A dynamic simulation model of desertification in Egypt - CORE · A dynamic simulation model of...
11
A dynamic simulation model of desertification in Egypt M. Rasmy a , A. Gad b , H. Abdelsalam a , M. Siwailam b, * a Department of Decision Support, Faculty of Computer and Information, Cairo University, Giza, Egypt b National Authority for Remote Sensing and Space Sciences (NARSS), P.O. Box 1564, Alf Maskan, Cairo, Egypt Received 3 March 2010; accepted 17 March 2010 Available online 3 December 2010 KEYWORDS Desertification; System dynamic; Simulation; Causal loop diagram; Stock and flow diagram Abstract This paper presents the development of a system dynamic model to simulate and analyze potential future state of desertification in Egypt. The presented model enhances the MEDALUS methodology developed by European Commission. It illustrates the concept of desertification through different equations and simulation output graphs. It is supplemented with a causal loop diagram showing the feedback between different variables. For the purpose of testing and measur- ing the effect of different policy scenarios on desertification in Egypt, a simulation model using stock and flow diagram was designed. Multi-temporal data were used to figure out the dynamic changes in desertification sensitivity related to the dynamic nature of desert environment. The model was applied to Al Bihira governorate in western Nile Delta, Egypt, as the study area, and the results showed that the urban expansion, salinization, and not applying the policy enforcement are considered the most variables provoking the desertification. Ó 2011 National Authority for Remote Sensing and Space Sciences. Production and hosting by Elsevier B.V. All rights reserved. 1. Introduction 1.1. Desertification Desertification is a major environmental, social and economic problem to many countries in all parts of the world (Breckle et al., 2001). Desertification means land degradation in arid, semiarid and dry subhumid areas resulting mainly from ad- verse human impact (David and Nicholas, 1994). There are many factors that can contribute to desertification; these fac- tors include soil, vegetation, climate, demographic and human activities, each of these factors has different variables deter- mining it (e.g. population size, arable land and livestock size). Desertification indicators or the group of associated indicators should be reliable information sources including remotely sensed images, topographic data (maps or Digital Elevation Models (DEMs)), climate, soils and geologic data (Gad and Lotfy, 2006). * Corresponding author. E-mail addresses: [email protected] (M. Rasmy), abdallagad@ gmail.com (A. Gad), [email protected] (H. Abdelsalam), [email protected] (M. Siwailam). 1110-9823 Ó 2011 National Authority for Remote Sensing and Space Sciences. Production and hosting by Elsevier B.V. All rights reserved. Peer review under responsibility of National Authority for Remote Sensing and Space Sciences. doi:10.1016/j.ejrs.2010.03.001 Production and hosting by Elsevier The Egyptian Journal of Remote Sensing and Space Sciences (2010) 13, 101–111 National Authority for Remote Sensing and Space Sciences The Egyptian Journal of Remote Sensing and Space Sciences www.elsevier.com/locate/ejrs www.sciencedirect.com
Transcript of A dynamic simulation model of desertification in Egypt - CORE · A dynamic simulation model of...
The Egyptian Journal of Remote Sensing and Space Sciences (2010) 13, 101–111
National Authority for Remote Sensing and Space Sciences
The Egyptian Journal of Remote Sensing and Space
Sciences
www.elsevier.com/locate/ejrswww.sciencedirect.com
A dynamic simulation model of desertification in Egypt
M. Rasmy a, A. Gad b, H. Abdelsalam a, M. Siwailam b,*
a Department of Decision Support, Faculty of Computer and Information, Cairo University, Giza, Egyptb National Authority for Remote Sensing and Space Sciences (NARSS), P.O. Box 1564, Alf Maskan, Cairo, Egypt
Received 3 March 2010; accepted 17 March 2010Available online 3 December 2010
*
E
gm
so
11
Sc
Pe
Se
do
KEYWORDS
Desertification;
System dynamic;
Simulation;
Causal loop diagram;
Stock and flow diagram
Corresponding author.
-mail addresses: m.rasmy@f
ail.com (A. Gad), hmes
[email protected] (M. Si
10-9823 � 2011 National Au
iences. Production and hosti
er review under responsibili
nsing and Space Sciences.
i:10.1016/j.ejrs.2010.03.001
Production and h
ci-cu.edu
alam@ya
wailam).
thority f
ng by Els
ty of Na
osting by E
Abstract This paper presents the development of a system dynamic model to simulate and analyze
potential future state of desertification in Egypt. The presented model enhances the MEDALUS
methodology developed by European Commission. It illustrates the concept of desertification
through different equations and simulation output graphs. It is supplemented with a causal loop
diagram showing the feedback between different variables. For the purpose of testing and measur-
ing the effect of different policy scenarios on desertification in Egypt, a simulation model using
stock and flow diagram was designed. Multi-temporal data were used to figure out the dynamic
changes in desertification sensitivity related to the dynamic nature of desert environment. The
model was applied to Al Bihira governorate in western Nile Delta, Egypt, as the study area, and
the results showed that the urban expansion, salinization, and not applying the policy enforcement
are considered the most variables provoking the desertification.� 2011 National Authority for Remote Sensing and Space Sciences.
Production and hosting by Elsevier B.V. All rights reserved.
.eg (M. Rasmy), abdallagad@
hoo.com (H. Abdelsalam),
or Remote Sensing and Space
evier B.V. All rights reserved.
tional Authority for Remote
lsevier
1. Introduction
1.1. Desertification
Desertification is a major environmental, social and economicproblem to many countries in all parts of the world (Breckle
et al., 2001). Desertification means land degradation in arid,semiarid and dry subhumid areas resulting mainly from ad-verse human impact (David and Nicholas, 1994). There aremany factors that can contribute to desertification; these fac-
tors include soil, vegetation, climate, demographic and humanactivities, each of these factors has different variables deter-mining it (e.g. population size, arable land and livestock size).
Desertification indicators or the group of associated indicatorsshould be reliable information sources including remotelysensed images, topographic data (maps or Digital Elevation
Models (DEMs)), climate, soils and geologic data (Gad andLotfy, 2006).

Figure 1 Steps of building a simulation model.
Figure 2 Drought resistance land use intensity loop.
Figure 4 Population food income from livestock loop.
Figure 3 Population food income from plant cover loop.
102 M. Rasmy et al.
Computer simulation models can link current knowledge of
processes driving vegetation dynamics and allow systematicinvestigations of the interactions between all relevant factorsand their logical consequences. Also, simulation modeling is
a powerful tool for controlled experimental manipulation ofa large number of environmental conditions over long timespans (Florian et al., 2001).
Egypt’s area (96%) is desert and only 4% is inhabited bymore than 82 million people, situated mostly in the Nile Valleyand the Delta. Egypt is classified as territory susceptible tovery high to high desertification sensitivity. One of the main
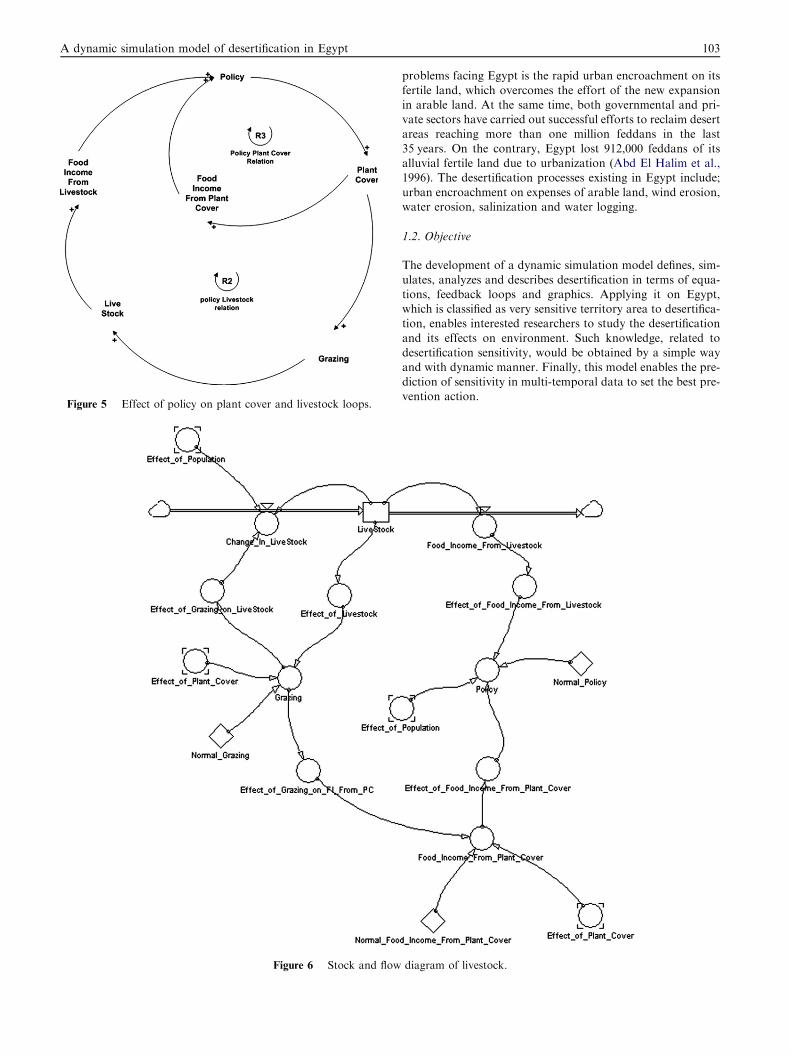
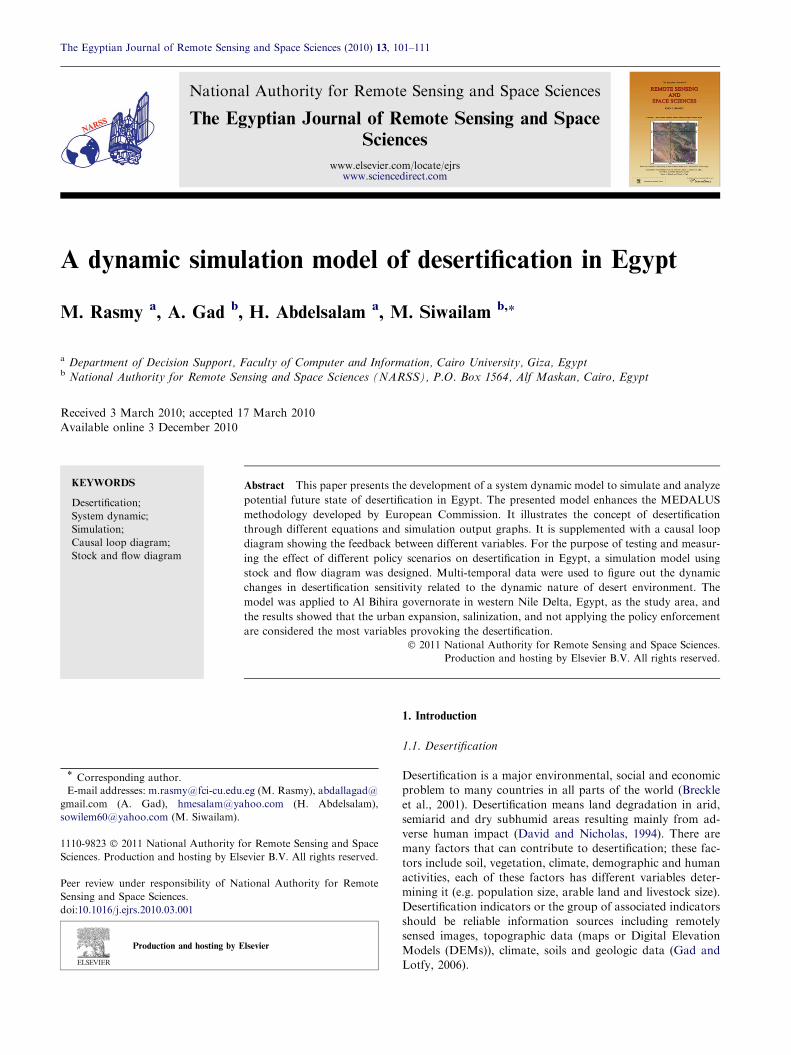
Figure 5 Effect of policy on plant cover and livestock loops.
Figure 6 Stock and flow
A dynamic simulation model of desertification in Egypt 103
problems facing Egypt is the rapid urban encroachment on its
fertile land, which overcomes the effort of the new expansionin arable land. At the same time, both governmental and pri-vate sectors have carried out successful efforts to reclaim desertareas reaching more than one million feddans in the last
35 years. On the contrary, Egypt lost 912,000 feddans of itsalluvial fertile land due to urbanization (Abd El Halim et al.,1996). The desertification processes existing in Egypt include;
urban encroachment on expenses of arable land, wind erosion,water erosion, salinization and water logging.
1.2. Objective
The development of a dynamic simulation model defines, sim-
ulates, analyzes and describes desertification in terms of equa-tions, feedback loops and graphics. Applying it on Egypt,which is classified as very sensitive territory area to desertifica-tion, enables interested researchers to study the desertification
and its effects on environment. Such knowledge, related todesertification sensitivity, would be obtained by a simple wayand with dynamic manner. Finally, this model enables the pre-
diction of sensitivity in multi-temporal data to set the best pre-vention action.
diagram of livestock.

104 M. Rasmy et al.
1.3. Related work
The modeling of desertification sensitivity is very important invisualizing and predicting the expected environmental risk to-
wards desertification. Although little research is existing in thisfield, modeling of desertification can be made by differentways; by using either simulation modeling, the Geographic
Information System (GIS) or parametric methods.The quantitative index or number is important to know the
environmental sensitivity areas (ESAs) to desertification.European Commission (1999) puts the indices for calculating
different factors of desertification.Stephenne and Lambin (2001) developed a dynamic simula-
tion model of land-use changes in Sudano-Sahelian Countries
of Africa (SALU). The purpose of this model was to under-stand the process of land-use changes in Sudano-Sahelian re-gion of Africa in a dynamic way.
Gad and Lotfy (2006) employed remote sensing and Geo-graphic Information System (GIS) to calculate the environ-mental sensitivity areas for desertification in Egyptian
territory with one temporal set of data. They used ETM satel-lite images, geologic and soil maps as main sources for calcu-lating the desertification sensitivity index. The algorithm wasadopted from MEDALUS methodology.
Yu et al. (2003) made a development of a system dynamicmodel for sustainable land use management, aiming to help
Figure 7 Stock and flow diagram
decision makers to integrate the interactions in land use man-
agement. This study uses system thinking to develop dynamicsof sustainable land use management in the Nakan river basin,located in the northern Taiwan, based on the concept of sus-tainable development which considers human activities, land
resources, water resources and air resources integrally.Ulf (2008) developed a system dynamic model to simulate
and illustrate the concept of desertification through terms of
equations, feedback loops (causal loop diagram) and simula-tion output graphs. The developed model is a human–environ-ment two-level (resource–man) coupled predator–prey based
model. The model is based on the original concept of thepredator–prey model, further developed to simulate con-sumer–resource interactions. The human population is the
predator and the biomass resource is the prey.
2. Methodology
2.1. Simulation modeling
The developed model is a dynamic simulation model of desert-ification in Egypt. It is developed by the system dynamic mod-eling of ‘‘Powersim’’. It is a simulation software which
provides the ability to make complex business simulatorsbased on a modeling called system dynamics. Steps of buildinga simulation model are:
of population and arable land.
A dynamic simulation model of desertification in Egypt 105
(A) Formulation
(1) Building/adopting a model.
(B) Modeling
(1) Enhance/validate model variables,(2) Collect data,(3) Construct causal loopdiagram(influence diagram),(4) Causal loop diagram validation,
(5) Develop a simulation model,(6) Make pilot runs,(7) Validate simulation model.
(C) Analyzing
(1) Analyze output data,(2) Make scenario analysis.
(D) Document, present and implement the model.
Fig. 1 shows the steps of building a simulation model.The presented model enhances the MEDALUS methodol-
ogy developed by European Commission, where it enables
interested researcher in calculating desertification with multi-temporal data. It also shows the feedback between differentvariables.
2.2. Data collection
With reference to the outcome of the stock and flow, the datarequired were identified and collected. Some data (e.g. parentmaterial, and vegetation cover) could not be collected by thetraditional ways. These data could be collected by analyzing
TM and Spot satellite images and represented by quantitative
Figure 8 Stock and flow d
weights due to their nature that could not be measured
quantitatively. Also, climatic data such as rainfall andpotential_evapo_transpiration were collected from CentralLaboratory for Agriculture Climate (CLAC). Data of othervariables such as population, livestock and arable land were
collected according historical data from Central Agency forPublic Mobilization and Statistics (CAPMAS). After collect-ing historical data, statistical analysis was performed to point
out the equations that represent the changes of variables overtime (Appendix A depicts the model equations).
2.3. Causal loop diagram
The causal loop diagrams are important tool for representing
the interrelationships between variables of desertification.The pool of variables was deduced from the previousresearches and studies (MEDALUS, FAO, UNCCD, Ming-hong) concerning desertification used in developing the casual
loop diagram. The causal loop diagram is made of total 24variables, which are mainly categorized as soil, climate, vegeta-tion and management categories. Figs. 2–4 show causal and
loop diagrams of the model, while Fig. 5 shows the effect ofpolicy on plant cover and livestock loops.
2.4. Stock and flow diagram
In order to use the causal loop diagram, shown in Section 2.3,a stock and flow diagram needs to be developed for building a
simulation model. The first step to develop the stock and flowdiagram is to recognize the causal loop variables as stock orflows. Next step is to elaborate mathematical functions that
correlate variables with each others as shown in Appendix
iagram of plant cover.
106 M. Rasmy et al.
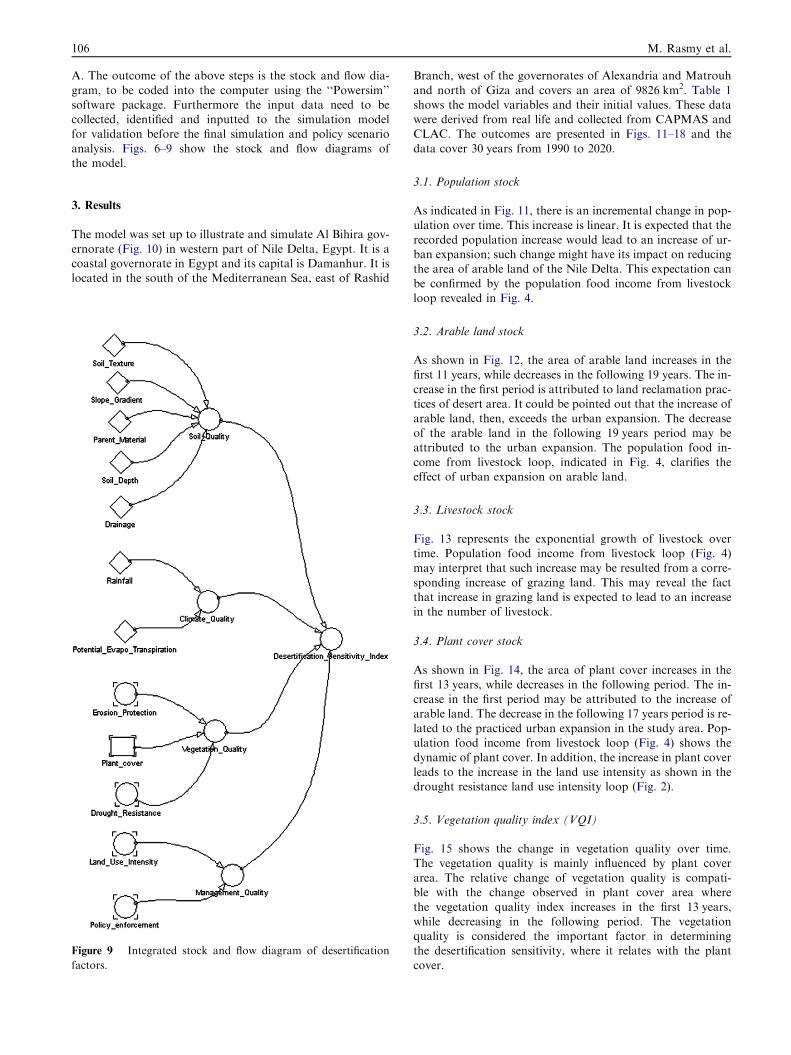
A. The outcome of the above steps is the stock and flow dia-
gram, to be coded into the computer using the ‘‘Powersim’’software package. Furthermore the input data need to becollected, identified and inputted to the simulation modelfor validation before the final simulation and policy scenario
analysis. Figs. 6–9 show the stock and flow diagrams ofthe model.
3. Results
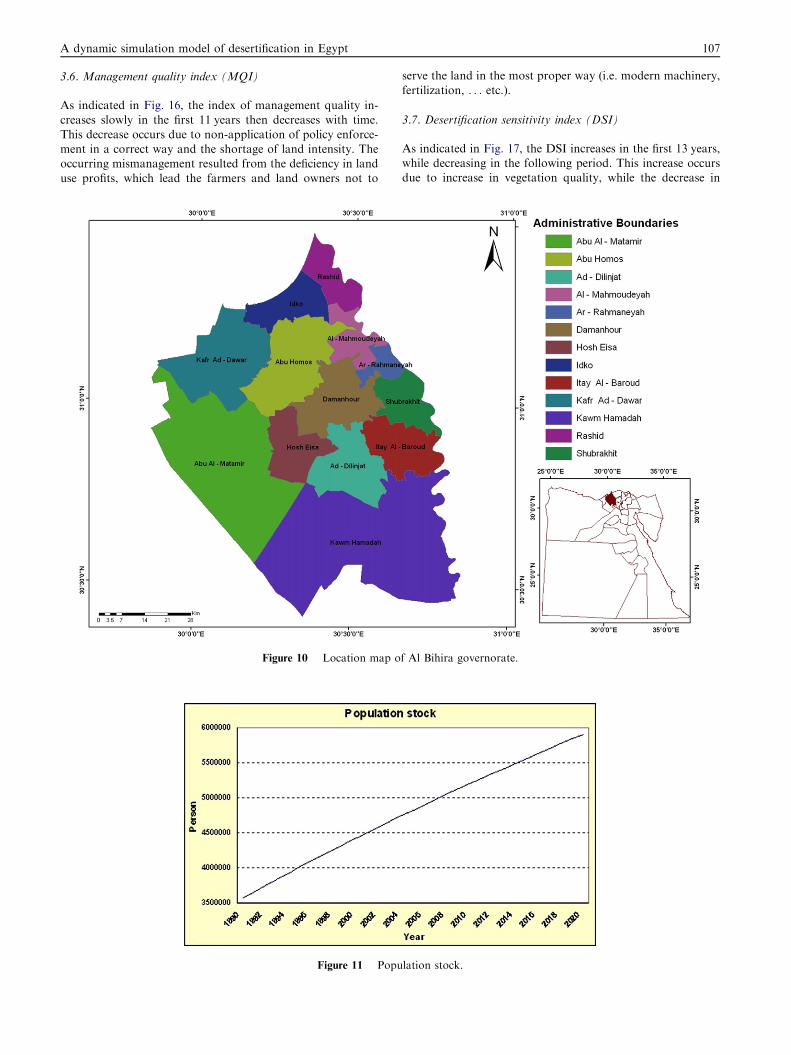
The model was set up to illustrate and simulate Al Bihira gov-
ernorate (Fig. 10) in western part of Nile Delta, Egypt. It is acoastal governorate in Egypt and its capital is Damanhur. It islocated in the south of the Mediterranean Sea, east of Rashid
Figure 9 Integrated stock and flow diagram of desertification
factors.
Branch, west of the governorates of Alexandria and Matrouh
and north of Giza and covers an area of 9826 km2. Table 1shows the model variables and their initial values. These datawere derived from real life and collected from CAPMAS andCLAC. The outcomes are presented in Figs. 11–18 and the
data cover 30 years from 1990 to 2020.
3.1. Population stock
As indicated in Fig. 11, there is an incremental change in pop-ulation over time. This increase is linear. It is expected that the
recorded population increase would lead to an increase of ur-ban expansion; such change might have its impact on reducingthe area of arable land of the Nile Delta. This expectation can
be confirmed by the population food income from livestockloop revealed in Fig. 4.
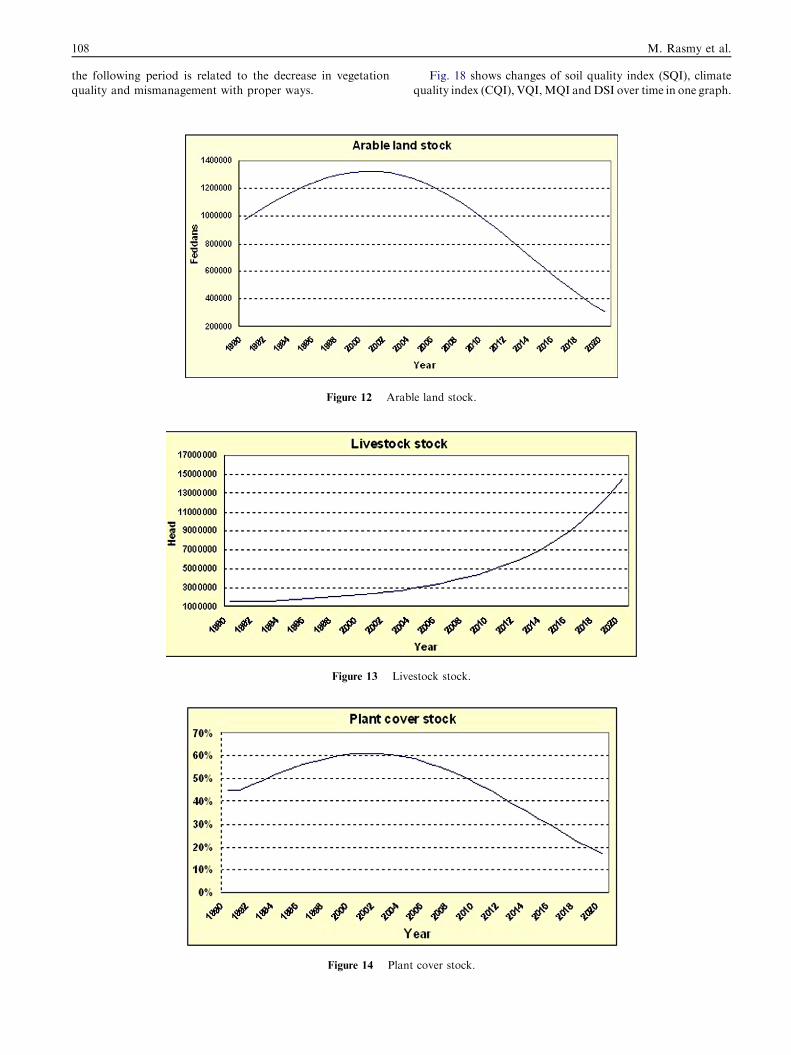
3.2. Arable land stock
As shown in Fig. 12, the area of arable land increases in thefirst 11 years, while decreases in the following 19 years. The in-
crease in the first period is attributed to land reclamation prac-tices of desert area. It could be pointed out that the increase ofarable land, then, exceeds the urban expansion. The decrease
of the arable land in the following 19 years period may beattributed to the urban expansion. The population food in-come from livestock loop, indicated in Fig. 4, clarifies theeffect of urban expansion on arable land.
3.3. Livestock stock
Fig. 13 represents the exponential growth of livestock overtime. Population food income from livestock loop (Fig. 4)may interpret that such increase may be resulted from a corre-
sponding increase of grazing land. This may reveal the factthat increase in grazing land is expected to lead to an increasein the number of livestock.
3.4. Plant cover stock
As shown in Fig. 14, the area of plant cover increases in the
first 13 years, while decreases in the following period. The in-crease in the first period may be attributed to the increase ofarable land. The decrease in the following 17 years period is re-
lated to the practiced urban expansion in the study area. Pop-ulation food income from livestock loop (Fig. 4) shows thedynamic of plant cover. In addition, the increase in plant cover
leads to the increase in the land use intensity as shown in thedrought resistance land use intensity loop (Fig. 2).
3.5. Vegetation quality index (VQI)
Fig. 15 shows the change in vegetation quality over time.The vegetation quality is mainly influenced by plant cover
area. The relative change of vegetation quality is compati-ble with the change observed in plant cover area wherethe vegetation quality index increases in the first 13 years,
while decreasing in the following period. The vegetationquality is considered the important factor in determiningthe desertification sensitivity, where it relates with the plant
cover.
A dynamic simulation model of desertification in Egypt 107
3.6. Management quality index (MQI)
As indicated in Fig. 16, the index of management quality in-creases slowly in the first 11 years then decreases with time.
This decrease occurs due to non-application of policy enforce-ment in a correct way and the shortage of land intensity. Theoccurring mismanagement resulted from the deficiency in land
use profits, which lead the farmers and land owners not to
Figure 10 Location map o
Figure 11 Popu
serve the land in the most proper way (i.e. modern machinery,
fertilization, . . . etc.).
3.7. Desertification sensitivity index (DSI)
As indicated in Fig. 17, the DSI increases in the first 13 years,while decreasing in the following period. This increase occursdue to increase in vegetation quality, while the decrease in
f Al Bihira governorate.
lation stock.
108 M. Rasmy et al.
the following period is related to the decrease in vegetation
quality and mismanagement with proper ways.
Figure 12 Arab
Figure 13 Live
Figure 14 Plant
Fig. 18 shows changes of soil quality index (SQI), climate
quality index (CQI), VQI,MQI andDSI over time in one graph.
le land stock.
stock stock.
cover stock.
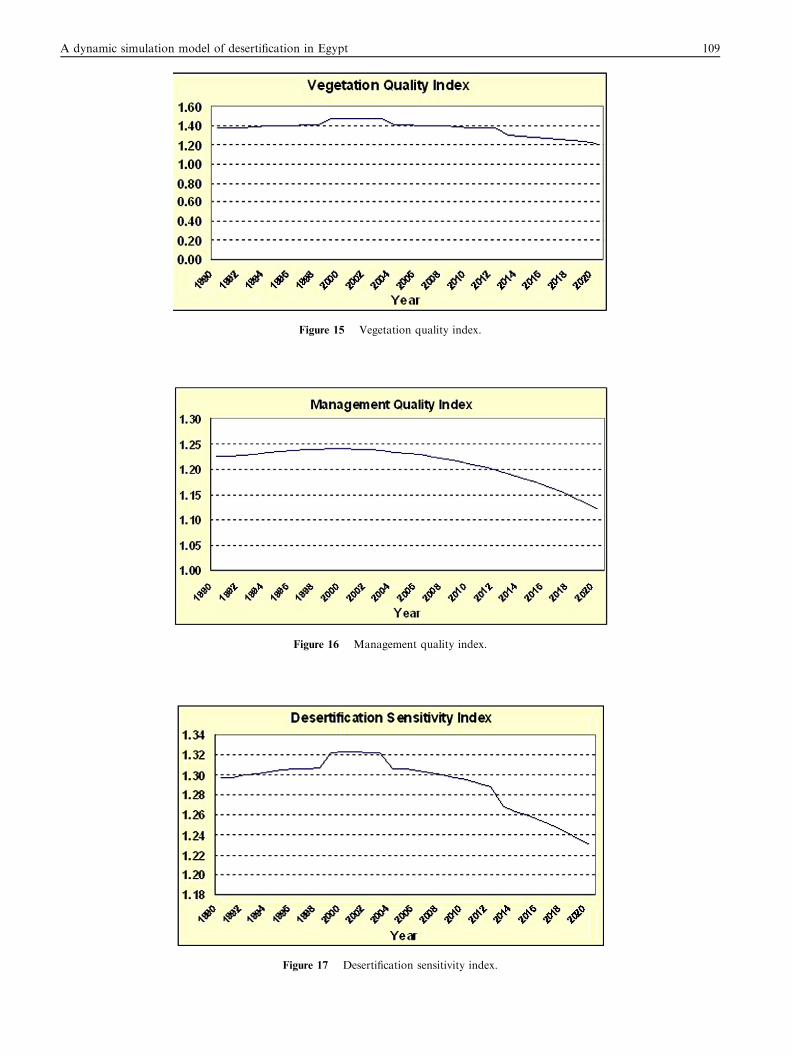
Figure 15 Vegetation quality index.
Figure 16 Management quality index.
Figure 17 Desertification sensitivity index.
A dynamic simulation model of desertification in Egypt 109
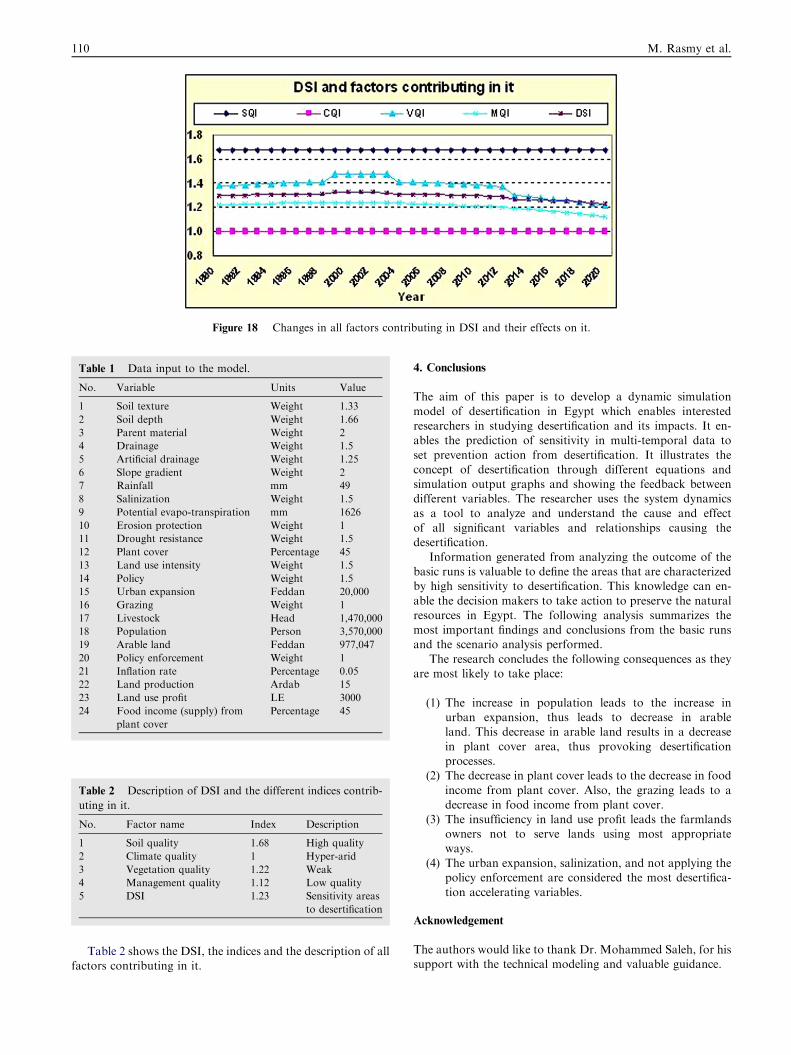
Figure 18 Changes in all factors contributing in DSI and their effects on it.
Table 2 Description of DSI and the different indices contrib-
uting in it.
No. Factor name Index Description
1 Soil quality 1.68 High quality
2 Climate quality 1 Hyper-arid
3 Vegetation quality 1.22 Weak
4 Management quality 1.12 Low quality
5 DSI 1.23 Sensitivity areas
to desertification
Table 1 Data input to the model.
No. Variable Units Value
1 Soil texture Weight 1.33
2 Soil depth Weight 1.66
3 Parent material Weight 2
4 Drainage Weight 1.5
5 Artificial drainage Weight 1.25
6 Slope gradient Weight 2
7 Rainfall mm 49
8 Salinization Weight 1.5
9 Potential evapo-transpiration mm 1626
10 Erosion protection Weight 1
11 Drought resistance Weight 1.5
12 Plant cover Percentage 45
13 Land use intensity Weight 1.5
14 Policy Weight 1.5
15 Urban expansion Feddan 20,000
16 Grazing Weight 1
17 Livestock Head 1,470,000
18 Population Person 3,570,000
19 Arable land Feddan 977,047
20 Policy enforcement Weight 1
21 Inflation rate Percentage 0.05
22 Land production Ardab 15
23 Land use profit LE 3000
24 Food income (supply) from
plant cover
Percentage 45
110 M. Rasmy et al.
Table 2 shows the DSI, the indices and the description of allfactors contributing in it.
4. Conclusions
The aim of this paper is to develop a dynamic simulation
model of desertification in Egypt which enables interestedresearchers in studying desertification and its impacts. It en-ables the prediction of sensitivity in multi-temporal data to
set prevention action from desertification. It illustrates theconcept of desertification through different equations andsimulation output graphs and showing the feedback betweendifferent variables. The researcher uses the system dynamics
as a tool to analyze and understand the cause and effectof all significant variables and relationships causing thedesertification.
Information generated from analyzing the outcome of thebasic runs is valuable to define the areas that are characterizedby high sensitivity to desertification. This knowledge can en-
able the decision makers to take action to preserve the naturalresources in Egypt. The following analysis summarizes themost important findings and conclusions from the basic runsand the scenario analysis performed.
The research concludes the following consequences as theyare most likely to take place:
(1) The increase in population leads to the increase inurban expansion, thus leads to decrease in arableland. This decrease in arable land results in a decrease
in plant cover area, thus provoking desertificationprocesses.
(2) The decrease in plant cover leads to the decrease in food
income from plant cover. Also, the grazing leads to adecrease in food income from plant cover.
(3) The insufficiency in land use profit leads the farmlandsowners not to serve lands using most appropriate
ways.(4) The urban expansion, salinization, and not applying the
policy enforcement are considered the most desertifica-
tion accelerating variables.
Acknowledgement
The authors would like to thank Dr. Mohammed Saleh, for hissupport with the technical modeling and valuable guidance.
A dynamic simulation model of desertification in Egypt
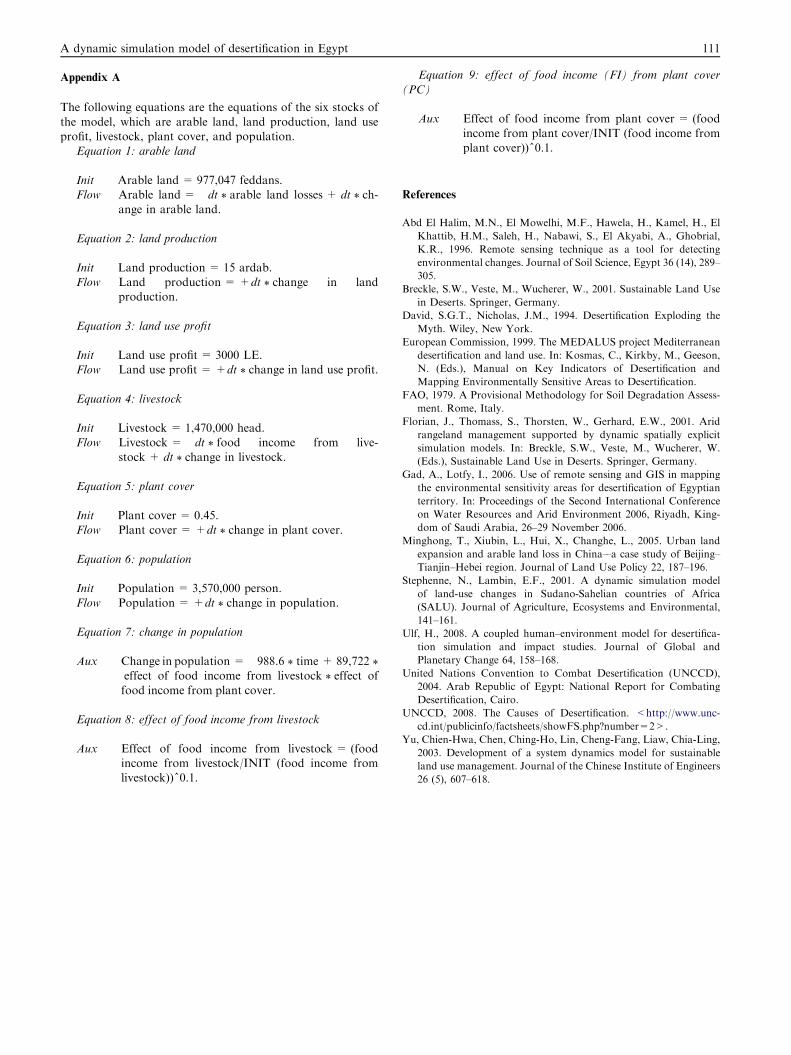
Appendix A
The following equations are the equations of the six stocks of
the model, which are arable land, land production, land useprofit, livestock, plant cover, and population.
Equation 1: arable land
Init Arable land = 977,047 feddans.Flow Arable land = �dt \ arable land losses + dt \ ch-
ange in arable land.
Equation 2: land production
Init Land production = 15 ardab.Flow Land production =+dt \ change in land
production.
Equation 3: land use profit
Init Land use profit = 3000 LE.Flow Land use profit = +dt \ change in land use profit.
Equation 4: livestock
Init Livestock = 1,470,000 head.Flow Livestock = �dt \ food income from live-
stock + dt \ change in livestock.
Equation 5: plant cover
Init Plant cover = 0.45.Flow Plant cover = +dt \ change in plant cover.
Equation 6: population
Init Population = 3,570,000 person.
Flow Population = +dt \ change in population.
Equation 7: change in population
Aux Change in population = �988.6 \ time + 89,722 \
effect of food income from livestock \ effect of
food income from plant cover.
Equation 8: effect of food income from livestock
Aux Effect of food income from livestock = (foodincome from livestock/INIT (food income fromlivestock))^0.1.
Equation 9: effect of food income (FI) from plant cover
(PC)
Aux Effect of food income from plant cover = (food
income from plant cover/INIT (food income fromplant cover))^0.1.
References
Abd El Halim, M.N., El Mowelhi, M.F., Hawela, H., Kamel, H., El
Khattib, H.M., Saleh, H., Nabawi, S., El Akyabi, A., Ghobrial,
K.R., 1996. Remote sensing technique as a tool for detecting
environmental changes. Journal of Soil Science, Egypt 36 (14), 289–
305.
Breckle, S.W., Veste, M., Wucherer, W., 2001. Sustainable Land Use
in Deserts. Springer, Germany.
David, S.G.T., Nicholas, J.M., 1994. Desertification Exploding the
Myth. Wiley, New York.
European Commission, 1999. The MEDALUS project Mediterranean
desertification and land use. In: Kosmas, C., Kirkby, M., Geeson,
N. (Eds.), Manual on Key Indicators of Desertification and
Mapping Environmentally Sensitive Areas to Desertification.
FAO, 1979. A Provisional Methodology for Soil Degradation Assess-
ment. Rome, Italy.
Florian, J., Thomass, S., Thorsten, W., Gerhard, E.W., 2001. Arid
rangeland management supported by dynamic spatially explicit
simulation models. In: Breckle, S.W., Veste, M., Wucherer, W.
(Eds.), Sustainable Land Use in Deserts. Springer, Germany.
Gad, A., Lotfy, I., 2006. Use of remote sensing and GIS in mapping
the environmental sensitivity areas for desertification of Egyptian
territory. In: Proceedings of the Second International Conference
on Water Resources and Arid Environment 2006, Riyadh, King-
dom of Saudi Arabia, 26–29 November 2006.
Minghong, T., Xiubin, L., Hui, X., Changhe, L., 2005. Urban land
expansion and arable land loss in China––a case study of Beijing–
Tianjin–Hebei region. Journal of Land Use Policy 22, 187–196.
Stephenne, N., Lambin, E.F., 2001. A dynamic simulation model
of land-use changes in Sudano-Sahelian countries of Africa
(SALU). Journal of Agriculture, Ecosystems and Environmental,
141–161.
Ulf, H., 2008. A coupled human–environment model for desertifica-
tion simulation and impact studies. Journal of Global and
Planetary Change 64, 158–168.
United Nations Convention to Combat Desertification (UNCCD),
2004. Arab Republic of Egypt: National Report for Combating
Desertification, Cairo.
UNCCD, 2008. The Causes of Desertification. <http://www.unc-
cd.int/publicinfo/factsheets/showFS.php?number=2>.
Yu, Chien-Hwa, Chen, Ching-Ho, Lin, Cheng-Fang, Liaw, Chia-Ling,
2003. Development of a system dynamics model for sustainable
land use management. Journal of the Chinese Institute of Engineers
26 (5), 607–618.
111