A division of Westpac Banking Corporation ABN 33 007...
25
A division of Westpac Banking Corporation ABN 33 007 457 141 Perspectives on credit & the foreign exchange market Melbourne Institute November 2003 Bill Evans Global Head of Economics
Transcript of A division of Westpac Banking Corporation ABN 33 007...

A division of Westpac Banking Corporation ABN 33 007 457 141
Perspectives on credit & the foreign exchange market
Melbourne Institute November 2003Bill EvansGlobal Head of Economics

Current forecasts - NOVEMBER 2003
latest Dec-03 Jun-04 Dec-04Cash 5.00 5.25 5.50 5.503yr 5.75 6.00 6.50 6.0010yr 5.90 6.10 6.75 6.40Fed Funds 1.00 1.00 1.00 1.5010yr 4.35 4.50 4.80 5.40AUD/USD 0.71 0.72 0.77 0.74EUR/USD 1.18 1.17 1.21 1.25

Australian growth to converge with US- 4.25% expected in 2004
-4
-2
0
2
4
6
8
10
Dec-80 Dec-84 Dec-88 Dec-92 Dec-96 Dec-00
% ann
-4
-2
0
2
4
6
8
10% ann
US GDP growthAustralian GDP growth
forecast

Happiness all round, for consumers & business
60
70
80
90
100
110
120
130
Sep-80 Sep-85 Sep-90 Sep-95 Sep-00
index
20
30
40
50
60
70index
Consumer sentiment (lhs)
business expectations (rhs)

Healthy job outlook, Westpac outlook suggests strong employment
-60
-50
-40
-30
-20
-10
0
10
20
30
Mar-80 Mar-84 Mar-88 Mar-92 Mar-96 Mar-00 Mar-04
% ann
-6
-4
-2
0
2
4
6% net
Westpac labour market composite - adv 2 qtrs (lhs)
employment growth (rhs)

Credit growth remains excessive in housing as business bounces back
-8
-4
0
4
8
12
16
20
24
Jul-90 Jul-92 Jul-94 Jul-96 Jul-98 Jul-00 Jul-02
% ann
-8
-4
0
4
8
12
16
20
24% ann
personal housing business

Investor finance for housing: almost $7bn/month
0
2
4
6
8
Sep-91 Sep-93 Sep-95 Sep-97 Sep-99 Sep-01 Sep-03
AUDbn/mth
0
2
4
6
8AUDbn/mth
total investor finance
finance for construction

Household debt running ahead of housing prices Ratio of debt/prices to income/earnings
0
50
100
150
200
250
300
Jun-86 Jun-90 Jun-94 Jun-98 Jun-02
index
0
50
100
150
200
250
300index
prices to wages/salariesdebt to income
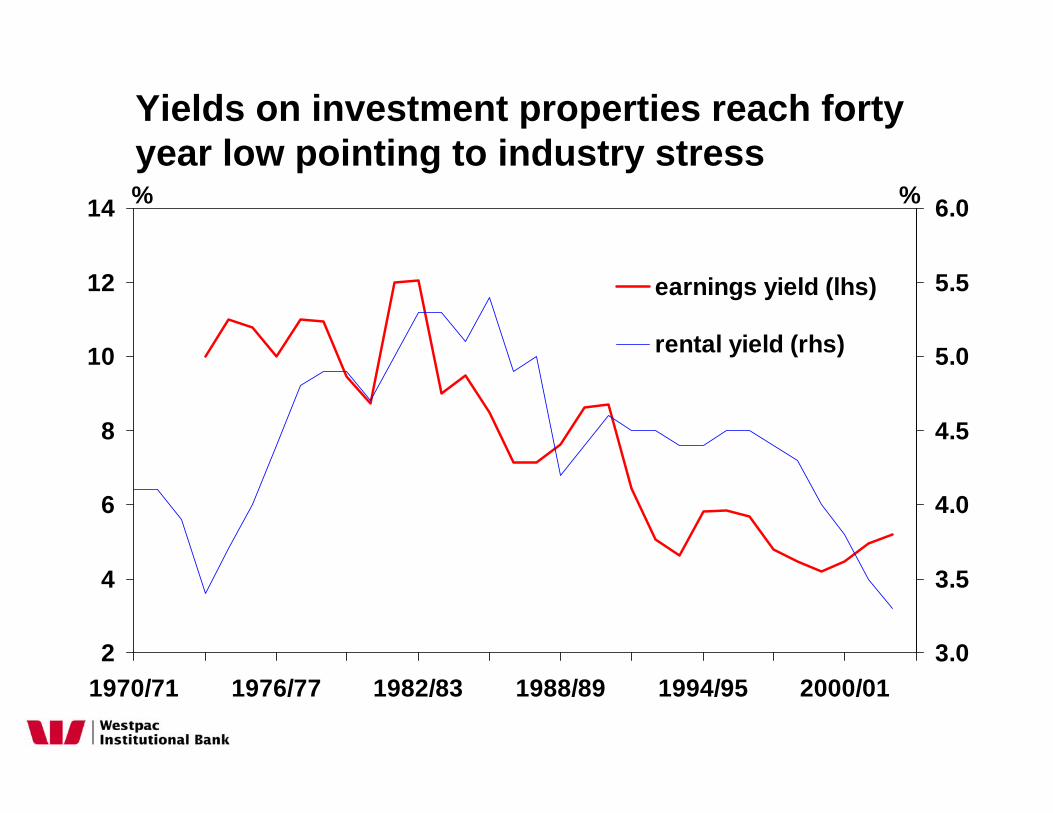
Yields on investment properties reach forty year low pointing to industry stress
2
4
6
8
10
12
14
1970/71 1976/77 1982/83 1988/89 1994/95 2000/01
%
3.0
3.5
4.0
4.5
5.0
5.5
6.0%
earnings yield (lhs)
rental yield (rhs)

Property PE ratios at 40 year highs: equities - better value
5
10
15
20
25
30
35
1962/63 1970/71 1978/79 1986/87 1994/95 2002/03
PE
5
10
15
20
25
30
35PE
housing equities

A surge of private units is hitting the market - expect activity to fall, prices to ease
0
5
10
15
20
Jun-85 Jun-89 Jun-93 Jun-97 Jun-01
qtr '000
0
5
10
15
20qtr '000
completed
commenced

Net immigration boosts population growth -supports growth in underlying demand
0
50
100
150
200
250
300
350
Jun-83 Jun-87 Jun-91 Jun-95 Jun-99 Jun-03
'000
0
50
100
150
200
250
300
350'000
net immigration - annualnet immigration (ANU estimates)population change - annual
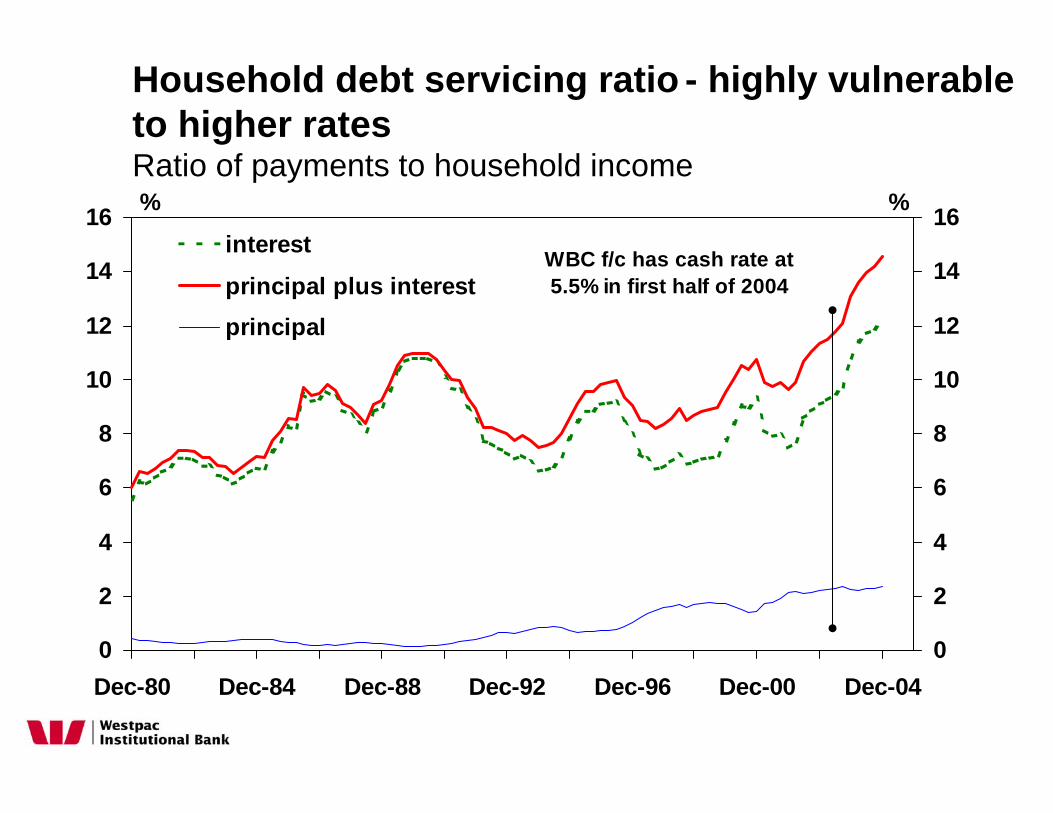
Household debt servicing ratio - highly vulnerable to higher ratesRatio of payments to household income
0
2
4
6
8
10
12
14
16
Dec-80 Dec-84 Dec-88 Dec-92 Dec-96 Dec-00 Dec-04
%
0
2
4
6
8
10
12
14
16%
interest
principal plus interestprincipal
WBC f/c has cash rate at 5.5% in first half of 2004

Investors are very exposed to rates but owner occupiers look comfortable - confidence of investors to be tested
0
10
20
30
40
50
60
1977/78 1981/82 1985/86 1989/90 1993/94 1997/98 2001/02
%
0
4
8
12
16
20%
investors - interest only (lhs)
owner occupiers (rhs)

Australians’ high equity in housing assets, provides new source of spending support & credit growth
60
65
70
75
80
85
90
95
Mar-53 Mar-65 Mar-77 Mar-89 Mar-01
%
60
65
70
75
80
85
90
95%
US Aust
source: Westpac Economic Research

Housing equity injection/withdrawal, (% of disposable income) points to consumers accessing more housing equity
-10-8-6-4-202468
10
Mar-80 Mar-83 Mar-86 Mar-89 Mar-92 Mar-95 Mar-98 Mar-01 Mar-04
%
-10-8-6-4-20246810%

0
50
100
150
200
250
Dec-78 Dec-81 Dec-84 Dec-87 Dec-90 Dec-93 Dec-96 Dec-99 Dec-02
index
0
50
100
150
200
250index
Japanese residential property prices - rise 150% in 5 years and fall 65% later

Established house prices marching upwardsrise 100% in 7 years
0
50
100
150
200
250
Dec-87 Dec-90 Dec-93 Dec-96 Dec-99 Dec-02
index
0
50
100
150
200
250index
MelbourneBrisbane
capital city avgSydney

0
2
4
6
8
Dec-92 Dec-94 Dec-96 Dec-98 Dec-00 Dec-02
% pa
0
2
4
6
8% pa
US
Australia
forecast
Australian rates to increase in early 2004 - to move well before US

Australia’s current fixed rate yields are pricing in more rate hikes - but will go higher
3
4
5
6
7
8
9
Apr-96 Apr-98 Apr-00 Apr-02 Apr-04
%
3
4
5
6
7
8
9%Australian 3 yr bondAustralian official cash rate
forecast

-6.0
-4.0
-2.0
0.0
2.0Dec-80 Dec-84 Dec-88 Dec-92 Dec-96 Dec-00 Dec-04
index
70
80
90
100
110
120
130
140% GDP
US current account deficit (lhs, inverted)
USD real trade weighted index (rhs)
USD peak ...
… to current account trough ... … was a five year period
US current account deficit & the USD - still no relief for US current account deficit

The purchasing power parity for the AUD is a likely medium term target-overshoot likely
0.45
0.55
0.65
0.75
0.85
0.95
Dec-83 Dec-87 Dec-91 Dec-95 Dec-99 Dec-03
USD
0.45
0.55
0.65
0.75
0.85
0.95USD
PPP AUD/USD

The AUD & commodity prices-old relationships are being reestablished
60
80
100
120
Dec-84 Dec-87 Dec-90 Dec-93 Dec-96 Dec-99 Dec-02
USD
0.45
0.55
0.65
0.75
0.85
0.95
index
AUD/USD (rhs)
WCFI+BI (lhs)

Current forecasts - NOVEMBER 2003
latest Dec-03 Jun-04 Dec-04Cash 5.00 5.25 5.50 5.503yr 5.75 6.00 6.50 6.0010yr 5.90 6.10 6.75 6.40Fed Funds 1.00 1.00 1.00 1.5010yr 4.35 4.50 4.80 5.40AUD/USD 0.71 0.72 0.77 0.74EUR/USD 1.18 1.17 1.21 1.25

Disclaimer
Westpac Institutional Bank is a division of Westpac Banking Corporation ABN 33 007 457 141 ("Westpac"). The information contained in this report: does not constitute an offer, or a solicitation of an offer, to subscribe for or purchase any securities or other financial instrument;· does not constitute an offer, inducement or solicitation to enter a legally binding contract; and is not to be construed as an indication or prediction of future results. The Information is general and preliminary information only and while Westpac has made every effort to ensure that information is free from error, Westpac does not warrant the accuracy, adequacy or completeness of the Information. The Information may contain material provided directly by third parties and while such material is published with necessary permission, Westpac accepts no responsibility for the accuracy or completeness of any such material. In preparing the Information, Westpac has not taken into consideration the financial situation, investment objectives or particular needs of any particular investor and recommends that investors seek independent advice before acting on the Information. Certain types of transactions, including those involving futures, options and high yield securities give rise to substantial risk and are not suitable for all investors. Except where contrary to law, Westpac intends by this notice to exclude liability for the Information. The Information is subject to change without notice. Westpac Banking Corporation is regulated for the conduct of investment business in the United Kingdom by the Financial Services Authority. Westpac Banking Corporation is incorporated in Australia with limited liability. © 2002 Westpac Banking Corporation. If you wish to be removed from our email, fax or mailing list please send an email to [email protected] or fax us on (61 2) 9284 9363 or mail Westpac Economics Level 5, 255 Elizabeth Street Sydney 2000. Please state your full name, telephone/fax number and company details on all correspondence.