A DISTRIBUTED ENERGY RESOURCE ROADMAP FOR PUERTO RICO
36
GOVERNMENT OF PUERTO RICO PUBLIC SERVICE REGULATORY BOARD PUERTO RICO ENERGY BUREAU IN RE: IN RE PUERTO RICO ELECTRIC POWER AUTHORITY INTEGRATED RESOURCE PLAN CASE NO. CEPR-AI-2018-0001 SUBJECT: MOTION TO SUBMIT SUPPLEMENTAL EXPERT TESTIMONY LOCAL ENVIRONMENTAL ORGANIZATIONS’ MOTION TO SUBMIT SUPPLEMENTAL EXPERT TESTIMONY TO THE HONORABLE PUERTO RICO ENERGY BUREAU: COME NOW, Local Environmental Organizations, by and through their legal counsel, to respectfully set forth and pray: Local Environmental Organizations request that the Puerto Rico Energy Bureau accept this supplemental expert testimony of Ronny Sandoval, President of ROS Energy Strategies LLC. We will submit the attestation as soon as it is received from the County Clerk’s office. RESPECTFULLY SUBMITTED, on December 11, 2019. /s/ Raghu Murthy Raghu Murthy Earthjustice 48 Wall Street, 15 th Floor New York, NY 10005 212.823.4991 [email protected] 1 NEPR Received: Dec 11, 2019 11:49 PM
Transcript of A DISTRIBUTED ENERGY RESOURCE ROADMAP FOR PUERTO RICO

GOVERNMENT OF PUERTO RICO PUBLIC SERVICE REGULATORY BOARD
PUERTO RICO ENERGY BUREAU
IN RE: IN RE PUERTO RICO ELECTRIC POWER AUTHORITY INTEGRATED RESOURCE PLAN
CASE NO. CEPR-AI-2018-0001
SUBJECT: MOTION TO SUBMIT SUPPLEMENTAL EXPERT TESTIMONY
LOCAL ENVIRONMENTAL ORGANIZATIONS’ MOTION TO SUBMIT SUPPLEMENTAL EXPERT TESTIMONY
TO THE HONORABLE PUERTO RICO ENERGY BUREAU:
COME NOW, Local Environmental Organizations, by and through their legal counsel, to respectfully set forth and pray:
Local Environmental Organizations request that the Puerto Rico Energy Bureau accept this supplemental expert testimony of Ronny Sandoval, President of ROS Energy Strategies LLC. We will submit the attestation as soon as it is received from the County Clerk’s office.
RESPECTFULLY SUBMITTED, on December 11, 2019.
/s/ Raghu Murthy Raghu Murthy Earthjustice 48 Wall Street, 15th Floor New York, NY 10005 212.823.4991 [email protected]
1
NEPR
Received:
Dec 11, 2019
11:49 PM

2
CERTIFICATION OF SERVICE We hereby certify that, on December 11, 2019, we have filed this Motion and Supplemental Testimony via the Energy Bureau’s online filing system, and sent to the Puerto Rico Energy Bureau Clerk and legal counsel to: [email protected]; [email protected]; [email protected]; [email protected]; [email protected] and to the following persons: • PREPA ([email protected]; [email protected]) • Sunrun ([email protected]); • EcoElectrica ([email protected] and [email protected]); • Grupo Windmar ([email protected], [email protected]); • Oficina Independiente de Protección al Consumidor ([email protected], [email protected]); • Empire Gas Company ([email protected]); • National Public Finance Guarantee ([email protected] and [email protected]); • Progression Energy ([email protected] and [email protected]); • Shell ([email protected]); • Wartsila North America ([email protected]); • Non Profit Intervenors ([email protected]); • EDF ([email protected]); • Arctas Capital Group ([email protected], [email protected]); • SESA PR & Caribe GE ([email protected]); • League of Cooperatives of Puerto Rico and AMANESER 2025 ([email protected], [email protected]) Respectfully submitted on this day December 11, 2019 s/Pedro Saadé PEDRO J. SAADÉ LLORÉNS Colegiado Núm. 5452 RUA Núm. 4182 Calle Condado 605, Oficina 611 San Juan, Puerto Rico 00907 Tel & Fax (787) 948-4142 [email protected]
s/Raghu Murthy RAGHU MURTHY Earthjustice 48 Wall Street, 19th Floor New York, NY 10005 Tel. (212) 823-4991 [email protected]

GOVERNMENT OF PUERTO RICO PUBLIC SERVICE REGULATORY BOARD
PUERTO RICO ENERGY BUREAU IN RE: | CASE NO.: | CEPR-AP-2018-0001 Review of the Puerto Rico Electric Power | Authority Integrated Resource Plan |
SUPPLEMENTAL EXPERT TESTIMONY OF RONNY O. SANDOVAL ON BEHALF OF LOCAL ENVIRONMENTAL ORGANIZATIONS
Comité Diálogo Ambiental, Inc., El Puente de Williamsburg, Inc. - Enlace Latino de Acción Climática, Comité Yabucoeño Pro-Calidad de Vida, Inc., Alianza Comunitaria Ambientalista del Sureste, Inc., Sierra Club and its Puerto Rico chapter, Mayagüezanos por la Salud y el Ambiente, Inc., Coalición de Organizaciones Anti-Incineración, Inc., Amigos del Río Guaynabo, Inc., Campamento Contra las Cenizas en Peñuelas, Inc., and CAMBIO Puerto Rico, Inc.

2
I. BACKGROUND AND QUALIFICATIONS 1
2
Q. Please state your name, employer and business address. 3
A. My name is Ronny Sandoval. I am President of ROS Energy Strategies, LLC, a Colorado 4
based limited liability company specializing in energy consulting. My business address is 5
1905 15th St. #7241, Boulder, CO 80306. 6
Q. On whose behalf are you testifying? 7
A. I am testifying on behalf of the Local Environmental Organizations: Comité Diálogo 8
Ambiental, Inc., El Puente de Williamsburg, Inc. - Enlace Latino de Acción Climática, 9
Comité Yabucoeño Pro-Calidad de Vida, Inc., Alianza Comunitaria Ambientalista del 10
Sureste, Inc., Sierra Club and its Puerto Rico chapter, Mayagüezanos por la Salud y el 11
Ambiente, Inc., Coalición de Organizaciones Anti-Incineración, Inc., Amigos del Río 12
Guaynabo, Inc., Campamento Contra las Cenizas en Peñuelas, Inc., and CAMBIO Puerto 13
Rico. 14
Q. Have you previously testified before this Bureau? 15
A. Yes. In this same proceeding, CEPR-AP-2018-0001 on October 23, 2019. 16
17

3
Q. What is the purpose of your supplemental testimony? 1
A. My supplemental testimony addresses PREPA’s responses to the Puerto Rico Energy 2
Bureau’s 9th set of requirements of information related to energy efficiency, as submitted 3
on November 27, 2019. I believe PREPA should consider the potential for expanding the 4
portfolio of energy efficiency and demand side management program offerings in its 5
Integrated Resource Plan. 6
Q. What aspect of the PREPA’s responses on energy efficiency does your supplemental 7
testimony address? 8
A. In its response to the Puerto Rico Energy Bureau’s ninth requirement of information, 9
PREPA indicated that Demand Side Management programs “are always managed to an 10
annual cap—even during the ramping years. We ramped adoption conservatively to 11
ensure market demand would likely exceed supply.” In the results section of the ROIs, 12
PREPA further recognized the uncertainty in the demand forecast in identifying the ESM 13
as its preferred plan “in case that the demand did not drop as expected”. It should be 14
noted that PREPA’s annual caps are based on the specific energy efficiency measures and 15
customer segments PREPA has identified in its forecasts, and does not include the 16
potential for additional measures that customers could be offered as a result of decisions 17
made in the Regulation for Energy Efficiency and Demand Response docket1. In its 18
Amicus Brief filed September 20, 20192, Rocky Mountain Institute observed that the 19
1 Regulation for Energy Efficiency and Demand Response http://energia.pr.gov/wp-content/uploads/2019/09/Resolution-NEPR-MI-2019-0015-2.pdf 2 Amicus Brief filing of Rocky Mountain Institute; September 20, 2019 http://energia.pr.gov/wp-content/uploads/2019/09/RMI-Amicus-Brief-PREPA-IRP.pdf

4
“demand forecast presented in this IRP is very uncertain, so it is critical that a plan be 1
robust to demand changes, especially if demand is higher than forecast.” 2
Q. What are your recommendations for managing these concerns around the 3
uncertainty of energy efficiency and demand side management measure adoption? 4
A. One potential strategy for managing this uncertainty could include expanding the energy 5
efficiency and demand side management program offerings to include additional 6
measures and customer segments. 7
A report recently released by the “Queremos Sol” coalition3 identifies a series energy 8
efficiency and demand side management program offerings, based on historical 9
experiences in Puerto Rico and DSM measure potential based on similar planning 10
regions. The Queremos Sol coalition views these offerings as incremental to the program 11
efforts identified in the IRP. Some of the measures identified in the Queremos Sol report 12
include the replacement of inefficient refrigerators, commercial demand response, 13
conservation voltage reduction, and distributed storage. Diversifying the program 14
offerings to include additional measures that are tailored to the energy use of Puerto 15
Rico’s customer segments, could aid PREPA in managing this uncertainty in its forecast. 16
For instance, if a few programs underperform in the early years, having additional well-17
designed energy efficiency programs that overperform could make up a potential shortfall 18
in the demand reductions achieved. 19
3 A Distributed Energy Resource Roadmap for Puerto Rico – Phase I Report; Sandoval, R. ; November 2019 https://ieefa.org/puerto-rico-update-queremos-sol-coalition-calls-for-adopting-decentralized-and-renewables-based-energy-plan/ The Report is attached as exhibit LEO-ROS-2 to my testimony.

5
Additional demand side management offerings as those identified in the report could 1
serve as a hedge against the underperformance of measures already identified in the IRP. 2
Q. Do you have any additional observations on demand side management program and 3
planning? 4
A. As also stated in its Amicus Brief, RMI observed that “PREB could provide greater 5
clarity by establishing both clear lines of responsibility and clear goals and direction for 6
distributed storage programs, whether in this IRP or in the Energy Efficiency and 7
Demand Response docket.” Coordination across the IRP, Energy Efficiency & Demand 8
Response, and Distribution System Planning dockets is critical to establishing a solid 9
foundation by which to pursue measures that manage uncertainty, increase the likelihood 10
of customer adoption of efficiency, and prioritize Puerto Rico’s energy policy objectives 11
to benefit the public good. 12
Q. Does this conclude your prepared supplemental testimony? 13
A. Yes. 14

CERTIFICATION
I, Ronny Sandoval, CERTIFY that the contents of my testimony are known to me and are
the truth according to the best of my abilities and reasonable knowledge. The technical and
operational aspects included in the testimony are based on information that has been gathered in
good faith; but I cannot guarantee the truthfulness of information gathered from third parties.
_____________________________________
Ronny Sandoval

0
A DISTRIBUTED ENERGY RESOURCE ROADMAP FOR
PUERTO RICO PHASE I REPORT
Ronny Sandoval [email protected]
Abstract An evaluation of the capability for Distributed Energy Resources and Non-Wires Alternatives to
defer or avoid large centralized infrastructure across Puerto Rico’s energy system. November 18, 2019
NEPR
Received:
Dec 11, 2019
11:49 PM

A Distributed Energy Resource Roadmap for Puerto Rico Phase I Report
1

A Distributed Energy Resource Roadmap for Puerto Rico Phase I Report
2
Table of Contents I. Report Summary ................................................................................................................................... 3
A. Approach ........................................................................................................................................... 3
B. Report Structure ................................................................................................................................ 4
II. Policy Landscape and Planning Environment ....................................................................................... 5
A. Methodology ...................................................................................................................................... 5
B. Primary References .......................................................................................................................... 6
C. Resource Requirements ................................................................................................................... 7
III. Distributed Energy Resources and Non-Wires Alternatives ........................................................... 11
Relationship between Energy Efficiency and Distributed Generation .................................................... 11
A. Residential and Commercial Lighting ............................................................................................. 12
B. Solar Water Heaters ........................................................................................................................ 13
C. Refrigerator Replacements ............................................................................................................. 14
D. Air Conditioners ............................................................................................................................... 14
E. Solar PV and Energy Storage ......................................................................................................... 15
F. Commercial Demand Response ..................................................................................................... 16
G. Conservation Voltage Reduction..................................................................................................... 16
Figure 1 ............................................................................................................................................... 18
Figure 2 ............................................................................................................................................... 19
IV. Analysis Results and Levelized Cost of Energy .............................................................................. 20
A. Results ............................................................................................................................................ 20
Figure 3 ............................................................................................................................................... 21
Figure 4 .............................................................................................................................................. 22
B. Levelized Cost of Energy ................................................................................................................ 23
Figure 5 ............................................................................................................................................... 23
V. Foundations for Growth in DERs and NWAs .................................................................................. 24
A. Hosting Capacity Analysis ............................................................................................................... 24
B. Streamlined Interconnection Process ............................................................................................. 24
C. Non-Wires Alternatives Solicitations ............................................................................................... 25
D. Potential Funding Sources .............................................................................................................. 25
Utility Planning Budgets ...................................................................................................................... 25
Renewable Energy Certificates ........................................................................................................... 25
Federal Assistance .............................................................................................................................. 26
VI. Conclusion ....................................................................................................................................... 26
About the Author ......................................................................................................................................... 27

A Distributed Energy Resource Roadmap for Puerto Rico Phase I Report
3
I. Report Summary This report delivers a high-level analysis of the required non-wires alternatives, Distributed Energy Resource (DER) integration, and coordination that will defer or eliminate the need for large traditional centralized investments across Puerto Rico’s electric system, such as proposed 302-MW natural gas combined cycle units. The analysis demonstrates that a portfolio of Distributed Energy Resources can deliver demand reductions at the scale needed to realize large capital deferrals, and in a manner that advances community resilience, customer choice, and the public interest.
A. Approach
• Identify a portfolio of non-wires alternatives and distributed energy resources that can provide the capabilities needed to defer or eliminate the need for a proposed 302-MW natural gas combined cycle unit. • The Puerto Rico Electric Power Authority’s Integrated Resource Plan (IRP) primarily relies on large scale energy resources and large capital investments in transmission and distribution to address future energy needs. • Utilities in other regions have had great success in proactively pursuing and deploying a mix of non-wires alternatives and distributed energy resources as a means of meeting future energy needs reliably and cost-effectively. • This portfolio approach allows various technologies to work in concert and complement each other’s capabilities in a way that the entire mix delivers greater benefits than the sum of its parts. • This analysis seeks to identify a portfolio of resources that could eliminate the need for a 302-MW natural gas combined cycle or completely place it out of the IRP’s planning horizon.

A Distributed Energy Resource Roadmap for Puerto Rico Phase I Report
4
B. Report Structure
This report is organized as follows: Section II explores the policy landscape, history, and planning environment for the deployment of Distributed Energy Resources. Section III presents various Distributed Energy Resource solutions and explains why each is a good fit for Puerto Rico. Section IV presents the results of the analysis, including expected reductions in energy demand and the costs associated with the selection of each technology. Section V discusses some of the foundational elements needed to support the growth of DERs in a purposeful and methodical way. Section VI concludes the report with additional insights and key takeaways from the analysis.

A Distributed Energy Resource Roadmap for Puerto Rico Phase I Report
5
II. Policy Landscape and Planning Environment
The year 2009 marked the first time the Weatherization Assistance Program (WAP), part of American Recovery and Reinvestment Act (ARRA) stimulus package, was introduced in Puerto Rico. Prior to the rollout of this effort, the island did not have a strong history administering energy efficiency programs. The introduction of WAP led to the development of a robust infrastructure that allowed the island to manage the roughly $65 Million that was allocated to it for this purpose. By many measures, including customer satisfaction with the program offerings, customer referrals to friends and family, and the resultant energy savings, the program can be considered a success. However, once the original grant period concluded, there weren’t other funding streams readily available to continue program activities at this level and resulted in the winding down of the effort.
The Green Energy Fund was established in 2010 by the “Puerto Rico Green Energy Incentives Act” to promote sustainability by incentivizing the development of renewable energy projects, but operational challenges have slowed the continued progress of the program’s mission.
The Energy Public Policy Act of 2019 has reignited a discussion on how to advance energy efficiency and clean energy by setting ambitious targets for these sustainable solutions, including those sited at or near the customer. The Puerto Rico Energy Bureau has initiated several dockets that address the process and funding necessary to ensure the successful execution of the goals of the recent energy law.
We are at the early stages of this new effort, however ensuring there is a supportive environment for sustainable solutions to be identified, procured, and installed across communities to enhance resilience and foster economic growth is more important now than ever.
A. Methodology
When pursuing all cost-effective energy efficiency, Distributed Energy Resources, and Non-Wires Alternatives it’s a common practice to first perform a potential study to serve as a guide of what resources are possible to attain within a given time frame to serve a specific need. A recent notice from the Puerto Rico Energy Bureau1 recognized the importance of conducting this study to aid in program design and in establishing the alternative DER measures to pursue across various customer classes. Given the current absence of such a potential study of these alternatives across Puerto Rico, past experiences on DER deployment across the island were supplemented with experiences across places including Florida and Hawaii to arrive at the portfolio of solutions identified in the analysis conducted here.
1 In RE: Regulation for Energy Efficiency and Demand Response; Puerto Rico Energy Bureau; NEPR-MI-2019-0015; September 4, 2019 http://energia.pr.gov/wp-content/uploads/2019/09/Resolution-NEPR-MI-2019-0015-2.pdf

A Distributed Energy Resource Roadmap for Puerto Rico Phase I Report
6
B. Primary References
U.S. Territories and Weatherization Assistance Program During the Recovery Act Period; Tonn B., Rose E.; Oak Ridge National Laboratory; March 2015 https://weatherization.ornl.gov/wp-content/uploads/pdf/WAPRecoveryActEvalFinalReports/ORNL_TM-2014_592.pdf
Puerto Rico Integrated Resource Plan 2018-2019 Appendix 4: Demand Side Resources; Siemens – prepared for Puerto Rico Electric Power Authority; June 7, 2019
State of Hawaii Energy Efficiency Potential Study Final; EnerNOC Utility Solutions Consulting – prepared for Hawaii Public Utilities Commission; January 15, 2014
Measured Energy and Peak Demand Reduction from High Efficiency Air Conditioner Replacement; John A. Masiello and Matthew P. Bouchelle, Progress Energy Florida, Inc., Danny S. Parker and John R. Sherwin, Florida Solar Energy Center

A Distributed Energy Resource Roadmap for Puerto Rico Phase I Report
7
C. Resource Requirements
Puerto Rico’s energy planning efforts currently face several challenges that most other utilities don’t have to grapple with, including:
• Much of the generation fleet is slated to retire because of inefficiencies, environmental regulations, and policy decisions;
• A declining energy demand forecast that runs contrary to either the stagnant or rising demand other regions experience;
• Market forces and a focus on resilience introduce additional considerations for customers to explore alternatives to grid power.
2
2 2019 Fiscal Plan for the Puerto Rico Electric Power Authority; Certified June 27, 2019 p. 35 https://aeepr.com/es-pr/Documents/Exhibit%201%20-%202019%20Fiscal_Plan_for_PREPA_Certified_FOMB%20on_June_27_2019.pdf

A Distributed Energy Resource Roadmap for Puerto Rico Phase I Report
8
These dynamics present complexities to investment decisions regarding capital intensive investments across the grid. Thus, for the purposes of this assessment, the alternatives will be presented relative to the capacity of a large centralized gas plant.
3
Depending on the scenarios analyzed as part of PREPA’s Integrated Resource Plan (see table above), there can be significant variation in the magnitude and scale of the investment in centralized gas infrastructure each approach calls for.
3 Amicus Brief filing of Rocky Mountain Institute; September 20, 2019 https://drive.google.com/file/d/1xFY7Qa3-0XSPd9Ybv2F99szHFyobLO0N/view

A Distributed Energy Resource Roadmap for Puerto Rico Phase I Report
9
Normalized Load Shape for System Total
Source Workpaper: Load Forecast by Region PREPA 2018 IRP Base Case Revised 35 pct EE 050319.xlsm
Compared to many regions across the continental United States, the load shape across the Puerto Rico electric grid is relatively flat throughout the day. Many regions encounter very pronounced peaks, which as a result often dictate the energy conservation and DER solutions that are pursued in managing peak demand. PREPA’s grid4 as a whole peaks at night (see chart above), staying relatively constant for a period of about five hours, before dipping and ramping up again in the middle of the day. There is value in reducing consumption throughout the entire day or in targeting the pronounced peaks in a manner that doesn’t create new peaks to manage.
4 IRP 2019 – Main Report REV2 06182019 wERRATA, p 2-19

A Distributed Energy Resource Roadmap for Puerto Rico Phase I Report
10
The IRP already incorporates a significant amount of energy efficiency, demand response, and other distributed energy resources that result in lower energy consumption and demand (see below).
The following section identifies a portfolio of Distributed Energy Resources that is incremental to the DERs included in the IRP and can defer or eliminate the need for centralized gas infrastructure investments.

A Distributed Energy Resource Roadmap for Puerto Rico Phase I Report
11
III. Distributed Energy Resources and Non-Wires Alternatives
Distributed Energy Resources, or DERs, can be defined as energy solutions or technologies located close to the electric customer that can provide a service or value, including to other customers and the electric grid as a whole. These technologies and solutions can include “distributed generation resources, energy efficiency, energy storage, electric vehicles, and demand response technologies”5
Due to converging trends such as the sharp decline in costs for distributed energy solutions including residential systems6, increased customer interest in resilient power due to greater reliance on electricity as part of modern society, and customer interest in making clean energy choices, DERs have increasingly become a “go-to” option for customers, utilities, and stakeholders looking to transition to a more efficient, and cost-effective energy system.
Though DERs are usually found closer to the customer, utilities have taken note of the potential for these resources to assist in meeting their responsibility of providing reliable energy service, at potentially lower cost than traditional centralized investments and with better outcomes for the customer. When DERs are used in this manner, they are referred to as “Non-Wires Alternatives” or “projects [that] allow utilities to defer or avoid conventional infrastructure investments by procuring distributed energy resources (DER) that lower costs and emissions while maintaining or improving system reliability.”7
When utilities include DERs in the portfolio of solutions that can be used to meet future energy needs, it creates opportunities for selecting solutions that can be less expensive and include people and their communities in addressing future energy challenges.
Though the electric grid was originally designed with a one-way flow of electricity from the utility to the customer in mind, a more distributed future requires that electricity be managed to accommodate the flow of energy from customers as well. Processes and solutions are emerging every day that allow this new paradigm to be better managed. Greater transparency, standards, and communication between the utility, customers, energy service companies, and others can ensure that DERs can effectively operate in concert with the grid.
Relationship between Energy Efficiency and Distributed Generation
Energy efficiency measures and distributed generation can complement each other in a manner that increases value for individual customers and communities. Many microgrid installation
5 California’s Distributed Energy Resources Action Plan: Aligning Vision and Action; California Public Utilities Commission September 29, 2016 https://www.cpuc.ca.gov/uploadedFiles/CPUC_Public_Website/Content/About_Us/Organization/Commissioners/Michael_J._Picker/2016-09-26%20DER%20Action%20Plan%20FINAL3.pdf 6Tracking the Sun – Installed Price Trends for Distributed Photovoltaic Systems in the United States; LBL; September 2018 https://emp.lbl.gov/sites/default/files/tracking_the_sun_2018_briefing_0.pdf 7 NY REV CONNECT; NYSERDA https://nyrevconnect.com/non-wires-alternatives/

A Distributed Energy Resource Roadmap for Puerto Rico Phase I Report
12
designs located at the customer’s premise often begin by reducing energy waste through energy efficiency, before deciding on what generation technologies to select. This not only saves money by installing only the amount of generation that is necessary, but can ensure that critical equipment, including refrigerators and other appliances consume less energy, and can be powered through an outage.
The following list of measures can not only deliver energy and cost savings individually but can result in more resilient solutions when working in concert.
A. Residential and Commercial Lighting
Lighting is often one of the most cost-effective measures that one can pursue in any region. It also has a relatively high coincidence with the system peak, given that Puerto Rico’s peak demand takes place at night. The IRP already included some residential and commercial lighting, but not to the point of saturation of the measure. Given these factors and the low cost of the measure, lighting contribution was increased by 10% in the moderate scenario but 25% in the aggressive scenario.
Why it’s right for Puerto Rico:
Lighting is a critical service to maintain through large prolonged outages, with implications for the safety and security of communities, including in remote areas of the island. The more efficient the lighting measure, the more likely on-site generation can be used to power this measure through disruptions. Throughout the year, efficient lighting measures can deliver energy demand reductions at Levelized Cost of Energy of about $0.06 / kWh for residential offerings and at higher rate of $0.12 / kWh for commercial installations due to higher administrative costs for the latter. Redesigns of these programs can likely reduce these costs further to fall in line with the lower costs realized in lighting programs across other parts of the United States.
Residential and Commercial Lighting Reductions in Moderate Scenario:
5 MWs by 2025; 15 MWs by 2038
Residential and Commercial Lighting Reductions in Aggressive Scenario:
12 MWs by 2025; 38 MWs by 2038
In its Integrated Resource Plan, PREPA’s proposed a residential and commercial lighting programs that would engage around 150,000 participants a year. The reductions presented in this analysis account for an incremental participation of 14,000 residential customers and 1,000 commercial customers a year, totaling an additional 300,000 participants by the end of the 20-year period ending in 2038 for the moderate scenario. This participation rate is roughly doubled in the aggressive scenario.

A Distributed Energy Resource Roadmap for Puerto Rico Phase I Report
13
B. Solar Water Heaters
In 2010, the U.S. Department of Energy’s Weatherization Assistance Program (WAP) in Puerto Rico prioritized the installation of 1,200 solar water heaters across income-eligible residents, with support from American Recovery and Reinvestment Act funds. In 2011, the number of installations increased ten-fold to cover an additional 10,000 units8.
Though the lifetime savings from these systems are relatively significant (considering the high energy consumption of the electric water heater alternative), the capital costs of installing these systems is high compared to other measures and can be out of reach for the average consumer.
That said, the estimated Levelized Cost of Energy for residential solar water heaters of $0.19 / kWh9 could still be a competitive energy option for customers, especially in a high retail rate environment. Jurisdictions have begun to update their building codes to require solar water heaters in new construction of single-family homes.
For the moderate scenario analyzed, only an annual install rate comparable to that of WAP in 2011 are presented. For the aggressive scenario, this install rate is essentially doubled. Given observations from the WAP administration on demand and eligibility among customers, the installation of these resources will likely continue to be a desired measure over the planning horizon.
Why it’s right for Puerto Rico:
In the aftermath of Hurricanes Irma and Maria, Federal Emergency Management Agency (FEMA) assessed10 the performance of various structures and facilities across Puerto Rico. FEMA observed an “excellent” performance from solar water heaters anchored to roof systems, in part due to the strong frame required to support the water tanks that increased their resistance to strong winds. These systems are well suited to the concrete homes found on the island.
Solar Water Heater Reductions in Moderate Scenario:
18 MWs by 2025; 52 MWs by 2038
Solar Water Heater Reductions in Aggressive Scenario:
36 MWs by 2025; 104 MWs by 2038
8 U.S. Territories and Weatherization Assistance Program During the Recovery Act Period; Tonn B., Rose E.; Oak Ridge National Laboratory; March 2015 9 State of Hawaii Energy Efficiency Potential Study Final; EnerNOC Utility Solutions Consulting; January 15, 2014 https://puc.hawaii.gov/wp-content/uploads/2013/04/State_of_HI_Potential_Study_Final.pdf 10 Hurricanes Irma and Maria in Puerto Rico - Building Performance, Observations Recommendations, and Technical Guidance - Mitigation Assessment Team Report; FEMA; October 2018 https://www.fema.gov/media-library-data/1551103959254-8696c36e064ea9540499dfe85cbb7ef3/FINALFEMAPRMATP-2020-022219.pdf

A Distributed Energy Resource Roadmap for Puerto Rico Phase I Report
14
The reductions presented here represent solar water heater installations at around 7,000 units per year or around 130,000 units by the end of the 20-year period ending in 2038 in the moderate scenario. These total installations are essentially doubled in the aggressive scenario to about 260,000 installations by the end of the 20-year period. These projections are in line with rates observed for this measure through the Weatherization Assistance Program.
C. Refrigerator Replacements
This measure focuses on the replacement of inefficient refrigerators with newer units that meet current and more stringent standards. Refrigerators generally have a long life, but even older units that are technically still functional lose efficiency over time. Some refrigerators can predate modern efficiency standards and can consume very large amounts of electricity. With careful selection of the participant population, savings from the replacement of these refrigerators have been routinely been observed at “well over 1,000 kWh / year”11 .
Why it’s right for Puerto Rico:
WAP administrators identified the installation of Energy-Star rated refrigerators to be a key measure for efficiency, at one point installing around 50 units per day.12 Efficient refrigerators can more likely be powered through a large power disruption with on-site distributed generation and energy storage than those that produce a large amount of waste. Aside from having a large population of likely program participants, the low Levelized Cost of Energy for this measure of about $0.08 / kWh makes this an attractive customer solution.
Refrigerator Replacement Reductions in Moderate and Aggressive Scenarios:
12 MWs by 2025; 35 MWs by 2038
These reductions represent refrigerator replacements at the rate of about 20,000 per year. This would total roughly 400,000 replacements by the end of the 20-year period ending in 2038 and reflects a rate of installation observed previously through the Weatherization Assistance Program.
D. Air Conditioners
Window Air Conditioners were included as a measure in the IRP, though the program does not include a dedicated offering for wall-mounted units. WAP experience indicates this is a significant
11Refrigerator Replacements for the Weatherization Program; Moore A. - D&R International, Ltd., Kinney L. - E Source / Platts / McGraw Hill https://aceee.org/files/proceedings/2002/data/papers/SS02_Panel2_Paper16.pdf 12 U.S. Territories and Weatherization Assistance Program During the Recovery Act Period; Tonn B., Rose E.; Oak Ridge National Laboratory; March 2015 https://weatherization.ornl.gov/wp-content/uploads/pdf/WAPRecoveryActEvalFinalReports/ORNL_TM-2014_592.pdf

A Distributed Energy Resource Roadmap for Puerto Rico Phase I Report
15
portion of the residential cooling segment. As a conservative assumption, the AC measures included in the IRP were increased by 10%.
Why it’s right for Puerto Rico:
Air conditioning use in Puerto Rico is estimated to make up 24%13 of all energy use for residential customers. Replacing inefficient cooling systems with Energy Star rated appliances could result in annual energy savings of 500 kWh per unit / per year and can be delivered at a relatively low Levelized Cost of Energy of about $0.07 / kWh.
Air Conditioner Reductions in Moderate and Aggressive Scenarios:
4 MWs by 2025; 11 MWs by 2038
In its Integrated Resource Plan, PREPA’s proposed a residential air conditioner program that would install a little over 100,000 units a year. The reductions presented in this analysis account for an incremental replacement of 10,000 air conditioner units per year, totaling an additional 200,000 units by the end of the 20-year period ending in 2038.
E. Solar PV and Energy Storage
The IRP included large capacity installations of utility-scale solar photovoltaics and energy storage to varying degrees across planning scenarios - with a recognition for the anticipated growth of distributed generation also included in the energy and demand forecast. However, residential and commercial energy storage was not included in the IRP assumptions.
Distributed Energy Storage can provide significant value to the grid, by shifting the solar energy generated during relatively low demand periods and when production is high in a similar manner as is projected at the utility scale. The island’s peak occurs at night and remains relatively constant for about 5 hours. This presents an ideal opportunity and application for distributed energy storage to dispatch the energy it can store from solar systems off-peak to this peak period.
The analysis examined deployment levels of energy storage needed to shift a percentage of the energy from the projected distributed PV systems to realize demand reductions across the 5-hour peak period. The resultant energy reductions are presented for a moderate scenario, where 5-7% of the distributed solar PV systems have energy storage and can shift energy generated to the peak and a more aggressive scenario where 8-10 % is shifted over the peak period.
The annualized costs for distributed energy storage were obtained from documents submitted as part PREPA’s IRP filing, at a projected $164 / kW.
Why it’s right for Puerto Rico:
Communities in Puerto Rico have pursued distributed Solar PV, alongside energy storage as a means of enhancing energy resilience. Energy storage allows the power produced from solar systems to be dispatched when its needed on-site. Most current configurations disconnect solar
13 U.S. Territories and Weatherization Assistance Program During the Recovery Act Period; Tonn B., Rose E.; Oak Ridge National Laboratory; March 2015 https://weatherization.ornl.gov/wp-content/uploads/pdf/WAPRecoveryActEvalFinalReports/ORNL_TM-2014_592.pdf

A Distributed Energy Resource Roadmap for Puerto Rico Phase I Report
16
generation from demand when an outage occurs. The combined offering could additionally help in managing distribution dynamic conditions that can arise from the two-way flow of power resulting from higher deployment of distributed generation.
Residential and Commercial Storage Reductions in Moderate Scenario:
10 MWs by 2025; 25 MWs by 2038
Residential and Commercial Storage Reductions in Aggressive Scenario:
16 MWs by 2025; 37 MWs by 2038
These reductions represent distributed solar PV and energy storage system installations totaling around 6,000 in the moderate scenario and about 9,000 systems in the aggressive scenario by 2038. The required number of systems to meet these peak demand reductions can vary depending on the size of the energy storage systems, dispatch capabilities etc. It is assumed that stored energy from these systems would be available to be dispatched during the required hours of the system peak.
F. Commercial Demand Response
Only some small commercial DER was included in the IRP, resulting in a total of about 7 MWs of demand response for this segment by 2038. In contrast, the residential demand response projected in the IRP by the year 2038 was 75 MWs, more than 10 times that of the commercial sector. In most regions, commercial demand response far eclipses the contributions of the residential sector given the demand controls and other options available to the large commercial market. As a conservative assumption, the commercial demand response contribution was assumed to be in the order of that presented in the IRP for the residential sector, accounting for the coincidence of the commercial sector with the system peak for both the moderate and aggressive scenarios.
Why it’s right for Puerto Rico:
This measure is relatively untapped in Puerto Rico and can be deployed in a targeted manner across large commercial sites. There’s a lower volume of customers to market these demand response programs to relative to the residential market, which can result in higher engagement and faster realization of demand reductions across the planning horizon.
The estimated levelized cost for these demand reductions is $ 70 / kW.
Commercial Demand Response Reductions in Moderate and Aggressive Scenario:
50 MWs by 2025; 72 MWs by 2038
G. Conservation Voltage Reduction

A Distributed Energy Resource Roadmap for Puerto Rico Phase I Report
17
Integrated Volt / VAR Control (IVVC) involves the management of various electric distribution system assets and advanced control technologies to ''right-size" the voltage delivered to end-use electric customers. Conservation Voltage Reduction (CVR) is a specialized application of IVVC, and can reduce overall voltage levels, while ensuring these voltages remain within acceptable standards for electric distribution. Reductions in distribution system voltage have been demonstrated to result in reductions in energy consumption across the electric circuits on which this practice is applied.
Electric customers across circuits with active IVVC management and lower voltage levels typically consume less energy without needing to make changes to their individual consumption behavior. Investments in IVVC technology and grid modernization can result not only in energy reductions, but also may provide additional visibility and operational flexibility in responding to a variety of dynamic system conditions.
For instance, Duke Energy Progress (DEP) in North Carolina implemented14 a Conservation Voltage Reduction program specifically deployed during peak demand times to defer the construction of a new Combustion Turbine (CT) plant. This specialized use of modernization technologies most resembled a Demand Response program, in that it was primarily deployed during system peaks and emergencies. It had a target of achieving 310 MW of peak reductions. The North Carolina Utility Commission, which regulates DEP, classified this solution as an Energy Efficiency program and allowed expenditures to be recovered through a rider. The peak demand reduction goals for the program were exceeded, reaching 322 MW of reductions. These reductions alone nearly matched the generation capabilities of Duke Energy’s Asheville Plant Units 3 & 4, which have a combined production of 324 MW at peak.
Conservation Voltage Reduction can typically deliver reductions in the range of 2.5% - 3.0%15, across the circuits that it is applied (see Figure 1 and Figure 2). This means that if a series of circuits where CVR is applied have 100 MW of demand, a 3% reduction performance from CVR solutions will result in a net demand of 97 MW across the circuits instead, all while maintaining adequate electric service. These reductions are observed on the customer side of the meter, which means that in addition to the energy avoided, delivery losses are also reduced as with other energy efficiency measures.
Why it’s right for Puerto Rico:
Figure 1 and Figure 2 show a drop over time in the amount of peak demand reductions coming from CVR across the IRP planning horizon. Since CVR operates by reducing a percentage of the total load across the circuits on which it is applied, as PREPA’s load forecasts continue to decrease the closer one gets to the end of the plan at 2038, the reductions from CVR also decrease.
14 2018 Smart Grid Technology Plans of Duke Energy Carolina, LLC and Duke Energy Progress, LLC and Duke Energy Progress, LLC; NCUC Docket No. E-100, Sub 157 p.47 https://starw1.ncuc.net/NCUC/ViewFile.aspx?Id=637b938c-008b-4b25-bc20-b50d9d9f5034 15 Conservation Voltage Reduction; Paladino J.; Office of Electricity Delivery & Energy Reliability ; October 13, 2015 https://www.smartgridclimatechange.org/wp-content/uploads/2013/10/Joe-Paladino-DOE.pdf

A Distributed Energy Resource Roadmap for Puerto Rico Phase I Report
18
However, one additional significant benefit of deploying CVR in the earlier years, is that if energy efficiency and distributed energy resources underperform resulting in higher net demands, CVR will automatically overperform and make up some of the progress.
Another benefit is that these solutions can be installed quickly over a few years - increasing the efficiency of the electric grid in Puerto Rico and reducing how much energy customers consume without requiring any action on their part.
The estimated Levelized Cost of Energy for Conservation Voltage Reduction was $0.03 / kWh.
Some CVR providers have estimated the Levelized Cost of Energy for Conservation Voltage Reduction as low as $0.01 / kWh.
Conservation Voltage Reductions in Moderate Scenario:
45 MWs by 2025; 26 MWs by 2038
Conservation Voltage Reductions in Aggressive Scenario:
54 MWs by 2025; 31 MWs by 2038
Figure 1 – Peak Demand Reductions from CVR for the High, Low, and Reference load forecasts of PREPA’s 2019 IRP, assuming an average performance from the CVR solutions.

A Distributed Energy Resource Roadmap for Puerto Rico Phase I Report
19
Figure 2 – Peak Demand Reductions from CVR for the High, Low, and Reference load forecasts PREPA’s 2019 IRP, assuming a high-end performance from the CVR solutions.

A Distributed Energy Resource Roadmap for Puerto Rico Phase I Report
20
IV. Analysis Results and Levelized Cost of Energy
A. Results
Conservation Voltage Reduction, solar water heaters, refrigerator replacements, and to a slightly lesser extent, window AC replacements and lighting, have relatively uniform demand reduction throughout the day. Commercial Demand Response and energy storage act as more dispatchable resources during system peaks and complement the solar generation available during the day but not found during the five or so hours at night when the system peaks. Solar PV is not presented in the peak demand reductions across these scenarios but serve a critical role in ensuring the energy storage resources needed at night are charged and available to meet system peaks.
Utilities that pursue these kinds of resource portfolios are beginning to develop tools that help orchestrate the contribution of Distributed Energy Resources throughout the day. For example, Con Edison built a “Distributed Energy Resource Evaluation” tool “using both internal and external expertise, to evaluate on a comparable basis a diverse range of DER while accounting for duration of availability (e.g., four hour battery, eight-plus-hour energy efficiency, two-hour demand response), risk, maturity, flexibility, and ability to otherwise meet the needs” in a target area.16 This would help incorporate additional analytics to optimize the selection and operation of DERs in a given portfolio.
16 BQDM Quarterly Expenditures& Program Report Q2-2019; Consolidated Edison Company of New York, Inc.; August 2019

21
Figure 3 – System-wide Peak Demand Reductions from a moderate deployment of measures using information from the 2019 PREPA IRP Reference load forecast. Projections are based on anticipated operational performance and do not reflect a maximum potential for the individual measures.
22
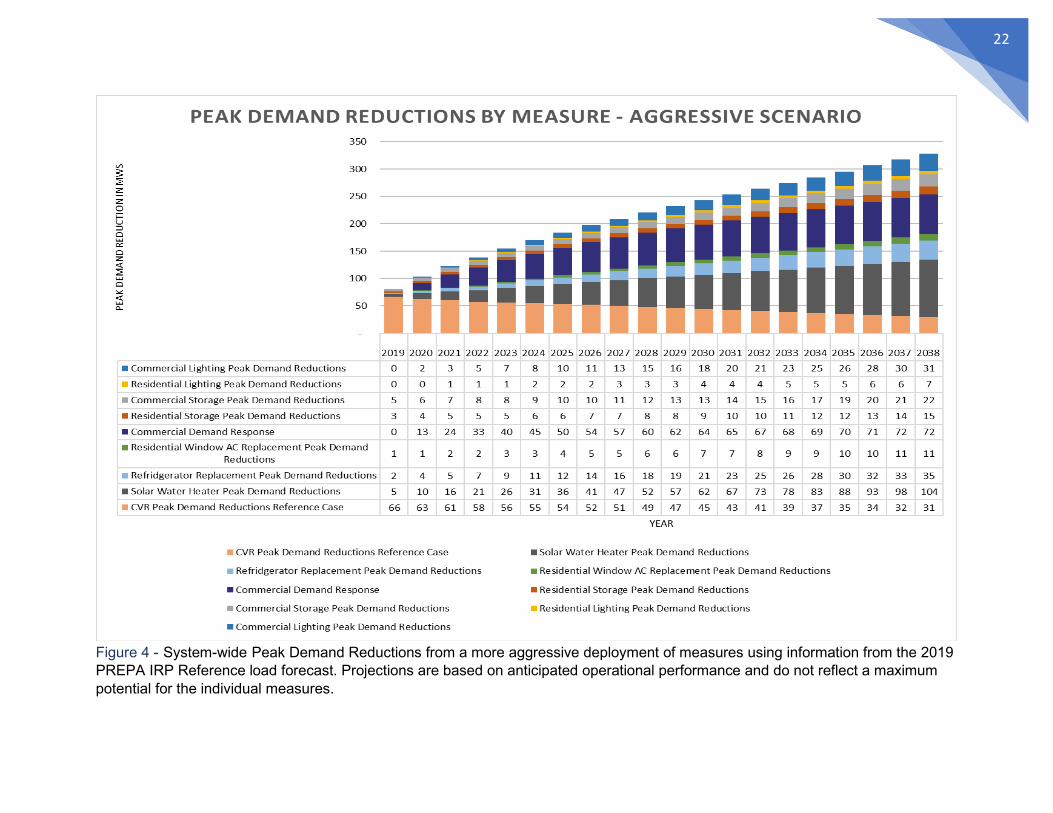
Figure 4 - System-wide Peak Demand Reductions from a more aggressive deployment of measures using information from the 2019 PREPA IRP Reference load forecast. Projections are based on anticipated operational performance and do not reflect a maximum potential for the individual measures.

23
B. Levelized Cost of Energy
A comparison of the Levelized Cost of Energy for the Distributed Energy Resource and Non-Wires alternatives for the measures discussed is presented in the table below. These measures deliver year-round energy savings, which when compared to their associated costs over the life of each measure, arrive at a Levelized Cost of Energy in $ / kWh. Other measures including energy storage and demand response are instead dispatched over specific hours. Thus, the costs for these measures are reflected in $ / kW to reflect the value over specific hours. It should be noted that when these energy conservation measures are implemented, customer don’t just save on energy – they also save on transmission, distribution, and associated technical losses because the energy saved doesn’t have to go through the electric grid. Thus, these DER costs should be compared to the retail rate versus just the cost of generation.
Figure 5 – Measure Levelized Cost of Energy.

A Distributed Energy Resource Roadmap for Puerto Rico Phase I Report
24
V. Foundations for Growth in DERs and NWAs
In its Integrated Resource Plan, PREPA indicated it would need to invest in “changes to the transmission and distribution system to support the incorporation of rooftop PV and the recommended energy efficiency and demand response programs.”17 Though PREPA estimated nearly $1B in distribution investments to accommodate DERs across the first seven years of the IRP alone, the company also recognized the limitations of the high-level analysis behind these estimates.
PREPA noted that this analysis “can only be used for screening purposes and it is not a substitute for the necessary detailed system studies that must consider the feeder topology, assets in service, and location of the load and PV systems. This future detailed analysis, which is beyond the scope of this evaluation, must include an evaluation of the expected performance of equipment; refinement of the definition of the necessary improvements, capital expenditures, and timing to implement the projects.”
In order to establish a supportive environment where DERs and NWAs can grow and thrive, the following capabilities should be developed through a collaboration with PREPA and its many stakeholders.
A. Hosting Capacity Analysis
Hosting capacity analyses allow utilities to develop a better sense of the amount of distributed energy resources that may be integrated at the local feeder level, with current system assets and without impacting power quality or reliability. When this hosting information is shared through maps and other accessible tools, customers and other stakeholders can make more informed decisions with regards to siting and project design. As hosting capacity analyses are further informed by feeder level DER forecasts and modeling, utilities and its stakeholders can identify where future system upgrades may be required in order to support DER growth. Data access and presentation to customers is key to following through and ensuring the utility meets changing customer demands.
B. Streamlined Interconnection Process
Regions without a standardized interconnection process may lack clarity in terms technical requirements for systems looking to connect, costs and fees for customers and third-party energy companies, as well as the expected timelines for when the projects are to hit certain milestones and completion.
17 IRP 2019 – Main Report REV2 06182019 wERRATA, p 9-1

A Distributed Energy Resource Roadmap for Puerto Rico Phase I Report
25
This can create unnecessary friction and create barriers for the installation of these projects. Standards help create a uniform set of expectations and experiences for the customer and third parties as a result of thoughtful consideration.
C. Non-Wires Alternatives Solicitations
Non-wire alternative solicitations initiated by utilities allow stakeholders to propose solutions that could defer or avoid costly infrastructure investments otherwise required to meet a clearly defined system need. Through these competitive solicitations, utilities communicate the requirements of the system needs to be addressed including the location, magnitude of the load relief needed, and the required in-service date for the proposed solution. Communities, customers and stakeholders working alongside the utility, can expand the solution set of investments available for meeting system needs to include cost-effective DERs—resulting in significant savings for all customers in the form of avoided infrastructure investments.
In addition, studies such as the aforementioned “Distributed Energy Resource Evaluation” should be conducted in order to identify how energy efficiency, demand response, energy storage, and other forms of DER can work in concert to meet system needs beyond capacity. NWA projects in some regions have incentivized utilities18 to increase the diversity of DER that participate through these solicitations to achieve local public policy goals.
D. Potential Funding Sources
Utility Planning Budgets
Successful NWA solutions allow utilities to select a less costly or a more beneficial societal solution than historically would have been the case through system planning. Utility budgets that would have ordinarily been assigned to a traditional utility solution could instead be used to fund NWAs, potentially at a lower cost, closer to the customer, and with greater overall benefits. Additionally, as DER and NWA design and interconnection process becomes standardized, local lenders and green banks may develop a better sense of risks and opportunities involved in financing these projects – potentially bringing down financing costs for the customer.
Renewable Energy Certificates
Renewable Energy Certificates (RECs) function as a form of incentive and are created whenever one MWh of renewable energy is generated in certain regions. The price for these RECs (the effective incentive) is determined based on the demand for these certificates at a specific point in time. Select entities are required to obtain a certain number of RECs, thus creating a demand for
18 Order Establishing Brooklyn / Queens Demand Management Program; State of New York Public Service Commission; December 11, 2014 Case 14-E-0302 http://documents.dps.ny.gov/public/MatterManagement/CaseMaster.aspx?MatterSeq=45800

A Distributed Energy Resource Roadmap for Puerto Rico Phase I Report
26
these RECs. Rather than being offered a fixed incentive, renewable energy resources receive payments based on the demand for RECs.
Federal Assistance
In addition to the Weatherization Assistance Program discussed, it may be possible to coordinate with local agencies on the use of Federal funding sources, including the Hazard Mitigation Grant Program funds to support the deployment of beneficial DER solutions. Though this report has primarily focused on the ability of DERs to defer capital investments, DERs can also offer services that enhance community resilience19 and the lower the risk to loss of life prioritized by these Federal grants.
VI. Conclusion
There is great potential in pursuing a DER resource portfolio that includes some of the most promising and cost-effective measures suitable for the Puerto Rico energy system. Through a combination of assessing past experiences of pursuing these measures on the island and identifying incremental opportunities that remain untapped beyond those identified in the Integrated Resource Plan, a moderate and aggressive scenario for a higher level of DER resources was developed across a 20-year planning horizon.
Additional analysis of transmission constraints and distribution system interactions may indicate whether a specific plant can be deferred or eliminated based on the location and magnitude of the DERs in the resource portfolio. As discussed, DERs and NWAs have been demonstrated to realize demand reductions at scales large enough to defer capital investments in centralized resources across other jurisdictions. However, a conducting a study on the potential of each measure, considering the Puerto Rico planning environment, could provide additional information on how much can be deployed and when. Similarly, an NWA solicitation may yield an actual market response that can provide this information.
The moderate scenario identified peak demand reductions of 144 MW by 2025 and 236 MW by 2038, while the more aggressive scenario identified 184 MW of reductions by 2025 and 328 MWs by 2038. 2025 is a key year in the IRP in that, depending on the planning assumptions scenario of the study, one or more large centralized plant is scheduled to come on-line. Depending on the location and other power system dynamics, the reductions provided by a portfolio of distributed resources deployed before a plant investment is made may eliminate the project from the planning horizon.
19 Alternative Energy Generation Opportunities in Critical Infrastructure; NREL; E. Hotchkiss, I. Metzger, J. Salasovich, and P. Schwabe; November 2013 https://www.nrel.gov/docs/fy14osti/60631.pdf

A Distributed Energy Resource Roadmap for Puerto Rico Phase I Report
27
About the Author
Ronny Sandoval
Ronny Sandoval is President of ROS Energy Strategies, a consultancy focused on advancing the modernization and transformation of the electric system. He has testified as an expert witness across several states on issues regarding system planning, grid modernization, and energy efficiency. He has over ten years of management experience in the utility business, including areas of transmission and distribution system planning and demand side management as well as forecasting the long-range impacts of energy efficiency programs for revenue and system planning. He currently sits on multiple boards of non-profit organizations that champion the transformation of the electric grid, workforce development, and customer empowerment.