A Display is a Terrible Thing to Waste
16
A DISPLAY IS A TERRIBLE THING TO WASTE Examining P.O.P. Compliance Rates & Best Practices sponsored by shopassociation.org
Transcript of A Display is a Terrible Thing to Waste
A DISPLAY IS A TERRIBLE THING TO WASTE
Examining P.O.P. Compliance Rates & Best Practices
sponsored byshopassociation.org
A DISPLAY IS A TERRIBLE THING TO WASTE | Examining P.O.P. Compliance Rates & Best Practices2
The point of purchase represents the time and place at which all the elements of the sale—the shopper, the money, and the product—come together.
By using various communications vehicles, including displays, packaging, sales promotions, in-store advertising, and digital signage, at the point of purchase (P.O.P.), marketers have a great opportunity to influence the shopper’s buying decision.
P.O.P. programs need to be managed carefully, however, so as to ensure that both retailers and shoppers will see consistency and coordination in the programs rather than confusion and contradiction. After all, a well executed point-of-purchase initiative can be a huge shot in the arm for your sales.
Having the greatest offer, eye-catching graphics and ground-breaking shopper insights doesn’t count for much, however, if the P.O.P. display fails to reach the sales floor. It ’s like leaving money on the table—quite literally. And the sad reality is that even the most creative programs often fall short of expectations due to the challenge of in-store compliance execution.
If you were asked to come up with a dollar figure for how much your company spends on point-of-purchase materials, could you? Could anyone at your company? What about your P.O.P. compliance rate? Do you have any idea what percentage of the tens of thousands of pallet stackers, merchandisers, counter toppers, and end cap displays that get sent out to stores every year actually make it to the aisles?
As the global, non-profit association dedicated to enhancing the total shopper experience, Shop!, a trade association focused on enhancing retail environments and experiences set out to establish a benchmark for current compliance rates. We also sought to understand the cost of lost sales opportunities resulting from set-up non-compliance, the ROI of the display, and the influence, if any, the mode of execution played in compliance. In 2014, and again in 2015, we conducted compliance studies using Quri’s IMPACT tool to learn more about the in-store execution of P.O.P. displays across the grocery, mass merchant, drug, and dollar store channels.
This white paper offers actionable insights, case studies, and best practices based on the findings of those studies. I hope you will leverage the learnings in the following pages to create and execute P.O.P. programs that address retailers’ challenges so that your display makes it onto the floor and your product ends up in the shopper’s basket.
Steven A. WeissChief Executive OfficerShop! Enhancing Retail Environments & Experiences
Madeline Baumgartner Shop!
Dennis Bonn Menasha Packagaing
William Carafello Trans World Marketing
Richard Carrigan United Displaycraft
John Cochran WestRock Merchandising Displays
Blake Edelman Applied Merchandising Concepts, LLC
Denis Gibney Frito-Lay, Inc.
Mike Heneghan TimBar Packaging & Display
John Jaffke Kraft Heinz
Lisa Parks Darko, Inc.
John Pender Bayer Healthcare - NA HQ
Will Phillips Menasha Packaging
Jeffrey Rafalski TimBar Packaging & Display
Anne Samoyedny Pepsi-Cola North American Beverage
Michael Schliesmann Great Northern Corporation
Rick Sensenbrenner KapStone Paper & Packaging
Greg WegeThe Central Group
Mary Westerhaus Applied Merchandising Concepts, LLC
A SPECIAL THANKS TO OUR COMPLIANCE COMMITTEE
FOREWORD
A DISPLAY IS A TERRIBLE THING TO WASTE | Examining P.O.P. Compliance Rates & Best Practices 3
Each week, 127 million customers visit Wal-Mart. That’s compared to 68 million people who watch ABC, CBS or NBC evening news. The store is filled with engaged con-sumers in “shopping mode,” already thinking about and pre-disposed to making purchases—a marketer’s dream come true.
However, brand marketers know that this dream can easily turn into a terrible nightmare when their in-store programs aren’t executed correctly or at all.
Companies spend billions every year on displays and other forms of P.O.P. marketing—and for good reason. Point-of-purchase displays and programs offer far- reaching visibility inside stores, help boost sales and influence purchases. That is, IF the displays are in place, correctly implemented, and stocked.
Sales organizations have been utilizing the store for quite some time through rather substantial trade promotion programs and investments. Brand marketers have only been targeting consumers outside of the store, leading them to the store but leaving them at the front door. They have been neglecting an important moment in the consumer’s decision making process, “The First Moment of Truth.” In order to execute holistic 360-degree market-ing, marketers can no longer overlook the store or the consumer-turned-shopper.
The average consumer is exposed to 3,000 advertising and promotional messages a day and has more 80,000
items to choose from in a single store visit. So a shopper’s intentions can and do change in a split second.
As the typical shopper walks through a store, her eyes are only still for 200-300 milliseconds at a time. The decision on whether to stock with a brand or buy a rival product is made in just three to seven seconds. So it’s no surprise that six in ten in-store purchases can be classified as impulse buys.
Once we grasp shoppers’ motivations and needs, we need to understand how they move through the store and use the various zones in the environment so that we can more accurately place and position P.O.P. pro-grams to lift sales.
Maximizing your P.O.P. display program results requires a combination of great design, a clear understanding of display economics, and exceptional execution of all aspects of the display program. Effective program exe-cution necessitates excellent project management and attention to detail since there are hundreds of details that need to be coordinated and properly managed to ensure successful execution.
This white paper will examine the role of P.O.P. compli-ance and execution at retail and offer some actionable insights and best practices to help ensure that your program makes it on the floor and your product into the shopper’s basket.
The store is a critical touch point to reach and influence consumers. 76% of all purchase decisions are made in-store, and 68% of all in-store purchases are impulse driven. So the store’s potential to create impressions and build brand equity is tremendous, and it should be thought of like any other marketing media.
A DISPLAY IS A TERRIBLE THING TO WASTE | Examining P.O.P. Compliance Rates & Best Practices4
PERCEPTION IS EVERYTHING, EXCEPT WHEN IT’S NOTPERCEPTION VS. REALITY: THE STOPPING POWER OF DISPLAYSMarketers are increasingly recognizing the importance of influencing the many purchase decisions made in-store through more effective shopper marketing programs, particularly when it comes to P.O.P. displays.
In their efforts to “win at retail,” most have quickly learned that observation is the key to understanding the shopping experience. Given the overwhelming amount of product choices, in-store decisions are largely physiologi-cal and subconscious: Shoppers are driven by habit—and by what they see (and miss) during their trips down the aisle. So asking people direct questions often elicits logi-cal but misleading answers, because people don’t know exactly how or why they made decisions.
POPAI’s Shopper Engagement Studies, which examined purchase decision rates and P.O.P. audits in supermarket and mass-merchant channels, portions of which included neuro-monitoring and eye-tracking components in the research methodology. The result was much deeper insight into shoppers’ behavior in the retail environment.
The studies also highlighted the critical role of store placement of P.O.P. displays and the fact that the location can actually be more important than the creative exe-cution. We now know that stopping power and in-store visibility is primarily a function of location/placement and contrast with the surrounding environment. So we can’t assume that the most compelling displays will be the most visible and successful ones.
Store-level display audits were a significant compo-nent of the Shopper Engagement Studies. A number of details were recorded by field ethnographers, including location of displays, types of displays, characteristics of displays, and if products were on sale on the display. Information was logged manually and photos of the displays were included with the appropriate audit entry. More than 8,000 displays were audited and recorded in the mass-merchant study alone.
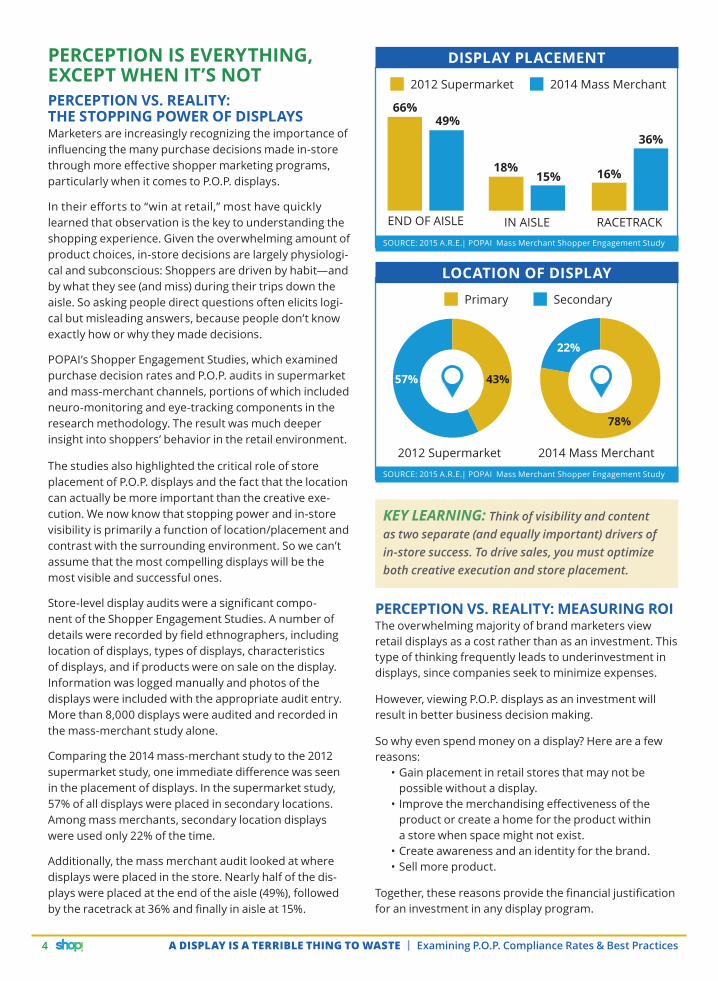
Comparing the 2014 mass-merchant study to the 2012 supermarket study, one immediate difference was seen in the placement of displays. In the supermarket study, 57% of all displays were placed in secondary locations. Among mass merchants, secondary location displays were used only 22% of the time.
Additionally, the mass merchant audit looked at where displays were placed in the store. Nearly half of the dis-plays were placed at the end of the aisle (49%), followed by the racetrack at 36% and finally in aisle at 15%.
KEY LEARNING: Think of visibility and content as two separate (and equally important) drivers of in-store success. To drive sales, you must optimize both creative execution and store placement.
PERCEPTION VS. REALITY: MEASURING ROIThe overwhelming majority of brand marketers view retail displays as a cost rather than as an investment. This type of thinking frequently leads to underinvestment in displays, since companies seek to minimize expenses.
However, viewing P.O.P. displays as an investment will result in better business decision making.
So why even spend money on a display? Here are a few reasons:
• Gain placement in retail stores that may not be possible without a display.
• Improve the merchandising effectiveness of the product or create a home for the product within a store when space might not exist.
• Create awareness and an identity for the brand.• Sell more product.
Together, these reasons provide the financial justification for an investment in any display program.
2012 Supermarket
66%49%
15%
36%
18% 16%
DISPLAY PLACEMENT
2014 Mass Merchant
END OF AISLE
Primary
LOCATION OF DISPLAY
Secondary
2012 Supermarket 2014 Mass Merchant
43%
22%
78%
57%
SOURCE: 2015 A.R.E.| POPAI Mass Merchant Shopper Engagement Study
SOURCE: 2015 A.R.E.| POPAI Mass Merchant Shopper Engagement Study
IN AISLE RACETRACK
A DISPLAY IS A TERRIBLE THING TO WASTE | Examining P.O.P. Compliance Rates & Best Practices 5
For the small number of brand marketers who classify P.O.P. display as an investment, measuring the return on that investment should be a priority. CPG participants in the 2014 A.R.E. | POPAI Compliance Study often cited that their company calculates ROI using “No specific formula,” “Program cost measured against net sales gain,” or “Do Not Track.”
KEY LEARNING: P.O.P. displays are a solid business investment, not an expense. However, measuring the ROI of those displays is of critical importance.
PERCEPTION VS. REALITY: FAILURE TO LAUNCHHow do brand marketers know if their P.O.P. display has been displayed properly in the store, or if it has even been displayed at all? Turns out that compliance— meaning whether or not P.O.P. promotions are displayed in-store as planned—varies widely based on the retail channel, the display type and who is responsible for the display installation.
A.R.E. | POPAI’s 2015 Compliance Initiative Study polled participating CPGs to see the current state of their expec-tations around display compliance. What we found was a severe disconnect between expectations and reality. CPGs had a perceived compliance rate around displays upwards of 70%. The reality: display compliance was 40%—no change from the 2014 study.
What can account for this vast difference in compliance perception versus reality? Three factors contribute to the success or failure of a launch:
1. Retail channel2. Display type3. The installer
KEY LEARNING: With hundreds of details involved in coordinating and managing a P.O.P. program, effective execution requires excellent project management and attention to detail.
CPGs had a perceived compliance rate around displays upwards of 70%.
The reality is that planned display compliance was at 40%.
RETAIL ME NOTEXAMINING THE IMPACT OF RETAIL CHANNEL ON DISPLAY COMPLIANCEToday’s shoppers are trying to find the precise mix of value, quality and convenience, which leads them to use as many as five different retail channels to purchase groceries, according to a 2013 Deloitte report.
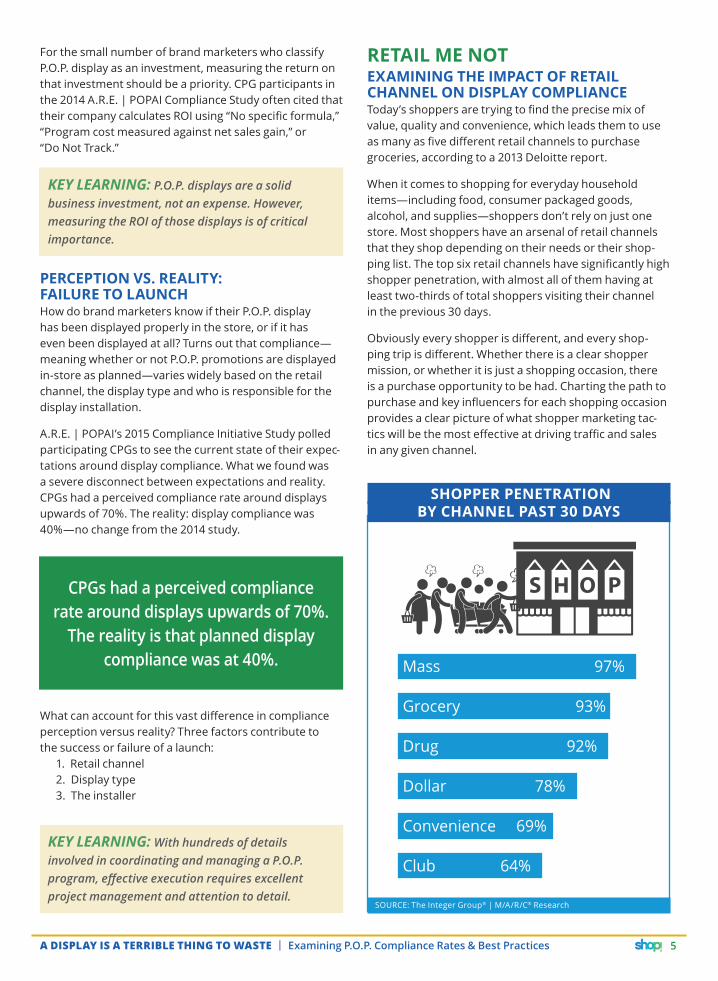
When it comes to shopping for everyday household items—including food, consumer packaged goods, alcohol, and supplies—shoppers don’t rely on just one store. Most shoppers have an arsenal of retail channels that they shop depending on their needs or their shop-ping list. The top six retail channels have significantly high shopper penetration, with almost all of them having at least two-thirds of total shoppers visiting their channel in the previous 30 days.
Obviously every shopper is different, and every shop-ping trip is different. Whether there is a clear shopper mission, or whether it is just a shopping occasion, there is a purchase opportunity to be had. Charting the path to purchase and key influencers for each shopping occasion provides a clear picture of what shopper marketing tac-tics will be the most effective at driving traffic and sales in any given channel.
SHOPPER PENETRATION BY CHANNEL PAST 30 DAYS
SOURCE: The Integer Group® | M/A/R/C® Research
Mass 97%
Grocery 93%
Drug 92%
Dollar 78%
Convenience 69%
Club 64%
A DISPLAY IS A TERRIBLE THING TO WASTE | Examining P.O.P. Compliance Rates & Best Practices6
Understanding the shopping occasion and shopping mode provides marketers the opportunity to tailor P.O.P. programs not only for the shopper, but for the retail channel as well. This, in part, helps explain why P.O.P. expenditures are of increasing significance to marketers.
After all, P.O.P. displays often prove more productive than advertising and promotion expenditures. That combined with the decline in sales support at the store level is stim-ulating interest among retailers in manufacturers’ P.O.P. programs.
Finally, changes in consumers’ shopping patterns and expectations, along with an upsurge in impulse buying, means that the point of purchase is playing a more import-ant role in consumers’ decision making than ever before.
All that said, it might stand to reason that displays designed and tailored for different channels would have a higher compliance rate across the board.
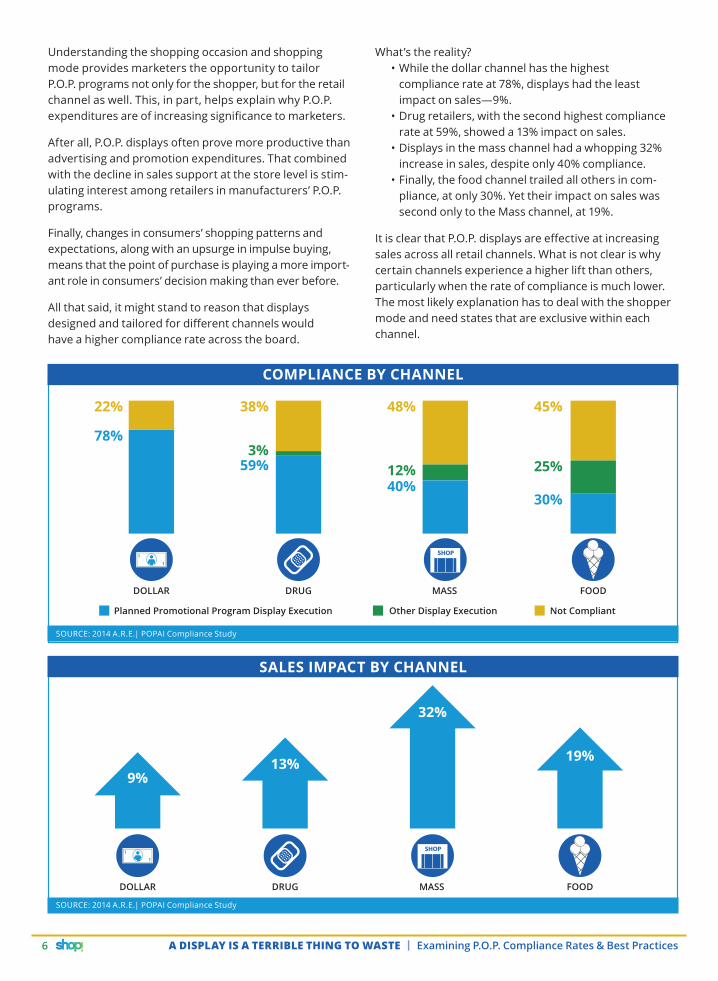
What’s the reality?• While the dollar channel has the highest
compliance rate at 78%, displays had the least impact on sales—9%.
• Drug retailers, with the second highest compliance rate at 59%, showed a 13% impact on sales.
• Displays in the mass channel had a whopping 32% increase in sales, despite only 40% compliance.
• Finally, the food channel trailed all others in com-pliance, at only 30%. Yet their impact on sales was second only to the Mass channel, at 19%.
It is clear that P.O.P. displays are effective at increasing sales across all retail channels. What is not clear is why certain channels experience a higher lift than others, particularly when the rate of compliance is much lower. The most likely explanation has to deal with the shopper mode and need states that are exclusive within each channel.
COMPLIANCE BY CHANNEL
SALES IMPACT BY CHANNEL
SOURCE: 2014 A.R.E.| POPAI Compliance Study
SOURCE: 2014 A.R.E.| POPAI Compliance Study
Planned Promotional Program Display Execution Other Display Execution Not Compliant
MASS
48%
40%12%
22%
DOLLAR
78%
FOOD
45%
30%
25%
38%
DRUG
59%3%
MASS
32%
FOOD
19%
DRUG
13%
DOLLAR
9%
A DISPLAY IS A TERRIBLE THING TO WASTE | Examining P.O.P. Compliance Rates & Best Practices 7
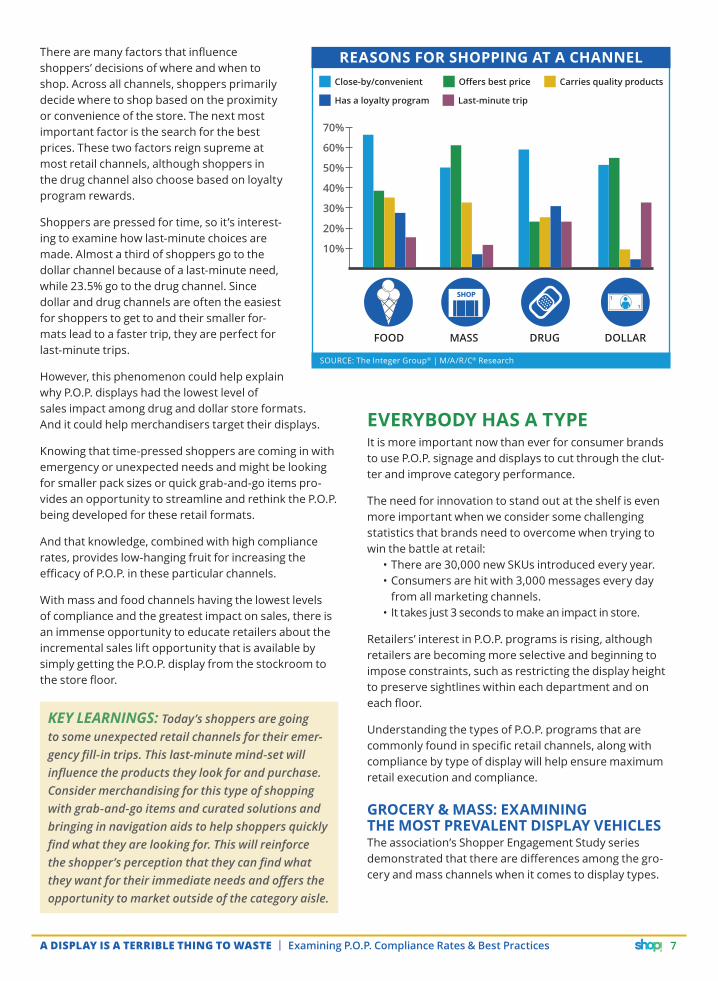
There are many factors that influence shoppers’ decisions of where and when to shop. Across all channels, shoppers primarily decide where to shop based on the proximity or convenience of the store. The next most important factor is the search for the best prices. These two factors reign supreme at most retail channels, although shoppers in the drug channel also choose based on loyalty program rewards.
Shoppers are pressed for time, so it’s interest-ing to examine how last-minute choices are made. Almost a third of shoppers go to the dollar channel because of a last-minute need, while 23.5% go to the drug channel. Since dollar and drug channels are often the easiest for shoppers to get to and their smaller for-mats lead to a faster trip, they are perfect for last-minute trips.
However, this phenomenon could help explain why P.O.P. displays had the lowest level of sales impact among drug and dollar store formats. And it could help merchandisers target their displays.
Knowing that time-pressed shoppers are coming in with emergency or unexpected needs and might be looking for smaller pack sizes or quick grab-and-go items pro-vides an opportunity to streamline and rethink the P.O.P. being developed for these retail formats.
And that knowledge, combined with high compliance rates, provides low-hanging fruit for increasing the efficacy of P.O.P. in these particular channels.
With mass and food channels having the lowest levels of compliance and the greatest impact on sales, there is an immense opportunity to educate retailers about the incremental sales lift opportunity that is available by simply getting the P.O.P. display from the stockroom to the store floor.
KEY LEARNINGS: Today’s shoppers are going to some unexpected retail channels for their emer-gency fill-in trips. This last-minute mind-set will influence the products they look for and purchase. Consider merchandising for this type of shopping with grab-and-go items and curated solutions and bringing in navigation aids to help shoppers quickly find what they are looking for. This will reinforce the shopper’s perception that they can find what they want for their immediate needs and offers the opportunity to market outside of the category aisle.
EVERYBODY HAS A TYPEIt is more important now than ever for consumer brands to use P.O.P. signage and displays to cut through the clut-ter and improve category performance.
The need for innovation to stand out at the shelf is even more important when we consider some challenging statistics that brands need to overcome when trying to win the battle at retail:
• There are 30,000 new SKUs introduced every year.• Consumers are hit with 3,000 messages every day
from all marketing channels.• It takes just 3 seconds to make an impact in store.
Retailers’ interest in P.O.P. programs is rising, although retailers are becoming more selective and beginning to impose constraints, such as restricting the display height to preserve sightlines within each department and on each floor.
Understanding the types of P.O.P. programs that are commonly found in specific retail channels, along with compliance by type of display will help ensure maximum retail execution and compliance.
GROCERY & MASS: EXAMINING THE MOST PREVALENT DISPLAY VEHICLESThe association’s Shopper Engagement Study series demonstrated that there are differences among the gro-cery and mass channels when it comes to display types.
SOURCE: The Integer Group® | M/A/R/C® Research
Close-by/convenient Offers best price Carries quality products
Has a loyalty program Last-minute trip
70%
60%
50%
40%
30%
20%
10%
MASS DOLLARFOOD DRUG
REASONS FOR SHOPPING AT A CHANNEL
A DISPLAY IS A TERRIBLE THING TO WASTE | Examining P.O.P. Compliance Rates & Best Practices8
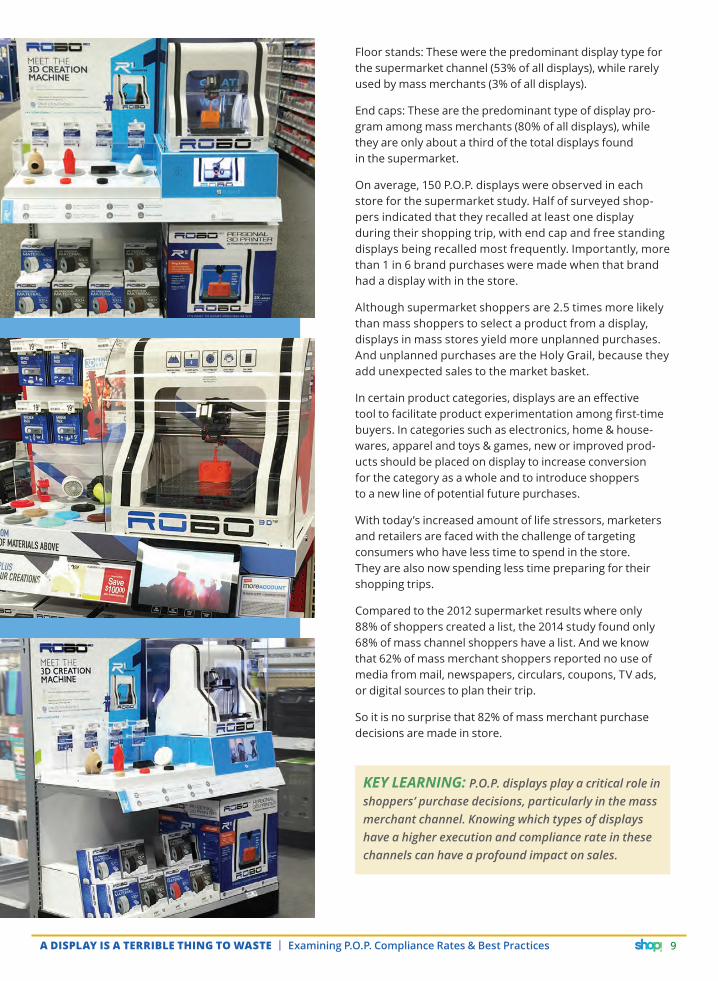
SITUATIONAL OVERVIEWROBO 3D™, a designer and marketer of consumer grade 3D printers, was looking to break the retail barrier in an abbreviated timeframe and deliver a targeted solution that merchandised and displayed their printer, filament options and 3D print ready kits. ROBO 3D company is the leading brand which made 3D printing affordable to the consumer. Not surprisingly tech-nology driven retailers like Best Buy and Staples gravitated towards ROBO 3D to lead them into new categories. ROBO 3D printer is new to retail there-fore prominent placement in high traffic retailers was essential. Once place-ment was secured the display required direction to illustrate the functioning and capabilities of the 3D printer for ease of use at an excellent price point.
KEY INSIGHTFor maximum sales and education at retail the display showcased the printer under a clear case to give the consumer a clear view of the product. An inter-active audio/video player promotes use of the product and ease of use. Key to consumer buy-in is clear communication on ease-of-use for 3D printing and showcase ideas on what to do with 3D printed objects from crafts to real classroom projects. The 3D printers use a variety of filaments which are available in a variety of colors and textures, the display has mounted sample swatches for consumers to touch and feel the actual printed products. This has proven to be key in the sales of the 3D printers.
STRATEGIC APPROACHRobo 3D, new to the retail, chose end cap placement to garner the most traf-fic within stores and prominently display the product in one central location. The in-store display required a merchandiser which would be able to hold the 3D printer along with samples of product to view and purchase. Gaining premier end cap placement at Best Buy store locations brought the product to life at the store level. An executed deployment plan for display setup was key to ensure the needed ROI.
RESULTSWithin the first three weeks of the product placed on the endcap sales tripled and most recently displays have been deployed in a variety of Staples loca-tions in even more predominate traffic areas in store.
“We had to pull together this endcap display and experience in a short period of time and Frank Mayer and Associates, Inc. was able to work with us exten-sively to make it happen” said, Braydon Moreno, CEO, ROBO 3D, Inc. “The vision of the endcap came to life based on our ideas and working with their team was truly seamless.”
BREAKING THE RETAIL BARRIER IN 3Da case study of ROBO 3D’s innovative use of end caps to boost sales
A DISPLAY IS A TERRIBLE THING TO WASTE | Examining P.O.P. Compliance Rates & Best Practices 9
Floor stands: These were the predominant display type for the supermarket channel (53% of all displays), while rarely used by mass merchants (3% of all displays).
End caps: These are the predominant type of display pro-gram among mass merchants (80% of all displays), while they are only about a third of the total displays found in the supermarket.
On average, 150 P.O.P. displays were observed in each store for the supermarket study. Half of surveyed shop-pers indicated that they recalled at least one display during their shopping trip, with end cap and free standing displays being recalled most frequently. Importantly, more than 1 in 6 brand purchases were made when that brand had a display with in the store.
Although supermarket shoppers are 2.5 times more likely than mass shoppers to select a product from a display, displays in mass stores yield more unplanned purchases. And unplanned purchases are the Holy Grail, because they add unexpected sales to the market basket.
In certain product categories, displays are an effective tool to facilitate product experimentation among first-time buyers. In categories such as electronics, home & house-wares, apparel and toys & games, new or improved prod-ucts should be placed on display to increase conversion for the category as a whole and to introduce shoppers to a new line of potential future purchases.
With today’s increased amount of life stressors, marketers and retailers are faced with the challenge of targeting consumers who have less time to spend in the store. They are also now spending less time preparing for their shopping trips.
Compared to the 2012 supermarket results where only 88% of shoppers created a list, the 2014 study found only 68% of mass channel shoppers have a list. And we know that 62% of mass merchant shoppers reported no use of media from mail, newspapers, circulars, coupons, TV ads, or digital sources to plan their trip.
So it is no surprise that 82% of mass merchant purchase decisions are made in store.
KEY LEARNING: P.O.P. displays play a critical role in shoppers’ purchase decisions, particularly in the mass merchant channel. Knowing which types of displays have a higher execution and compliance rate in these channels can have a profound impact on sales.
A DISPLAY IS A TERRIBLE THING TO WASTE | Examining P.O.P. Compliance Rates & Best Practices10
Few companies need to be convinced that in today’s scale-driven, technology-intensive global economy, part-nerships are the supply chain’s lifeblood. Vendors and suppliers provide a critical service for any business. In the world of P.O.P., these relationships allow businesses to focus on building shopper-stopping displays that add value to both retailers and brands alike. If you start with the right attitude—that is, your key suppliers are incorporated as valued partners—and leverage available tools and practices to get your product and development processes under control, you’ll have a foundation upon which to build outstanding supplier relationships that are not only critical to your company’s success, but also to getting your displays up on the store floor.
Are you effectively tapping into the knowledge and product lines that your suppliers offer? Often, because they write the order, manufacturers find themselves in the dominant position and miss a prime opportunity to enhance their services by not asking for the expertise and knowledge of their suppliers during the design phase. While components pieces may be viewed as a small part of the overall design of a display you might be missing out on a big opportunity to make your P.O.P. programs easier to deploy in the field.
“While we certainly have the hooks and components to provide simple-to-deploy solutions, we have also earned 117 United States and international patents for innovations and have over 50 years of point-of-purchase experience,” says Rich Wildrick, Directory of Engineering at Trion Industries. “We can obligingly provide the parts requested by our customers, but we have extensive knowledge and inventory of other solutions that can make displays easier to ship and deploy with all the parts included and merchandise in place for immediate sale.”
Vendor and supplier relationships are a delicate balance between an immediate “pre-ordained” P.O.P. execution and the potential for a better, vendor-based solution. One thing is clear: all parties need open communication and trust to gain maximum mutual benefit from the partnership. This is an important dynamic to under-stand, since, in the long run, a healthy vendor and supplier alliance will be a competitive advantage.
DEVELOPING RELATIONSHIPSRelationships matter. So much so that it’s vital to main-tain the best vendor and supplier relationships contin-
uously. The foundation for these relationships includes the following:
Respect: Relationships are built on mutual respect. If you don’t respect a vendor or supplier, and any recommendations they may make, then the relation- ship will be doomed to fail.
Trust: Building trust provides the cornerstone of your vendor or supplier relationship. Trust is a two-way street that must be cultivated at all times. Trust becomes important when times get tough. You must trust that your vendor makes recommendations in YOUR best interests so as to keep the partnership alive and vital.
Mutual Benefit: Relationships need to provide benefits to both parties. Without mutual benefits the partner-ship will be on shaky ground since the incentives to stick around are lacking. On occasion, compromise solutions to meet delivery deadlines can be to mutual benefit. Be open to the idea.
Fairness and Honesty: Fair and honest partners will always win out in the long run.
Without these components, a vendor or supplier rela-tionship will be challenging to maintain and will certainly descend into chaos over time. Remember all of these elements must be present because they feed off each other and allow the relationship to be productive instead of a chore.
STRIVE TO BUILD LASTING PARTNERSHIPSBuilding a strong partnership should be your goal when selecting vendors and suppliers. These partnerships will only strengthen your business and allow you to focus on your core competencies.
“Good vendors and suppliers also want to build strong partnerships because that builds better business for all,” said Brad Cox, Director of Sales & Marketing at Trion Industries. “The selection, cultivation and building of of vendor and supplier relationships is something that everyone within the in-store industry should be striving towards. This continuous process attempts to balance our business needs with the needs of our partners, help-ing position all for success when it comes time to launch any display at point of purchase.”
When business needs align, the partnership will be durable, profitable, and long-lived.
SOMETIMES IT’S THE SMALL THINGS THAT MATTER THE MOSTHow Deep Vendor-Supplier Relationships Can HELP Boost Compliance
A DISPLAY IS A TERRIBLE THING TO WASTE | Examining P.O.P. Compliance Rates & Best Practices 11
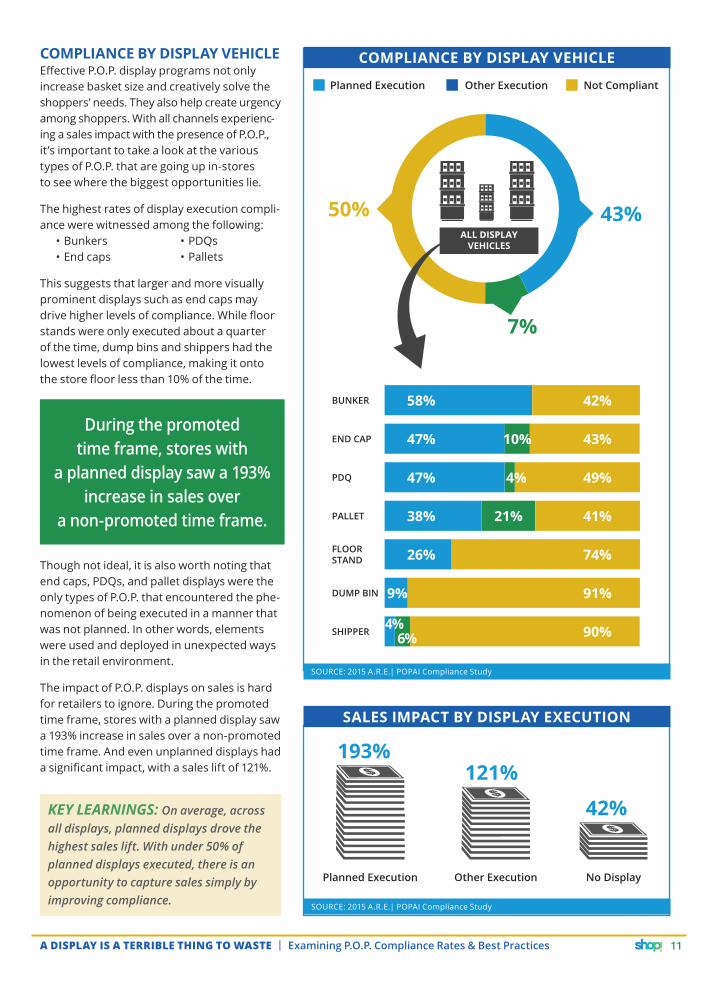
COMPLIANCE BY DISPLAY VEHICLEEffective P.O.P. display programs not only increase basket size and creatively solve the shoppers’ needs. They also help create urgency among shoppers. With all channels experienc-ing a sales impact with the presence of P.O.P., it’s important to take a look at the various types of P.O.P. that are going up in-stores to see where the biggest opportunities lie.
The highest rates of display execution compli-ance were witnessed among the following:
• Bunkers• End caps
• PDQs• Pallets
This suggests that larger and more visually prominent displays such as end caps may drive higher levels of compliance. While floor stands were only executed about a quarter of the time, dump bins and shippers had the lowest levels of compliance, making it onto the store floor less than 10% of the time.
Though not ideal, it is also worth noting that end caps, PDQs, and pallet displays were the only types of P.O.P. that encountered the phe-nomenon of being executed in a manner that was not planned. In other words, elements were used and deployed in unexpected ways in the retail environment.
The impact of P.O.P. displays on sales is hard for retailers to ignore. During the promoted time frame, stores with a planned display saw a 193% increase in sales over a non-promoted time frame. And even unplanned displays had a significant impact, with a sales lift of 121%.
KEY LEARNINGS: On average, across all displays, planned displays drove the highest sales lift. With under 50% of planned displays executed, there is an opportunity to capture sales simply by improving compliance.
COMPLIANCE BY DISPLAY VEHICLE
SALES IMPACT BY DISPLAY EXECUTION
SOURCE: 2015 A.R.E.| POPAI Compliance Study
SOURCE: 2015 A.R.E.| POPAI Compliance Study
Planned Execution
Planned Execution
Other Execution
Other Execution
Not Compliant
No Display
50%
7%
43%
BUNKER 42%58%
END CAP 47% 10% 43%
PDQ 4% 49%47%
FLOOR STAND 74%26%
DUMP BIN 91%9%
PALLET 41%38% 21%
ALL DISPLAY VEHICLES
121%
42%
During the promoted time frame, stores with
a planned display saw a 193% increase in sales over
a non-promoted time frame.
193%
SHIPPER 90%6%4%
A DISPLAY IS A TERRIBLE THING TO WASTE | Examining P.O.P. Compliance Rates & Best Practices12
COMPLIANCE BY RETAIL EXECUTION METHODIn the merchandising services business, execution is key. If the product or merchandise is not on the shelf or on the floor, it can’t sell. And, when merchandise doesn’t perform it leads to lost sales opportunities and brand engagement as well as frustration for the shopper.
So what’s the best method for installing displays and P.O.P. programs in the retail store?
Many CPG marketers cannot afford their own sales force and must rely on brokers or service merchandisers. Both often get a bad rap. A good broker can be more effective than a direct sales force in managing the point of pur-chase, as many big companies know well. Because they carry a number of non competing product lines, brokers enjoy economies of scale that enable them to visit retail stores more often than a manufacturer’s sales force to check stocks, reset displays, and offer planograms. Brokers can establish close relationships with retailers in their local areas and organize blockbuster promotional events for their clients.
All that said, it would be a logical assumption to believe that brokers have the highest level of compliance when it comes to executing displays at retail.
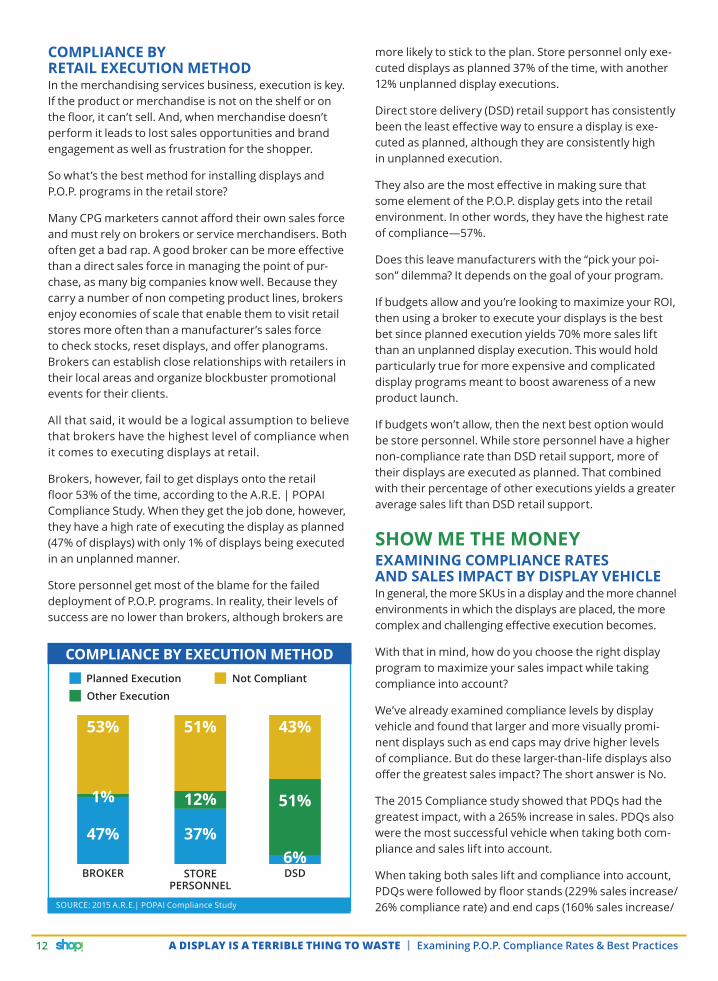
Brokers, however, fail to get displays onto the retail floor 53% of the time, according to the A.R.E. | POPAI Compliance Study. When they get the job done, however, they have a high rate of executing the display as planned (47% of displays) with only 1% of displays being executed in an unplanned manner.
Store personnel get most of the blame for the failed deployment of P.O.P. programs. In reality, their levels of success are no lower than brokers, although brokers are
COMPLIANCE BY EXECUTION METHOD
SOURCE: 2015 A.R.E.| POPAI Compliance Study
BROKER
53%
1%
47%
STORE PERSONNEL
51%
12%
37%
DSD
43%
51%
6%
Planned ExecutionOther Execution
Not Compliant
more likely to stick to the plan. Store personnel only exe-cuted displays as planned 37% of the time, with another 12% unplanned display executions.
Direct store delivery (DSD) retail support has consistently been the least effective way to ensure a display is exe-cuted as planned, although they are consistently high in unplanned execution.
They also are the most effective in making sure that some element of the P.O.P. display gets into the retail environment. In other words, they have the highest rate of compliance—57%.
Does this leave manufacturers with the “pick your poi-son” dilemma? It depends on the goal of your program.
If budgets allow and you’re looking to maximize your ROI, then using a broker to execute your displays is the best bet since planned execution yields 70% more sales lift than an unplanned display execution. This would hold particularly true for more expensive and complicated display programs meant to boost awareness of a new product launch.
If budgets won’t allow, then the next best option would be store personnel. While store personnel have a higher non-compliance rate than DSD retail support, more of their displays are executed as planned. That combined with their percentage of other executions yields a greater average sales lift than DSD retail support.
SHOW ME THE MONEYEXAMINING COMPLIANCE RATES AND SALES IMPACT BY DISPLAY VEHICLE In general, the more SKUs in a display and the more channel environments in which the displays are placed, the more complex and challenging effective execution becomes.
With that in mind, how do you choose the right display program to maximize your sales impact while taking compliance into account?
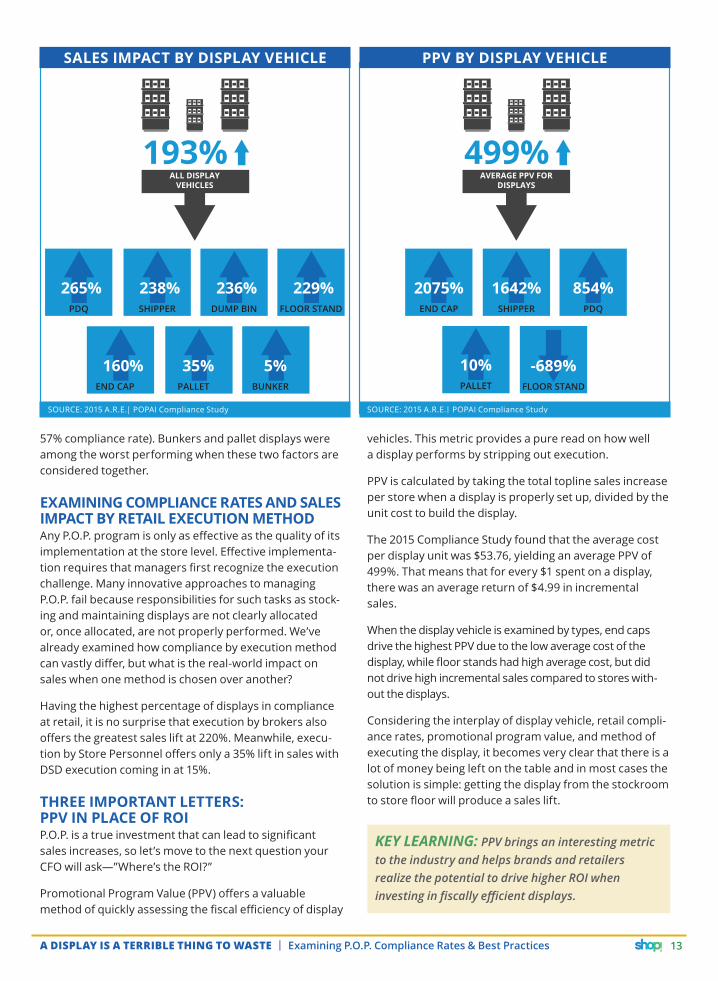
We’ve already examined compliance levels by display vehicle and found that larger and more visually promi-nent displays such as end caps may drive higher levels of compliance. But do these larger-than-life displays also offer the greatest sales impact? The short answer is No.
The 2015 Compliance study showed that PDQs had the greatest impact, with a 265% increase in sales. PDQs also were the most successful vehicle when taking both com-pliance and sales lift into account.
When taking both sales lift and compliance into account, PDQs were followed by floor stands (229% sales increase/ 26% compliance rate) and end caps (160% sales increase/
A DISPLAY IS A TERRIBLE THING TO WASTE | Examining P.O.P. Compliance Rates & Best Practices 13
SOURCE: 2015 A.R.E.| POPAI Compliance Study
57% compliance rate). Bunkers and pallet displays were among the worst performing when these two factors are considered together.
EXAMINING COMPLIANCE RATES AND SALES IMPACT BY RETAIL EXECUTION METHODAny P.O.P. program is only as eff ective as the quality of its implementation at the store level. Eff ective implementa-tion requires that managers fi rst recognize the execution challenge. Many innovative approaches to managing P.O.P. fail because responsibilities for such tasks as stock-ing and maintaining displays are not clearly allocated or, once allocated, are not properly performed. We’ve already examined how compliance by execution method can vastly diff er, but what is the real-world impact on sales when one method is chosen over another?
Having the highest percentage of displays in compliance at retail, it is no surprise that execution by brokers also off ers the greatest sales lift at 220%. Meanwhile, execu-tion by Store Personnel off ers only a 35% lift in sales with DSD execution coming in at 15%.
THREE IMPORTANT LETTERS: PPV IN PLACE OF ROIP.O.P. is a true investment that can lead to signifi cant sales increases, so let’s move to the next question your CFO will ask—”Where’s the ROI?”
Promotional Program Value (PPV) off ers a valuable method of quickly assessing the fi scal effi ciency of display
vehicles. This metric provides a pure read on how well a display performs by stripping out execution.
PPV is calculated by taking the total topline sales increase per store when a display is properly set up, divided by the unit cost to build the display.
The 2015 Compliance Study found that the average cost per display unit was $53.76, yielding an average PPV of 499%. That means that for every $1 spent on a display, there was an average return of $4.99 in incremental sales.
When the display vehicle is examined by types, end caps drive the highest PPV due to the low average cost of the display, while fl oor stands had high average cost, but did not drive high incremental sales compared to stores with-out the displays.
Considering the interplay of display vehicle, retail compli-ance rates, promotional program value, and method of executing the display, it becomes very clear that there is a lot of money being left on the table and in most cases the solution is simple: getting the display from the stockroom to store fl oor will produce a sales lift.
KEY LEARNING: PPV brings an interesting metric to the industry and helps brands and retailers realize the potential to drive higher ROI when investing in fi scally effi cient displays.
SALES IMPACT BY DISPLAY VEHICLE
SOURCE: 2015 A.R.E.| POPAI Compliance Study
193%ALL DISPLAY
VEHICLES
PDQ
END CAP
SHIPPER
PALLET
DUMP BIN
BUNKER
FLOOR STAND
265%
160%
238%
35%
236%
5%
229%
PPV BY DISPLAY VEHICLE
499%AVERAGE PPV FOR
DISPLAYS
END CAP
FLOOR STAND
SHIPPER PDQ
PALLET
2075%
-689%
1642% 854%
10%
A DISPLAY IS A TERRIBLE THING TO WASTE | Examining P.O.P. Compliance Rates & Best Practices14
YOU’RE NOT IN COMPLIANCEThe three largest hurdles to increasing sales through P.O.P. displays deal with the interplay between people, store, and display vehicle. Addressing even one of these factors can positively affect the success of marketing at retail. Even with these challenges, there are simple steps that can be taken to overcome these barriers and boost the sales impact of any P.O.P. display program.
1. PLANNING FOR THE STORERetailers are increasingly strapped for space and resources that benefit employees, shoppers, brand partners, and by extension the retailer itself. Labor is often a retailer’s largest controllable expense and can account for more than 10% of revenues—a considerable level in an industry with low profit margins. Many retailers see labor as a cost driver rather than a sales driver and therefore focus on minimizing its costs. The short-term pressures are just too difficult to resist.
“Through countless research and activation projects I’ve learned that design needs to meet the needs of both the shopper and the retailer. Designing for the shopper is one part of the equation, designing for the retailer is the second part” said Mary Westerhaus, Chief Marketing and Insights Officer at Applied Merchandising Concepts and former Sr. Director of The In-Store Experience Team at ConAgra Foods. “If the display is overly complicated to assemble and doesn’t make it onto the store floor then a design is not truly effective. Manufacturers should strive to design displays that are intuitive to assemble and ideally should never exceed more than five instruction steps to assemble unless it is permanent display.”
Understanding and planning for these challenges, it may be advisable to provide ideas for acceptable alternatives to in-store placement that would help address space issues and save employees’ valuable time when planned execution may not be possible.
Helping store personnel understand the impact on sales that a display can produce if properly located and executed, may help them see the urgency and benefit of executing displays as planned.
2. PLANNING FOR PEOPLEIt is not uncommon for a P.O.P. display to lose its brand identity simply because someone removes the signs or stocks the display with the wrong brand or product. Exploring ways to motivate and incentivize store personnel to make the promotion a priority can help ensure compliance and execution as planned. One way to incentivize store personnel is to include information about store-level incentives on the shipper itself. In addition, facilitating com-munications between representatives and stores to manage ongoing store priorities and personnel considerations can help ensure greater compliance.
3. PLANNING FOR DISPLAYSWhen it comes to getting the display on the floor, be sure to design appropri-ate footprints for the promotion scope, store space, and multiple fixtures.
“The notable increase in the quality of the briefs and the focus on the retail footprint suggests that retailers and brand marketers alike find value in P.O.P.“ said Westerhaus. “As a result, displays are becoming a lot more creative and clever to fit in the space that stores are allowing. CVS is a great example. The skinny displays and towers that are commonly found in the retailer allow for
A DISPLAY IS A TERRIBLE THING TO WASTE | Examining P.O.P. Compliance Rates & Best Practices 15
REFERENCE NOTESA.R.E. | POPAI 2015 Compliance Initiative Study: A Benchmark for the Successful Implementation of Secondary Displays and the Impact on Sales.
Clift, Joseph. (2010 May), MRS Retail Research: Neuroscience, eye-tracking and the real-time revolution’, WARC Exclusive Downloaded from warc.com
Integer Group. The Check-Out: Inside The Store Experience. Issue 4, 2016.
Lev-Glick, Lily (2012) Winning the In-Store Purchase Decision Game: Five Critical Measures to Uncover Shopper Marketing Opportunities. Shopper Sense.
‘Making the most of the moment of truth’, Millward Brown Points of View, 2006
POPAI 2014 Compliance Initiative Study: A Benchmark for the Successful Implementation of Secondary Displays and the Impact on Sales.
2012 POPAI Supermarket Shopper Engagement Study
2014 POPAI Mass Merchant Shopper Engagement Study
Retail Commission on Shopper Marketing (2010). Shopper marketing best practices: A collaborative model for retailers and manufacturers. In-Store Marketing Institute.
Ton, Zeynep. (2012 January/February) Why “Good Jobs” Are Good for Retailers. Harvard Business Review.
more P.O.P. on the floor. And because retailers are embracing and planning for P.O.P. the result is creating greater disruption not just noise and clutter in the retail environment.”
KEY RECOMMENDATIONS & TAKEAWAYSRecognizing the significance of P.O.P. programs is not enough. Brand market-ers must focus on developing more effective P.O.P. programs and, even more important, ensure that they are properly implemented at the store level.
Before developing a P.O.P. program, brand managers should have a clear understanding of their marketing strategy and obstacles they are likely to encounter—which products are being delivered to which markets through which channels of distribution.
Below are key recommendations and takeaways from this white paper that will help get your P.O.P. from the stock room floor to the store floor:
TUNE INTO A CHANNELToday’s shoppers are trying to find the precise mix of value, quality and con-venience, which leads them to use many different retail channels to fulfill their shopping needs. By segmenting your shoppers and tuning into the appropri-ate channel to reach them, you can develop a display program that not only has a higher compliance rate, but also a large sales lift for the given channel. It is also important to consider that the greater the number of SKUs in a display and the greater the diversity of channel environments in which the displays are placed, the more complex and challenging effective execution becomes.
JUST BECAUSE IT’S MY TYPE DOESN’T MEAN IT’S ALSO YOURSAssume that P.O.P. programs will vary depending on the distribution channel. The traditional hardware store and the self-service mass merchandiser, for example, differ both in store environment and in type of customer. So the ideal P.O.P. program for each will also differ. Taking into account compliance by display vehicle, retail channel, and sales impact can help create display programs that are win-win for brand marketers, retailers, and shoppers. Many innovative approaches to managing P.O.P. fail because responsibili-ties for stocking and maintaining displays are not clearly assigned, or once assigned, are not properly performed. Under these circumstances, coopera-tion between manufacturers and retailers can quickly turn into recrimination and blame. Instead, focus on the display vehicle types and creative placement alternatives to accommodate the needs of the retailers, not just the brand on display.
FROM PPV TO ROI, DISPLAYS OFFER A REAL SALES IMPACT The most important message for brand marketers is this: An effective P.O.P. program never runs like clockwork; it needs constant attention and re- evaluation. However, P.O.P.—even if it’s not executed as planned—rarely fails to deliver a significant boost in sales. Today’s savvy brand marketers recognize the old adage that the difference between success and failure often depends on the last 5% of effort rather than on the 95% that preceded it. In shopper marketing, that last 5% manifests itself at the point of purchase—just before shoppers choose what to buy.
For additional questions about the data or information contained in this White Paper please contact us at: