Discounting of Property and Casualty Loss and Loss Adjustment

P/C Loss & Loss Adjustment Expense Studies: Demotech Analysis
A Discussion of P/C Loss and Loss Adjustment Expense Reserve Studies
Initiated by Demotech, Inc.
Joseph L. Petrelli
President
Insurance literature is replete with articles, analyses, studies and discussion documents
related to industry loss and loss adjustment expense (L&LAE) reserves, the impact of L&LAE
reserve adequacy on insurance pricing cycles as well as the correlation between inadequate
L&LAE reserves and the failure rates of carriers. However, we found negligible justification for
the terminology or analysis of “industry L&LAE reserves” and no rigorous discussion of the
impact of underreserving L&LAE on the overstatement of reported income by solvent carriers.
In an effort to initiate thoughtful review and dialogue on these issues, Demotech undertook
this study to investigate two questions:
1) Is the term “industry loss and loss adjustment expense reserves” a meaningful one?
2) Has the relationship between underreporting of L&LAE and the resulting overreporting
of income been thoroughly discussed? If not, why not?
Some of the research on industry loss and loss adjustment expense reserves
A review of previous research and articles on this subject indicates the focus of researchers
is either an industrywide analysis of the relative adequacy of L&LAE or the relationship of
inadequate L&LAE reserves to the failure of carriers. (See related textbox, “Research Sources,”
for exact citations.)
In Charles Bryan’s May 2014 review of Stan Khury’s paper “Testing the Reasonableness of
Loss Reserves: Reserve Ratios,” Bryan reminded us that the actuary’s increased role in setting
and evaluating loss reserves came about during the late 1980s after changes to the required
components of actuarial opinions were instituted by the National Association of Insurance
Commissioners (NAIC). The NAIC had revised these requirements following a report issued by
the U.S. House of Representatives, which highlighted deficiencies in the evaluation of loss

P/C Loss and Loss Adjustment Expense Reserve Studies: Demotech Analysis
2
reserves regarding the issue of solvency. Bryan noted an A.M. Best report that stated “Deficient
loss reserves (intrinsically linked with inadequate product pricing) and rapid growth were the
most dominant causes of insolvencies.” (Bryan)
In recent annual reports (2010, 2011, 2012 and 2013) entitled “U.S. P/C Industry Statutory
Reserve Study”, Aon Benfield studied industrywide, rather than individual company, reserves by
looking at an aggregation of NAIC Annual Statement data. In its June 3, 2014 report, Aon
Benfield reported the overall industry redundancy of $6.5 billion is equivalent to 1.1 percent of
booked reserves. Further, they noted that the industrywide redundancy in personal lines of
$9.3 billion was less than the $10.1 billion reported at year-end 2012. (Aon Benfield Analytics)
In its “GC Briefing, Industry Reserve Update—Which Way is the Cycle Turning?” issued in
April 2014, Guy Carpenter focused on industrywide trends when it noted “Seventy percent of
the improvement for accident year 2012 can be attributed to two lines: homeowners and
private passenger auto.” (Guy Carpenter & Company)
In the May 31, 2012, issue of PropertyCasualty360, Meyer Shields, an analyst at Stifel
Nicolaus, suggested that the (then) industry reserves of $573.7 billion were but $5 billion [less
than 1 percent] above the minimum adequate level. (Ruquet)
In their report “What May Cause Insurance Companies to Fail—and How This Influences Our
Criteria,” Brennan, Clark, and Vine discovered seven key factors that led to company failure.
Two major factors were underpricing and underreserving.
They cited one example of California-based workers compensation insurance companies
becoming insolvent following rate deregulation: “The underpricing and inadequate reserving
that ensued came to light late in the decade and resulted in several companies that were
heavily concentrated in the market becoming insolvent.” (Brennan)
They then went on to discuss global P/C companies that failed due to industry-wide
underpricing and the resulting inadequate reserves.
Darrell Leadbetter and Suela Dibra referenced a study by the Financial Services Authority
(FSA) in the United Kingdom in “Why Insurers Fail: The Dynamics of Property and Casualty
Insurance Insolvency in Canada.” This FSA study analyzed failed insurers across life and non-life
sectors within 15 countries of the European Union and concluded that over 60 percent of the

P/C Loss and Loss Adjustment Expense Reserve Studies: Demotech Analysis
3
failed insurers “showed poor underwriting or reserving as a contributing factor” to their failure.
(Leadbetter)
Further, in their investigation of the 35 P/C insurance companies who had become insolvent
in the Canadian insurance market between 1960 and 2005, Leadbetter and Dibra determined
that “inadequate pricing and deficient loss reserves are the leading cause of insurer
insolvency.” (Leadbetter)
Our Take: Concentration of L&LAE Reserves Renders Industry Analysis Interesting But Not Meaningful
Our analysis of the L&LAE reported and recorded by property and casualty (P/C) insurers
focused on the 2,1371 insurers reporting financial information to the NAIC that reported that
their loss and loss adjustment expenses reserves at year-end 2013 were greater than zero. We
excluded 559 carriers with reported L&LAE of zero or less.
Our analysis considered L&LAE reserves on a net basis, by carrier. We did not review P/C
L&LAE reserves by group, holding company, family of companies or other basis. Projections of
L&LAE reserves, actuarial or otherwise, were outside the scope of the study. Had we reviewed
loss and loss adjustment expense reserves on a net basis by group or family of insurers, the
concentration of L&LAE reserves might have been interpreted differently. We choose a carrier
level basis of review because we believe that each carrier exists within a group or family of
carriers to play a unique role.2
Of the 2,137 active P/C insurers comprising the P/C industry, seven insurers recorded and
reported 20 percent of industry L&LAE reserves. That is, seven companies reported $119.2
billion of the $596.7 billion that was described as “industry loss and loss adjustment expense
reserves.”
1 Although 2,696 companies reported financial results at year-end 2013, 559 had net Loss and LAE reserves of zero or less. As
such, the percentage of companies in this discussion is conservatively stated, i.e., 1 out of 2,137 is greater than 1 out of 2,696, with 2,137 equal to the 2,969 reporting carriers minus 559 carriers with L&LAE of zero or less.
2 Although ratings assigned to groups of insurers may reflect overall group L&LAE inadequacy or redundancy as opposed to
individual carrier positions, the carrier information reported to regulators and interested third parties was intentionally promulgated by management. We assume there was a reason for doing so.
P/C Loss and Loss Adjustment Expense Reserve Studies: Demotech Analysis
4
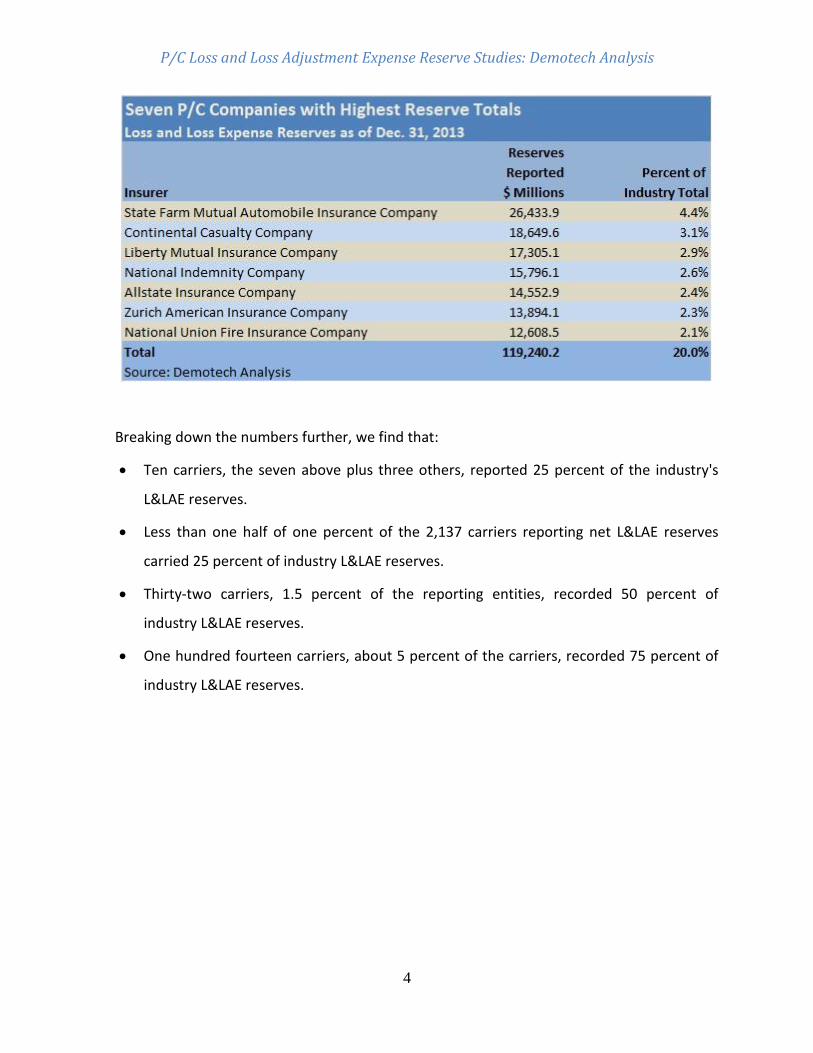
Breaking down the numbers further, we find that:
Ten carriers, the seven above plus three others, reported 25 percent of the industry's
L&LAE reserves.
Less than one half of one percent of the 2,137 carriers reporting net L&LAE reserves
carried 25 percent of industry L&LAE reserves.
Thirty-two carriers, 1.5 percent of the reporting entities, recorded 50 percent of
industry L&LAE reserves.
One hundred fourteen carriers, about 5 percent of the carriers, recorded 75 percent of
industry L&LAE reserves.

P/C Loss and Loss Adjustment Expense Reserve Studies: Demotech Analysis
5
Company by Company details are on the following page.
0%
25%
50%
75%
100%
10 32 114 149 204 297 493 2,137
Pe
rce
nta
ge o
f P
/C In
du
stry
L&
LAE
Re
serv
es
Number of Companies
Number of Companies Accounting for Percentage of 2013 P/C Industry
Loss and LAE Reserves

P/C Loss and Loss Adjustment Expense Reserve Studies: Demotech Analysis
6
This concentration indicates to Demotech that a relatively small percentage of P/C carriers
contributed a significant component of “industry loss and loss adjustment expense reserves.”
As shown in the table and pie chart below, the L&LAE reserves reported by the largest single
carrier exceeded the aggregate L&LAE reserves reported by the 1,605 smallest carriers in terms
of L&LAE reserves. These 1,605 carriers comprised 75 percent of the industry by count.
We think this bears repeating: 1,605 of the 2,137 insurers reviewed held aggregate loss and
loss adjustment expense reserves that were less than the dollar amount reported by State Farm
Mutual Automobile Insurance Company.

P/C Loss and Loss Adjustment Expense Reserve Studies: Demotech Analysis
7
In an industry that has this distribution of L&LAE reserves does a high level analysis of
“industry L&LAE reserves” create value? Or is the term “industry loss and loss adjustment
expense reserves” a misnomer due to the concentration of L&LAE reserves in a relatively small
number of insurers?
Demotech believes that the concentration of loss and loss adjustment expense reserves in a
small number of companies reduces analyses and studies of industry L&LAE reserves to a level
that is interesting but can hardly be considered informative or indicative of the situation of any
specific individual carrier.
The Impact of Adverse L&LAE Reserve Development on Reported Income
Loss and LAE reserving and reported income are but two components of a thorough, all-
encompassing rating agency analysis of an insurer. Today, more than ever before, there

P/C Loss and Loss Adjustment Expense Reserve Studies: Demotech Analysis
8
appears to be a move toward qualitative areas of analysis, such as general financial and
operational management with a focus on corporate governance and Enterprise Risk
Management (ERM). The adequacy of capital, business profile, current or historical financial
metrics are viewed as the output of a corporate governance process as much as they are the
reported dollar amount in a statutory financial statement.
If this is the direction in which regulators, rating agencies, reinsurers, Wall Street analysts
and other third parties are heading, the discussion of reported financial results is as much
about how the results were achieved or calculated, i.e., “process” as it is about “what was
recorded in the reported financial statements.” In this environment, governance, managerial
processes and execution of the business model are now as important, perhaps even more
important, than reported operating results.
This said, the influence of inadequate L&LAE reserves on the integrity of an insurer’s balance
sheet has been discussed in numerous articles and research papers with a focus on the
correlation between inadequate L&LAE reserves and the failure rate of insurers. However, it is
Demotech’s observation that the impact of inadequate L&LAE reserves, overreporting of pretax
profit or underreporting of a pretax loss, has not received the explicit discussion that it deserves
as regards solvent carriers.
Every dollar of adverse one-year L&LAE reserve development reported in calendar year 2013
was a dollar of overstatement in pretax operating income in calendar year 2012. Similarly, a
carrier that reported favorable L&LAE reserve development in the year subsequent had
understated its pretax operating income in the prior calendar year. The integrity of earnings is
higher when a carrier overestimates L&LAE and reports favorable reserve development.
To initiate a preliminary discussion, Demotech reviewed the statutory financial statements
of thousands of insurers to identify those that had:
1. Received an unqualified statement of actuarial opinion as regards its year-end L&LAE
reserves for five consecutive years.
2. Received an unqualified year-end audit from its auditors for five consecutive years.
3. Self-reported at least five consecutive years of adverse L&LAE reserve development.
P/C Loss and Loss Adjustment Expense Reserve Studies: Demotech Analysis
9
Our thought process is this: If reported L&LAE reserves are adequate, the integrity of
earnings is high. If adequately reserved carriers are assigned ratings at an “A” level or above,
then reported operating results, in and of themselves, may be sufficient to address the
requirements of rating services.
Conversely, if the reported results associated with L&LAE reserves do not appear to
favorably impact the ratings assigned by rating services, then it seems reasonable to believe
that operational, managerial or governance related procedures and processes are more
important, or more heavily weighted, than one of the most fundamental objectives of an
insurance enterprise—estimating its L&LAE reserves adequately.
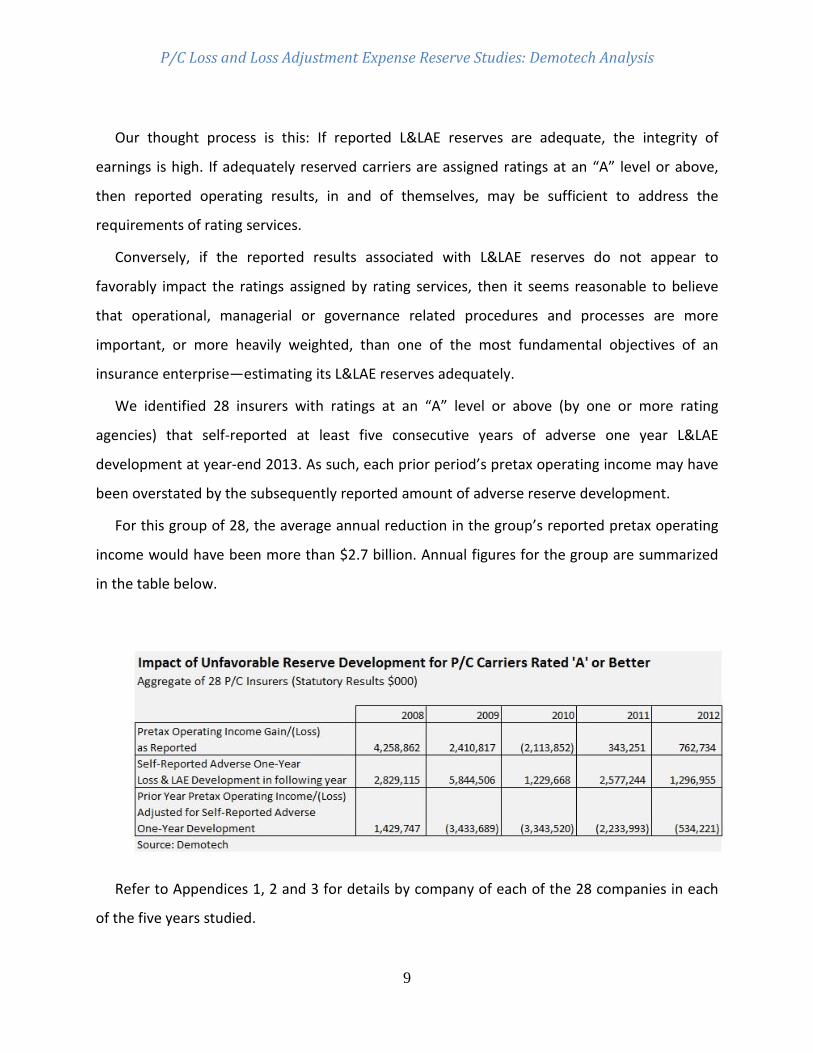
We identified 28 insurers with ratings at an “A” level or above (by one or more rating
agencies) that self-reported at least five consecutive years of adverse one year L&LAE
development at year-end 2013. As such, each prior period’s pretax operating income may have
been overstated by the subsequently reported amount of adverse reserve development.
For this group of 28, the average annual reduction in the group’s reported pretax operating
income would have been more than $2.7 billion. Annual figures for the group are summarized
in the table below.
Refer to Appendices 1, 2 and 3 for details by company of each of the 28 companies in each
of the five years studied.
P/C Loss and Loss Adjustment Expense Reserve Studies: Demotech Analysis
10
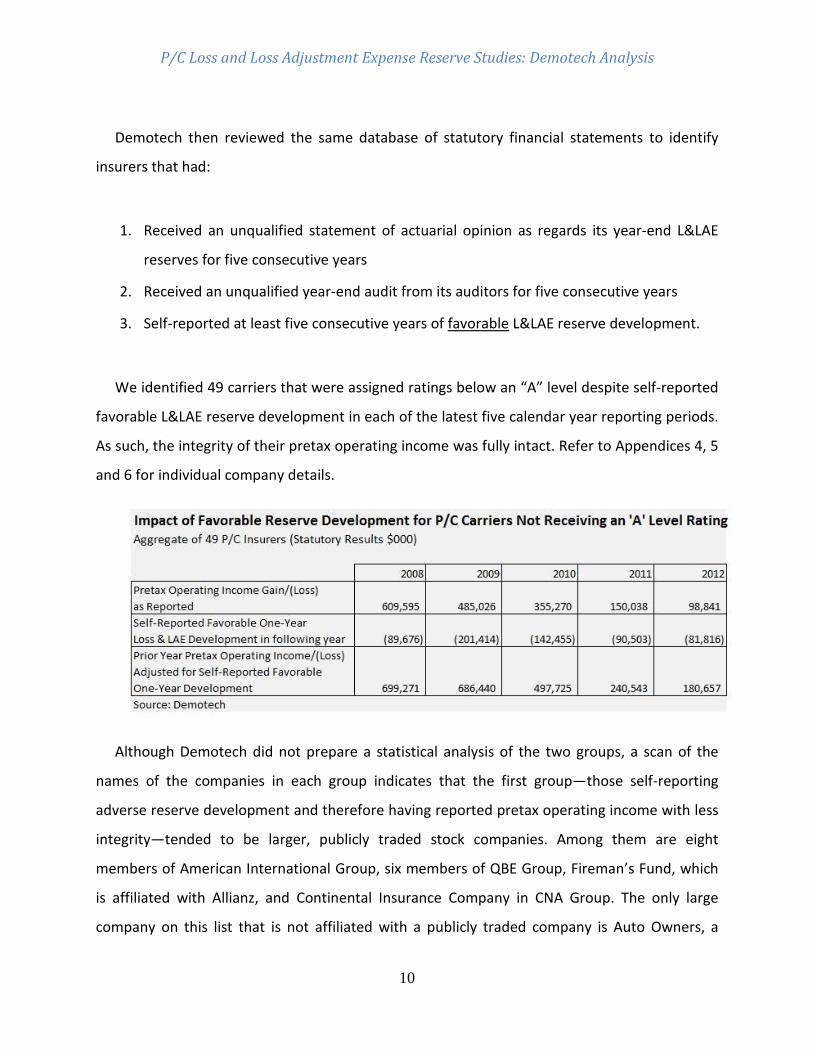
Demotech then reviewed the same database of statutory financial statements to identify
insurers that had:
1. Received an unqualified statement of actuarial opinion as regards its year-end L&LAE
reserves for five consecutive years
2. Received an unqualified year-end audit from its auditors for five consecutive years
3. Self-reported at least five consecutive years of favorable L&LAE reserve development.
We identified 49 carriers that were assigned ratings below an “A” level despite self-reported
favorable L&LAE reserve development in each of the latest five calendar year reporting periods.
As such, the integrity of their pretax operating income was fully intact. Refer to Appendices 4, 5
and 6 for individual company details.
Although Demotech did not prepare a statistical analysis of the two groups, a scan of the
names of the companies in each group indicates that the first group—those self-reporting
adverse reserve development and therefore having reported pretax operating income with less
integrity—tended to be larger, publicly traded stock companies. Among them are eight
members of American International Group, six members of QBE Group, Fireman’s Fund, which
is affiliated with Allianz, and Continental Insurance Company in CNA Group. The only large
company on this list that is not affiliated with a publicly traded company is Auto Owners, a

P/C Loss and Loss Adjustment Expense Reserve Studies: Demotech Analysis
11
mutual.
In contrast, those that reported favorable L&LAE reserve development over the same five
calendar years and thereby demonstrated greater integrity in their initial report of pretax
operating income than their “below-A” ratings might suggest, tended to be smaller, mutual
companies or risk retention groups.
That’s not to say that big companies are in trouble or small insurers are all overestimating
reserves. For the “A”-rated companies that underreported reserves, the dollar amount of the
adverse L&LAE reserve development, whether measured as a percentage of reported L&LAE,
admitted assets, earned premium or surplus, did not appear to be material for the larger,
publicly traded carriers. It impacted the integrity of reported income but in no way could be
considered a threat to the solvency of the reporting entity.
In this type of environment, it seems reasonable to assume that rating agencies, regulators
and Wall Street analysts have focused on governance, operational management and qualitative
considerations including the implementation and execution of enterprise risk management
procedures, to differentiate the stronger carriers.
However, Demotech is unwilling to concede bigger is always better. It appears to us that as
the conversation of a regulatory focus or a rating agency review turns to capital adequacy,
business model, execution, financial and managerial operations, including ERM, as opposed to
balance sheet fundamentals, L&LAE reserve adequacy or integrity of reported earnings, some
insurers will be downgraded due solely to the change in the rating agency review processes.
This transition may disproportionally impact smaller, privately held or mutual insurers, which
have consistently practiced conservative loss reserving but may not have the resources or the
interest to garner the highest ERM and governance scores from rating agencies.
We are also concerned that users of ratings may believe that the ratings assigned by rating
agencies are more focused on L&LAE reserve adequacy and other balance sheet fundamentals
than may be the case. If, or maybe as, downgrades may be based on subjective qualitative
criteria, users of ratings should be made aware of this.

P/C Loss and Loss Adjustment Expense Reserve Studies: Demotech Analysis
12
Putting it All Together
We began our research with two questions:
1) Is the term “industry loss and loss adjustment expense reserves” a meaningful one?
2) Why hasn’t the relationship between underreporting of L&LAE and the concomitant
overreporting of income been thoroughly discussed?
Our review of 2,137 companies found that the term “industry loss and loss adjustment
expense reserves” is interesting yet meaningless because less than 10 percent of the insurers
comprising the industry account for 85 percent of the industry’s L&LAE reserves. Given this
level of concentration, “industry loss and loss adjustment expense reserves” would appear to
be the L&LAE reserves of a small number of larger carriers.
As to underreporting of L&LAE reserves and the overreporting of pretax operating income,
we believe three interesting observations emerged from our preliminary research:
1) Industry research and studies have focused on underreserving and its impact on carrier
insolvency. Our analysis of this research shows that explicit acknowledgements of
underreserving as an overstatement of income were negligible. This phenomenon is not
restricted to insolvent carriers.
2) Chronic underreserving at a level that overstates reported pretax operating income
does not appear to adversely impact the ability of larger, publicly traded stock insurers
to be assigned “A” level ratings or above. Concurrently, a conscious effort to report
adequate L&LAE reserves appeared insufficient to enhance the ratings assigned to
smaller, privately held carriers, smaller mutual insurers or risk retention groups.
3) Rating agency review and analysis techniques and procedures appear to heavily
consider criteria other than L&LAE reserve adequacy, such as capital adequacy, business
model, financial and operational management and corporate governance.

P/C Loss and Loss Adjustment Expense Reserve Studies: Demotech Analysis
13
Initiating a Dialogue
Demotech undertook this research to initiate a dialogue between insurers, regulators and
other informed third parties about the utility of L&LAE reserves on an industry basis and the
relationship between the relative level of L&LAE reserves carried by an insurer and the
concomitant impact on its reported pretax income.
Some of the questions that we suggest are:
Should L&LAE reserve adequacy and its concomitant impact on the integrity of earnings
be more heavily weighted in the rating assignment process?
Are the observations, summarized in Appendices 1 through 6, sufficient to conclude that
L&LAE reserve development is not the singularly critical criterion in the assignment of
ratings?
Were you aware that larger, well-known, respected carriers could sustain high ratings
despite self-reporting of L&LAE reserve inadequacy?
Were you aware that carriers with a long history of L&LAE reserve adequacy could be
assigned ratings below an “A” level?
Your thoughts, comments, perspectives and opinions are both welcomed and encouraged.
Disclaimers
This study is not intended to be, and should not be construed to be, a statement of actuarial
opinion regarding loss and loss adjustment expense reserves or any other type of statement of
actuarial opinion.
This study was compiled from sources that Demotech, Inc. believes to be reliable. However,
Demotech, Inc. makes no representations or warranties as to the accuracy, reliability or
completeness of such information, and the information should not be relied upon in making
business, investment or similar decisions. Demotech did not independently verify the accuracy
or reliability of the information.
This analysis was based upon financial statements promulgated using statutory insurance
P/C Loss and Loss Adjustment Expense Reserve Studies: Demotech Analysis
14
accounting principles as prescribed or permitted by the National Association of Insurance
Commissioners. An analysis of financial statement based upon generally accepted accounting
principles may have other implications.
The statutory insurance accounting information underlying our analysis was created,
compiled and self-reported by the carriers.
As part of this analysis, Demotech did not review or seek to draw conclusions about the sizes
or ownership structures of:
Companies with ratings of “A” or above that self-reported favorable L&LAE reserve
development in each of the latest five calendar year reporting periods
Companies with ratings below “A” that self-reported adverse reserve development in
each of the latest five calendar year reporting periods.
ABOUT THE AUTHOR
Joseph L. Petrelli is the President of Demotech, Inc.
Demotech is a financial analysis firm specializing in
evaluating the financial stability of regional and specialty
insurers. Since 1985, Demotech has served the insurance
industry by assigning accurate, reliable and proven
Financial Stability Ratings® (FSRs) for property/casualty
insurers and title underwriters. FSRs are a leading
indicator of financial stability, providing an objective
baseline of the future solvency of an insurer. Visit
www.demotech.com for more information.

P/C Loss and Loss Adjustment Expense Reserve Studies: Demotech Analysis
15
Research Sources Aon Benfield Analytics. "U.S. P/C Industry Statutory Reserve Study: Based on Schedule P data as of December 31, 2011." Aon Benfield Analytics, June 2012. PowerPoint. —. "U.S. P/C Industry Statutory Reserve Study: Based on Schedule P data as of December 31, 2012." Aon Benfield Analytics, 13 June 2013. PowerPoint. —. "U.S. P/C Industry Statutory Reserve Study: Based on Schedule P data as of December 31, 2013." Aon Benfield Analytics, 3 June 2014. PowerPoint. —. "U.S. P/C Industry Statutory Reserve Study: Based on Schedule P data as of December 31, 2010." Aon Benfield, 15 June 2011. PowerPoint. Brennan, Michelle, Rodney A. Clark & Michael J. Vine. "What May Cause Insurance Companies to Fail— And How This Influences Our Criteria." 13 June 2013. standardandpoors.com. Web. 9 May 2014. Bryan, Charles A. "A Review of Stan Khury's 'Testing the Reasonableness of Loss Reserves: Reserve Ratios.'" n.d. casact.org. Web. 15 May 2014. Guy Carpenter & Company. "GC Briefing, An Update from Global Strategic Advisory: Industry Reserve Update — Which Way is the Cycle Turning?" April 2014. guycarp.com. Web. 10 July 2014. Leadbetter, Darrell & Suela Dibra. "Why Insurers Fail: The Dynamics of Property and Casualty Insurance Insolvency in Canada." The Geneva Papers (2008): 464-488. Document. Ruquet, Mark E. "Analyst: Industry 'Flirting with Inadequacy' on Reserves." 31 May 2012. propertycasualty360.com. Document. 31 May 2014.

P/C Loss & Loss Adjustment Expense Studies: Demotech Analysis
Note: All figures in thousands Appendix 1
Companies with Five Consecutive Years of Self-Reported Adverse One Year Development Securing Ratings at an A Level or Above Appendix 1
Statutory Pre-Tax Operating Income Gain/(Loss) as Reported
Company Group 2008 2009 2010 2011 2012
AIG Property Casualty Company American Intnl Group 164,617 (31,339) (107,991) 42,367 16,655
American Home Assurance Company American Intnl Group 1,267,677 34,428 (1,213,377) 223,480 198,003
Auto-Owners Insurance Company Auto Owners Group 295,288 281,383 208,253 (118,736) 290,836
Cherokee Insurance Company 32,819 9,399 8,430 7,444 11,168
Coast National Insurance Company Farmers Ins Group 20,422 15,473 13,766 13,442 12,058
Commerce and Industry Insurance Company American Intnl Group 219,926 174,790 (325,149) 87,260 81,962
Continental Insurance Company CNA Ins Group 111,328 47,826 (368,915) 40,793 30,470
Daily Underwriters of America 5,383 3,787 388 2,332 29
Everest National Insurance Company Everest Reins Holdings Group 3,595 (3,182) (5,939) (9,482) (140)
Everest Reinsurance Company Everest Reins Holdings Group 292,077 485,021 202,126 (294,436) 382,999
Fireman's Fund Insurance Company Allianz Ins Group 198,751 897,273 188,664 (243,935) (838,436)
General Casualty Company of Wisconsin QBE Ins Group 221,702 93,617 28,660 (36,449) (8,257)
General Casualty Insurance Company QBE Ins Group 18,011 1,275 893 (4,660) (1,404)
Generali - U.S. Branch (1,773) (1,741) (1,354) 474 66
Hoosier Insurance Company QBE Ins Group 10,133 640 512 (4,173) (1,354)
Insurance Company of the State of Pennsylvania American Intnl Group 206,630 (23,872) (56,710) 29,144 (5,266)
National Farmers Union Property and Casualty Company QBE Ins Group 12,124 3,322 1,600 (10,931) (3,065)
National Union Fire Insurance Company of Pittsburgh, PA. American Intnl Group 1,275,750 111,797 (697,595) 430,583 1,027,171
New Hampshire Insurance Company American Intnl Group 111,394 103,426 (117,148) 29,929 (7,848)
Nuclear Electric Insurance Limited (323,704) 80,057 11,170 100,497 (351,080)
QBE Insurance Corporation QBE Ins Group (12,905) (55,076) (44,929) (45,196) (30,399)
QBE Reinsurance Corporation QBE Ins Group (64,112) 84,255 29,079 10,823 (10,804)
QBE Specialty Insurance Company QBE Ins Group (2,129) 3,963 17,154 28,648 (12,151)
Regent Insurance Company QBE Ins Group 23,063 1,871 1,466 (6,360) (1,911)
Safety National Casualty Corporation Millea Holdings Inc Group 75,622 81,228 106,930 101,893 (10,033)
Southern Guaranty Insurance Company QBE Ins Group 25,313 2,010 1,261 (6,064) (1,690)
Unigard Indemnity Company QBE Ins Group 7,803 640 218 (3,468) (1,170)
Unigard Insurance Company QBE Ins Group 64,058 8,545 4,687 (21,966) (3,676)
Total for Companies Above 4,258,862 2,410,817 (2,113,852) 343,251 762,734
Statutory Pre-Tax Operating Income Gain/(Loss) as Reported

P/C Loss and Loss Adjustment Expense Reserve Studies: Demotech Analysis
Note: All figures in thousands Appendix 2
Companies with Five Consecutive Years of Self-Reported Adverse One Year Development Securing Ratings at an A Level or Above Appendix 2
Statutory Self-Reported Adverse One Year Loss & LAE Development
Company Group 2009 2010 2011 2012 2013
AIG Property Casualty Company American Intnl Group 114,335 261,368 31,477 47,650 32,302
American Home Assurance Company American Intnl Group 906,629 1,904,075 216,863 340,959 231,983
Auto-Owners Insurance Company Auto Owners Group 62,573 21,347 21,974 51,408 75,531
Cherokee Insurance Company 4,833 2,124 1,400 6,436 5,298
Coast National Insurance Company Farmers Ins Group 158 780 263 26 168
Commerce and Industry Insurance Company American Intnl Group 251,540 575,008 69,249 104,831 71,065
Continental Insurance Company CNA Ins Group 6,971 32,044 100,869 24,333 179,434
Daily Underwriters of America 639 1,037 1,041 2,609 1,823
Everest National Insurance Company Everest Reins Holdings Group 4,393 3,792 11,354 7,109 17,658
Everest Reinsurance Company Everest Reins Holdings Group 84,617 77,874 55,604 61,832 91,398
Fireman's Fund Insurance Company Allianz Ins Group 146,452 209,411 248,067 538,436 5,104
General Casualty Company of Wisconsin QBE Ins Group 7,189 337 8,939 21,730 19,866
General Casualty Insurance Company QBE Ins Group 1,232 81 1,109 2,943 2,337
Generali - U.S. Branch 135 578 1,209 2,417 3,798
Hoosier Insurance Company QBE Ins Group 822 49 947 2,490 1,948
Insurance Company of the State of Pennsylvania American Intnl Group 114,335 261,368 31,477 47,650 32,302
National Farmers Union Property and Casualty Company QBE Ins Group 2,465 160 2,425 6,111 5,064
National Union Fire Insurance Company of Pittsburgh, PA. American Intnl Group 868,958 1,986,392 239,225 362,145 245,493
New Hampshire Insurance Company American Intnl Group 114,335 261,368 31,477 47,650 32,302
Nuclear Electric Insurance Limited 73,076 157,974 34,796 521,121 29,122
QBE Insurance Corporation QBE Ins Group 19,861 20,973 19,088 53,645 48,107
QBE Reinsurance Corporation QBE Ins Group 11,342 6,186 7,926 23,540 15,581
QBE Specialty Insurance Company QBE Ins Group 3,951 1,651 9,755 21,956 18,892
Regent Insurance Company QBE Ins Group 1,849 110 1,501 4,074 3,116
Safety National Casualty Corporation Millea Holdings Inc Group 19,442 57,964 74,288 256,940 111,293
Southern Guaranty Insurance Company QBE Ins Group 1,438 111 1,455 3,848 3,116
Unigard Indemnity Company QBE Ins Group 616 37 716 1,811 1,558
Unigard Insurance Company QBE Ins Group 4,929 307 5,174 11,544 11,296
Total for Companies Above 2,829,115 5,844,506 1,229,668 2,577,244 1,296,955
Statutory Self-Reported Adverse One Year Loss & LAE Development

P/C Loss and Loss Adjustment Expense Reserve Studies: Demotech Analysis
Note: All figures in thousands Appendix 3
Companies with Five Consecutive Years of Self-Reported Adverse One Year Development Securing Ratings at an A Level or Above Appendix 3
Statutory Prior Year Pre-Tax Operating Income Gain/(Loss) Adjusted For Self-Reported Adverse One Year Development
Company Group 2008 2009 2010 2011 2012
AIG Property Casualty Company American Intnl Group 50,282 (292,707) (139,468) (5,283) (15,647)
American Home Assurance Company American Intnl Group 361,048 (1,869,647) (1,430,240) (117,479) (33,980)
Auto-Owners Insurance Company Auto Owners Group 232,715 260,036 186,279 (170,144) 215,305
Cherokee Insurance Company 27,986 7,275 7,030 1,008 5,870
Coast National Insurance Company Farmers Ins Group 20,264 14,693 13,503 13,416 11,890
Commerce and Industry Insurance Company American Intnl Group (31,614) (400,218) (394,398) (17,571) 10,897
Continental Insurance Company CNA Ins Group 104,357 15,782 (469,784) 16,460 (148,964)
Daily Underwriters of America 4,744 2,750 (653) (277) (1,794)
Everest National Insurance Company Everest Reins Holdings Group (798) (6,974) (17,293) (16,591) (17,798)
Everest Reinsurance Company Everest Reins Holdings Group 207,460 407,147 146,522 (356,268) 291,601
Fireman's Fund Insurance Company Allianz Ins Group 52,299 687,862 (59,403) (782,371) (843,540)
General Casualty Company of Wisconsin QBE Ins Group 214,513 93,280 19,721 (58,179) (28,123)
General Casualty Insurance Company QBE Ins Group 16,779 1,194 (216) (7,603) (3,741)
Generali - U.S. Branch (1,908) (2,319) (2,563) (1,943) (3,732)
Hoosier Insurance Company QBE Ins Group 9,311 591 (435) (6,663) (3,302)
Insurance Company of the State of Pennsylvania American Intnl Group 92,295 (285,240) (88,187) (18,506) (37,568)
National Farmers Union Property and Casualty Company QBE Ins Group 9,659 3,162 (825) (17,042) (8,129)
National Union Fire Insurance Company of Pittsburgh, PA. American Intnl Group 406,792 (1,874,595) (936,820) 68,438 781,678
New Hampshire Insurance Company American Intnl Group (2,941) (157,942) (148,625) (17,721) (40,150)
Nuclear Electric Insurance Limited (396,780) (77,917) (23,626) (420,624) (380,202)
QBE Insurance Corporation QBE Ins Group (32,766) (76,049) (64,017) (98,841) (78,506)
QBE Reinsurance Corporation QBE Ins Group (75,454) 78,069 21,153 (12,717) (26,385)
QBE Specialty Insurance Company QBE Ins Group (6,080) 2,312 7,399 6,692 (31,043)
Regent Insurance Company QBE Ins Group 21,214 1,761 (35) (10,434) (5,027)
Safety National Casualty Corporation Millea Holdings Inc Group 56,180 23,264 32,642 (155,047) (121,326)
Southern Guaranty Insurance Company QBE Ins Group 23,875 1,899 (194) (9,912) (4,806)
Unigard Indemnity Company QBE Ins Group 7,187 603 (498) (5,279) (2,728)
Unigard Insurance Company QBE Ins Group 59,129 8,238 (487) (33,510) (14,972)
Total for Companies Above 1,429,747 (3,433,689) (3,343,520) (2,233,993) (534,221)
Statutory Prior Year Pre-Tax Operating Income Gain/(Loss)
Adjusted For Self-Reported Adverse One Year Development

P/C Loss and Loss Adjustment Expense Reserve Studies: Demotech Analysis
Note: All figures in thousands Appendix 4
Companies with Five Consecutive Years of Self-Reported Favorable One Year Development Assigned Ratings Below an A level Appendix 4
Statutory Pre-Tax Operating Income Gain/(Loss) as Reported
Company Group 2008 2009 2010 2011 2012
AgSecurity Insurance Company Oklahoma Farm Bureau Group (834) (1,398) 991 925 33
American Healthcare Indemnity Company Doctors Co Group 4,718 6,994 27,748 23,328 1,355
Anchor General Insurance Company Anchor Ins Holdings Group 2,880 (260) (1,171) 604 (901)
Armed Forces Insurance Exchange 2,418 3,933 (400) (12,339) (6,038)
Bondex Insurance Company 202 333 176 (26) 152
Buckeye State Mutual Insurance Company Buckeye Ins Group (6,328) 321 (1,643) (1,925) (2,246)
Bunker Hill Insurance Company Plymouth Rock Ins Group 2,516 2,951 4,414 (13,343) 2,754
BusinessFirst Insurance Company RetailFirst Group 2,344 1,999 (2,039) 268 39
Cameron Mutual Insurance Company Cameron Mut Group (13,414) (5,589) (610) (6,429) 3,115
Celina Mutual Insurance Company Celina Group 1,839 687 (360) (2,035) 211
Century Casualty Company 307 167 (383) 289 267
Club Insurance Company 1,313 1,106 890 662 586
Colorado Farm Bureau Mutual Insurance Company 2,536 (5,414) (118) (703) (3,327)
Community Hospital Alternative for Risk Transfer (A Reciprocal RRG) 5,354 6,107 6,384 8,164 10,337
Conifer Insurance Company Conifer Holdings Group 611 362 87 (3,107) (1,415)
Eastern Dentists Insurance Company RRG 1,705 1,580 3,346 4,362 1,994
Ever-Greene Mutual Insurance Company Everett Mut Group 385 192 343 324 319
Forestry Mutual Insurance Company 2,265 1,796 693 545 (2,301)
Frank Winston Crum Insurance Company (1,542) 1,208 413 (1,892) 586
Galen Insurance Company 733 634 530 1,435 (153)
Great Plains Casualty, Inc. 519 808 1,218 1,140 1,398
Housing and Redevelopment Insurance Exchange 1,114 732 1,601 (128) (811)
Illinois Casualty Company (A Mutual Insurance Company) (230) 2,755 (181) (1,906) 12
Juniata Mutual Insurance Company 23 598 283 (381) 292
Lawyers Mutual Insurance Company of Kentucky 578 195 200 54 152
Members Insurance Company Carolina Motor Club Group (325) (451) (260) 87 (253)
Miami Mutual Insurance Company Celina Group 955 619 (382) (1,789) 3
Michigan Professional Insurance Exchange 4,166 7,308 5,315 7,213 9,740
Midrox Insurance Company 203 (189) 100 (50) 408
Motors Insurance Corporation GMAC Ins Holding Group 535,557 393,377 255,492 118,042 30,639
Mt. Morris Mutual Insurance Company 38 894 (954) 491 751
MutualAid eXchange (3,885) (2,142) (413) (835) (687)
National Mutual Insurance Company Celina Group 1,815 672 (357) (1,947) 250
National Security Fire & Casualty Company National Security Group (7,512) 5,235 5,721 (4,047) (726)
National Unity Insurance Company 3,605 5,299 3,183 2,711 3,066
Northwest Dentists Insurance Company Oregon Dental Group 854 (193) (606) 1,022 297
Northwest G.F. Mutual Insurance Company (579) (555) (1,614) (1,098) 502
Ocean Harbor Casualty Insurance Company Ocean Harbor Group 3,122 1,808 1,272 (2,624) 6,117
Physicians' Insurance Program Exchange (510) 1,907 66 1,216 1,178
Safeway Property Insurance Company Safeway Ins Group 6,872 3,620 3,031 2,056 3,085
Standard Mutual Insurance Company (886) (112) (1,575) 582 (3,194)
Waco Fire & Casualty Insurance Company 1,578 94 1,210 (71) (203)
Wayne Cooperative Insurance Company 403 545 1,871 415 650
Wayne Mutual Insurance Company Wayne & Washington Mut Group (983) 325 (1,075) 2,430 2,751
Wisconsin County Mutual Insurance Corporation Wisconsin Cnty Mut Group 3,753 6,252 3,220 622 1,492
Wisconsin Reinsurance Corporation Wisconsin Re Group (3,737) 1,128 (515) (6,092) 2,516
Wolverine Mutual Insurance Company (1,560) (243) (675) (1,570) 698
Yosemite Insurance Company Fortress Group 51,772 33,766 36,042 27,815 25,439
Zale Indemnity Company Zale Corp Group 2,865 3,264 4,759 7,576 7,911
Total for Companies Above 609,595 485,026 355,270 150,038 98,841
Statutory Pre-Tax Operating Income Gain/(Loss) as Reported

P/C Loss and Loss Adjustment Expense Reserve Studies: Demotech Analysis
Note: All figures in thousands Appendix 5
Companies with Five Consecutive Years of Self-Reported Favorable One Year Development Assigned Ratings Below an A level Appendix 5
Statutory Self-Reported Favorable One Year Loss & LAE Development
Company Group 2009 2010 2011 2012 2013
AgSecurity Insurance Company Oklahoma Farm Bureau Group (642) (1,482) (2,723) (3,308) (2,052)
American Healthcare Indemnity Company Doctors Co Group (6,880) (23,627) (28,074) (311) (1,592)
Anchor General Insurance Company Anchor Ins Holdings Group (2,270) (181) (1,112) (476) (452)
Armed Forces Insurance Exchange (5,181) (1,239) (2,671) (4,150) (3,955)
Bondex Insurance Company (16) (57) (147) (214) (91)
Buckeye State Mutual Insurance Company Buckeye Ins Group (2,506) (3,151) (1,858) (3,232) (1,607)
Bunker Hill Insurance Company Plymouth Rock Ins Group (846) (798) (1,225) (1,286) (1,275)
BusinessFirst Insurance Company RetailFirst Group (2,297) (814) (639) (570) (25)
Cameron Mutual Insurance Company Cameron Mut Group (7) (2,408) (1,461) (1,962) (275)
Celina Mutual Insurance Company Celina Group (1,132) (680) (1,045) (834) (626)
Century Casualty Company (4) (131) (750) (353) (502)
Club Insurance Company (54) (209) (208) (88) (68)
Colorado Farm Bureau Mutual Insurance Company (3,601) (4,816) (5,036) (3,536) (3,820)
Community Hospital Alternative for Risk Transfer (A Reciprocal RRG) (1,901) (5,330) (8,363) (8,560) (6,498)
Conifer Insurance Company Conifer Holdings Group (38) (192) (138) (904) (1,309)
Eastern Dentists Insurance Company RRG (1,838) (3,388) (3,877) (3,071) (2,989)
Ever-Greene Mutual Insurance Company Everett Mut Group (34) (23) (22) (13) (16)
Forestry Mutual Insurance Company (3,854) (2,863) (2,187) (1,011) (1,666)
Frank Winston Crum Insurance Company (2,537) (1,007) (1,300) (465) (626)
Galen Insurance Company (371) (631) (1,054) (1,025) (167)
Great Plains Casualty, Inc. (92) (196) (155) (183) (674)
Housing and Redevelopment Insurance Exchange (4,002) (3,287) (3,295) (3,043) (2,721)
Illinois Casualty Company (A Mutual Insurance Company) (3,270) (2,954) (2,508) (2,437) (2,567)
Juniata Mutual Insurance Company (262) (112) (100) (74) (51)
Lawyers Mutual Insurance Company of Kentucky (684) (1,660) (908) (874) (1,675)
Members Insurance Company Carolina Motor Club Group (44) (199) (128) (196) (76)
Miami Mutual Insurance Company Celina Group (943) (566) (871) (695) (521)
Michigan Professional Insurance Exchange (3,553) (3,153) (4,608) (7,663) (4,522)
Midrox Insurance Company (259) (288) (228) (246) (215)
Motors Insurance Corporation GMAC Ins Holding Group (4,587) (101,422) (38,745) (13,963) (17,475)
Mt. Morris Mutual Insurance Company (169) (240) (1,632) (547) (598)
MutualAid eXchange (847) (463) (650) (355) (460)
National Mutual Insurance Company Celina Group (1,069) (642) (987) (787) (591)
National Security Fire & Casualty Company National Security Group (2,488) (2,451) (1,191) (225) (259)
National Unity Insurance Company (2,336) (2,309) (2,018) (3,297) (1,158)
Northwest Dentists Insurance Company Oregon Dental Group (2) (178) (591) (1,708) (1,364)
Northwest G.F. Mutual Insurance Company (209) (303) (565) (194) (73)
Ocean Harbor Casualty Insurance Company Ocean Harbor Group (6,683) (7,444) (4,581) (3,592) (2,432)
Physicians' Insurance Program Exchange (2,402) (1,557) (1,177) (1,692) (1,041)
Safeway Property Insurance Company Safeway Ins Group (165) (309) (45) (277) (24)
Standard Mutual Insurance Company (1,009) (970) (1,982) (1,537) (2,973)
Waco Fire & Casualty Insurance Company (6,298) (7,043) (1,510) (3,907) (2,527)
Wayne Cooperative Insurance Company (310) (753) (109) (831) (1,070)
Wayne Mutual Insurance Company Wayne & Washington Mut Group (2,086) (1,053) (1,865) (967) (703)
Wisconsin County Mutual Insurance Corporation Wisconsin Cnty Mut Group (4,320) (3,394) (1,738) (2,949) (1,167)
Wisconsin Reinsurance Corporation Wisconsin Re Group (2,313) (1,201) (1,770) (610) (940)
Wolverine Mutual Insurance Company (1,451) (1,035) (814) (378) (779)
Yosemite Insurance Company Fortress Group (1,800) (2,662) (3,292) (880) (2,785)
Zale Indemnity Company Zale Corp Group (14) (543) (502) (1,029) (764)
Total for Companies Above (89,676) (201,414) (142,455) (90,505) (81,816)
Statutory Self-Reported Favorable One Year Loss & LAE Development

P/C Loss and Loss Adjustment Expense Reserve Studies: Demotech Analysis
Note: All figures in thousands Appendix 6
Companies with Five Consecutive Years of Self-Reported Favorable One Year Development Assigned Ratings Below an A level Appendix 6
Statutory Prior Year Pre-Tax Operating Income Gain/(Loss) Adjusted For Self-Reported Favorable One Year Development
Company Group 2008 2009 2010 2011 2012
AgSecurity Insurance Company Oklahoma Farm Bureau Group (192) 84 3,714 4,233 2,085
American Healthcare Indemnity Company Doctors Co Group 11,598 30,621 55,822 23,639 2,947
Anchor General Insurance Company Anchor Ins Holdings Group 5,150 (79) (59) 1,080 (449)
Armed Forces Insurance Exchange 7,599 5,172 2,271 (8,189) (2,083)
Bondex Insurance Company 218 390 323 188 243
Buckeye State Mutual Insurance Company Buckeye Ins Group (3,822) 3,472 215 1,307 (639)
Bunker Hill Insurance Company Plymouth Rock Ins Group 3,362 3,749 5,639 (12,057) 4,029
BusinessFirst Insurance Company RetailFirst Group 4,641 2,813 (1,400) 838 64
Cameron Mutual Insurance Company Cameron Mut Group (13,407) (3,181) 851 (4,467) 3,390
Celina Mutual Insurance Company Celina Group 2,971 1,367 685 (1,201) 837
Century Casualty Company 311 298 367 642 769
Club Insurance Company 1,367 1,315 1,098 750 654
Colorado Farm Bureau Mutual Insurance Company 6,137 (598) 4,918 2,833 493
Community Hospital Alternative for Risk Transfer (A Reciprocal RRG) 7,255 11,437 14,747 16,724 16,835
Conifer Insurance Company Conifer Holdings Group 649 554 225 (2,203) (106)
Eastern Dentists Insurance Company RRG 3,543 4,968 7,223 7,433 4,983
Ever-Greene Mutual Insurance Company Everett Mut Group 419 215 365 337 335
Forestry Mutual Insurance Company 6,119 4,659 2,880 1,556 (635)
Frank Winston Crum Insurance Company 995 2,215 1,713 (1,427) 1,212
Galen Insurance Company 1,104 1,265 1,584 2,460 14
Great Plains Casualty, Inc. 611 1,004 1,373 1,323 2,072
Housing and Redevelopment Insurance Exchange 5,116 4,019 4,896 2,915 1,910
Illinois Casualty Company (A Mutual Insurance Company) 3,040 5,709 2,327 531 2,579
Juniata Mutual Insurance Company 285 710 383 (307) 343
Lawyers Mutual Insurance Company of Kentucky 1,262 1,855 1,108 928 1,827
Members Insurance Company Carolina Motor Club Group (281) (252) (132) 283 (177)
Miami Mutual Insurance Company Celina Group 1,898 1,185 489 (1,094) 524
Michigan Professional Insurance Exchange 7,719 10,461 9,923 14,876 14,262
Midrox Insurance Company 462 99 328 196 623
Motors Insurance Corporation GMAC Ins Holding Group 540,144 494,799 294,237 132,005 48,114
Mt. Morris Mutual Insurance Company 207 1,134 678 1,038 1,349
MutualAid eXchange (3,038) (1,679) 237 (480) (227)
National Mutual Insurance Company Celina Group 2,884 1,314 630 (1,160) 841
National Security Fire & Casualty Company National Security Group (5,024) 7,686 6,912 (3,822) (467)
National Unity Insurance Company 5,941 7,608 5,201 6,008 4,224
Northwest Dentists Insurance Company Oregon Dental Group 856 (15) (15) 2,730 1,661
Northwest G.F. Mutual Insurance Company (370) (252) (1,049) (904) 575
Ocean Harbor Casualty Insurance Company Ocean Harbor Group 9,805 9,252 5,853 968 8,549
Physicians' Insurance Program Exchange 1,892 3,464 1,243 2,908 2,219
Safeway Property Insurance Company Safeway Ins Group 7,037 3,929 3,076 2,333 3,109
Standard Mutual Insurance Company 123 858 407 2,119 (221)
Waco Fire & Casualty Insurance Company 7,876 7,137 2,720 3,836 2,324
Wayne Cooperative Insurance Company 713 1,298 1,980 1,246 1,720
Wayne Mutual Insurance Company Wayne & Washington Mut Group 1,103 1,378 790 3,397 3,454
Wisconsin County Mutual Insurance Corporation Wisconsin Cnty Mut Group 8,073 9,646 4,958 3,571 2,659
Wisconsin Reinsurance Corporation Wisconsin Re Group (1,424) 2,329 1,255 (5,482) 3,456
Wolverine Mutual Insurance Company (109) 792 139 (1,192) 1,477
Yosemite Insurance Company Fortress Group 53,572 36,428 39,334 28,695 28,224
Zale Indemnity Company Zale Corp Group 2,879 3,807 5,261 8,605 8,675
Total for Companies Above 699,271 686,440 497,725 240,543 180,657
Adjusted For Self-Reported Favorable One Year Development
Statutory Prior Year Pre-Tax Operating Income Gain/(Loss)