A Descriptive Study - KU ScholarWorks
112
An Examination of the Validity of Office Disciplinary Referrals (ODR) as a Behavioral Screener: A Descriptive Study By Copyright 2011 Jamie M. Bezdek Submitted to the graduate degree program in Special Education and the Graduate Faculty of the University of Kansas in partial fulfillment of the requirements for the degree of Doctor of Philosophy. ________________________________ Chairperson Wayne Sailor ________________________________ Amy McCart ________________________________ Rud Turnbull ________________________________ Michael Wehmeyer ________________________________ Bruce Frey Date Defended: April 5 th , 2011
Transcript of A Descriptive Study - KU ScholarWorks
An Examination of the Validity of Office Disciplinary Referrals (ODR)
as a Behavioral Screener:
A Descriptive Study
By Copyright 2011
Jamie M. Bezdek
Submitted to the graduate degree program in Special Education and the Graduate Faculty of the University of Kansas in partial fulfillment of the requirements for the degree of
Doctor of Philosophy.
________________________________ Chairperson Wayne Sailor
________________________________
Amy McCart
________________________________ Rud Turnbull
________________________________
Michael Wehmeyer
________________________________ Bruce Frey
Date Defended: April 5th, 2011

ii
The Dissertation Committee for Jamie M. Bezdek
certifies that this is the approved version of the following dissertation:
An Examination of the Validity of Office Disciplinary Referrals (ODR)
as a Behavioral Screener:
A Descriptive Study
________________________________ Chairperson Wayne Sailor
Date approved: April 5th, 2011

iii
ABSTRACT
Response to Intervention is an overall framework applicable to both behavioral
and academic need and support (NASDSE, 2006). Schoolwide Positive Behavior Support
(SWPBS), which also uses a multi-tiered system utilizing the same logic (Sailor, 2009), is
often used as the behavioral framework nesting within RtI. Schools utilizing a system of
Schoolwide Positive Behavior Support need to employ a universal screener to determine
those students who are at risk for internalizing and externalizing challenging behaviors in
order to provide these students with additional preventative supports. Office discipline
referrals (ODRs) are a commonly used form of discipline, so the data they produce are
readily available to researchers and school personnel. Using Messick’s theory of validity,
a specificity and sensitivity analysis were completed on ODRs as a screener using data
from two diverse elementary schools with results of the Systematic Screening for
Behavior Disorders (SSBD) used as the reference standard. Over and underrepresentation
of certain subgroups, including boys, members of racial minorities, and students with
special education labels, were also examined. Results were interpreted in light of social
and educational consequences. The sensitivity analysis for the overall student population
(n=315) showed 43.6% of students were properly identified as needing support using the
ODR system of screening. Correspondingly, the rate of false negatives for externalizing
students was 42.3% (p<.01) and 84.6% (p<.01) for internalizing students. Given the
consequences of failing to provide additional support for these students, as well as a host
of other social and educational consequences resulting from use of ODR data, it is
recommended that ODR data should not be used as a screener to identify students in need
of behavioral support.
iv
ACKNOWLEDGEMENTS
The credit for this dissertation belongs to so many wonderful people. Specifically, I would like to acknowledge:
My advisor, Wayne Sailor, who is as much a patient person as he is brilliant and ground
breaking; Rud Turnbull, who is as gentle as they come, yet a fierce advocate for individuals with disabilities; Bruce Frey, who is incredibly kind and has a gift for making the complex seem simple, and to my entire dissertation committee for generously giving of their time and talent. I admire you all so much and you have left big shoes to fill for
the next generation!
My friends, coworkers, and mentors, especially Amy McCart who brought me into the world of systems change, and treated me like an equal; thank you for letting me soak up
your wisdom (and for teaching me to love coffee when I needed it most!); Holly Sweeney, who gave me more than one pep talk along the way about what was truly important in life; Alisha Templeton, because you are my “person;” and Nan Perrin, who was the first to instill this passion in me and with whom I have been able to share every
important milestone in life. I am glad this doctoral program was no exception.
To Robert Rodriguez, of the McNair Scholars Program, for all your support over the years! No matter what the topic, I always knew I could pop into your office at any time
and receive great advice.
Additionally, I would like to thank Mickey Waxman and Rebecca Fox-Barrett, two hidden treasures at the University I am grateful to have discovered along the way.
To God, because with Him all things are possible,
To my parents, who always placed importance on education with their children and gave everything they had to that end, especially their time and encouragement.
Dad, you never made it a secret how proud you are of me. Mom, you did not just talk the talk, but walked the walk—all the way down “the hill”
with me, something I will always treasure!
To my husband who has been there with me through it all, from acceptance into the program to its completion, and every tuition payment in between.
And, last but not least, to my four children conceived during this program--two in
heaven, two on earth. Because some things are too important to put off, and because “Mom” will always be my favorite title.

v
TABLE OF CONTENTS
Chapter Page
Title Page i
Acceptance Page ii
Abstract iii
Acknowledgements iv
Table of Contents v
List of Tables and Figures vii
CHAPTER 1: Introduction and Literature Review 1
Review of Literature 3
History of RtI and PBS 3
Importance of Screening 8
Screeners 11
Conclusion 39
Study Questions 41
CHAPTER 2: Methods 42
Participants 42
Procedures 46
Instrument 48
Study Questions and Data Analysis 52
Definition of Variables 57
Summary 59
CHAPTER 3: Results 61

vi
Descriptive Results 61
Question One and Respective Results 62
Question Two, Part A, and Respective Results 66
Question Two, Part B, and Respective Results 76
CHAPTER 4: Discussion 78
Implication of Results 78
Demographics 78
Sensitivity and Specificity 79
False Positives and False Negatives 81
Over and Underrepresentation 84
Additional Consequences 84
Limitations and Future Research 87
References 89
vii
LIST OF TABLES AND FIGURES
Figure 1: RtI Conceptual System 4
Table 1: Aggregate Demographic Data by School 44
Figure 2: SSBD Gates and Stages 51
Figure 3: Sample Table of ODR Results 54
Table 2: Breakdown of Subgroups for Each School and Screening Method
62
Table 3: ODR Results for Overall Study Population 63
Table 4: ODR Results for Externalizing Group 64
Table 5: ODR Results for Internalizing Group 64
Table 6: ODR Results for Males 67
Table 7: ODR Results for Females 68
Table 8: ODR Results for Students with a Disability Label 69
Table 9: ODR Results for Students without a Disability Label 69
Table 10: ODR Results for Students with Low SES 70
Table 11: ODR Results for Students who Do Not Qualify for Free or Reduced Lunch
71
Table 12: ODR Results for English Language Learners 72
Table 13: ODR Results for Students whom English is Their Primary Language
72
Table 14: ODR Results for African American Students 73
Table 15: ODR Results for Caucasian Students 74
Table 16: ODR Results for Hispanic Students 74

1
CHAPTER 1: Introduction and Literature Review
The purpose of this descriptive study was to measure the validity of office
disciplinary referrals (ODR) when used as a screener within the context of Response to
Intervention (RtI). This study was designed as a preliminary look at whether ODRs have
acceptable validity for screening and identifying students in need of behavioral support,
an issue currently under debate. Of additional significance is whether ODR is an accurate
measure of child behavior and whether the use of ODR leads to overrepresentation of
various subgroups, such as males or minorities, among those labeled “at risk.”
ODR validity was estimated using the Systematic Screener for Behavior
Disorders (SSBD; Walker & Severson, 1992) as the reference standard. The SSBD is a
psychometrically established tool designed for the purpose of serving as a “screener”,
that is for identifying students with internalizing (i.e., depression; withdrawal) or
externalizing (i.e., aggression) child behaviors. It is known to be effective and has been
normed on a diverse population that includes various ethnicities, as well as socio-
economic statuses. The study also addresses some of the consequences of combining both
SSBD and ODR as a single screening instrument.
The question of ODR’s validity as a screener is particularly relevant to
implementation of schoolwide applications of RtI since ODR is readily available and,
because of this, ODR is the most commonly used screening method among behavioral
researchers (Horner, Sugai, Todd, & Lewis-Palmer, 2005; McIntosh, Horner, Chard,
Boland & Good, 2006; Sugai, Sprague, Horner, & Walker, 2000). Unlike the SSBD,
ODR is not designed as a screener, even though it is used, de facto, to identify students in
need of extra support. For the most part, researchers and those who provide technical

2
assistance within the field of PBS do not prefer the SSBD as it requires teachers to
complete additional work in the form of filling out a questionnaire at least twice per year.
Sensitivity to the time demands on teachers is especially important at a time when
teachers are already considered to be overburdened in general, a stress partially due to
additional responsibilities such as preparing for and administering standardized tests that
have resulted from accountability legislation. In other words, school districts will likely
encounter less resistance from teachers if they use ODR for screening, because ODR
relies on established teacher routines for ongoing classroom management, than districts
will if they require the SSBD, which requires teachers to fill out a multi-gated
questionnaire. Therefore, if the ODR has acceptable sensitivity and specificity levels,
does not result in over or underrepresentation, and this information is viewed in light of
the potential social and educational consequences, then continuing its use will be
acceptable, eliminating the need for an additional formal screener.
However, the research suggests legitimate concerns about the use of ODR in this
manner. The validity for use of ODR in general, but particularly as a screening method,
remains under debate. Concerns mainly revolve around the following areas: ODR
accuracy in predicting future ODRs or other negative long-term outcomes and ODR
sensitivity and specificity in identification without overidentification of certain subgroups
(such as males, minorities, English-language learners, those of low income, and those
identified for a special education), as well as without underidentification of groups that
would go without necessary support. These are not concerns to be taken lightly because
of the mere “availability” of the ODR data. Therefore, determining whether ODR is a
valid screening method is both necessary and valuable.

3
Review of Literature
History of Response to Intervention (RtI) and Positive Behavior Support (PBS)
Much attention has been given to the relatively new and promising practice of
Response to Intervention (RtI) within the field of education. RtI is a logic model used to
tailor instruction to each student’s need (Sailor, 2009). It involves universal screening,
interventions, progress monitoring, and using data to make decisions and implement
evidenced-based interventions. These hallmarks must be in place before educators can
determine whether a student is making adequate progress. The goal is early identification
of students who are having difficulty (i.e., prevention logic) and requisite modification of
the amount of time and content of instruction to meet their needs. Researchers believe
that if schools can identify students early and modify their instruction, fewer students will
need special education referral and accompanying services. By adopting an RtI
framework, schools potentially become more preventative and cost effective in nature
(Sailor, 2009).
RtI involves multiple tiers (see Figure 1, Sailor, 2009). The first tier, the primary
form of support, is a system of preventative academic and behavioral support involving
evidenced-based instruction and universal academic and behavioral screening for all
students. It is designed to meet the needs of all students and is cost efficient and
preventative in nature. Based on the screening and progress monitoring data collected at
the universal level, a certain percentage of students (typically around 15%; National
Association of State Directors of Special Education, 2006) will require additional
support, or tier 2 interventions. This second tier involves systems of intervention for
students with more extensive needs and, and as a result, has a higher level of support and

4
therefore requires more resources. Through additional progress monitoring, those who
fail to respond to the tier 2 interventions (estimated at about 5%) receive an even higher
level of support at tier 3. The third tier is a system of extensive interventions for the
treatment of individuals with severe and chronic academic and/or behavioral problems
who require a higher level of individualized support and, therefore, even greater
resources per student. The actual tiers are somewhat arbitrary in that the model reflects a
continuum of support matched to the level of need (NASDSE, 2006).
Response to Intervention is an overall framework applicable to both behavioral and
academic need and support (NASDSE, 2006). Schoolwide Positive Behavior Support
(SWPBS), which also uses a multi-tiered system utilizing the same logic (Sailor, 2009), is
often used as the behavioral framework nesting within RtI.
Designing Schoolwide Systems for Student Success
Academic Instruction(with fidelity measures)
Behavioral Instruction(with fidelity measures)
Tertiary Interventions(for individual students)• Wraparound Intervention• Complex Multiple Life Domain FBA/BIPs
Tertiary Interventions(for individual students)• Wraparound Intervention• Complex Multiple Life Domain FBA/BIPs
Secondary Interventions(for some students: at‐risk)• Simple FBA/BIPs• Group Intervention with Individual Features
• Group Intervention
Secondary Interventions(for some students: at‐risk)• Simple FBA/BIPs• Group Intervention with Individual Features
• Group Intervention
Universal Interventions(for all students)• Direct Instruction of Behavioral Expectation
• Positive Acknowledgement
Universal Interventions(for all students)• Direct Instruction of Behavioral Expectation
• Positive Acknowledgement
Tertiary Interventions(for individual students)• Assessment‐based• Resource Intensive
Tertiary Interventions(for individual students)• Assessment‐based• Resource Intensive
Secondary Interventions(for some students: at‐risk)• Some individualizing• Small Group Interventions• High Efficiency• Rapid Response
Secondary Interventions(for some students: at‐risk)• Some individualizing• Small Group Interventions• High Efficiency• Rapid Response
Inc
rea
ses L
eve
ls of S
up
po
rtR
ed
uc
es
Nu
mb
ers
of
Stu
de
nts
Mo
nito
ring
Stu
de
nt P
rog
ressM
onit
ori
ng S
tud
ent
Pro
gre
ss
Screen All Students
RtI conceptual system with general and special education integrated at all three levels
Universal Interventions(for all students)• Preventive, Proactive• Differentiated Instruction• Research Validated Curriculum
Universal Interventions(for all students)• Preventive, Proactive• Differentiated Instruction• Research Validated Curriculum
Figure 1: RtI conceptual system

5
Positive behavior support (PBS) evolved from the field of applied behavior
analysis and the normalization/inclusion movement and is rooted in person-centered
values (Carr et al., 2002). Positive behavior support usually refers to a collection of
values (e.g., inclusion, prevention, environmental impact, self-determination, data-based
decision making) and resulting intervention ideas that grew out of behavioral and social
skills research and that address the function of the behavior. PBS evolved into
schoolwide PBS (SWPBS), a preventative systems change framework, in the 1990s in
response to growing concerns around the country about two trends: the increase in anti-
social behavior and violence (Sugai, et al, 2000) and the increasing realization that
existing discipline systems, including zero-tolerance and exclusionary (“get tough”)
policies, were not only ineffective but actually enhanced problem behaviors in some
cases (Mayer, 1995; Skiba, 2002). SWPBS also encompasses the idea of a continuum of
behavior support to match a continuum of students’ needs, from primary supports all
students receive (such as teaching students expectations of school behavior and
rewarding their use) to more intensive individual supports for individuals with more
chronic challenging behaviors (such as a complete functional behavioral assessment and
behavior intervention plan). The focus in SWPBS, as in RtI, is on prevention, data-based
decision making, and evidenced-based instruction. SWPBS uses research-based (and
function-based) interventions to assist in the prevention of disability and the inclusion of
all students (Sugai & Horner, 2009).
Both PBS and RtI are written into legislation. The Individuals with Disabilities
Education Improvement Act (IDEIA; formerly IDEA) formally recognized positive
behavioral interventions and supports beginning in 1997. IDEIA currently requires that

6
the Individualized Education Program (IEP) team shall “in the case of a child whose
behavior impedes his or her learning or that of others, consider the use of positive
behavior interventions and supports, and other strategies, to address that behavior”
(Section 1414 (d) (3) (A)). Components of individual positive behavior support,
functional behavioral assessment, and behavior interventions are also encouraged when
behavior impedes learning and are explicitly required when a student receives out-of-
school suspension for more than ten days or where a pattern is established that there was
a manifestation of behavior that impeded learning (20 U.S.C. Sec 1415 (k)(1)(F)(i)-(ii);
20 U.S.C. Sec. 1415 (k) (1) (D)(ii)). In addition, the preamble of IDEIA, beginning in the
1997 reauthorization, contained support for whole school approaches, including positive
behavior support (20 U.S.C. Sec 1400(c) (5)). NASDSE (2006) noted “Although IDEA
’97 included a number of significant changes… to improve student outcomes… few real
changes occurred in practice… However, IDEA ’97 set the stage for the response to
intervention language that appears in IDEIA 2004” (p.16).
RtI is also included in legislation, although at this time it is limited to providing
supplemental information to identify students with learning disabilities (LD). Language
acknowledging and allowing this practice to continue was included in the reauthorization
of IDEA 2004. The law no longer requires using the traditional discrepancy model
(identifying a discrepancy between IQ and ability) and stated that districts “may use a
process that determines if the child responds to scientific research-based intervention as a
part of the evaluation procedures” (20. U.S.C. 1414(b)(6)(B) as cited in NASDSE, 2006).
Fuchs, Mock, Morgan, and Young (2003) described RtI as a criterion for identifying LD
in the following broad terms: a) students receive “generally effective” instruction by the

7
classroom teacher; b) their progress is monitored; c) those who do not respond receive
more intense instruction or different methods; d) progress is monitored again; e) if there
is not a response to the intervention in place, students may qualify for special education
or a special education evaluation. The potential for RtI has since extended beyond the
identification of students for special education at this time, but that is currently how the
legislation is written.
The growing awareness of RtI and use of SWPBS within the RtI model has been
mutually beneficial to the fields of both RtI and PBS. The relatively new field of RtI is
learning from the wealth of research published under SWPBS about systems change and
how to implement this multi-tiered model. The field of PBS benefits as individuals in the
field formalize some of the practices and scrutinize others. One example that goes to the
heart of this study is related to screeners. RtI uses psychometrically valid schoolwide
screeners for academics, so researchers of SWPBS, as a subset of RtI, have been debating
office disciplinary referrals’ (ODRs’) validity (Rusby, Taylor, & Foster, 2007; Irvin et
al., 2006; Kern & Manz, 2004; McIntosh, Campbell, Carter & Zumbo, 2009; Morrison,
Peterson, O’Farrell, & Redding, 2004; Morrison & Skiba, 2001; Nelson, Benner, Reid,
Epstein, & Currin, 2002; Nelson, Gonzalez, Epstein, & Benner, 2003; Skiba, Peterson, &
Williams, 1997; Tobin & Sugai, 1996 and 1999; Walker, Steiber, & O’Neill, 1990) and
whether ODR can be used for screening (Irvin et al., 2006; Walker, Cheney, Stage, &
Blum, 2005) or if using an existing psychometrically validated screener (Lane et al.,
2009; Lane, Kalberg, Lambert, Crnobori, & Bruhn, 2010; McIntosh et al., 2009; Nelson,
Benner, et al, 2002; and Walker et al., 2005), such as the SSBD, which is commonly
8
referred to as the “gold standard” of screeners (Lane et al., 2009, p. 95; Lane et al., 2010,
p. 101), is more effective.
Importance of screening.
This study sought to determine the validity of office disciplinary referrals (ODR)
as a screener using another screener, SSBD, as a reference standard. As mentioned
previously, part of RtI (and therefore SWPBS) is a need to systematically screen all
students. The need to screen is aligned with the mission of RtI as a proactive preventative
model. RtI moves beyond the “wait to fail” system historically used, and thus systematic
and accurate screening is necessary.
National trends in education in the 1990s and early twenty-first century
contextualized the push for RtI and PBS and highlighted the need for a focus on
screening and prevention. Serious problems with (and within) the national educational
system were growing. These included the recognition of separation/fragmentation
between special education and general education; overrepresentation of minorities in
special education; lack of implementation of research-based practices; and more,
including a lack of emphasis on the prevention of small problems before they grew. Even
the overall benefits of special education were being called into question (NASDSE,
2006).
A group of individuals respected in the field of education felt strongly that there
was a deficit in the current education system, specifically with the traditional method of
diagnosing students and applying prescriptive treatments. Instead, they wanted a system
better grounded in the features of hard science, a system that would investigate why
students were not learning and track progress. As a result, Charles Finn, Andrew

9
Rotherham, and Charles Hokanson (2001) edited Rethinking Special Education for a New
Century, which included many like-minded authors. This book elaborated on how these
ideas could be put to work to improve special education.
No Child Left Behind (NCLB) legislation was part of the response to these
concerns. For example, Reading First, a national initiative established as part of NCLB in
2001, focused on high-quality comprehensive reading instruction in grades K-3, as well
as high-quality instruction with research-based interventions, and supported the use of
screening and diagnostic tools to assess students and monitor progress. Reading First
brought RtI into the mainstream of academics (Walser, 2007). In general, NCLB had a
heavy emphasis on accountability and has supported the use of evidence-based
instruction, highly qualified teachers, and the requirement to deliver effective reading and
behavior programs. All of this was an effort to improve student outcomes and prevent
students from needing special education services (NASDSE, 2006).
In anticipation of the 2004 IDEA reauthorization, in October of 2001, the
President’s Commission on Excellence in Special Education (PCESE) was established to
recommend priorities for improvement. The PCESE, which included four authors of the
Rethinking Special Education text (Fletcher, Hassel, Horn and Lyon), received input from
parents, teachers, and researchers. The Commission’s report, issued in July 2002, largely
mirrored the text and brought to national attention the growing problems within
education. These problems included the current “wait to fail” model, the growing number
of misidentified students, and the way that qualifying for special education failed to be a
gateway to effective and research-based interventions. The major recommendations
found in the report were a) focus on results, not process, b) embrace a prevention model,

10
and c) consider students with disabilities to be general education students before
considering them to be special education students (NASDSE, 2006). RtI has the potential
to correct many of these concerns, which continue today to various degrees. It is
important that part of that process includes schoolwide screening, a cornerstone to
prevention, as
mental health professionals and some educators… regard systematic, universal
screening as a preferred practice that would connect more vulnerable students to
needed services, supports, and placements much earlier in their school careers.
(Severson, Walker, Hope-Doolittle, Kratchowill, & Gresham, 2007, p. 219-220)
Forness, Kavale, MacMillan, Asarnow, and Duncan (1996) distinguish between
the early identification and early detection of problems, arguing that early detection,
which occurs through practices such as systematic schoolwide screening mentioned
above, best serves students:
While early identification implies recognition of a child’s problem by service
system professionals once it comes to their attention through initial teacher or
parent referrals, early detection implies recognition of the matter before it
becomes a matter of referral. This latter implication not only suggests a need for
systematic school-wide screening, but also implies a greater emphasis on primary
rather than secondary prevention. Primary prevention is an attempt to take
advance measures that forestall probable emotional or behavioral problems in
children. Secondary prevention is an attempt to lessen the impact of problems that
have already occurred. (p. 228)

11
Lane and colleagues agree on both points: the importance of schoolwide
screening and the idea that, through schoolwide screenings, schools can identify students
“when they are most amenable to intervention affects” (Lane et al., 2010, p. 101). As the
authors’ note, “the issue of identifying and supporting students with [emotional and
behavior disorders] is more than a special education issue as the majority of these
students are members of the general education population” (p. 100). If educators actively
engage in systematic screening and early intervention, students with these “soft” signs of
emotional and behavior disorders (EBD) can be identified as early as possible, allowing
all of the students’ needs to be addressed at a time when they will be most responsive to
intervention.
Screeners.
Within the field of SWPBS, the literature describes the use of psychometrically
valid screeners as well as the use of office disciplinary referrals (Horner et al., 2005;
Irvin, et al., 2006; Sugai et al., 2000) for use in schoolwide behavioral screening. As
mentioned earlier, of the psychometrically valid screeners, the Systematic Screener for
Behavior Disorders (SSBD; Walker & Severson, 1992) is considered the “gold standard”
(Lane et al., 2009, p. 95; Lane et al., 2010, p. 101). Research related to both office
disciplinary referrals (ODR) and the SSBD are described below.
Systematic screener for behavior disorders (SSBD).
The Systematic Screening for Behavior Disorders (SSBD) is widely considered a
valid tool for schoolwide screening of behavior disorders. Since SSBD publication,
researchers confirmed that the SSBD tool has been proven valid and reliable (Forness et
al., 1996; Merrell, 2003; Sprague, et al., 2001; Todis, Severson, & Walker, 1990; Walker,

12
Severson, Nicholson, Kehle, Jenson, & Clark, 1994). Forness, et al., (1996) cited it as
“among the most promising” (p. 229), “characterized by considerable economy of effort;
and exceptionally good reliability and validity” (p.230). Additionally, researchers suggest
that it has evidence of reliability and validity for identifying elementary students at risk
for Emotional Behavioral Disability (EBD; Kelley, 1998; Zlomke & Spies, 1998). This
section will outline the initial development and field testing leading to the published
psychometric properties, as well as research on the SSBD since its initial validation. For a
detailed description of how the SSBD is administered, see Chapter 2: Methods and
specifically Figures 2 and 3 for movement through the various gates and stages.
Walker et al., (1988) described the initial research in the SSBD’s development, as
well as trial testing. This study showed the SSBD, by taking educators through various
gates and stages of rank ordering, going through sub-scales, and observing students,
correctly identified 89.47% of pupils who had been identified as “externalizers,”
“internalizers,” or “normals” (per the study). Additionally, concurrent validity testing was
completed on the three sub-scales (maladaptive, external, and internal), which are part of
Stage 2, using the Achenbach Child Behavior Checklist (CBC; Achenbach & Edelbrock,
1979).
Todis and colleagues (1990) published an article specific to the Critical Events
Scale (one of the scales within the SSBD) where two studies and two case studies were
described. It concluded the high-ranked externalizers and internalizers had extremely
different profiles on the scale compared to non-ranked students. For example, non-ranked
students rarely even had one of the thirty-three behaviors listed on the scale whereas
“true” internalizers and externalizers (those who were ranked at least as the top three in

13
the class and then were flagged based on the score of the subscale) had an average of four
(internalizers) or six (externalizers) of these events. Examples of these events include:
stealing, being painfully shy, having tantrums, abusing oneself, being physically
aggressive, and swearing. These events are considered low frequency yet highly
significant.
In 1990, Walker et al. validated and replicated the SSBD in a study similar to the
one they had completed in 1988, although it had a much larger sample. It described two
studies. In the first, researchers addressed validation (factorial, criterion-related, and
discriminate) and normative questions. In the second, researchers conducted a study of
replication and reliability (which included test-retest and sensitivity). The first study
found powerful subject/group differences and criterion-related validity coefficients
between the SSBD and archival school record profiles. These results support findings that
the SSBD is a sensitive measure in finding students with known behavioral needs.
Temporal stability of Stage 1 and 2 was tested and the mean test-retest rank order
correlations were determined for both the externalizing and internalizing teacher rank
order lists. The researchers found that, upon removal of the two outliers with negative
rhos, the average externalizing rho improved from .79 to .88 and the average internalizing
rho improved from .72 to .74 (p.41). The stability of group membership (internalizing,
externalizing, and the comparison groups) analyzed by chi square analysis showed results
significant well beyond p <.01 for both internalizing and externalizing proportions.
Pearson’s r’s were computed twice, with a one-month interval between computations, for
SSBD Stage 2 rating instruments. The correlation for the Critical Events Index was .81;
for the Adaptive Behavior Rating Scale the correlation was .90, and for the maladaptive,
14
the correlation was .87. All were statistically significant at p<.01. Coefficient alphas for
the scales were reported greater than .90 with the sample.
Walker and Severson (1990) normed the tool on almost 4500 cases for Stage 2
measures and nearly 1300 cases for Stage 3. These students came from four different
U.S. census zones and eight states and were located within eighteen school districts
across the country. The authors collected demographic and socioeconomic status data on
twelve of the eighteen districts. From this information, they found that the non-white
proportions of students ranged from less than 1 to 29%. Additionally, the proportion of
students coming from low income families ranged from 4.3 to 40%. Analyses were
completed on gender differences, and statistically significant mean differences between
males and females on teacher ratings for the Adaptive Behavior Rating Scale (in Stage 2)
were found. From the national standardization sample, Walker and colleagues found
inter-rater reliability coefficients to be .89 to .94 for externalizing behavior and .73 to .88
for internalizing. The test-retest reliability coefficients were .76 for externalizers and .74
for internalizers. It is clear that the SSBD was normed on a large sample that included an
economically and racially diverse group of students and resulted in excellent
psychometrics.
Walker and Severson (1992) described the studies associated with the tool’s
development that yielded the reliability estimates for its use. Internal consistency was
estimated above .80 (r=.82-.88) for Stage 2 subscales Adaptive and Maladaptive Student
Behavior. Elementary test-retest reliability for Stage 1 reported ranking of internalizing
behavior as .72 and externalizing behavior as .79. During the instrument development
phase, interrater agreement (Spearmen ρ) on the internalizing and externalizing
15
dimensions of Stage 1 ranged from .82 to .94. High levels of construct validity, as well as
moderate to high correlations with other scales related to behavior (e.g. Walker-
McConnell; r=.44-.79), show the SSBD to be valid.
The SSBD has been held to a high standard in its applications in schools for over
a decade now. With time and use, the reputation of the SSBD has only increased. Based
on the results of the field trials done, it has been called “among the most promising” tools
(Forness, et al., 1996, p. 230), and referred to as the “gold standard” (Lane et al., 2010, p.
101) and “exemplary” Lane et al., 2010, p. 102). Lane and colleagues (2009) also called
the tool “state of the art” from their review of the literature. Kauffman (2001) felt it was
the “most fully developed screening system currently available for school settings” (p.
141). And, finally, Elliot & Busse (1993) stated it was the best instrument for screening
and identification of students with behavior disorders.
The SSBD has earned this reputation for many reasons. Of course, its uniquely
strong psychometrics certainly contributes (Forness, et al., 1996; Merrell, 2003; Sprague
et al., 2001; Todis et al., 1990; and Walker et al., 1994). Many other characteristics also
make this tool particularly useful. These include the fact that it captures externalizers as
well as internalizers, uses a multi-gated approach, is intended for large scale schoolwide
screening, and uses few resources. Because of all these features, it is widely accepted
among researchers and teachers. Why each of these qualities is desirable is detailed
below.
First, as mentioned, the SSBD is highly lauded because it captures internalizers as
well as externalizers and does so accurately while screening for them together (Elliot &
Busse, 2004; Lane et al., 2009; Severson et al., 2007). According to the tool’s authors

16
(Walker et al., 1988, p. 9), “externalizing refers to behavior problems that are directed
outward by the child toward the social environment and usually involve behavioral
excesses. This category includes aggressive behavior, noncompliance, out of seat, and
hyperactivity.” Those who exhibit externalizing behavior in their early school years are at
risk for school dropout, delinquency, and other negative outcomes (Walker, et al. 1988).
Contrastingly, “internalizing is defined as behavior problems that are directed inward and
often involve behavioral deficits. These deficits include being excessively shy and timid,
severely withdrawn, not participating in peer controlled activities, and being
unresponsive to social initiations by others” (Walker et al., 1988, p. 9). These students are
at risk for peer neglect or rejection (Walker, et al., 1988). Early detection is crucial so that
interventions and supports can be put in place. Both can be highly problematic if not
detected early; however, internalizers (due to their quiet nature) are less likely to be
recognized (Lane et al., 2010). The fact that the SSBD is particularly sensitive to
capturing internalizers is perhaps the strongest point in its favor.
Secondly, the SSBD utilizes a multiple gated approach (Forness, et al., 1996;
Severson et al., 2007). When completing the SSBD, teachers evaluate all their students,
dividing and ranking them according to specific criteria. A smaller subset of students
(six) who rank highly then pass to Stage 2, where the teacher completes scales for them.
Based on the scores, anywhere from zero to six of the students pass on to Stage 3 for
observation. The use of multiple gating procedures can improve the efficiency and
effectiveness of screening and intervening, resulting in lower costs (Walker et al., 1988).
It also serves as cross-validation within the overall instrument (Severson, et al, 2007).

17
Also, because of the multiple gating feature, interventions could theoretically
occur at any point (Forness, et al., 1996). Research shows that students who pass through
Stage 2 can be considered at least at moderate risk for developing behavior problems
(McKinney, Montague & Hocutt, 1998). Additionally, Nichols and Nichols (1990)
recommended that schools set up the eligibility criteria in such a way that more, rather
than fewer, students are able to benefit from the interventions. As a result, researchers
have chosen to use only the first two stages to screen, rather than all three (Cheney,
Blum, & Walker, 2004; Lane et al., 2009 and 2010; Walker et al., 2005). Not only does it
save resources (namely time, and therefore money, due to intensive observations required
at Stage 3), but it increases the likelihood that students who need support will not miss
out on interventions, and it therefore contributes to the overall proactive nature of the
tool. Severson and Walker (2002) agreed that over identification is better than
underidentification with a screener. For these reasons, multiple gating formats are
considered part of current best practice (Severson, et al., 2007).
Related to the multiple gating feature is also the fact that the SSBD is designed
for wide scale, school-based screening so all students are considered to have an equal
opportunity to be identified (Forness, et al., 1996; Lane, et al., 2009 and 2010; Severson
et al, 2007). If the population screened is artificially truncated prior to screening, valuable
information may be lost and students in need of supports may not be screened. Again,
with screening, casting a wider net is better.
Additionally, the SSBD is also characterized by considerable economy of
resources--both time and money (Forness, et al., 1996; Lane et al., 2009 and 2010;
Severson et al., 2007). The SSBD costs less than $200 to purchase, and the first two

18
stages of the tool take less than one hour to complete (Lane et al., 2010). It has
demonstrated savings of both time and money over traditional referral processes (Walker
et al., 1994), and earlier identification and access to services help additional long-term
savings accrue (Lane et al., 2010).
Finally, the SSBD is recognized for its perceived acceptability with researchers in
the field of behavior disorders (Severson et al, 2007) and as well with teachers. Lane and
colleagues (2009) state that not only researchers, but also teachers, refer to the SSBD as
the “gold standard” (p. 95). Additionally, Lane et al., (2010) referred to the tool as “user
friendly” (p. 104). Social validity data is minimal, available only through the original
authors’ replication study (Walker, et al., 1994); however those preliminary results
showed a majority of the participating school staff (both teachers and related-service
professionals) preferred it as the initial screener (as opposed to typical special education
referral procedures), which Phillips, Nelson, and McLaughlin (1993) then interpreted as
acceptable levels of consumer satisfaction.
Of course, no instrument is perfect. A few weaknesses of the SSBD have been
noted. First, other measures, such as the Student Risk Screening Scale (SRSS;
Drummond, 1994; Lane et al., 2009 and 2010), are easier to score. Second, no formal
social validity data have appeared outside the initial study by Walker and colleagues,
which compared it to the “standard referral process” (Walker et al., 1994); although the
SSBD is not very expensive or time consuming, there are tools that are cheaper and more
readily available, so some would consider the perceived time and expense for
administration a drawback (Severson, et al., 2007). Unfortunately, these easier methods
are not methods that are as sensitive to capturing internalizers. Lane et al. (2010) did note

19
that a web version of the SSBD (in development) has the potential to further decrease the
time necessary for completion and would make the need to score non-existent.
Additionally, Lane et al., (2009) cited the SSBD as only letting six students pass through
the first gate into Stage 2 (although SSBD instructions state this is suggested only as a
guiding metric). Finally, Lane et al., (2010) noted lack of a specific procedure for
identifying those students who exhibit both externalizing and internalizing behaviors.
Multiple studies have compared the Systematic Screening for Behavior Disorders
(SSBD) to other individual measures, or groups of screening measures and found the
SSBD to be quite effective (Lane et al., 2009 and 2010; and Severson et al., 2007). Lane,
et al. (2009 and 2010) found the SSBD to be more sensitive to internalizers than the
SRSS. Severson, et al. (2007) described how the Office of Special Education Programs
(OSEP) and the Stanford Research Institute (SRI) gathered experts to search for the
“optimal measures” for early detection and assessment of students at risk for behavioral
disorders; they found six, the SSBD being among them. The SSBD remains “the only
tool developed specifically to identify students with either externalizing or internalizing
behavior patterns” (Kauffman, 2001 as cited in Lane et al, 2009, p. 95). As a result, Scott
and Nelson (1999), in their article supporting best practices in screening, pointedly
mention the SSBD. In sum, the limitations listed are not of enough concern to outweigh
the benefits.
In fact, researchers in the field have showed their overwhelming acceptance of the
SSBD in various ways. First, researchers have used it as the measure by which to validate
other screeners. Secondly, researchers have worked to expand the SSBD for use with

20
other populations (both older and younger). Finally, researchers have used the SSBD to
screen within their own studies.
The SSBD has been used to test the validity of other screeners. For example,
Epstein, Nordness, Nelson, and Hertzog (2002) tested the Behavioral and Emotional
Rating Scale (BERS; Epstein & Sharma, 1998) against the SSBD’s subscales (Critical
Events checklist, Maladaptive Behavior scale, and Adaptive Behavior scale) typically
used as part of Stage 2 of the SSBD in order to determine convergent validity. When
using the criteria developed by Hammill, Brown, and Bryant (1989), which stated that a
correlation coefficient should meet or exceed .35 if it is to be evidence of validity, they
found that 85% of the correlations exceeded this standard.
Walker and colleagues (2005) validated the use of Office Disciplinary Referrals
(ODR) as a screener using students who passed Stage 1 and Stage 2 of the SSBD (Walker
& Severson, 1992). Seventy-two students from three schools (two suburban and one
located in a more urban setting with a more diverse population, all three from
Washington State) participated in the study. Both SSBD and referral data were collected,
and the distribution of ODR was analyzed. Findings indicated sensitivity (rate of true
positives) was 41.5% overall and only slightly higher (58.6%) for externalizers. A
majority of the students who were considered “at risk” via the ODR system were
considered to be externalizers via the SSBD, demonstrating that an ODR-only system
would have neglected to identify the internalizing students. By using the ODR method to
screen, all twelve internalizers found through the SSBD screening (though also verified
through the Social Skills Rating System or SSRS; Gresham & Elliot, 1990; not to be
confused with the Student Risk Screening Scale; SRSS; Drummond, 1994, cited
21
previously here) would have been missed and therefore would not have received
additional support (i.e. 0% sensitivity rate). The authors recommended the use of both
schoolwide screening and monitoring of ODR to increase the number of students
identified as at risk and therefore receiving supports.
Additionally, researchers have shown their respect for the SSBD by expanding it
for use with other populations. To date, the SSBD is normed for elementary aged
children. Feil and Walker (1995) published an article describing the Early Screening
Project (ESP), a screener specifically to identify preschoolers with behavior problems.
Adapted from the SSBD, this screener also has the multiple gating system and now
experiences much of the same prestige as the SSBD. More recently, a group of
researchers out of Brigham Young University (Caldarella, Young, Richardson, Young &
Young, 2008; Richardson, Caldarella, Young, Young & Young, 2009) have sought to
validate the SSBD for use with the middle school population. A few adaptations of the
original format accommodated the host of teachers with whom middle schoolers interact
daily. Currently, the findings showed support for the value of such a measure, although
the correlations with Achenbach System of Empirically Based Assessment (ASEBA;
Achenbach & Rescorla, 2001) and the SSRS have tended to be modest.
In addition to expanding the population for which the SSBD is normed and
validating other screeners using the SSBD, studies have also been published on the SSBD
as a screener. The following is not an exhaustive search but an example of these studies,
which have occurred both outside of, and more recently within, multi-tiered programs.
A study by McConaghy, Kay, and Fitzgerald (1999) described using the SSBD to
screen Kindergartners. In this longitudinal study, eighty-two children were identified as
22
at risk from thirteen different classrooms. All three stages were utilized, although
teachers were allowed to select up to five externalizers and five internalizers at Stage 1
rather than the typical three each. The study began with 189 children, and the number of
participants was continuously narrowed as the Kindergartners progressed through the
typical Stages 1 through 3. A Stage 4 was added for the 82 children remaining. They
were matched with each other by gender, scores, teacher, etc. and then randomly assigned
to either a control group or a Parent-Teacher Action Research (PTAR) team. PTAR teams
worked together to design and implement interventions and plans specific for each
referred child. After two years, the intervention group showed significantly fewer
problems than the control group, as reported by the parents and teachers on several
different report forms.
As RtI has gained popularity, so has the research on reading and behavior,
common places to start when implementing a schoolwide program of behavior and
academics. Two articles focused on these areas and reported the use of the SSBD as the
behavioral screener. In 2004, a group of researchers conducted screening (which included
conducting the first two stages of the SSBD or ESP, depending on age) in five urban
schools and monitored change over three years (Kamps et al., 2004). Results related to
behavior showed that students who had a behavior risk, academic risk, or both types of
risk made the least progress in oral reading fluency, although those with only behavior
risk made the most progress of the three, while those with academic risk made less
progress, and students facing both types of risk made the least progress of all.
In another study (Trout, Epstein, Nelson, Syhorst, & Hurley, 2006), Kindergarten
and first graders were screened across nine participating elementary schools in a
23
Midwestern city using the ESP and SSBD for behavior (depending on age) in addition to
the Woodcock Reading Mastery Tests-Revised (WRMT-R; Woodcock, 1998). Complete
data sets were gathered on 195 of the original 247 following parental permission. Based
on the data, clusters were formed to represent the various groups and then the clusters
were validated using split-half procedures and external criteria. The result was
confirmation of the five distinct groups the researchers titled “broad risks,” “academic
achievers,” “primarily behavior,” “primarily academic” and “extreme behaviors.” Prior to
clustering, only behavior concerns were obvious within the total population using the
maladaptive behavior scale. No overarching reading risk was notable prior to clustering.
However, after the subtyping occurred and meaningful subgroups emerged, a host of
risks that were hidden within the overall population were revealed, including reading
risks. Also, researchers concluded that children in the primarily academic group, rather
than having behavioral difficulties, may actually benefit behaviorally from academic
interventions such as tutoring and may not actually need behavioral interventions.
Findings suggested that those with academic and behavioral risk are the children with the
greatest chance of being identified with Behavioral Disorders (BD).
Interest is also increasing in using the SSBD as a behavioral screener as part of
schoolwide multi-tiered programs to assist in identifying students in need of further
intervention and supports. In early intervention, studies were found that focused on using
the SSBD as part of a program called First Steps to Success (Carter & Horner, 2007 and
2009; Sadler & Sugai, 2009). First Steps to Success is a secondary or tier 2 early
intervention program designed to decrease problem behavior in young children. It always
utilizes the SSBD to screen and identify those in need of intervention and supports.
24
Recent studies add functional behavioral assessment to the program, resulting in a greater
impact than First Steps alone (Carter & Horner, 2007 and 2009). This program is
recommended to others as a secondary intervention (Sadler & Sugai, 2009).
At the elementary level, the SSBD has been utilized and written about by a few
noted groups: University of Washington in Seattle (Cheney, Walker, and colleagues),
Florida Atlantic University (Lago-Delello, 1998), and Vanderbilt University (Lane and
colleagues). The study by Lago-Delello (1998) looked at the classroom dynamics of
kindergarten and first graders who were identified as at risk using the SSBD.
Engagement, perception of teacher expectations, teacher attitudes and perceptions about
the students, and teaching methods used to accommodate the students were examined.
The study found that students at risk were generally rejected by their teachers (as
measured by a teacher interview), were perceived as having less ideal student qualities
(also as measured by a teacher interview), spent less time academically engaged, and
received limited accommodations by their teachers. Interestingly, at risk students did not
perceive that their teachers felt any differently toward them than toward the students who
were not considered at risk.
The Seattle group published articles in which the SSBD was used to identify
students in need of additional supports as part of schoolwide PBS systems. The first study
(Cheney et al., 2004) modified the SSBD at risk criteria to include risk as measured by
the SSBD and/or three other common scales (the Behavior Assessment System for
Children-Teacher Rating Scales-BASC; Reynolds & Kamphaus, 1998; and two
previously cited--the SSRS and BERS) in an attempt to increase the pool of those
considered at risk. In 2005, the group’s next study used the SSBD to screen, and schools

25
were trained to make data-based decisions using the ODR cutoffs (Walker, Cheney, Stage
& Blum). The SSRS was used to examine the level of problem behaviors and
functioning. The third and most recent used the SSBD alone as a screener (Cheney,
Stage, Hawken, Lynass, Mielenz, & Waugh, 2009). All students who were flagged
received additional support, such as through Check, Connect, and Expect programs or a
referral to the Student Study Team, as a result (Cheney et al., 2004; Cheney, et al., 2009;
and Walker, Cheney, Stage & Blum, 2005).
In Lane, et al., (2007), the SSBD screening was used in addition to non-
responsiveness to primary and secondary interventions to determine the need for tertiary
supports. Lane, Kalberg, Bruhn, Mahoney, & Driscoll (2008) proposed an entirely unique
use for the SSBD. They used the screener initially, and then again, to assess the same
students over time to measure both individual and aggregate change in risk. In doing so,
this screener became more of a schoolwide outcome measure than a student screener,
which is the first time this concept had been introduced.
Most recently, Young, Sabbah, Young, Reisser and Richardson (2010) used their
version of the SSBD (modified for middle schools) to examine gender differences. The
most striking finding of their study, found across all three years, were that males were
consistently nominated more often than females in Stage 1 with the ratio being 5:1 for
externalizers and 3:1 for internalizing behavior for total students nominated.
Additionally, PBS researchers affiliated with the state of Illinois, the University of
Kansas, the University of New Orleans, and the University of South Florida have made
recent presentations at national PBS conferences highlighting SSBD use as a behavioral
screener across the schools they support (Breen, Rose, Rose, & Thompson, 2009;
26
Iovannone & Christiansen, 2008; Morgan-D’Atrio, Naquin, Arthur, & Roussel, 2008; and
Sailor & Eber, 2007). However, many more schools and researchers continue to do
“business as usual.” Lane (2007) elaborates:
[D]espite the availability of screening tools at the elementary level, they are often
not integrated into regular school practices at the elementary level and, instead,
teacher judgment is the sole gate keeper for targeted support. (p. 151)
Although the SSBD is entering the field of PBS, the fact remains, “the most
widely used screener for risk of academic achievement failure resulting primarily from
social or behavioral problems is the frequency of office disciplinary referrals (ODR)”
(Sailor, 2009, p. 68).
Office disciplinary referrals (ODR).
Office disciplinary referrals have been defined as representing an event where:
a) a student engaged in behavior that violated a rule or social norm in the school, b) the
problem behavior was observed or identified by a member of the school staff, and c)
administrative staff delivered a consequence through a permanent (written) product that
defined the whole event (Sugai, et al., 2000, p.96).
To use ODR as a screener within the field of PBS, researchers and technical
assistance providers created a decision rule whereby students who get zero or one ODR
are considered typical and thus adequately supported by universal interventions; students
with two to five ODR are considered at risk and thus qualified for secondary level
supports, and, finally, six or more referrals warrant individualized support to be in place,
indicative of the tertiary level of PBS (Sugai et al., 2000; Horner, et al., 2005). These cut
scores, based on logic and also theoretical estimates, mirror the percentages found in the

27
field of public health--80% in tier 1, 15-20% in tier 2, and 1-5% in tier 3 (Horner, et al.,
2005).
Nelson and colleagues (2003) described the role of office disciplinary referrals in
the field of behavior, a role that goes beyond screening. They stated:
Administrative discipline contacts also play a significant role in the efforts of the
Office of Special Education Programs Technical Assistance Center on Positive
Behavioral Interventions and Supports to promote schoolwide positive behavioral
interventions and supports. Specifically administrative discipline contacts are
used a) to guide decisions about the initial development of primary, secondary,
and tertiary level interventions; b) to identify children in need of interventions and
supports; and c) as an outcome measure. (p. 249)
Basically, ODR (which are encompassed within the term administrative discipline
contacts, a term that also includes in- and out-of-school suspensions, expulsions,
detentions, and emergency removals) are used as a schoolwide lens at the macro level to
either establish or detect where systems level change is needed, as well as at an
individualized student level, a micro level, to screen and determine who is in need of
additional supports. Finally, ODR is used as an outcome measure to determine the overall
effects of PBS interventions, including change within the building and/or district. As a
result, ODR play a significant role in data-based decision making around schoolwide
positive behavior support. ODRs are embedded into both the practice and the research
surrounding schoolwide PBS. PBS thus relies on ODR and other administrative
discipline contacts to develop, screen, adjust, and measure outcomes.
28
The Technical Assistance Center on Positive Behavioral Intervention and Support
also supports the use of the School-wide Information System (SWIS; May et al., 2000), a
web-based computer program designed to enter and monitor ODRs. SWIS graphs
visually display patterns of ODRs for ease in data-based decision making. The makers
designed the program with the intent to control some sources of error by pairing the
system with technical assistance and oversight to ensure, as much as possible,
consistency across classrooms in what is considered an ODR. In doing so, they sought to
increase the effectiveness of the use of data (Irvin, et al., 2006). Sugai et al. (2000) agree
that a major part of their work, as researchers and technical assistance providers, is
assisting the school staff in implementing ODR reporting systems that are usable and
reliable because “[a]s the integrity of the office discipline referral monitoring system is
weakened, so is the integrity of the data to inform decision making” (p. 15).
The present review of the literature reveals an ongoing debate regarding the
validity of ODR in general as well as specifically for use at the systems level and for
screening. For this study’s purpose, the literature presented here is limited to those
studies that specifically have bearing on ODR use as a schoolwide screener or
information about the validity of ODRs that would affect the ability for their use as
screeners.
Literature on the use of ODR, specifically as a screener, is growing as researchers
attempt to add to the literature and make (or break) the case for validation. The literature
to date focuses on the two types of criterion validity (predictive and concurrent, which
include information on sensitivity and specificity) as well as social validity.
29
Criterion validity.
The two types of criterion validity are predictive and concurrent. Predictive
validity differs from concurrent in that it measures how one variable predicts another that
occurs several months or even years in the future. Morrison and Skiba (2001), note “[I]n
using disciplinary data for early identification, one is seeking to use the discipline event
to predict which students are likely to be at risk for violence or disruption in the future”
(p. 175). The following six studies, which include two literature reviews, demonstrate the
mixed results that researchers have reported about the predictive validity of discipline
referrals, but they are not meant to be an exhaustive search.
Tobin and Sugai (1996) described two exploratory studies related to challenging
behavior and discipline referrals, the first of which is relevant. The goal was to determine
events in grade six that would predict stable long-term referral patterns. Two criteria were
adequate predictors: students who, in the fall term of sixth grade, received two or more
discipline referrals for any reason or who received one referral for harassment.
Tobin and Sugai published an additional study in 1999 determining if sixth grade
school records predicted chronic discipline problems and examining high school
outcomes. The study had two significant findings. Their study showed stability of ODR
for misbehavior that started in middle school and continued through high school. For
example, sixth graders who were referred for violence related to fighting tended to
continue to receive the same types of referrals in eighth grade. Referrals in sixth graders,
even those for nonviolent behavior, correlated with of the use of harassing type violence
in eighth grade. Secondly, ODRs were predictive of high school difficulties in that sixth
grade males who received referrals for fighting more than two times or sixth grade

30
females who received even one referral for harassing were more likely to be off-track for
graduation in high school.
More recently, Rusby et al. (2007) completed a study of office disciplinary
referrals in first graders. They cited several studies tying discipline referrals to negative
academic achievement, evidence of misbehavior later on, and even violence and
subsequent conviction of crimes. In their study, office referrals in Kindergarten were a
stronger predictor of problem behavior in the first grade than socioeconomic status. Also,
ODR in first grade accurately predicted problem behavior as reported by teachers at the
end of the school year.
A study done by Sprague and colleagues (2001) examined forty-four students
who passed a multi-gated referral process related to factors such as teacher perception
that they were at risk for failure. Multiple points of data were gathered on these students,
including office disciplinary referrals and contact with the local department of youth
services (DYS). Correlations were calculated. Contacts with DYS and office disciplinary
referrals were only mildly correlated (ρ =.10) for the students with at least one DYS
contact (n=16) and negligible for the entire sample (r=.014). The highest delinquency
score for the 16 who had a DYS contact and frequency of ODR was moderately
correlated (r=.54); when it was calculated for the full sample, the severity score and
referral frequency was similar (r=.53). Based on these results, the researchers informally
suggested that there are three types of student offenders: a) those who offend in the
community but not in school, b) those who offend in school, but not the community, and
c) those who offend both places.

31
Both Morrison and Skiba (2001) and Nelson and colleagues (2003) reviewed the
literature related to office disciplinary referrals, suspensions, and referrals. Morrison and
Skiba found that “predicting from school discipline is not a univariate but a multivariate
process of prediction” (p. 175). They went on to list the many sources of variance. The
authors stated: “[W]hile student behavior is a salient contributor to disciplinary referrals,
so are teacher tolerance and classroom management skill” (p.177), in addition to a host of
other factors that muddy the waters, including local, state, and national politics and the
differences between schools based on their unique methods for handling discipline,
including variation related to administrative disposition, as well as within-school
differences based on individual skill at the classroom level. Additionally, the authors
presumed an underlying assumption of causal homogeneity when in fact there is existing
research that finds the contrary and alternately reveals there are various subtypes and
developmental trajectories instead (Loeber, 1996 and Morrison & D’Incau, 2000 as cited
in Morrison & Skiba, 2001). Finally, predictions are limited in that a considerable amount
of variance is unaccounted for, so false positives and negatives are more likely to be high.
This article adds to the evidence of multiple challenges associated with using ODRs as a
screener and the scholars concluded that these challenges result in compromising
accurate predictions of student behavior.
Similarly, Nelson and colleagues (2003), in their review of 23 articles that
included 20 independent samples, found that the predictive (and concurrent) validity of
administrative discipline contacts is relatively limited. They questioned what is actually
being measured due to the large number of false negatives and false positives. They also
found that the more severe behaviors in combination with other factors, such as grade
32
point average, were actually predictive of other acts of violence and school failure. They
also found a variety of school and individual variables influenced administrative
discipline contacts. For example, students experience more discipline contacts if they
have low achievement and limited abilities, if they are African American students, if they
receive a free or reduced-price lunch, or if they are male. This overrepresentation is a
source of error that can compromise predictive validity, but it also demonstrates the use
of ODR results in false positives, a topic addressed in studies of the sensitivity and
specificity of ODR.
Kern and Manz (2004) suggested that “construct validity studies should aim to
define the meaning of office disciplinary referrals through external validation with
related, psychometrically strong measures” (p. 53). Three studies have sought to do this,
examining the validity of ODR by measuring it against already validated screeners.
As described in the review of Systematic Screening for Behavior Disorders
(SSBD) literature above, Walker and colleagues (2005) screened students using the Stage
1 and Stage 2 of the SSBD (Walker & Severson, 1992). Seventy-two students from three
schools (two suburban and one urban, all from Washington State) participated in the
study. Both SSBD and referral data were collected, and the distribution of office
disciplinary referrals (ODR) was analyzed. The SSRS was used to examine the level of
problem behaviors and functioning. A majority of the students who were considered “at
risk” via the ODR system were considered externalizers via the SSBD, revealing that the
ODR-only system did not detect internalizing students. By using the ODR method to
screen, all twelve internalizers found through the SSBD screening (and then confirmed
through the SSRS) would have been missed, and therefore students with these behaviors

33
would not have received additional support. The authors recommended the use of both
schoolwide screening and monitoring of ODR to increase the number of students
identified as at risk and therefore receiving supports, although why they recommended
both methods instead of the SSBD alone is not clear. On its face, the ODR results of not
appear to provide any information not already provided by the data produced by the
SSBD. Additionally, this study appears to be the first to provide evidence for the cut
points or decision rules related to ODR, described above, which were previously only
grounded in theory. 1 The authors of this study found that one scale on the SSRS, Social
Skills, did not reveal differences between the cutoff groups, while another scale, Problem
Behavior, showed that students with two or more ODR had a mean score greater than one
standard deviation above those with zero or one ODR.
Nelson and colleagues (Nelson, Benner, et al., 2002) compared ODR to the Child
Behavior Checklist-Teacher Report Form (CBCL-TRF; Achenbach, 1991b) and found
that ODR has false negatives, particularly with internalizers. The actual percentages for
borderline false negatives ranged from 48.8 for the total problems subscale to 87.5 on the
Withdrawn and Somatic subscales. The percent of false negatives went even higher in
two cases--60% for total problems and 90.1% for Withdrawn when Clinical was
examined,--and decreased slightly for Somatic complaints (to 75%).
Another study, this one by McIntosh, Campbell, Carter and Zumbo (2009), found
fault with the Nelson et al. (2002) study, mainly that the ODR system was not systematic 1 Recall that, to use ODR as a screener, a decision rule had been created where zero or one ODR is considered part of the typical student population and thus adequately supported by universal interventions; students with two to five ODR were considered at- risk, qualifying them for secondary level supports, and six or more referrals warranted more individualized supports to be in place indicative of the tertiary level of PBS (Sugai et al., 2000; Horner, et al., 2005).
34
enough (i.e., the schools were not using SWIS or receiving the associated form of
technical assistance that goes with it. Therefore, there were no formal criteria for what
behaviors resulted in office referrals, the form to record ODR was open-ended, and there
was not regular training to monitor the fidelity of the referral system). Their study sought
to rectify some of these concerns as the researchers used the Behavior Assessment Scale
for Children-Second Edition Teacher Report Scale-Child Form (BASC 2-Reynolds &
Kamphaus, 2004) to determined ODR validity.
Their study included forty students, 88% of whom were European American, who
were selected from six schools. Each of these schools had implemented the SWIS system
for longer than a decade. These students were identified through the district’s usual
referral process, which was not described in the study. The authors used bivariate
correlations to examine the amount of shared variance between the two ways of
identification. The results indicated statistically significant strong correlations (r=.51)
between the Externalizing Composite scale and ODR and suspension, correlations much
stronger than found in the Nelson study. However, similar to the Nelson study, significant
correlations for internalizing problems were not found. The authors concluded that the
ODR method is an acceptable measure for screening for externalizing behavior. This
study, like Walker, et al. (2005), went into further detail in examining the ODR cutoffs.
The authors examined cut points for the ODR (zero or one, two to five, and six or more)
and found that, based on them, students had statistically significant behavior ratings
(Externalizing Composite scores). These studies showed that ODR are weak in
identifying students with internalizing behaviors.

35
Concurrent validity is one way to determine the degree to which the measure in
question is appropriately sensitive and specific. Sensitivity and specificity, together, refer
to the degree that a test accurately identifies a population without over or under
identification. Stated another way, it refers to the number of false positives, false
negatives, true positives, and true negatives to see if they are of acceptable values. If false
positives are clustered around specific groups, then they can be a source of
overrepresentation. Skiba (2002) recognizes 25 years of studies with consistent results
around racial and economic bias, specifically regarding suspension and expulsion. The
following studies provide support that there is, indeed, overrepresentation in the area of
discipline within education for the following groups: racial minorities, those with low
socio-economic status (SES), those with disabilities, and males.
Skiba and his colleagues published several articles that pose reason for concern
about overrepresentation of various subgroups (Morrison & Skiba, 2001; Skiba, 2002;
Skiba, Michael, Nardo, & Peterson, 2002; and Skiba et al., 1997). For the first study
(Skiba et al., 1997), data were drawn from over 11,000 students from nineteen middle
schools in a large urban public Midwestern district and their ODR were analyzed.
Findings indicated that students were more likely to receive an ODR if they were in one
of the following categories: African-American, recipient of free or reduced cost lunch,
recipient of the label emotionally handicapped, or male. Similar patterns were noted
when one school was analyzed in more depth. Skiba and colleagues (1997) stated that
overrepresentation of those in any of the above listed categories is one of the most
consistent findings in school discipline research and cited literature to support the
following subgroups: males (Panko-Stilmock, 1996), those with a special education label

36
(Cooley, 1995), those of minority ethnicity (Children’s Defense Fund, 1974; Costenbader
& Markson, 1994; Massachusetts Advocacy Center, 1986; McFadden, Marsh, Price, &
Hwang, 1990; National Coalition of Advocates for Students, 1986), and those who have
low SES (Brantlinger, 1991).
Morrison and Skiba (2001) and Skiba (2002) provided additional evidence that
the issue of overrepresentation in discipline is a reoccurring theme. These articles
provided ample supporting documentation for overrepresentation of minority and low-
income students (Kaeser, 1979; McCarthy & Hoge, 1987; Shaw & Braden, 1990; Skiba,
et al., 2002; Skiba et al., 1997;; Thornton & Trent, 1988; Wu, Pink, Crain & Moles,
1982) as well as students with disabilities (Leone, 1994; Morrison & D’Incau, 2000; SRI
International, 1997). Overall, students in these categories were found to be more likely to
receive harsh punishments, such as corporal punishment and suspension, and that harsher
consequences may be administered for less severe offenses. When African Americans
were receiving more (usually two to three times more; Costenbader & Markson, 1994;
Glackman et al., 1978; Kaeser, 1979; Lietz & Gregory, 1978; and Taylor & Foster,
1986)) and harsher punishments (Gregory, 1996; Shaw & Braden, 1990) than their white
peers, neither higher rate of misbehavior (McCarthy & Hoge, 1987; Wu et al., 1982) or
economic status (Skiba, et al., 2002; Wu et al., 1982) accounted for these differences.
Skiba et al., 2002 specifically looked at school discipline and overrepresentation.
They found that racial and gender disparities were stronger factors than SES for
administrative discipline contacts (referrals, suspensions, and expulsions). In fact, racial
and gender differences were still present when the socioeconomic status was controlled.

37
The study also found that though boys did, in fact, engage more frequently in disruptive
behavior, the same explanation did not account for overrepresentation of race.
Finally, Skiba (2002) examined literature on school discipline and
overrepresentation specific to individuals with disability in light of IDEA regulations.
The review of literature found that national surveys and studies support that students with
disabilities represent around 20% of all students suspended, a much higher percentage
than those students in the typical population (11%; Leone, Mayer, Malmgren, & Meisel,
2000). Skiba questioned whether regulations were protecting students with disabilities
from punishment related to their diagnosis since that does not appear to be the case;
however, he mentioned that one might argue at least some of the students’ suspensions
may be warranted if the behavior is extreme, which may be the case for students with
EBD.
Studies on overrepresentation also exist apart from Skiba and colleagues. Rusby
and associates (Rusby et al., 2007), already cited above with regard to predictive validity,
also found large overrepresentation of office referrals in males. In fact, males received
four times as many office disciplinary referrals than their female counterparts. The
authors also found that the families of first grade students considered at risk had a
significantly lower SES than their peers, though SES did not predict the number of
referrals. Schools in the study with low SES, defined as those with a higher percentage of
students receiving free or reduced lunches, and large class sizes actually had fewer
discipline referrals than schools with lower percentages. These results did not support
findings from a previous study by Winbinger, Katsiyannis, and Archwamety (2000).

38
Kern and Manz (2004) used Messick’s unified version of validity (1995) to
examine multiple components of ODR validity, including construct and social, as they
pertain to school-wide support. They shared some concerns. For example, they stated:
[A]lthough a seemingly logical and accessible outcome indicator for school-wide
behavior programs, the actual construct that is being measured by office
disciplinary referrals has not been empirically demonstrated…[and is] based upon
an untested assumption that consistent, linear connection exists between student
behavior and the imposition of this disciplinary procedure. In reality, however
ODR reflect…varying conditions. (p. 52)
As a result of this, some researchers have stated that the best use of office disciplinary
referrals (ODR) is actually for detecting change within schools, and, consequently, they
discourage the use of ODR in-between school analyses. Kern and Manz disagree, noting
the same concerns that prevent ODR use in between-school analyses also prevent its
valid use for within-school analyses. If the instrument does not measure what it is
intended to measure, then it does not do much good in any function, including as a
screener. As a result of the many sources of variability that can enter the equation, Kern
and Manz cited additional studies’ findings of disproportionality similar to those already
mentioned.
Social validity.
Social validity can be defined as user perception of usefulness, ease of use, cost,
and overall feasibility. Lane et al. (2010) stated that “even if an instrument is
psychometrically sound, it is less likely to be employed as part of regular school practices
if it is too resource intensive with respect to personnel, time, materials, or money”

39
(p.101). Kern and Manz added, “[P]rograms are destined for failure…[if they are] not
acceptable to consumers” (2004, p. 54). Despite how important social validity is, only
one study under review examined this question specific to the use of ODR. Importantly,
however, the social validity of a schoolwide PBS system has been the subject of multiple
studies (such as McCurdy, Mannella, & Eldridge 2003; Metzler, Biglan, Rusby, &
Sprague, 2001; Nelson, 1996; Nelson, Martella, & Marchand-Martella, 2002; and Taylor-
Green et al., 1997, all cited in Kern & Manz, 2004). Irvin et al. (2006) employed
Messick’s unified construct of validity (1988) to frame their social validity study to
determine perception and use of ODR (more specifically the SWIS system), considered
Evidential Use under Messick’s framework. The related question under Messick’s
framework is: what is the empirical evidence justifying actual uses, usefulness, and social
validity of ODR measures in schoolwide contexts? The following are examples of
questions asked in the Irvin et al. study: Who does SWIS ODR data entry? How often are
ODR entered in the database? What are the associated costs in time and effort per week?
How frequently do school staff members access the reports and who uses the reports?
How do users associated with data entry and report use evaluate the amount of effort to
use them? How do SWIS users evaluate the usefulness of the SWIS system relative to
other methods of organizing and summarizing the data? Users from twenty-two
elementary schools and ten middle schools responded, indicating that the SWIS system
was efficient and effective for these purposes.
Conclusion
While the validity of office disciplinary referrals (ODR) for use of screening
remains under debate, the literature review reveals agreement on three conclusions. First,

40
ODR is more appropriately used as either an outcome measure to predict change or a way
to make data-based decisions around primary, secondary, and tertiary systems as a
screener. For example, Morrison et al. (2004) concluded that
the value of office referral data, while limited in terms of a prediction of extreme
aggressive or violent behavior in its primary use for milder form of school
disruption, may rest in the ability to describe the day to day behaviors that detract
from the overall safety of a school campus….in this case, office referrals act as an
indicator of the school’s response to the student (p.41-42).
The second item that seems to garner agreement is the fact that ODR will show greater
validity for any purpose if ODR data collection is systematic and removes as much
sample variance as possible. Finally, a majority of the researchers in the field believe that
the social validity benefits of using ODR as a universal screener outweigh the concerns
presented in the literature thus far. As a result, they will continue to use it until research
or practice convinces them otherwise.
The purpose of this study is to determine if ODR has acceptable validity, as
measured against the already validated SSBD, for use in screening and identifying
students in need of additional behavior support. Acceptable validity is indicated if the
measure has appropriate sensitivity and specificity so as to not to generate too many false
positive or negatives that lead to overrepresentation of certain subgroups. Also of concern
is the issue of false positives in discipline, specifically the overrepresentation of students
of minority ethnicity, those with special education labels, males, English-language
learners, or those from families who have low socio-economic status. Any of these cases
can result in detrimental social consequences, such as exclusion.

41
The literature reviewed here supports the need for schoolwide screening as part of
an RtI model. The literature also supports the validity of the Systematic Screening for
Behavior Disorders (SSBD) as a valid screener. Studies undertaken on the validity of
ODR, however, show mixed results. While some researchers conclude that office
disciplinary referrals are appropriate for a variety of uses, including screening, others
hypothesize, taking a macro perspective, that using them to determine needs, set up, and
evaluate secondary and tertiary systems is the most appropriate use; finally, others argue
that office disciplinary referrals are not valid in any form due to their complex nature.
Those who do support their use as a screener believe that the more systematized the
referrals system is, the more valid the data and therefore the more accurate the decisions
based on those data.
Study Questions
Three areas are addressed in this study to determine if the use of office
disciplinary referrals (ODR) can serve as an effective screener for behavioral risk. First,
does ODR have adequate sensitivity and specificity as measured against the Systematic
Screening for Behavior Disorders (SSBD)? Second, what are the social and educational
consequences of using an ODR measure as a schoolwide screener? Lastly, descriptive
demographic information is used to provide additional information about the SSBD and
ODR methods of screening.

42
CHAPTER 2: Methods
Participants
Participants in the study come from two schools within the same district. These
schools were chosen because they were already working with the University of Kansas as
part of the K-I Center Tertiary Model Demonstration Project (Wayne Sailor, co-PI). This
project was supported by a grant awarded by the Office of Special Education Programs
(OSEP) and was scheduled to run from January 2005 to December 2010. The project was
being undertaken in partnership with the Illinois Positive Behavior Support and
Intervention Statewide Network, overseen by Lucille Eber (co-PI). The purpose of the
model demonstration project was to create a national training and technical assistance
model in Kansas and Illinois schools to address the issues of establishing a sustainable,
systemic approach to building school/district capacity to support students with complex
behavioral/emotional (as well as academic) needs within school-wide systems of positive
behavior support. The K-I Center operated with a strong RtI logic model, incorporating
multiple interventions; merging mental health and school-wide positive behavior support
with data-based, decision-making at the school site level; and using multiple levels of
ongoing assessments (both academic and social/behavioral), with a strong capacity-
building, scale-up, and dissemination approach.
All schools involved in the project from both Kansas and Illinois routinely
completed the Systematic Screening for Behavior Disorders (SSBD) during an all school
in-service. Two schools in Kansas, in the same district, joined the study in the first year,
and then two additional schools from a different district in the state joined the subsequent
year. Given their longer history of implementing schoolwide PBS, the first two schools
43
were chosen to be part of this study. The district was fairly large, serving 20, 597 students
in 31 elementary schools (grades K-5), eight middle schools (grades 6-8), four senior
high schools (grades 9-12), an academy of arts and science (grades 8-12), two alternative
schools, and an area vocational technical school. The district served an ethnically and
racially diverse and low socio-economic population.
The two urban elementary schools served grades K-5. Enrollment at the two
schools fluctuated greatly between 200 and 300 students due to a large transient
population. A specific breakdown of each school’s subpopulations can be found in Table
1.

44
Table 1
Aggregate Demographic Data by School
School A B
Total Population 239 248
Male 45.2% 57.7%
Female 54.8% 42.3%
With Disability 8.4% 10.1%
English-Language Learners 5% 37.1%
African American 54.8% 56%
Hispanic 9.6% 38.3%
Caucasian 30.1% 2.4%
Other Ethnicity 5.4% 3.2%
Economically Disadvantaged 59.8% 94%
Made AYP? Yes Yes
Number of ODRs 508 82
Implementing PBS since 2000 2006
SET Score (Total/Expectations Taught) 77/.7 77.5/.8
45
Demographic and office disciplinary referral (ODR) data were collected on all
487 students. However, the sample was narrowed for several reasons. First, the SSBD is
normed on students in grade one through five. As a result, three full Kindergarten
classrooms were removed (n=30, 29, and 24). Secondly, both of the schools in the study,
to some extent, had combined grade classrooms. School A had four such classrooms, two
of which were split between Kindergartners and first graders. To maintain consistency,
teachers sorted and ranked their entire roster of students regardless of grade, and those
who were Kindergartners were simply removed from the study and analysis (n=11 and
n=10). School B’s Kindergarten classrooms were not multigrade classrooms, so this did
not affect their data. Altogether, removal of Kindergarten aged students resulted in the
removal of 104 students.
Additionally, the sample was further narrowed due to absence during the in-
service meeting where the SSBD was administered. A fifth grade teacher in school A was
absent and therefore the data were unable to be obtained before the end of the year when
he/she no longer worked as a teacher for this school (n=27). Also, one school (school B)
chose not to have fifth grade teachers (n=17 for each of two classrooms) participate
because students in those classes were moving on to middle school in a few short months
and the administrator did not feel that completing the SSBD would be a valuable use of
their teachers’ time.
The last reason for narrowing the sample was due to a teacher not following
instructions. This teacher did not label the students in the classroom “internalizers” and
“externalizers” and then rank them and progress with the top three in each category.
Instead, likely for the sake of time, he/she skipped some steps and identified only one

46
internalizer and seven externalizers, leaving out the remaining students. Since a wide net
was not cast and six students were not advanced to Stage 2, it was not possible to say the
students not included (n=7) “did not pass Stage 1” or “did not pass Stage 2.” No
information about them was available, and therefore they had to be removed from the
analysis.
In the end, the sample totaled 315 students for whom SSBD, demographic, and
ODR data were able to be collected. For school A, eight out of ten classroom teachers
completed the SSBD screening and had their data included, totaling 167 students. For
school B, eight out of twelve classroom teachers completed the SSBD screening on their
students and had their data included, totaling 148 students.
Procedures
After securing university and district approvals, de-identified SSBD and
demographic data were collected as part of a larger study. As part of the school plan, the
school began administration of the SSBD in the spring and continued it each fall
thereafter. The tool was introduced to the faculty during a regular in-service in April.
Teachers were asked to rank all of their students using gates 1 and 2 of the SSBD. In
every case, each teacher ranked only students who had been in his or her classroom for
longer than one month (per SSBD guidelines).
The teachers filled out the SSBD on the computer, which was the exact same as
the published paper version (in content, order, Likert scale, etc). The only difference was
that this computerized version, because it was formatted in the familiar Excel software,
was perceived by project staff to be less overwhelming for teachers. It was thought there
was a chance that the paper version would appear thick and cumbersome, potentially
47
overwhelming teachers or causing them to rush. The computerized version was also self-
scoring, which provided for immediate results. The electronic version of the tool was
created and used internally. It was not distributed or made available to anyone outside of
the K-I project.
Teachers used codes instead of their names and their students’ names: therefore,
data were protected for confidentiality from the onset (“de-identified”). The protected
data were copied from the computers to a thumb drive and then deleted instantly from the
computer as well as the computer’s “recycle bin.” Sheets that contained the class roster
and corresponding codes used by the teachers were collected and shredded immediately
following the in-service. The data were then put on a password protected computer,
deleted from the thumb drive, and translated into an Excel database.
Additional demographic information was then collected to assist in the analysis as
follows: student gender, ethnicity, age, GPA, grade, free/reduced lunch status, special
education status, number of office referrals in the current year, absence/tardy rate,
whether students could be considered as needing either secondary (two to five ODR) or
tertiary level PBS supports (six or more ODR) and corresponding approximate office
referral dates, whether they were referred by their teacher for any secondary or tertiary
level PBS supports and corresponding approximate date, whether the students passed gate
1 or gate 2, specific scores on the Stage 2 subscales (the critical events index and
combined frequencies), whether the student was considered an externalizer or
internalizer, and (if possible) frequency with which the student saw the nurse. This
information was added to the database. In each case, the principal’s secretary entered the
data into a version of the database that contained student names to minimize error. The

48
information was transferred from the school’s existing database directly into this Excel
spreadsheet. A member of the K-I grant staff from the University of Kansas who was
authorized by the Internal Review Board (IRB) to see identifiable information within the
district received the spreadsheet and immediately changed the names back into codes.
Instrument
The Systematic Screener for Behavior Disorders (SSBD; Severson & Walker,
1992), as discussed, is a behavioral screener intended to be fairly easy for teachers to use.
The SSBD was first published in 1990, with a second edition in 1992. Studies describing
the trials and field testing were also published around same time and show strong
psychometric properties (Todis et al., 1990; Walker et al., 1994; Walker et al, 1988;
Walker, et al., 1990). Additionally, a great deal of evidence for the validity and reliability
of this measure exists as described in Chapter 1 (Forness, et al., 1996; Merrell, 2003;
Sprague et al., 2001; Todis et al., 1990; Walker et al., 1994); therefore, only a brief
summary will be provided here.
The SSBD was validated using a variety of analyses. It was found to correctly
identify and differentiate those with clinically significant externalizing symptomology,
those with clinically significant internalizing symptomology, those with certified
emotional disturbances, and typically developing students. Both the externalizers and
internalizers had extremely different profiles, powerful subject/group differences, and
criterion-related validity coefficients between the SSBD and archival school records
(Walker & Severson, 1990). The results of these early studies revealed the SSBD to be a
sensitive measure for finding students with known behavior disorders. The stability of
group membership (internalizing, externalizing and the comparison groups) analyzed by

49
chi square analysis showed results significant well beyond p <.01 for both internalizing
and externalizing populations (Walker et al., 1990).
Coefficient alphas for the scales were reported to be greater than .90 with the
sample. Inter-rater reliability coefficients were found to be .89 to .94 for externalizing
behavior and .73 to .88 for internalizing. The test-retest reliability coefficients were .76
for externalizers and .74 for internalizers (Walker & Severson, 1990). Internal
consistency was estimated above .80 (r=.82-.88) for Stage 2 subscales Adaptive and
Maladaptive Student Behavior. Elementary test-retest reliability for Stage 1 reported
ranking of internalizing behavior as .72 and externalizing behavior as .79 (Walker &
Severson, 1992). All of these demonstrate excellent psychometric properties.
Concurrent validity testing was done with the three sub-scales (maladaptive,
external, and internal) of the Achenbach child behavior checklist (CBC) for Stage 2
(Walker et al., 1988). Temporal stability of Stage 1 and 2 was tested and the mean test-re-
test rank order correlations were determined on the both externalizing and internalizing
teacher rank order lists. It was found that the average externalizing rho was .88 and the
average internalizing rho was .74. Pearson r’s were computed across twice, with a one-
month interval between computations, for SSBD Stage 2 rating instruments. The
correlation for the Critical Events Index was .81, for the Adaptive Behavior Rating Scale
the correlation was .90 and for the maladaptive subscale, the correlation was .87. All
were statistically significant at p<.01 (Walker et al., 1990).
High levels of construct validity, as well as moderate to high correlations with
other scales related to behavior (e.g. Walker-McConnell; r=.44-.79) show the SSBD to be

50
valid (Walker & Severson, 1992). A complete summary of the literature that led to these
results can be found in Chapter 1.
As part of Stage 1 of the Systematic Screening for Behavior Disorders (SSBD),
teachers take their rosters and divide their class lists into 10 “externalizing” students and
10 “internalizing” students based on a multitude of provided examples. Next, teachers are
asked to rank the students in each category, with the number one ranked student being the
student who is most representative of the description. The top three students in each
category (externalizing and internalizing) are considered to have passed gate 1 (see
Figure 2) and are officially in SSBD Stage 2. The teacher then fills out a combined
frequency index (adaptive and maladaptive) and a critical events index on each of the six
students. Based on those scores, anywhere from one to six of the students may pass gate 2
and be considered in SSBD Stage 3. See Figure 2 for a description and clarification of the
various stages and gates associated with the SSBD.

51
Pool of Regular Classroom Students
Stage 1 Teachers take the
class list and determining the top 10 externalizers & internalizers. The 3 highest of each
pass gate 1 to Stage 2
Stage 2 Teachers rate each of the 6
students on scales. Students who exceed
normative criteria pass gate 2 to Stage 3
Stage 3 Direct observation
of remaining students occurs
(n=0-6 per classroom) in classroom and on playground.
Those that exceed criteria pass gate 3
Figure 2. SSBD gates and stages.
As illustrated in Figure 2, the SSBD does have a Stage 3 protocol that involves observing
students during instructional and free play time (such as on the playground and at lunch

52
time); however, research shows that students who pass through Stage 2 can be considered
at least at moderate risk for developing behavior problems (McKinney et al., 1998). Due
to the preventative purpose of using SSBD as a screener, it makes sense to cast a wider
net and focus on all of the students who pass Stage 2, rather than further narrowing down
the group that will receive intervention; therefore Stage 3 observations were not used as
part of this study.
Study Questions and Data Analysis
This study is non-experimental and descriptive. It was designed to determine
whether office disciplinary referrals (ODRs) have acceptable validity for screening and
identifying students in need of additional behavior support. Three different analyses will
be used to determine ODR validity based on Messick’s theory of validity (Messick, 1989,
1996a, 1996b). These are sensitivity/specificity of using ODR as a screener, social
consequences resulting from their use and interpretation as a screener, and general
demographic/descriptive information.
Validity is a broad term that generally means that a test is used or interpreted in
the manner in which it was intended or can answer the question it was intended to
answer. Traditional views put validity into one of many categories, including content,
criterion, and construct. Construct validity refers to a test’s representation of reality
according to some construct. This can be broken down into convergent validity
(simultaneous measures of the same construct are correlated) or discriminate validity
(tests do not correlate with measures they should not). Criterion means the test correlates
with standards. There are two types of criterion validity: predictive and concurrent.
Predictive validity means measures can predict future values of a criterion (some later

53
measure), whereas concurrent validity means a measure correlates with other tests
conducted simultaneously or within a very short period of time. For predictive validity,
some period of time—months or even years—passes between the two measures. Content
validity refers to whether all aspects of a construct are being measured.
Messick (1989, 1996a, 1996b) has argued that the traditional concept of validity
was incomplete and fragmented. He proposed a more comprehensive and unified view of
validity. Though this view recognizes value in the previous approaches to construct
validity, he added to those concepts and unified them, placing a greater emphasis on
score meaning and relevance to the test’s intended purpose, how the test is used (or
misused), and social consequences, including those that go beyond the intended and into
the unintended, and potentially negative, consequences. He described six components
that come together, as opposed to being separate types, to comprise validity, and they
must be viewed in combination for all educational and psychological measurement
because they are interdependent and complementary. Additionally, for something to be
valid, both convergent and discriminant evidence are required. However, it is important
to note that validity is not a black or white construct but rather a question of degree. The
result is a more complete view of validity, a unitary concept, which is how it is now
recognized (American Psychological Association, AERA, & NCME, 1985 as cited in
Messick, 1989).
The six components Messick describes are: content (related to how relevant and
representative the content is, as well as the technical quality of the content), substantive
(related to theoretical rationales for consistencies that are observed in responses and
evidence these theories are correct), structural (the fidelity of scoring), generalizability

54
(how well score interpretations can be generalized to the population, and across
populations), external (convergent and discriminant evidence from multitrait-
multimethod comparisons, as well as relevance and utility), and consequential (the results
or social consequences of the assessment-both positive and negative) (Messick, 1995).
Messick (1998) believed that four questions encompass his approach. First, what
is the evidential basis for justifying interpretations of the measure? Second, what is the
evidential basis for the relevance, utility, and uses of the measure? Third, what is the
empirical evidence justifying the actual use, usefulness, and social validity? Finally, what
are the social/educational consequences that result from the uses of the measure?
Because of scientific researchers’ acceptance of Messick’s modern view of validity as
being more complete than the traditional view of validity, this study employed his
method. This study is not large enough in scope to address all of these components but
will investigate some of the pieces of Messick’s first and final questions. The exact study
questions, in addition to descriptive statistics, are described in detail below.
The overarching question this study aimed to answer is: can office disciplinary
referrals (ODR) serve as a screener for behavioral risk? The first question addressed by
this study was, what is the evidential basis for justifying interpretations of ODR as a
screening measure? Specifically, does ODR have adequate sensitivity (rate of true
positives) and specificity (rate of true negatives)? In this study “true” is defined as the
results of the SSBD, so true positives occur when the ODR method flags students as
being at risk behaviorally (i.e. students receive at least two to five ODRs) when the
SSBD has flagged these same students as being a behavioral risk (i.e., passing gate 2).
True negatives occur when the ODR method determines students to be not at risk

55
behaviorally (i.e. students received less than two ODRs) when the SSBD has also found
these students not to face behavioral risk (i.e. not passing gate 2).
These analyses were completed by contrasting the ODR data from the 2007-2008
school year (the same school year the SSBD data, gathered in April, 2008 references) and
examining the sensitivity and specificity using the SSBD classifications as the “correct”
answers. A sensitivity/specificity analysis was performed using SPSS statistical software
package, version 18.0 (specifically using the CrossTabs procedure within the descriptives
menu).
While a general principle states that the higher the levels of sensitivity and
specificity, the greater the accuracy, what is considered to be an acceptable level of each
is unique to that particular situation based on the potential consequences. Ideally, a
measure would have both of these qualities; however specificity and sensitivity relate
directly to the number of false positives and false negatives (for example, the proportion
of false positives can be calculated by take one minus the rate of true negatives) so there
is a tradeoff and more sensitive tests result in more false positives (Frey, 2006).
Consequently, there is a necessary balancing of the two types of errors given the specific
situation. This is in alignment with Messick’s theory of including the social and
educational consequences as part of validity.
The results are listed as three separate figures--one for the overall population that
passed Stage 1 (considered potential internalizers and externalizers), one for those who
passed Stage 1 and were initially labeled internalizers, and one for those who passed
Stage 1 and were initially labeled externalizers. To balance these figures, the proportion
of false positives and false negatives are also reported. Because no level of false positives

56
or false negatives is desirable, statistical significance was determined by examining
whether the rates of false positives and false negatives were statistically different from
zero. See Figure 3 for exact content of the two by two boxes. Additionally, Phi was
reported to show whether or not there was a relationship between the two methods of
screening, as well as the strength of that relationship (analyzed in the same manner as a
correlation).
ODR does not indicate behavior risk (zero or
one ODR)
ODR indicates behavior risk (2 or more ODRs)
Student actually does not have behavior risk determined by not passing Stage 2 on the SSBD
Specificity True Negative X% N=X
False positives X% N=X
Student actually has behavior risk as determined by passing Stage 2 on the SSBD
False negatives X% N=X
Sensitivity True positive X% N=X
Figure 3. Sample table of ODR results.
Both specificity and sensitivity analyses fall under Messick’s category of
evidential interpretation (What is the empirical evidence justifying interpretations of the
meaning of ODR as a screener?) and can be compared to, added to, and can also extend
the results provided in the existing literature (McIntosh et al., 2009; Nelson, Benner, et
al., 2002; and Walker et al., 2005).
The second question of interest in this study relates to the fourth question under
Messick’s framework: what are the social and educational consequences of using ODR
measures as a schoolwide screener? This question was answered in two different ways.

57
First, the levels of false positives and false negatives were examined due to the
educational and social consequences that could potentially result for students—either the
consequences that occur from being incorrectly labeled as having a behavior risk or those
that occur when students are not correctly identified and therefore do not receive the
appropriate support as a result. Secondly this question was answered by examining
whether under and overrepresentation exists with various vulnerable subpopulations:
males, those with special education labels, those with free/reduced lunch status, those
who are English-language learners, and those with the following ethnicities: African
American, Caucasian, and Hispanic. To determine this, the rates of false negatives and
false positives of the various subgroups were compared to the rate of false negatives and
false positives in the overall population to determine whether the differences are
statistically significant. Statistical significance was determined by examining whether the
rate of false positives or false negatives in the subgroups were each higher (at a level that
was considered statistically significant, p<.01) than the rate of false positives or false
negatives in the overall population.
Both questions one and two above will supplement the findings of the social
validity study of screening in Irvin, et al. (2006) that used Messick’s approach to validity
to answer evidential use (i.e., what is the empirical evidence justifying actual uses,
usefulness, and social validity of ODR measures in schoolwide contexts?).
Definition of Variables
The variables include information that is objective, such as grade, gender,
ethnicity, age, free/reduced lunch status, and special education status. These data were
obtained from a data management system used by the school district. The number of

58
office disciplinary referrals (ODR) was also obtained from the management program.
However, this information can be considered much more subjective, as mentioned in
Chapter 1. Whether a student receives an office referral for a particular behavior depends
upon a variety of factors, as the literature has shown, including which teacher witnessed
the offending behavior and which school the student attended. In this study, one school
utilized the SWIS program and one did not. Regardless, some sources of error and
variability may not be able to be remediated through use of SWIS and the associated
technical assistance. This remains to be seen, and in some part is answered by the results
of this study. The absence/tardy rate is another variable that cannot always be considered
reliable. For example, because absences are not always recorded or recorded accurately,
some students might be marked as absent when they are actually tardy.
Whether students hit traditional markers using office referral numbers (and are
therefore considered as needing additional support--either secondary or tertiary level
PBS) was entered based on the number of ODR. For example, based on the previously
described literature, if the data indicated a student received two to five total ODR, then
that student was coded as “at risk” or in need of secondary interventions under the ODR
method of screening. This information was an extension of data previously collected
from the student management system. If the school’s data system had the capability, the
corresponding dates that the student received his or her ODRs were noted.
Additionally, if the schools maintained records on visits to the nurse, as one did,
this information was obtained in the form of the number of times the nurse was visited.
The source of this information is unclear; however the school did keep records of this
information, and therefore it can be considered somewhat reliable.
59
The Systematic Screening for Behavior Disorders (SSBD) results were also
recorded. Teachers completed the SSBD in the Excel program, which scored the
subscales automatically. Information about whether the student was considered an
externalizer or internalizer initially by his or her teacher, what ranking the student held,
whether the student passed Stage 1, what scores the student received on the subscales,
and whether the student passed Stage 2 was recorded. The author transferred this
information into a file so it could be analyzed. Although this information was obtained
through teacher report and is therefore somewhat subjective, because the SSBD has
strong psychometrics, the information was considered reliable (see Chapter 1). Reliability
of data entry was not assessed for the demographic information entered or the SSBD
scores entered into the final Excel sheet for analysis.
Summary
The present study was undertaken to determine whether screening using office
disciplinary referrals (ODR) has acceptable validity when measured against the
previously validated Systematic Screening for Behavior Disorders (SSBD). Both tools
are currently used to screen and identify students in need of additional behavior support.
It is important to determine if ODR have acceptable validity as a screener since the field
has expressed continuing interest in using ODR as a universal screener because the
system is readily available and therefore teachers would not be asked to perform
additional screening. This study also addresses some of the concerns about ODR use. If
ODR shows adequate sensitivity and specificity using the SSBD as a reference measure,
and if social consequences resulting from their use do not present a problem, then
continuing to use ODR would be acceptable.

60
While the present study lacks the scope needed to end the debate regarding the
validity (or lack thereof) of ODR as a universal screener, it nonetheless provides a
significant contribution to the growing body of research and can serve the purpose of
determining whether a large-scale study is warranted based on this small descriptive
sample.

61
CHAPTER 3: Results
The overarching question this study aims to answer is: can office disciplinary
referrals (ODR) serve as a screener for behavioral risk? To do this, the Systematic
Screening for Behavior Disorders (SSBD) results (internalizer, externalizer, or typical as
determined by passing Stage 2) serve as the “correct” answer and the ODR as a screener
was measured against it.
Descriptive Results
As part of this study, the descriptive demographic information was analyzed in
order to learn more about the SSBD and the ODR screening methods as well as to
examine overall correlations. The first sub-question was: what patterns did the schools
yield as a result of the SSBD? Nine externalizers were identified as passing Stage 2 for
school A, which accounted for 3.8% of the school’s population. At school B, 17 students
passed Stage 2 as externalizers for school B, accounting for 6.9% of the school’s
population. The numbers were lower for internalizers. Five internalizers were identified
as passing Stage 2 for school A (2.1% of the population screened) and eight internalizers
were identified as passing Stage 2 for school B (3.2% of the population screened). The
characteristics of students identified through the use of the SSBD and ODR are identified
in Table 2. Not all subgroups are represented in their entirety since each subgroup totals
100%. For example, for School A, 18.4% of those identified at risk using the ODR
method were individuals with disabilities, so it can be inferred that the remaining 81.6%,
were those without disabilities.

62
Table 2
Breakdown of Subgroups for Each School and Screening Method
Of those At Risk Per
ODR
Of those At Risk Per
SSBD
School
A
School
B Total
School
A
School
B Total
African American
69.4% 80% 71.9% 57.1% 84% 74.4%
Caucasian 24.5% 0% 18.8% 31.4% 0% 12.8%Hispanic 4.1% 13.3% 6.3% 0% 16% 10.3%
Males 77.6% 93.3% 81.3% 78.6% 84% 82.1%Females 22.4% 6.7% 18.8% 21.4% 16% 17.9%Low SES 73.5% 100% 79.9% 78.6% 92% 87.2%
ELL 4.1% 13.3% 6.3% 0% 16% 7.1% Disability 18.4% 20% 18.8% 7.1% 16% 12.8%
Question One and Respective Results: Sensitivity and Specificity Analysis
The first question addressed by this study is: What is the evidential basis for
justifying interpretations of office disciplinary referrals (ODR) as a screening measure?
Specifically, does ODR have adequate sensitivity (rate of true positives) and specificity
(rate of true negatives)? “True,” in this case, is defined as the SSBD scores.
A sensitivity and specificity analysis was run. Tables 3 through 5 illustrate the
results, which are discussed below. Because true negatives and true positives are only
some of the information sought, the rate of false positives and false negatives are also
included in the tables in an effort to provide a more complete picture. However, these
results are discussed with the results under Question Two.

63
Table 3
ODR Results for Overall Study Population
ODR does not indicate behavior risk (zero or
one ODR)
ODR indicates behavior risk (2 or more ODRs)
Student actually does not have behavior risk
determined by not passing Stage 2 on the
SSBD
True Negatives
87%**2 N=240
False positives
13%** N=36
Student actually has behavior risk as
determined by passing Stage 2 on the SSBD
False negatives
56.4%** N=22
True positives
43.6%** N=17
For the overall study population and each subgroup below, the total N was 315, as
described in the methods section, with one exception. Internalizers and Externalizers had
an N of 264 because, to be included in this analysis, the student either had to be initially
determined to have “internalizing” characteristics or “externalizing” characteristics. This
does not mean that students were considered to be internalizing or externalizing, only that
the teachers initially judged them to be so. Should they have passed Stage 2 on the SSBD,
then one could say they fit those criteria. When teachers have classes of more than 20
students, they only make a determination of internalizer or externalizer for the top twenty
students who most demonstrate those characteristics. This was the case for thirty-six
students. Fifteen additional students were removed from the analysis because the teachers
failed to make this determination for everyone in their class (up to twenty students) in an
2 For all values, statistical significance was calculated. Rates significant at the .05 level are indicated by an asterisk, whereas rates significant at the .01 level are indicated by double asterisks.

64
attempt to save time. Externalizers and internalizers were examined independently to
determine whether there is better sensitivity for one of the subgroups (see Table 4 and 5)..
Table 4
ODR Results for Externalizing Group
ODR does not indicate behavior risk (zero or
one ODR)
ODR indicates behavior risk (2 or more ODRs)
Student actually does not have behavior risk
determined by not passing Stage 2 on the
SSBD
True Negatives 75.9%**
N=85
False positives 24.1%**
N=27
Student actually has behavior risk as
determined by passing Stage 2 on the SSBD
False negatives 42.3%**
N=11
True positives 57.7%**
N=15
Table 5
ODR Results for Internalizing Group
ODR does not indicate behavior risk (zero or
one ODR)
ODR indicates behavior risk (2 or more ODRs)
Student actually does not have behavior risk
determined by not passing Stage 2 on the
SSBD
True Negatives 93.8%** N=106
False positives 6.2%**
N=7
Student actually has behavior risk as
determined by passing Stage 2 on the SSBD
False negatives 84.6%**
N=11
True positives 15.4% N=2

65
Table 3 illustrates that true negatives (specificity) overall is 87% (p<.01). This
means that if someone does not have a behavior risk (as indicated by the SSBD results),
87% of the time the ODR method will also indicate no behavior risk. This specificity rate
is slightly less for externalizers (75.9%, p<.01) and slightly greater for internalizers (87%,
p<.01).
For true positives, the range is much lower. The rate of true positives (sensitivity)
overall is 43.6% (p<.01), which indicates that if someone has a behavior risk (as
indicated by the SSBD), less than half of the time the ODR method will also indicate a
behavior risk. The sensitivity rate is slightly greater for externalizers 57.7% (p<.01) and
slightly less for internalizers (15.4%). However, the rate for internalizers is not
statistically significant.
Also, a chi square analysis was run to determine Phi as a test of significance. It
was determined that Phi was -.269, with a significance of .000. Phi is reported here for
only the overall subgroup because each additional subgroup analysis would have tested
the same relationship just with a smaller sample size, creating redundancy.
These results indicate that there is a relationship between the Systematic
Screening for Behavior Disorders (SSBD) and office disciplinary referral (ODR) method,
though it is weak (when analyzed using the same technique as a correlation). Also, the
ODR method is more accurate in its identification of those without behavior risk than it is
in its identification of those who have behavior risk. Since there is no general agreement
on acceptable levels of sensitivity and specificity, these numbers need to be interpreted in
light of other factors such as the intent of the test, cost, variation by subgroup, and
educational and social consequences, etc. This will be elaborated upon in Chapter 4.

66
Question Two, Part A, and Respective Results: False Positives and False Negatives
Question one results reported the rate of true negatives and true positives
identified by the ODR method as compared with the SSBD method, which reveals how
sensitive and specific the ODR method is. However, to examine the social and
educational consequences of the method, we need to examine two other very important
pieces of information: the rate of false positives and of false negatives. The following
figures answer the questions: if a student has a behavior risk (as determined by the
SSBD), how likely is he/she to score a negative test result on the ODR (i.e. indicating
incorrectly there is no behavior risk)? And, conversely, if a student does not have a
behavior risk (as determined by the SSBD), how likely is he/she to score a positive test
result on the ODR (i.e. indicating incorrectly that there is a behavior risk)?
The information for the three main groups—overall, externalizers, and
internalizers--has already been reported in Tables 3 through 5. Looking at false positives,
Table 2 indicates that if a student does not have a behavior risk (per the SSBD), there is a
13% chance (p<.01) he or she will incorrectly be considered to have a behavior risk using
the results of the ODR method. This rate roughly doubles when only externalizers are
examined (24.1%, p<.01) and roughly halves (6.2%, p<.01) when only internalizers are
considered.
Higher rates of false negatives were found than false positives for all three groups
(see Table 2 through 4). If a student does have a behavior risk (per the SSBD), there is a
56.4% chance (p<.01) the ODR method will actually indicate he or she not have a
behavior risk. This risk of false negatives decreases for externalizers (42.3%, p<.01) and
increases for internalizers (84.6%, p<.01).

67
The following tables, Table 6 through 16, present the results for the remaining
subgroups—males/females, those with special education labels, those with free/reduced
lunch status, those who are English-language learners, and those with the following
ethnicities: African American, Caucasian, and Hispanic. First, male and female
subgroups were analyzed.
Table 6
ODR Results for Males
ODR does not indicate behavior risk (zero or
one ODR)
ODR indicates behavior risk (2 or more ODRs)
Student actually does not have behavior risk
determined by students not passing Stage 2 on
the SSBD
True Negatives 78.8%** N=104
False positives 21.2%**
N=28
Student actually has behavior risk as
determined by students passing Stage 2 on the
SSBD
False negatives 53.1%**
N=17
True positives 46.9%**
N=15
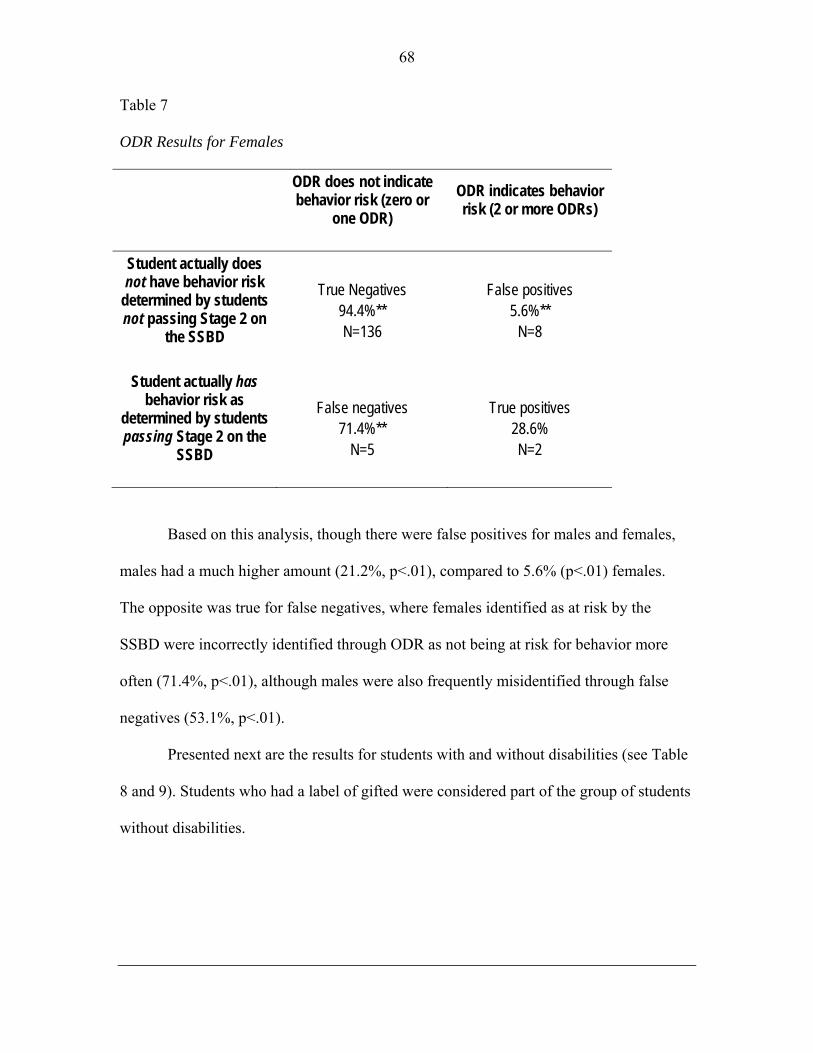
68
Table 7
ODR Results for Females
ODR does not indicate behavior risk (zero or
one ODR)
ODR indicates behavior risk (2 or more ODRs)
Student actually does not have behavior risk
determined by students not passing Stage 2 on
the SSBD
True Negatives 94.4%** N=136
False positives 5.6%**
N=8
Student actually has behavior risk as
determined by students passing Stage 2 on the
SSBD
False negatives 71.4%**
N=5
True positives 28.6% N=2
Based on this analysis, though there were false positives for males and females,
males had a much higher amount (21.2%, p<.01), compared to 5.6% (p<.01) females.
The opposite was true for false negatives, where females identified as at risk by the
SSBD were incorrectly identified through ODR as not being at risk for behavior more
often (71.4%, p<.01), although males were also frequently misidentified through false
negatives (53.1%, p<.01).
Presented next are the results for students with and without disabilities (see Table
8 and 9). Students who had a label of gifted were considered part of the group of students
without disabilities.

69
Table 8
ODR Results for Students with a Disability Label
ODR does not indicate behavior risk (zero or
one ODR)
ODR indicates behavior risk (2 or more ODRs)
Student actually does not have behavior risk
determined by students not passing Stage 2 on
the SSBD
True Negatives 78.3%**
N=18
False positives 21.7%*
N=5
Student actually has behavior risk as
determined by students passing Stage 2 on the
SSBD
False negatives 80%** N=4
True positives 20% N=1
Table 9
ODR Results for Students without a Disability Label
ODR does not indicate behavior risk (zero or
one ODR)
ODR indicates behavior risk (2 or more ODRs)
Student actually does not have behavior risk
determined by students not passing Stage 2 on
the SSBD
True Negatives 87.7%** N=222
False positives 12.3%**
N=31
Student actually has behavior risk as
determined by students passing Stage 2 on the
SSBD
False negatives 52.9%**
N=18
True positives 47.1%**
N=16

70
The rate of false positives for students with disabilities was 21.7% (p<.05),
greater than the rate of false positives for those without disabilities (12.3%, p<.01). As
with gender, the rate of false negatives was much greater than the rate of false positives.
The rate of false negatives (those missed by using the ODR method of identification) was
80% (p<.01) for those with a disability and 52.9% for those without disabilities (p<.01).
Table 10 and 11 show the data for groups who were determined to have or not
have low SES based on their free/reduced lunch status.
Table 10
ODR Results for Students with Low SES
ODR does not indicate behavior risk (zero or
one ODR)
ODR indicates behavior risk (2 or more ODRs)
Student actually does not have behavior risk
determined by students not passing Stage 2 on
the SSBD
True Negatives 87.7%** N=179
False positives 12.3%**
N=25
Student actually has behavior risk as
determined by students passing Stage 2 on the
SSBD
False negatives 52.9%**
N=18
True positives 47.1%**
N=16
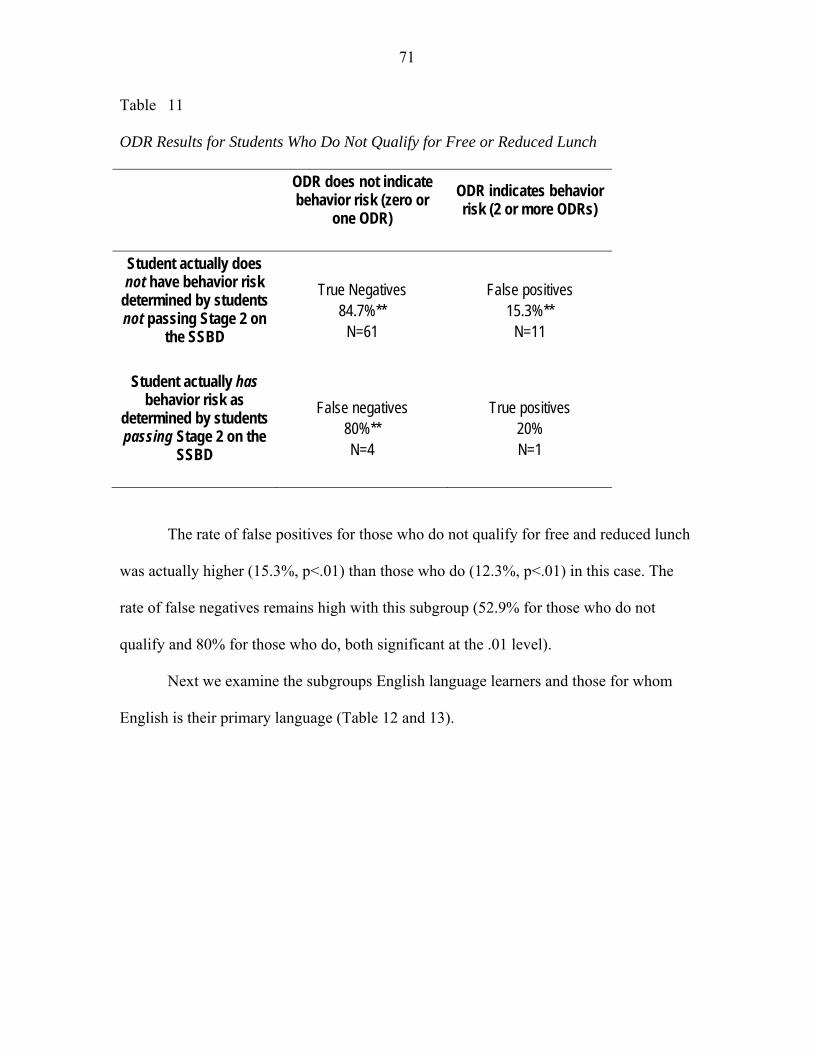
71
Table 11
ODR Results for Students Who Do Not Qualify for Free or Reduced Lunch
ODR does not indicate behavior risk (zero or
one ODR)
ODR indicates behavior risk (2 or more ODRs)
Student actually does not have behavior risk
determined by students not passing Stage 2 on
the SSBD
True Negatives 84.7%**
N=61
False positives 15.3%**
N=11
Student actually has behavior risk as
determined by students passing Stage 2 on the
SSBD
False negatives 80%** N=4
True positives 20% N=1
The rate of false positives for those who do not qualify for free and reduced lunch
was actually higher (15.3%, p<.01) than those who do (12.3%, p<.01) in this case. The
rate of false negatives remains high with this subgroup (52.9% for those who do not
qualify and 80% for those who do, both significant at the .01 level).
Next we examine the subgroups English language learners and those for whom
English is their primary language (Table 12 and 13).
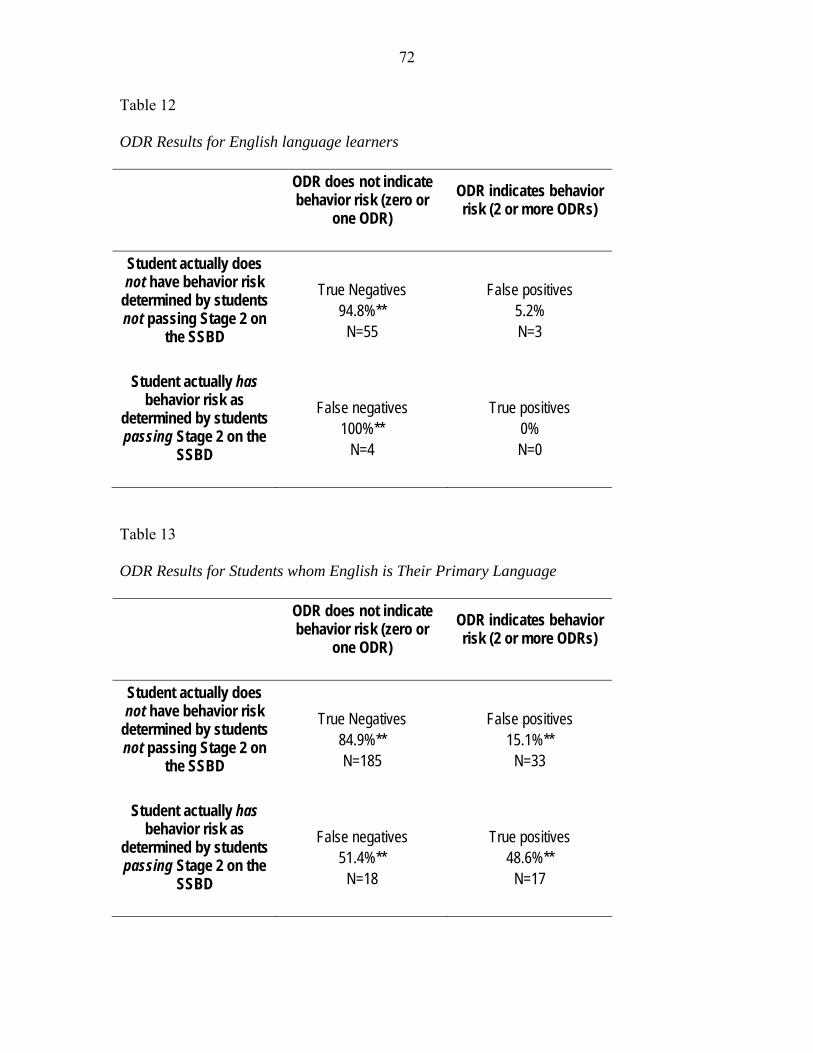
72
Table 12
ODR Results for English language learners
ODR does not indicate behavior risk (zero or
one ODR)
ODR indicates behavior risk (2 or more ODRs)
Student actually does not have behavior risk
determined by students not passing Stage 2 on
the SSBD
True Negatives 94.8%**
N=55
False positives 5.2% N=3
Student actually has behavior risk as
determined by students passing Stage 2 on the
SSBD
False negatives 100%**
N=4
True positives 0% N=0
Table 13
ODR Results for Students whom English is Their Primary Language
ODR does not indicate behavior risk (zero or
one ODR)
ODR indicates behavior risk (2 or more ODRs)
Student actually does not have behavior risk
determined by students not passing Stage 2 on
the SSBD
True Negatives 84.9%** N=185
False positives 15.1%**
N=33
Student actually has behavior risk as
determined by students passing Stage 2 on the
SSBD
False negatives 51.4%**
N=18
True positives 48.6%**
N=17

73
Those who were not English language learners had a higher rate of false positives
(15.1%, p<.01) than those who were (5.2%), though this difference was not statistically
significant). Also, for students whose primary language is English, again, the rate of
false negatives was just over 50% (p<.01). The rate of false negatives for students who
are English language learners was 100% (p<.01).
Finally, we have the analysis for the top three ethnicities: African American,
Caucasian, and Hispanic students (Table 14 through 16).
Table 14
ODR Results for African American Students
ODR does not indicate behavior risk (zero or
one ODR)
ODR indicates behavior risk (2 or more ODRs)
Student actually does not have behavior risk
determined by students not passing Stage 2 on
the SSBD
True Negatives 83.4%** N=121
False positives 16.6%**
N=24
Student actually has behavior risk as
determined by students passing Stage 2 on the
SSBD
False negatives 55.2%**
N=16
True positives 44.8%**
N=13

74
Table 15
ODR Results for Caucasian Students
ODR does not indicate behavior risk (zero or
one ODR)
ODR indicates behavior risk (2 or more ODRs)
Student actually does not have behavior risk
determined by students not passing Stage 2 on
the SSBD
True Negatives 84.6%**
N=44
False positives 15.4%**
N=8
Student actually has behavior risk as
determined by students passing Stage 2 on the
SSBD
False negatives
40% N=2
True positives
60%* N=3
Table 16
ODR Results for Hispanic Students
ODR does not indicate behavior risk (zero or
one ODR)
ODR indicates behavior risk (2 or more ODRs)
Student actually does not have behavior risk
determined by students not passing Stage 2 on
the SSBD
True Negatives 95.5%**
N=64
False positives 4.5% N=3
Student actually has behavior risk as
determined by students passing Stage 2 on the
SSBD
False negatives 100%**
N=4
True positives 0% N=0

75
For these three ethnicities, the rate of false positives was 16.6% for African
Americans (p<.01), 15.4% for Caucasians (p<.01), and 4.5% for Hispanics, which was
not statistically significant. False negative rates, again, were much higher than false
positive rates, ranging from the lowest for Caucasian students (40%, though not
statistically significant), to 55.2% for African American students (p<.01), and finally
topping out at 100% for Hispanic students (p<.01).
The consistent theme across these results is that each of the subgroups
(ethnicities, disability, SES, English language learner status, and gender) had a much
higher rate of false negatives (ranging from over 50% to 100%, considering only those
numbers that were statistically significant) than rate of false positives (which range from
5.6% to 21.7%). Six subgroups had rates of false negatives over 70%, all statistically
significant: females, those with disabilities, those who did not have low SES, those who
were considered internalizers, Hispanic students, and those for whom English was their
second language. The last two groups had false negative rates of 100%.
Also of interest is the fact that groups that one might suspect to be more at risk for
false positives did not always fall into that stereotype. While males did have a higher rate
of false positives than females, as did those with disabilities over those without, those
who were not English language learners and those who did not have low SES actually
had higher levels of false positives than their counterparts. African Americans and
Caucasian students had roughly the same level of false positives.
With regards to false negatives, females “fell through the cracks” more than
males, as did English language learners over those whose primary language was English,
and those with disabilities over those without. However, those with a low SES fell

76
through the cracks less than their higher income counterparts. In terms of ethnicity, those
who were Hispanic had a rate of being missed 100% of the time and those who were
African American were not identified when they should have been over half of the time.
Question Two, Part B, and Respective Results: Over and Underrepresentation
To determine over and underrepresentation, the percentage of false positives or
negatives for each subgroup was compared to the percentage of false positives or
negatives within the overall study population. Higher numbers of false positives or
negatives for specific subgroups that were statistically significant were of interest.
The number of false positives in the overall population was 13%, p<.01. When
this overall proportion of false positives was compared to each individual subgroups’
proportion of false positives, four subgroups stood out as having a different rate of false
positives that were statistically significant: externalizers, Hispanics, males, and females.
Only two of these four (males, p<.05 and externalizers, p<.01) were significantly higher
than the overall population, indicating overrepresentation of these subgroups when the
ODR method of evaluating behavior risk is used.
The proportion of false negatives in the overall population was 56.4% (p<.01).
When we compare this overall proportion of false negatives to each of the subgroups’
proportion of false negatives, no subgroup had a proportion that was statistically
significantly different at the .05 or 01 level. The closest population to significance was
internalizers (p=.068). The next closest were Hispanics and English Language Learners
(p=.089 for each). Beyond that, no other group was approaching significance (p=.263 and
higher). These three subgroups each had a higher proportion of false negatives than the

77
overall group but, to reiterate, no group reached statistical significance, indicating no
underrepresentation of subgroups was found using the method described.
78
CHAPTER 4: Discussion
Implications of Results
Office disciplinary referrals (ODRs) are a commonly used form of discipline so
the data collected by schools and districts are readily available to researchers and school
personnel. However, based on the results of this study, ODR data are not valid as a
behavioral screener and therefore should not be used to identify students in need of
additional support.
Demographics
The demographic data from this study shows a very diverse population. This is
not seen as a detriment, but rather a benefit. On a psychometrically valid tool diversity
should not matter. The prevalence of Emotional and Behavioral Disorders (EBD) should
be evenly distributed, given a valid tool such as the SSBD. However, over and
underrepresentation may be found on a tool that exhibits bias. Students from backgrounds
typically not represented in great numbers help to provide statistical power and make bias
more easily discovered, should it exist.
When considering the number of students who went from passing Stage 1 to
passing Stage 2 for each school, school A was very close to the SSBD published norms
(the school’s 33.3% compared to the SSBD’s 31.75%), whereas school B had a much
higher proportion of students pass through (55.6%). The percent of the total school
population that went on to be identified as internalizers or externalizers for school A also
closely matched what Walker et al., 2005 published from their study from urban and rural
schools in the Seattle area; however for school B, they were higher proportions. The
results that Morgan D’Atrio and colleagues (March, 2008) produced from their study in
79
Jefferson Parish, a diverse area of Louisiana, were a closer match. Their breakdown of
the SSBD results by externalizers (66.6%) and internalizers (33.4%), gender (71.7%
males and 28.3% females), and also by race (60.6% African American, 29.3% white, and
close to 10% other ethnicities), are a close match to the results of this study.
Sensitivity and Specificity
The results of the sensitivity and specificity analysis show that while the ODR
method was able to correctly identify those who did not have a behavior risk 87% of the
time (p<.01), it was only able to accurately identify those who did have behavior risk
about 44% of the time (p<.01). While a general principle states that the higher the levels
of sensitivity and specificity, the greater the accuracy, what is considered to be an
acceptable level of each is unique to that particular situation based on the potential
consequences. Keeping this in mind, less than 50% accuracy for the overall student
population is not acceptable for a behavioral screener given that the goal is accurate
identification of students with externalizing and/or internalizing behaviors.
Though these numbers reflect the results of the overall student population, the
subsequent subgroup analyses on externalizers and internalizers show that the sensitivity
is only slightly improved with externalizers (57.7%, p<.01). The number appears to be
drastically reduced for internalizers (15.4%). Due to a small sample size, the number of
true positives was not statistically significant. Further studies are necessary to determine
the exact sensitivity for internalizers. For specificity, the ODR method accurately
identified those who were not at risk more for internalizing behaviors more accurately
than with externalizing behaviors. In that case, both were statistically significant (p<.01).

80
It is understandable that one would think ODR would be an effective indicator of
externalizing behavior, even if it is not sufficient for internalizing behavior. In fact,
McIntosh and colleagues (2009) found this true in their recent study. Based on this
preliminary study, however, it appears that ODR is not an effective method for
identifying externalizers either. This finding is consistent with other studies that show
poor results using ODR as a screener, even with externalizers (or other subgroups for
which one would expect the ODR method to excel as a method of identification). For
example, Walker, Cheney, Stage, and Blum (2005) found only 17 of 41 students were
correctly identified using the ODR method alone when using the SSBD as the standard
for correct response role. The sensitivity with externalizers was better than internalizers
but was still relatively poor at 58.6%. In their study, the ODR method caught no
internalizing students, so the sensitivity rate was zero for that population. The results of
the present study can also be compared to those in Nelson, Benner, et al. (2002), which
studied convergent validity of ODR and the Child Behavior Checklist-Teacher Report
Form (CBCL-TRF; Achenbach, 1991b). Despite using a more liberal criterion (one or
more ODR), the percent of false negatives started at 48.8% for borderline and 42.8% for
clinical and increased from there. The correspondence between the two ways of
identification was low to moderate. This continued to be true even when the scales that
would be expected to have higher correlations (the externalizing scale, the Delinquent
Behavior subscale, and the Aggressive Behavior subscale of the TRF) were singled out.
The findings of this study support the conclusion that the ODR method does not
have enough specificity to be used as a screener for the overall population, nor does it
have enough specificity for internalizing or externalizing subgroups exclusively.
81
False Positives and False Negatives
Sensitivity and specificity results are not only related to each other, but they are
also related to the corresponding rates of false negatives and false positives. More
sensitive tests result in more false positives, while tests with greater specificity result in
higher rates of false negatives.
Given that the goal in SWPBS is to use an effective schoolwide behavioral
screener and because screeners by their very nature are meant to cast a wider net so as to
not miss anyone, though a high number of false positives are never desired, a high
number of false negatives (i.e. students falling through the cracks) would be more
devastating. Because the interventions being put into place are likely group interventions
consistent with Tier 2 of SWPBS, they are not resource intensive (in terms of money or
staff time) and are meant to be as non-stigmatizing as possible. If a student receives a
necessary intervention, this may prevent the behaviors from becoming ones that interfere
with the individual student’s academic and social development as well as the academic
development of his or her peers. The consequences of false positives are simply that a
student is provided extra support that is not necessary, which results in the loss of some
resources. Given that this extra support is usually in the form of small group instruction,
then this is a relatively small loss if the student does not actually need the support.
However, the consequences are far greater if the support is not provided to a student in
need.
Should a student fail to receive the early intervention needed, there is the chance
the student could go on to suffer academically, as well as socially, being at risk for
greater stigmatization than what would result from participating in a group intervention.

82
The student may also, particularly with externalizers, keep others from being able to
focus and learn and be responsible for bullying. In extreme cases, those who fail to
receive support could go on to be a danger to themselves (suicide, for example) or others.
It was thought those who were responsible for Columbine and Virginia Tech massacres
exhibited some of the risk factors for internalizing behavior. In the latter cases, though
the numbers may be small, the risk of not catching and intervening early could be very
large. For this reason, a higher emphasis is placed on accurately identifying students who
display externalizing and internalizing behaviors (sensitivity) and a lower number of false
negatives.
Overall, this study found that, of the students not at risk (as determined by the
SSBD), 13% of those were incorrectly found to be at risk when the ODR was used as the
screener. However, as mentioned above, of greater concern are students who miss
support that is needed. Out of those who were considered to be at risk for behavior via the
SSBD, the ODR method incorrectly identified over half (56%, p<.01) of those students as
actually not having any behavior risk. These are the students who would then fail to
receive the behavior support they would need. In light of the consequences related to
having students misidentified who need additional support, this false negative rate of
56% is unacceptable.
Given that sensitivity levels were low for both students with internalizing and
students with externalizing behaviors and given the inter-relatedness of false negatives to
sensitivity, it should not be surprising that high rates of false negatives were found for
both of these subgroups. Almost 85% of the internalizing students fell through the cracks
as part of this study (almost 85%, p<.01). Though smaller, the number of externalizing
83
students who fell through the cracks also remained high (close to 42%, p<.01) when the
ODR method of screening was used.
This study found several groups, in addition to the internalizing group already
mentioned, with extremely high rates of false negatives when the ODR was used. These
include females (71.4%, p<.01), those with a disability label (80%, p<.01), those who did
not qualify for free/reduced lunch (80%, p<.01), ELL students (100%, p<.01), and
Caucasian students (100%, p<.01). The finding that students with disabilities are falling
through the cracks is not consistent with the theory that individuals with disabilities are at
risk for overidentification, which Skiba (2002), who was concerned that regulations were
not protecting individuals with disabilities as they should, found in his literature review.
Perhaps now that the IDIEA regulations have been in effect longer, these regulations are
working more effectively to protect individuals with disabilities from being
disproportionately and inappropriately punished. A teacher’s hesitancy to send a student
with a disability to the office may be due to his or her belief that ODR is ineffective for
this student or because the teacher has a different behavioral plan in place to prevent or
respond to challenging behavior. While certain disabilities would lend themselves to
additional behavior support as part of the diagnosis, a universal screener could catch
students with disabilities if a behavior risk (internalizing or externalizing) was not already
known or associated with that particular disability. If schools use ODR to screen, students
with disabilities who are not sent to the office may miss needed additional behavior
support. In this case, the high number of false negatives with students with disabilities is
a matter of concern.

84
Over and Underrepresentation
The rates of false positives and false negatives were examined for each of the
subgroups as a precursor to an analysis of under and overrepresentation. While some
false positives are to be expected as part of the tradeoff for balancing types of errors, over
and underrepresentation are never acceptable as these indicate bias, whether intentional
or not. As education is lauded as the great equalizer, there is no place for bias in
education, especially regarding punishment that can result in short- or long-term removal
from education. Since high levels of false negatives or false positives in each subgroup
may just reflect the high rate of false negatives or false positives in the overall study
population, as already discussed, statistical significance was determined. In this case, a
value was statistically significant if it was significantly higher than the corresponding
value in the overall population.
This study found that both males and students initially considered externalizers
were overrepresented when using the ODR method. This is consistent with literature
reviews by Nelson and colleagues (2003) and Skiba (2002). No populations
underrepresented were statistically significant. Given the small sample size, it is likely
this is an issue of statistical power. Given a larger sample size, students initially
considered internalizers by their teachers, those who are Hispanic, and those students
who are English Language Learners may become significant. This study needs to be
repeated with a larger sample to confirm this finding.
Additional Consequences
Thanks to Messick’s insight, researchers are not limited to viewing validity
strictly in terms of the numbers. As seen above, numbers must be interpreted relevant to
85
the test’s intended purpose. When this occurs, the argument for ODR as a screener
continues to weaken.
When researchers and technical assistance providers support the use of data that
are produced by sending students to the office as a form of discipline, they themselves
become complicit. Even if it is inadvertent, they are supporting the action of sending
students to the office for discipline. The use of office referrals as a discipline practice is
something that PBS researchers and TA providers are inherently against (or at least
committed to reducing) based on research showing it is an ineffective form of discipline;
reactive in nature, does not prevent challenging behavior from occurring in the first place;
removes the student from instruction; and may actually reinforce the student who acts out
to obtain attention or avoid a task. In fact, schoolwide positive behavior support evolved
as an alternative to these types of punishments. To make use of the data because it is
simply available goes against the hallmarks of the field: inclusion/access to instruction
and prevention of problem behavior. Additionally, using ODR data gives the impression
to schools and districts that ODR has value as a measure of child behavior. In fact, the
value of the data contained within an office disciplinary referral record is limited because
of its complexity. ODRs do not measure child behavior but rather record a series of
events that include child behavior, teacher behavior, and administrator behavior. This is
one of the reasons achieving validity with ODR is difficult.
Many times the argument has been made that ODR is useful because it has social
validity, meaning it is readily available in almost every school with little effort or
investment on the part of the school staff. However, researchers increasingly consider
that only ODR data from schools that use the SWIS system have sufficient validity

86
because these schools’ staff members go through an extensive process of training in order
to standardize the process. Additionally, as staff members undertake improving ODR
validity, the time and energy investment increases.
Expending resources to increase ODR validity instead of using other, already
valid, tools, sends the message that these are salvageable databases and researchers and
TA providers in the field of PBS support their use. The fact remains that efforts to
improve the reactive, exclusionary, and punishment-based ODR could be better spent
improving the skill sets of the teachers and the building staff, as well as restructuring the
environment, to prevent challenging behavior from occurring in the first place. Rather
than encouraging effective behavior management on the part of teachers so that they can
better handle discipline in their classroom early on—thus increasing teacher confidence
and satisfaction and preventing the disruption of learning—sending a student out of class
shifts the responsibility of discipline to the administration.
Researchers’ reliance on ODR databases also sends schools a confusing message
regarding reducing the number of office referrals. Teachers are told that office
disciplinary referrals are not effective and they need to be reduced; at the same time, the
unspoken message is that by sending a student to the office, teacher’s concerns about
individual students are “heard” and documented and students may are receive the help
they need. Additionally, researchers’ use of ODR data promotes ODR as an effective
means of discipline and implies that removing a student from instruction serves some
useful purpose, and that it will result in getting much needed support for the student, both
of which are not necessarily true.
87
These arguments represent both social and educational consequences of using
ODR as a data source within the field of PBS and, according to Messick, are acceptable
to consider when considering whether ODR are a valid measure for screening.
Combining these with the low sensitivity rate, high level of false negatives, and potential
for overrepresentation, the evidence against using ODR as a schoolwide screener is
strong. Thankfully, other universal screeners normed for a diverse range of students have
been proven to have excellent psychometric properties and are sensitive to both
externalizing and internalizing behaviors.
Limitations and Future Research
This study is not without limitations. This study was meant to be a small-scale
preliminary look at the validity of office referrals using Messick’s theories in an urban
envnironment. Messick’s theory of validity includes four quadrants, and, as this study
only addresses two of them, other studies are needed. For example, scholarship on the
social validity of the SSBD would be useful given nothing has been done formally since
the tool’s development, which itself was not very comprehensive. This would be
especially useful if a web-based version is widely disseminated.
A larger scale study is needed to confirm the findings in this study, especially in
areas such as over and underrepresentation that may come to light given greater statistical
power. Also, the student population of this study used was very diverse. Additional
studies need to confirm these findings are consistent for all populations.
Additionally, the schools used in this study did not have perfect PBS
implementation. They represent schools trying to keep up ongoing implementation of
PBS but struggling against turnover in key positions, lack of full support at the district
88
level, etc. One school utilized the SWIS system and one did not. This might be significant
because McIntosh and colleagues (2009) critiqued the Nelson, Benner, et al., 2002 study
for testing the validity of a “different type of referral, one that approximates an
unstandardized incident report in schools” (p.109) since their schools had only been
doing PBS in a standardized way for about a year. Walker and colleagues (2005)
hypothesized that staff understanding of definitions of what is to be measured affect
SSBD results as well. The smallest school in their study had the largest percentage of
their externalizing students pass stage 2. They felt this could reflect the school’s
population or it may represent a better understanding of externalizing characteristics from
the onset of the measure. Additional studies testing this same construct, but with a larger
sample could be done in order to investigate the fidelity of PBS implementation affects
ODRs validity as a screener. For example, SWIS schools could be compared to non-
SWIS schools.
This study was done using the SSBD. The BASC-2 is a newer screener for
detecting internalizers and externalizers that is normed through high school. It would be
useful to see a comparative validity study of the SSBD versus the BASC-2 as it might be
useful for districts to employ one screener for all grade levels.

89
References
Achenbach, T.M. (1991). Manual for the Teacher Report Form. Burlington: University
of Vermont Press.
Achenbach, T. & Edelbrock, C. (1979). The child behavior profile: II. Boys aged 12-16
and girls aged 6-11 and 12-16. Journal of Consulting and Clinical Psychology,
47, 223-233. doi:10.1037//0022-006X.47.2.223
Achenbach, T.M. & Rescorla, L.A. (2001). Manual for the ASEBA school-age forms &
profiles. Burlington: University of Vermont, Research Center for Children,
Youth, & Families.
American Psychological Association, American Educational Research Association, &
National Council on Measurement in Education. (1985). Standards for
educational and psychological testing. Washington, DC: American Psychological
Association.
Brantlinger, E. (1991). Social class distinctions in adolescents’ reports of problems and
punishment in school. Behavioral Disorders 17, 36-46. doi:10.1007/BF01807533
Breen, K., Rose, J., Rose, P. & Thompson, M. (2009, March). Universal screening using
the SSBD. Paper presented at the Seventh International Conference on Positive
Behavior Support, Jacksonville, FL.
Caldarella, P., Young, E.L., Richardson, M.J., Young, B.J., & Young, K.R. (2008).
Validation of the systematic screening for behavior disorders in middle and junior
high school. Journal of Emotional and Behavioral Disorders, 16, 105-117.
doi:10.1177/1063426607313121

90
Carr, E.G., Dunlap, G., Horner, R.H., Koegel, R.L., Turnbull, A.P., Sailor, W., Anderson,
J.L., Albin, R.W., Koegel, L.K., & Fox, L. (2002). Positive behavior support:
Evolution of an applied science. Journal of Positive Behavior Interventions, 4(1)
4-17. doi:10.1177/109830070200400102
Carter, D.R. & Horner, R.H. (2007). Adding functional behavioral assessment to first
step to success: A case study. Journal of Positive Behavior Interventions, 9, 229-
238. doi: 10.1177/10983007070090040501
Carter, D.R. & Horner, R.H. (2009). Adding function-based behavioral support to first
step to success: Integrating individualized and manualized practices. Journal of
Positive Behavior Interventions, 11, 22-34. doi:10.1177/1098300708319125
Cheney, D., Blum, C., & Walker, B. (2004). An analysis of leadership teams’ perceptions
of positive behavior support and the outcomes of typically developing and at-risk
students in their schools. Assessment for Effective Intervention, 30, 7-24.
doi:10.1177/0737247704030000102
Cheney, D.A., Stage, S.A., Hawken, L.S., Lynass, L., Mielenz, C., & Waugh, M. (2009).
A 2-year outcome study of the check, connect, and expect intervention for
students at risk for severe behavior problems. Journal of Emotional and
Behavioral Disorders, 17, 226-243. doi:10.1177/1063426609339186
Children’s Defense Fund. (1974). Children out of school in America. Washington, DC:
Author, Washington Research Project, Inc.
Cooley, S. (1995). Suspension/expulsion of regular and special education students in
Kansas: A report to the Kansas State Board of Education. Topeka, KS: Kansas
State Board of Education.

91
Costenbader, V. K., & Markson, S. (1994). School suspension: A survey of current
policies and practices. NASSP Bulletin, 78, 103-107.
doi:10.1177/019263659407856420
Drummond, T. (1994). The Student Risk Screening Scale (SRSS). Grants Pass, OR:
Josephine County Mental Health Program.
Elliot, S. N., & Busse, R. T. (1993). Behavior rating scales: Issues of use and
development. School Psychology Review, 22, 313−322.
Elliot, S. N., & Busse, R. T. (2004). Assessment and evaluation of students' behavior and
intervention outcomes: The utility of rating scale methods. In R. B. Rutherford,
M. M. Quinn, & S. R. Mathur (Eds.), Handbook of research in emotional and
behavioral disorders (pp. 123−142). New York, NY: Guilford.
Epstein, M.H., Nordness, P.D., Nelson, J.R., and Hertzog, M. (2002). Convergent validity
of the behavioral and emotional rating scale with primary grade-level students.
Topics in Early Childhood Special Education, 22, 114-121.
doi:10.1177/02711214020220020601
Epstein, M.H. & Sharma, J. (1998). Behavioral and Emotional Rating Scale: A strength-
based approach to assessment. Austin, TX: PRO-ED.
Feil, E.G., & Walker, H.M. (1995). The early screening project for young children with
behavior problems. Journal of Emotional and Behavioral Disorders, 3, 194-203.
doi:10.1177/106342669500300401
Finn, C., Rotherham, A., & Hokanson, C. (2001). Rethinking Special Education for a
New Century. PPI and Thomas B. Fordham Foundation.

92
Forness, S.R., Kavale, K.A., MacMillan, D.L., Asarnow, J.R., & Duncan, B.B. (1996).
Early detection and prevention of emotional and behavioral disorders:
Developmental aspects of systems of care. Behavioral Disorders, 21, 226-240.
Frey, B. (2006). Statisical Hacks. Sebastopol: O’Reilly Media.
Fuchs, D., Mock, D., Morgan, P.L., & Young, C.L. (2003). Responsiveness-to-
Intervention: Definitions, evidence, and implications for the learning disabilities
construct. Learning Disabilities Research & Practice, 18, 157-171.
doi:10.1111/1540-5826.00072
Glackman, T., Martin, R., Hyman, I., McDowell, E., Berv, V., & Spino, P. (1978).
Corporal punishment, school suspension, and the civil rights of students: An
analysis of Office for Civil Rights school surveys. Inequality in Education, 23,
61-65.
Gregory, J.F. (1996). The crime of punishment: Racial and gender disparities in the use
of corporal punishment in the U.S. public schools. Journal of Negro Education,
64, 454-462.
Gresham, F. & Elliot, S.N. (1990). Social skills rating system. Circle Pines, MN:
American Guidance Service.
Gresham, F.M., Lane, K.L., & Lambros, K.M. (2000). Comorbidity of conduct problems
and ADHD: Identification of “fledgling psychopaths.” Journal of Emotional and
Behavioral Disorders, 8, 83-93. doi:10.1177/106342660000800204
Hammill, D.D., Brown, L., & Bryant, B.R. (1989). A Consumer’s Guide to Tests in Print.
Austin, TX: PRO-ED.

93
Horner, R., Sugai, G., Todd, A.W., & Lewis-Palmer, T. (2000). Elements of behavior
support plans: A technical brief. Exceptionality, 8(3), 205-215.
doi:10.1207/S15327035EX0803_6
Individuals with Disabilities Education Act Amendments of 2004, 20 USC. §1400 et seq.
Iovannone, R. & Christiansen, K. (2008, October). Identification and progress
monitoring at tier 3: Prevent-teach, reinforce. Paper presented at the Chicago
Positive Behavior Support Implementers Forum, Rosemont, IL.
Irvin, L.K., Horner, R.H., Ingram, K., Todd, A.W., Sugai, G., Sampson, N.K., & Boland,
J.B. (2006). Using office discipline referral data for decision making about
student behavior in elementary and middle schools: An empirical evaluation of
validity. Journal of Positive Behavior Interventions, 8, 10-23.
doi:10.1177/10983007060080010301.
Kaeser, S.C. (1979). Suspensions in school discipline. Education and Urban Society, 11,
465-484. doi:10.1177/001312457901100405
Kamps, D., Wills, H.P., Greenwood, C.R., Thorne, S., Lazo, E., Crockett, J.L.,
McGonigleakers, J., & Swaggart, B.L. (2004). Curriculum influences on growth
in early reading fluency for students with academic and behavior risks: A
descriptive study. Journal of Direct Instruction, 4, 189-210.
Kauffman, J.M. (2001). Characteristics of emotional and behavioral disorders of
children and youth (7th ed.). Columbus, OH: Merrill.
Kauffman, J.M. & Landrum, T. (2009). Characteristics of emotional and behavioral
disorders of children and youth (8th ed.). Columbus, OH: Merrill.
94
Kelley, M.L. (1998). Review of the Systematic Screening for Behavior Disorders. In J.C.
Impara, B.S. Plake, & L.L. Murphy (Eds.), The thirteenth mental measurements
yearbook (pp. 994-995). Lincoln, NE: Buros Institute.
Kern, L. & Manz, P. (2004). A look at current validity issues of school-wide behavior
support. Behavioral Disorders, 30, 47-59.
Lago-Delello, E. (1998). Classroom dynamics and the development of serious emotional
disturbance. Exceptional Children, 64, 479-492.
Lane, K.L. (2007) Identifying and supporting students at risk for emotional and
behavioral disorders within multi-level models: Data driven approaches to
conducting secondary interventions with an academic emphasis. Education and
Treatment of Children, 30, 135-164. doi:10.1353/etc.2007.0026
Lane, K.L., Kalberg, J.R., Bruhn, A.L., Mahoney, M.E., & Driscoll, S.A. (2008). Primary
prevention programs at the elementary level: Issues of treatment integrity,
systematic screening, and reinforcement. Education and Treatment of Children,
31, 465-494.
Lane, K.L., Kalberg, J.R., Lambert, E.W., Crnobori, M. & Bruhn, A.L. (2010). A
comparison of systematic screening tools for emotional and behavioral disorders:
A replication. Journal of Emotional and Behavioral Disorders, 18, 100-112.
doi:10.1177/1063246609341069
Lane, K.L., Little, M.A., Casey, A.M., Lambert, W., Wehby, J., Weisenbach, J.L., &
Phillips, A. (2009). A comparison of systematic screening tools for emotional and
behavioral disorders. Journal of Emotional and Behavioral Disorders, 17, 93-105.
doi:10.1177/106326608326203

95
Lane, K.L., Rogers, L.A., Parks, R.J., Weisenback, J.L., Mau, A.C., Merwin, M.T., &
Bergman, W.A. (2007). Function-based interventions for students who are
nonresponsive to primary and secondary prevention efforts: Illustrations at the
elementary and middle school levels. Journal of Emotional and Behavioral
Disorders, 15, 169-183.
Lane, K.L. (2007) Identifying and supporting students at risk for emotional and
behavioral disorders within multi-level models: Data driven approaches to
conducting secondary interventions with an academic emphasis. Education and
Treatment of Children, 30, 135-164. doi:10.1353/etc.2007.0026
Lane, K.L., Kalberg, J.R., Bruhn, A.L., Mahoney, M.E., & Driscoll, S.A. (2008). Primary
prevention programs at the elementary level: Issues of treatment integrity,
systematic screening, and reinforcement. Education and Treatment of Children,
31, 465-494.
Lane, K.L., Kalberg, J.R., Lambert, E.W., Crnobori, M. & Bruhn, A.L. (2010). A
comparison of systematic screening tools for emotional and behavioral disorders:
A replication. Journal of Emotional and Behavioral Disorders, 18, 100-112.
Doi:10.1177/1063246609341069
Lane, K.L., Little, M.A., Casey, A.M., Lambert, W., Wehby, J., Weisenbach, J.L., &
Phillips, A. (2009). A comparison of systematic screening tools for emotional and
behavioral disorders. Journal of Emotional and Behavioral Disorders, 17, 93-105.
Doi:10.1177/106326608326203
Lane, K.L., Rogers, L.A., Parks, R.J., Weisenback, J.L., Mau, A.C., Merwin, M.T., &
Bergman, W.A. (2007). Function-based interventions for students who are

96
nonresponsive to primary and secondary prevention efforts: Illustrations at the
elementary and middle school levels. Journal of Emotional and Behavioral
Disorders, 15, 169-183.
Leone, P.E. (1994). Education services for youth with disabilities in a state-operated
juvenile correctional system: Case study and analysis. Journal of Special
Education, 28, 43-58. doi:10.1177/002246699402800104
Leone, P.E., Mayer, M.J., Malmgren, K., & Meisel, S.M. (2000). School violence and
disruption: Rhetoric, reality, and reasonable balance. Focus on Exceptional
Children, 33(1), 1-20.
Lietz, J.J. & Gregory, M.K. (1978). Pupil race and sex determinants of office and
exceptional education referrals. Educational Research Quarterly, 3, 61-66.
Loeber, R. (1996). Developmental continuity, change, and pathways in male juvenile
problem behavior and delinquency. In J.D. Hawkins (Ed.), Delinquency and
crime: Current theories. (pp.1-27). Cambridge: Cambridge University Press.
Massachusetts Advocacy Center (1986). The way out: Student exclusion practices in
Boston Middle Schools. Boston, MA: Author.
May, S., Ard, W., Todd, A., Horner, R., Glasgow, A., Sugai, G., et al. (2000). School-
wide Information System (SWIS). University of Oregon: Education and
Community Supports.
Mayer, G. (1995). Preventing antisocial behavior in the schools. Journal of Applied
Behavior Analysis, 28, 467-478. doi:10.1901/jaba.1995.28-467
McCarthy, J.D. & Hoge, D.R. (1987). The social construction of school punishment:
Racial disadvantage out of universalistic process. Social Forces, 65, 1101-1120.
97
McConaghy, S.H., Kay, P.J., & Fitzgerald, M. (1999). The achieving, behaving, caring
project for preventing ED: Two-year outcomes. Journal of Emotional and
Behavioral Disorders, 7, 224-239.
McCurdy, B.L., Mannella, M.C., & Eldridge, N. (2003). Positive behavior support in
urban schools. Journal of Positive Behavior Interventions, 5, 158-170.
doi:10.1177/10983007030050030501
McFadden, A. C., Marsh, G. E., Price, B. J., & Hwang Y. (1992). A study of race and
gender bias in the punishment of school children. Education and Treatment of
Children. 15, 140-146. doi:10.1007/BF01108358
McKinney, J., Montague, M., & Hocutt, A. (1998). A two year follow up study of
children at-risk for developing SED: Initial results from a prevention project. In
C. Liberton, K. Kutash, & R, Friedman (Eds.), A system of care for children’s
mental health: Expanding the research base, Tenth annual proceedings (pp. 271-
277). Tampa: University of South Florida, Research and Training Center for
Children’s Mental Health.
McIntosh, K., Campbell, A.L., Carter, D.R., & Zumbo, B.D. (2009). Concurrent validity
of office discipline referrals and cut points used in schoolwide positive behavior
support. Behavioral Disorders, 34, 100-113.
McIntosh, K., Horner, R.H., Chard, D.J., Boland, J.B., & Good III, R.H. (2006). The use
of reading and behavior screening measures to predict nonresponse to school-
wide positive behavior support: A longitudinal analysis. School Psychology
Review, 35, 275-291.

98
Merrell, K.W. (2003). Behavioral, social, and emotional assessment of children and
adolescents (2nd ed.). Mahwah, NJ: Lawrence Erlbaum.
Messick, S. (1988). The once and future issues of validity: Assessing the meaning and
consequences of measurement. In H. Wainer & H. Braun, (Eds.), Test validity
(pp.33-45). Hillsdale, NJ: Erlbaum.
Messick, S. (1989). Validity. In R.L. Linn (Ed.), Educational measurement (3rd ed.,
pp.13-103). New York: Macmillan.
Messick, S. (1995). Validity of psychological assessment: Validation of interferences
from persons’ responses and performance as scientific inquiry into score meaning.
American Psychologist, 50, 741-749. doi:10.1037//0003-066X.50.9.741
Messick, S. (1996a). Standards-based score interpretation: Establishing valid grounds
for valid inferences. Proceedings of the joint conference on standard setting for
large scale assessments, Sponsored by National Assessment Governing Board and
The National Center for Education Statistics. Washington, DC: Government
Printing Office.
Messick, S. (1996b). Validity of Performance Assessment. In Philips, G. (1996).
Technical Issues in Large-Scale Performance Assessment. Washington, DC:
National.
Metzler, C.W., Biglan, A., Rusby, J.C., & Sprague, J.R. (2001). Evaluation of a
comprehensive behavior management program to iprove school-wide positive
behavior supports. Education and Treatment of Children, 24, 448-479.

99
Morgan-D-Atrio, C., Naquin, G., Arthur, A., & Roussel, J. (2008, March). Using the
SSBD as a real universal screener. Poster session presented at the Sixth
International Conference on Positive Behavior Support, Chicago, IL.
Morrison, G.M., & D’Incau, B. (2000). Developmental and service trajectories of
students with disabilities recommended for expulsion from school. Exceptional
Children, 66, 257–272.
Morrison, G.M., Peterson, R., O’Farrell, S., & Redding, M. (2004). Using office referral
records in school violence research: Possibilities and limitations. Journal of
School Violence, 3, 39-61. doi:10.1300/J202v03n02_04
Morrison, G.M. & Skiba, R. (2001). Predicting violence from school misbehavior.
Psychology in Schools, 38, 173-184. doi:10.1002/pits.1008
National Association of State Directors of Special Education. (2006). Response to
Intervention: Policy considerations and implementation. Alexandria, VA: Author.
National Coalition of Advocates for Students. (1988). A special analysis of 1984
elementary and secondary school civil rights survey data. Boston, MA: Author.
Nelson, J.R. (1996). Designing schools to meet the needs of students who exhibit
disruptive behavior. Journal of Emotional and Behavioral Disorders, 4, 147-161.
doi:10.1177/106342669600400302
Nelson, J.R., Benner, G.J., Reid, R.C., Epstein, M.H., & Currin, D. (2002). The
convergent validity of office discipline referrals with the CBCL-TRF. Journal of
Emotional and Behavioral Disorders, 10, 181-188.
Nelson, J.R., Gonzalez, K.E., Epstein, M.H. & Benner, G.J. (2003). Administrative
discipline contacts: A review of the literature. Behavioral Disorders, 28, 249-281.

100
Nelson, J.R., Martella, R.M., & Marchand-Martella, N. (2002). Maximizing student
learning: The effects of a comprehensive school-based program for preventing
problem behaviors. Journal of Emotional and Behavioral Disorders, 10,136-148.
Nichols, C.E., & Nichols, R.E. (1990). Dropout prediction and prevention. Brandon, VT:
Clinical Psychology Publishing.
Panko-Stilmock, J. (1996). Teacher gender and discipline referral rates for middle level
boys and girls. Lincoln, NE: Unpublished doctoral dissertation, University of
Nebraska-Lincoln.
Phillips, V., Nelson, C.M., & McLaughlin, J.F. (1993). Systems change and services for
students with emotional/behavioral disabilities in Kentucky. Journal of Emotional
and Behavioral Disorders, 1, 155-164. doi:10.1177/106342669300100303
Reynolds, C.R., & Kamphaus, R.W. (2004). Behavior Assessment Scale for Children (2nd
ed.). Circle Pines, MN: AGS Publishing.
Richardson, M.J., Caldarella, P., Young, B.J., Young, E.L., & Young, K.R. (2009).
Further validation of the systematic screening for behavior disorders in middle
and junior high school. Psychology in the Schools, 46, 605-615.
doi:10.1002/pits.20401
Rusby, J.C., Taylor, T.K., & Foster, E.M (2007). A descriptive study of school discipline
referrals in first grade. Psychology in Schools, 44, 333-350.
doi:10.1002/pits.20226
Sadler, C. & Sugai, G. (2009). Effective behavior and instructional support: A district
model for early identification and prevention of reading and behavior problems.
Journal of Positive Behavior Support, 11, 35-46. doi:10.1177/1098300708322444

101
Sailor, W. (2009). Making RtI Work. San Francisco: Jossey-Bass.
Sailor, W., Dunlap, G., Sugai, G., & Horner, R. (Eds.). (2009). Handbook of positive
behavior support. New York: Springer.
Sailor, W. & Eber, L. (2007, October). Response to intervention (RtI) model of continuum
of support: The Kansas-Illinois tertiary demonstration center. Paper presented at
the Chicago Positive Behavior Support Implementers Forum, Rosemont, IL.
Scott, T.M. & Nelson, C.M. (1999). Universal school discipline strategies: Facilitating
positive learning environments. Effective School Practices, 17(4), 54-64.
Severson, H. & Walker, H. (2002). Proactive approaches for identifying children at risk
for socio-behavior problems. In K. Lane, F. Gresham, & T. O’Shaughnessy
(Eds.), Interventions for children with or at risk for emotional and behavioral
disorders (pp. 33-54). Boston: Allyn & Bacon.
Severson, H.H., Walker, H.M., Hope-Doolittle, J., Kratchowill, T.R., & Gresham, F.M.
(2007). Proactive early screening to detect behaviorally at-risk students: Issues,
approaches, emerging, innovations, and professional practices. Journal of School
Psychology, 45, 193-223. doi:10.1016/j.jsp.2006.11.003
Shaw, S.R. & Braden, J.P. (1990). Race and gender bias in the administration of corporal
punishment. School Psychology Review, 19, 378-383.
Skiba, R. J. (2002). Special education and school discipline: A precarious balance.
Behavioral Disorders, 27, 81-97.
Skiba, R.J., Michael, R.S., Nardo, A.C., & Peterson, R. (2002). The color of discipline:
Sources of racial and gender disproportionality in school punishment. Urban
Review. 34, 317-342. doi:10.1023/A:1021320817372

102
Skiba, R.J., Peterson, R.L., & Williams, T. (1997). Office referrals and suspension:
Disciplinary intervention in middle schools. Education and Treatment of
Children, 20, 295-315.
Sprague, J., Walker, H.M., Stieber, S., Simonsen, B., Nishioka, V., & Wagner, L. (2001).
Exploring the relationship between school discipline referrals and delinquency.
Psychology in the Schools, 38, 197-206. doi:10.1002/pits.1010
SRI International, Center for Education and Human Services. (1997). The National
Longitudinal Transition Study: A Summary of Findings. Washington, DC: U.S.
Department of Education, Office of Special Education Programs.
Sugai, G. & Horner, R. (2009). Defining and Describing Schoolwide Positive Behavior
Support. In W. Sailor, G. Dunlap, G. Sugai, & R. Horner (Eds.), Handbook of
Positive Behavior Support (pp. 307-326). New York, NY: Springer.
Sugai, G., Horner, R.H., Dunlap, G., Hieneman, M., Lewis, T.J., Nelson, C.M., Scott, T.,
Liaison, C., Sailor, W., Turnbull, A.P., Turnbull, H.R., Wilcox, B., & Reuf, M.
(2000). Applying positive behavior support and functional behavior assessment in
schools. Journal of Positive Behavior Interventions, 2, 131-143.
Sugai, G., Sprague, J.R., Horner, R.H., & Walker, H.M. (2000). Preventing school
violence: The use of office discipline referrals to assess and monitor school-wide
discipline interventions. Journal of Emotional and Behavioral Disorders, 2, 94-
102. doi:10.1177/106342660000800205
Taylor-Green, S., Brown, D., Nelson, L., Longton, J., Gassman, T., Cohen, J., et al.
(1997). School-wide behavioral support: Starting the year off right. Journal of
Behavioral Education, 7, 99-112.
103
Taylor, M.C. & Foster, G.A. (1986). Bad boys and school suspensions: Public policy
implications for black males. Sociological Inquiry, 56, 498-506.
doi:10.1111/j.1475-682X.1986.tb01174.x
Thornton, C.H. & Trent, W. (1988). School desegregation and suspension in East Baton
Rouge Parish: A preliminary report. Journal of Negro Education, 57, 482-501.
doi:10.2307/2295691
Tobin, T. & Sugai, G. (1996). Patterns in middle school discipline records. Journal of
Emotional and Behavioral Disorders, 4, 82-94.
doi:10.1177/106342669600400203
Tobin, T.J. & Sugai, G.M. (1999). Using sixth-grade school records to predict school
violence, chronic discipline problems, and high school outcomes. Journal of
Emotional and Behavioral Disorders, 7, 40-53.
Todis, B., Severson, H.H., & Walker, H.M. (1990). The critical events scale: Behavioral
profiles of students with externalizing behavior disorders. Behavioral Disorders,
15, 75-86.
Trout, A.L., Epstein, M.H., Nelson, R., Synhorst, L., & Hurley, K.D. (2006). Profiles of
children served in early intervention programs for behavioral disorders: Early
literacy and behavioral characteristics. Topics in Early Childhood Special
Education, 26, 206-218. doi:10.1177/02711214060260040201
Walker, B., Cheney, D., Stage, S., & Blum, C. (2005). Schoolwide screening and positive
behavior supports: Identifying and supporting students at risk for school failure.
Journal of Positive Behavior Interventions, 7, 194-204.
doi:10.1177/10983007050070040101

104
Walker, H., & Severson, H. (1990). Systematic screening for behavior disorders (SSBD):
Forms and manuals. Longmont, CO: Sopris West.
Walker, H. & Severson, H.H. (1992). Systematic screening for behavior disorders (2nd
ed.).. Longmont, CO: Sopris West.
Walker, H.M., Severson, H.H., Nicholson, F., Kehle, T., Jenson, W.R., & Clark, E.
(1994). Replication of the systematic screening for behavior disorders (SSBD)
procedure for the identification of at-risk children. Journal of Emotional and
Behavioral Disorders, 2, 66-77. doi:10.1177/106342669400200201
Walker, H., Severson, H., Stiller, B., Williams, G. Haring, N., Shinn, M., & Todis, B.
(1988). Systematic screening of pupils in the elementary age range at risk for
behavior disorders: Development and trial testing of a multiple gating model.
Remedial and Special Education, 9(3), 8-14. doi:10.1177/074193258800900304
Walker, H.M., Severson, H.H., Todis, B.J., Block-Pedego, A.E., Williams, G.J., Haring,
N.G., & Barckley, M. (1990). Systematic screening for behavior disorders
(SSBD): Further validation, replication, and normative data. RASE, 11, 32-46.
doi:10.1177/074193259001100206
Walker, H.M., Steiber, S., & O’Neill, R.E. (1990). Middle school behavioral profiles of
antisocial and at-risk control boys: Descriptive and predictive outcomes.
Exceptionality, 1, 61-77. doi:10.1080/09362839009524742
Walser, N. (2007, JanuaryFebruary). Response to intervention: A new approach to
reading instruction aims to catch struggling readers early. Harvard Education
Letter. Last retrieved April 23, 2007, from
http://www.edletter.org/current/response.shtml (no longer available)

105
Winbinger, B., Katsiyannis, A., & Archwamety, T. (2000). Disciplinary practices in
Nebraska’s public schools. Journal of Child and Family Studies, 9, 389-399.
doi:10.1023/A:1026452709160
Woodcock, R. W. (1998). Woodcock reading mastery tests-Revised. Circle Pines, MN:
American Guidance Service.
Wu, S.C., Pink, W.T., Crain, R.L., & Moles, O. (1982). Student suspension: A critical
reappraisal. The Urban Review, 14, 245-303. doi:10.1007/BF02171974
Young, E., Sabbah, H.Y., Young, B.J., Reiser, M.L., & Richardson, M.J. (2010). Gender
differences and similarities in the screening process for emotional and behavioral
risks in secondary schools. Journal of Emotional and Behavioral Disorders, 18,
225-235.
doi: 10.1177/1063426609338858.
Zlomke, L.C. & Spies, R. (1998). Review of the Systematic Screening for Behavior
Disorders. In J.C. Impara, B.S. Plake, & L.L. Murphy (Eds.), The thirteenth
mental measurements yearbook (pp. 995-996). Lincoln, NE: Buros Institute.