A deep learning methodology for the automated detection of ...
13
Vol.:(0123456789) 1 3 The International Journal of Cardiovascular Imaging (2021) 37:1825–1837 https://doi.org/10.1007/s10554-021-02162-x ORIGINAL PAPER A deep learning methodology for the automated detection of end‑diastolic frames in intravascular ultrasound images Retesh Bajaj 1,2 · Xingru Huang 3 · Yakup Kilic 1 · Ajay Jain 1 · Anantharaman Ramasamy 1,2 · Ryo Torii 4 · James Moon 1,5 · Tat Koh 1 · Tom Crake 1 · Maurizio K. Parker 2 · Vincenzo Tufaro 1,2 · Patrick W. Serruys 6 · Francesca Pugliese 1,2 · Anthony Mathur 1,2 · Andreas Baumbach 1,2 · Jouke Dijkstra 7 · Qianni Zhang 3 · Christos V. Bourantas 1,2,5 Received: 6 November 2020 / Accepted: 7 January 2021 / Published online: 15 February 2021 © The Author(s) 2021 Abstract Coronary luminal dimensions change during the cardiac cycle. However, contemporary volumetric intravascular ultrasound (IVUS) analysis is performed in non-gated images as existing methods to acquire gated or to retrospectively gate IVUS images have failed to dominate in research. We developed a novel deep learning (DL)-methodology for end-diastolic frame detection in IVUS and compared its efficacy against expert analysts and a previously established methodology using electrocardio- graphic (ECG)-estimations as reference standard. Near-infrared spectroscopy-IVUS (NIRS-IVUS) data were prospectively acquired from 20 coronary arteries and co-registered with the concurrent ECG-signal to identify end-diastolic frames. A DL-methodology which takes advantage of changes in intensity of corresponding pixels in consecutive NIRS-IVUS frames and consists of a network model designed in a bidirectional gated-recurrent-unit (Bi-GRU) structure was trained to detect end-diastolic frames. The efficacy of the DL-methodology in identifying end-diastolic frames was compared with two expert analysts and a conventional image-based (CIB)-methodology that relies on detecting vessel movement to estimate phases of the cardiac cycle. A window of ± 100 ms from the ECG estimations was used to define accurate end-diastolic frames detection. The ECG-signal identified 3,167 end-diastolic frames. The mean difference between DL and ECG estimations was 3 ± 112 ms while the mean differences between the 1st-analyst and ECG, 2nd-analyst and ECG and CIB-methodology and ECG were 86 ± 192 ms, 78 ± 183 ms and 59 ± 207 ms, respectively. The DL-methodology was able to accurately detect 80.4%, while the two analysts and the CIB-methodology detected 39.0%, 43.4% and 42.8% of end-diastolic frames, respec- tively (P < 0.05). The DL-methodology can identify NIRS-IVUS end-diastolic frames accurately and should be preferred over expert analysts and CIB-methodologies, which have limited efficacy. Keywords Intravascular ultrasound · Near-infrared spectroscopy · Machine learning Introduction Intravascular ultrasound (IVUS) is the preferred intravascu- lar imaging modality for the evaluation of coronary plaque burden and the efficacy of emerging therapies targeting Retesh Bajaj and Xingru Huang have contributed equally to this work. * Christos V. Bourantas [email protected] 1 Department of Cardiology, Barts Heart Centre, Barts Health NHS Trust, West Smithfield, London EC1A 7BE, UK 2 Centre for Cardiovascular Medicine and Devices, William Harvey Research Institute, Queen Mary University of London, London, UK 3 School of Electronic Engineering and Computer Science, Queen Mary University of London, London, UK 4 Department of Mechanical Engineering, University College London, London, UK 5 Institute of Cardiovascular Sciences, University College London, London, UK 6 Faculty of Medicine, National Heart & Lung Institute, Imperial College London, London, UK 7 Department of Radiology, Division of Image Processing, Leiden University Medical Center, Leiden, The Netherlands
Transcript of A deep learning methodology for the automated detection of ...
Vol.:(0123456789)1 3
The International Journal of Cardiovascular Imaging (2021) 37:1825–1837 https://doi.org/10.1007/s10554-021-02162-x
ORIGINAL PAPER
A deep learning methodology for the automated detection of end‑diastolic frames in intravascular ultrasound images
Retesh Bajaj1,2 · Xingru Huang3 · Yakup Kilic1 · Ajay Jain1 · Anantharaman Ramasamy1,2 · Ryo Torii4 · James Moon1,5 · Tat Koh1 · Tom Crake1 · Maurizio K. Parker2 · Vincenzo Tufaro1,2 · Patrick W. Serruys6 · Francesca Pugliese1,2 · Anthony Mathur1,2 · Andreas Baumbach1,2 · Jouke Dijkstra7 · Qianni Zhang3 · Christos V. Bourantas1,2,5
Received: 6 November 2020 / Accepted: 7 January 2021 / Published online: 15 February 2021 © The Author(s) 2021
AbstractCoronary luminal dimensions change during the cardiac cycle. However, contemporary volumetric intravascular ultrasound (IVUS) analysis is performed in non-gated images as existing methods to acquire gated or to retrospectively gate IVUS images have failed to dominate in research. We developed a novel deep learning (DL)-methodology for end-diastolic frame detection in IVUS and compared its efficacy against expert analysts and a previously established methodology using electrocardio-graphic (ECG)-estimations as reference standard. Near-infrared spectroscopy-IVUS (NIRS-IVUS) data were prospectively acquired from 20 coronary arteries and co-registered with the concurrent ECG-signal to identify end-diastolic frames. A DL-methodology which takes advantage of changes in intensity of corresponding pixels in consecutive NIRS-IVUS frames and consists of a network model designed in a bidirectional gated-recurrent-unit (Bi-GRU) structure was trained to detect end-diastolic frames. The efficacy of the DL-methodology in identifying end-diastolic frames was compared with two expert analysts and a conventional image-based (CIB)-methodology that relies on detecting vessel movement to estimate phases of the cardiac cycle. A window of ± 100 ms from the ECG estimations was used to define accurate end-diastolic frames detection. The ECG-signal identified 3,167 end-diastolic frames. The mean difference between DL and ECG estimations was 3 ± 112 ms while the mean differences between the 1st-analyst and ECG, 2nd-analyst and ECG and CIB-methodology and ECG were 86 ± 192 ms, 78 ± 183 ms and 59 ± 207 ms, respectively. The DL-methodology was able to accurately detect 80.4%, while the two analysts and the CIB-methodology detected 39.0%, 43.4% and 42.8% of end-diastolic frames, respec-tively (P < 0.05). The DL-methodology can identify NIRS-IVUS end-diastolic frames accurately and should be preferred over expert analysts and CIB-methodologies, which have limited efficacy.
Keywords Intravascular ultrasound · Near-infrared spectroscopy · Machine learning
Introduction
Intravascular ultrasound (IVUS) is the preferred intravascu-lar imaging modality for the evaluation of coronary plaque burden and the efficacy of emerging therapies targeting Retesh Bajaj and Xingru Huang have contributed equally to this
work.
* Christos V. Bourantas [email protected]
1 Department of Cardiology, Barts Heart Centre, Barts Health NHS Trust, West Smithfield, London EC1A 7BE, UK
2 Centre for Cardiovascular Medicine and Devices, William Harvey Research Institute, Queen Mary University of London, London, UK
3 School of Electronic Engineering and Computer Science, Queen Mary University of London, London, UK
4 Department of Mechanical Engineering, University College London, London, UK
5 Institute of Cardiovascular Sciences, University College London, London, UK
6 Faculty of Medicine, National Heart & Lung Institute, Imperial College London, London, UK
7 Department of Radiology, Division of Image Processing, Leiden University Medical Center, Leiden, The Netherlands
1826 The International Journal of Cardiovascular Imaging (2021) 37:1825–1837
1 3
plaque evolution [1]. Grayscale-IVUS analysis in intravas-cular imaging studies is usually performed at 1-mm intervals ignoring the phase of the cardiac cycle [2], even though this approach neglects cyclical changes in luminal dimensions and the longitudinal motion of the IVUS catheter within the vessel, which can affect accurate quantification of atheroma [3–5]. It has been suggested that gated-IVUS analysis may be more accurate and reproducible [6, 7]; however, commercial catheters in contemporary use do not incorporate an electro-cardiographic (ECG)-signal to allow the end-diastolic frame to be discerned. Whilst hardware for gated-IVUS acquisition has been developed, it has not found widespread use partly due to the increased time required for image acquisition [8]. Moreover, the automated methodologies developed to retrospectively-gate IVUS images, taking advantage of the relative movement of the lumen with regards to the IVUS catheter, have failed to dominate in research as most of them have not been robustly validated against ECG estimations as reference standard or they have not been incorporated in user-friendly software [9–17]. Over recent years, deep learning (DL) algorithms have gained interest as potential solutions for the rapid and accurate analysis of large datasets in cardiac imaging [18]. These approaches rely on the use of a pre-defined reference standard to train algorithms that can detect features on a training dataset and then apply these algorithms on new data. Despite the potential value of this approach, its application in intravascular imaging has not been fully explored yet [19–24].
It is hypothesised that a DL-based methodology will be able to detect end-diastolic frames in IVUS datasets and may be superior to human experts and previous automated methodologies. The aims of this study are: (a) to develop and train a novel DL-based methodology for automated detection of end-diastolic frames in IVUS sequences, (b) examine the reproducibility of expert analysts in detecting end-diastolic IVUS frames and (c) validate the performance of DL, the expert analysts and an established, conventional image-based (CIB)-methodology in detecting end-diastolic frames in patients with co-registered IVUS images and ECG-recordings.
Methods
Study population
Twenty coronary arteries from six consecutive patients in sinus rhythm who were recruited to the “Evaluation of the efficacy of computed tomographic coronary angiography (CTCA) in assessing coronary artery morphology and physi-ology” study (NCT03556644), were included in the present analysis. The rationale, study design, and inclusion and exclusion criteria have been presented in detail elsewhere
[25]. Briefly, patients with stable angina and obstructive coronary disease on coronary angiography referred to Barts Heart Centre for invasive assessment were considered eli-gible for participation. All patients underwent CTCA fol-lowed by coronary catheterisation and 3-vessel near-infrared spectroscopy (NIRS)-IVUS imaging. Only native vessels were included in the study. The study protocol complied with the Declaration of Helsinki and was approved by the local research ethics committee. All recruited patients gave written informed consent.
Intravascular ultrasound analysis and ECG co‑registration
NIRS-IVUS imaging was performed using the 50 MHz Dualpro system (Infraredx, Burlington, Massachusetts, United States) according to a standardised protocol. After administration of 400mcg of nitrates the NIRS-IVUS probe was advanced to the distal part of the vessel and an angio-graphic projection was obtained under contrast agent injec-tion to identify the location of the probe. The probe was pulled back at a constant speed of 0.5 mm/s using an auto-mated pullback device (frame-rate: 30 frames per second (fps)). A concurrent ECG tracing was recorded at the time of pullback. The NIRS-IVUS data and the ECG tracing were imported in a viewer-mixer that enabled simultaneous visu-alisation of the two recordings; the displays of the viewer-mixer were recorded at 120fps and digital video files were transferred to an offline workstation for further analysis.
Manual end‑diastolic frame detection
Analysis was performed by two well-trained analysts (RB and YK) who have segmented > 375,000 NIRS-IVUS frames. The two analysts reviewed the digital-video files that simultaneously portrayed the NIRS-IVUS pullback and the ECG tracing and identified each NIRS-IVUS frame that corresponded to the peak of the R-wave as an end-diastolic frame. These ECG estimations were checked by a third ana-lyst (CVB); any conflicts were resolved by consensus.
Two months after this process the two analysts reviewed the original NIRS-IVUS sequences blindly to the ECG and manually identified the end-diastolic frames; in this analysis, it was assumed that the NIRS-IVUS frame with the minimal lumen motion before the largest movement of the lumen in relation to the NIRS-IVUS catheter corresponded to the end-diastolic frame. The 1st-analyst performed the analysis twice (3 weeks apart) to report intra-observer variability while the estimations of the 2nd-analyst were used to report inter-observer variability.
To explore the effect of frame rate on the estimations of the two analysts, a second analysis was performed in NIRS-IVUS sequences with a frame rate of 15fps; these data were
1827The International Journal of Cardiovascular Imaging (2021) 37:1825–1837
1 3
obtained after excluding 1 of every 2 frames from each sequence. Again, intra- and inter-observer variability were reported and their estimations compared to ECG estima-tions, which were calculated by halving the frame number of the initial ECG estimations.
Conventional image‑based gating algorithm
CIB-gating was performed in the NIRS-IVUS data using a special version of the QCU-CMS software (version 4.69, Leiden University Medical Center, Leiden, The Nether-lands) by implementing an established solution, the only one that has previously been incorporated in a user-friendly software package for IVUS analysis [10]. This approach is further described in the Data Supplement. The CIB algo-rithm processed the NIRS-IVUS sequences twice and its intra-observer variability was reported.
Deep learning methodology
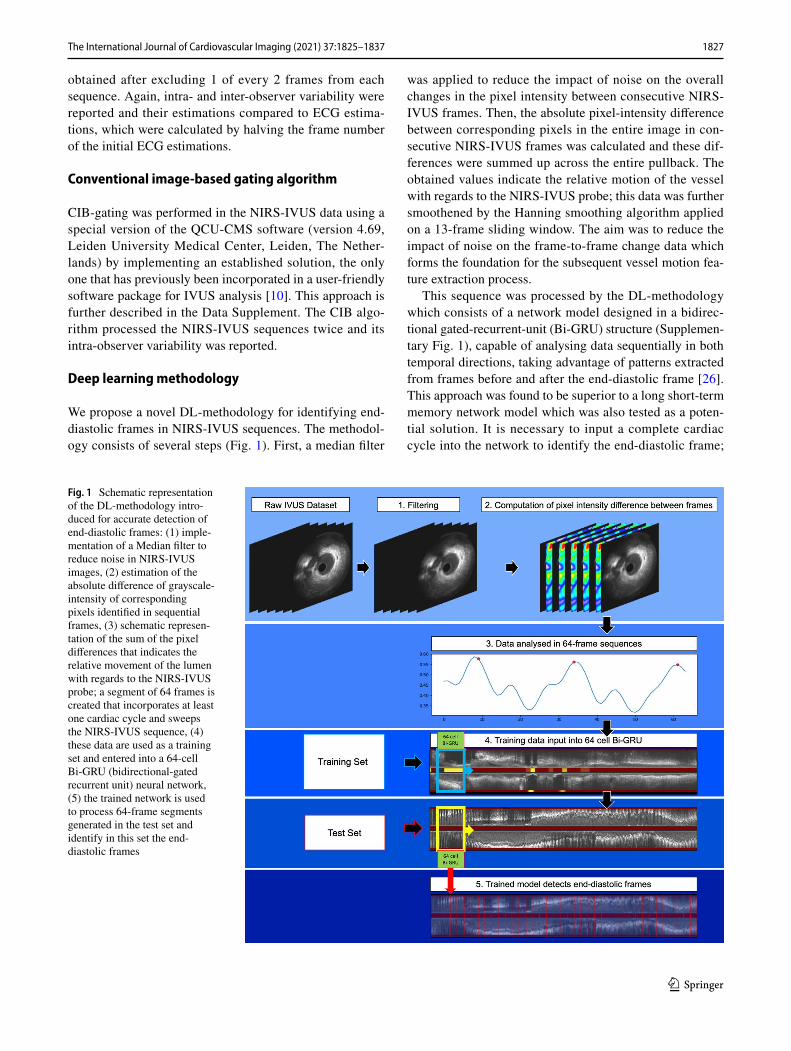
We propose a novel DL-methodology for identifying end-diastolic frames in NIRS-IVUS sequences. The methodol-ogy consists of several steps (Fig. 1). First, a median filter
was applied to reduce the impact of noise on the overall changes in the pixel intensity between consecutive NIRS-IVUS frames. Then, the absolute pixel-intensity difference between corresponding pixels in the entire image in con-secutive NIRS-IVUS frames was calculated and these dif-ferences were summed up across the entire pullback. The obtained values indicate the relative motion of the vessel with regards to the NIRS-IVUS probe; this data was further smoothened by the Hanning smoothing algorithm applied on a 13-frame sliding window. The aim was to reduce the impact of noise on the frame-to-frame change data which forms the foundation for the subsequent vessel motion fea-ture extraction process.
This sequence was processed by the DL-methodology which consists of a network model designed in a bidirec-tional gated-recurrent-unit (Bi-GRU) structure (Supplemen-tary Fig. 1), capable of analysing data sequentially in both temporal directions, taking advantage of patterns extracted from frames before and after the end-diastolic frame [26]. This approach was found to be superior to a long short-term memory network model which was also tested as a poten-tial solution. It is necessary to input a complete cardiac cycle into the network to identify the end-diastolic frame;
Fig. 1 Schematic representation of the DL-methodology intro-duced for accurate detection of end-diastolic frames: (1) imple-mentation of a Median filter to reduce noise in NIRS-IVUS images, (2) estimation of the absolute difference of grayscale-intensity of corresponding pixels identified in sequential frames, (3) schematic represen-tation of the sum of the pixel differences that indicates the relative movement of the lumen with regards to the NIRS-IVUS probe; a segment of 64 frames is created that incorporates at least one cardiac cycle and sweeps the NIRS-IVUS sequence, (4) these data are used as a training set and entered into a 64-cell Bi-GRU (bidirectional-gated recurrent unit) neural network, (5) the trained network is used to process 64-frame segments generated in the test set and identify in this set the end-diastolic frames
1828 The International Journal of Cardiovascular Imaging (2021) 37:1825–1837
1 3
however, an extra cardiac cycle can help the network bet-ter identify the motion of the vessel and localise the frame of interest. Based on these considerations, a meaningful sequence-length for training the DL-algorithm was assumed to contain at least two full cardiac cycles. The majority of end-diastolic frame intervals in the training dataset were between 19 and 30 frames, therefore a segment length of 64 frames was used. That segment started from the beginning of the smoothened sequence and advanced frame-by-frame until this swept the entire studied vessel. In this way, for every NIRS-IVUS sequence n-63 segments of 64 frames were generated where n is the number of NIRS-IVUS frames. These segments were regarded as the basic units for training the DL model; training was performed separately in the left anterior descending (LAD), left circumflex (LCx) and right coronary artery (RCA) using the ECG-defined end-diastolic frames to generate models for each vessel type.
The choice of loss function used for the Bi-GRU model was mean square error and learning rates in all experiments were set to 1e−3 . The maximum training epoch was 50 with batch size set to 1 during all experiments. As the model is ready-trained using the data without any manual fine tuning of hyperparameters, no validation set was required in this experiment.
Testing of the DL models was performed using the leave-one-out cross-validation approach—all pullbacks performed in the LAD, or the LCx, or the RCA were used for training apart from one vessel from each vessel type (LAD/LCx/RCA) that was used for testing. This process was repeated sequentially leaving a different vessel out from the train-ing set until all vessels were used for testing. Similar to the training set, a 64-frame segment was generated that swept the entire NIRS-IVUS sequence. For each segment, the probability of the 32nd frame to be the end-diastolic frame was calculated and the frames with the highest probability amongst neighbouring frames were selected and constituted the network output. The DL-methodology analysed the NIRS-IVUS images twice and its intra-observer variability was reported.
Statistical methods
Numerical variables are presented as mean ± standard deviation (SD) while categorical variables are reported as absolute values and percentages. Comparison between cat-egorical variables was performed using the Chi-square test. Bland–Altman analysis was used to assess the intra- and inter-observer variability of the analysts and compare their estimations and the estimations of the CIB- and DL-meth-odology against the end-diastolic frames identified by the ECG. The root mean square error (RMSE) between the esti-mations of the analysts, the CIB, the DL-methodology and
the ECG were computed and compared. Considering that the temporal resolution of NIRS-IVUS imaging is 33.3 ms (30fps) we used a fixed cut-off range of ± 100 ms from the peak of R-wave on ECG to define correct end-diastolic frame detection (Fig. 2). In the absence of “true/false negatives” we defined the accuracy of each of the above approaches as the percentage of the correct end-diastolic frames from the end-diastolic frame estimations corresponding with a car-diac cycle. A P-value of < 0.05 was taken to be statistically significant. Statistical analyses were performed using SPSS for Mac version 23 (IBM, Armonk, New York).
Results
Studied patients
The baseline characteristics of the included patients are shown in Table 1. NIRS-IVUS imaging was performed in 20 vessels [6 LAD, 9 LCx (3 performed in the main vessel and 6 in major obtuse marginals) and 5 RCA]; the total num-ber of acquired frames was 92,526, of which 3271 frames were classified as end-diastolic frames by ECG-signal. From these, we excluded 104 frames due to image artefacts obscuring detection of the peak of R-wave or identifica-tion of frame number. Therefore, in total 3167 frames were included in the final analysis.
End‑diastolic frame detection in NIRS‑IVUS sequences with a frame‑rate of 30fps
The representative analysis time for an analyst identifying end-diastolic frames manually for a representative 5000-frame vessel was approximately 15 min. Automated meth-odologies were significantly quicker: the CIB-methodology required 135 s while the DL-methodology required 15 s for the same number of frames to be analysed.
The 1st-analyst identified 3144 end-diastolic frames; 3034 estimations corresponded with the ECG-defined car-diac cycle; 133 estimations could not be matched with the ECG estimations as there were other annotations closer to the peak of R-wave, while in 110 cases the analyst failed to identify an end-diastolic frame for a cardiac cycle. Simi-lar results were reported when analysis was repeated by the 1st-analyst or when end-diastolic frame detection was performed by the 2nd-analyst (Table 2). There was no dif-ference between the analysts and the CIB-methodology in the incidence of frames that were matched with the ECG estimations, of frames that could not be matched to ECG estimations and to missed end-diastolic frames for a car-diac cycle (P = 0.182). Conversely, the DL-methodology missed cardiac cycles more frequently than the analysts
1829The International Journal of Cardiovascular Imaging (2021) 37:1825–1837
1 3
or the CIB-methodology (P ≤ 0.010). Vessel-level analysis demonstrated that this difference was mainly due to a larger number of missed end-diastolic frames in the LAD. In the LCx, the analysts were more likely to detect additional end-diastolic frames not corresponding to ECG estimations than the CIB- and DL-methodologies. Finally, in the RCA, the CIB- and DL-methodologies were found to more frequently identify extra end-diastolic frames not detected on ECG than the two analysts.
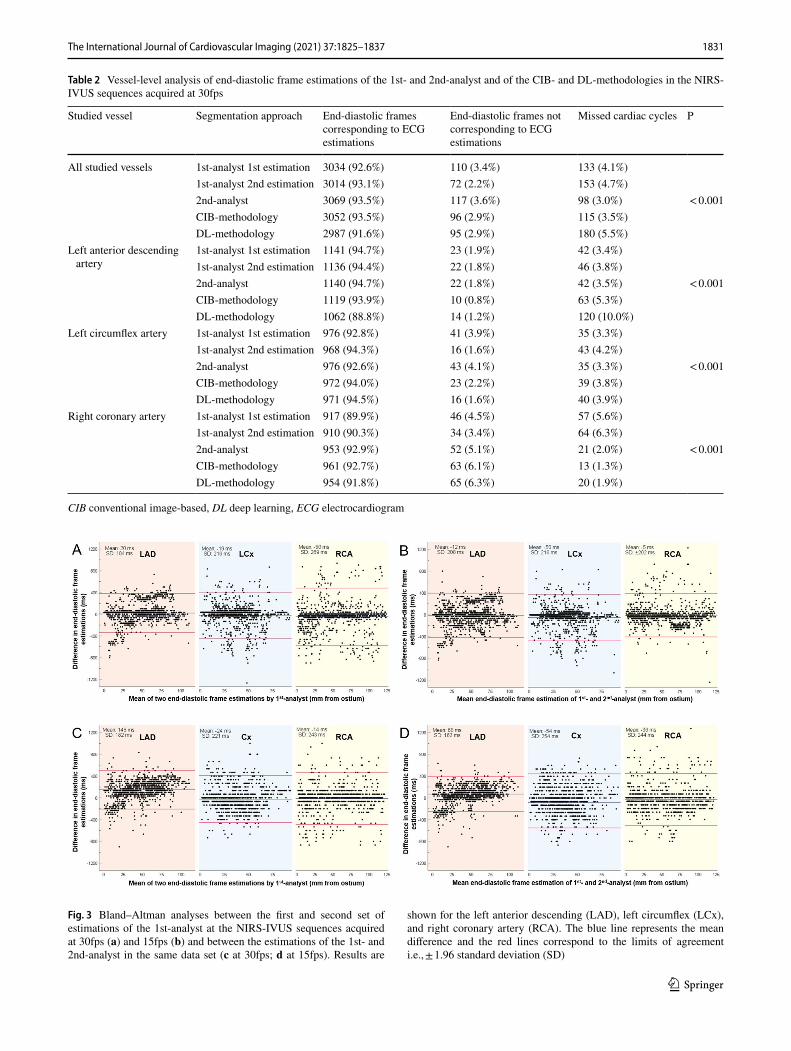
Bland–Altman analysis demonstrated an intra- and inter-observer variability for the detected end-diastolic frames in all the studied vessels of 13 ± 224 ms and 23 ± 227 ms, respectively. This was in contrast to the CIB- and DL-meth-odologies which were perfectly reproducible, identifying exactly the same end-diastolic frames in repeated analyses. The vessel type did not impact the intra- or inter-observer agreement (Fig. 3).
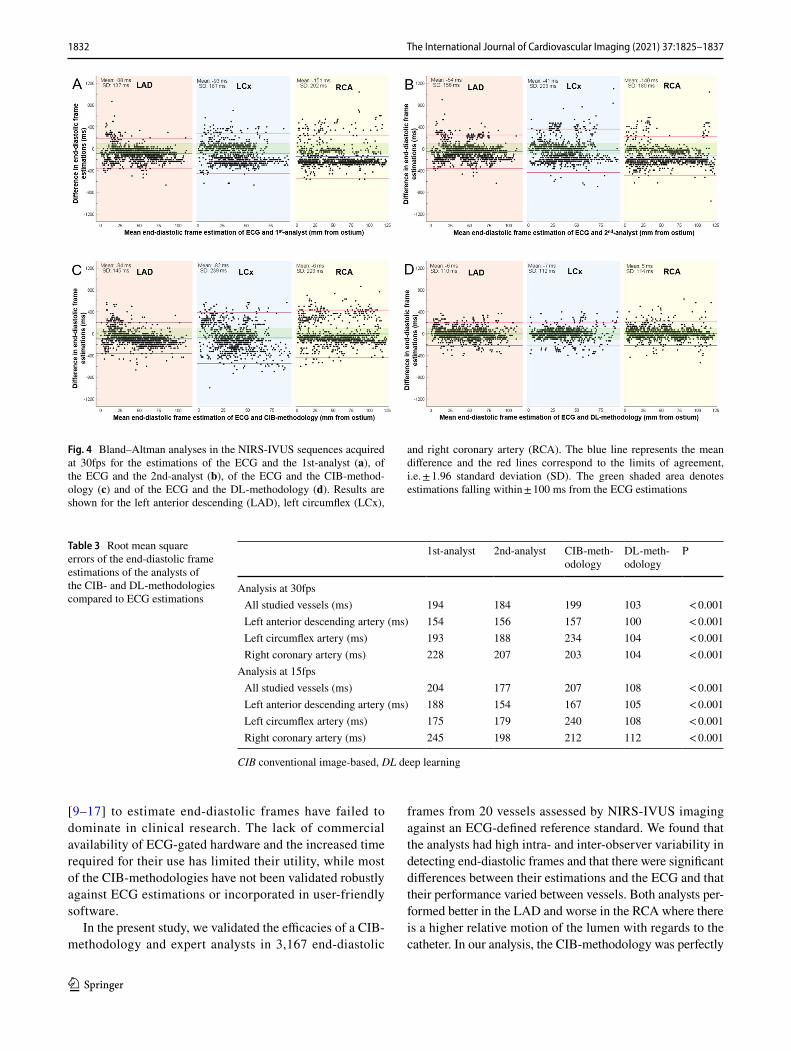
Figure 4 illustrates the Bland–Altman analyses between ECG estimations and the estimations of the 1st-analyst, 2nd-analyst, CIB- and DL-methodologies. The differences between the estimations of the analysts and ECG or between the CIB-methodology and ECG were similar (86 ± 192 ms for the 1st-analyst, 78 ± 183 ms for the 2nd-analyst, 59 ± 207 ms for the CIB-methodology); conversely the DL-methodology was more accurate, with a smaller mean dif-ference between its estimations and the ECG (3 ± 112 ms). These findings were consistent in all three coronary arter-ies. RMSE analysis also confirmed the superiority of DL-methodology (Table 3).
Using a cut-off of ± 100 ms difference from ECG esti-mations to define correct end-diastolic frame detection, we found that the 1st-analyst correctly identified 1182 frames
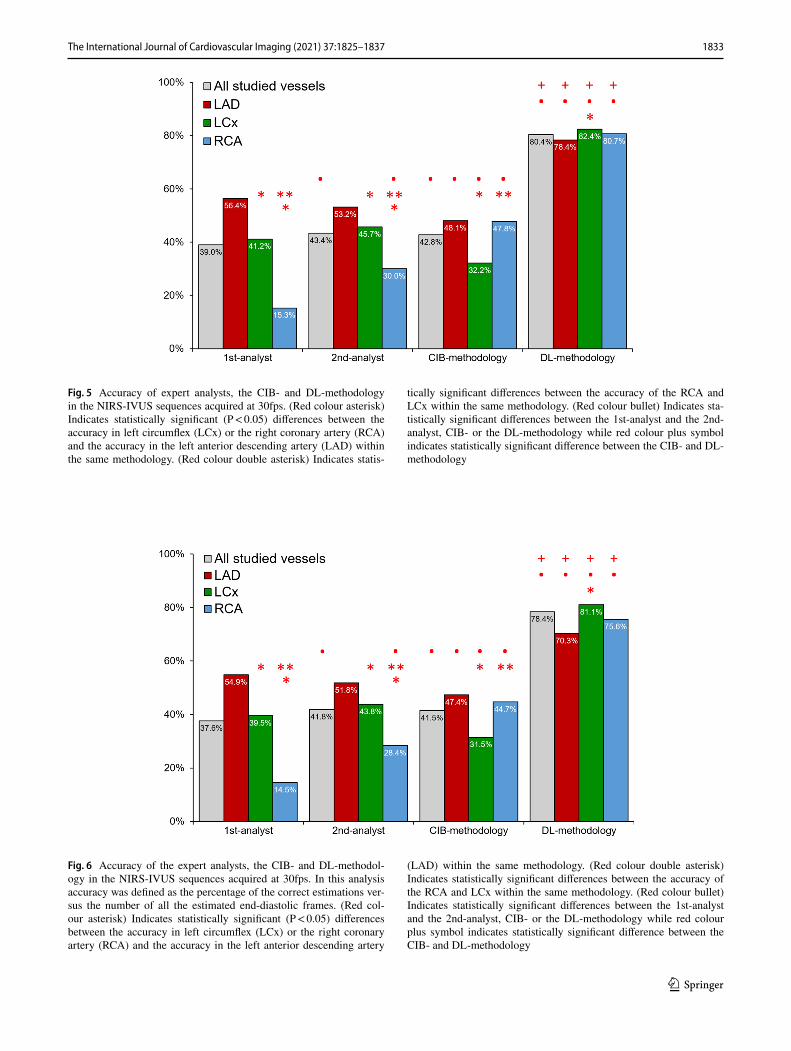
(39.0%), the 2nd-analyst 1333 (43.4%), the CIB-methodol-ogy 1306 (42.8%) and the DL-methodology 2401 (80.4%) frames (Fig. 5, P < 0.05). The accuracy of the analysts was significantly better for the LAD and LCx, compared to the RCA (P < 0.05), while the CIB-methodology was more accu-rate in the LAD and RCA compared to the LCx (P < 0.001). DL had excellent accuracy and was superior to the analysts and the CIB-methodology in all 3 coronary arteries and appeared to perform better in the LCx than the LAD. Results were not different when accuracy was defined as the ratio of correctly identified end-diastolic frames versus all frames estimated by each approach (Fig. 6).
The results were similar when we took into account patient heart rate variability and defined accurate end-dias-tolic frame detection as estimations falling within ± 10% of the R-R interval from the peak of R-wave. An accuracy of 68.0% was reported for the DL-methodology; the accuracy of the 1st-analyst was 35.6%, of the 2nd 29.7% and of the CIB-methodology 29.7%.
End‑diastolic frame detection in NIRS‑IVUS sequences with a frame‑rate of 15fps
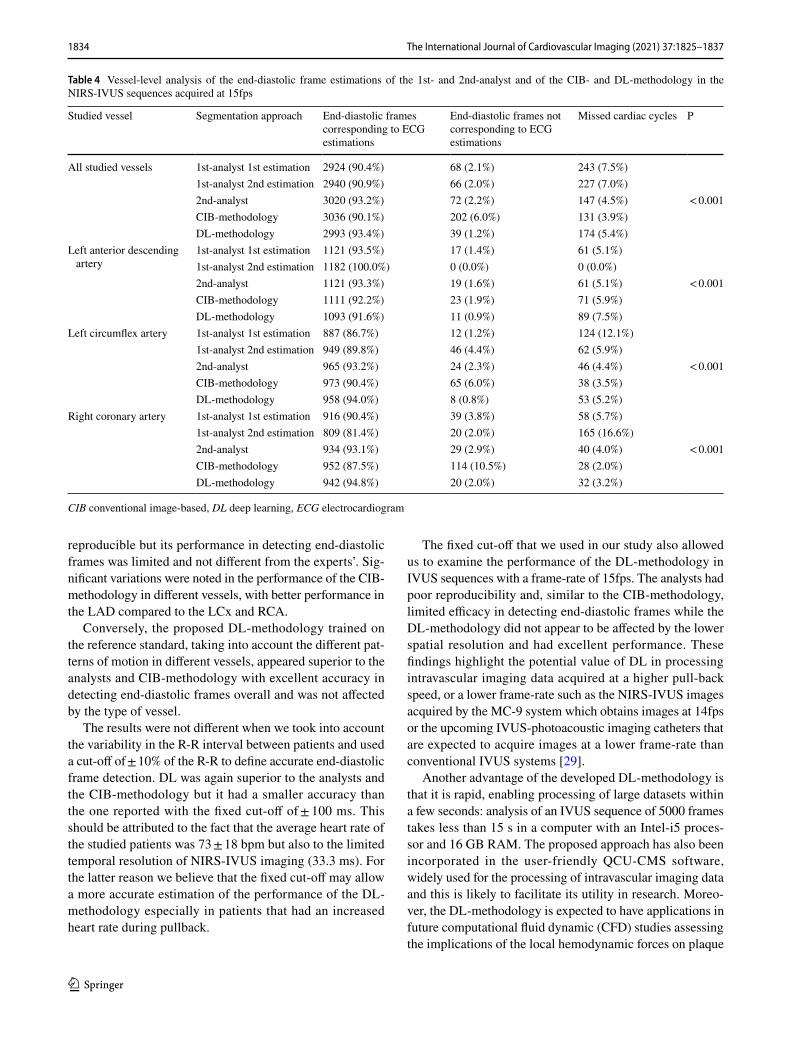
The results from analysis at a frame-rate of 15fps are shown in Table 4. The CIB-methodology in this dataset detected more end-diastolic frames that did not correspond with ECG compared to the analysts or the DL-methodology. Vessel-level analysis indicated that this difference was driven by the performance of the CIB-methodology in the LCx and RCA. The DL-methodology performed similarly to the analysts in terms of detecting extra end-diastolic frames, but as before
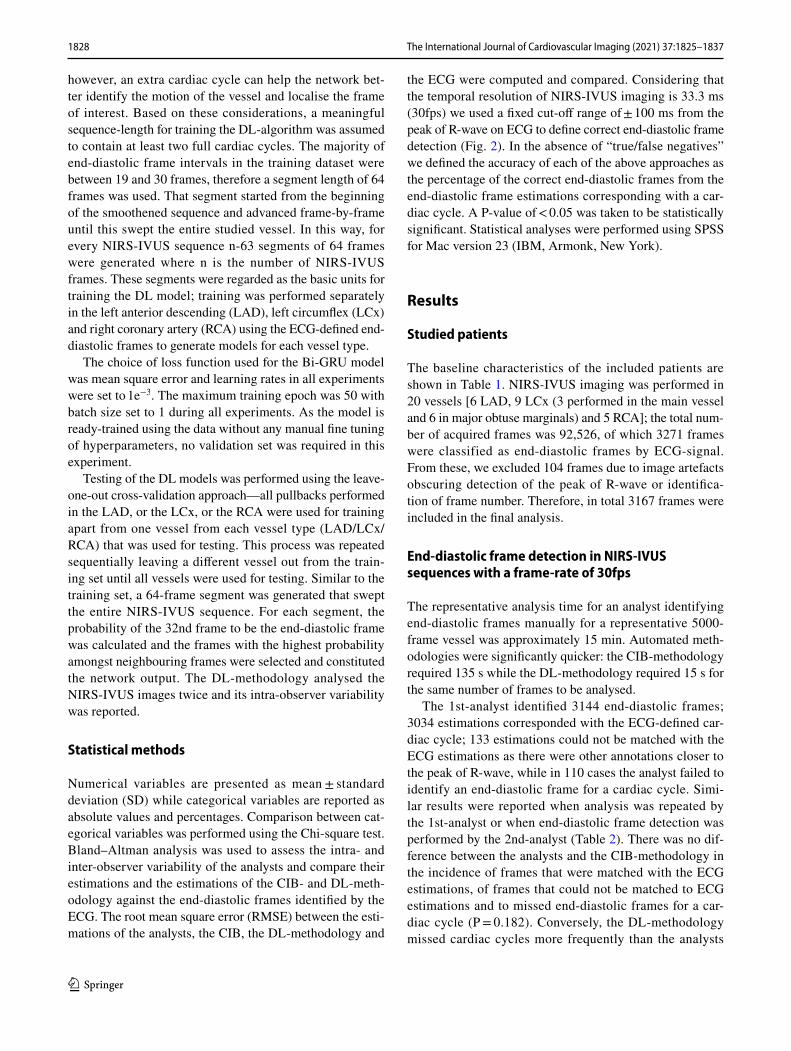
Fig. 2 ECG recording with the corresponding NIRS-IVUS frames acquired at different phases of the cardiac cycle. The IVUS frame corresponding to the peak of the R-wave was defined by the ECG as the end-diastolic frame (green line). The green shaded area represents a period within ± 100 ms of the peak of R-wave. Frames detected by the analysts or the CIB- or DL-methodologies that fell in the green shaded area were classified as correctly detected end-diastolic frames.
It is apparent in the NIRS-IVUS frames above the ECG that there is no motion of the lumen with regards to the NIRS-IVUS probe in frames that correspond to the end-diastolic period (shown with a green or a yellow colour); conversely the relative movement of the lumen with regards to the NIRS-IVUS probe is increased in the frames that do not correspond to the end-diastolic period and are por-trayed with an orange colour
1830 The International Journal of Cardiovascular Imaging (2021) 37:1825–1837
1 3
it missed more end-diastolic frames than the analysts or the CIB-methodology in the LAD.
Similar to the 30fps analyses, the intra- (26 ± 240 ms for all vessels) and inter-observer (26 ± 221 ms for all vessels) variability was higher for the estimations of the analysts when compared to the CIB- and DL-methodologies that were again perfectly reproducible (Fig. 3).
Bland–Altman analyses of frames identified by the ECG, 1st-analyst, 2nd-analyst, CIB- and DL-methodologies are shown in the Supplementary Fig. 2. The agreement between DL and ECG estimations (3 ± 117 ms) was higher than the agreement between ECG and 1st-analyst (76 ± 315 ms), 2nd-analyst (46 ± 186 ms) or CIB-methodology (13 ± 223 ms).
These findings were consistent in all three coronary arteries. RMSE analysis again confirmed the superiority of the DL-methodology (Table 3). The DL-methodology had a signifi-cantly higher accuracy than the analysts or the CIB approach in detecting the correct end-diastolic frame in all 3 coronary arteries (Supplementary Fig. 3).
Discussion
In this study, we have introduced, trained and tested for the first time a novel DL-methodology for detecting end-dias-tolic frames in NIRS-IVUS sequences using ECG-defined estimations as the reference standard. The novelty of the proposed framework relies on the use of a Bi-GRU network, for learning and processing in a bidirectional fashion the temporal information in IVUS sequences to detect end-dias-tolic frames. We found that, (1) expert analysts have limited accuracy and reproducibility in identifying end-diastolic frames, (2) the CIB-methodology, while more reproduc-ible, has similar accuracy to expert analysts, (3) the effi-cacy of the analysts and CIB-methodology varies dependent on vessel type and (4) the DL-methodology is superior to expert analysts and the CIB-methodology, and has an excel-lent accuracy in identifying end-diastolic frames in all three coronary arteries.
The merits of analysing IVUS images obtained at the same phase of the cardiac cycle to accurately quantify volu-metric changes in atheroma burden in longitudinal IVUS studies are well recognised. Previous studies have demon-strated that the lumen area can vary significantly, by as much as 10% in disease-free segments, during the cardiac cycle [4, 5]. Moreover, reports have demonstrated that the longi-tudinal motion of the IVUS catheter in the vessel during a cardiac cycle can reach up to 5.5 mm [3, 27]. A simulation study conducted by de Winter et al. showed that these fac-tors can impact the efficacy of non-gated IVUS analysis in detecting changes in plaque burden in longitudinal studies; in their analysis, to detect a 3% decrease in plaque burden at follow-up, gated-IVUS analysis would require 26 vessels, while non-gated IVUS 254 vessels [7]. These findings were not confirmed by a report which included 19 vessels which were assessed twice by gated and non-gated IVUS; in this study, the differences in lumen, external elastic membrane and plaque volume between the two IVUS examinations were numerically smaller when analysis was performed using an ECG-gated device, but not statistically significant from the differences reported in the non-gated IVUS analy-sis [28]. This may be explained by the fact that the study is lacking the power to demonstrate the superiority of the ECG-gated analysis.
Hardware designed to selectively acquire gated IVUS frames [8] and automated image-based methodologies
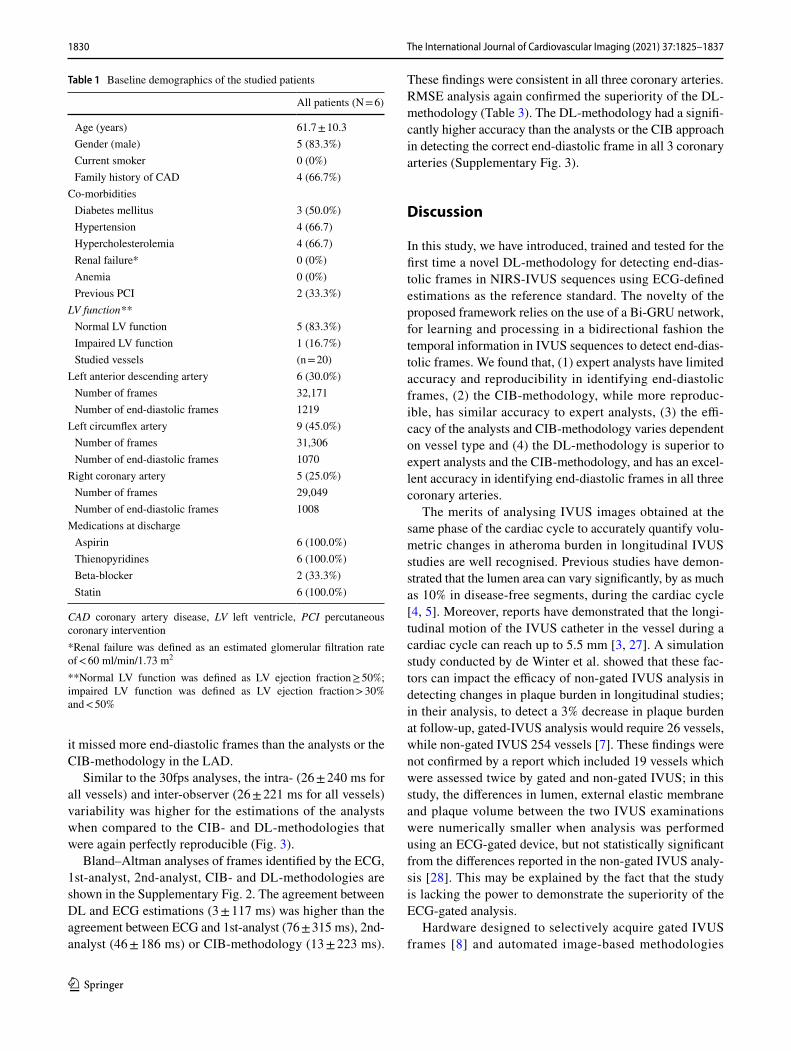
Table 1 Baseline demographics of the studied patients
CAD coronary artery disease, LV left ventricle, PCI percutaneous coronary intervention*Renal failure was defined as an estimated glomerular filtration rate of < 60 ml/min/1.73 m2
**Normal LV function was defined as LV ejection fraction ≥ 50%; impaired LV function was defined as LV ejection fraction > 30% and < 50%
All patients (N = 6)
Age (years) 61.7 ± 10.3 Gender (male) 5 (83.3%) Current smoker 0 (0%) Family history of CAD 4 (66.7%)
Co-morbidities Diabetes mellitus 3 (50.0%) Hypertension 4 (66.7) Hypercholesterolemia 4 (66.7) Renal failure* 0 (0%) Anemia 0 (0%) Previous PCI 2 (33.3%)
LV function** Normal LV function 5 (83.3%) Impaired LV function 1 (16.7%) Studied vessels (n = 20)
Left anterior descending artery 6 (30.0%) Number of frames 32,171 Number of end-diastolic frames 1219
Left circumflex artery 9 (45.0%) Number of frames 31,306 Number of end-diastolic frames 1070
Right coronary artery 5 (25.0%) Number of frames 29,049 Number of end-diastolic frames 1008
Medications at discharge Aspirin 6 (100.0%) Thienopyridines 6 (100.0%) Beta-blocker 2 (33.3%) Statin 6 (100.0%)
1831The International Journal of Cardiovascular Imaging (2021) 37:1825–1837
1 3
Table 2 Vessel-level analysis of end-diastolic frame estimations of the 1st- and 2nd-analyst and of the CIB- and DL-methodologies in the NIRS-IVUS sequences acquired at 30fps
CIB conventional image-based, DL deep learning, ECG electrocardiogram
Studied vessel Segmentation approach End-diastolic frames corresponding to ECG estimations
End-diastolic frames not corresponding to ECG estimations
Missed cardiac cycles P
All studied vessels 1st-analyst 1st estimation 3034 (92.6%) 110 (3.4%) 133 (4.1%)1st-analyst 2nd estimation 3014 (93.1%) 72 (2.2%) 153 (4.7%)2nd-analyst 3069 (93.5%) 117 (3.6%) 98 (3.0%) < 0.001CIB-methodology 3052 (93.5%) 96 (2.9%) 115 (3.5%)DL-methodology 2987 (91.6%) 95 (2.9%) 180 (5.5%)
Left anterior descending artery
1st-analyst 1st estimation 1141 (94.7%) 23 (1.9%) 42 (3.4%)1st-analyst 2nd estimation 1136 (94.4%) 22 (1.8%) 46 (3.8%)2nd-analyst 1140 (94.7%) 22 (1.8%) 42 (3.5%) < 0.001CIB-methodology 1119 (93.9%) 10 (0.8%) 63 (5.3%)DL-methodology 1062 (88.8%) 14 (1.2%) 120 (10.0%)
Left circumflex artery 1st-analyst 1st estimation 976 (92.8%) 41 (3.9%) 35 (3.3%)1st-analyst 2nd estimation 968 (94.3%) 16 (1.6%) 43 (4.2%)2nd-analyst 976 (92.6%) 43 (4.1%) 35 (3.3%) < 0.001CIB-methodology 972 (94.0%) 23 (2.2%) 39 (3.8%)DL-methodology 971 (94.5%) 16 (1.6%) 40 (3.9%)
Right coronary artery 1st-analyst 1st estimation 917 (89.9%) 46 (4.5%) 57 (5.6%)1st-analyst 2nd estimation 910 (90.3%) 34 (3.4%) 64 (6.3%)2nd-analyst 953 (92.9%) 52 (5.1%) 21 (2.0%) < 0.001CIB-methodology 961 (92.7%) 63 (6.1%) 13 (1.3%)DL-methodology 954 (91.8%) 65 (6.3%) 20 (1.9%)
Fig. 3 Bland–Altman analyses between the first and second set of estimations of the 1st-analyst at the NIRS-IVUS sequences acquired at 30fps (a) and 15fps (b) and between the estimations of the 1st- and 2nd-analyst in the same data set (c at 30fps; d at 15fps). Results are
shown for the left anterior descending (LAD), left circumflex (LCx), and right coronary artery (RCA). The blue line represents the mean difference and the red lines correspond to the limits of agreement i.e., ± 1.96 standard deviation (SD)
1832 The International Journal of Cardiovascular Imaging (2021) 37:1825–1837
1 3
[9–17] to estimate end-diastolic frames have failed to dominate in clinical research. The lack of commercial availability of ECG-gated hardware and the increased time required for their use has limited their utility, while most of the CIB-methodologies have not been validated robustly against ECG estimations or incorporated in user-friendly software.
In the present study, we validated the efficacies of a CIB-methodology and expert analysts in 3,167 end-diastolic
frames from 20 vessels assessed by NIRS-IVUS imaging against an ECG-defined reference standard. We found that the analysts had high intra- and inter-observer variability in detecting end-diastolic frames and that there were significant differences between their estimations and the ECG and that their performance varied between vessels. Both analysts per-formed better in the LAD and worse in the RCA where there is a higher relative motion of the lumen with regards to the catheter. In our analysis, the CIB-methodology was perfectly
Fig. 4 Bland–Altman analyses in the NIRS-IVUS sequences acquired at 30fps for the estimations of the ECG and the 1st-analyst (a), of the ECG and the 2nd-analyst (b), of the ECG and the CIB-method-ology (c) and of the ECG and the DL-methodology (d). Results are shown for the left anterior descending (LAD), left circumflex (LCx),
and right coronary artery (RCA). The blue line represents the mean difference and the red lines correspond to the limits of agreement, i.e. ± 1.96 standard deviation (SD). The green shaded area denotes estimations falling within ± 100 ms from the ECG estimations
Table 3 Root mean square errors of the end-diastolic frame estimations of the analysts of the CIB- and DL-methodologies compared to ECG estimations
CIB conventional image-based, DL deep learning
1st-analyst 2nd-analyst CIB-meth-odology
DL-meth-odology
P
Analysis at 30fps All studied vessels (ms) 194 184 199 103 < 0.001 Left anterior descending artery (ms) 154 156 157 100 < 0.001 Left circumflex artery (ms) 193 188 234 104 < 0.001 Right coronary artery (ms) 228 207 203 104 < 0.001
Analysis at 15fps All studied vessels (ms) 204 177 207 108 < 0.001 Left anterior descending artery (ms) 188 154 167 105 < 0.001 Left circumflex artery (ms) 175 179 240 108 < 0.001 Right coronary artery (ms) 245 198 212 112 < 0.001
1833The International Journal of Cardiovascular Imaging (2021) 37:1825–1837
1 3
Fig. 5 Accuracy of expert analysts, the CIB- and DL-methodology in the NIRS-IVUS sequences acquired at 30fps. (Red colour asterisk) Indicates statistically significant (P < 0.05) differences between the accuracy in left circumflex (LCx) or the right coronary artery (RCA) and the accuracy in the left anterior descending artery (LAD) within the same methodology. (Red colour double asterisk) Indicates statis-
tically significant differences between the accuracy of the RCA and LCx within the same methodology. (Red colour bullet) Indicates sta-tistically significant differences between the 1st-analyst and the 2nd-analyst, CIB- or the DL-methodology while red colour plus symbol indicates statistically significant difference between the CIB- and DL-methodology
Fig. 6 Accuracy of the expert analysts, the CIB- and DL-methodol-ogy in the NIRS-IVUS sequences acquired at 30fps. In this analysis accuracy was defined as the percentage of the correct estimations ver-sus the number of all the estimated end-diastolic frames. (Red col-our asterisk) Indicates statistically significant (P < 0.05) differences between the accuracy in left circumflex (LCx) or the right coronary artery (RCA) and the accuracy in the left anterior descending artery
(LAD) within the same methodology. (Red colour double asterisk) Indicates statistically significant differences between the accuracy of the RCA and LCx within the same methodology. (Red colour bullet) Indicates statistically significant differences between the 1st-analyst and the 2nd-analyst, CIB- or the DL-methodology while red colour plus symbol indicates statistically significant difference between the CIB- and DL-methodology
1834 The International Journal of Cardiovascular Imaging (2021) 37:1825–1837
1 3
reproducible but its performance in detecting end-diastolic frames was limited and not different from the experts’. Sig-nificant variations were noted in the performance of the CIB-methodology in different vessels, with better performance in the LAD compared to the LCx and RCA.
Conversely, the proposed DL-methodology trained on the reference standard, taking into account the different pat-terns of motion in different vessels, appeared superior to the analysts and CIB-methodology with excellent accuracy in detecting end-diastolic frames overall and was not affected by the type of vessel.
The results were not different when we took into account the variability in the R-R interval between patients and used a cut-off of ± 10% of the R-R to define accurate end-diastolic frame detection. DL was again superior to the analysts and the CIB-methodology but it had a smaller accuracy than the one reported with the fixed cut-off of ± 100 ms. This should be attributed to the fact that the average heart rate of the studied patients was 73 ± 18 bpm but also to the limited temporal resolution of NIRS-IVUS imaging (33.3 ms). For the latter reason we believe that the fixed cut-off may allow a more accurate estimation of the performance of the DL-methodology especially in patients that had an increased heart rate during pullback.
The fixed cut-off that we used in our study also allowed us to examine the performance of the DL-methodology in IVUS sequences with a frame-rate of 15fps. The analysts had poor reproducibility and, similar to the CIB-methodology, limited efficacy in detecting end-diastolic frames while the DL-methodology did not appear to be affected by the lower spatial resolution and had excellent performance. These findings highlight the potential value of DL in processing intravascular imaging data acquired at a higher pull-back speed, or a lower frame-rate such as the NIRS-IVUS images acquired by the MC-9 system which obtains images at 14fps or the upcoming IVUS-photoacoustic imaging catheters that are expected to acquire images at a lower frame-rate than conventional IVUS systems [29].
Another advantage of the developed DL-methodology is that it is rapid, enabling processing of large datasets within a few seconds: analysis of an IVUS sequence of 5000 frames takes less than 15 s in a computer with an Intel-i5 proces-sor and 16 GB RAM. The proposed approach has also been incorporated in the user-friendly QCU-CMS software, widely used for the processing of intravascular imaging data and this is likely to facilitate its utility in research. Moreo-ver, the DL-methodology is expected to have applications in future computational fluid dynamic (CFD) studies assessing the implications of the local hemodynamic forces on plaque
Table 4 Vessel-level analysis of the end-diastolic frame estimations of the 1st- and 2nd-analyst and of the CIB- and DL-methodology in the NIRS-IVUS sequences acquired at 15fps
CIB conventional image-based, DL deep learning, ECG electrocardiogram
Studied vessel Segmentation approach End-diastolic frames corresponding to ECG estimations
End-diastolic frames not corresponding to ECG estimations
Missed cardiac cycles P
All studied vessels 1st-analyst 1st estimation 2924 (90.4%) 68 (2.1%) 243 (7.5%)1st-analyst 2nd estimation 2940 (90.9%) 66 (2.0%) 227 (7.0%)2nd-analyst 3020 (93.2%) 72 (2.2%) 147 (4.5%) < 0.001CIB-methodology 3036 (90.1%) 202 (6.0%) 131 (3.9%)DL-methodology 2993 (93.4%) 39 (1.2%) 174 (5.4%)
Left anterior descending artery
1st-analyst 1st estimation 1121 (93.5%) 17 (1.4%) 61 (5.1%)1st-analyst 2nd estimation 1182 (100.0%) 0 (0.0%) 0 (0.0%)2nd-analyst 1121 (93.3%) 19 (1.6%) 61 (5.1%) < 0.001CIB-methodology 1111 (92.2%) 23 (1.9%) 71 (5.9%)DL-methodology 1093 (91.6%) 11 (0.9%) 89 (7.5%)
Left circumflex artery 1st-analyst 1st estimation 887 (86.7%) 12 (1.2%) 124 (12.1%)1st-analyst 2nd estimation 949 (89.8%) 46 (4.4%) 62 (5.9%)2nd-analyst 965 (93.2%) 24 (2.3%) 46 (4.4%) < 0.001CIB-methodology 973 (90.4%) 65 (6.0%) 38 (3.5%)DL-methodology 958 (94.0%) 8 (0.8%) 53 (5.2%)
Right coronary artery 1st-analyst 1st estimation 916 (90.4%) 39 (3.8%) 58 (5.7%)1st-analyst 2nd estimation 809 (81.4%) 20 (2.0%) 165 (16.6%)2nd-analyst 934 (93.1%) 29 (2.9%) 40 (4.0%) < 0.001CIB-methodology 952 (87.5%) 114 (10.5%) 28 (2.0%)DL-methodology 942 (94.8%) 20 (2.0%) 32 (3.2%)
1835The International Journal of Cardiovascular Imaging (2021) 37:1825–1837
1 3
evolution. Recently, convincing evidence has emerged high-lighting the role of coronary blood flow patterns on plaque progression and destabilisation [30, 31], while reports have shown that multimodality intravascular imaging combined with CFD estimations enables more accurate assessment of plaque pathophysiology and progression [32]. However, accurate reconstruction of coronary anatomy requires fusion of angiography with intravascular images at the end-diastolic phase of the cardiac cycle. None of the recently developed high-resolution IVUS or hybrid-IVUS systems incorporate ECG-gated hardware or are able to visualise the ECG along-side the acquired IVUS images. The developed DL-meth-odology overcomes these limitations, enabling retrospec-tive, fast and accurate identification of end-diastolic frames necessary for reliable reconstruction of vessel architecture.
Limitations
The present study has several limitations that should be acknowledged. Firstly, the number of vessels included was small and thus we could not examine the implications of the erroneous estimations of the analysts and of the CIB-methodology on the quantification of the lumen and vessel volumes [6]. Secondly, there was a variability in the number of vessels between LAD, LCx and RCA groups; however, the number of end-diastolic frames in each group was rela-tively large (> 1000 frames/group, Table 1) and similar in the 3 vessel groups, while the non-end-diastolic frames add up to around 85,000; both end-diastolic frames and non-end-diastolic frames are considered in training to highlight the differences of positive and negative training samples. Using leave-one-out cross-validation scheme, the size of train-ing set for each validation is approximately 25,000 frames. Therefore, we believe that the obtained data were sufficient to adequately train the DL-methodology [33].
All included patients were in sinus rhythm, with a heart rate between 45 and 85 beats-per-minute and had a relatively stable R-R interval; nevertheless, premature atrial or ventricular ectopics were often seen during the pull-back and were included in the analysis. Therefore, the developed DL-methodology should be used only in patients in sinus rhythm as it is uncertain how significant rhythm variability might affect its performance. Moreo-ver, the present analysis excluded stented segments where the friction effect between the catheter and the protruded struts may affect the movement of the lumen with regards to the IVUS probe—further research is needed to exam-ine the performance of the proposed methodology in such segments. Finally, this study did not examine the value of IVUS-gating in the accurate quantification of atheroma burden compared to non-gated IVUS; this should be tested in a large-scale appropriately sized study.
Conclusion
In conclusion, the proposed DL-methodology is capable of detecting end-diastolic frames in 50 MHz NIRS-IVUS datasets of all three coronary arteries rapidly and repro-ducibly, with greater accuracy than both expert analysts and a CIB-methodology. The DL-methodology’s perfor-mance is unaffected by the rate at which IVUS images are acquired. These features render it a useful tool for the analysis of IVUS datasets in longitudinal studies and in studies that fuse IVUS and X-ray angiographic data to assess the implication of the haemodynamic forces on plaque evolution.
Supplementary Information The online version contains supplemen-tary material available at https ://doi.org/10.1007/s1055 4-021-02162 -x.
Author contributions All authors takes responsibility for all aspects of the reliability and freedom from bias of the data presented and their discussed interpretation.
Funding This study is jointly funded by the British Heart Foundation (PG/17/18/32883), University College London Biomedical Resource Centre (BRC492B) and Rosetrees Trust (A1773). RB, AR, VT, AM, AB and CVB are funded by Barts NIHR Biomedical Research Centre, London, UK. This study was supported by the Cardiovascular Devices Hub at the Centre for Cardiovascular Medicine and Devices, Queen Mary University of London.
Code availability Custom code not publicly available.
Compliance with ethical standards
Conflict of interest All authors have no conflicts of interests to declare.
Ethical approval The study protocol complied with the Declaration of Helsinki and was approved by the local research ethics committee.
Consent to participate All recruited patients gave written informed consent.
Consent for publication All recruited patients gave written informed consent.
Open Access This article is licensed under a Creative Commons Attri-bution 4.0 International License, which permits use, sharing, adapta-tion, distribution and reproduction in any medium or format, as long as you give appropriate credit to the original author(s) and the source, provide a link to the Creative Commons licence, and indicate if changes were made. The images or other third party material in this article are included in the article’s Creative Commons licence, unless indicated otherwise in a credit line to the material. If material is not included in the article’s Creative Commons licence and your intended use is not permitted by statutory regulation or exceeds the permitted use, you will need to obtain permission directly from the copyright holder. To view a copy of this licence, visit http://creat iveco mmons .org/licen ses/by/4.0/.
1836 The International Journal of Cardiovascular Imaging (2021) 37:1825–1837
1 3
References
1. Böse D, von Birgelen C, Erbel R (2007) Intravascular ultrasound for the evaluation of therapies targeting coronary atherosclero-sis. J Am Coll Cardiol 49:925–932. https ://doi.org/10.1016/j.jacc.2006.08.067
2. Mintz G, Garcia-Garcia H, Nicholls S et al (2011) Clinical expert consensus document on standards for acquisition, measurement and reporting of intravascular ultrasound regression/progression studies. EuroIntervention 6:1123–1130. https ://doi.org/10.4244/EIJV6 I9A19 5
3. Arbab-Zadeh A, DeMaria AN, Penny WF et al (1999) Axial movement of the intravascular ultrasound probe during the car-diac cycle: implications for three-dimensional reconstruction and measurements of coronary dimensions. Am Heart J 138:865–872. https ://doi.org/10.1016/S0002 -8703(99)70011 -6
4. Weissman NJ, Palacios IF, Weyman AE (1995) Dynamic expan-sion of the coronary arteries: implications for intravascular ultrasound measurements. Am Heart J 130:46–51. https ://doi.org/10.1016/0002-8703(95)90234 -1
5. Ge J, Erbel R, Gerber T et al (1994) Intravascular ultrasound imaging of angiographically normal coronary arteries: a prospec-tive study in vivo. Heart 71:572–578. https ://doi.org/10.1136/hrt.71.6.572
6. Bruining N, von Birgelen C, de Feyter PJ et al (1998) ECG-gated versus nongated three-dimensional intracoronary ultrasound analysis: implications for volumetric measurements. Cathet Car-diovasc Diagn 43:254–260. https ://doi.org/10.1002/(SICI)1097-0304(19980 3)43:3%3c254 ::AID-CCD3%3e3.0.CO;2-8
7. de Winter S, Hamers R, Roelandt J et al (2009) Quantitative gated intravascular ultrasound largely reduces the population size for atherosclerosis progression-regression trials: a computer simula-tion study. Comput Cardiol 36:829–832
8. von Birgelen C, de Vrey EA, Mintz GS et al (1997) ECG-gated three-dimensional intravascular ultrasound: feasibility and repro-ducibility of the automated analysis of coronary lumen and ath-erosclerotic plaque dimensions in humans. Circulation 96:2944–2952. https ://doi.org/10.1161/01.CIR.96.9.2944
9. de Winter SA, Hamers R, Degertekin M et al (2004) Retrospec-tive image-based gating of intracoronary ultrasound images for improved quantitative analysis: the intelligate method. Cathet Cardiovasc Interv 61:84–94. https ://doi.org/10.1002/ccd.10693
10. O’Malley SM, Carlier SG, Naghavi M, Kakadiaris IA (2007) Image-based frame gating of IVUS pullbacks: a surrogate for ECG. In: 2007 IEEE International Conference on Acoustics, Speech and Signal Processing—ICASSP ’07. IEEE, Hono-lulu, HI, USA, pp. I-433-I–436. https ://doi.org/10.1109/ICASS P.2007.36670 9
11. Gatta C, Pujol O, Leor OR et al (2008) Robust image-based IVUS pullbacks gating. In: Metaxas D, Axel L, Fichtinger G, Székely G (eds) Medical image computing and computer-assisted interven-tion—MICCAI 2008. Springer, Berlin, Heidelberg, pp 518–525
12. Hutchison D, Kanade T, Kittler J, et al (2010) Manifold learning for image-based gating of intravascular ultrasound(IVUS) pull-back sequences. In: Liao H, Edwards PJ “Eddie,” Pan X, et al (eds) Medical imaging and augmented reality. Springer, Berlin, Heidel-berg. pp. 139–148. https ://doi.org/10.1007/978-3-642-15699 -1_15
13. Maso Talou GD, Larrabide I, Blanco PJ et al (2015) Improving cardiac phase extraction in IVUS studies by integration of gat-ing methods. IEEE Trans Biomed Eng 62:2867–2877. https ://doi.org/10.1109/TBME.2015.24492 32
14. Nadkarni SK, Boughner D, Fenster A (2005) Image-based cardiac gating for three-dimensional intravascular ultrasound imaging. Ultrasound Med Biol 31:53–63. https ://doi.org/10.1016/j.ultra smedb io.2004.08.025
15. Torbati N, Ayatollahi A, Sadeghipour P (2019) Image-based gating of intravascular ultrasound sequences using the phase information of dual-tree complex wavelet transform coeffi-cients. IEEE Trans Med Imaging 38:2785–2795. https ://doi.org/10.1109/TMI.2019.29140 74
16. Hernàndez-Sabaté A, Gil D, Garcia-Barnés J, Martí E (2011) Image-based cardiac phase retrieval in intravascular ultrasound sequences. IEEE Trans Ultrason Ferroelectr Freq Control 58:60–72. https ://doi.org/10.1109/TUFFC .2011.1774
17. Guo D, Richardson P (2006) Detection of cardiac cycle from intracoronary ultrasound. Ultrasound Med Biol 32:345–356. https ://doi.org/10.1016/j.ultra smedb io.2005.12.011
18. Al’Aref SJ, Anchouche K, Singh G et al (2019) Clinical appli-cations of machine learning in cardiovascular disease and its relevance to cardiac imaging. Eur Heart J 40:1975–1986. https ://doi.org/10.1093/eurhe artj/ehy40 4
19. Bae Y, Kang S-J, Kim G et al (2019) Prediction of coronary thin-cap fibroatheroma by intravascular ultrasound-based machine learning. Atherosclerosis 288:168–174. https ://doi.org/10.1016/j.ather oscle rosis .2019.04.228
20. Min H-S, Yoo JH, Kang S-J et al (2019) Detection of optical coherence tomography-defined thin-cap fibroatheroma in the coronary artery using deep learning. EuroIntervention. https ://doi.org/10.4244/EIJ-D-19-00487
21. Xia M, Yan W, Huang Y, et al (2020) Extracting membrane borders in IVUS images using a multi-scale feature aggregated U-Net. In: 2020 42nd Annual international conference of the IEEE Engineering in Medicine & Biology Society (EMBC). IEEE, Montreal, QC, Canada, pp. 1650–1653. https ://doi.org/10.1109/EMBC4 4109.2020.91759 70
22. Mishra D, Chaudhury S, Sarkar M, Soin AS (2019) Ultrasound image segmentation: a deeply supervised network with attention to boundaries. IEEE Trans Biomed Eng 66:1637–1648. https ://doi.org/10.1109/TBME.2018.28775 77
23. Gao Z, Chung J, Abdelrazek M et al (2020) Privileged modal-ity distillation for vessel border detection in intracoronary imaging. IEEE Trans Med Imaging 39:1524–1534. https ://doi.org/10.1109/TMI.2019.29529 39
24. Lo Vercio L, del Fresno M, Larrabide I (2019) Lumen-intima and media-adventitia segmentation in IVUS images using supervised classifications of arterial layers and morphological structures. Comput Methods Programs Biomed 177:113–121. https ://doi.org/10.1016/j.cmpb.2019.05.021
25. Ramasamy A, Safi H, Moon JC et al (2020) Evaluation of the efficacy of computed tomographic coronary angiography in assessing coronary artery morphology and physiology: ration-ale and study design. Cardiology 145:285–293. https ://doi.org/10.1159/00050 6537
26. Schuster M, Paliwal KK (1997) Bidirectional recurrent neural networks. IEEE Trans Signal Process 45:2673–2681. https ://doi.org/10.1109/78.65009 3
27. Talou GDM, Blanco PJ, Larrabide I et al (2017) Registration methods for IVUS: transversal and longitudinal transducer motion compensation. IEEE Trans Biomed Eng 64:890–903. https ://doi.org/10.1109/TBME.2016.25815 83
28. Jensen LO, Thayssen P (2007) Accuracy of electrocardio-graphic-gated versus nongated volumetric intravascular ultra-sound measurements of coronary arterial narrowing. Am J Car-diol 99:279–283. https ://doi.org/10.1016/j.amjca rd.2006.08.024
29. Bourantas CV, Jaffer FA, Gijsen FJ et al (2017) Hybrid intravas-cular imaging: recent advances, technical considerations, and current applications in the study of plaque pathophysiology. Eur Heart J 38:400–412. https ://doi.org/10.1093/eurhe artj/ehw09 7
30. Bourantas CV, Räber L, Sakellarios A et al (2020) Utility of multimodality intravascular imaging and the local hemodynamic forces to predict atherosclerotic disease progression. JACC

1837The International Journal of Cardiovascular Imaging (2021) 37:1825–1837
1 3
Cardiovasc Imaging 13:1021–1032. https ://doi.org/10.1016/j.jcmg.2019.02.026
31. Stone PH, Saito S, Takahashi S et al (2012) Prediction of pro-gression of coronary artery disease and clinical outcomes using vascular profiling of endothelial shear stress and arterial plaque characteristics: the prediction study. Circulation 126:172–181. https ://doi.org/10.1161/CIRCU LATIO NAHA.112.09643 8
32. Guo X, Giddens DP, Molony D et al (2018) Combining IVUS and optical coherence tomography for more accurate coronary cap thickness quantification and stress/strain calculations: a patient-specific three-dimensional fluid-structure interaction
modeling approach. J Biomech Eng 140:041005. https ://doi.org/10.1115/1.40382 63
33. Browne MW (2000) Cross-validation methods. J Math Psychol 44:108–132. https ://doi.org/10.1006/jmps.1999.1279
Publisher’s Note Springer Nature remains neutral with regard to jurisdictional claims in published maps and institutional affiliations.