A Deep Dive Into Shortfalls and ... -...
32
Rachel Barkley Municipal Credit Analyst 11 312 696-6256 rachel.barkley@morningstar.com 26 November 2012 1 Sielman, Rebecca. 2012 Public Pension Funding Study. Milliman. Key Takeaways Pension funded levels and UAAL vary widely between the states. Over 40% of all states fall below Morningstar’s fiscally sound threshold of a 70% funded ratio. UAAL per capita is a major indicator as it represents how much each resident would need to pay to fund the liability and can vary compared to funded ratio. Watch out for underfunded plans despite a satisfactory aggregate funded level. Upcoming GASB requirements will change pension standards and accounting significantly. 3 3 3 3 3 The challenges and vulnerabilities facing government pension plans have gained new public prominence and attention of late. Both governing entities and the taxpaying public are beginning to grasp and acknowledge the potential, chronic consequences of looming pension liabilities. During the past several years, ever-escalating pension costs and liabilities have induced new, sometimes unrelenting, pressure on the finances of state and local governments still hampered by the recession. Current data indicates these pressures are expected to persist, even intensify. A recent report from the actuarial firm Milliman, found a $1.2 trillion gap for the largest 100 U.S. public pension plans 1 while actuarial reports for a large portion of these plans are projecting sizeable increases in required contribu- tions in order to fully fund these liabilities. Despite their importance, the inner workings of pensions remain mired in foggy opacity, due to a combination of their complexity and sheer number, as well as a lack of transparency precipitated by weak disclosure requirements. To get a better view of the present state of major pension plans, and the potential impact of their vulnerabilities on governments, taxpayers, and investors, Morningstar has analyzed current data for pension plans administered by each of the 50 states. Overall, we found the fiscal health of state pension plans varies drastically with some states having exceptionally strong plans while others are facing severe funding shortfalls. State pension plans are particularly important for several reasons. Not only do they represent a respective state’s financial obligations, but they’re often structured as umbrella plans covering employees of that state’s myriad local government bodies. State pension plans that solely cover state employees can have a notable influence on underlying governments within the state, as states provide substantial aid to school districts and other local governments. Financial pressure on state governments, including the fiscal strain imposed by ballooning pension costs, can lead to reductions in intergovernmental aid to local governments. The State of State Pension Plans A Deep Dive Into Shortfalls and Surpluses ©2012 Morningstar. All rights reserved. Morningstar’s Credit Research is produced and offered by Morningstar, Inc., which is not registered with the U.S. Securities and Exchange Commission as a Nationally Recognized Statistical Rating Organization (“NRSRO”). The information contained herein is the proprietary property of Morningstar and may not be reproduced, in whole or in part, or used in any manner, without the prior written consent of Morningstar. To order reprints, call 11 312 696-6100. To license the research, call 11 312 696-6869.
Transcript of A Deep Dive Into Shortfalls and ... -...
Rachel BarkleyMunicipal Credit Analyst11 312 [email protected]
26 November 2012
1 Sielman, Rebecca. 2012 Public Pension Funding Study. Milliman.
Key TakeawaysPension funded levels and UAAL vary widely between the states.Over 40% of all states fall below Morningstar’s fiscally sound threshold of a 70% funded ratio.UAAL per capita is a major indicator as it represents how much each resident would need to pay to fund the liability and can vary compared to funded ratio.Watch out for underfunded plans despite a satisfactory aggregate funded level.Upcoming GASB requirements will change pension standards and accounting significantly.
3
3
3
3
3
The challenges and vulnerabilities facing government pension plans have gained new public prominence and attention of late. Both governing entities and the taxpaying public are beginning to grasp and acknowledge the potential, chronic consequences of looming pension liabilities.
During the past several years, ever-escalating pension costs and liabilities have induced new, sometimes unrelenting, pressure on the finances of state and local governments still hampered by the recession. Current data indicates these pressures are expected to persist, even intensify. A recent report from the actuarial firm Milliman, found a $1.2 trillion gap for the largest 100 U.S. public pension plans1 while actuarial reports for a large portion of these plans are projecting sizeable increases in required contribu-tions in order to fully fund these liabilities.
Despite their importance, the inner workings of pensions remain mired in foggy opacity, due to a combination of their complexity and sheer number, as well as a lack of transparency precipitated by weak disclosure requirements. To get a better view of the present state of major pension plans, and the potential impact of their vulnerabilities on governments, taxpayers, and investors, Morningstar has analyzed current data for pension plans administered by each of the 50 states. Overall, we found the fiscal health of state pension plans varies drastically with some states having exceptionally strong plans while others are facing severe funding shortfalls.
State pension plans are particularly important for several reasons. Not only do they represent a respective state’s financial obligations, but they’re often structured as umbrella plans covering employees of that state’s myriad local government bodies. State pension plans that solely cover state employees can have a notable influence on underlying governments within the state, as states provide substantial aid to school districts and other local governments. Financial pressure on state governments, including the fiscal strain imposed by ballooning pension costs, can lead to reductions in intergovernmental aid to local governments.
The State of State Pension Plans A Deep Dive Into Shortfalls and Surpluses
©2012 Morningstar. All rights reserved. Morningstar’s Credit Research is produced and offered by Morningstar, Inc., which is not registered with the U.S. Securities and Exchange Commission as a Nationally Recognized Statistical Rating Organization (“NRSRO”). The information contained herein is the proprietary property of Morningstar and may not be reproduced, in whole or in part, or used in any manner, without the prior written consent of Morningstar. To order reprints, call 11 312 696-6100. To license the research, call 11 312 696-6869.
2 The State of State Pension Plans: A Deep Dive Into Shortfalls and Surpluses
Overview
While the majority of states are adequately managing their aggregate pension liabilities, several pension systems are coming under duress. The fiscal solvency and management of these plans varies greatly, according to two key drivers of Morningstar’s pension analysis: the funded ratio, and unfunded actuarial accrued liability (UAAL, or unfunded liability) per capita. The funded ratio, which is calculated by dividing the pension plan’s assets by its liabilities, serves as a good measure of the plan’s ability to meet its obligations. In addition, Morningstar to highlight the UAAL per capita, which, in our opinion, is a useful metric not commonly applied in the current pension analysis narrative. Similar to the debt per capita calculation in credit analysis, the UAAL per capita represents the amount each person in the state would need to pay to fully fund this unfunded liability.
For the funded ratio and UAAL calculations, we looked at all defined benefit plans to which the state contributes and/or has a legal obligation to provide funding (see the appendix for a full discussion of the methodology). This brings up two critical points:
1 Pension plans are not required to report the percentage of the total unfunded liability for which each participant accounts under current accounting rules. This is important, as many of these plans have multiple contributing governments, meaning the state will not be responsible for paying the full liability. Because of this, it is difficult to project the impact on the state budget. However, as the other participants are underlying local governments, the UAAL will still be funded by state taxpayers, either through payments to the state, or an underlying entity.
2 Additionally, states are often the administrator of plans to which they have no liability or requirement to contribute. We have excluded these plans from our calculations, given that the states will not be funding these liabilities. We do, however, note that these additional plans administered by the states, as well as local plans not under state administration, represent what can be, at times, significant additional pension liabilities which taxpayers will be required to fund.
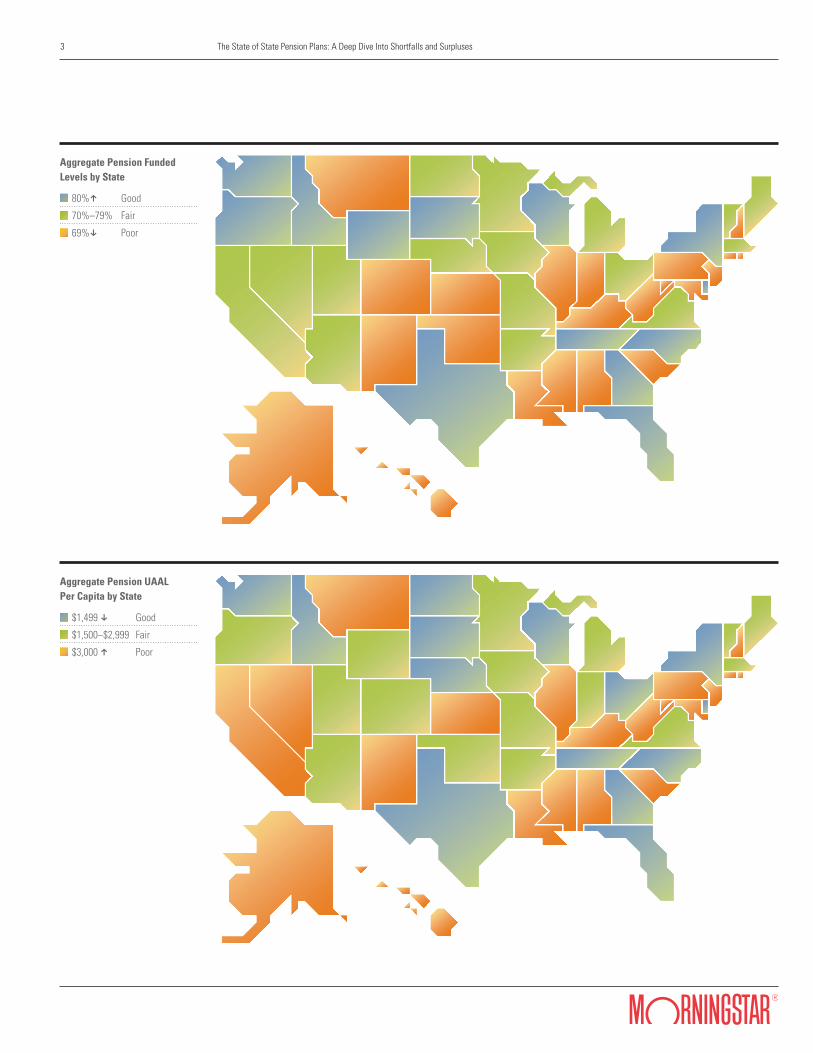
Overall, funded percentages and UAAL per capita vary dramatically between the states (see maps). Several states have very strong pension systems. Seven states have an aggregate funded ratio of at least 90%, while eight states have UAALs under $1,000 per capita. Wisconsin is currently the strongest system, with a 99.8% funded ratio and a UAAL of $23 per capita. On the other side of the spectrum, 21 states fall under Morningstar’s fiscally sound threshold of a 70% funded ratio. Despite the passage of recent reforms, Illinois continues to have the worst funded system, with a 43.4% funded ratio and a $6,505 per capita UAAL.
Although there tends to be a relationship between funded level and UAAL per capita, there are multiple notable exceptions in which the two data points do not correlate when rank-ordering the systems. While Illinois has the lowest funded ratio, Alaska has by far the highest UAAL per capita, at over $10,000. This is despite its higher, although still poor, funded ratio of 59.2%. Meanwhile, Indiana has a funded
Related ResearchState and Local Pensions 101Upcoming Reports on Plans for High Profile Individual State Plans
3
3
3 The State of State Pension Plans: A Deep Dive Into Shortfalls and Surpluses
Aggregate Pension Funded Levels by State 80%h Good
70%–79% Fair
69%x Poor
Aggregate Pension UAAL Per Capita by State $1,499 x Good
$1,500–$2,999 Fair
$3,000 h Poor

4 The State of State Pension Plans: A Deep Dive Into Shortfalls and Surpluses
ratio roughly on par with that of Alaska, at 59.6%. However, the UAAL per capita for Indiana is substan-tially lower than that of Alaska, at $2,284, and is even lower than that of more well-funded plans. This substantial disparity in the apparent fiscal health of the systems highlighted by these two data points reinforces Morningstar’s opinion that the UAAL per capita needs to be taken into consideration when analyzing pensions.
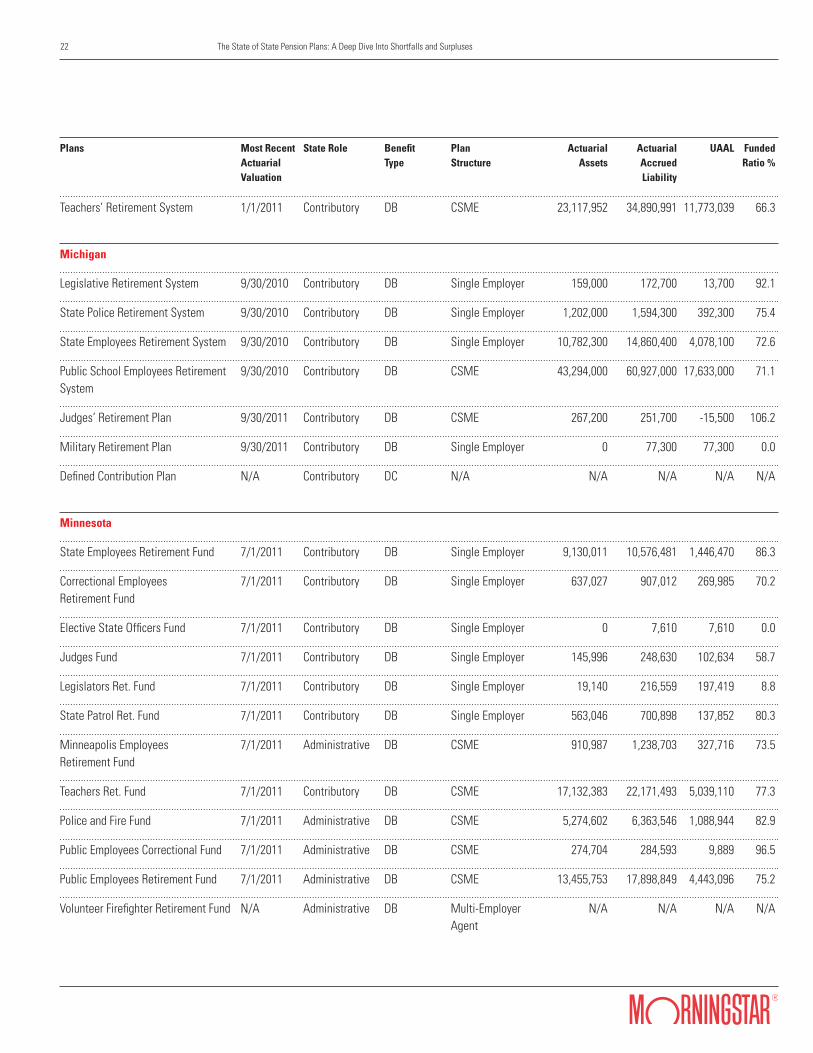
Even within well-funded systems, individual plans can often be severely underfunded. The majority of the systems have multiple plans covering different classes of employees. Often, the systems have one or two large plans, typically covering general state employees and/or teachers, along with separate smaller plans for a specific type of employee, such as judicial employees or elected representatives. While the aggregate funded ratio is a good picture of a system’s overall health, it largely reflects the funded ratio of larger systems, which can lead to funding issues in smaller plans being overlooked. In aggregate, Minnesota’s system is adequately funded, with a 79.3% funded ratio. Its Legislators Retirement Fund, however, has an exceptionally low 8.8% funded ratio, while the Elective State Officers Fund has a 0% funded ratio. While these plans are relatively small compared to the system in its entirety, they still need to be considered. Low funded levels in these smaller plans can lead to budgetary pressure.
Trends
The majority of plans continue to experience declines in their funded levels, and increases in their UAAL per capita, although volatility has moderated since its peak in 2009. Overall, the universe of plans has experienced gains in the market value of their assets, as of their most recent actuarial valuation. However, most plans do not recognize the full magnitude of actual gains or losses at the end of each fiscal year. Instead, they use a process called smoothing to determine the actuarial value of their assets, which incorporates any deviation between expected returns and actual results over a period of time, typically five years. Smoothing has an impact on periods of both positive returns and negative returns. Consequently, these plans will still have a few more years of absorbing the investment losses suffered during the recession, although gains in recent years offset a significant portion of these losses. Declines in the funded level for each state can be seen in the data appendix.
As funded levels have declined and overall fiscal pressure for states has increased in recent years, many states have implemented some level of pension reforms in response. The majority of these changes have been mandated increases or implementation of employee contributions, changes to formula calcula-tions, and extending vesting periods. The details of these changes and the projected impact on the state’s liability, if available, will be addressed in the upcoming pension reports for the applicable states. Pension reforms continue in the latter portion of calendar year 2012, including two of the most populous states with sizeable liabilities: California and Ohio. It is worth pointing out that not all pension reform attempts are successful. The Illinois State Legislature held a special session in August to focus on additional pension reforms, but failed to implement any.
Highlights of Recent Ohio Pension ReformIncreases contributions for some public employeesRaises the retirement ageChange in benefit formulaNew guidelines for cost of living adjustments (COLA)
333
3
3
3
3 33
Highlights of Recent California Pension ReformCaps benefit paymentsRaises the retirement ageRequires equal sharing of pension costsEliminates certain practices that have elevated payments for some retirees in prior yearsEstimated to provide at least $65 billion in savings between the two major systems

5 The State of State Pension Plans: A Deep Dive Into Shortfalls and Surpluses
Not All Pension Plans Are Directly Comparable
There exist wide disparities in pension plan structures, managements and accounting practices, making it difficult to compare plans across all states accurately. Two key elements are (1) type of benefit, and (2) plan contributor. Benefit types can range from defined benefit, to defined contribution, or hybrid plans. Plans can be single-employer, with the state responsible for the entire liability, or multi-employer, with the state accounting for only a portion of total contribution and liabilities.
Some of the largest differences between state-administered plans are often who is covered, and who is responsible for making contributions. Major differences that affect a state’s liability commonly involve whether the state is responsible for teacher pensions, and whether they contribute to a multi-employer plan for underlying governments. Multi-employer plans can inflate the reported liability, and make them difficult to compare to single-employer plans. Teacher pension plans often serve as the largest portion of a state’s liability. While the majority of states contribute to teacher plans, some do not. This can significantly lower a state’s liability. Colorado underscores this point: Given that the state does not contribute to the pension plan covering public school teachers, the UAAL per capita is a moderate $1,804, despite a low 57.7% funded ratio. Again, Morningstar notes that the fact that teachers’ liabilities are not covered by the plan does not mean that Colorado taxpayers aren’t ultimately liable for the funding.
Another key pension data point, annual contributions by the state, can be affected by plan management and assumptions. Aggressive investment return assumptions make a plan appear better funded than a comparable plan with a more conservative discount rate. Additionally, several states have been making pension contributions at a rate lower than the actuarially determined rate, due either to statutory or legislative regulations. These lower payments often slow the growth of contributions as well as their current impact on the budget. While this lowers pensions’ current fiscal impact on the states, the liability is simply pushed out into future years, which will likely escalate upcoming fiscal pressure.
These variations have increased in recent years, as many states have added defined contribution plans or options to existing plans as part of pension reforms, and need to be recognized and considered when comparing pension liabilities across states.
Disclosure: Greater Transparency Needed
Pension disclosure is currently less than ideal. Pension systems provided by the states are discussed in modest detail in the financial notes section of their audits. While single-employer plans report more detailed data, cost-sharing multi-employer plans (CSME) often only report the state’s administration of the plan. Pertinent general information, including total assets, liabilities, and funded levels, as well as the annual contributions made by the state, are often not included. To accurately and fully analyze a plan, analysts should examine its audited financial statements and actuarial reports for individual plans, which can be difficult to find. In multiple cases, neither the financial notes nor the plan documents
6 The State of State Pension Plans: A Deep Dive Into Shortfalls and Surpluses
disclose whether the state is a contributing participant of the plan, or if the state simply plays a fiduciary role, with no corresponding liability.
Further complicating this is the time lag in obtaining relevant data. Audits of the government and the individual plans, as well as the actuarial reports, often take six to nine months after the close of a fiscal year to release audited financial statements. Further complicating the effect of the time lag is that actuarial report dates do not always correspond to government fiscal years. In state audits for fiscal 2011, pension data can be as of the end of fiscal 2011 or fiscal 2010, depending on the plan. This leaves investors without accurate information for a significant period of time while the data is often rendered stale by the time of release, and potentially no longer reflective of the plan’s true fiscal health.
As discussed below, upcoming regulations are expected to ease a portion of these disclosure issues, making pension data more accessible, although timing issues are expected to continue.
Red Flags
The upside for investors is that, with the exception of sweeping plan changes, the fiscal health of pension plans tends to shift gradually over time. Pressured plans can often be identified years before substantial stress is placed on the applicable government. Investors should be wary of red flags that indicate the solvency of a pension plan is deteriorating. Potential red flags include a substantial unfunded pension liability, a low and/or declining funded ratio, a high UAAL per capita, annual contribu-tions less than the ARC, rapid increases in annual contributions and pension costs accounting for a significant portion of general government spending.
What to Watch For
Morningstar believes that pensions will play an integral role in determining a state’s fiscal health and overall credit quality, going forward. With the growing focus on pensions from both governments and investors, we expect continued adjustments to how governments handle these liabilities. Some of these modifications will be customized changes from individual governments, while national regulatory changes for public pensions are expected to have a significant impact.
Individually, we expect some states to continue seeking pension reforms. Depending on the state, these could range from minor changes in formula calculations, to switching new employees to a defined contribution plan. The extent of these reforms will likely depend on the political power of state leadership and affected beneficiaries, the general fiscal health of the state, the strength of the pension plan, and legal constraints.
On a national level, upcoming regulatory changes are expected to shake up pension reporting and accounting dramatically. The Governmental Accounting Standards Board (GASB), which establishes
7 The State of State Pension Plans: A Deep Dive Into Shortfalls and Surpluses
government accounting standards, approved new accounting and reporting standards for state and local government pension plans in June 2012, with the goal of improving the accounting and financial reporting for affected plans. GASB standards are non-binding, but compliance is required if governments are to receive a clean audit. The new pension standards become effective in fiscal years beginning after June 15, 2013, and for employers in fiscal years beginning after June 15, 2014. While it will be a few years until all applicable governments fully incorporate these standards, some states will likely move towards early adoption and compliance.
Overall, the new standards aim to focus pension disclosure on liabilities as opposed to the annual required contribution, or ARC. For defined benefit plans, disclosure of the ARC will no longer be required. Instead, annual change in the net pension liability (NPL) will serve as the primary pension expense reported. Analysts will need to judge movement of the NPL to determine if an entity is making adequate contributions to the plan.
Defined benefit plans will be required to report an NPL on their balance sheets. In many cases, this will cause a drastic change in the balance sheet presentation, particularly in terms of total liabilities. This number is expected to be relatively volatile, as asset smoothing won’t be allowed for accounting purposes. The NPL will be measured at market value, with annual changes immediately recognized. Despite its expected volatility, the implementation of the NPL will allow investors and constituents to gain a clearer picture of actual projected liabilities. Cost-sharing multi-employer plan participants will record a liability and expense equal to their proportionate share of the total plan liability and expenses, allowing analysts to accurately incorporate pension liabilities into analysis of credits which participate in a CSME plan.
Additionally, the GASB regulations change allowable accounting methods, which will create a disconnect between pension funding and accounting while leading to greater levels of volatility for pension accounting. The impending change expected to have the greatest impact will be the prohibition on using smoothing methods for accounting, as mentioned above, although it will still be allowed for funding purposes. The discount rate of liabilities will change for accounting purposes, but will remain unchanged for funding calculations. For accounting purposes, the allowable assumed discount rate will depend on whether the plan’s net position is projected to be sufficient to pay benefits of current employees and retirees. If that condition is met, the regular discount rate may be used. An index rate on tax-exempt 20-year municipal bonds rated AA or higher will be used to the extent that projected assets are not anticipated to meet projected liabilities.
Morningstar contends that this additional pension disclosure, especially the disclosure of individual government liabilities, will be positive for the municipal market as a whole. However, the change in accounting standards is expected to lower the overall funded levels. A recent report by the Center for
8 The State of State Pension Plans: A Deep Dive Into Shortfalls and Surpluses
Retirement Research at Boston College indicated the aggregate funded level for 126 large pension plans it sampled would decline from 76% based on fiscal 2010 levels to a low 57%2. This decline in funding, coupled with the emphasis on the NPL, will likely increase the level of debate regarding pension benefits, and their impact on governments. K
Data for this analysis was gathered from publicly available government comprehensive annual financial reports (CAFRs), pension plan CAFRs, and actuarial valuations. The most recent available data was used from the available sources. Since pension data reported in state CAFRs is often dated, current actuarial reports were used, when available. In certain instances, follow-up phone calls were made to specific states and/or plans to clarify data.
Aggregate data for funded ratios, liability, and UAAL per capita was compiled for defined benefit plans, or which have a defined benefit component, to which the
state contributes and/or is legally liable for benefits. While most plans have a new actuarial valuation on an annual basis, some plans are revalued every two years. In states that had a combination of plans which were revalued annually and biannually, the biannual plan data points were held constant from the year prior in nonvaluation years. We have excluded plans from our calculations to which the state acts solely as an administrator, since the states will not be funding these liabilities. When available, the data for these state- administrated plans is presented in the individual plan portion of the data appendix to give readers a clear understanding of overlapping pension liabilities.
Methodology
Actuarial Accrued Liability (AAL)The present value of future benefits earned by employees to date.
Actuarial Cost MethodThe actuarial cost method is the process used by the actuary to allocate the projected liabilities of the plan to prior years (the actuarial accrued liability), the current year (the normal cost), and future years.
Actuarial Value of Assets (AVA)The actuarial value of the plan’s assets. This amount incorporates investment gains and losses dependent upon the asset valuation method.
Agent Multiple-Employer PlanIn agent multi-employer plans, assets are pooled but legally restricted to pay pension obligations of their specific employer.
Annual Required Contribution (ARC)The ARC is determined by the actuary during the valuation of the plan and equals the amount that would need to be paid during the current fiscal year to fund
benefits earned in that year (the normal cost) plus a portion of any unfunded liability from past years.
Asset Valuation MethodThe actuarial value of the plan recognizes gains and losses in the market value of plan assets dependent on the asset valuation method.
Cost Sharing Multiple Employer Plan (CSME) In CSME plans, the participating employers pool their obligations and assets. Assets of the plan can be used to pay pension obligations of any participating employer.
Defined Benefit Plan (DB)For defined benefit (DB) plans, pension payments operate as an annuity, with each employee entitled to a specific annual payment based on a benefit formula. These formulas generally incorporate years of service, salary and a multiplier variable. Specific benefit formulas vary between plans, and often within plans dependent on an employee’s start date and/or employee classification (public safety, general, management, etc.). Defined benefit payments can either be constant for the life of the payment, adjusted annually for cost of
Glossary
2 Munnell, Alicia et al. How Would GASB Proposals Affect State and Local Pension Reporting? Center for Retirement Research at Boston College. November 2011.

9 The State of State Pension Plans: A Deep Dive Into Shortfalls and Surpluses
living, or adjusted occasionally for cost of living increases as seen fit by the overseeing party. The government is responsible for funding this liability no matter what return it achieves on its investments.
Defined Contribution Plan (DC)Defined contribution plans are similar to 401ks found in the private sector. The government is obligated to contribute a certain amount annually until retirement while the actual benefit is subject to market returns. The government has no liability to make up for investment losses.
Entry Age Normal Actuarial Cost MethodEntry age normal allocates the cost of benefits from the time an employee is hired (the entry age) to the date of expected retirement either as a level dollar amount or as a percentage of payroll.
Funded RatioThe percentage of the AAL that is currently funded through the AVA. This is calculated by dividing AVA by the UAAL.
Market Value Method of Asset Valuation Under the market value method, plans recognize the full amount of actual gains or losses at the end of each fiscal year.
Net Pension Liability (NPL)The NPL is the total pension liability (actuarially deter-mined present value of future benefits that are due to work already completed by plan participants) less the plan net position (plan assets set aside in a trust or restricted for benefit payments).
Smoothing Method of Asset ValuationSmoothing incorporates any deviation between expected returns and actual results over a period of years. Assuming a five-year smoothing period, which is common, 20% of any variation between expected and actual results for a given year would be incorporated into the AVA for each of the next five years.
Unfunded Actuarial Accrued Liability The difference between the AVA and the AAL.
2007 2008 2009 2010 2011
Alabama Assets 30,687,002 30,977,314 30,763,098 30,118,307 29,122,163 AAL 38,657,817 40,206,232 41,634,554 42,872,101 43,536,747 UAAL 7,970,815 9,228,918 10,871,457 12,753,794 14,414,584 Funded Ratio 79.4% 77.0% 73.9% 70.3% 66.9% UAAL Per Capita 1,691 1,958 2,307 2,706 3,059
Alaska Assets 10,273,770 11,032,112 9,375,501 9,876,701 10,255,099 AAL 13,859,315 14,567,631 15,347,768 16,592,762 17,329,260 UAAL 3,585,545 3,535,519 5,972,267 6,716,061 7,074,161 Funded Ratio 74.1% 75.7% 61.1% 59.5% 59.2% UAAL Per Capita 5,188 5,115 8,641 9,717 10,235
Arizona Assets 26,898,098 28,263,827 28,825,891 29,322,102 29,768,148 AAL 32,498,404 34,560,848 36,552,608 38,468,647 39,714,837 UAAL 5,600,306 6,297,021 7,726,717 9,146,545 9,946,689 Funded Ratio 82.8% 81.8% 78.9% 76.2% 75.0% UAAL Per Capita 897 1,008 1,237 1,464 1,592
Arkansas Assets 17,554,603 18,811,399 17,607,157 17,840,827 18,226,718 AAL 20,138,317 21,576,344 22,724,578 23,849,287 25,155,070 UAAL 2,583,715 2,764,945 5,117,420 6,008,461 6,928,352 Funded Ratio 87.2% 87.2% 77.5% 74.8% 72.5% UAAL Per Capita 899 962 1,781 2,092 2,412
Aggregate Pension Data By State
10 The State of State Pension Plans: A Deep Dive Into Shortfalls and Surpluses
2007 2008 2009 2010 2011
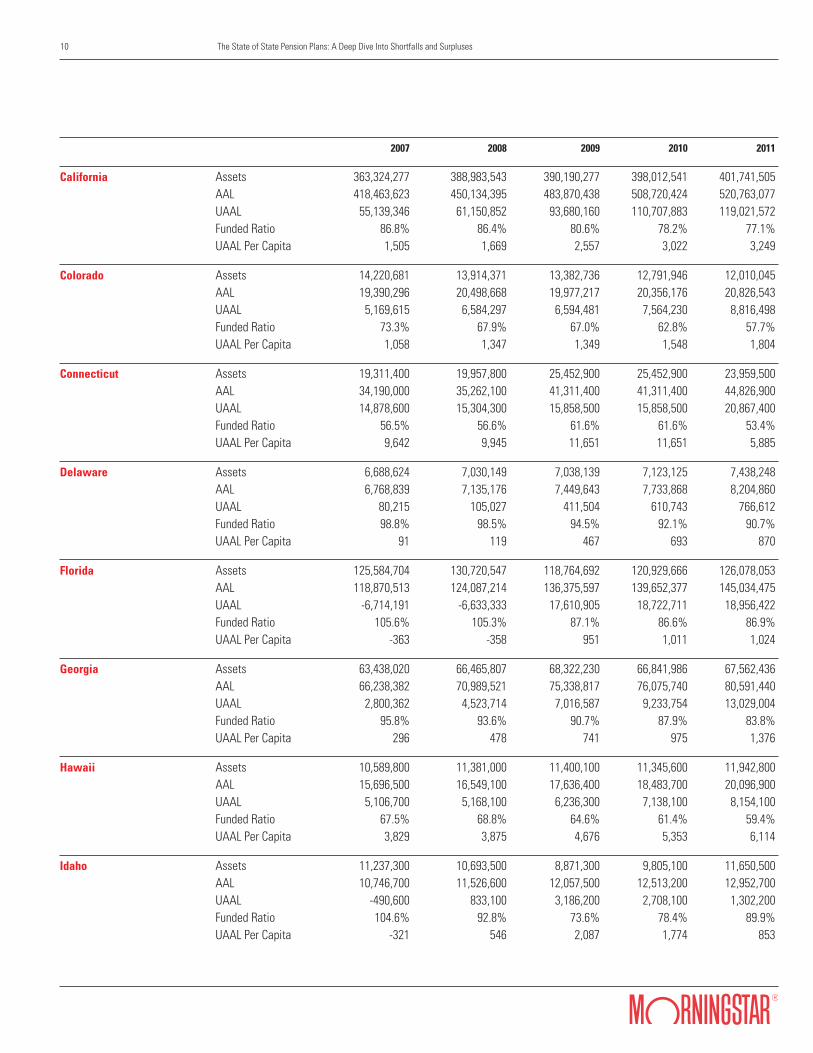
California Assets 363,324,277 388,983,543 390,190,277 398,012,541 401,741,505 AAL 418,463,623 450,134,395 483,870,438 508,720,424 520,763,077 UAAL 55,139,346 61,150,852 93,680,160 110,707,883 119,021,572 Funded Ratio 86.8% 86.4% 80.6% 78.2% 77.1% UAAL Per Capita 1,505 1,669 2,557 3,022 3,249
Colorado Assets 14,220,681 13,914,371 13,382,736 12,791,946 12,010,045 AAL 19,390,296 20,498,668 19,977,217 20,356,176 20,826,543 UAAL 5,169,615 6,584,297 6,594,481 7,564,230 8,816,498 Funded Ratio 73.3% 67.9% 67.0% 62.8% 57.7% UAAL Per Capita 1,058 1,347 1,349 1,548 1,804
Connecticut Assets 19,311,400 19,957,800 25,452,900 25,452,900 23,959,500 AAL 34,190,000 35,262,100 41,311,400 41,311,400 44,826,900 UAAL 14,878,600 15,304,300 15,858,500 15,858,500 20,867,400 Funded Ratio 56.5% 56.6% 61.6% 61.6% 53.4% UAAL Per Capita 9,642 9,945 11,651 11,651 5,885
Delaware Assets 6,688,624 7,030,149 7,038,139 7,123,125 7,438,248 AAL 6,768,839 7,135,176 7,449,643 7,733,868 8,204,860 UAAL 80,215 105,027 411,504 610,743 766,612 Funded Ratio 98.8% 98.5% 94.5% 92.1% 90.7% UAAL Per Capita 91 119 467 693 870
Florida Assets 125,584,704 130,720,547 118,764,692 120,929,666 126,078,053 AAL 118,870,513 124,087,214 136,375,597 139,652,377 145,034,475 UAAL -6,714,191 -6,633,333 17,610,905 18,722,711 18,956,422 Funded Ratio 105.6% 105.3% 87.1% 86.6% 86.9% UAAL Per Capita -363 -358 951 1,011 1,024
Georgia Assets 63,438,020 66,465,807 68,322,230 66,841,986 67,562,436 AAL 66,238,382 70,989,521 75,338,817 76,075,740 80,591,440 UAAL 2,800,362 4,523,714 7,016,587 9,233,754 13,029,004 Funded Ratio 95.8% 93.6% 90.7% 87.9% 83.8% UAAL Per Capita 296 478 741 975 1,376
Hawaii Assets 10,589,800 11,381,000 11,400,100 11,345,600 11,942,800 AAL 15,696,500 16,549,100 17,636,400 18,483,700 20,096,900 UAAL 5,106,700 5,168,100 6,236,300 7,138,100 8,154,100 Funded Ratio 67.5% 68.8% 64.6% 61.4% 59.4% UAAL Per Capita 3,829 3,875 4,676 5,353 6,114
Idaho Assets 11,237,300 10,693,500 8,871,300 9,805,100 11,650,500 AAL 10,746,700 11,526,600 12,057,500 12,513,200 12,952,700 UAAL -490,600 833,100 3,186,200 2,708,100 1,302,200 Funded Ratio 104.6% 92.8% 73.6% 78.4% 89.9% UAAL Per Capita -321 546 2,087 1,774 853

11 The State of State Pension Plans: A Deep Dive Into Shortfalls and Surpluses
2007 2008 2009 2010 2011
Illinois Assets 70,731,230 64,700,501 63,996,419 63,053,413 63,553,027 AAL 112,908,645 119,084,440 126,435,510 138,794,302 146,460,036 UAAL 42,177,415 54,383,939 62,439,091 75,740,889 82,907,009 Funded Ratio 62.6% 54.3% 50.6% 45.4% 43.4% UAAL Per Capita 3,309 4,267 4,899 5,943 6,505
Indiana Assets 21,367,422 22,514,762 21,295,534 21,868,361 21,604,609 AAL 32,065,247 32,750,778 33,592,160 35,366,037 36,258,923 UAAL 10,697,825 10,236,015 12,296,626 13,497,676 14,654,314 Funded Ratio 66.6% 68.7% 63.4% 61.8% 59.6% UAAL Per Capita 1,667 1,595 1,916 2,103 2,284
Iowa Assets 21,148,616 22,252,913 21,517,287 21,927,434 22,973,672 AAL 23,557,799 25,110,757 26,602,517 27,057,851 28,883,186 UAAL 2,409,182 2,857,843 5,085,230 5,130,417 5,909,514 Funded Ratio 89.8% 88.6% 80.9% 81.0% 79.5% UAAL Per Capita 799 947 1,686 1,701 1,959
Kansas Assets 13,433,115 11,827,619 13,461,221 13,589,658 13,379,020 AAL 18,984,915 20,106,787 21,128,206 21,853,783 22,607,170 UAAL 5,551,800 8,279,168 7,666,985 8,264,125 9,228,150 Funded Ratio 70.8% 58.8% 63.7% 62.2% 59.2% UAAL Per Capita 1,976 2,947 2,729 2,942 3,285
Kentucky Assets 21,772,613 21,765,574 20,767,785 20,103,024 19,647,575 AAL 32,125,380 34,094,003 35,686,739 37,007,001 38,883,793 UAAL 10,352,767 12,328,429 14,918,955 16,903,977 19,236,218 Funded Ratio 67.8% 63.8% 58.2% 54.3% 50.5% UAAL Per Capita 2,416 2,877 3,481 3,944 4,488
Louisiana Assets 23,586,673 25,113,079 22,396,333 21,772,556 22,450,542 AAL 33,781,764 36,290,562 32,030,121 39,143,604 40,058,066 UAAL 10,195,091 11,177,483 9,633,788 17,371,048 17,607,524 Funded Ratio 69.8% 69.2% 69.9% 55.6% 56.0% UAAL Per Capita 2,301 2,523 2,175 3,921 3,975
Maine Assets 8,361,985 8,750,594 8,440,344 8,426,968 8,795,250 AAL 11,262,947 11,774,511 12,433,315 12,732,410 11,335,259 UAAL 2,900,962 3,023,917 3,992,971 4,305,442 2,540,009 Funded Ratio 74.2% 74.3% 67.9% 66.2% 77.6% UAAL Per Capita 2,185 2,278 3,008 3,243 1,913
Maryland Assets 37,886,936 39,504,284 34,284,569 34,688,346 36,177,656 AAL 47,144,354 50,244,047 52,729,171 54,085,081 55,917,543 UAAL 9,257,418 10,739,763 18,444,602 19,396,735 19,739,887 Funded Ratio 80.4% 78.6% 65.0% 64.1% 64.7% UAAL Per Capita 1,625 1,885 3,238 3,405 3,465

12 The State of State Pension Plans: A Deep Dive Into Shortfalls and Surpluses
2007 2008 2009 2010 2011
Massachusetts Assets 39,265,617 43,284,209 35,919,945 40,281,524 44,362,852 AAL 50,991,524 53,776,006 56,267,022 58,601,387 61,133,767 UAAL 11,725,907 10,491,797 20,347,077 18,319,863 16,770,915 Funded Ratio 77.0% 80.5% 63.8% 68.7% 72.6% UAAL Per Capita 1,810 1,620 3,141 2,828 2,589
Michigan Assets 55,390,200 58,241,300 58,811,200 57,498,300 55,704,500 AAL 63,609,900 66,009,500 70,326,800 72,918,100 77,883,400 UAAL 8,219,700 7,768,200 11,515,600 15,419,800 22,178,900 Funded Ratio 87.1% 88.2% 83.6% 78.9% 71.5% UAAL Per Capita 826 781 1,157 1,549 2,228
Minnesota Assets 29,075,302 28,595,205 28,263,705 27,626,374 27,627,603 AAL 32,784,396 34,001,154 35,510,278 34,210,748 34,828,683 UAAL 3,709,094 5,405,949 7,246,573 6,584,374 7,201,080 Funded Ratio 88.7% 84.1% 79.6% 80.8% 79.3% UAAL Per Capita 1,261 1,838 2,463 2,238 2,448
Mississippi Assets 20,088,912 21,126,762 20,903,289 20,437,755 20,607,036 AAL 27,248,923 28,931,887 31,005,711 31,828,346 33,087,502 UAAL 7,160,011 7,805,125 10,102,422 11,390,591 12,480,466 Funded Ratio 73.7% 73.0% 67.4% 64.2% 62.3% UAAL Per Capita 2,434 2,653 3,434 3,872 4,242
Missouri Assets 36,174,004 38,446,743 38,254,989 38,319,430 38,935,657 AAL 44,121,085 46,993,230 49,037,428 50,726,637 48,198,049 UAAL 7,947,082 8,546,486 10,782,439 12,407,208 9,262,392 Funded Ratio 82.0% 81.8% 78.0% 75.5% 80.8% UAAL Per Capita 1,342 1,443 1,821 2,095 1,564
Montana Assets 7,650,336 8,110,894 7,659,206 7,748,736 7,585,464 AAL 9,168,369 9,725,168 10,304,575 11,064,666 11,446,051 UAAL 1,518,033 1,614,274 2,645,369 3,315,930 3,860,587 Funded Ratio 83.4% 83.4% 74.3% 70.0% 66.3% UAAL Per Capita 1,559 1,658 2,717 3,405 3,965
Nebraska Assets 7,368,558 7,963,814 8,073,287 8,149,754 8,415,852 AAL 8,026,690 8,719,033 9,230,597 9,748,009 10,320,850 UAAL 658,132 755,219 1,157,310 1,598,255 1,904,998 Funded Ratio 91.8% 91.3% 87.5% 83.6% 81.5% UAAL Per Capita 366 420 643 888 1,059
Nevada Actuarial Assets 21,395,755 23,282,100 24,015,893 24,777,010 25,931,848 AAL 27,732,493 30,563,851 33,148,347 35,164,102 36,969,843 UAAL 6,336,739 7,281,752 9,132,454 10,387,092 11,037,995 Funded Ratio 77.2% 76.2% 72.4% 70.5% 70.1% UAAL Per Capita 2,406 2,765 3,468 3,944 4,192
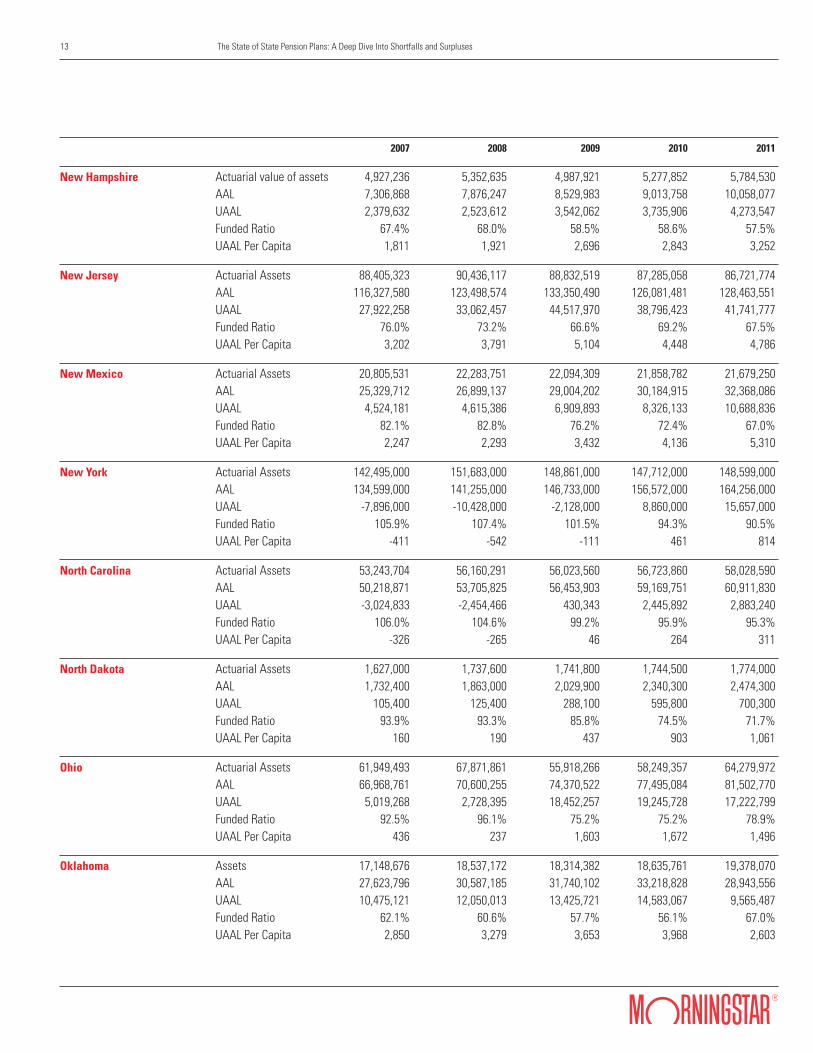
13 The State of State Pension Plans: A Deep Dive Into Shortfalls and Surpluses
2007 2008 2009 2010 2011
New Hampshire Actuarial value of assets 4,927,236 5,352,635 4,987,921 5,277,852 5,784,530 AAL 7,306,868 7,876,247 8,529,983 9,013,758 10,058,077 UAAL 2,379,632 2,523,612 3,542,062 3,735,906 4,273,547 Funded Ratio 67.4% 68.0% 58.5% 58.6% 57.5% UAAL Per Capita 1,811 1,921 2,696 2,843 3,252
New Jersey Actuarial Assets 88,405,323 90,436,117 88,832,519 87,285,058 86,721,774 AAL 116,327,580 123,498,574 133,350,490 126,081,481 128,463,551 UAAL 27,922,258 33,062,457 44,517,970 38,796,423 41,741,777 Funded Ratio 76.0% 73.2% 66.6% 69.2% 67.5% UAAL Per Capita 3,202 3,791 5,104 4,448 4,786
New Mexico Actuarial Assets 20,805,531 22,283,751 22,094,309 21,858,782 21,679,250 AAL 25,329,712 26,899,137 29,004,202 30,184,915 32,368,086 UAAL 4,524,181 4,615,386 6,909,893 8,326,133 10,688,836 Funded Ratio 82.1% 82.8% 76.2% 72.4% 67.0% UAAL Per Capita 2,247 2,293 3,432 4,136 5,310
New York Actuarial Assets 142,495,000 151,683,000 148,861,000 147,712,000 148,599,000 AAL 134,599,000 141,255,000 146,733,000 156,572,000 164,256,000 UAAL -7,896,000 -10,428,000 -2,128,000 8,860,000 15,657,000 Funded Ratio 105.9% 107.4% 101.5% 94.3% 90.5% UAAL Per Capita -411 -542 -111 461 814
North Carolina Actuarial Assets 53,243,704 56,160,291 56,023,560 56,723,860 58,028,590 AAL 50,218,871 53,705,825 56,453,903 59,169,751 60,911,830 UAAL -3,024,833 -2,454,466 430,343 2,445,892 2,883,240 Funded Ratio 106.0% 104.6% 99.2% 95.9% 95.3% UAAL Per Capita -326 -265 46 264 311
North Dakota Actuarial Assets 1,627,000 1,737,600 1,741,800 1,744,500 1,774,000 AAL 1,732,400 1,863,000 2,029,900 2,340,300 2,474,300 UAAL 105,400 125,400 288,100 595,800 700,300 Funded Ratio 93.9% 93.3% 85.8% 74.5% 71.7% UAAL Per Capita 160 190 437 903 1,061
Ohio Actuarial Assets 61,949,493 67,871,861 55,918,266 58,249,357 64,279,972 AAL 66,968,761 70,600,255 74,370,522 77,495,084 81,502,770 UAAL 5,019,268 2,728,395 18,452,257 19,245,728 17,222,799 Funded Ratio 92.5% 96.1% 75.2% 75.2% 78.9% UAAL Per Capita 436 237 1,603 1,672 1,496
Oklahoma Assets 17,148,676 18,537,172 18,314,382 18,635,761 19,378,070 AAL 27,623,796 30,587,185 31,740,102 33,218,828 28,943,556 UAAL 10,475,121 12,050,013 13,425,721 14,583,067 9,565,487 Funded Ratio 62.1% 60.6% 57.7% 56.1% 67.0% UAAL Per Capita 2,850 3,279 3,653 3,968 2,603
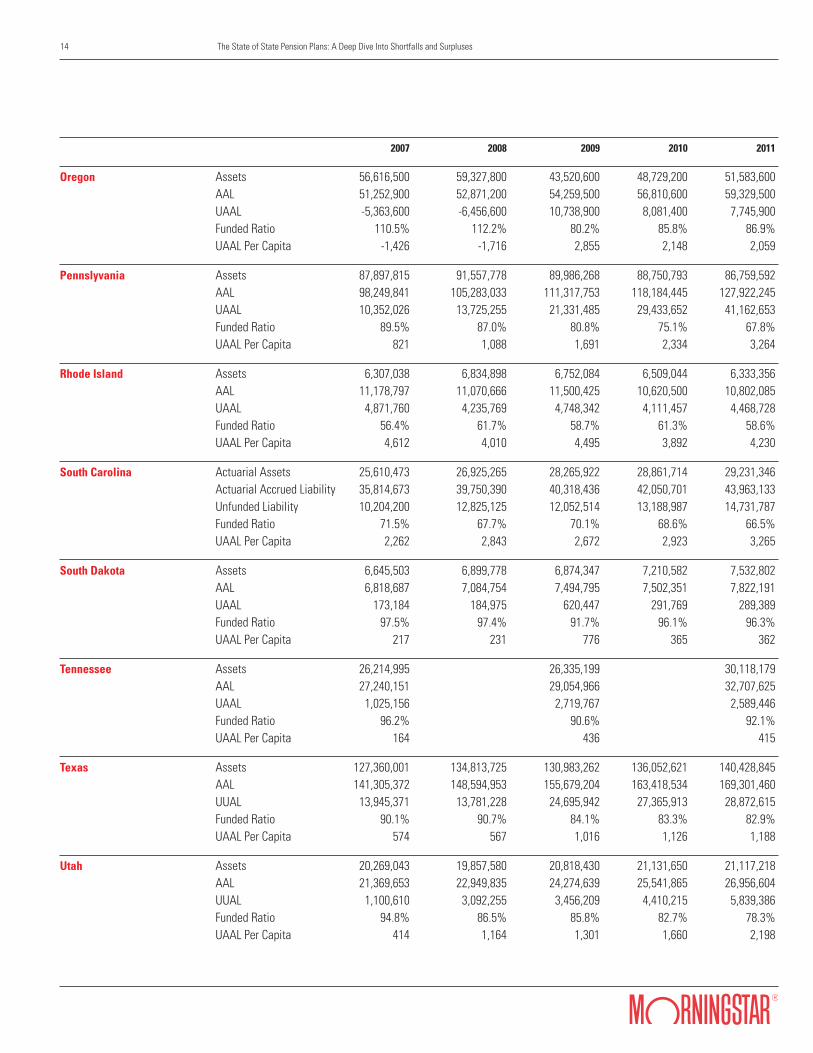
14 The State of State Pension Plans: A Deep Dive Into Shortfalls and Surpluses
2007 2008 2009 2010 2011
Oregon Assets 56,616,500 59,327,800 43,520,600 48,729,200 51,583,600 AAL 51,252,900 52,871,200 54,259,500 56,810,600 59,329,500 UAAL -5,363,600 -6,456,600 10,738,900 8,081,400 7,745,900 Funded Ratio 110.5% 112.2% 80.2% 85.8% 86.9% UAAL Per Capita -1,426 -1,716 2,855 2,148 2,059
Pennslyvania Assets 87,897,815 91,557,778 89,986,268 88,750,793 86,759,592 AAL 98,249,841 105,283,033 111,317,753 118,184,445 127,922,245 UAAL 10,352,026 13,725,255 21,331,485 29,433,652 41,162,653 Funded Ratio 89.5% 87.0% 80.8% 75.1% 67.8% UAAL Per Capita 821 1,088 1,691 2,334 3,264
Rhode Island Assets 6,307,038 6,834,898 6,752,084 6,509,044 6,333,356 AAL 11,178,797 11,070,666 11,500,425 10,620,500 10,802,085 UAAL 4,871,760 4,235,769 4,748,342 4,111,457 4,468,728 Funded Ratio 56.4% 61.7% 58.7% 61.3% 58.6% UAAL Per Capita 4,612 4,010 4,495 3,892 4,230
South Carolina Actuarial Assets 25,610,473 26,925,265 28,265,922 28,861,714 29,231,346 Actuarial Accrued Liability 35,814,673 39,750,390 40,318,436 42,050,701 43,963,133 Unfunded Liability 10,204,200 12,825,125 12,052,514 13,188,987 14,731,787 Funded Ratio 71.5% 67.7% 70.1% 68.6% 66.5% UAAL Per Capita 2,262 2,843 2,672 2,923 3,265
South Dakota Assets 6,645,503 6,899,778 6,874,347 7,210,582 7,532,802 AAL 6,818,687 7,084,754 7,494,795 7,502,351 7,822,191 UAAL 173,184 184,975 620,447 291,769 289,389 Funded Ratio 97.5% 97.4% 91.7% 96.1% 96.3% UAAL Per Capita 217 231 776 365 362
Tennessee Assets 26,214,995 26,335,199 30,118,179 AAL 27,240,151 29,054,966 32,707,625 UAAL 1,025,156 2,719,767 2,589,446 Funded Ratio 96.2% 90.6% 92.1% UAAL Per Capita 164 436 415
Texas Assets 127,360,001 134,813,725 130,983,262 136,052,621 140,428,845 AAL 141,305,372 148,594,953 155,679,204 163,418,534 169,301,460 UUAL 13,945,371 13,781,228 24,695,942 27,365,913 28,872,615 Funded Ratio 90.1% 90.7% 84.1% 83.3% 82.9% UAAL Per Capita 574 567 1,016 1,126 1,188
Utah Assets 20,269,043 19,857,580 20,818,430 21,131,650 21,117,218 AAL 21,369,653 22,949,835 24,274,639 25,541,865 26,956,604 UUAL 1,100,610 3,092,255 3,456,209 4,410,215 5,839,386 Funded Ratio 94.8% 86.5% 85.8% 82.7% 78.3% UAAL Per Capita 414 1,164 1,301 1,660 2,198
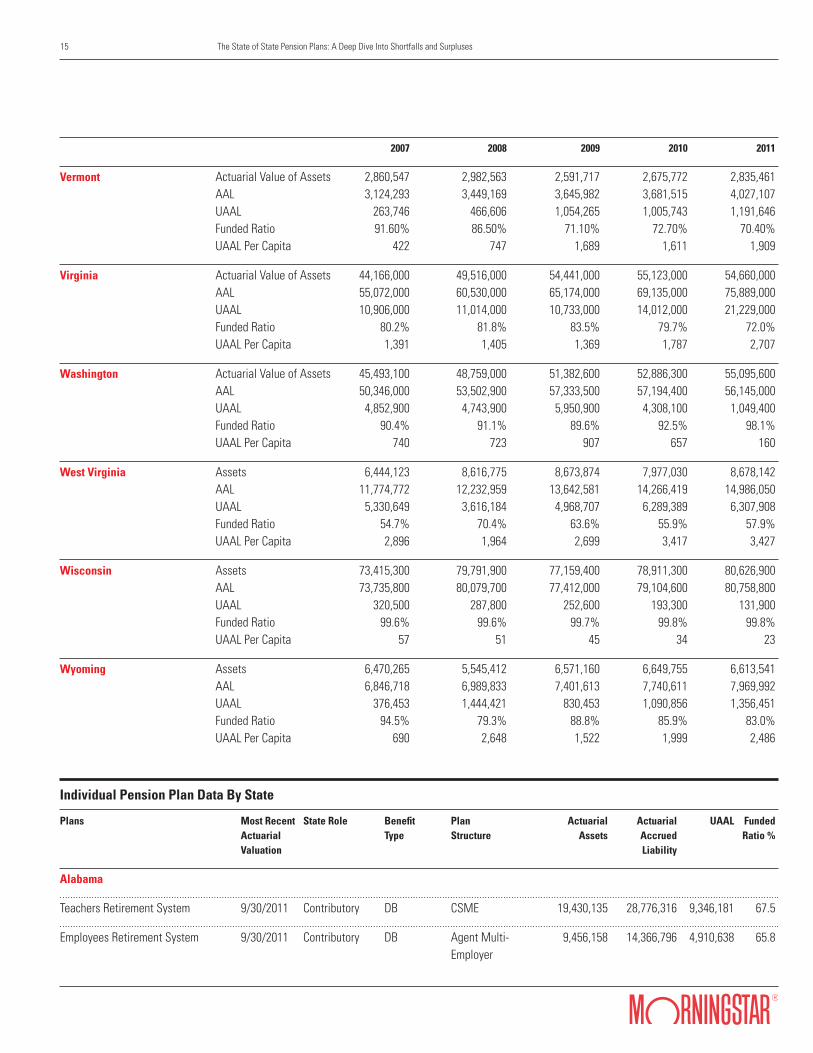
15 The State of State Pension Plans: A Deep Dive Into Shortfalls and Surpluses
2007 2008 2009 2010 2011
Vermont Actuarial Value of Assets 2,860,547 2,982,563 2,591,717 2,675,772 2,835,461 AAL 3,124,293 3,449,169 3,645,982 3,681,515 4,027,107 UAAL 263,746 466,606 1,054,265 1,005,743 1,191,646 Funded Ratio 91.60% 86.50% 71.10% 72.70% 70.40% UAAL Per Capita 422 747 1,689 1,611 1,909
Virginia Actuarial Value of Assets 44,166,000 49,516,000 54,441,000 55,123,000 54,660,000 AAL 55,072,000 60,530,000 65,174,000 69,135,000 75,889,000 UAAL 10,906,000 11,014,000 10,733,000 14,012,000 21,229,000 Funded Ratio 80.2% 81.8% 83.5% 79.7% 72.0% UAAL Per Capita 1,391 1,405 1,369 1,787 2,707
Washington Actuarial Value of Assets 45,493,100 48,759,000 51,382,600 52,886,300 55,095,600 AAL 50,346,000 53,502,900 57,333,500 57,194,400 56,145,000 UAAL 4,852,900 4,743,900 5,950,900 4,308,100 1,049,400 Funded Ratio 90.4% 91.1% 89.6% 92.5% 98.1% UAAL Per Capita 740 723 907 657 160
West Virginia Assets 6,444,123 8,616,775 8,673,874 7,977,030 8,678,142 AAL 11,774,772 12,232,959 13,642,581 14,266,419 14,986,050 UAAL 5,330,649 3,616,184 4,968,707 6,289,389 6,307,908 Funded Ratio 54.7% 70.4% 63.6% 55.9% 57.9% UAAL Per Capita 2,896 1,964 2,699 3,417 3,427
Wisconsin Assets 73,415,300 79,791,900 77,159,400 78,911,300 80,626,900 AAL 73,735,800 80,079,700 77,412,000 79,104,600 80,758,800 UAAL 320,500 287,800 252,600 193,300 131,900 Funded Ratio 99.6% 99.6% 99.7% 99.8% 99.8% UAAL Per Capita 57 51 45 34 23
Wyoming Assets 6,470,265 5,545,412 6,571,160 6,649,755 6,613,541 AAL 6,846,718 6,989,833 7,401,613 7,740,611 7,969,992 UAAL 376,453 1,444,421 830,453 1,090,856 1,356,451 Funded Ratio 94.5% 79.3% 88.8% 85.9% 83.0% UAAL Per Capita 690 2,648 1,522 1,999 2,486
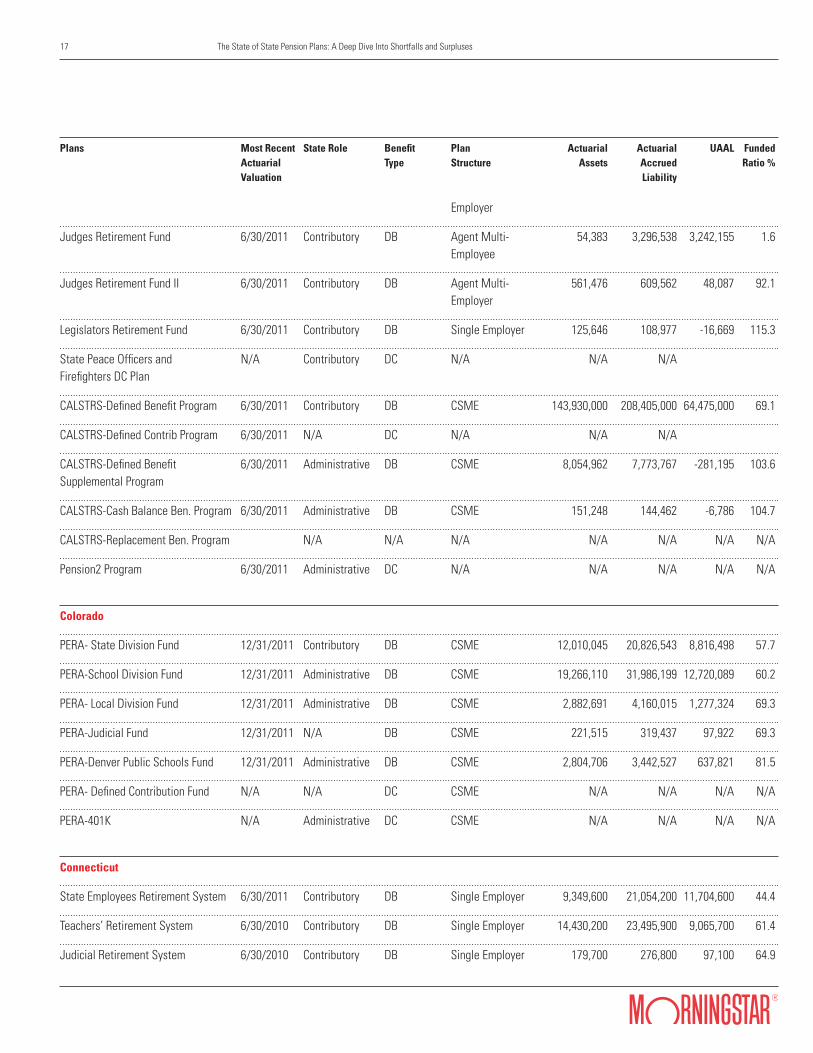
Plans Most Recent State Role Benefit Plan Actuarial Actuarial UAAL Funded Actuarial Type Structure Assets Accrued Ratio % Valuation Liability
Alabama
Teachers Retirement System 9/30/2011 Contributory DB CSME 19,430,135 28,776,316 9,346,181 67.5
Employees Retirement System 9/30/2011 Contributory DB Agent Multi- 9,456,158 14,366,796 4,910,638 65.8 Employer
Individual Pension Plan Data By State
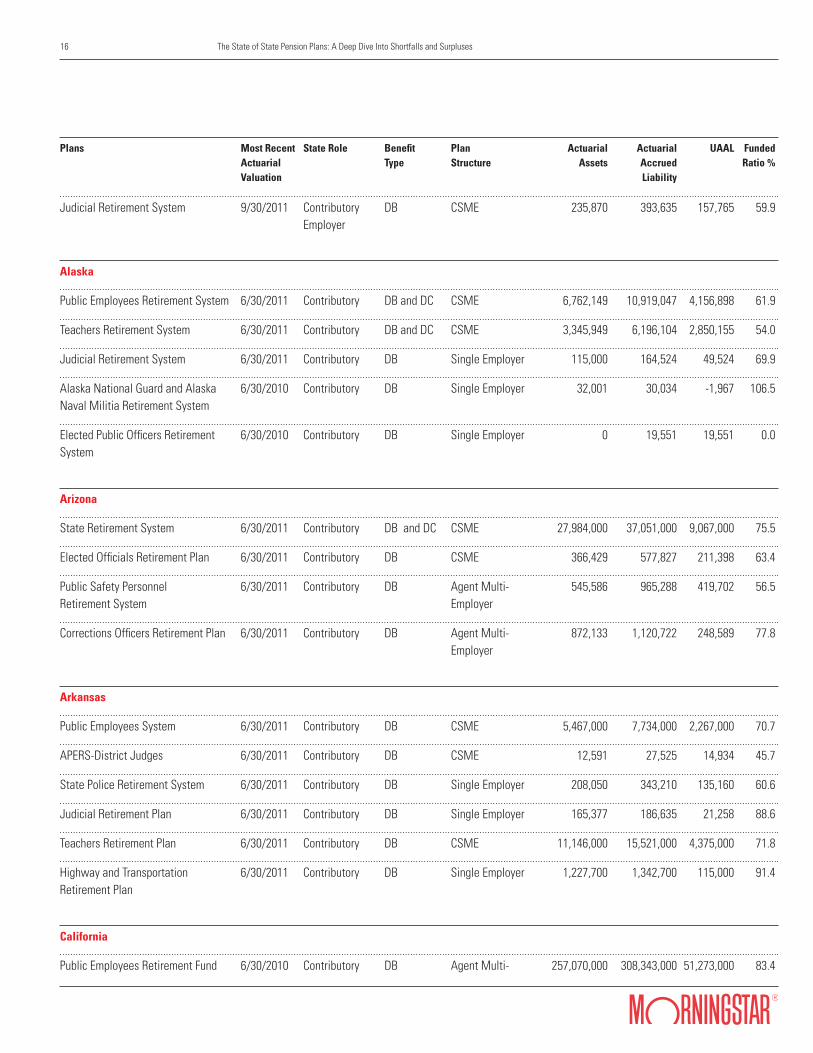
16 The State of State Pension Plans: A Deep Dive Into Shortfalls and Surpluses
Plans Most Recent State Role Benefit Plan Actuarial Actuarial UAAL Funded Actuarial Type Structure Assets Accrued Ratio % Valuation Liability
Judicial Retirement System 9/30/2011 Contributory DB CSME 235,870 393,635 157,765 59.9 Employer
Alaska
Public Employees Retirement System 6/30/2011 Contributory DB and DC CSME 6,762,149 10,919,047 4,156,898 61.9
Teachers Retirement System 6/30/2011 Contributory DB and DC CSME 3,345,949 6,196,104 2,850,155 54.0
Judicial Retirement System 6/30/2011 Contributory DB Single Employer 115,000 164,524 49,524 69.9
Alaska National Guard and Alaska 6/30/2010 Contributory DB Single Employer 32,001 30,034 -1,967 106.5 Naval Militia Retirement System
Elected Public Officers Retirement 6/30/2010 Contributory DB Single Employer 0 19,551 19,551 0.0 System
Arizona
State Retirement System 6/30/2011 Contributory DB and DC CSME 27,984,000 37,051,000 9,067,000 75.5
Elected Officials Retirement Plan 6/30/2011 Contributory DB CSME 366,429 577,827 211,398 63.4
Public Safety Personnel 6/30/2011 Contributory DB Agent Multi- 545,586 965,288 419,702 56.5 Retirement System Employer
Corrections Officers Retirement Plan 6/30/2011 Contributory DB Agent Multi- 872,133 1,120,722 248,589 77.8 Employer
Arkansas
Public Employees System 6/30/2011 Contributory DB CSME 5,467,000 7,734,000 2,267,000 70.7
APERS-District Judges 6/30/2011 Contributory DB CSME 12,591 27,525 14,934 45.7
State Police Retirement System 6/30/2011 Contributory DB Single Employer 208,050 343,210 135,160 60.6
Judicial Retirement Plan 6/30/2011 Contributory DB Single Employer 165,377 186,635 21,258 88.6
Teachers Retirement Plan 6/30/2011 Contributory DB CSME 11,146,000 15,521,000 4,375,000 71.8
Highway and Transportation 6/30/2011 Contributory DB Single Employer 1,227,700 1,342,700 115,000 91.4 Retirement Plan
California
Public Employees Retirement Fund 6/30/2010 Contributory DB Agent Multi- 257,070,000 308,343,000 51,273,000 83.4
17 The State of State Pension Plans: A Deep Dive Into Shortfalls and Surpluses
Plans Most Recent State Role Benefit Plan Actuarial Actuarial UAAL Funded Actuarial Type Structure Assets Accrued Ratio % Valuation Liability
Employer
Judges Retirement Fund 6/30/2011 Contributory DB Agent Multi- 54,383 3,296,538 3,242,155 1.6 Employee
Judges Retirement Fund II 6/30/2011 Contributory DB Agent Multi- 561,476 609,562 48,087 92.1 Employer
Legislators Retirement Fund 6/30/2011 Contributory DB Single Employer 125,646 108,977 -16,669 115.3
State Peace Officers and N/A Contributory DC N/A N/A N/A Firefighters DC Plan
CALSTRS-Defined Benefit Program 6/30/2011 Contributory DB CSME 143,930,000 208,405,000 64,475,000 69.1
CALSTRS-Defined Contrib Program 6/30/2011 N/A DC N/A N/A N/A
CALSTRS-Defined Benefit 6/30/2011 Administrative DB CSME 8,054,962 7,773,767 -281,195 103.6 Supplemental Program
CALSTRS-Cash Balance Ben. Program 6/30/2011 Administrative DB CSME 151,248 144,462 -6,786 104.7
CALSTRS-Replacement Ben. Program N/A N/A N/A N/A N/A N/A N/A
Pension2 Program 6/30/2011 Administrative DC N/A N/A N/A N/A N/A
Colorado
PERA- State Division Fund 12/31/2011 Contributory DB CSME 12,010,045 20,826,543 8,816,498 57.7
PERA-School Division Fund 12/31/2011 Administrative DB CSME 19,266,110 31,986,199 12,720,089 60.2
PERA- Local Division Fund 12/31/2011 Administrative DB CSME 2,882,691 4,160,015 1,277,324 69.3
PERA-Judicial Fund 12/31/2011 N/A DB CSME 221,515 319,437 97,922 69.3
PERA-Denver Public Schools Fund 12/31/2011 Administrative DB CSME 2,804,706 3,442,527 637,821 81.5
PERA- Defined Contribution Fund N/A N/A DC CSME N/A N/A N/A N/A
PERA-401K N/A Administrative DC CSME N/A N/A N/A N/A
Connecticut
State Employees Retirement System 6/30/2011 Contributory DB Single Employer 9,349,600 21,054,200 11,704,600 44.4
Teachers’ Retirement System 6/30/2010 Contributory DB Single Employer 14,430,200 23,495,900 9,065,700 61.4
Judicial Retirement System 6/30/2010 Contributory DB Single Employer 179,700 276,800 97,100 64.9
18 The State of State Pension Plans: A Deep Dive Into Shortfalls and Surpluses
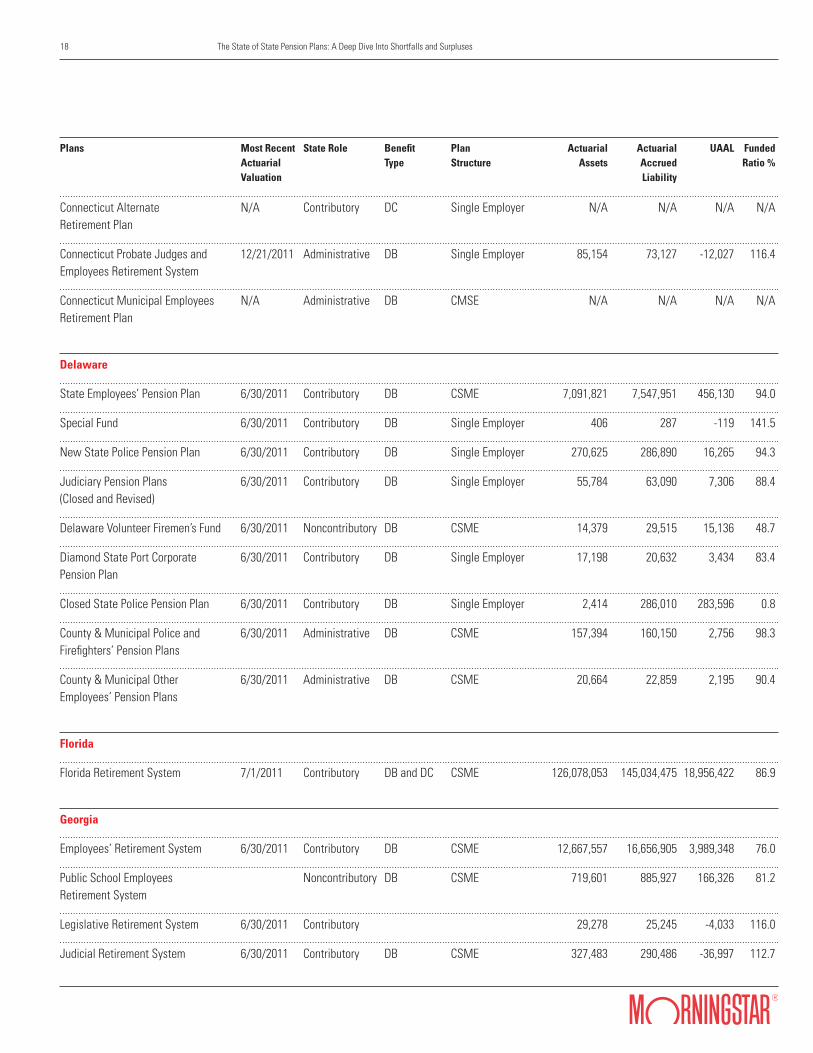
Plans Most Recent State Role Benefit Plan Actuarial Actuarial UAAL Funded Actuarial Type Structure Assets Accrued Ratio % Valuation Liability
Connecticut Alternate N/A Contributory DC Single Employer N/A N/A N/A N/A Retirement Plan
Connecticut Probate Judges and 12/21/2011 Administrative DB Single Employer 85,154 73,127 -12,027 116.4 Employees Retirement System
Connecticut Municipal Employees N/A Administrative DB CMSE N/A N/A N/A N/A Retirement Plan
Delaware
State Employees’ Pension Plan 6/30/2011 Contributory DB CSME 7,091,821 7,547,951 456,130 94.0
Special Fund 6/30/2011 Contributory DB Single Employer 406 287 -119 141.5
New State Police Pension Plan 6/30/2011 Contributory DB Single Employer 270,625 286,890 16,265 94.3
Judiciary Pension Plans 6/30/2011 Contributory DB Single Employer 55,784 63,090 7,306 88.4 (Closed and Revised)
Delaware Volunteer Firemen’s Fund 6/30/2011 Noncontributory DB CSME 14,379 29,515 15,136 48.7
Diamond State Port Corporate 6/30/2011 Contributory DB Single Employer 17,198 20,632 3,434 83.4 Pension Plan
Closed State Police Pension Plan 6/30/2011 Contributory DB Single Employer 2,414 286,010 283,596 0.8
County & Municipal Police and 6/30/2011 Administrative DB CSME 157,394 160,150 2,756 98.3 Firefighters’ Pension Plans
County & Municipal Other 6/30/2011 Administrative DB CSME 20,664 22,859 2,195 90.4 Employees’ Pension Plans
Florida
Florida Retirement System 7/1/2011 Contributory DB and DC CSME 126,078,053 145,034,475 18,956,422 86.9
Georgia
Employees’ Retirement System 6/30/2011 Contributory DB CSME 12,667,557 16,656,905 3,989,348 76.0
Public School Employees Noncontributory DB CSME 719,601 885,927 166,326 81.2 Retirement System
Legislative Retirement System 6/30/2011 Contributory 29,278 25,245 -4,033 116.0
Judicial Retirement System 6/30/2011 Contributory DB CSME 327,483 290,486 -36,997 112.7

19 The State of State Pension Plans: A Deep Dive Into Shortfalls and Surpluses
Plans Most Recent State Role Benefit Plan Actuarial Actuarial UAAL Funded Actuarial Type Structure Assets Accrued Ratio % Valuation Liability
Military Pension Fund 6/30/2011 Contributory DB CSME 8,702 26,767 18,065 32.5
Teachers Retirement System 6/30/2011 Contributory DB CSME 54,529,416 63,592,037 9,062,621 85.7
Hawaii
Employee Retirement System 6/30/2011 Contributory DB and CSME 11,942,800 20,096,900 8,154,100 59.4 Hybrid
Idaho
Public Employee Ret. Base Plan 7/1/2011 Contributory DB CSME 11,360,100 12,641,200 1,281,100 89.9
Firefighters’ Retirement Fund 7/1/2011 Contributory* DB CSME 290,400 311,500 21,100 93.2
Public Employee Retirement Fund N/A Contributory DC N/A N/A N/A N/A N/A Choice Plan 401k
Public Employee Retirement Fund N/A Administrative DC N/A N/A N/A N/A N/A Choice Plan 414k
Illinois
General Assembly Retirement System 6/30/2011 Contributory DB Single Employer 63,161 298,408 235,247 21.2
Judges Retirement System 6/30/2011 Contributory DB Single Employer 614,596 1,952,539 1,337,943 31.5
State Employees Retirement System 6/30/2011 Contributory DB Single Employer 11,159,837 31,395,008 20,235,171 35.5
Teachers Retirement System 6/30/2011 Contributory DB CSME 37,769,753 81,299,745 43,529,992 46.5
State University Retirement System 6/30/2011 Contributory DB and DC CSME 13,945,680 31,514,336 17,568,656 44.3
Indiana
State Police Retirement Fund 6/30/2011 Contributory DB Single Employer 361,457 470,852 109,395 76.8
State Excise Police, Gaming Agent, 6/30/2011 Contributory DB Single Employer 72,599 101,534 28,935 71.5 Gaming Control Officer and Conservation Enforcement Officers Retirement Plan
Prosecuting Attorney’s Retirement 6/30/2011 Contributory DB Single Employer 25,651 53,252 27,601 48.2 Fund
20 The State of State Pension Plans: A Deep Dive Into Shortfalls and Surpluses
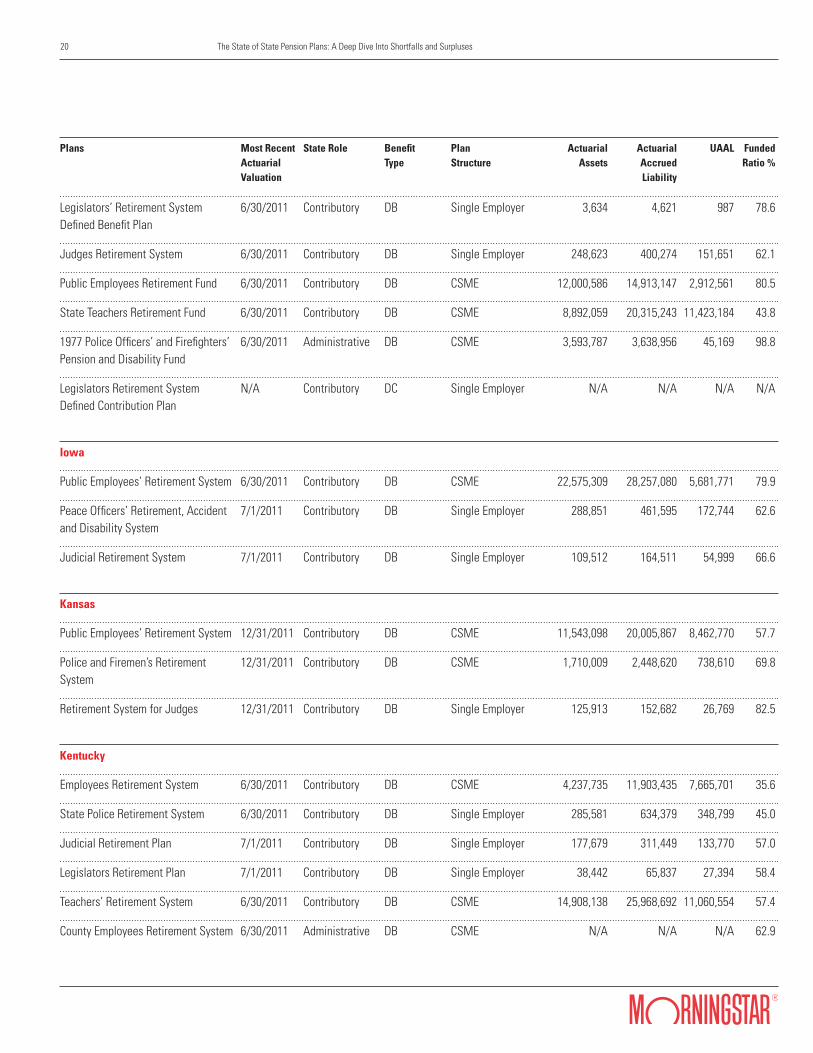
Plans Most Recent State Role Benefit Plan Actuarial Actuarial UAAL Funded Actuarial Type Structure Assets Accrued Ratio % Valuation Liability
Legislators’ Retirement System 6/30/2011 Contributory DB Single Employer 3,634 4,621 987 78.6 Defined Benefit Plan
Judges Retirement System 6/30/2011 Contributory DB Single Employer 248,623 400,274 151,651 62.1
Public Employees Retirement Fund 6/30/2011 Contributory DB CSME 12,000,586 14,913,147 2,912,561 80.5
State Teachers Retirement Fund 6/30/2011 Contributory DB CSME 8,892,059 20,315,243 11,423,184 43.8
1977 Police Officers’ and Firefighters’ 6/30/2011 Administrative DB CSME 3,593,787 3,638,956 45,169 98.8 Pension and Disability Fund
Legislators Retirement System N/A Contributory DC Single Employer N/A N/A N/A N/A Defined Contribution Plan
Iowa
Public Employees’ Retirement System 6/30/2011 Contributory DB CSME 22,575,309 28,257,080 5,681,771 79.9
Peace Officers’ Retirement, Accident 7/1/2011 Contributory DB Single Employer 288,851 461,595 172,744 62.6 and Disability System
Judicial Retirement System 7/1/2011 Contributory DB Single Employer 109,512 164,511 54,999 66.6
Kansas
Public Employees’ Retirement System 12/31/2011 Contributory DB CSME 11,543,098 20,005,867 8,462,770 57.7
Police and Firemen’s Retirement 12/31/2011 Contributory DB CSME 1,710,009 2,448,620 738,610 69.8 System
Retirement System for Judges 12/31/2011 Contributory DB Single Employer 125,913 152,682 26,769 82.5
Kentucky
Employees Retirement System 6/30/2011 Contributory DB CSME 4,237,735 11,903,435 7,665,701 35.6
State Police Retirement System 6/30/2011 Contributory DB Single Employer 285,581 634,379 348,799 45.0
Judicial Retirement Plan 7/1/2011 Contributory DB Single Employer 177,679 311,449 133,770 57.0
Legislators Retirement Plan 7/1/2011 Contributory DB Single Employer 38,442 65,837 27,394 58.4
Teachers’ Retirement System 6/30/2011 Contributory DB CSME 14,908,138 25,968,692 11,060,554 57.4
County Employees Retirement System 6/30/2011 Administrative DB CSME N/A N/A N/A 62.9
21 The State of State Pension Plans: A Deep Dive Into Shortfalls and Surpluses
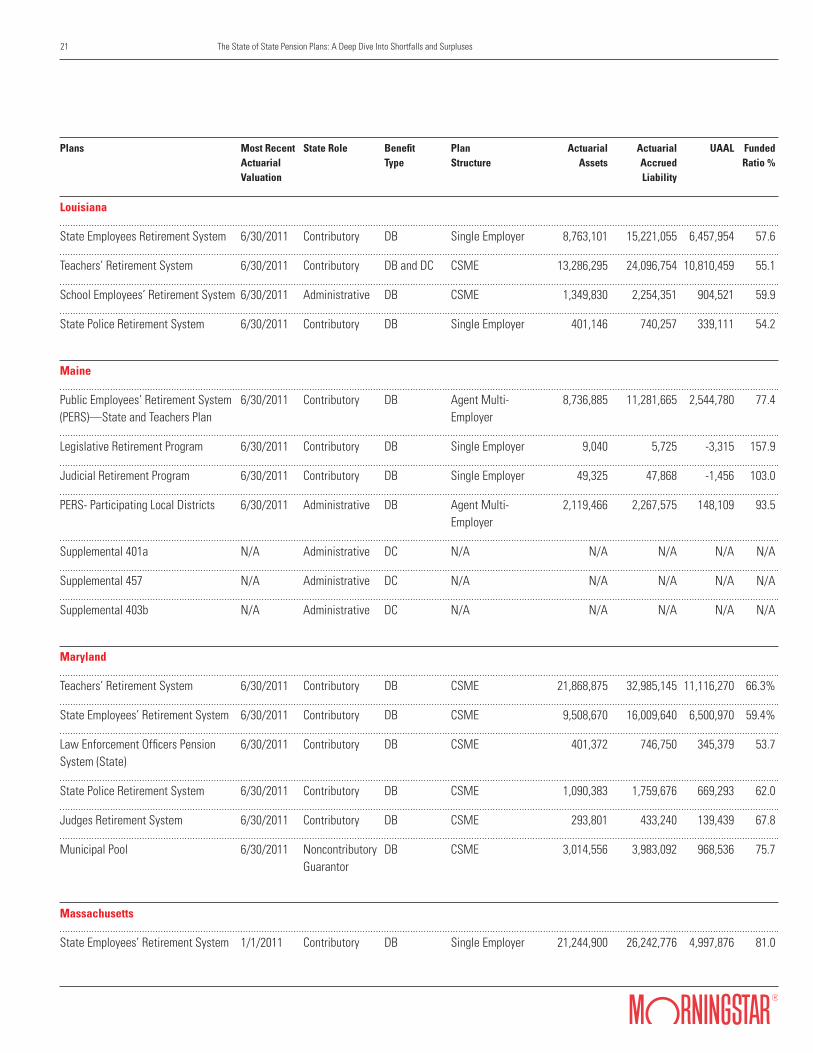
Plans Most Recent State Role Benefit Plan Actuarial Actuarial UAAL Funded Actuarial Type Structure Assets Accrued Ratio % Valuation Liability
Louisiana
State Employees Retirement System 6/30/2011 Contributory DB Single Employer 8,763,101 15,221,055 6,457,954 57.6
Teachers’ Retirement System 6/30/2011 Contributory DB and DC CSME 13,286,295 24,096,754 10,810,459 55.1
School Employees’ Retirement System 6/30/2011 Administrative DB CSME 1,349,830 2,254,351 904,521 59.9
State Police Retirement System 6/30/2011 Contributory DB Single Employer 401,146 740,257 339,111 54.2
Maine
Public Employees’ Retirement System 6/30/2011 Contributory DB Agent Multi- 8,736,885 11,281,665 2,544,780 77.4 (PERS)—State and Teachers Plan Employer
Legislative Retirement Program 6/30/2011 Contributory DB Single Employer 9,040 5,725 -3,315 157.9
Judicial Retirement Program 6/30/2011 Contributory DB Single Employer 49,325 47,868 -1,456 103.0
PERS- Participating Local Districts 6/30/2011 Administrative DB Agent Multi- 2,119,466 2,267,575 148,109 93.5 Employer
Supplemental 401a N/A Administrative DC N/A N/A N/A N/A N/A
Supplemental 457 N/A Administrative DC N/A N/A N/A N/A N/A
Supplemental 403b N/A Administrative DC N/A N/A N/A N/A N/A
Maryland
Teachers’ Retirement System 6/30/2011 Contributory DB CSME 21,868,875 32,985,145 11,116,270 66.3%
State Employees’ Retirement System 6/30/2011 Contributory DB CSME 9,508,670 16,009,640 6,500,970 59.4%
Law Enforcement Officers Pension 6/30/2011 Contributory DB CSME 401,372 746,750 345,379 53.7 System (State)
State Police Retirement System 6/30/2011 Contributory DB CSME 1,090,383 1,759,676 669,293 62.0
Judges Retirement System 6/30/2011 Contributory DB CSME 293,801 433,240 139,439 67.8
Municipal Pool 6/30/2011 Noncontributory DB CSME 3,014,556 3,983,092 968,536 75.7 Guarantor
Massachusetts
State Employees’ Retirement System 1/1/2011 Contributory DB Single Employer 21,244,900 26,242,776 4,997,876 81.0
22 The State of State Pension Plans: A Deep Dive Into Shortfalls and Surpluses
Plans Most Recent State Role Benefit Plan Actuarial Actuarial UAAL Funded Actuarial Type Structure Assets Accrued Ratio % Valuation Liability
Teachers’ Retirement System 1/1/2011 Contributory DB CSME 23,117,952 34,890,991 11,773,039 66.3
Michigan
Legislative Retirement System 9/30/2010 Contributory DB Single Employer 159,000 172,700 13,700 92.1
State Police Retirement System 9/30/2010 Contributory DB Single Employer 1,202,000 1,594,300 392,300 75.4
State Employees Retirement System 9/30/2010 Contributory DB Single Employer 10,782,300 14,860,400 4,078,100 72.6
Public School Employees Retirement 9/30/2010 Contributory DB CSME 43,294,000 60,927,000 17,633,000 71.1 System
Judges’ Retirement Plan 9/30/2011 Contributory DB CSME 267,200 251,700 -15,500 106.2
Military Retirement Plan 9/30/2011 Contributory DB Single Employer 0 77,300 77,300 0.0
Defined Contribution Plan N/A Contributory DC N/A N/A N/A N/A N/A
Minnesota
State Employees Retirement Fund 7/1/2011 Contributory DB Single Employer 9,130,011 10,576,481 1,446,470 86.3
Correctional Employees 7/1/2011 Contributory DB Single Employer 637,027 907,012 269,985 70.2 Retirement Fund
Elective State Officers Fund 7/1/2011 Contributory DB Single Employer 0 7,610 7,610 0.0
Judges Fund 7/1/2011 Contributory DB Single Employer 145,996 248,630 102,634 58.7
Legislators Ret. Fund 7/1/2011 Contributory DB Single Employer 19,140 216,559 197,419 8.8
State Patrol Ret. Fund 7/1/2011 Contributory DB Single Employer 563,046 700,898 137,852 80.3
Minneapolis Employees 7/1/2011 Administrative DB CSME 910,987 1,238,703 327,716 73.5 Retirement Fund
Teachers Ret. Fund 7/1/2011 Contributory DB CSME 17,132,383 22,171,493 5,039,110 77.3
Police and Fire Fund 7/1/2011 Administrative DB CSME 5,274,602 6,363,546 1,088,944 82.9
Public Employees Correctional Fund 7/1/2011 Administrative DB CSME 274,704 284,593 9,889 96.5
Public Employees Retirement Fund 7/1/2011 Administrative DB CSME 13,455,753 17,898,849 4,443,096 75.2
Volunteer Firefighter Retirement Fund N/A Administrative DB Multi-Employer N/A N/A N/A N/A Agent
23 The State of State Pension Plans: A Deep Dive Into Shortfalls and Surpluses
Plans Most Recent State Role Benefit Plan Actuarial Actuarial UAAL Funded Actuarial Type Structure Assets Accrued Ratio % Valuation Liability
Unclassified Employees N/A Contributory DC N/A N/A N/A N/A N/A Retirement Fund
DC Fund N/A Administrative DC N/A N/A N/A N/A N/A
State Colleges and Universities N/A Administrative DC N/A N/A N/A N/A N/A Retirement Fund
Hennepin County Supplemental N/A Administrative DC Single Employer N/A N/A N/A N/A Retirement Fund
Mississippi
Public Employees’ Retirement 6/30/2011 Contributory DB CSME 20,315,165 32,654,465 12,339,300 62.2 System
Highway Safety Patrol Retirement 6/30/2011 Contributory DB Single Employer 278,265 414,432 136,167 67.1 System
Supplemental Legislative Retirement 6/30/2011 Contributory DB Single Employer 13,606 18,605 4,999 73.1 System
Municipal Retirement System 9/30/2011 Administrative DB Agent Multi-Employer 167,604 363,604 196,000 46.1
Missouri
State Employees’ Retirement System 6/30/2011 Contributory DB Single Employer 8,022,481 10,123,544 2,101,063 79.2
Judicial Retirement Plan 6/30/2011 Contributory DB Single Employer 98,399 393,485 295,086 25.0
Department of Transportation and 6/30/2011 Contributory DB Single Employer 1,427,291 3,297,590 1,870,299 43.3 Highway Patrol Employees’ Retirement System
Public School Retirement System 6/30/2011 Contributory DB CSME 29,387,486 34,383,430 4,995,944 85.5
Montana
Judges Retirement System 6/30/2011 Contributory DB Single Employer 61,274 43,414 -17,860 141.1
Highway Patrol Officers 6/30/2011 Contributory DB Single Employer 95,274 155,742 60,468 61.2 Retirement System
Public Employees Retirement 6/30/2011 Contributory DB CSME 3,800,479 5,410,144 1,609,665 70.2 System (PERS)—Defined Benefit Plan
Sheriffs Retirement System 6/30/2011 Contributory DB CSME 203,689 266,506 62,817 76.4
24 The State of State Pension Plans: A Deep Dive Into Shortfalls and Surpluses
Plans Most Recent State Role Benefit Plan Actuarial Actuarial UAAL Funded Actuarial Type Structure Assets Accrued Ratio % Valuation Liability
Game Wardens & Peace Officers 6/30/2011 Contributory DB CSME 90,437 119,881 29,444 75.4 Retirement System
Municipal Police Officers 6/30/2011 Contributory DB CSME 221,669 401,381 179,712 55.2 Retirement System
Firefighters United Retirement System 6/30/2011 Contributory DB CSME 219,959 355,188 135,229 61.9
Volunteer Firefighter 6/30/2011 Contributory DB CSME 26,183 35,195 9,012 74.4 Compensation Act
Teachers Retirement System 7/1/2011 Contributory DB CSME 2,866,500 4,658,600 1,792,100 61.5
PERS- Defined Contribution Plan N/A Contributory DC N/A N/A N/A N/A N/A
Nebraska
State Employees Retirement System 1/1/2012 Contributory DB and DC Single Employer 743,971 813,286 69,315 91.5
School Retirement System 6/30/2011 Contributory DB CSME 7,267,497 9,039,745 1,772,248 80.4
Judges Retirement System 6/30/2011 Contributory DB Single Employer 125,191 128,265 3,074 97.6
State Patrol Retirement System 6/30/2011 Contributory DB Single Employer 279,193 339,554 60,361 82.2
County Employees Retirement System 1/1/2012 Administrative DB and DC CSME 220,663 240,195 19,532 91.9
Nevada
Public Employees Retirement System 6/30/2011 Contributory DB CSME 25,871,100 36,876,200 11,005,100 70.2
Legislators Retirement System 7/1/2010 Contributory DB Single Employer 4,134 5,608 1,474 73.7
Judicial Retirement System 6/30/2011 Contributory DB Agent Multi-Employer 56,614 88,035 31,421 64.3
New Hampshire
Retirement System 6/30/2011 Contributory DB CSME 5,740,516 9,998,251 4,257,735 57.4
Judicial Retirement Plan 1/1/2010 Contributory DB Single Employer 44,014 59,826 15,812 73.6
New Jersey
Consolidated Police & 7/1/2011 Contributory DB CSME 8,127 9,180 1,053 88.5 Fire Pension Fund
25 The State of State Pension Plans: A Deep Dive Into Shortfalls and Surpluses
Plans Most Recent State Role Benefit Plan Actuarial Actuarial UAAL Funded Actuarial Type Structure Assets Accrued Ratio % Valuation Liability
Judicial Retirement System 7/1/2011 Contributory DB Single Employer 305,246 585,701 280,455 52.1
Police & Firemen’s Retirement System 7/1/2011 Contributory DB CSME 23,171,332 30,905,158 7,733,825 75.0
Prison Officers Pension Fund 7/1/2011 Contributory DB Single Employer 9,998 5,097 -4,901 196.2
Public Employees’ Retirement System 7/1/2011 Contributory DB CSME 28,934,369 42,969,925 14,035,555 67.3
State Police Retirement System 7/1/2011 Contributory DB Single Employer 2,002,814 2,581,951 579,137 77.6
Teachers’ Pension & Annuity Fund 7/1/2011 Contributory DB CSME 32,289,888 51,406,540 19,116,652 62.8
Supplemental Annuity Collective N/A Administrative DC Single Employer N/A N/A N/A N/A Trust Fund
Central Pension Fund N/A Administrative DC Single Employer N/A N/A N/A N/A
Pensions Adjustment Fund N/A Contributory Other Various N/A N/A N/A N/A
DC Retirement Program N/A N/A DC N/A N/A N/A N/A N/A
New Mexico
Public Employees’ Retirement System 6/30/2011 Contributory DB CSME 11,878,725 16,852,739 4,974,014 70.5
Judicial Retirement System 6/30/2011 Contributory DB CSME 78,199 139,709 61,510 56.0
Magistrate Retirement System 6/30/2011 Contributory DB CSME 33,121 55,429 22,308 59.8
Volunteer Firefighters Retirement 6/30/2011 Contributory DB CSME 47,005 27,109 -19,896 173.4 System
Educational Employees’ Retirement 6/30/2011 Contributory DB CSME 9,642,200 15,293,100 5,650,900 63.0 System
New York
State and Local Employees’ 4/1/2011 Contributory DB CSME 126,394,000 140,087,000 13,693,000 90.2 Retirement System
State and Local Police and Fire 4/1/2011 Contributory DB CSME 22,205,000 24,169,000 1,964,000 91.9 Retirement System
North Carolina
Teachers and State Employees 12/31/2010 Contributory DB CSME 57,102,198 59,876,066 2,773,868 95.4 Retirement System

26 The State of State Pension Plans: A Deep Dive Into Shortfalls and Surpluses
Plans Most Recent State Role Benefit Plan Actuarial Actuarial UAAL Funded Actuarial Type Structure Assets Accrued Ratio % Valuation Liability
Consolidated Judicial Retirement 12/31/2010 Contributory DB Single Employer 451,196 492,606 41,410 91.6 System
Legislative Ret. System 12/31/2010 Contributory DB Single Employer 29,835 23,752 -6,083 125.6
Firemen’s and Rescue Squad 6/30/2011 Contributory DB CSME 327,984 391,837 63,853 83.7 Workers’ Pension Fund
National Guard Pension Fund 12/31/2010 Contributory DB CSME 86,559 127,066 40,507 68.1
Registers of Deed’s Supplemental 12/31/2010 Administrative DB CSME 40,529 22,104 -18,425 183.4 Pension Fund
Sheriffs Supplemental Pension Fund N/A Administrative DC N/A N/A N/A N/A N/A
Local Govt. Employees’ N/A Administrative DC CSME 18,570,514 18,646,430 75,916 99.6 Retirement System
Optional Retirement System N/A Administrative DC N/A N/A N/A N/A N/A
Separation Allowance N/A Contributory DB Agent Multi-Employer N/A N/A N/A N/A
North Dakota
Public Employees’ Retirement System 7/1/2011 Contributory DB CSME 1,650,400 2,339,800 689,400 70.5
Highway Patrolmen’s Retirement 7/1/2011 Contributory DB Single Employer 49,500 67,100 17,600 73.8 System
Retirement Plan for the Employees 7/1/2011 Contributory DB Single Employer 74,100 67,400 -6,700 109.9 of Job Service North Dakota
Teachers’ Fund for Retirement 7/1/2011 Administrative DB CSME 1,822,600 2,749,800 927,200 66.3
Defined Contribution Retirement Plan 7/1/2011 Contributory DC Single Employer N/A N/A N/A N/A
Ohio
Public Employees’ Retirement System 12/31/2010 Contributory DB and DC CSME 63,649,000 80,485,000 16,836,000 79.1
Teachers’ Retirement System Jul-10 Administrative DB and DC CSME 58,110,495 98,766,204 40,655,709 58.8
Highway Patrolmen’s Retirement 12/31/2010 Contributory DB Single Employer 630,972 1,017,770 386,799 62.0 System
Alternative Retirement Plan N/A Contributory DC CSME N/A N/A N/A N/A
27 The State of State Pension Plans: A Deep Dive Into Shortfalls and Surpluses
Plans Most Recent State Role Benefit Plan Actuarial Actuarial UAAL Funded Actuarial Type Structure Assets Accrued Ratio % Valuation Liability
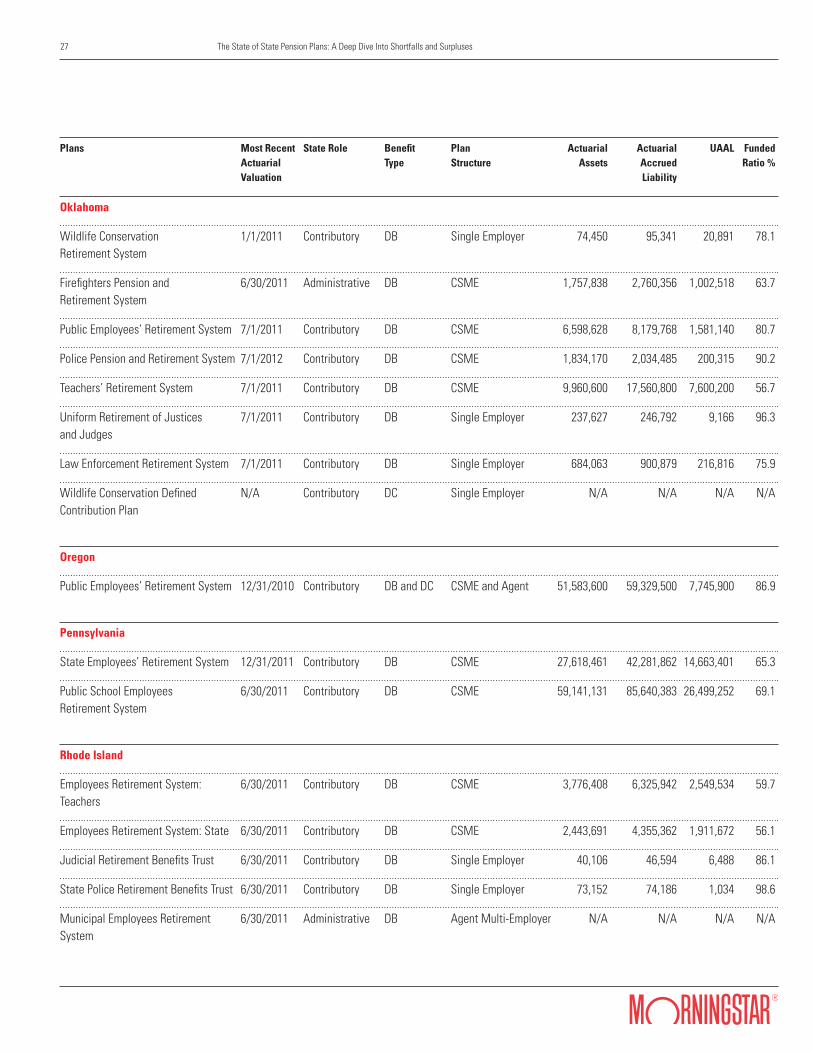
Oklahoma
Wildlife Conservation 1/1/2011 Contributory DB Single Employer 74,450 95,341 20,891 78.1 Retirement System
Firefighters Pension and 6/30/2011 Administrative DB CSME 1,757,838 2,760,356 1,002,518 63.7 Retirement System
Public Employees’ Retirement System 7/1/2011 Contributory DB CSME 6,598,628 8,179,768 1,581,140 80.7
Police Pension and Retirement System 7/1/2012 Contributory DB CSME 1,834,170 2,034,485 200,315 90.2
Teachers’ Retirement System 7/1/2011 Contributory DB CSME 9,960,600 17,560,800 7,600,200 56.7
Uniform Retirement of Justices 7/1/2011 Contributory DB Single Employer 237,627 246,792 9,166 96.3 and Judges
Law Enforcement Retirement System 7/1/2011 Contributory DB Single Employer 684,063 900,879 216,816 75.9
Wildlife Conservation Defined N/A Contributory DC Single Employer N/A N/A N/A N/A Contribution Plan
Oregon
Public Employees’ Retirement System 12/31/2010 Contributory DB and DC CSME and Agent 51,583,600 59,329,500 7,745,900 86.9
Pennsylvania
State Employees’ Retirement System 12/31/2011 Contributory DB CSME 27,618,461 42,281,862 14,663,401 65.3
Public School Employees 6/30/2011 Contributory DB CSME 59,141,131 85,640,383 26,499,252 69.1 Retirement System
Rhode Island
Employees Retirement System: 6/30/2011 Contributory DB CSME 3,776,408 6,325,942 2,549,534 59.7 Teachers
Employees Retirement System: State 6/30/2011 Contributory DB CSME 2,443,691 4,355,362 1,911,672 56.1
Judicial Retirement Benefits Trust 6/30/2011 Contributory DB Single Employer 40,106 46,594 6,488 86.1
State Police Retirement Benefits Trust 6/30/2011 Contributory DB Single Employer 73,152 74,186 1,034 98.6
Municipal Employees Retirement 6/30/2011 Administrative DB Agent Multi-Employer N/A N/A N/A N/A System
28 The State of State Pension Plans: A Deep Dive Into Shortfalls and Surpluses
Plans Most Recent State Role Benefit Plan Actuarial Actuarial UAAL Funded Actuarial Type Structure Assets Accrued Ratio % Valuation Liability
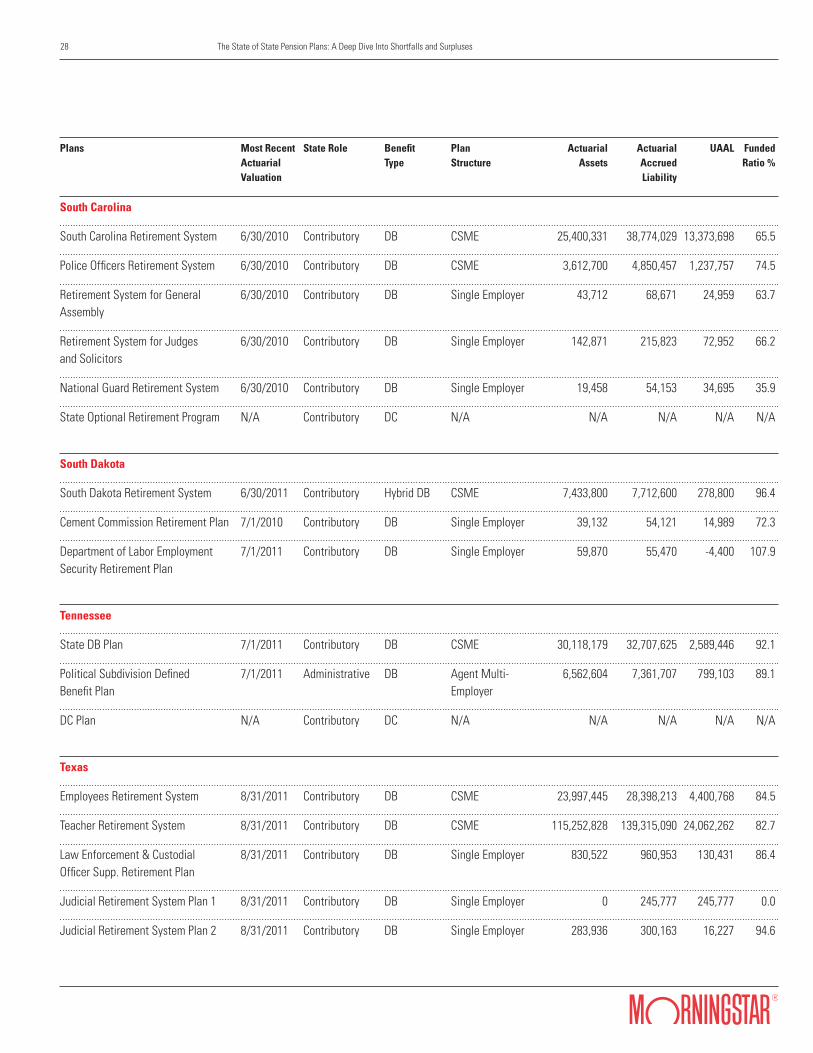
South Carolina
South Carolina Retirement System 6/30/2010 Contributory DB CSME 25,400,331 38,774,029 13,373,698 65.5
Police Officers Retirement System 6/30/2010 Contributory DB CSME 3,612,700 4,850,457 1,237,757 74.5
Retirement System for General 6/30/2010 Contributory DB Single Employer 43,712 68,671 24,959 63.7 Assembly
Retirement System for Judges 6/30/2010 Contributory DB Single Employer 142,871 215,823 72,952 66.2 and Solicitors
National Guard Retirement System 6/30/2010 Contributory DB Single Employer 19,458 54,153 34,695 35.9
State Optional Retirement Program N/A Contributory DC N/A N/A N/A N/A N/A
South Dakota
South Dakota Retirement System 6/30/2011 Contributory Hybrid DB CSME 7,433,800 7,712,600 278,800 96.4
Cement Commission Retirement Plan 7/1/2010 Contributory DB Single Employer 39,132 54,121 14,989 72.3
Department of Labor Employment 7/1/2011 Contributory DB Single Employer 59,870 55,470 -4,400 107.9 Security Retirement Plan
Tennessee
State DB Plan 7/1/2011 Contributory DB CSME 30,118,179 32,707,625 2,589,446 92.1
Political Subdivision Defined 7/1/2011 Administrative DB Agent Multi- 6,562,604 7,361,707 799,103 89.1 Benefit Plan Employer
DC Plan N/A Contributory DC N/A N/A N/A N/A N/A
Texas
Employees Retirement System 8/31/2011 Contributory DB CSME 23,997,445 28,398,213 4,400,768 84.5
Teacher Retirement System 8/31/2011 Contributory DB CSME 115,252,828 139,315,090 24,062,262 82.7
Law Enforcement & Custodial 8/31/2011 Contributory DB Single Employer 830,522 960,953 130,431 86.4 Officer Supp. Retirement Plan
Judicial Retirement System Plan 1 8/31/2011 Contributory DB Single Employer 0 245,777 245,777 0.0
Judicial Retirement System Plan 2 8/31/2011 Contributory DB Single Employer 283,936 300,163 16,227 94.6

29 The State of State Pension Plans: A Deep Dive Into Shortfalls and Surpluses
Plans Most Recent State Role Benefit Plan Actuarial Actuarial UAAL Funded Actuarial Type Structure Assets Accrued Ratio % Valuation Liability
Firefighters’ Pension Commissioner 8/30/2010 Contributory DB CSME 64,114 81,264 17,150 78.9
Optional Retirement Program N/A Contributory DC N/A N/A N/A N/A N/A
Utah
Public Employees Contributory 12/31/2011 Contributory DB CSME 1,080,139 1,278,272 198,133 84.5 Retirement System
Public Employees Noncontributory 12/31/2011 Contributory DB CSME 16,861,064 21,516,610 4,655,546 78.4 Retirement System
Firefighters Retirement System 12/31/2011 Contributory DB CSME 810,764 926,634 115,870 87.5
Public Safety Retirement System 12/31/2011 Contributory DB Mixed Agent & CSME 2,222,202 3,044,707 822,505 73.0
Judges Retirement System 12/31/2011 Contributory DB Single Employer 130,561 175,763 45,202 74.3
Governors and Legislative 12/31/2011 Contributory DB Single Employer 9,565 11,722 2,157 81.6 Retirement Plan
Tier 2 Retirement Plan Public 12/31/2011 Contributory DB CSME 2,833 2,806 -27 101.0 Employees Plan
Tier 2 Public Safety & Firefighters Plan 12/31/2011 Contributory DB CSME 90 90 0 100.0
401k Defined Contribution Plan N/A Contributory DC N/A N/A N/A N/A N/A
457 Defined Contribution Plan N/A Contributory DC N/A N/A N/A N/A N/A
Roth Plan N/A Administrative DC N/A N/A N/A N/A N/A
Traditional IRA Plan N/A Administrative DC N/A N/A N/A N/A N/A
Tier 2 Defined Contribution Plan N/A Contributory DC N/A N/A N/A N/A N/A
Vermont
State Retirement System 6/30/2011 Contributory DB Single Employer 1,348,763 1,695,301 346,538 79.6
State Teachers Retirement System 6/30/2011 Contributory DB CSME 1,486,698 2,331,806 845,108 63.8
Municipal Employees Retirement 7/1/2011 Administrative DB CSME 402,550 436,229 33,679 92.3 System
State Defined Contribution Plan N/A Contributory DC Single Employer N/A N/A N/A N/A
30 The State of State Pension Plans: A Deep Dive Into Shortfalls and Surpluses
Plans Most Recent State Role Benefit Plan Actuarial Actuarial UAAL Funded Actuarial Type Structure Assets Accrued Ratio % Valuation Liability
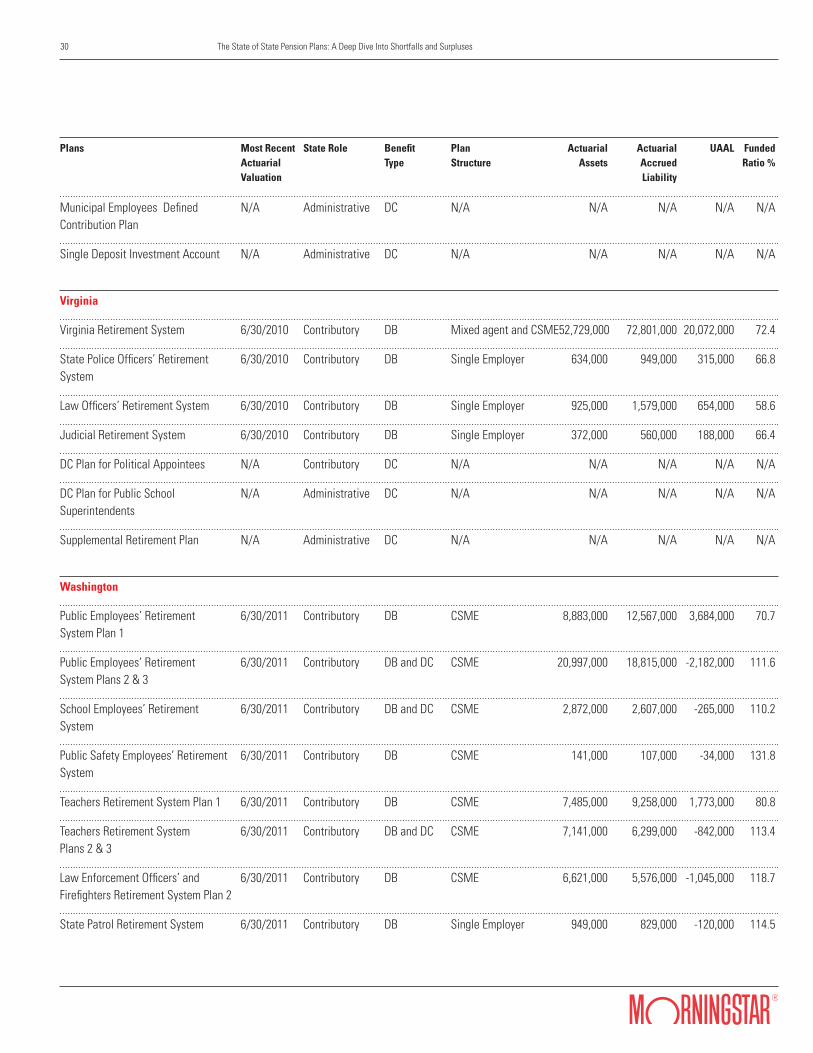
Municipal Employees Defined N/A Administrative DC N/A N/A N/A N/A N/A Contribution Plan
Single Deposit Investment Account N/A Administrative DC N/A N/A N/A N/A N/A
Virginia
Virginia Retirement System 6/30/2010 Contributory DB Mixed agent and CSME 52,729,000 72,801,000 20,072,000 72.4
State Police Officers’ Retirement 6/30/2010 Contributory DB Single Employer 634,000 949,000 315,000 66.8 System
Law Officers’ Retirement System 6/30/2010 Contributory DB Single Employer 925,000 1,579,000 654,000 58.6
Judicial Retirement System 6/30/2010 Contributory DB Single Employer 372,000 560,000 188,000 66.4
DC Plan for Political Appointees N/A Contributory DC N/A N/A N/A N/A N/A
DC Plan for Public School N/A Administrative DC N/A N/A N/A N/A N/A Superintendents
Supplemental Retirement Plan N/A Administrative DC N/A N/A N/A N/A N/A
Washington
Public Employees’ Retirement 6/30/2011 Contributory DB CSME 8,883,000 12,567,000 3,684,000 70.7 System Plan 1
Public Employees’ Retirement 6/30/2011 Contributory DB and DC CSME 20,997,000 18,815,000 -2,182,000 111.6 System Plans 2 & 3
School Employees’ Retirement 6/30/2011 Contributory DB and DC CSME 2,872,000 2,607,000 -265,000 110.2 System
Public Safety Employees’ Retirement 6/30/2011 Contributory DB CSME 141,000 107,000 -34,000 131.8 System
Teachers Retirement System Plan 1 6/30/2011 Contributory DB CSME 7,485,000 9,258,000 1,773,000 80.8
Teachers Retirement System 6/30/2011 Contributory DB and DC CSME 7,141,000 6,299,000 -842,000 113.4 Plans 2 & 3
Law Enforcement Officers’ and 6/30/2011 Contributory DB CSME 6,621,000 5,576,000 -1,045,000 118.7 Firefighters Retirement System Plan 2
State Patrol Retirement System 6/30/2011 Contributory DB Single Employer 949,000 829,000 -120,000 114.5
31 The State of State Pension Plans: A Deep Dive Into Shortfalls and Surpluses
Plans Most Recent State Role Benefit Plan Actuarial Actuarial UAAL Funded Actuarial Type Structure Assets Accrued Ratio % Valuation Liability
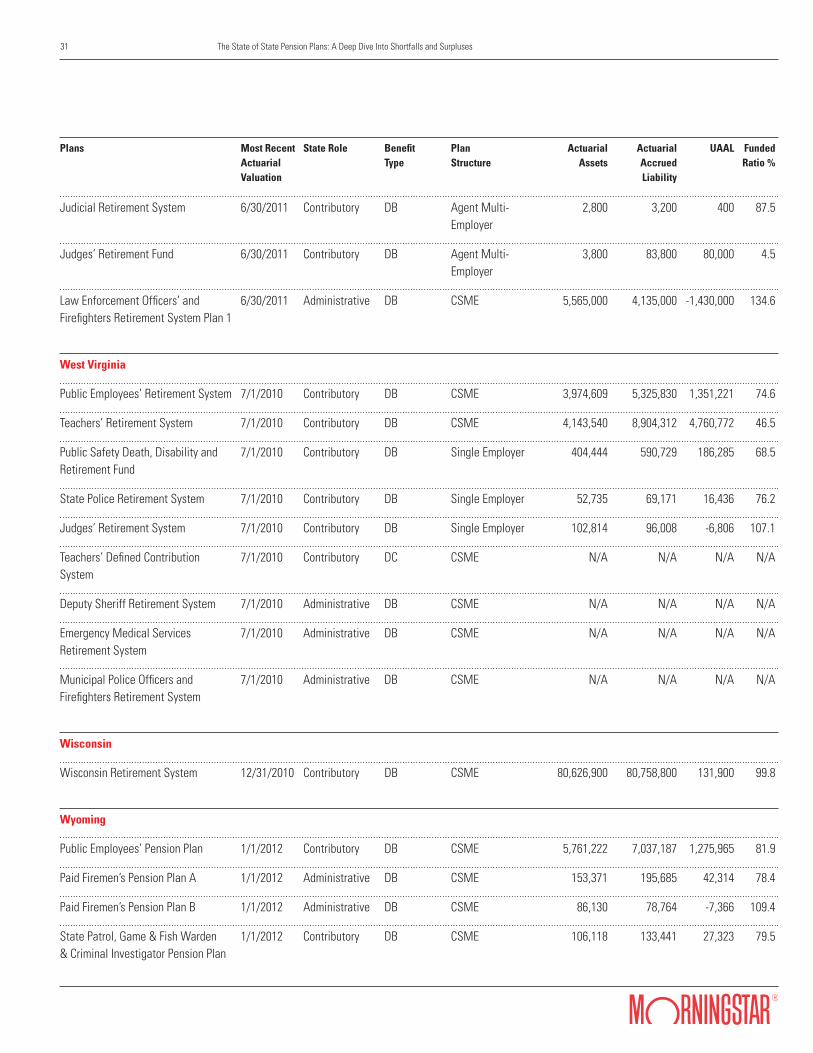
Judicial Retirement System 6/30/2011 Contributory DB Agent Multi- 2,800 3,200 400 87.5 Employer
Judges’ Retirement Fund 6/30/2011 Contributory DB Agent Multi- 3,800 83,800 80,000 4.5 Employer
Law Enforcement Officers’ and 6/30/2011 Administrative DB CSME 5,565,000 4,135,000 -1,430,000 134.6 Firefighters Retirement System Plan 1
West Virginia
Public Employees’ Retirement System 7/1/2010 Contributory DB CSME 3,974,609 5,325,830 1,351,221 74.6
Teachers’ Retirement System 7/1/2010 Contributory DB CSME 4,143,540 8,904,312 4,760,772 46.5
Public Safety Death, Disability and 7/1/2010 Contributory DB Single Employer 404,444 590,729 186,285 68.5 Retirement Fund
State Police Retirement System 7/1/2010 Contributory DB Single Employer 52,735 69,171 16,436 76.2
Judges’ Retirement System 7/1/2010 Contributory DB Single Employer 102,814 96,008 -6,806 107.1
Teachers’ Defined Contribution 7/1/2010 Contributory DC CSME N/A N/A N/A N/A System
Deputy Sheriff Retirement System 7/1/2010 Administrative DB CSME N/A N/A N/A N/A
Emergency Medical Services 7/1/2010 Administrative DB CSME N/A N/A N/A N/A Retirement System
Municipal Police Officers and 7/1/2010 Administrative DB CSME N/A N/A N/A N/A Firefighters Retirement System
Wisconsin
Wisconsin Retirement System 12/31/2010 Contributory DB CSME 80,626,900 80,758,800 131,900 99.8
Wyoming
Public Employees’ Pension Plan 1/1/2012 Contributory DB CSME 5,761,222 7,037,187 1,275,965 81.9
Paid Firemen’s Pension Plan A 1/1/2012 Administrative DB CSME 153,371 195,685 42,314 78.4
Paid Firemen’s Pension Plan B 1/1/2012 Administrative DB CSME 86,130 78,764 -7,366 109.4
State Patrol, Game & Fish Warden 1/1/2012 Contributory DB CSME 106,118 133,441 27,323 79.5 & Criminal Investigator Pension Plan
32 The State of State Pension Plans: A Deep Dive Into Shortfalls and Surpluses
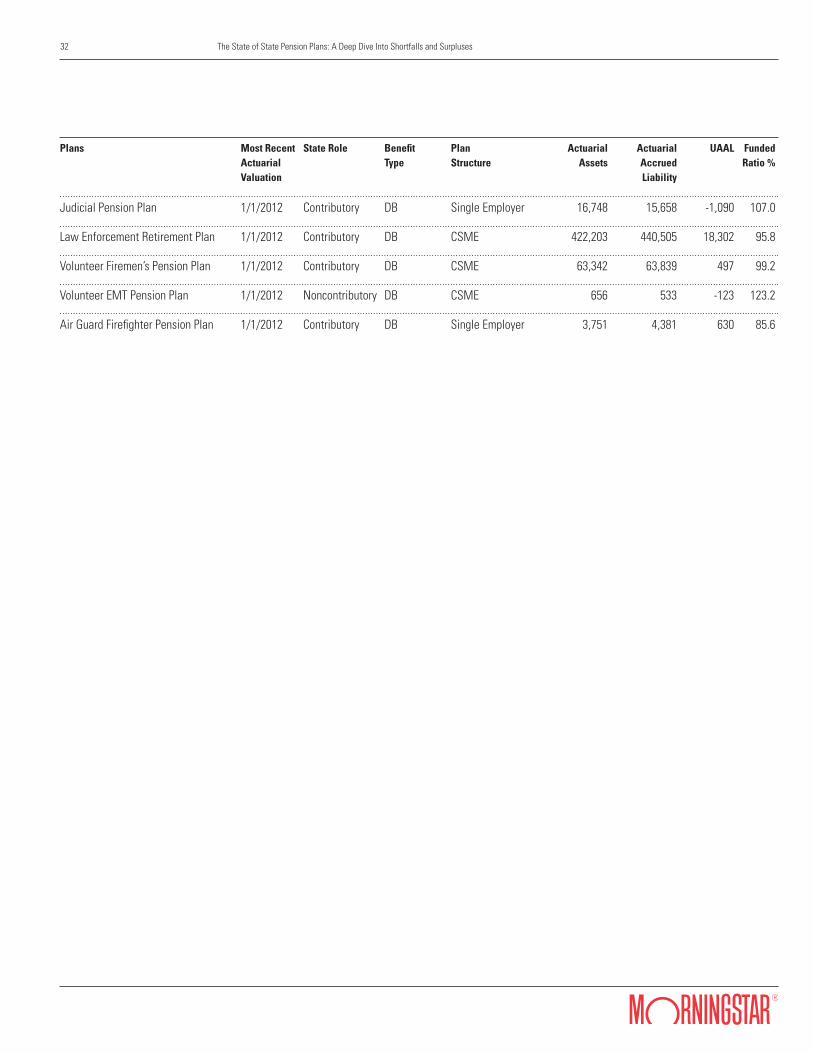
Plans Most Recent State Role Benefit Plan Actuarial Actuarial UAAL Funded Actuarial Type Structure Assets Accrued Ratio % Valuation Liability
Judicial Pension Plan 1/1/2012 Contributory DB Single Employer 16,748 15,658 -1,090 107.0
Law Enforcement Retirement Plan 1/1/2012 Contributory DB CSME 422,203 440,505 18,302 95.8
Volunteer Firemen’s Pension Plan 1/1/2012 Contributory DB CSME 63,342 63,839 497 99.2
Volunteer EMT Pension Plan 1/1/2012 Noncontributory DB CSME 656 533 -123 123.2
Air Guard Firefighter Pension Plan 1/1/2012 Contributory DB Single Employer 3,751 4,381 630 85.6