A Decomposition of Factors Influencing Horizontal and ...
22
A Decomposition of Factors Influencing Horizontal and Vertical FDI: A Separate Analysis Kazuhiko Yokota The International Centre for the Study of East Asian Development and Akinori Tomohara Department of Economics, University of Kitakyushu Working Paper Series Vol. 2007-15 May 2007 The views expressed in this publication are those of the author(s) and do not necessarily reflect those of the Institute. No part of this article may be used reproduced in any manner whatsoever without written permission except in the case of brief quotations embodied in articles and reviews. For information, please write to the Centre. The International Centre for the Study of East Asian Development, Kitakyushu
Transcript of A Decomposition of Factors Influencing Horizontal and ...
A Decomposition of Factors Influencing Horizontal and Vertical FDI: A Separate Analysis
Kazuhiko Yokota
The International Centre for the Study of East Asian Development and
Akinori Tomohara Department of Economics, University of Kitakyushu
Working Paper Series Vol. 2007-15 May 2007
The views expressed in this publication are those of the author(s) and do
not necessarily reflect those of the Institute.
No part of this article may be used reproduced in any manner
whatsoever without written permission except in the case of brief
quotations embodied in articles and reviews. For information, please
write to the Centre.
The International Centre for the Study of East Asian Development, Kitakyushu

1
A Decomposition of Factors Influencing Horizontal and Vertical FDI:
A Separate Analysis∗
Kazuhiko Yokota∗∗ Akinori Tomohara♦ The International Centre for Department of Economics the Study of East Asian Development University of Kitakyushu
Abstract While the literature has explored which factors determine the emergence of different multinational enterprise (MNE) structures (i.e., horizontal or vertical MNEs), little attention has been paid to differences within the same MNE type. This paper proposes an index to distinguish horizontal FDI from vertical FDI and tries to identify different FDI motivations within the same MNE type. The analysis indicates that industry type, FDI destinations, and the interaction of the two play an important role in determining MNE structures. The analysis provides potentially useful information to host country governments regarding industry policy to encourage FDI.
Keywords: Horizontal FDI; Multinational Enterprises; Vertical FDI JEL Classification: F1; F21; F23 ∗ We are grateful to Masayuki Hara, Nazrul Islam, Jim Markusen, Keith Maskus, Molly Sherlock,
Nobuo Teramachi and seminar participants at the ICSEAD and the Japan Society of International
Economics for their helpful comments and suggestions for the earlier draft. The second author
appreciates financial support from the Research Foundation of the City University of New York. All
remaining errors are ours. ∗∗ Corresponding Author. 11-4 Otemachi, Kokurakita, Kitakyushu, Fukuoka, 803-0814, Japan.
Phone: +81-93-583-6202, Fax: +81-93-583-6576, E-mail: [email protected]. ♦ 4-2-1, Kitagata, Kokuraminami-ku, Kitakyushu, 802-8577, E-mail: [email protected]

2
1. Introduction Questioning which factors characterize the structure of multinational enterprises (MNEs) has been one of trade economists’ concerns ever since Mundell (1957) related trade in goods with trade in factors and developed the trade model incorporating capital flows. Seminal works in the 1980s considered MNEs location choice by relating trade and foreign direct investment (FDI), providing a framework for explaining MNE’s different activities (Helpman, 1984; Markusen, 1984; see e.g., Markusen (2002) for the survey). The MNEs structure is related to FDI motives. Horizontal MNEs are concerned with market access while vertical MNEs focus on comparative advantage. A horizontal MNE has headquarters in its home country while assembling final products in both the home and a host country. A horizontal MNE can avoid trade costs (such as tariffs and transportation costs) by locating an affiliate in a host country. FDI to establish a horizontal MNE is a substitute for international trade. Alternatively, a vertical MNE splits its production process into more than two locations. Keeping headquarters in the home country, a vertical MNE assembles final goods only in a host country. Vertical MNEs locate their affiliates in host country’s offering cheap factor inputs. FDI to establish a vertical MNE complements international trade. Trade theory provides different FDI implications depending on the MNE’s structure. The horizontal MNE model shows that similarity in size and relative factor endowments between a home country and a host country are important factors determining FDI. The vertical MNE model emphasizes the importance of the two country’s relative factor endowments, since MNEs choose locations based on input costs. Different factor prices are the reason for establishing the vertical MNE.1 Recently, the knowledge capital model was developed to encompass both factor price and market access elements (Markusen et al., 1996; Markusen, 1997). Recent empirical and/or simulation models try to distinguish the horizontal MNE model from the vertical MNE model by examining the theoretical implications (Carr, Markusen, and Maskus, 2001; Markusen and Maskus, 2002; Blonigen, Davis, and Head, 2003;
1 The classic horizontal MNE model by Markusen (1984) is a one factor (labor) framework, where
firm-specific fixed costs and trade costs play important roles. Markusen and Venables (1998, 2000),
recognized as the standard horizontal MNE model, employ a general equilibrium approach with two
factors (skilled and unskilled labor force). The vertical MNE model originated by Helpman (1984) and
Helpman and Krugman (1985) uses a two-factor framework that introduces monopolistic competition
but does not include trade costs.

3
see Feenstra, 2004; Navaretti and Venables, 2004 for a survey).2 The consensus is that horizontal MNEs emerge when countries are of similar size and share similar relative factor endowments. Vertical MNEs emerge when countries differ in relative factor endowments. While the literature has focused on the different roles of horizontal and vertical MNEs, little attention has been paid to differences within the same MNE type. This paper examines whether MNEs within the same category may have different characteristics (or are motivated by different FDI reasons) depending on industry or FDI destination (e.g., either developed or less developed countries). The analysis requires classifying companies as being either horizontal or vertical MNEs. We propose that the sales-imports ratio of an affiliate operating in a foreign host country be used an index to distinguish between horizontal and verticals MNEs. After stratifying the sample using the index, we examine whether there are any structural differences within the same MNE type.
Our analysis uses data from U.S. multinational affiliates operating in foreign countries. We construct the data set using sources such as the Bureau of Economic Analysis, the International Labor Organization, IMF’s International Financial Statistics, Penn World Tables, and the World Bank.
The analysis indicates that, in addition to the commonly used explanatory variables in the literature (i.e., world income, differences in relative market sizes, and skilled labor abundance), industry type and FDI destinations (and the interaction of the two) distinguish MNE structures even within the same FDI type. The results show that both horizontal FDI and vertical FDI behave similarly regarding FDI destinations in food and chemical industries. In electric machinery industry, horizontal FDI is dominant in developed host countries, but the importance of vertical FDI increases in less developed host countries. Perhaps this arises because horizontal MNEs produce high quality electric machinery for the markets in developed countries, while vertical MNEs seek cost advantages in less developed countries to produce cheap electric machinery for either the host markets, the home market or another export market.
The remainder of the paper is organized as follows. Section 2 reviews the data used in the analysis. Section 3 describes a framework for studying different characteristics within the same MNE type. Results of the analysis are presented in Section 4. Section 5 concludes our paper.
2 Aizenman and Miron (2004) study how uncertainty affects FDI profitability (either horizontal or
vertical) and discuss the impacts on MNE structures. Their model implies that “increased uncertainty
should encourage horizontal FDI but discourage vertical FDI.”

4
2. Data Our sample contains companies operating in six different U.S. manufacturing industries whose affiliates are located in 44 different countries between 1983 and 1999.3 Using the BEA classification, the six industries are Food, Chemicals, Metal, Machinery, Electric Machinery, and Transportation.
We obtain sales and number of employees information on U.S. multinational companies from the Bureau of Economic Analysis (BEA), the Department of Commerce (http://www.bea.gov/bea/di/di1usdop.htm). The Penn World Tables provide GDP data (http://pwt.econ.upenn.edu/php_site/pwt_index.php). Labor data are obtained from the International Labor Organization (http://laborsta.ilo.org/). Total output, exports, and imports are calculated from the World Bank database, “Trade and Production, 1976-1999.” Trade data such as CIF and FOB are obtained from the NBER-United Nations Trade Data, 1962-2000 compiled by Feenstra et al. (2005) (www.nber.org/data). All values in the analysis are deflated using the GDP deflator to 1995 U.S. dollars. Deflators, together with interest rates, are obtained from the IMF’s International Financial Statistics database. Table 1 shows summary statistics for variables used for the analysis. Summary statistics are presented for the whole samples as well as for each of the two-sub-samples. 3. Model The analysis begins by stratifying our sample distinguishing horizontal FDI from vertical FDI. Following previous empirical works, we use the empirical model:
ijtjjijt
jtjtjt
ijtjtijt
DISTANCEDADJTCOST
DSPEAKLENDRATESKILLDIF
MKTDIFGDPSUMSALE
εβββ
βββ
βββ
+++
+++
+++=
876
543
210
(1)
SALE is real sales of a non-bank U.S. affiliate i operating in a host country j at time t.4 3 The countries include Argentina, Australia, Austria, Canada, Chile, China, Colombia, Costa Rica, Denmark, Ecuador, Egypt, Finland, France, Germany, Greece, Guatemala, Honduras, Hong Kong, India, Indonesia, Ireland, Italy, Japan, Korea, Malaysia, Mexico, Netherlands, New Zealand, Norway, Panama, Peru, Philippines, Portugal, Singapore, South Africa, Spain, Sweden, Taiwan, Thailand, Trinidad and Tobago, Turkey, United Kingdom, and Venezuela. Since data availability varies by country during the sample periods, our data are an unbalanced panel. 4 The notation i is equivalent to industry in the following analysis. We return to this point later.

5
Sales are affiliate i’s sales in a host country plus i’s exports to the rest of the world. GDPSUM is the sum of the U.S. real GDP and the host country’s real GDP. All variables are measured in natural logarithmic forms. |MKTDIF| captures the similarity of market sizes between the U.S. and the host country. The term takes an absolute value after calculating log of the host country's market size less the log of the U.S. market size. Market size is derived as total output minus exports plus imports at the industry level (i.e., market size in the industry where i is belonging). A smaller value indicates the two markets are similar. |SKILLDIF| is the difference in skilled labor abundance between the two countries. The term takes an absolute value after calculating log of skilled labor abundance in the host country minus log of skilled labor abundance in the U.S. Skilled labor abundance is defined as skilled labor as a proportion of the total labor force at the country level.5
The literature shows that horizontal FDI becomes more prevalent, as opposed to trade, as world income increases and countries converge in size and relative factor endowments (Markusen and Venables, 1998). Similarity across countries is important when local market access is the motivation for FDI. Vertical FDI occurs when relative factor endowments differ across countries. The model in Helpman (1984) shows that neither different country sizes nor world income are important factors in deciding vertical FDI. Vertical FDI is motivated by comparative advantage (e.g., cheap labor). For vertical FDI, dissimilarity across countries is key.
The theory predicts the following results from estimating Equation (1). If the sample is dominated by horizontal FDI, the coefficient of GDPSUM will be positive and the coefficient of |MKTDIF| will be negative. |SKILLDIF| is expected to be negative for horizontal FDI and positive for vertical FDI. Signs of estimated coefficients on these terms play a key role in distinguishing horizontal FDI from vertical FDI.
The next five variables control for costs related to FDI. LENDRATE is the lending interest rate in the host country. The effects on FDI (and, thus, affiliate sales) are ambiguous. High interest rates indicate high borrowing costs and deter FDI. But higher interest rates may also imply higher returns on investment. DSPEAK is a dummy variable with value one for non-English speaking host countries
5 We collect U.S. data from the BEA and other country data from the ILO. Technically speaking,
skilled labor is the sum of two ILO occupational categories (0/1: professional, technical, and kindred
workers and 2: administrative workers) divided by the total number of workers. BEA conducted
Benchmark surveys in 1989, 1994, and 1999. The analysis utilizes 1989 data for the periods between
1983 and 1991, 1994 data for between 1992 and 1995, and 1999 data for between 1996 and 2000.

6
and zero otherwise. Considering that communication is an important factor in conducting trade, the coefficient of DSPEAK is expected to be negative. TCOST is another proxy for trade costs (e.g., freight and insurance costs). We calculate the ratio of CIF value to FOB value about the industry-level transactions between the US and a host country and take the log of the ratio. The coefficient is expected to be positive for horizontal FDI, since horizontal FDI is a substitute for international trade. The expected sign on TCOST is not obvious in the vertical FDI case as vertical FDI is complement to international trade. The last two terms measure geographically imposed trade costs. DADJ is a dummy variable with value one if the host country is adjacent to the U.S. DISTANCE is a distance between the U.S. and the host country. The coefficient on DADJ is expected to be positive. FDI is likely to occur for U.S. neighbor host countries due to lower costs. This in turn will increase affiliate sales. For a similar reason, the coefficient on DISTANCE is expected to be negative.
The empirical model is based on theoretical relationships between trade, FDI, and MNEs. Unfortunately, firm-level data are not available to explore this theoretical relationship. Hence, the analysis applies the model to industry-level data. Seminal works also use country-level data but not firm-level data in order to study determinants of U.S. FDI (e.g., Carr, Markusen and Maskus, 2001; Blonigen, Davis, and Head, 2003). Our analysis is similar in spirit to Hanson, Mataloni, and Slaughter (2001) and Yeaple (2003), in that it includes the role of industrial characteristics for the analysis of U.S. outward FDI.
We develop an index in order to sort the sample into the two categories, i.e., horizontal FDI and vertical FDI. The analysis stratifies the sample based on ex post characteristics of FDI activities. Sales in a host country are most important for horizontal MNEs (Feenstra, 2004). Activities of horizontal MNEs substitute for international trade. The ratio of affiliate's domestic sales to total sales is high. On the other hand, activities of vertical MNEs compliment international trade. Vertical MNEs import intermediate goods from their parent companies in home countries. The share of affiliates’ input imports is large relative to total sales. Hereafter we use the term, horizontal (or vertical) FDI, to refer to observations which have horizontal (or vertical) MNE characteristics.
The index is constructed by using three factors. Let D, M, and S be an affiliate’s domestic sales in a host country, imports from its parent company in a home country, and total sales in a host country, respectively. As mentioned above, a larger D/S implies that horizontal MNEs dominate the sample while a larger M/S implies that vertical MNEs dominate the sample. Thus, combining the two indices, a larger sales-imports ratio, D/M, implies that horizontal MNEs dominate the sample

7
and a smaller D/M indicates that vertical MNEs dominate the sample. We want to identify the threshold level of D/M that distinguishes horizontal
FDI and vertical FDI. For this purpose, we order the data based on the level of D/M, and create two sub-samples using a threshold level of D/M. Then, we estimate Equation (1) for various sub-samples created by using different D/M threshold levels, and examine the sign conditions of estimated coefficients. For example, if one sub-sample contains primarily horizontal MNEs, the estimated coefficient of |SKILLDIF| would be negative. We expect companies in this group to be motivated by horizontal FDI. Similarly, if the other sub-sample contains mainly vertical MNEs, the estimated coefficient of |SKILLDIF| would be positive. We expect companies in this group to be motivated by vertical FDI. A D/M value that will split the sample into two sub-samples so as to satisfy the sign conditions of estimated coefficients distinguishes the horizontal FDI group from the vertical FDI group.
Upon stratifying the sample into two groups, we characterize each FDI type by examining FDI determinants. Specifically, FDI characteristics are studied in relation to affiliate sales strategies. The analysis decomposes SALE in Equation (1) to identify a U.S. affiliate’s sales in the host country, exports back to the U.S., and exports to other countries (i.e., an export platform strategy). This approach is motivated by the idea that the export sales back to a parent company in a home country are important for vertical MNEs (Feenstra, 2004). Correspondingly, we drop GDPSUM, the world income proxy, and include MKT, a host country’s market size, and USMKT, a U.S. market size, in the model.
,*)(
*)(*)(
*)(*)(*2
55
4433
221100
ijtjt
jtjt
jtjtijt
TCOSTV
LENDRATEVSKILLDIFV
USMKTVMKTVVSALE
ξγβ
γβγβ
γβγβγβ
++
++++
++++++=
(2)
where V=1 for vertical FDI and 0 otherwise. Lastly, we examine the effects of different FDI types on industry-level productivity in a host country by using the following model:
ijtijtijtjtijt eEMPLOYEESIZESKILLTFP ++++= 3210 δδδδ (3)
TFP is the total factor productivity of industry i in a host country j (where a U.S. affiliate is operating) at time t. TFP is calculated as
ijtijtijtijtijtijt LsKsGDPTFP )1( −−−= ,

8
where ijtGDP is GDP, ijts is the capital expenditure share, ijtK is capital stock,
and ijtL is the size of the labor force. SKILL is the share of skilled labor in the
labor force. SIZE is per-firm sales, calculated as sales divided by the number of all local and multinational companies. EMPLOYEE is the number of employees working for MNEs.6 4. Results of the Analysis Column (1) in Table 2 shows the results of Equation (1) estimated by using the entire sample. The results indicate that horizontal FDI dominates U.S. FDI activities. The coefficient on GDPSUM is positive, the coefficient on |MKTDIF| is negative, and the one on |SKILLDIF| is negative. Column (2)-(8) in Table 2 shows the results when the sample is stratified into two sub-samples using various sales-imports ratios, D/M. We order samples in a descending manner based on D/M values and then stratify the sample into a group with large D/M values and a group with small D/M values. For example, Top 20% includes the sample with top 20% (i.e., large) D/M values and Bottom 80% contains the rest of the sample. We tried to identify a threshold value that sorts the samples such that the top part of the sample (a larger D/M) is motivated by horizontal FDI while the bottom part of the sample (a smaller D/M) is motivated by vertical FDI.
In order to identify such a value, we need to examine the signs of the estimated coefficients. If the signs of estimated coefficients of GDPSUM and/or SKILLDIF are different between Top and Bottom groups (and the signs satisfy the conditions predicted by the trade theory), then the threshold level of D/M had been identified. Column (2)-(8) in Table 2 shows that the coefficients of GDPSUM remains positive for various D/M values in the Top% samples at statistically significant levels. The results indicate the samples are dominated by horizontal FDI. In the Bottom% samples, the coefficients are positive from Column (2) to (5) and turn negative after (6). The estimates in Columns (6)-(8) are not statistically significant. The results indicate that the nature of sample changes after (6) and Bottom% results after (6) seem to possess vertical FDI characteristics. The coefficients of |SKILLDIF| show a similar trend. The coefficients are negative at statistically significant levels in the Top% samples. Again, this indicates the samples are dominated by horizontal FDI. In the Bottom% samples, the coefficients are 6 The number of skilled labor employed by MNEs (that may be an alternative) is not available.

9
estimated to be negative initially, but change to positive after Column (7). The magnitude of the estimates becomes larger and statistically significant from Column (7) to (8). Judging from these results, Top 70% D/M value is a threshold level able to distinguish horizontal FDI from vertical FDI among U.S. manufacturing industries. The estimates of other variables confirm that the threshold level is reasonable. For example, the estimates of trade costs (TCOST) are larger for the Top% samples compared to the Bottom% samples in Column (7). The results are consistent with the theory that horizontal FDI is a substitute for international trade. An increase in trade costs enhances horizontal FDI (and affiliate’s sales). Since vertical FDI is complement to international trade, an increase in trade costs is expected to deteriorate vertical FDI. Thus, the samples with horizontal FDI would be more sensitive to a change in trade costs as compared to vertical FDI.
We further examine the relevance of using the Top 70% D/M as a threshold level. Summary statistics in Table 1 show that the sum of two countries’ GDPs (GDPSUM) and trade costs (TCOST) are larger in the horizontal FDI samples as opposed to the vertical FDI samples.7 Market size difference (MKTDIF) is smaller for horizontal FDI than for vertical FDI. All our observations are consistent with the theoretical predictions. World income induces horizontal FDI as opposed to vertical FDI. Horizontal FDI is also more sensitive to trade costs than vertical FDI. Finally, similarity in markets is important for horizontal FDI.
We further examine, using ANOVA, whether mean for each variable in Table 1 is different between horizontal FDI and vertical FDI groups at statistically significant levels. Table 3 shows the results for whole sample and for sub-samples stratified by industry. Values in the table are t-statistics. The results show that the majority of mean variables are different between the two FDI types, and that the two groups are fundamentally different. We conclude that it is relevant to use Top 70% D/M value as a threshold level to distinguish horizontal FDI from vertical FDI. Next, we characterize FDI in relation to U.S. affiliate sales strategies. Characterizations involve identifying whether companies are targeting a host market, aiming to export their goods back to the U.S., or to export to other countries. The relative importance of horizontal FDI compared to vertical FDI is well-known in the literature (e.g., Brainard, 1993). Our results also confirm the consensus. However, Hanson et al. (2001) point out the diverse FDI patterns in the 1990s. The early literature does not include the inward FDI boom to developing countries in the 1990s. Thus, we further decompose the SALE term in Equation (1) and examine FDI
7 Sales are larger for the horizontal FDI than for vertical FDI. This might imply that, on average,
horizontal FDI is more common among larger companies.

10
characteristics by affiliate sales strategies. The analysis reveals that different factors play a role, depending on sales destinations, not only between horizontal and vertical FDI but also even within the same FDI type (i.e., within horizontal or vertical FDI).
Table 4 shows the results from estimating Equation (2). Dependent variables are U.S. affiliate’s sales in the host country (Column (1)), exports back to the U.S. (Column (2)), and exports to other countries (Column (3)). The first five rows are estimates of βs and the next five rows are estimates of γs for each variable. All variables are in logarithmic form. Thus, estimates can be interpreted as the elasticity of each independent variable. For example, Column (1) shows that horizontal FDI has a higher elasticity of host market size (MKT) to local sales (0.562) than the one of vertical FDI (0.393=0.562-0.169). This is consistent with the belief that horizontal FDI is motivated by a desire to sell goods in host markets. The coefficient of the difference in skilled labor abundance between countries (|SKILLDIF|) is estimated to be negative (-0.619) for horizontal FDI and to be positive (0.162=-0.619+0.781) for vertical FDI. As the theory predicts, similarity in relative factor endowments promotes horizontal FDI (and, thus, local sales). In fact, these results are valid when U.S. affiliates sell goods either in a host country or export back to the U.S.
In Column (2), the coefficient on |SKILLDIF| is estimated to be –1.62 for horizontal FDI and 1.91 for vertical FDI. When U.S. affiliates in host countries export goods back to the U.S., vertical FDI is sensitive to relative factor endowment differences between the U.S. and the host country, but horizontal FDI is influenced by factor endowment similarities. Similarity in relative factor endowments spurs affiliate exports and thus horizontal FDI while deterring vertical FDI. Host countries with similar relative factor endowments are not attractive to MNEs with vertical FDI, since they are motivated by comparative advantage. One final note is that the magnitudes of the estimates are different depending U.S. affiliate sales destinations: -0.619 and 0.162 in Column (1) and -1.62 and 1.91 in Column (2). Both horizontal and vertical FDI are very sensitive to the nature of relative factor endowments between the U.S. and a host country, if U.S. MNEs export back their goods to the U.S. The theory indicates that sales in a host market are important for horizontal FDI and exporting back to a home country is important for vertical FDI. In the reality, it is not easy to distinguish the relationship between horizontal and vertical FDI. Horizontal MNEs also export goods back to their home country. When horizontal MNEs export goods back to a home country, similar factor endowments are very important compared to the case of sales in a host country in order to satisfy the quality standard in the U.S. market. Similarly, when vertical MNEs export goods back to their home country, price factors seem to be very

11
important compared to sales in the host country. Relatively cheap goods are required to compete with other goods in the U.S. market.
The coefficient of LENDRATE is estimated to be negative (-1.282) for vertical FDI. The term is not an important factor nor is it statistically significant for horizontal FDI, as is evidenced in both Column (1) and (2). If this term captures financing costs in a host country, affiliates with horizontal FDI characteristics can finance from various sources. For vertical FDI, LENDRATE plays a role only in Column (2) but not in Column (1). U.S. affiliates that export their products back to the U.S. may finance via host country financial markets. U.S. affiliates that sell their goods at host countries could have other financing sources. The observation about a firm’s business scale (i.e., horizontal MNEs has larger sales than vertical MNEs as in footnote 7) seems to support this conjecture.
Column (3) shows that the results of export platform strategies are very similar to the results for exports back to the U.S., in Column (2). The difference appears in TCOST. In Column (3) the coefficient is estimated to positive (1.479) for horizontal FDI and negative (-0.197) for vertical FDI. Column (2) indicates that the term is not important for both horizontal FDI and vertical FDI. When U.S. affiliates export their goods back to the U.S., there may be concern regarding the quality of the product rather than just a pure price consideration. The price of goods could be more important if U.S. affiliates export their goods to other countries.
Columns (1)-(3) show that the coefficient on MKT is estimated to be positive for all sales destinations (for horizontal FDI, 0.562 in Column (1), 0.578 in Column (2) and 0.26 in Column (3). For vertical FDI, the estimate is 0.393=0.562-0.169 in Column (1), 0.002=0.578-0.562 in Column (2) and 0.26 in Column (3)). Large market sizes are important to attract FDI regardless U.S. affiliate sales destinations. The term could operate as a proxy for attractive FDI conditions in addition to sales potential such as labor quality. USMKT is an important factor only if U.S. affiliates export their goods back to the U.S. The result applies to both horizontal and vertical FDI. Additionally, horizontal FDI and vertical FDI seem to differ fundamentally if affiliates export good back to the U.S. The coefficient on the constant is negative (-14.25) for horizontal FDI but positive (7.6=-14.25+21.859) for vertical FDI. The results are consistent with the notion that exporting goods back to a parent company is important for vertical MNEs.
We further investigate the structure of MNEs by industry and by a host country's development level (Table 5). As the first row indicates, there are 776 observations where host countries are developed countries (DC). Among the 776 observations, 542 observations are classified as horizontal FDI and 234 observations are classified as vertical FDI. Consequently, 70% of this sample is comprised of

12
horizontal FDI and 30% of vertical FDI. When host countries are less developed countries (LDC), 63% of investment is horizontal FDI and 36% is vertical FDI. Vertical FDI is not necessarily a phenomenon between developed and less developed countries. Similarly, horizontal FDI occurs even between countries with dissimilar relative factor endowments. The samples are further stratified by industries. For example, in the food industry, there are 142 observations whose host countries are developed countries and there are 47 observations whose host countries are less developed countries.
Overall, horizontal FDI dominates U.S. manufacturing MNEs regardless FDI destinations. Specifically, horizontal FDI dominates in machinery and transportation industries. However, vertical FDI has a relatively higher share in food and chemical industries while also dominating electric equipment in LDCs. There are no clear differences in FDI destinations between horizontal FDI and vertical FDI in food and chemical industries. In the food industry 59.2% of the sample is horizontal FDI if FDI destinations are developed countries and 48.9% of the sample is horizontal FDI if FDI destinations are less developed countries. In the chemical industry about 57% of the sample is horizontal FDI when FDI destinations are either less developed or developed countries. In the electric machinery industry, horizontal FDI is dominant in developed host countries (87.8%), but the relative importance of vertical FDI increases in less developed host countries (44%). Horizontal MNEs could produce high quality products for the markets in developed countries, while vertical MNEs seeking cost advantages in less developed countries produce cheap products for either the host markets or the home market.
Table 6 shows the results of estimating Equation (3). Skill abundance improves the industry-level productivity of a host country under both horizontal and vertical FDI. The magnitude is larger for vertical FDI than horizontal FDI. A possible explanation is that vertical FDI is motivated for comparative advantage. If the quality of cheap factor inputs is better, then productivity would be higher. Horizontal and vertical FDI have different impacts in terms of SIZE. As output per firm increases, productivity improves for horizontal FDI but deteriorates for vertical FDI. The result makes sense since this term captures the effects of scale economies. We could also relate the results to our observation in footnote 7: horizontal FDI tends to be larger in scales as compared to vertical FDI. The number of workers employed by MNEs improves the level of productivity. While we need further investigation, the result might indicate positive externality effects via both horizontal and vertical FDI.
13
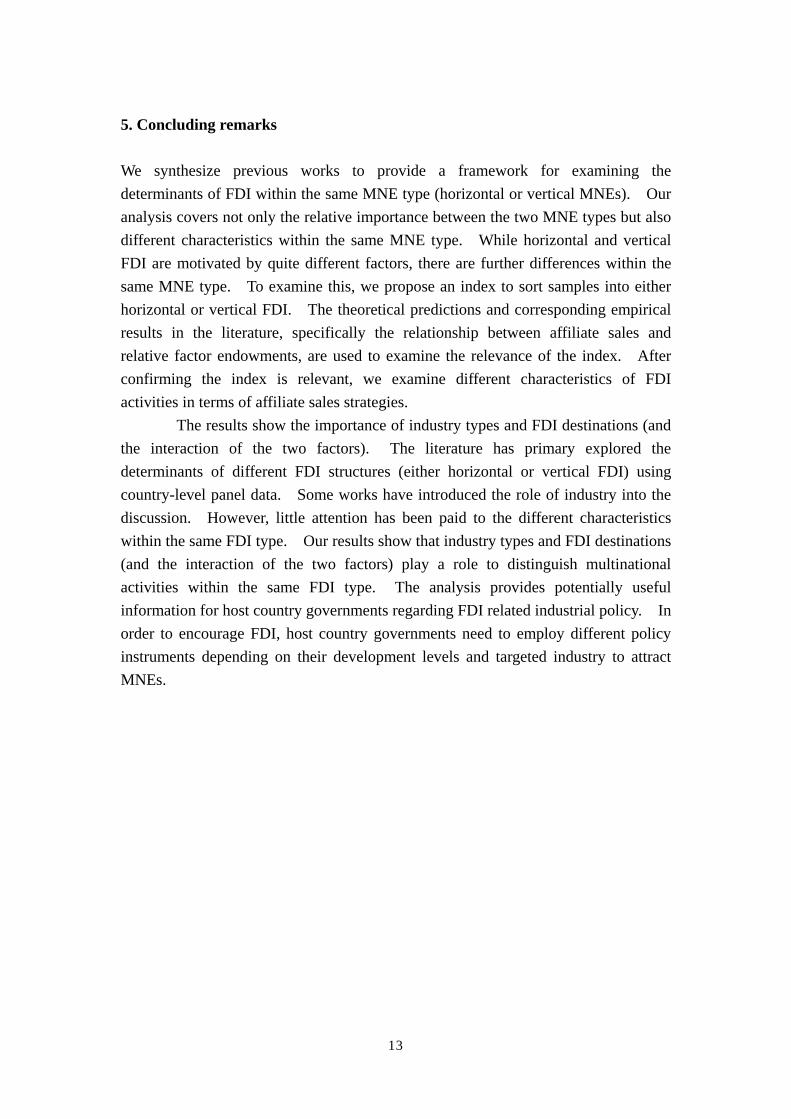
5. Concluding remarks We synthesize previous works to provide a framework for examining the determinants of FDI within the same MNE type (horizontal or vertical MNEs). Our analysis covers not only the relative importance between the two MNE types but also different characteristics within the same MNE type. While horizontal and vertical FDI are motivated by quite different factors, there are further differences within the same MNE type. To examine this, we propose an index to sort samples into either horizontal or vertical FDI. The theoretical predictions and corresponding empirical results in the literature, specifically the relationship between affiliate sales and relative factor endowments, are used to examine the relevance of the index. After confirming the index is relevant, we examine different characteristics of FDI activities in terms of affiliate sales strategies.
The results show the importance of industry types and FDI destinations (and the interaction of the two factors). The literature has primary explored the determinants of different FDI structures (either horizontal or vertical FDI) using country-level panel data. Some works have introduced the role of industry into the discussion. However, little attention has been paid to the different characteristics within the same FDI type. Our results show that industry types and FDI destinations (and the interaction of the two factors) play a role to distinguish multinational activities within the same FDI type. The analysis provides potentially useful information for host country governments regarding FDI related industrial policy. In order to encourage FDI, host country governments need to employ different policy instruments depending on their development levels and targeted industry to attract MNEs.

14
References
Aizenman, J. and N. Marion (2004), ‘The Merits of Horizontal versus Vertical FDI in the Presence of Uncertainty,’ Journal of International Economics, 62, 125-48.
Blonigen, B. A., R. B. Davies and K. Head (2003), ‘Estimating the Knowledge-Capital Model of the Multinational Enterprise: Comment’, American Economic Review, 93, 980-94.
Brainard, S. L. (1993), ‘An Empirical Assessment of the Factor Proportions Theory,’ NBER Working Paper No. 4269 (Cambridge, MA: National Bureau of Economic Research).
Carr, D., J. R. Markusen, and K. Maskus (2001), ‘Estimating the Knowledge-Capital Model of the Multinational Enterprise,’ American Economic Review, 91, 691-708.
Feenstra, R. C. (2004), Advanced International Trade (Princeton, NJ: Princeton University Press).
Feenstra, R. C., R. E. Lipsey, H. Deng, A. C. Ma and H. Mo (2005), ‘World Trade Flows: 1962-2000’, NBER Working Paper No. 11040 (Cambridge, MA: National Bureau of Economic Research).
Hanson, G., R. Mataloni and M. Slaughter (2001), ‘Expansion Strategies of U.S. Multinational Firms,’ NBER Working Paper No. 8433 (Cambridge, MA: National Bureau of Economic Research).
Helpman, E. (1984), ‘A Simple Theory of Trade with Multinational Corporations,’ Journal of Political Economy, 92, 451-71.
Helpman, E. and P. Krugman (1985), Market Structure and Foreign Trade (Cambridge, MA: MIT Press).
Markusen, J. R. (1984), ‘Multinationals, Multi-plant Economies, and the Gains from Trade,’ Journal of International Economics, 16, 205-26.
Markusen, J.R. (1997), ‘Trade versus Investment Liberalization’, NBER Working Paper No. 6321 (Cambridge, MA: National Bureau of Economic Research).
Markusen, J. R. (2002), Multinational Firms and the Theory of International Trade (Cambridge, MA: MIT Press).
Markusen, J.R. & Maskus, K.E. (2002), ‘Discriminating among Alternative Theories of the Multinational Enterprise. Review of International Economics, 10, 4, 694-707.
Markusen, J.R., A. J. Venables, D. Eby-Konan and K. H. Zhang (1996), ‘A Unified Treatment of Horizontal Direct Investment, Vertical Direct Investment, and the Pattern of Trade in Goods and Services’, NBER Working Paper No. 5969 (Cambridge, MA: National Bureau of Economic Research).
Markusen, J. R. and A. J. Venables (1998), ‘Multinational Firms and the New Trade

15
Theory,’ Journal of International Economics, 46, 183-204 Markusen, J. R. and A. J. Venables (2000), ‘The Theory of Endowment, Intra-industry
and Multinational Trade’, Journal of International Economics, 52, 209-34 Mundell, R. A. (1957), ‘International Trade and Factor Mobility’, American
Economic Review, 47, 321-35. Navaretti B.G.. and A.J. Venables ( 2004), Multinational Firms in the World Economy
(Princeton, NJ: Princeton University Press). Yeaple, S. (2003), ‘The Role of Skill Endowments in the Structure of U.S. Outward
Foreign Direct Investment’, Review of Economics and Statistics, 85, 3, 726-34.

16
Table 1: Summary Statistics
Total Sample Mean Std. Dev. Min Max Obs.HOR.INDEX 7.072 2.223 0.000 13.339 1108SALE 6.613 1.771 1.674 11.027 1108GDPSUM 41.830 1.245 38.615 44.736 1108|MKTDIF| 3.637 1.432 0.021 8.633 1108|SKILDIF| 0.635 0.420 0.001 1.844 1108LENDRATE 2.520 0.628 0.770 4.475 1108DSPEAK 0.605 0.489 0 1 1108TCOST 0.081 0.377 -4.576 0.583 1108DADJ 0.127 0.333 0.000 1 1108DIATANCE 8.407 0.609 6.981 9.154 1108
Horizontal Mean Std. Dev. Min Max Obs.HOR.INDEX 8.230 1.323 6.159 13.339 776SALE 7.210 1.495 3.618 11.027 776GDPSUM 42.291 1.054 38.800 44.736 776|MKTDIF| 3.230 1.329 0.021 8.633 776|SKILDIF| 0.637 0.438 0.001 1.844 776LENDRATE 2.522 0.650 0.770 4.475 776DSPEAK 0.634 0.482 0 1 776TCOST 0.089 0.333 -2.641 0.510 776DADJ 0.179 0.384 0 1 776DIATANCE 8.356 0.645 6.981 9.154 776
Vertical Mean Std. Dev. Min Max Obs.HOR.INDEX 4.364 1.390 0.000 6.158 332SALE 5.216 1.569 1.674 8.868 332GDPSUM 40.752 0.961 38.615 43.746 332|MKTDIF| 4.588 1.194 0.755 7.661 332|SKILDIF| 0.630 0.377 0.015 1.803 332LENDRATE 2.516 0.575 1.666 4.097 332DSPEAK 0.536 0.499 0 1 332TCOST 0.060 0.463 -4.576 0.583 332DADJ 0.006 0.077 0 1 332DIATANCE 8.524 0.498 6.981 9.148 332
All variables are defined in Section 3. All variables except D/M, LENDRATE, DSPEAK,
and DADJ are measured as natural logarithms.

17
Table 2: Horizontal FDI or Vertical FDI?
(1)
Top 20% Bot 80% Top 30% Bot 70% Top 40% Bot 60% Top 50% Bot 50% Top 60% Bot 40% Top 70% Bot 30% Top 80% Bot 20%
GDPSUM (+) 0.427 0.822 0.312 0.449 0.234 0.329 0.099 0.348 0.055 0.334 -0.042 0.351 -0.139 0.360 -0.111(8.18)** (9.48)** (4.90)** (5.99)** (3.39)** (4.94)** (1.25) (5.42)** (0.62) (5.36)** (0.44) (5.95)** (1.24) (6.72)** (0.70)
|MKTDIF| ( - ) -0.349 -0.100 -0.381 -0.183 -0.423 -0.184 -0.52 -0.194 -0.532 -0.209 -0.497 -0.239 -0.522 -0.267 -0.497(7.77)** (2.26)* (7.09)** (3.94)** (7.29)** (4.38)** (7.74)** (4.45)** (7.28)** (4.65)** (6.26)** (5.38)** (5.77)** (6.14)** (4.31)**
|SKILLDIF| ( - ,+) -0.280 -0.475 -0.313 -0.622 -0.301 -0.728 -0.189 -0.612 -0.058 -0.562 0.217 -0.467 0.529 -0.457 0.533(2.81)** (3.58)** (2.71)** (5.01)** (2.44)* (6.45)** (1.39) (5.68)** (0.39) (5.48)** (1.25) (4.65)** (2.59)* (4.67)** (2.12)*
LENDRATE ( - ) -0.194 -0.009 -0.205 -0.114 -0.244 -0.178 -0.278 -0.162 -0.356 -0.195 -0.501 -0.207 -0.557 -0.188 -0.493(2.68)** (0.10) (2.34)* (1.49) (2.51)* (2.43)* (2.56)* (2.21)* (2.88)** (2.68)** (3.61)** (2.85)** (3.35)** (2.67)** (2.23)*
DSPEAK ( - ) -0.782 -0.637 -0.746 -0.220 -0.762 -0.071 -0.812 -0.221 -0.876 -0.378 -0.98 -0.522 -1.153 -0.477 -1.536(8.89)** (4.86)** (7.46)** (1.94) (7.04)** (0.67) (6.98)** (2.23)* (6.85)** (3.89)** (7.14)** (5.54)** (7.49)** (5.42)** (6.84)**
TCOST (+) 0.586 0.419 0.612 0.441 0.552 0.584 0.507 0.610 0.481 0.677 0.416 0.734 0.319 0.770 0.217(6.12)** (3.89)** (5.54)** (3.57)** (4.89)** (4.67)** (4.30)** (5.13)** (3.84)** (5.80)** (3.15)** (6.60)** (2.14)* (6.98)** (1.31)
DADJ (+) 0.776 -0.437 0.982 0.612 1.181 0.766 0.911 0.862 1.070 0.868 1.283 0.933 1.234 1.246 0.614(3.64)** (1.54) (3.44)** (2.63)** (3.42)** (3.41)** (2.39)* (3.82)** (2.52)* (3.86)** (2.68)** (4.20)** (1.31) (6.00)** (0.46)
DISTANCE ( - ) -0.406 -0.854 -0.375 -0.191 -0.397 -0.211 -0.457 -0.192 -0.531 -0.234 -0.618 -0.199 -0.668 -0.051 -0.824(3.49)** (4.79)** (2.87)** (1.34) (2.83)** (1.57) (3.01)** (1.44) (3.22)** (1.77) (3.44)** (1.54) (3.19)** (0.43) (3.02)**
Obs 1108 222 886 332 776 443 665 554 554 665 443 776 332 886 222Adj R-sqd 0.58 0.84 0.44 0.76 0.39 0.7 0.39 0.66 0.41 0.6 0.43 0.59 0.43 0.59 0.47F-value 119.6 92.47 53.88 81.92 38.48 81.58 34.18 83.12 30.12 77.45 26.70 87.18 20.34 97.78 16.15
(6) (7) (8)(2) (3) (4) (5)
Note: Absolute values of t-statistics are in parentheses. * statistically significant at the 5% level, and ** at the 1% level. The analysis controls industry fixed
effects.

18
Table 3: Differences in Mean
Total Food Chemicals Metal Machinery
D/M 32.61** 11.59** 16.42** 24.72** 13.75** 16.06** 17.33**SALE 13.18** 8.41** 5.22** 9.26** 8.05** 4.25** 4.28**GDPSUM 22.22** 11.16** 13.86** 10.94** 9.22** 7.68** 11.15**|MKTDIF| -12.42** -6.52** -8.01** -4.27** -6.29** -4.46** -3.35**|SKILDIF| 0.60 4.35** 3.70** 1.10 -6.95** -10.62** 5.34**LENDRATE 0.25 1.39 1.73 0.48 -3.72** -7.81** 2.99**DSPEAK 6.27** 2.84** 2.20 9.73** 2.25* -3.81** 2.49**TCOST 3.11** 0.65 -1.45 6.97** 4.09** 7.31** -7.04**DADJ 25.11** 9.53** 9.95** 11.87** 13.43** 9.41** 6.72**DIATANCE -6.97** -3.63** 1.89 -3.57** -5.51** -2.46** -3.99**
ElectricMachinery
TransportEquipment
* Statistically significant at the 5% level; ** at the 1% level. Note: Values in the table are t-statistics. They are calculated as
21
2121221 nn
nnu
xxt nn +
−=−+ , where
221
222
211
−++
=nn
SnSnu , 1n : the number of observation in horizontal,
2n : the number of observations in vertical, 1S : standard deviation in horizontal, 2S : standard deviation in vertical,
1x mean in horizontal, 2x : mean in vertical, for each variable in Table 1.

19
Table 4: FDI Determinants by Affiliate Sales Strategies
(1) (2) (3)Local Sales Exports to US Export to
Other Countries
MKT 0.562 0.578 0.26(15.92)** (6.02)** (2.31)*
USMKT 0.052 0.488 0.385(0.82) (2.77)** (1.91)
|SKILLDIF| -0.619 -1.623 -1.03(6.34)** (6.22)** (3.45)**
LENDRATE 0.093 0.112 -0.331(1.22) (0.52) (1.34)
TCOST 0.01 -0.537 1.479(0.08) (1.50) (3.43)**
V_MKT -0.169 -0.562 -0.151(2.36)* (2.79)** (0.65)
V_USMKT 0.19 -0.635 0.269(1.22) (1.55) (0.58)
V_SKILLDIF 0.781 3.534 0.982(3.97)** (6.39)** (1.55)
V_LENDRATE 0.116 -1.282 -2.628(0.77) (2.79)** (4.79)**
V_TCOST -0.006 -0.141 -1.676(0.03) (0.20) (2.01)*
V_Constant -4.118 21.859 2.549(1.39) (2.76)** (0.28)
Constant -3.182 -14.25 -5.209(2.67)** (4.18)** (1.32)
Obs 1115 707 684Adj R-sq 0.66 0.17 0.13F-value 195.44 14.16 10.44
Absolute values of t-statistics are in parentheses.
* Statistically significant at the 5% level; ** at the 1% level.

20
Table 5: MNE Structure by Industry and FDI Destinations
TOTAL HORIZONTAL VERTICALTotal DC 776 542 234
69.8% 30.2%LDC 332 211 121
63.6% 36.4%Food DC 142 84 58
59.2% 40.8%LDC 47 23 24
48.9% 51.1%Chemicals DC 253 145 108
57.3% 42.7%LDC 62 35 27
56.5% 43.5%Metal DC 107 69 38
64.5% 35.5%LDC 71 48 23
67.6% 32.4%Machinery DC 86 80 6
93.0% 7.0%LDC 60 46 14
76.7% 23.3%DC 123 108 15
87.8% 12.2%LDC 75 42 33
56.0% 44.0%DC 65 56 9
86.2% 13.8%LDC 17 17 0
100.0% 0.0%
Electric Machinery
Transportatio Equipments
Note: Developed Countries (DC): High-income countries according to the World Bank classification.
Less Developed Countries (LDC): Low-income, lower-middle income, and upper-middle income
countries according to the World Bank classification.

21
Table 6: The Effects of FDI on Productivity in a Host Country
Horizontal MNEs Vertical MNEsTop 70% Bot 30%
SKILL 1.012 1.751(5.71)** (8.24)**
SIZE 0.185 -0.234(3.33)** (3.03)**
EMPLOYEE 0.118 0.098(2.01)* (1.75)
Constant 3.011 8.009(4.07)** (11.33)**
Observations 457 218Adj. R-sq 0.11 0.25F-value 19.92** 25.45** Absolute values of t-statistics are in parentheses.
* Statistically significant at the 5% level; ** at the 1% level.