A Decision-making and Tools Project White Paper
35
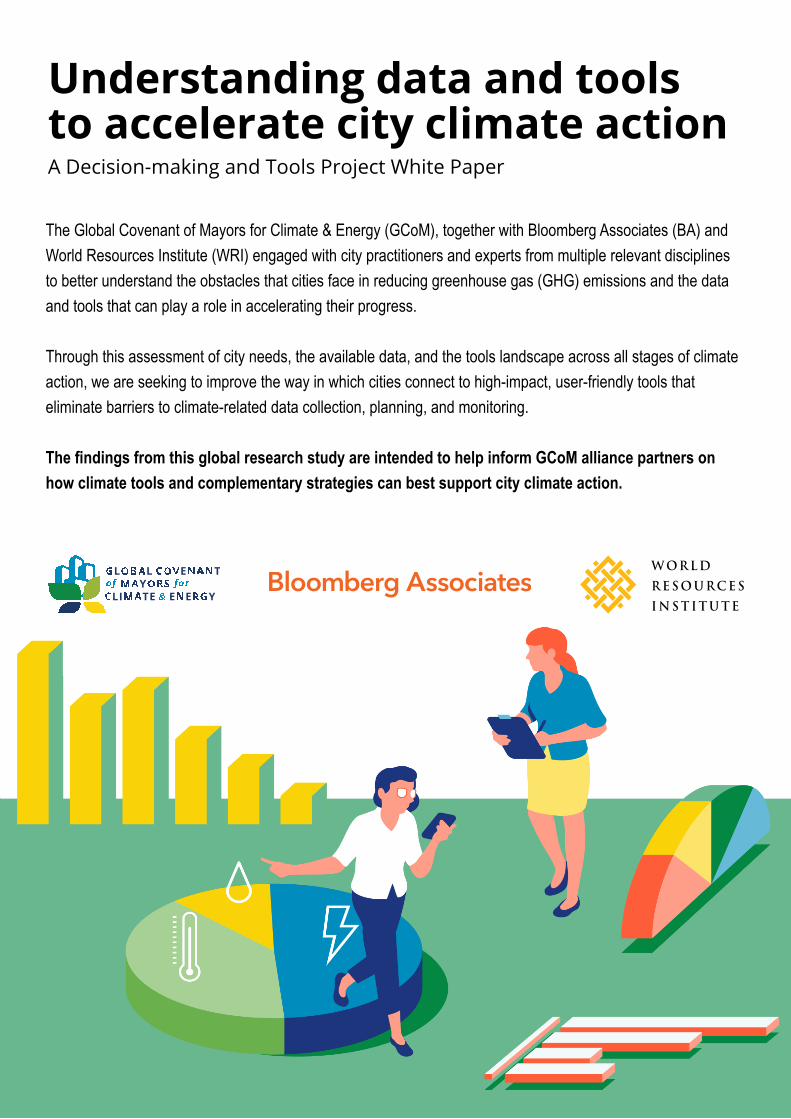
Understanding data and tools to accelerate city climate action A Decision-making and Tools Project White Paper The Global Covenant of Mayors for Climate & Energy (GCoM), together with Bloomberg Associates (BA) and World Resources Institute (WRI) engaged with city practitioners and experts from multiple relevant disciplines to better understand the obstacles that cities face in reducing greenhouse gas (GHG) emissions and the data and tools that can play a role in accelerating their progress. Through this assessment of city needs, the available data, and the tools landscape across all stages of climate action, we are seeking to improve the way in which cities connect to high-impact, user-friendly tools that eliminate barriers to climate-related data collection, planning, and monitoring. The findings from this global research study are intended to help inform GCoM alliance partners on how climate tools and complementary strategies can best support city climate action.
Transcript of A Decision-making and Tools Project White Paper
Understanding data and toolsto accelerate city climate action A Decision-making and Tools Project White Paper
The Global Covenant of Mayors for Climate & Energy (GCoM), together with Bloomberg Associates (BA) and World Resources Institute (WRI) engaged with city practitioners and experts from multiple relevant disciplines to better understand the obstacles that cities face in reducing greenhouse gas (GHG) emissions and the data and tools that can play a role in accelerating their progress.
Through this assessment of city needs, the available data, and the tools landscape across all stages of climate action, we are seeking to improve the way in which cities connect to high-impact, user-friendly tools that eliminate barriers to climate-related data collection, planning, and monitoring.
The findings from this global research study are intended to help inform GCoM alliance partners on how climate tools and complementary strategies can best support city climate action.

TABLE OF CONTENTS
SPECIAL ACKNOWLEDGMENTS 2
EXECUTIVE SUMMARY 3
1 | The Case for a Decision-making and Tools Project 4
2 | Methodology 6
Scope and definition 6Stakeholder engagement 6Mapping and structuring the tools landscape 7Crafting city typologies 9Identifying a taxonomy for data and tools 9Tool connectivity 12
3 | Mapping city needs: findings and opportunities 13
Unpacking the existing tools landscape 13Findings from discussions with Steering Committee partners 14Findings based on tools landscape mapping 15Opportunities 15Opportunity Analysis per phase 16
4 | A resource library with fit-for-purpose tools 18
5 | Recommendations: connecting cities and local governments to fit-for-purpose tools 19
Annex A. Glossary of Terms 25
Annex B. Acknowledgments 26
Annex C. Inventory of 59 tools proposed for initial inclusion 28
Annex D. Tool Usability Attributes 30
Annex E. Data Taxonomy - first two levels 31
Annex F. City Typology Approaches 31
Annex G. Opportunities for Future Tools and Beyond Tools 32
Annex H. Tool Ideas 34
SPECIAL ACKNOWLEDGMENTSThe GCoM Global Secretariat, BA, and WRI express their immense gratitude to the cities and local governments, partners, tool providers, and other stakeholders whose engagement and input made this project possible. Special thanks to partners who gave their time and expertise as part of the Steering Committee, and as well to the GCoM Regional/National Covenants and local governments who helped illustrate the strengths and opportunities that lay ahead as cities move from climate ambition into climate action.
2

EXECUTIVE SUMMARYEXECUTIVE SUMMARYData and tools can play a key role in underpinning and accelerating climate action at local level, where city leaders face
cross-sector decisions, multiple priorities, and a range of stakeholders to engage. At the same time, the landscape of
climate action support tools is vast, complex, and can be difficult to navigate - especially for capacity constrained cities.
Massive demographic shifts, technological transformation, budgetary constraints, and the unprecedented impacts of the
COVID-19 pandemic are increasing uncertainty and placing pressure on city practitioners to make better, faster, and more
integrated decisions.
Making tools easier to use and data more accessible will provide much needed and scalable support to cities with different
capacities and/or that are at various stages of their climate action journey, in part by taking into account regional differ-
ences and specific needs.
The Decision-making and Tools Project therefore sought to:
• Better understand the city climate action journey and barriers to action and implementation
• Connect cities to fit-for-purpose tools that address their needs and characteristics - regardless of shape or size.
The scope of this project was limited to tools and resources focused on climate mitigation opportunities at the local govern-
ment level. The project mapped where data and tools gaps exist in the city climate action journey, potential modifications
that could deliver instant value for cities, and initial recommendations for future tool development.
Our project has yielded three main results: firstly, by connecting practitioners to tools and data most relevant to them,
we ensure that data is more actionable and tools may be used to speed up decision making and free up more time for
implementation; secondly by developing typologies we aim to support all types of cities no matter where they are in their
climate action journey; and thirdly, by sharing our insights with tool developers, and funders, we hope to ensure that future
tools are more functional and adapted to changing user needs.
3
DISTRIBUTION NOTEThis document is authorized exclusively for digital distribution. For inquiries, reach out to [email protected].

1 | The Case for a Decision-making and Tools ProjectThe Paris Agreement explicitly refers to the role of cities as key drivers of climate action, complementing national governments.
Their position at the intersection of several societal challenges presents opportunities to test and develop multiple-win solu-
tions. At the same time, massive demographic shifts, technological transformation, budgetary constraints, and the COVID-19
pandemic are remaking the fabric of cities. This atmosphere fosters uncertainty, placing ever-greater pressure on city staff to
answer increasingly complex challenges and make better and faster decisions in both the short- and long-term. To achieve the
drastic emissions reduction and resilience measures needed to avoid the devastating impacts of climate change, local leaders
need to implement integrated, cross-sectoral climate policy - enabled by the right data, tools, strategies, and partnerships.
As a hub of city and local government action, the Global Covenant of Mayors for Climate & Energy (GCoM) unites city leaders,
networks, and practitioners from across the world and uses coordinated climate data to inform action planning, implementation,
policy development, research and innovation, and investment strategies at local, regional and global level. Paving a pathway
for local governments to implement action at-scale, more than 10,000 cities have made commitments to be part of this solution
- each committing to mitigate and adapt to climate change, as well as facilitate access to energy. In collaboration with partners,
GCoM helps cities bridge the knowledge gap, enhance access to information, build partnerships with data and climate service
providers, and access financial institutions and organizations that can provide relevant tools and information to facilitate their
efforts. Representing more than 900 million people, GCoM cities and local governments could account for 2.3 billion tons CO2-e
of annual emissions reduction by 2030.
In an effort to realize the full potential of these commitments, GCoM undertook this project together with Bloomberg Associates
(BA) and World Resources Institute (WRI) to better understand the state of city climate action along this journey - and the role
of data and tools in helping cities progress in order to guide the development of an overarching strategy that helps accelerate
the planning process for cities and eliminate barriers to climate-related data collection, implementation, and monitoring.
4
ASSESS IMPACTS
Fig 1. The GCoM City Climate Action Journey
5
Despite the need to get data and tools into the hands of local governments, widespread use is thwarted by complexity, lack of
awareness, and a high technical capacity threshold. Many cities acting on climate may lack the capacity to leverage tools for
activities like greenhouse gas (GHG) inventory creation; potentially fewer still have access to a library of tools that meets their
needs at each step of the policy process. Equipping cities with data and tools, therefore, starts with unpacking the landscape.
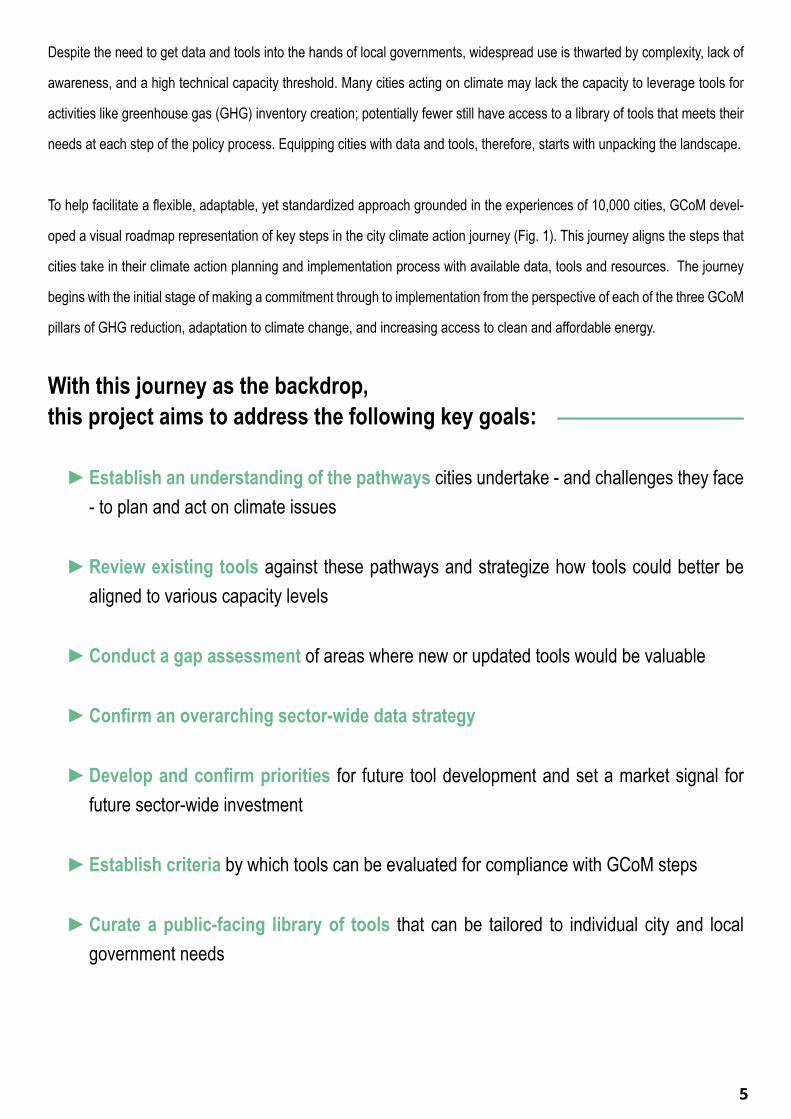
To help facilitate a flexible, adaptable, yet standardized approach grounded in the experiences of 10,000 cities, GCoM devel-
oped a visual roadmap representation of key steps in the city climate action journey (Fig. 1). This journey aligns the steps that
cities take in their climate action planning and implementation process with available data, tools and resources. The journey
begins with the initial stage of making a commitment through to implementation from the perspective of each of the three GCoM
pillars of GHG reduction, adaptation to climate change, and increasing access to clean and affordable energy.
With this journey as the backdrop, this project aims to address the following key goals:
►Establish an understanding of the pathways cities undertake - and challenges they face - to plan and act on climate issues
►Review existing tools against these pathways and strategize how tools could better be aligned to various capacity levels
►Conduct a gap assessment of areas where new or updated tools would be valuable
►Confirm an overarching sector-wide data strategy
►Develop and confirm priorities for future tool development and set a market signal for future sector-wide investment
►Establish criteria by which tools can be evaluated for compliance with GCoM steps
►Curate a public-facing library of tools that can be tailored to individual city and local government needs

2 | Methodology
Scope and definition
The project scope was focused squarely on climate mitigation - with the understanding that future efforts on data and tools
can benefit the areas of adaptation and energy access and poverty. To set a framework against which data and tools can be
identified, assessed, and evaluated, we defined a ‘climate tool’ as:
6
Any instrument, application, and algorithm that better informs decision making,
especially around planning, service provision, and regulatory assessments and
leads to more effective public policy for cities and local governments.
Definition: Climate Tool
Stakeholder engagement
This step of the project aimed to gain different perspectives on current tool use across several engagement channels. City
practitioners and technical experts were asked about city needs, planning process gaps, and efficiency opportunities for tools
- helping ensure that their perspectives form a significant portion of the evidence base for analysis and findings. Our goal was
to better understand:
► Where cities are at in their climate action journey
► Key challenges preventing cities from making progress
► The external supports or internal structure changes cities would make to accelerate climate action
► How cities are using data/tools to support their climate work
Two engagement channels were designed to gather information from these two overarching stakeholder groups:
► Interviews/Focus Groups: regional sessions or semi-structured interviews to acquire input from a diverse set of cities
on their experience moving to climate action and highlight resource gap(s) - as well as how data and tools are being
used to inform their decision-making:
► Interviews with a mix of city leaders and sustainability staff in 58 cities across all 13 GCoM Regional/National
Covenants conducted between December 2019 - June 2020
► Workshop in Brussels on 19 November 2019 with 17 city network partner representatives from 12 organizations
across 5 GCoM Regional/National Covenants
► Survey of 292 cities from around the world. The survey, conducted from February to June 2020, reflects inputs
from cities across 56 countries representing over 191 million people.

7
► Steering Committee meetings: a consultative body comprised of cross-sector representatives1 convened strategically
to help direct the initiative
After hearing from cities and practitioners directly through the survey and interviews, we understood that there was an underde-
veloped awareness of the suite of tools available to local governments throughout the climate action journey. Outside of a select
few that cities might be aware of, it remains difficult to know - as a local official - where or how to start with tools.
Mapping and structuring the tools landscape
As a first take on the tools landscape, an initial list of 600+ climate-related resources was compiled from numerous sources,
including responses to the City Survey; interviews with city staff, tool developers, and other experts; and a comprehensive scan
of the tools listed in the NDC Partnership’s Climate Toolbox. To structure the existing landscape of tools in an easily accessible
and functional way, we identified a set of common phases and shared characteristics along the climate action journey (Fig. 2).
Drawing on existing practitioner expertise, and in line with the GCoM City Journey (Fig. 1), these phases reflect the local policy
making process in the context of climate, allowing as well for progress evaluation2. While cities can experience this journey in
their own order, revisit phases multiple times, or even be in multiple phases at once, the conceptual journey and phases pre-
sented below serve as a framework to highlight our findings. This structure allows us to better understand the needs of cities at
each stage of the process by defining the discrete deliverables that city staff require to progress towards taking climate action.
Based on surveys and interviews, we identified 75 “city needs” as they move from understanding and planning into implemen-
tation and monitoring results. See Table 1 on page 8 for a list of city needs organized by phase.
While these needs are somewhat translatable across city contexts, local governments may face different challenges - related
to capacity, governance, resource, or otherwise - and therefore prioritize needs differently. As a result, we organized cities into
four “types,” reflecting their governance structure and capacity for climate action to facilitate a more nuanced perspective.
1 For a list of Steering Committee representatives, please see Annex B.
2 The GCoM City Journey is also available on the GCoM website at https://www.globalcovenantofmayors.org/journey/
DRAFT
City Climate Action Journey
Project Approach
We collectively developed a City Climate Action Journey to assess cities’ climate progress to comprehensively plan – –
Fig 2. The Decision-making and Tools Project City Climate Action Planning Journey

8
Understanding Planning Executing Monitoring• Best practice guides and methods for
producing GHG inventory• Demogrpahic trends and projections
(e.g. population, economic, etc.)• Outcome data (e.g. air quality, public
health, congestion, etc.)• Sectoral activity data (e.g. buildings,
transport, waste, land use, etc.) • Consumption data• Informal sector data• Equity / city-wide inequities data• Geospatial data (e.g. GIS)
• Best practice guides, methods, and RFPs for climate action plan development
• Interconnectivity of projects and policies with planned initiatives (city, other actors)
• Community input, participation, empow-erment, and coalition
• Pre-feasibility studies• Prior project or policy results• Capital structures / financial models• Assessment of financing options (e.g. munici-
pal budget, external, governmental)• Project-level cost benefit analysis • Policy/program impact analysis or pilot
studies to build buy-in and approval• Project and policy proposals (e.g. Mayoral,
legislative, investment, or budget-related)• Community engagement and collective
influence campaigns
• Methodology/framework for moni-toring and evaluating impact
• Demographic data (recollection)• Outcome data (recollection)• Sectoral activity data (recollection)• Informal sector data (recollection)• Equity / city-wide inequities data • GHG emissions inventory (recalcu-
lated - city operations, communi-ty-wide, and consumption)
• Priorities for climate action (e.g. commu-nity priorities and concerns)
• Proxy data
• Mandate for climate action• Buy-in and relationships with
climate-related systems controllers (e.g. city departments, other levels of government, private sector)
• Budget estimates for projects and policies
• Sustained political will • Sector-specific technical expertise for project
development• Local expertise and partners to craft policy
and run programs• Legal frameworks, regulations, and standards• Accountability and assigned governance /
leadership responsibilities• Access to and prioritization of capital for
climate action• Procurement models and contracting
procedures • Deal-brokers / facilitators for financial
transactions
• Community partners to gather information needed for results
• GHG emissions inventory - city oper-ations, community-wide, consumption emissions
• Climate risk studies• Climate action capacity assessment
(e.g. political landscape & context, community assets & resources, city powers)
• Expected policy & project benefits • Non-climate benefits (e.g. public
health, economic, etc.)• GHG emissions benefits• Equity benefits
• Scenario outputs• Cost-benefit analysis - projects &
policies• Prioritized list of actions• CAP implementation plan• Climate program proposal (e.g. CAP)
• Engaged community & local businesses• Mobilizaiton of other governmental actors
(e.g. regional and national)• Dedicated funding streams• Adopted policy frameworks to hold city
departments accountable• Adopted policy frameworks to hold other
actors accountable• Adopted new regulations, policies, and
ordinances to advance climate work
• Realized impacts of projects and policies
• Non-climate impacts• GHG emissions impacts• Equity impacts
• Policy refinements based on realized impact
Communicating
• Realized non-climate, GHG, and equity impacts of projets and policies within the city and across the community
• Result of action taken by city departments, community, businesses/private sector, and other levels of government
• Relationships with media• Best practices for different communication
vehicles to reach elected officials, city departments, community, business, & other government levels
• Marketing and communications materials• Tailored communications strategies to elected
officials, city departments, community, business-es, and other government levels
• Resident impact / stories• Community engagement• Outputs aligned with external frameworks (e.g.
CDP)
INPU
TSSU
PPOR
TSDE
LIVE
RABL
ES
INPU
TS
DELI
VERA
BLES
SUPP
ORTS
Table 1. 75 “City Needs” across each phase of the climate action journeyTo help classify each city need, we broke them down within each phase into one of three categories:
► Inputs: What is needed at the beginning of each phase? ► Supports: What supports do staff need to complete these activities? ► Deliverables: What are the deliverables that cities need to produce in each phase?

9
Crafting city typologies
Based on the surveys and interviews, we found that city progress on climate action and the governance framework cities are
operating in can be framed as a function of two main factors: capacity and authority (see Table 2).
DRAFT
Type A Type B Type DType C
* More detail found in Appendix
Project Approach
City Types
four “types” ––
Fig 3. City typologies
To define city “types” for this project, we explored a variety of practitioner and expert-tested approaches. This included a review
of existing city typologies for their potential applicability and testing both a quantitative and qualitative typologies approach.
Ultimately we decided to develop a new set of typologies using a qualitative approach. This decision was based on limited appli-
cability of existing typology frameworks for this exercise and the lack of available standardized data for quantitative indicators.
The resulting set of city typologies is not intended to group cities based on their built environment or the climate actions that
will have the greatest impact. Instead, our objective is to help cities identify which resources and support will be most useful
to them, while helping civil society, private actors, and the philanthropic community better understand how investments can be
tailored to meet cities at their stage in climate action journey and help them to accelerate towards full implementation, regard-
less of shape or size.
Identifying a taxonomy for data and tools
Making sense of the tools landscape and understanding how data flows through each tool required a common language against
which comparisons, analyses, and further connections could be made. We collected information about each tool’s required
inputs and generated outputs. We opened, logged into, or executed each tool and examined the data-input fields and output
options. We also examined user manuals and training materials when available. We recorded the data requirements of each
tool, as well as the data produced from the tool’s calculations, as individually named variables.
Dimension Definition Rationale
Capa
city
Human capital
Reflects the capacity of city staff to execute on climate programs
Larger teams can accommodate sophisticated supports, while smaller teams need simpler/easy to use options
Financial capital
Reflects the degree to which city funds are available for climate programs
Budget frameworks, capital policies, and fiscal health can all impact the best ways to support a city’s climate action
Gov
erna
nce Will
Reflects support level and ambition for climate action among those local government policy influencers
Building support among the community and elected officials is crucial for all cities; though messaging and other factors may vary based on current political will
City powersReflects the degree of control over city cli-mate-related systems and functions
Regional or metro-level mobilization may be more important in cities with less direct control; cities with stronger powers may have a greater need for help with direct action
Table 2. City typology criteria

Unpacking the existing tools landscape
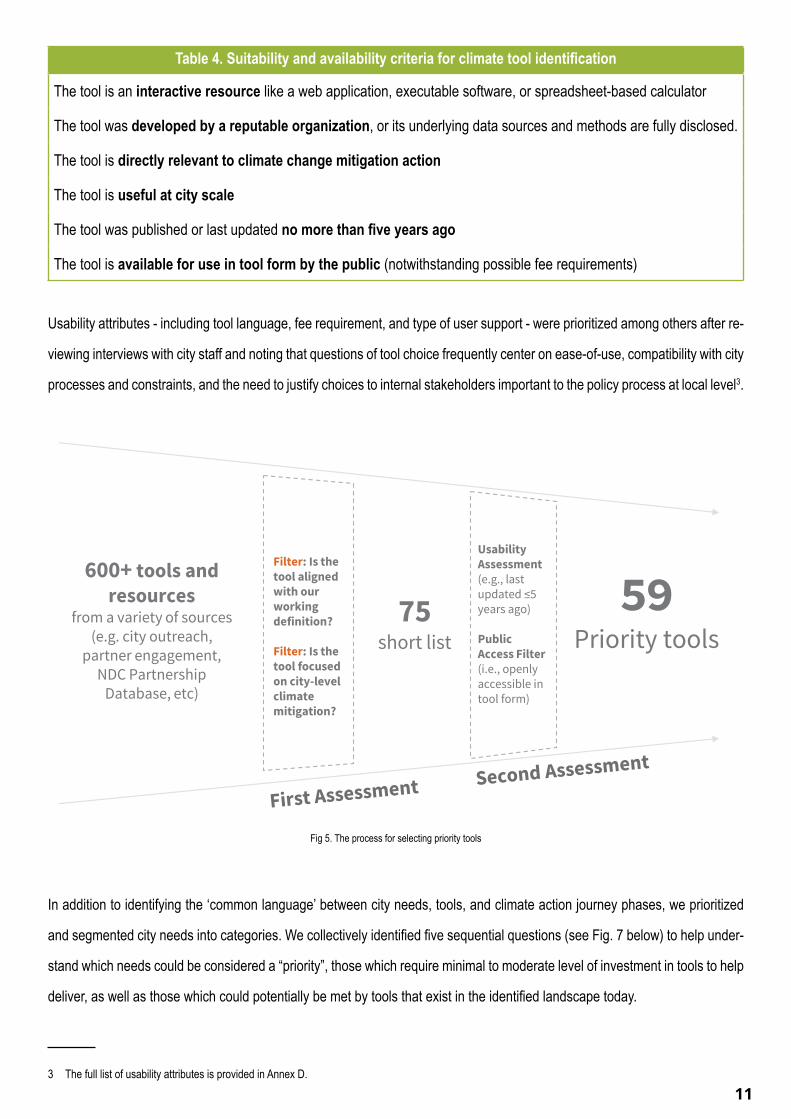
In collaboration with the Steering Committee and based on input collected through the stakeholder engagement process,
we developed a set of suitability and availability criteria with the goal of sorting out fit for purpose tools for city-scale climate
mitigation action (Fig. 5).
These criteria were then applied to an initial list of 600 tools, resulting in a final set of 59 tools available for city-level climate
mitigation action and that adequately met the criteria for GCoM endorsement. These 59 tools are listed in Annex C.
Taking these tools to be the current landscape of climate action tools, we examined the tools individually in terms of: ► Functionality (the specific calculations each tool performs, including the inputs required and outputs produced); ► Usability (tool attributes that are relevant to specific users’ capabilities and preferences); and ► Connectivity between tools, tools and needs, and the larger ecosystem of climate data and tools.
10
We organized the entire set of input and output variables into a nested, hierarchical data taxonomy consisting of 1860 terms.
The first two levels of the taxonomy - the top-level concept and the most general sub-concept - are described in Annex E. An
example how an element is ‘nested’ within a hierarchy is shown below:
The taxonomy and its constituent inputs and outputs were used to define categories of data and to assign data categories to city
needs. With data inputs and outputs as the ‘common language’ between city needs and tool data requirements and products,
we created an initial mapping of tools to the city needs they could support - and, by extension, each of the phases in the city
climate action journey. An example of how this mapping connects phases and needs to tools - via outputs - is provided below:
estimate : energy : electricity : wind power : mean power density
Top-level concept Nested sub-concepts Specific concept
Fig 4. Anatomy of the data taxonomy
Table 3. Sample mapping of phases, city needs, and toolsPhase Need within this
phase
Tool output supporting this need Tools providing this
outputUnderstanding Prioritized list of
actions
actions: action priorities: stationary energy BEST Cities
Planning Non-climate benefits actions: action indicators: climate justice CityBES
Executing GHG-reduction benefits
actions: action indicators: transportation Local Clean Energy Self-Scoring Tool
Monitoring Scenario outputs (15 total)
actions: action priorities: potable water TRACE
Communicating actions: action priorities: transportation (27 total)
11
Table 4. Suitability and availability criteria for climate tool identification
The tool is an interactive resource like a web application, executable software, or spreadsheet-based calculator
The tool was developed by a reputable organization, or its underlying data sources and methods are fully disclosed.
The tool is directly relevant to climate change mitigation action
The tool is useful at city scale
The tool was published or last updated no more than five years ago
The tool is available for use in tool form by the public (notwithstanding possible fee requirements)
Usability attributes - including tool language, fee requirement, and type of user support - were prioritized among others after re-
viewing interviews with city staff and noting that questions of tool choice frequently center on ease-of-use, compatibility with city
processes and constraints, and the need to justify choices to internal stakeholders important to the policy process at local level3.
In addition to identifying the ‘common language’ between city needs, tools, and climate action journey phases, we prioritized
and segmented city needs into categories. We collectively identified five sequential questions (see Fig. 7 below) to help under-
stand which needs could be considered a “priority”, those which require minimal to moderate level of investment in tools to help
deliver, as well as those which could potentially be met by tools that exist in the identified landscape today.
3 The full list of usability attributes is provided in Annex D.
DRAFT
“attributes” (e.g., languages) ➔➔
➔➔
updated ≤5
Project Approach
* A full list of the 58 tools is available in the appendixFig 5. The process for selecting priority tools
59

12
With the 75 city needs identified from city interviews and Steering Committee input, we used further research and discussion to:
► Determine the level of difficulty to address a need as well as the importance of addressing each need;
► Develop a shortlist of 30 “priority” needs based on this assessment;
► Compare each city “need” against the outputs produced by tools;
► Evaluate the level of tool support (strong or weak) based on the needs and climate action journey; and
► Study tool support gaps to determine where tools offer an appropriate solution.
Tool connectivity
We also examined the possibility that data generated as outputs from one tool could be used as inputs into another tool. We
did this by examining the tool outputs that support city needs that are likely to take place in intermediate phases of the climate
action journey - rather than at the beginning or end. For example, many cities will take data from a GHG inventory in the ‘Under-
standing’ phase, use it in the ‘Planning’ phase to inform scenario-based studies of potential actions, and pass those scenario
outputs to processes in the ‘Executing’ phase. In this journey, ‘Planning’ phase scenario studies are an intermediate step - an
opportunity to understand how data is handed off from inventory tools to scenario tools, and then on to execution tools.
We found that for the most part, the data that are produced by some tools and accepted as inputs to others are GHG emissions
estimates and projections. In order for a handoff to occur between a GHG inventory tool and a scenario-modeling or co-benefits
estimation tool, the necessary data transformations generally consist of aggregating data over emission sources and locations,
and sometimes disaggregating data so that within-boundary emissions are separated from outside-boundary emissions.
Languages
Default data provision
Technical requirements
User skill level Output formats
Support type Target geography
“Can I use it?” Frameworks and protocols
Fee model
“Can I justify it?”City and other expert interviewees con-sistently expressed concerns about ability to access and use tools, and necessity of justifying tool choice.
Interviewees expressed frustration with the labor and expertise required to perform particular data transformation tasks. Wish list items included task-specific data ac-quisition and management functionalities.
Input variables Output variables
“Does it do what I need?”
59 proposed
tools
STEP 1 | Usability assessment
STEP 2 | Functionality assessment
Fig 6.. Filtering tools with ‘usability’ and ‘functionality’ assessments
Is this difficult for cities today?
Is this important to address / a priority for cities? Is this supported by tools?
How much effort would be required to meet it with tools?
Which tools should GCoM point cities towards for which use cases?
Need
1 2 3 4 5
Fig 7. Questions to identify priority needs

3 | Mapping city needs: findings and opportunitiesComparing feedback across all project engagement channels in combination with the 75 city needs and pro-
posed list of fit-for-purpose tools created a data-driven foundation upon which analysis could be conducted and
findings derived. Below, we identify opportunities where tools can better support city needs.
Unpacking the existing tools landscape
Cities of all sizes, geographies, and political profiles are struggling to execute their climate agendas.
While almost 60% of cities that responded to the survey reported they had completed GHG inventories, de-
veloped climate action plans, or started projects, only 22% reported progressing further in execution and monitoring - even among cities with a climate action plan.
13
50% of survey respondents indicate not using any tools to support climate action. Those using tools were 2.5x more likely to be implementing at scale.
CONFIDENTIAL WORKING DRAFT
34%
17%
15%
21%12%
9%16%
42%33%
DemographicsThe survey, conducted from February to June 2020, reflects inputs from 292 cities across 56 countries. These cities are home to over 191 million people.
3
7
9
9
21
22
28
31
35
48
79
0 10 20 30 40 50 60 70 80 90
South Asia
East Asia
Oceania
North America - USA
European Union & Western Europe
Eastern Europe & Central Asia
North America - Canada
Southeast Asia
Middle East & North Africa
Sub Saharan Africa
Latin America & The Caribbean
Survey responses by region (n=292)
5
Survey sample by country-level income group*
Survey sample by city population group
Source: The World Bank* Income is measured in GNI per capita
Source: OECD
Town50,000 or less
Small Urban50,000 – 200,000
Medium Urban200,000 – 500,000
Urban500,000 – 1.5M
Large Urban1.5M+
Low-income economies$1,036 or less
Lower-middle-income economies$1,036 – $4,045
Upper-middle-income economies$4,045 - $12,535
High-income economies$12,536+
Fig 8. Surveyed cities by GCoM region
CONFIDENTIAL WORKING DRAFT
34%
17%
15%
21%12%
9%16%
42%33%
DemographicsThe survey, conducted from February to June 2020, reflects inputs from 292 cities across 56 countries. These cities are home to over 191 million people.
3
7
9
9
21
22
28
31
35
48
79
0 10 20 30 40 50 60 70 80 90
South Asia
East Asia
Oceania
North America - USA
European Union & Western Europe
Eastern Europe & Central Asia
North America - Canada
Southeast Asia
Middle East & North Africa
Sub Saharan Africa
Latin America & The Caribbean
Survey responses by region (n=292)
5
Survey sample by country-level income group*
Survey sample by city population group
Source: The World Bank* Income is measured in GNI per capita
Source: OECD
Town50,000 or less
Small Urban50,000 – 200,000
Medium Urban200,000 – 500,000
Urban500,000 – 1.5M
Large Urban1.5M+
Low-income economies$1,036 or less
Lower-middle-income economies$1,036 – $4,045
Upper-middle-income economies$4,045 - $12,535
High-income economies$12,536+
Fig 9. Survey sample by population size group
CONFIDENTIAL WORKING DRAFT
34%
17%
15%
21%12%
9%16%
42%33%
DemographicsThe survey, conducted from February to June 2020, reflects inputs from 292 cities across 56 countries. These cities are home to over 191 million people.
3
7
9
9
21
22
28
31
35
48
79
0 10 20 30 40 50 60 70 80 90
South Asia
East Asia
Oceania
North America - USA
European Union & Western Europe
Eastern Europe & Central Asia
North America - Canada
Southeast Asia
Middle East & North Africa
Sub Saharan Africa
Latin America & The Caribbean
Survey responses by region (n=292)
5
Survey sample by country-level income group*
Survey sample by city population group
Source: The World Bank* Income is measured in GNI per capita
Source: OECD
Town50,000 or less
Small Urban50,000 – 200,000
Medium Urban200,000 – 500,000
Urban500,000 – 1.5M
Large Urban1.5M+
Low-income economies$1,036 or less
Lower-middle-income economies$1,036 – $4,045
Upper-middle-income economies$4,045 - $12,535
High-income economies$12,536+
Fig 10. Survey sample by country-level income group
14
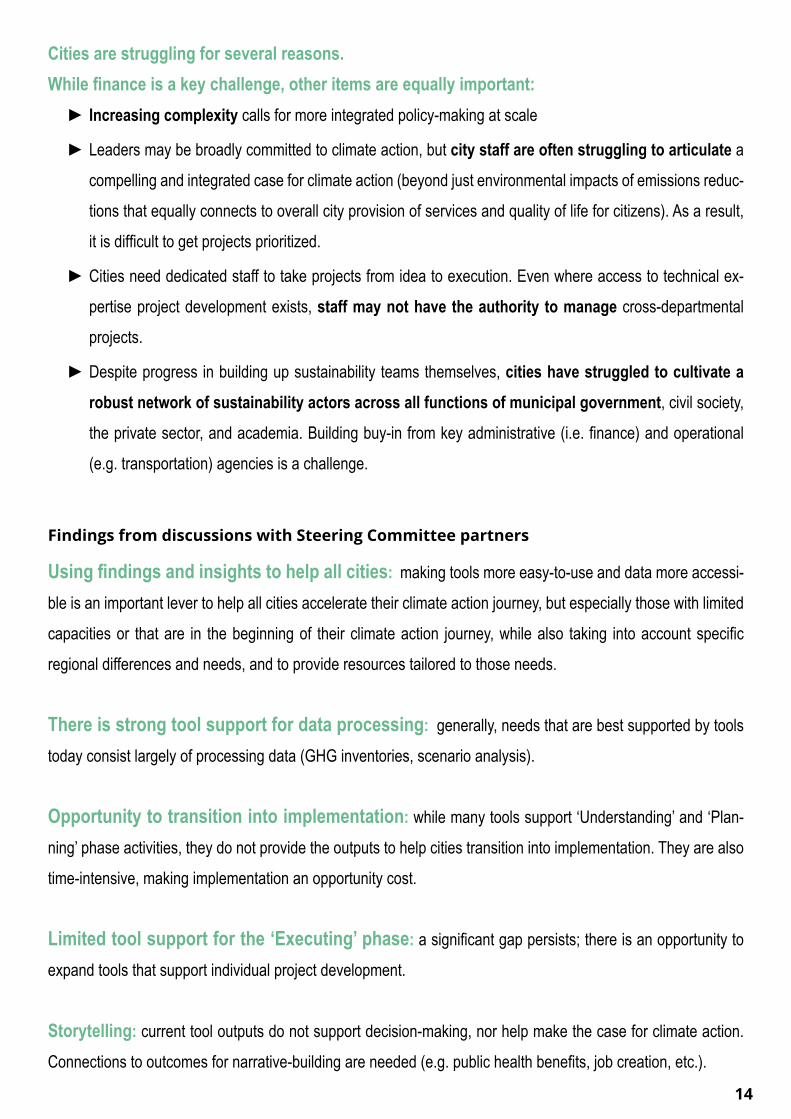
Cities are struggling for several reasons. While finance is a key challenge, other items are equally important:
► Increasing complexity calls for more integrated policy-making at scale
► Leaders may be broadly committed to climate action, but city staff are often struggling to articulate a
compelling and integrated case for climate action (beyond just environmental impacts of emissions reduc-
tions that equally connects to overall city provision of services and quality of life for citizens). As a result,
it is difficult to get projects prioritized.
► Cities need dedicated staff to take projects from idea to execution. Even where access to technical ex-
pertise project development exists, staff may not have the authority to manage cross-departmental
projects.
► Despite progress in building up sustainability teams themselves, cities have struggled to cultivate a robust network of sustainability actors across all functions of municipal government, civil society,
the private sector, and academia. Building buy-in from key administrative (i.e. finance) and operational
(e.g. transportation) agencies is a challenge.
Findings from discussions with Steering Committee partners
Using findings and insights to help all cities: making tools more easy-to-use and data more accessi-
ble is an important lever to help all cities accelerate their climate action journey, but especially those with limited
capacities or that are in the beginning of their climate action journey, while also taking into account specific
regional differences and needs, and to provide resources tailored to those needs.
There is strong tool support for data processing: generally, needs that are best supported by tools
today consist largely of processing data (GHG inventories, scenario analysis).
Opportunity to transition into implementation: while many tools support ‘Understanding’ and ‘Plan-
ning’ phase activities, they do not provide the outputs to help cities transition into implementation. They are also
time-intensive, making implementation an opportunity cost.
Limited tool support for the ‘Executing’ phase: a significant gap persists; there is an opportunity to
expand tools that support individual project development.
Storytelling: current tool outputs do not support decision-making, nor help make the case for climate action.
Connections to outcomes for narrative-building are needed (e.g. public health benefits, job creation, etc.).
15
Many needs are unfit for tools: more broadly, many government processes are not suited for tool support.
This includes needs that:
► Require relationships with stakeholders across government and/or other institutional entities;
► Depend on building trust and seeking input from community stakeholders; and/or
► Rely on highly specific local information.
Opportunity to support less data-intensive activities: the complexity of climate action requires the
close collaboration of city departments and the tracking of numerous planned and existing projects. Tools that
help users to manage data and city processes and that can help structure and track these tasks - particularly if
they distill practices from cities that have successfully navigated similar work - can help them be more efficient,
benchmark, avoid pitfalls and improve implementation.
Findings based on tools landscape mapping
Exploring and mapping the universe of tools for mitigation alone showed us how many tools are being
developed and how but a few are maintained or adapted.
There are significantly more tools supporting earlier phases in the climate action journey, areas where cities are making progress (e.g. GHG inventories, planning), and far fewer in execution
and implementation (e.g. attracting capital, implementing projects). Tools and data are needed to support and
deliver on city plans, and further exploration on where tools can facilitate implementation is needed. However,
many cities are still at the very beginning of their climate action journey or in the process of drafting a climate ac-
tion plan. For them, it remains important that existing, adapted or new tools also answer their early-phase needs.
Opportunities
Below is a list of opportunities - indicated by stakeholders - where investments could help cities accelerate
climate action through the journey and move towards implementation:
Opportunities fit for tools ► Simplification of existing tools
► Support in project development and execution
► Better access to (proxy) data and tools that can help spotlight complex and interdependent relationships
across sectors and policy domains - including spatial planning, mobility, industrial ecosystems and new
16
business models, social innovation, etc.
► Greater data inputs for tools and tool standardization can facilitate more impactful data aggregation, which
can in turn build an even stronger case for city climate action and targeted policy packages
► Stronger alignment of tool outputs with reporting frameworks (e.g. CDP-ICLEI Unified Reporting System,
MyCovenant)
► Better integration of outcome benefits
► Integrating interoperability between tools (so different tools can optimally collaborate with each other
across departments and workflows, between different public and private actors) into the existing tools
landscape can build support for collaboration across policy domains and sectors - with greater efficiency
and benchmarking standards.
Opportunities beyond tools ► Better engaging key decision makers within the city across policy fields and departments
► Improving capacity and skills in among others complex and integrated project management
► Facilitating dialogue and collaborative climate action at a metropolitan scale.
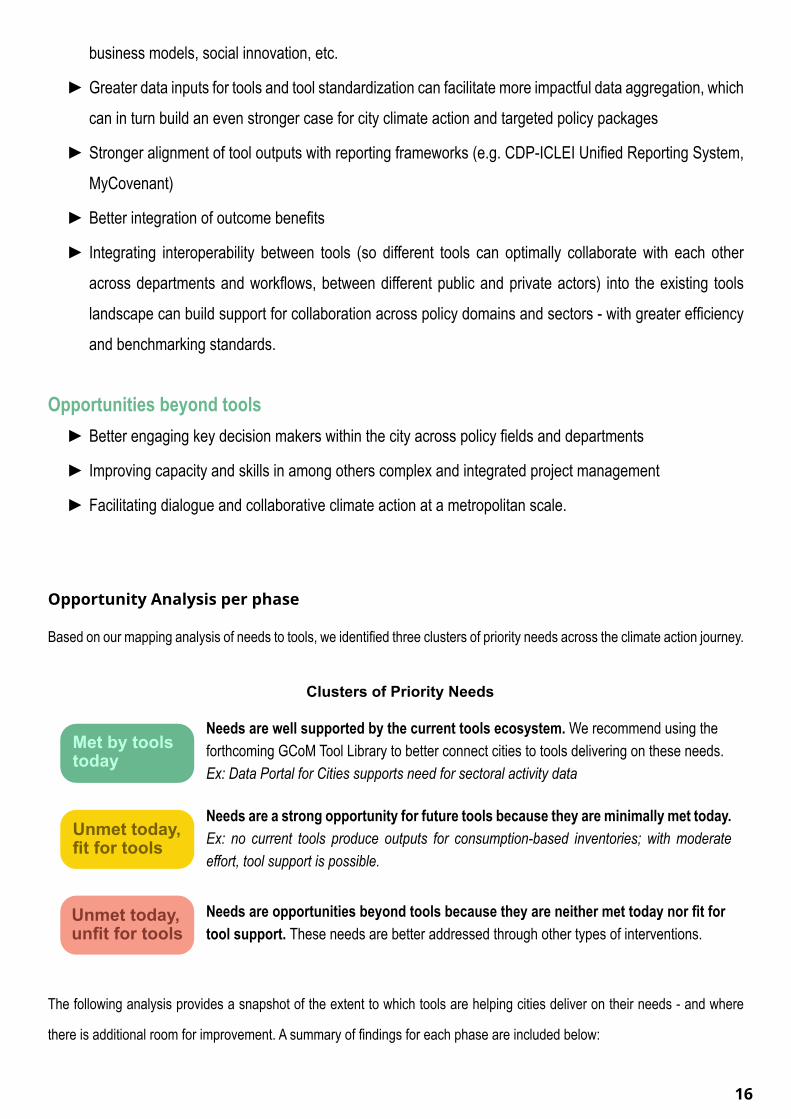
Opportunity Analysis per phase
Based on our mapping analysis of needs to tools, we identified three clusters of priority needs across the climate action journey.
The following analysis provides a snapshot of the extent to which tools are helping cities deliver on their needs - and where
there is additional room for improvement. A summary of findings for each phase are included below:
Clusters of Priority Needs
Met by tools today
Unmet today, fit for tools
Unmet today, unfit for tools
Needs are well supported by the current tools ecosystem. We recommend using the forthcoming GCoM Tool Library to better connect cities to tools delivering on these needs. Ex: Data Portal for Cities supports need for sectoral activity data
Needs are a strong opportunity for future tools because they are minimally met today. Ex: no current tools produce outputs for consumption-based inventories; with moderate effort, tool support is possible.
Needs are opportunities beyond tools because they are neither met today nor fit for tool support. These needs are better addressed through other types of interventions.

17
Understanding Planning Executing Monitoring
Currently very limited support for tools. The limited existing tools tend to be very technical or engineering focused (e.g., estimating congestion benefits of a road engineering project), and user intensive, and don’t connect to other outcomes - key challenges to action implementation. Importance of strategies and governance approaches is more dominant, with lower automation potential. We need to gather more insights on which factors/decision points are relevant to an individual community to better understand what is a truly beneficial investment in this phase.
Met by tools today(Connect cities to tools)
Unmet today, fit for tools(Opportunity for future tools)
Unmet today, unfit for tools(Opportunity beyond tools)
• N/A • Pre-feasibility, feasibility, and impact studies
• Financing and procurement models
• Mobilization of other governmental actors and local expertise to run programs
• Accountability frameworks
Understanding Planning Executing Monitoring
Most tools are focused on helping translate activity data into GHG inventories. Gaps exist when it comes to the collection and incorporation of outcome and equity-focused data. More broadly, early-stage tools are time intensive and could be simplified to reduce the burden on cities.
Met by tools today(Connect cities to tools)
Unmet today, fit for tools(Opportunity for future tools)
Unmet today, unfit for tools(Opportunity beyond tools)
• Sectoral activity data (e.g. Data Portal for Cities)
• GHG accounting (e.g. ClearPath)
• Proxy data and streamlined methodologies for GHG accounting
• Consumption inventories
• Outcome and equity-focused data
Many tools exist to support technical planning activities, evaluation of costs and GHG impacts of potential projects, and developing a prioritized list of actions. There is limited support for activities that enable a transition into execution.
Met by tools today(Connect cities to tools)
Unmet today, fit for tools(Opportunity for future tools)
Unmet today, unfit for tools(Opportunity beyond tools)
• Expected GHG emission benefits of potential projects/policies (e.g. Waste Reduction Model (WARM))
• Scenario outputs (e.g. LEEP-C)
• Prioritized action list (e.g. BEST Cities)
• Evaluating non-climate benefits and simplifying financial analysis for potential actions
• Standardized approaches to climate planning and community engagement
• Connecting climate to other city priorities and building buy in across departments
Understanding Planning Executing Monitoring
18
4 | A resource library with fit-for-purpose toolsEquipped with a greater understanding of where existing tools are best positioned to meet city needs, we can
build a tool library that will generate tools recommendations for cities. The GCoM City Journey (Fig.1) and
resource library both serve as a place where cities, developers, funders, and other partners can search, shortlist,
and utilize an organized set of fit-for-purpose tools to drive climate action4.
As we have found, quality of emissions reduction assessment tools is hard to assess and define. We therefore
defined a set of suitability criteria (Annex D) such that any tool that is suitable according to these criteria can be
recommended and endorsed by the GCoM alliance with confidence. To that end, tools under consideration for
inclusion in the resource library must:
4 https://www.globalcovenantofmayors.org/resources-library/
1 Meet the suitability criteria (Annex D)
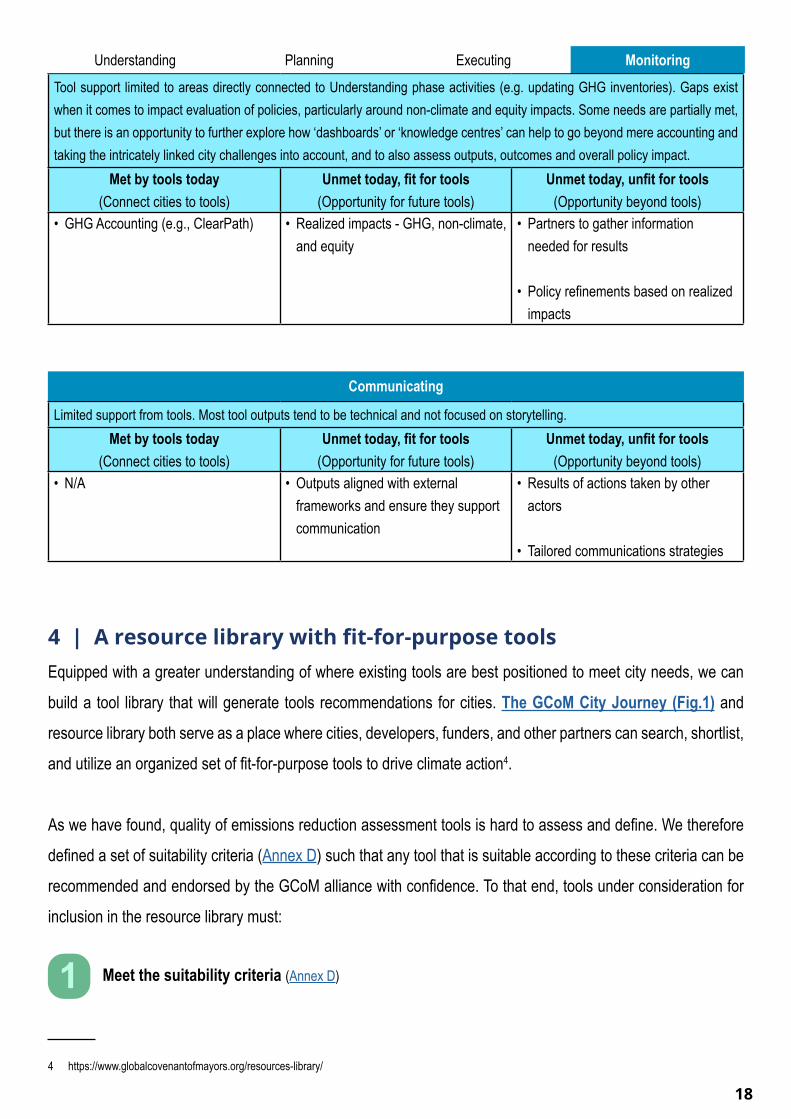
Tool support limited to areas directly connected to Understanding phase activities (e.g. updating GHG inventories). Gaps exist when it comes to impact evaluation of policies, particularly around non-climate and equity impacts. Some needs are partially met, but there is an opportunity to further explore how ‘dashboards’ or ‘knowledge centres’ can help to go beyond mere accounting and taking the intricately linked city challenges into account, and to also assess outputs, outcomes and overall policy impact.
Met by tools today(Connect cities to tools)
Unmet today, fit for tools(Opportunity for future tools)
Unmet today, unfit for tools(Opportunity beyond tools)
• GHG Accounting (e.g., ClearPath) • Realized impacts - GHG, non-climate, and equity
• Partners to gather information needed for results
• Policy refinements based on realized impacts
Understanding Planning Executing Monitoring
Limited support from tools. Most tool outputs tend to be technical and not focused on storytelling.Met by tools today
(Connect cities to tools)Unmet today, fit for tools
(Opportunity for future tools)Unmet today, unfit for tools
(Opportunity beyond tools)• N/A • Outputs aligned with external
frameworks and ensure they support communication
• Results of actions taken by other actors
• Tailored communications strategies
Communicating

19
The resource library can benefit from a series of features aimed at increasing accuracy and efficiency when
connecting cities with appropriate tools. These features include, but are not limited to:
► Need(s) selection from a pre-selected drop-down list based on the journey phase
► Typology selection, where the user may self-assess their city type based on a series of questions tied to
the analysis conducted as part of this project;
► Key attribute selection, including language, ease-of-use, fee model, and others;
► Tiered tool recommendations that prioritize a subset of tools over others based on a weighting of cov-
erage between tools and identified needs;
► Tools linked across phases that leverage a connectivity analysis between needs, phases, and tool
inputs/outputs to provide more holistic recommendations throughout the journey; and
► Keyword search or other search filters deemed relevant and/or appropriate by GCoM partners.
5 | Recommendations: connecting cities and local governments to fit-for-purpose toolsFocused on climate mitigation, the Decision-making and Tools Project is just one key step in helping to realize
systemic change at-scale. While many cities seek support to roll out mitigation actions, many others need to
respond to immediate risks and hazards. This work will also help to better understand interlinkages, co-benefits
and potential trade-offs.
In the mitigation context alone, the project showed us the complexity of the tools landscape, the difficulties in
identifying fit-for-purpose tools, and the importance of ensuring that tools can evolve and stay updated in line
with user needs.
2 Undergo analysis and evaluation, with inputs and outputs detailed using the data taxonomy. The taxonomy was developed with transferability, ease-of-use, and future tool inclusion in mind. In most cases, the procedure for adding tools to the library does not require detailed knowledge of the system of needs, types, and data that we have built in this project. Required information includes tool data requirements, calculation capabilities, and usability attributes like language, defaults, and others. If new terms must be added, they should be added using the taxonomy’s existing hier-archical structure. if possible, tool developers should ensure all data be described using terms that currently exist in the taxonomy. If necessary, the new terms must match the city needs.
3 Undergo vetting by the GCoM Research and Innovation (R&I) and Data Technical Working Groups. Both groups are well-placed to define policies and procedures, including the cadence of reviews and updates to the resource library, which allows for the development of a comprehensive, dynamic, functional, and pragmatic library that helps cities tackle complex challenges. The R&I Technical Working Group can also steward the GCoM alliance’s unique position as a global aggregating platform that transcends climate data and tools work and can therefore help to integrate findings from this project into the broader strategies used by cities to move from planning to implementation.

20
With almost half of city survey respondents not using tools in their climate action journeys, it will be critical to
better understand why they are not using any tools. Furthermore to have a better insight in city needs and
connect cities that are not using any tool today with those that are fit-for-purpose enabling practitioners to focus
on (at scale) implementation and monitoring. As city networks and stakeholders increasingly support cities in
moving from measurement to implementation, simplifying the tool ecosystem and finding ways to standardize
and connect data across disparate tools will ensure that they can transition without sacrificing the quantitative
rigor and preparation tasks required for implementation. It will help remove barriers, but will also allow for bench-
marking, comparison of results and impact with peer users or even lead to co-creation environments.
In the existing tool landscape there is strong tool support for data processing and the understanding and planning
phase of a city’s climate action journey, but limited tool support for implementation of climate action strategies.
While many tools support ‘Understanding’ and ‘Planning’ phase activities, they do not provide the outputs to help
cities transition into implementation. There is also considerable largely untapped potential in better integrating
tools into governance frameworks and stakeholder management.
Recommendations to accelerate action
Better understand barriers to tool use and connect cities to the listed fit-for-purpose tools. While it is
important to address needs that are fit for tools and/or unmet by tools, there are thousands of cities who need
support right now in early phases of the journey, from generating inventories to crafting plans. Offering further
technical assistance to run many of these tools will remain of key importance for the vast majority of cities. Stan-
dardization of the landscape and pointing cities towards fit-for-purpose tools is but a first step.
Fill the gaps. While some needs are met by globally available tools, the landscape overall lacks breadth - in
terms of addressing the different sectors and policy domains that have a key impact on the climate challenge
and to facilitate integrated planning that drives better project implementation at the right scale - and depth, in
terms of offering the best available support for specific needs in a city or region. The balance of granularity, the
appropriate level of detail to understand a problem, will be important when defining next steps on the intersection
between data and tools. Furthermore, there are needs, geographies, and use cases that deserve particular
attention, and tools that support underserved situations should receive priority. In particular, there is a need for
tools that provide activity and outcome data in developing country contexts. Non-English language tools are also
severely lacking.
Ease of integration. Many existing tools address narrow tasks - often in one sector or policy domain - rather
than entire needs or phases. Better understanding is needed of the trade-offs between integrated, single-tool
21
experiences for climate action journeys compared to narrow-function tools that might offer more flexibility to
customize the climate action journey approach. This requires more insight into machine-readable outputs, API
access to outputs and data, and setting standards for streamlined data transfers. This would improve on not only
the laborious task of managing a set of tools, but also the largely nonexistent integration of off-the-shelf tools with
city information infrastructures.
Long-term maintenance and availability. Our research shows that many tools become obsolete without
regular maintenance. Operations & maintenance do require resources the market currently does not sufficiently
seem to support. While there are benefits to offline tools, provision of constantly updated data can today only be
met by web applications. To ensure impact, developers and funders need to incorporate evolving user needs and
multi-year growth and maintenance into their product roadmaps.
A large amount of available data is not yet made actionable. Better disclosing available or using proxy data
can improve tool functionality. Moreover, an updated version of the GCoM Data Portal for Cities should provide
globally downscaled data, proxy data for regions where data is hard to collect, and nationally or regionally
downscaled or measured data where available. Providing more qualitative data and better aligning outputs with
reporting frameworks would allow tools to better support climate action. The Common Reporting Framework
can act as guidance; integrating standards and protocols into interactive / step-by-step tool experiences could
streamline city data calculations and related activities with external compliance processes like badging and
scoring. Designing tools to be more action oriented and putting the user experience more central would help to
better translate data into policies.
Data (dis)aggregation. We recommend that future tools facilitate aggregation and disaggregation of data. This
would require tools to store data at the highest available levels of detail, and to provide simple ways to organize
data based on spatial boundaries, timeframes, and other associated data (e.g., sectoral, demographic, category
of vehicle). This recommendation might be impractical for narrow-functionality tools that focus on providing a
specific type of calculation. But more standardization of data and protocols, and thus tools that deliberately store
and facilitate management of user data could reduce a great deal of labor and expense by helping users carry
out the apparently common tasks of reorganizing and rescaling their data.
Undertake region-specific analyses of city needs, gaps in data and tools, and potential strategies, part-
nerships, and knowledge-sharing opportunities, as well as the specific support and guidance required. Creating
user communities and peer-to-peer environments will not only drive better feedback and more actionable data,
but facilitate innovation and solutions at-scale.
22
Ongoing work will continue to refine our understanding of how existing tools and resources are being used, by
reaching out to user communities via the regional and national covenants. This feedback will help to optimize
tool recommendations via the resource library. Moreover, our experience with assessing the landscape of miti-
gation-focused data and tools will help us broaden the scope of future exercises, with the aim of exploring climate adaptation and other data entry points (e.g. air quality, energy access, finance) to address resil-
ience and foster green recovery strategies.
Fitting in. As tools remain a means to deploying, accelerating, and scaling up action across the journey - not
goals in themselves - it is important to better understand their use and role in the local policymaking process
to ensure they deliver optimal, actionable outputs. The creation of user communities can also help to create
feedback loops and standardize approaches.
Recommendations for funders and tool providers
As climate action plans are often part of a broad city vision or green recovery strategy and require a wide
variety of stakeholders, GCoM and its network partners can help tackle this complexity, support cross-sectoral
and cross-stakeholder programmes, and catalyze the development of bankable projects based on tool outputs.
Collecting the feedback on these complementary resources and initiatives will allow us to initiate a dialogue and
steer funders and tool providers to where gaps are not yet bridged, where tools not yet meet users’ evolving
needs, which opportunities require urgent attention, and which levers should be put in place to better integrate
tools in the policy making process. It will also allow us to better assess where capacity building is needed, where
dashboards can keep better track of whether action outputs deliver the planned policy outcomes, where educa-
tion needs to be put in place or new skills to be trained for new jobs that will be created in developing the resilient
climate neutral cities of the future.
Cities and their network partners have identified the following key improvement opportunities for existing tools:
► Simplification of existing tools to lower barriers to use (e.g. better proxy data, simplifying outputs to
align with reporting frameworks, cost)
► Integration of climate planning/decision support tools into overarching city strategy planning (e.g. to
link to multiple benefits)
► More investment in ongoing, longer-term maintenance for tools & ability to meet evolving user needs
► Providing guidance and support to staff skill and capacity via coaching, trainings and technical as-
sistance to help them better understand how data and tools can render the most optimal return and how
23
they can best be integrated in daily operations
► Facilitating effective engagement through a community of practice (e.g. train-the-trainer opportunities)
City practitioners and tool users, convened in part through the GCoM alliance, could be involved to test new and adapted tools as they can provide:
► User experience to validate use cases and test new functionalities
► Insights via a developer-user ‘matchmaking’ space that can help maintaining tools via review, evalu-
ation, and update processes
► Support in reinforcing data and tool value through:
► A collaborative process for generating new insights and developing a roadmap to further structure
the tool landscape, moving to a more service-oriented approach;
► Complementing tools with the required data (quality) and complementary strategies, instruments,
funding mechanisms and initiatives;
► Focusing on specific regional needs in dialogue with GCoM Regional/National Covenants
► Co-developing use and business cases, platforms and standards on data and tools
► Tracking the tool journey and history of users - and gain insight on their evolution
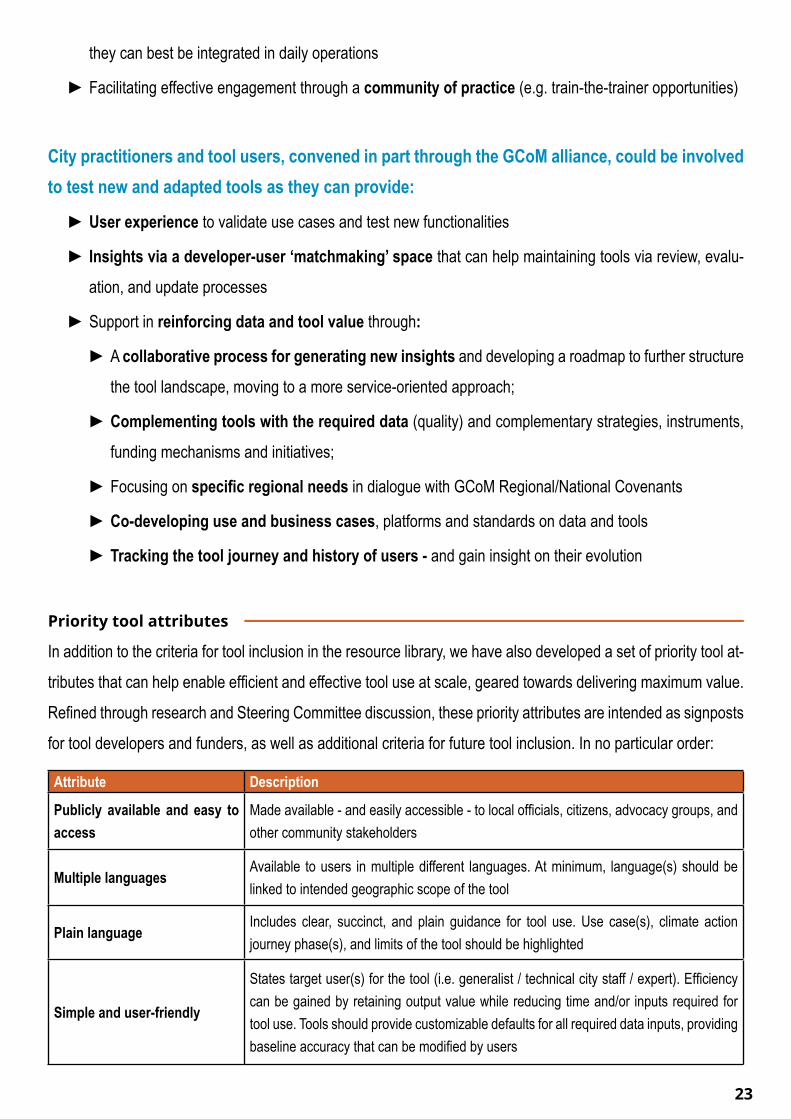
Priority tool attributes
In addition to the criteria for tool inclusion in the resource library, we have also developed a set of priority tool at-
tributes that can help enable efficient and effective tool use at scale, geared towards delivering maximum value.
Refined through research and Steering Committee discussion, these priority attributes are intended as signposts
for tool developers and funders, as well as additional criteria for future tool inclusion. In no particular order:
Attribute Description
Publicly available and easy to access
Made available - and easily accessible - to local officials, citizens, advocacy groups, and other community stakeholders
Multiple languagesAvailable to users in multiple different languages. At minimum, language(s) should be linked to intended geographic scope of the tool
Plain languageIncludes clear, succinct, and plain guidance for tool use. Use case(s), climate action journey phase(s), and limits of the tool should be highlighted
Simple and user-friendly
States target user(s) for the tool (i.e. generalist / technical city staff / expert). Efficiency can be gained by retaining output value while reducing time and/or inputs required for tool use. Tools should provide customizable defaults for all required data inputs, providing baseline accuracy that can be modified by users

24
LongevityDesigned for long-term availability and relevance, with on-going maintenance and regular updates
Tested Thoroughly and robustly practitioner-tested to ensure needs are met
ModularAllows individual users to updated data inputs and assumptions without need for whole tool update
Integration & connectivitySupports integration of climate-focused tools with city information structures (e.g. API access)
Comments, questions, and suggestions on the Decision-making and Tools Project can be directed to:
Jorn VerbeeckHead of Research & InnovationGlobal Covenant of Mayors for Climate & Energy (GCoM)[email protected]
Contact information
Benjamin Jance IVStrategy and Operations OfficerGlobal Covenant of Mayors for Climate & Energy (GCoM)[email protected]

25
Term Description
City interviews
Complementary to the City Survey, interviews conducted with 58 cities across all 13 GCoM Regional/National Covenants to better understand where cities are in their climate action journey, the greatest challenges preventing progress, external supports or internal structure changes needed, and how data/tools are being used
City survey
A survey of 292 cities from 56 countries representing more than 191 million people, con-ducted from February-June 2020, to understand the challenges facing cities along the climate action journey, priorities stakeholders face, and how data and tools are being used to inform decision-making
Decision-making and Tools Journey
A modified version of the GCoM City Journey, with greater emphasis on the climate pol-icymaking process
GCoM City JourneyA visual representation of key steps in the city climate action journey, combining the policymaking cycle with the data, resources, and initiatives available to cities from making a commitment to implementation and review
Project Core TeamThe Core Team consists of three organizations: the GCoM Global Secretariat, Bloomberg Associates, and World Resources Institute. See Annex B for a full list
Steering CommitteeThe individuals and partner organizations convened by the GCoM Secretariat to discuss, evaluate, and build on the findings of the research of the Project Core Team. See Annex B for a full list
Suitability and availability cri-teria (for tools)
The criteria upon which tools should be evaluated for inclusion in the GCoM Tool Library. Suitability refers to relevance, legitimacy, and usefulness, while availability refers to pub-lic access
TaxonomyThe organization of tool input and output variables into a nested, hierarchical set-up of 1860 terms (at time of writing). Facilitates understanding of tool connections, connections between tools and needs, and the landscape of which needs are met (or not) by tools
ToolAny instrument, application, and algorithm that better informs decision making, especially around planning, service provision, and regulatory assessments and leads to more effec-tive public policy for cities and local governments.
TaxonomyThe organization of tool input and output variables into a nested, hierarchical set-up of 1860 terms (at time of writing). Facilitates understanding of tool connections, connections between tools and needs, and the landscape of which needs are met (or not) by tools
Tool input Data is used by a tool to calculate outputs
Tool output Data that is the result of tool calculations based on inputs and assumptions
Annex A. Glossary of Terms
26
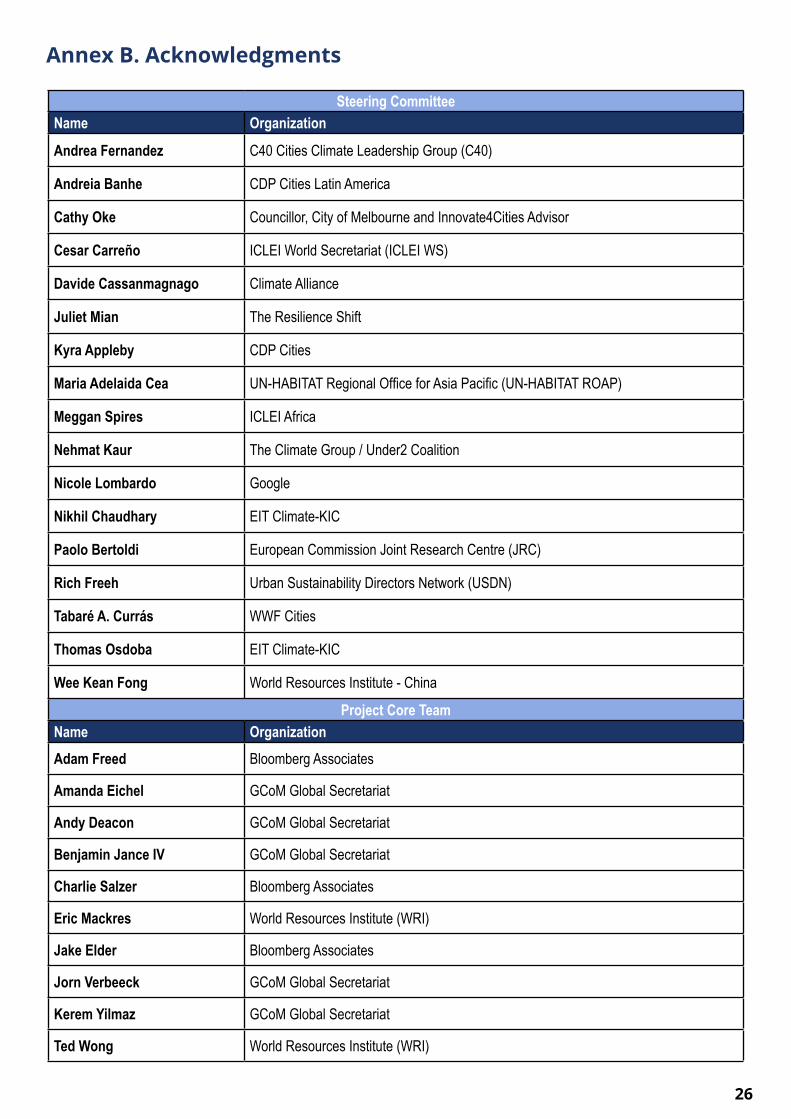
Annex B. Acknowledgments
Steering CommitteeName Organization
Andrea Fernandez C40 Cities Climate Leadership Group (C40)
Andreia Banhe CDP Cities Latin America
Cathy Oke Councillor, City of Melbourne and Innovate4Cities Advisor
Cesar Carreño ICLEI World Secretariat (ICLEI WS)
Davide Cassanmagnago Climate Alliance
Juliet Mian The Resilience Shift
Kyra Appleby CDP Cities
Maria Adelaida Cea UN-HABITAT Regional Office for Asia Pacific (UN-HABITAT ROAP)
Meggan Spires ICLEI Africa
Nehmat Kaur The Climate Group / Under2 Coalition
Nicole Lombardo Google
Nikhil Chaudhary EIT Climate-KIC
Paolo Bertoldi European Commission Joint Research Centre (JRC)
Rich Freeh Urban Sustainability Directors Network (USDN)
Tabaré A. Currás WWF Cities
Thomas Osdoba EIT Climate-KIC
Wee Kean Fong World Resources Institute - China
Project Core TeamName OrganizationAdam Freed Bloomberg Associates
Amanda Eichel GCoM Global Secretariat
Andy Deacon GCoM Global Secretariat
Benjamin Jance IV GCoM Global Secretariat
Charlie Salzer Bloomberg Associates
Eric Mackres World Resources Institute (WRI)
Jake Elder Bloomberg Associates
Jorn Verbeeck GCoM Global Secretariat
Kerem Yilmaz GCoM Global Secretariat
Ted Wong World Resources Institute (WRI)
27
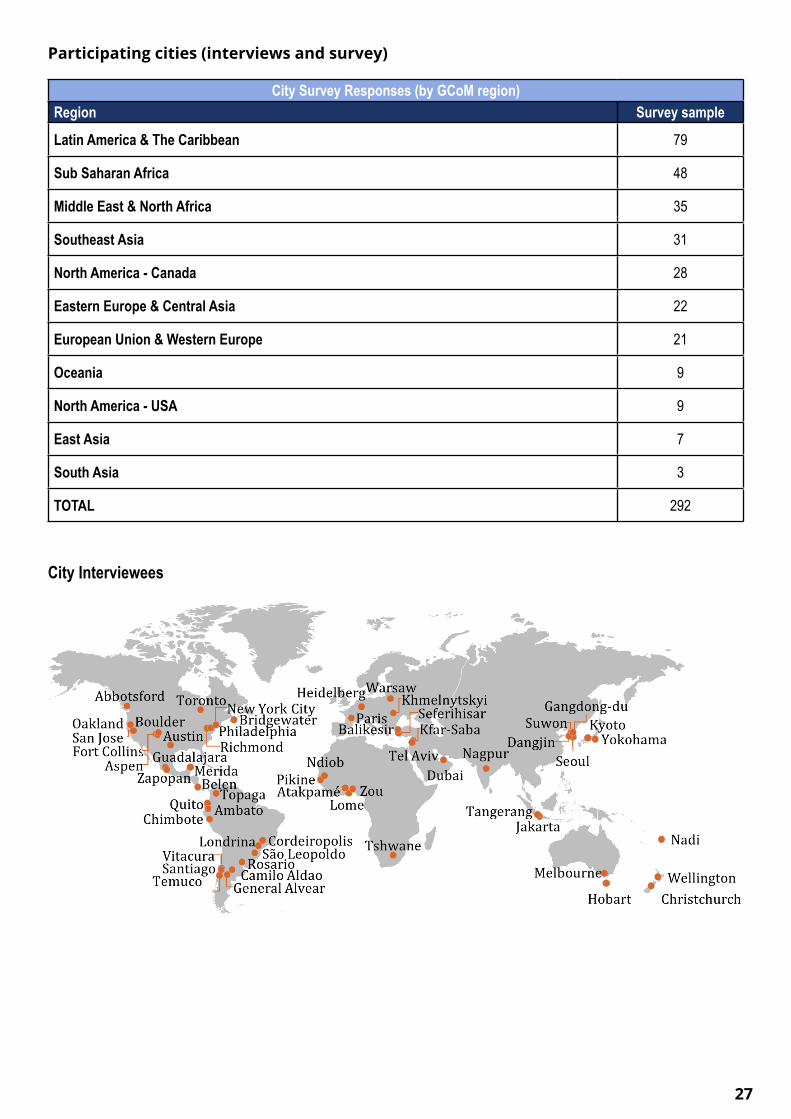
Participating cities (interviews and survey)
City Survey Responses (by GCoM region)Region Survey sample
Latin America & The Caribbean 79
Sub Saharan Africa 48
Middle East & North Africa 35
Southeast Asia 31
North America - Canada 28
Eastern Europe & Central Asia 22
European Union & Western Europe 21
Oceania 9
North America - USA 9
East Asia 7
South Asia 3
TOTAL 292
City Interviewees
DRAFT
Appendix
City Interview Participants
Latin America & The Caribbean 79Sub Saharan Africa 48North America 37Middle East & North Africa 35Southeast Asia 31Eastern Europe & Central Asia 22European Union & Western Europe 21Oceania 9East Asia 7South Asia 3Total 292
City Survey Responses

28
Annex C. Inventory of 59 tools proposed for initial inclusionTool Name Provider NameA Community-Level GHG Inventory for Local Government Units in the Philippines
Climate Change Commission, Philippines
Action Selection and Prioritisation Tool (ASAP) C40 Cities
Adaptation and Mitigation Integration Assessment Tool (AMIA) C40 Cities
AKSARA BAPPENAS (Indonesia)
Anaerobic Digester Project Screening Tool (AD-PST) Climate and Clean Air Coalition
Avoided Emissions and Generation Tool (AVERT) US EPA
Benchmarking and Energy Saving Tool for Low Carbon Cities (BEST Cities)Lawrence Berkeley Lab, US Dept of Energy
Biogas Wastewater Assessment Technology Tool (BioWATT) Global Methane Initiative
City Building Energy Saver (CityBES)Lawrence Berkeley Lab, US Dept of Energy
City Inventory Reporting and Information System (CIRIS) C40 Cities
City Performance Tool (CyPT) Siemens
CityLED Tool ESMAP, World Bank
Clean Energy Energy Emission Reduction Tool (CLEER) USAID
ClearPath ICLEI USA
Climate Action for Urban Sustainability (CURB) World Bank
Climate Policy Database New Climate Institute
ClimateView ClimateView
Co-Benefits Calculator for TransportInstitute for Global Environmental Strategies
Co-Benefits Risk Assessment Screening and Mapping Tool (COBRA) US EPA
Data Portal for Cities GCoM; WRI
Eco and Low-carbon Indicator Tool for Evaluating Cities (ELITE Cities)Lawrence Berkeley Lab, US Dept of Energy
Emission Quantification Tool for Estimation of GHGs/SLCPs from Solid Waste Sector (EQT)
Climate and Clean Air Coalition
Energy Performance and Carbon Emissions Assessment and Monitoring (ECAM)
Water and Wastewater Companies for Climate Mitigation
Environmental Benefits Mapping and Analysis Program, Community Edition (BenMAP-CE)
US EPA
Environmental Insights Explorer (EIE) Google
Futureproofed Futureproofed

29
GHG Contribution Analysis Tool ICLEI USA
Global Solar Atlas ESMAP, World Bank
Global Wind Atlas ESMAP, World Bank
Harmonized Emissions Analysis Tool (HEAT+) ICLEI
Impact analysis: air quality benefits C40 Cities
Impact analysis: congestion pricing C40 Cities
Impact analysis: cool roofs initiatives C40 Cities
Impact analysis: deep building retrofits for cold climates C40 Cities
Impact analysis: improved waste collection and segregation C40 Cities
Impact analysis: walking and cycling C40 Cities
Job and Economic Development Impact Model (JEDI): International NREL, US Dept of Energy
Klimaschutz-Planer Climate Alliance
Landfill Gas Project Screening Tool Climate and Clean Air Coalition
Local Clean Energy Self-Scoring Tool ACEEE
Local Energy Efficiency Policy Calculator (LEEP-C) 2.0 ACEEE
Local Greenhouse Gas Inventory Tool US EPA
Long-Range Energy Alternatives Planning System (LEAP) SEI
Marginal Abatement Cost Tool (MACTool) ESMAP, World Bank
Motor Vehicle Emissions Simulator (MOVES) US EPA
OrganEcs Climate and Clean Air Coalition
Partners for Climate Protection (PCP) Milestone ToolFederation of Canadian Municipalities
Renewable Energy and Energy Efficiency Technology Screen (RETScreen) Natural Resources Canada
SCATTERNottingham City Council; Anthesis Group
Scenario 360 City Explained, Inc.
SIGN-SMARTMinistry of Environment and Forestry, Indonesia
Snapshot Snapshot
Solid Waste Emissions Estimation Tool 3.0 (SWEET) Climate and Clean Air Coalition
System Advisor Model (SAM) NREL
30
Tool for Rapid Assessment of City Energy 2.0 (TRACE) ESMAP, World Bank
Uber Movement Uber
Urban Form Rapid Assessment Model (Urban-RAM)Lawrence Berkeley Lab, US Dept of Energy
Vertically Integrated Action Tool (VIA) C40 Cities
Waste Reduction Model (WARM) US EPA
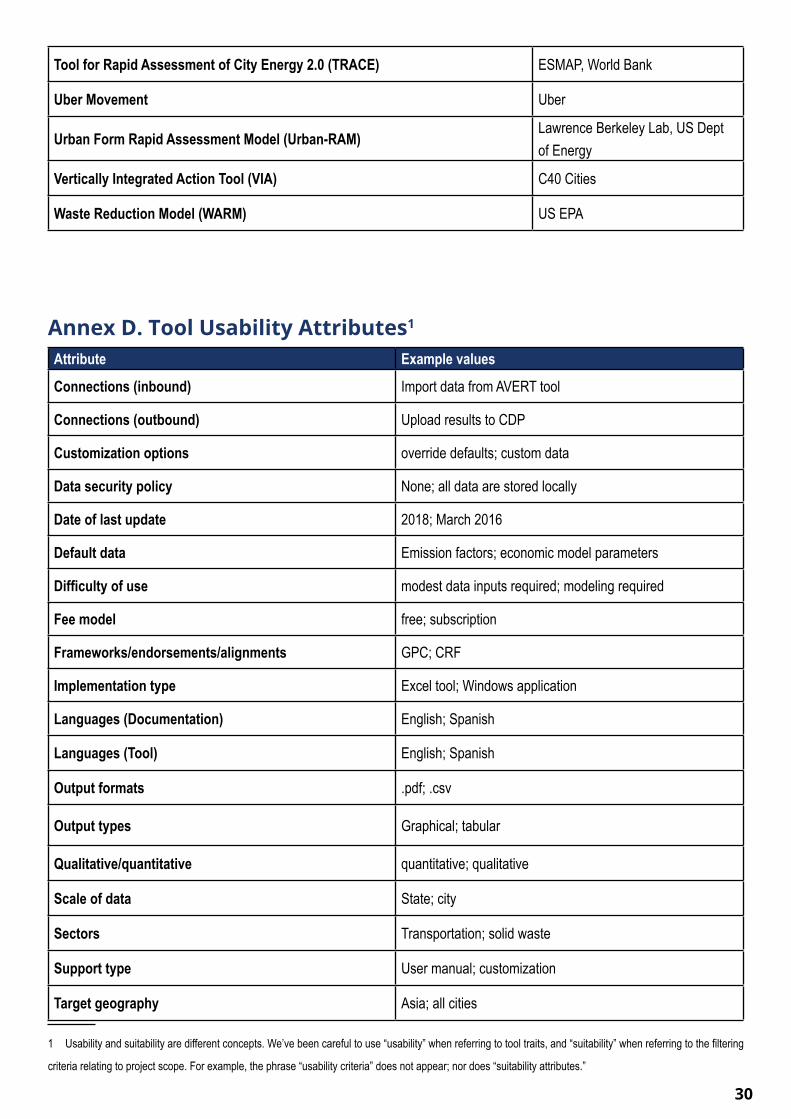
Annex D. Tool Usability Attributes1
Attribute Example values
Connections (inbound) Import data from AVERT tool
Connections (outbound) Upload results to CDP
Customization options override defaults; custom data
Data security policy None; all data are stored locally
Date of last update 2018; March 2016
Default data Emission factors; economic model parameters
Difficulty of use modest data inputs required; modeling required
Fee model free; subscription
Frameworks/endorsements/alignments GPC; CRF
Implementation type Excel tool; Windows application
Languages (Documentation) English; Spanish
Languages (Tool) English; Spanish
Output formats .pdf; .csv
Output types Graphical; tabular
Qualitative/quantitative quantitative; qualitative
Scale of data State; city
Sectors Transportation; solid waste
Support type User manual; customization
Target geography Asia; all cities
1 Usability and suitability are different concepts. We’ve been careful to use “usability” when referring to tool traits, and “suitability” when referring to the filtering
criteria relating to project scope. For example, the phrase “usability criteria” does not appear; nor does “suitability attributes.”

31
Annex E. Data Taxonomy - first two levels
Annex F. City Typology Approaches
To arrive at the identified typologies for this project, we tested a variety of approaches known to practitioners and
experts. This included a review of existing typologies for their potential applicability and testing a quantitative
method to develop a new set - before ultimately deciding to use a qualitative approach. Additional details:
► Utilize existing typology - surveyed existing typology frameworks for their applicability for this exercise.
We found existing frameworks to be economics- and megacity-focused (i.e., Redefining Global Cities),
and action-oriented (i.e., Focused Acceleration).
► Develop new typology, quantitative – developed a set of indicators based on city capacity and gover-
nance. Faced issues populating this information with available data.
► Develop new typology, qualitative – utilized the same factors as mentioned above yet took a qualitative
approach by using the information we learned from interviews.
Simplified tool inputs and outputs
23
actions activity context estimate projectinformation relating to policies and programs that are the current focus of planning
societal activities directly generating GHG emissions
background information relevant to climate action
impacts of current activities and proposed projects
specific information describing project scenarios
Simplifying all tool inputs/outputs to the first two levels in the data taxonomy…
• action indicators• action priorities• comparison to
benchmark• policy
development• priorities and
impacts• targets and goals• implementation
level
• energy• solid waste• stationary• transportation• wastewater• agriculture and
land management• community• energy industries• industry• infrastructure• potable water• sludge
management• vegetable oil
consumption
• buildings• climate• site suitability• behavior• costs• degree of control• economic• emission factors• energy• environment• equity• goals• government
capacity• households• housing• infrastructure
• planning• risk analysis• specifications• context• finance
• actions• attribution• avoided emissions• avoided impact• buildings• changed costs• cost-benefit ratio• costs• economic• emissions• energy• environment• equity• facility performance• finance• infrastructure• mitigation cost curve
• process output• project
requirements• public health• sensitivity• transportation• uncertainty• air quality
• land area• land use• location• policies and
programs• population• prices• priorities• public health• sector
improvement potential
• social• solid waste• transportation• utilities• wastewater
Variables that are available as tool outputs are darkerInput-only variables are lighter
32
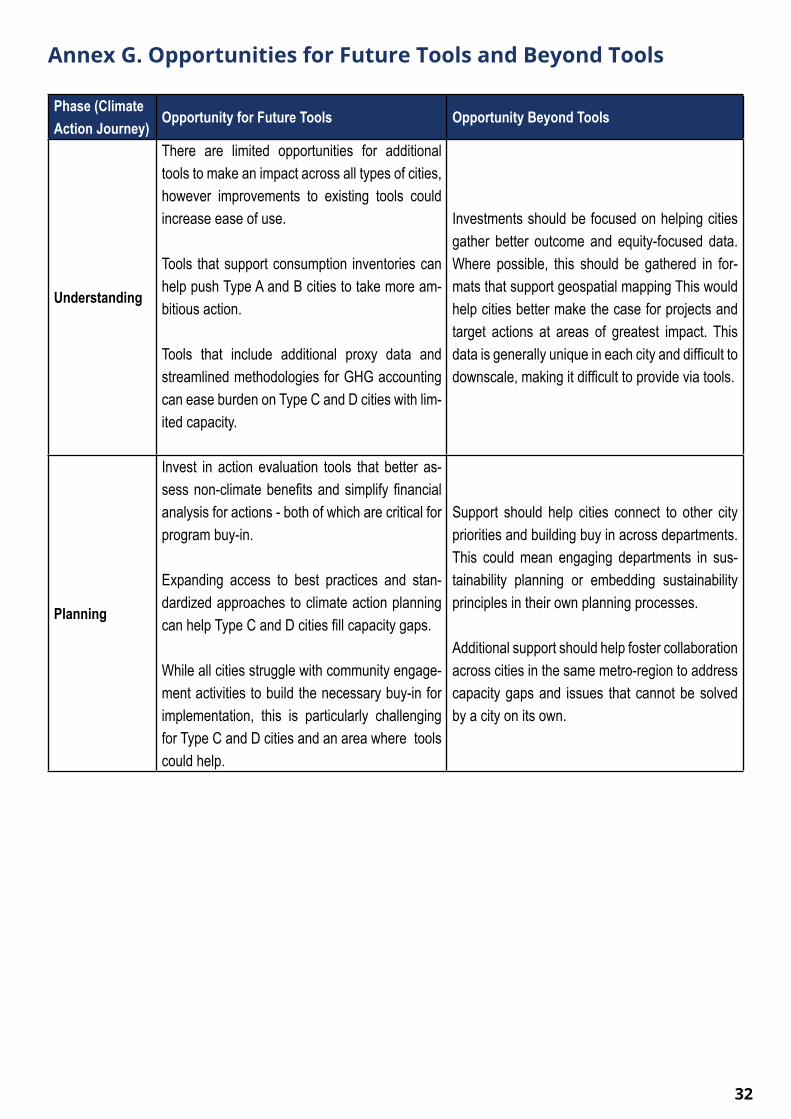
Annex G. Opportunities for Future Tools and Beyond Tools
Phase (Climate Action Journey)
Opportunity for Future Tools Opportunity Beyond Tools
Understanding
There are limited opportunities for additional tools to make an impact across all types of cities, however improvements to existing tools could increase ease of use.
Tools that support consumption inventories can help push Type A and B cities to take more am-bitious action.
Tools that include additional proxy data and streamlined methodologies for GHG accounting can ease burden on Type C and D cities with lim-ited capacity.
Investments should be focused on helping cities gather better outcome and equity-focused data. Where possible, this should be gathered in for-mats that support geospatial mapping This would help cities better make the case for projects and target actions at areas of greatest impact. This data is generally unique in each city and difficult to downscale, making it difficult to provide via tools.
Planning
Invest in action evaluation tools that better as-sess non-climate benefits and simplify financial analysis for actions - both of which are critical for program buy-in.
Expanding access to best practices and stan-dardized approaches to climate action planning can help Type C and D cities fill capacity gaps.
While all cities struggle with community engage-ment activities to build the necessary buy-in for implementation, this is particularly challenging for Type C and D cities and an area where tools could help.
Support should help cities connect to other city priorities and building buy in across departments. This could mean engaging departments in sus-tainability planning or embedding sustainability principles in their own planning processes.
Additional support should help foster collaboration across cities in the same metro-region to address capacity gaps and issues that cannot be solved by a city on its own.

33
Executing
While some tools support individual project de-velopment and evaluation, they could be simpli-fied and made less time intensive.
These tools could also be expanded to support specific sectors, particularly around multi-modal transportation planning, and tool use cases, par-ticularly for geospatial mapping.
Across all relevant departments, additional effort can be paid into embedding sustainability and cli-mate into Director-level job descriptions, recruit-ment efforts, and evaluation processes.
In addition to efforts to address financing gaps, engaging CFOs in a proactive manner could be a first step to shifting city financial systems (in addition to promoting more innovative steps like carbon budgets or internal carbon taxes).
Investments in department-level staff can ensure ownership for individual projects to bring efforts from concept to reality.
Targeted efforts can mobilize climate action di-rectly in Transportation, Planning, and Buildings departments and can focus on building metropol-itan-level partnerships/ coalitions of cities in the same metro-region.
Monitoring
It is unclear how much of this could be supported by tools in a standardized manner. Tools could help cities automate data collection or translate a specific data set into more tangible outcomes (e.g., turning kWh savings into dollar savings).
Strengthening commitments from the private sec-tor and building better partnerships with key com-munity stakeholders (e.g., utilities, regional transit networks, state departments of transportation, universities) could make it easier to access data.
As most cities lack the ability to do robust assess-ment of policies and test potential refinements, this is a possible opportunity for other partners to help determine what’s worked and how it could be more impactful.
Communicating
Any new investments in tools should pay par-ticular attention to the outputs they produce to ensure they support external communication.
Existing tools could also be better tweaked to align with reporting frameworks or produce easy to use visuals.
This is particularly important for Type C and D cities, which have less capacity to focus on sto-rytelling and may have less communications ex-pertise within city government.
Developing standard playbooks of ways to com-municate resident impact or highlight programs could provide some best practices and templates cities can leverage (e.g., “climate communica-tions toolkit”).
Investments around non-climate and equity data from other phases could also help change the narrative with the public.
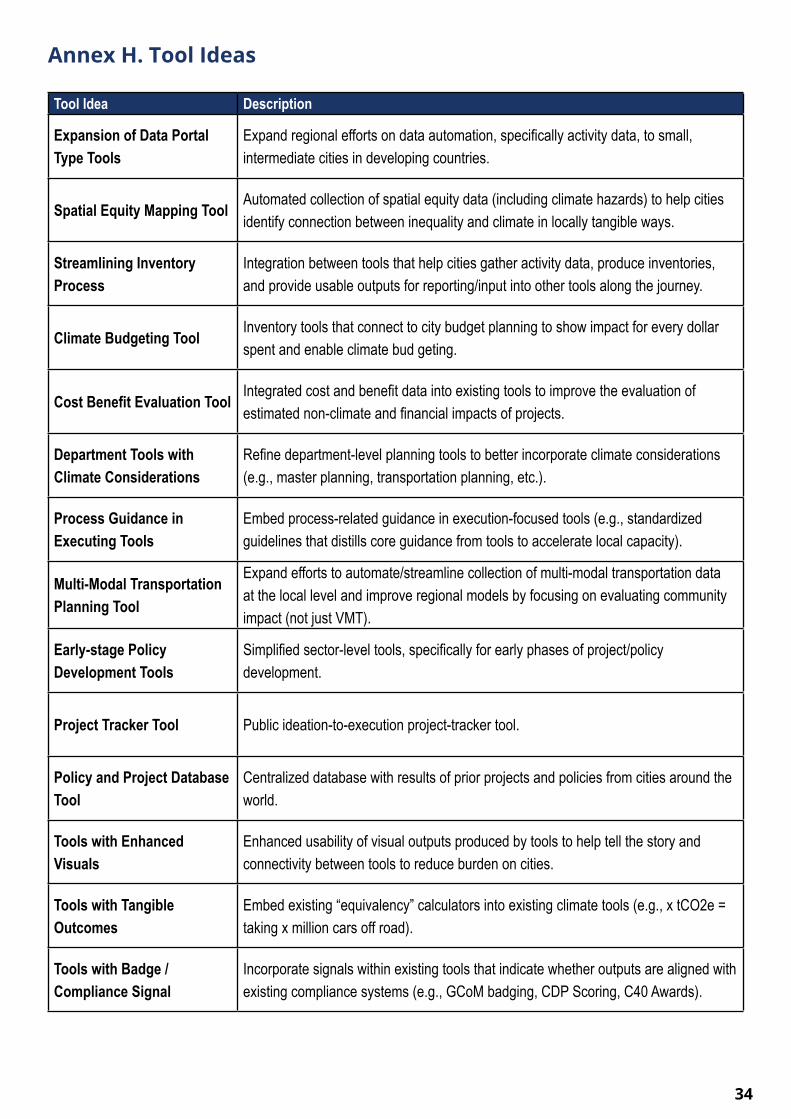
34
Annex H. Tool Ideas
Tool Idea Description
Expansion of Data Portal Type Tools
Expand regional efforts on data automation, specifically activity data, to small, intermediate cities in developing countries.
Spatial Equity Mapping Tool Automated collection of spatial equity data (including climate hazards) to help cities identify connection between inequality and climate in locally tangible ways.
Streamlining Inventory Process
Integration between tools that help cities gather activity data, produce inventories, and provide usable outputs for reporting/input into other tools along the journey.
Climate Budgeting Tool Inventory tools that connect to city budget planning to show impact for every dollar spent and enable climate bud geting.
Cost Benefit Evaluation Tool Integrated cost and benefit data into existing tools to improve the evaluation of estimated non-climate and financial impacts of projects.
Department Tools with Climate Considerations
Refine department-level planning tools to better incorporate climate considerations (e.g., master planning, transportation planning, etc.).
Process Guidance in Executing Tools
Embed process-related guidance in execution-focused tools (e.g., standardized guidelines that distills core guidance from tools to accelerate local capacity).
Multi-Modal Transportation Planning Tool
Expand efforts to automate/streamline collection of multi-modal transportation data at the local level and improve regional models by focusing on evaluating community impact (not just VMT).
Early-stage Policy Development Tools
Simplified sector-level tools, specifically for early phases of project/policy development.
Project Tracker Tool Public ideation-to-execution project-tracker tool.
Policy and Project Database Tool
Centralized database with results of prior projects and policies from cities around the world.
Tools with Enhanced Visuals
Enhanced usability of visual outputs produced by tools to help tell the story and connectivity between tools to reduce burden on cities.
Tools with Tangible Outcomes
Embed existing “equivalency” calculators into existing climate tools (e.g., x tCO2e = taking x million cars off road).
Tools with Badge / Compliance Signal
Incorporate signals within existing tools that indicate whether outputs are aligned with existing compliance systems (e.g., GCoM badging, CDP Scoring, C40 Awards).