A Day in the Life of the Hudson River (Snapshot Day) Sponsored by the Hudson River Estuary Program...
39
A A Day Day in the Life of in the Life of the Hudson River the Hudson River (Snapshot Day) (Snapshot Day) Sponsored by the Hudson River Estuary Program Sponsored by the Hudson River Estuary Program of the New York State Department of Environmental of the New York State Department of Environmental Conservation Conservation in partnership with the in partnership with the Lamont-Doherty Earth Observatory of Columbia University Lamont-Doherty Earth Observatory of Columbia University
-
Upload
richard-dawson -
Category
Documents
-
view
220 -
download
0
Transcript of A Day in the Life of the Hudson River (Snapshot Day) Sponsored by the Hudson River Estuary Program...
A A DayDay in the Life of the in the Life of the Hudson RiverHudson River
(Snapshot Day)(Snapshot Day)
Sponsored by the Hudson River Estuary Program Sponsored by the Hudson River Estuary Program
of the New York State Department of Environmental Conservationof the New York State Department of Environmental Conservation
in partnership with thein partnership with the
Lamont-Doherty Earth Observatory of Columbia UniversityLamont-Doherty Earth Observatory of Columbia University

This is the Hudson River This is the Hudson River estuaryestuary
The Hudson River Estuary is The Hudson River Estuary is 153 River Miles long 153 River Miles long
RM 153 is at the Troy dam, RM RM 153 is at the Troy dam, RM 0 is at the very bottom of 0 is at the very bottom of Manhattan. Below that is New Manhattan. Below that is New York Harbor and the New York York Harbor and the New York ““bightbight””
There are many other groups There are many other groups in the estuary today doing in the estuary today doing just what you are doing - even just what you are doing - even a few above the Troy Dam! a few above the Troy Dam!
Hundreds of students are Hundreds of students are participating - all grades & participating - all grades & agesages
Here is where we are in New York State!
E
S
T
U
A
R
Y
New York CityNew York City
Troy Troy RM RM 153153
NewburghNewburgh RM 60RM 60
PoughkeepsiPoughkeepsie RM 75e RM 75
Cohotate Cohotate RM 118RM 118
Croton Point Croton Point RM 35RM 35
Piermont Piermont RM 25RM 25
Atlantic Atlantic OceanOcean
Ulster Ulster Landing Landing RM 97RM 97
StateStaten n IslanIslandd
Jamaica BayJamaica Bay
Use the map to find your site on the river
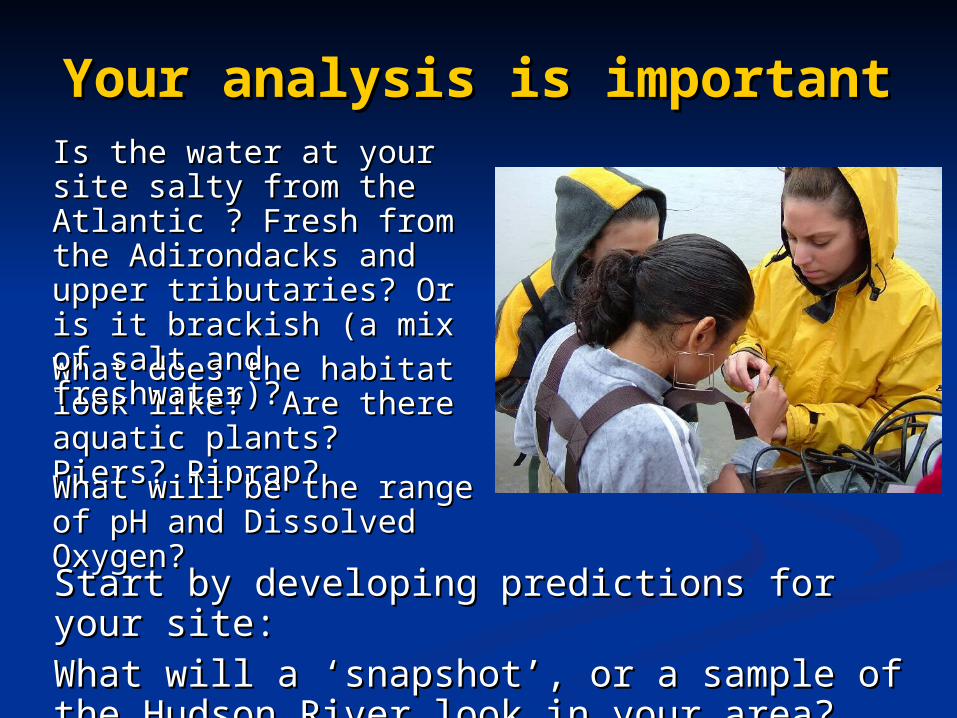
Your analysis is importantYour analysis is important
Start by developing predictions for your site:Start by developing predictions for your site:What will a What will a ‘‘snapshotsnapshot’’, or a sample of the , or a sample of the Hudson River look in your area?Hudson River look in your area?
What does the habitat What does the habitat look like? Are there look like? Are there aquatic plants? Piers? aquatic plants? Piers? Riprap? Riprap? What will be the range of What will be the range of pH and Dissolved pH and Dissolved Oxygen?Oxygen?
Is the water at your site Is the water at your site salty from the Atlantic ? salty from the Atlantic ? Fresh from the Fresh from the Adirondacks and upper Adirondacks and upper tributaries? Or is it tributaries? Or is it brackish (a mix of salt brackish (a mix of salt and freshwater)? and freshwater)?
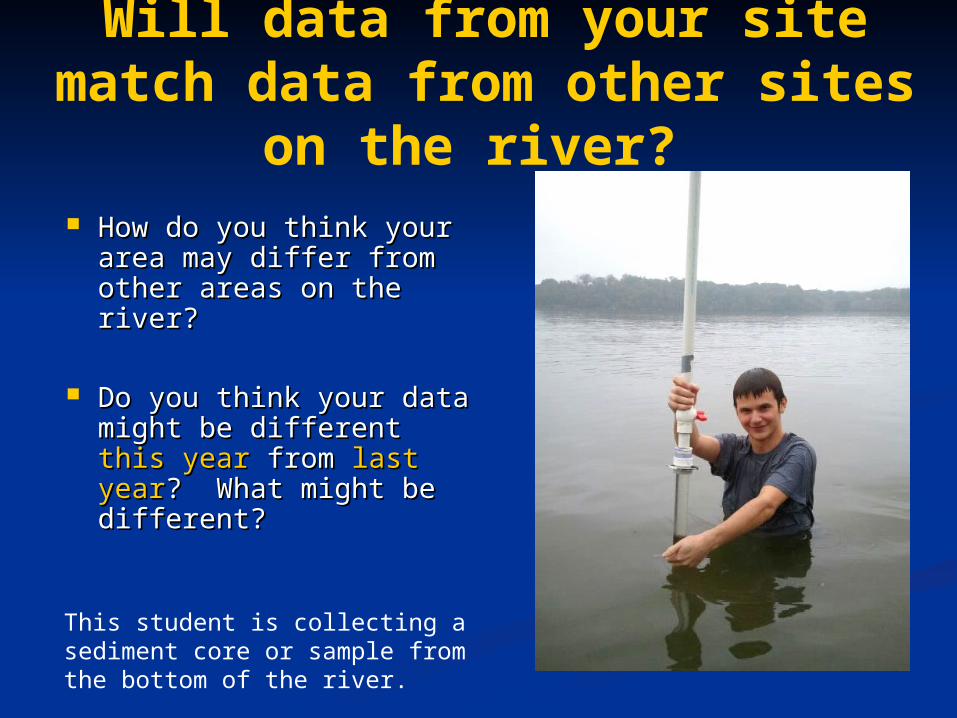
Will data from your site match data from other sites
on the river? How do you think your How do you think your
area may differ from area may differ from other areas on the river? other areas on the river?
Do you think your data Do you think your data might be different might be different this this yearyear from from last yearlast year? ? What might be different?What might be different?
This student is collecting a sediment core or sample from the bottom of the river.

You will be collecting You will be collecting data and comparing data and comparing your predictions to:your predictions to:Current data YOU collect Current data YOU collect Current data collected by Current data collected by students at OTHER sites students at OTHER sites Prior data from the Prior data from the EARLIER years EARLIER years www.ldeo.columbia.edu/dayinthelifeThe HRECOS real time The HRECOS real time monitoring system monitoring system www.hrecos.org//
Looking for TRENDS & Looking for TRENDS & learning about a learning about a
SYSTEMSYSTEM* Trends show patterns over * Trends show patterns over timetime* Systems show * Systems show relationshipsrelationships
These students are using a seine net to catch fish in the Hudson.
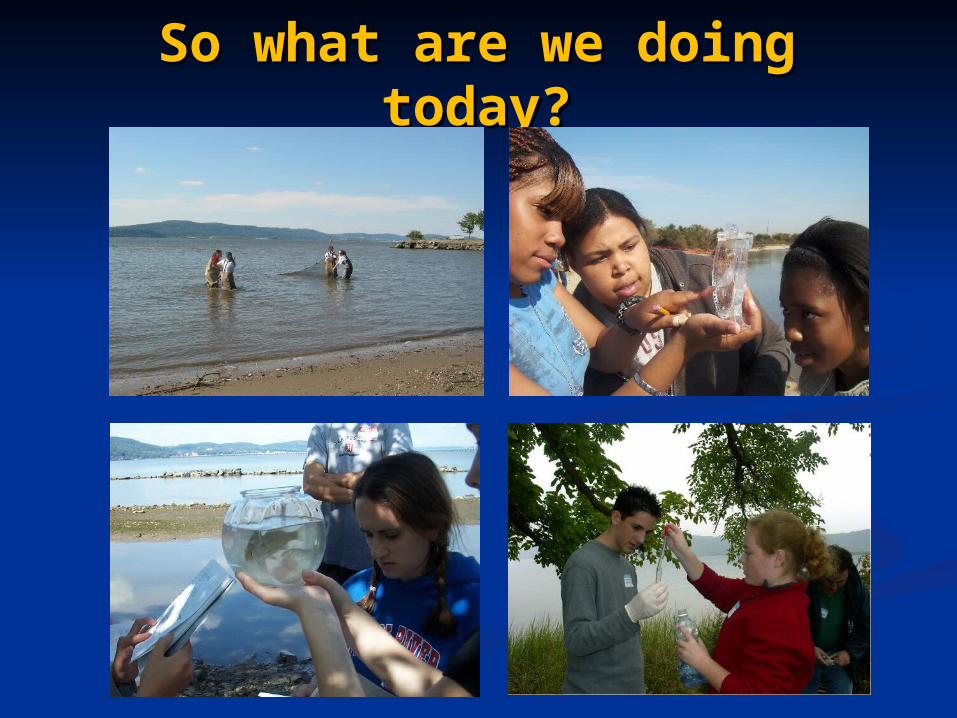
So what are we doing So what are we doing today?today?
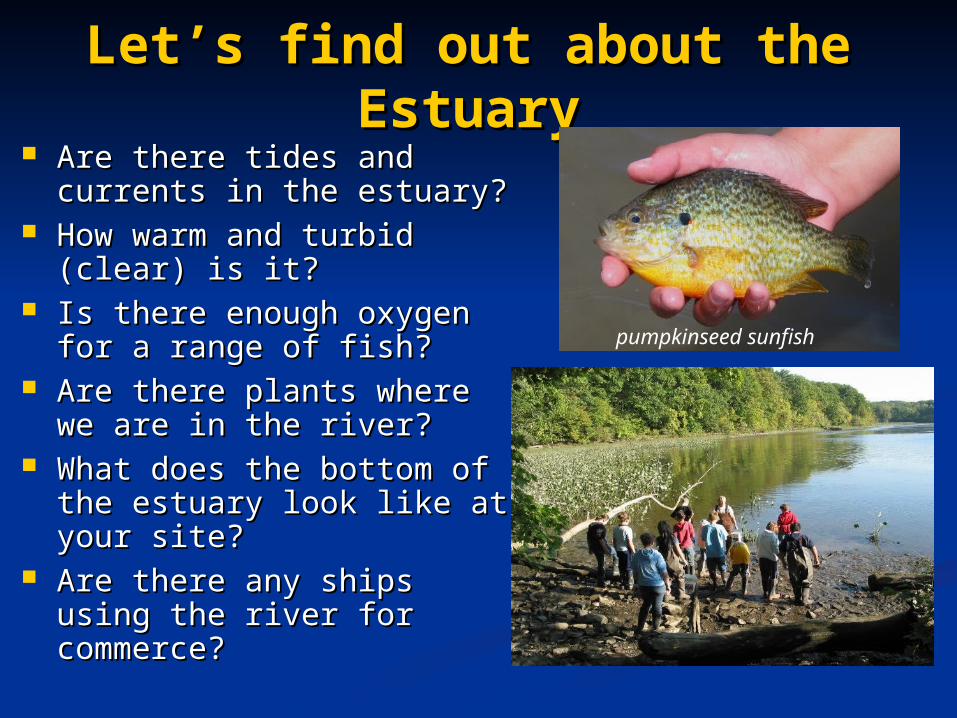
LetLet’’s find out about the s find out about the EstuaryEstuary
Are there tides and Are there tides and currents in the estuary?currents in the estuary?
How warm and turbid How warm and turbid (clear) is it?(clear) is it?
Is there enough oxygen for Is there enough oxygen for a range of fish?a range of fish?
Are there plants where we Are there plants where we are in the river? are in the river?
What does the bottom of What does the bottom of the estuary look like at the estuary look like at your site?your site?
Are there any ships using Are there any ships using the river for commerce?the river for commerce?
pumpkinseed sunfish

TideTidessCan a river have tides? Aren’t tides just in the
ocean?
Tides make the water Tides make the water level in the ocean rise level in the ocean rise and fall. In a river that is and fall. In a river that is flat and open to the sea, flat and open to the sea, like the Hudson, these like the Hudson, these ocean tides make the ocean tides make the river water rise and fall river water rise and fall too. too.
We will see if the tide is We will see if the tide is rising or falling by rising or falling by measuring the height of measuring the height of the water every half hour.the water every half hour.
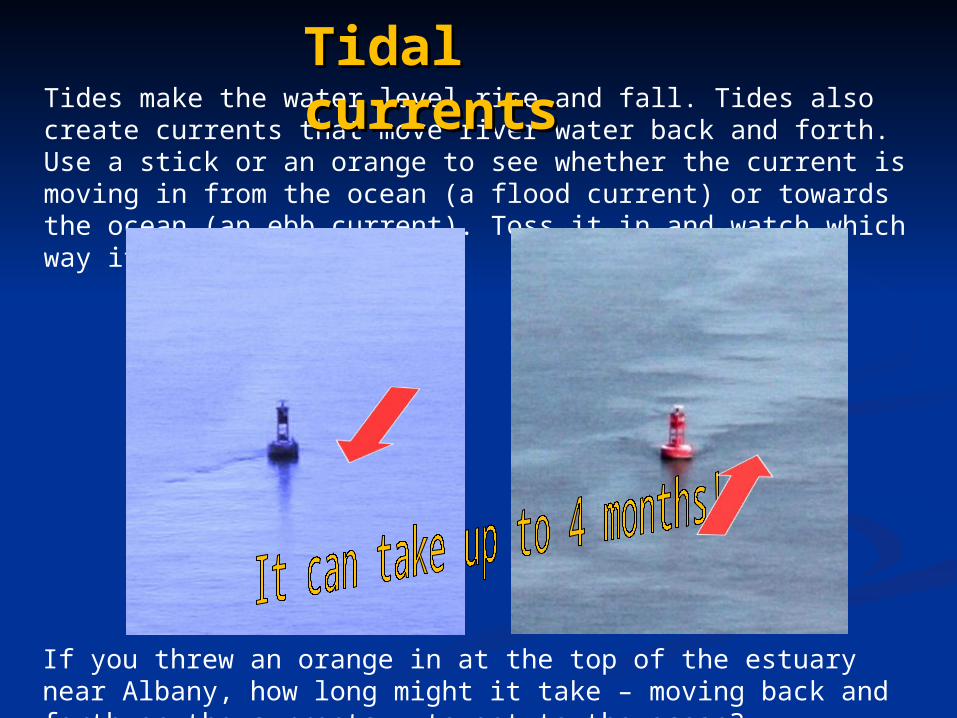
Tides make the water level rise and fall. Tides also create currents that move river water back and forth. Use a stick or an orange to see whether the current is moving in from the ocean (a flood current) or towards the ocean (an ebb current). Toss it in and watch which way it moves.
Tidal Tidal currentscurrents
If you threw an orange in at the top of the estuary near Albany, how long might it take – moving back and forth on the currents – to get to the ocean?

Rivers tend to run ONE direction - from their source to where they meet a larger water body. The Hudson River flows TWO ways - in fact the Native people called it Muhheakantuck - “river that flows both ways.”
The Hudson runs both down from Lake Tear of the Clouds in the Adirondacks AND in from the Atlantic Ocean due to tides. How do fish know which way to
go?
MuhheahkantMuhheahkantuckuck

The Hudson River Almanac reported a story of the river that flows both ways.
A bottle was collected at RM 18 September 3 and was found to have been thrown in at RM 34 July 18…45 days to travel 16 miles!
On average, how far south did the bottle travel each day?
(Source: Hudson River Almanac 9/3/04-9/10/04)
Notice we said travel “south.” The total distance traveled would be more. Why?
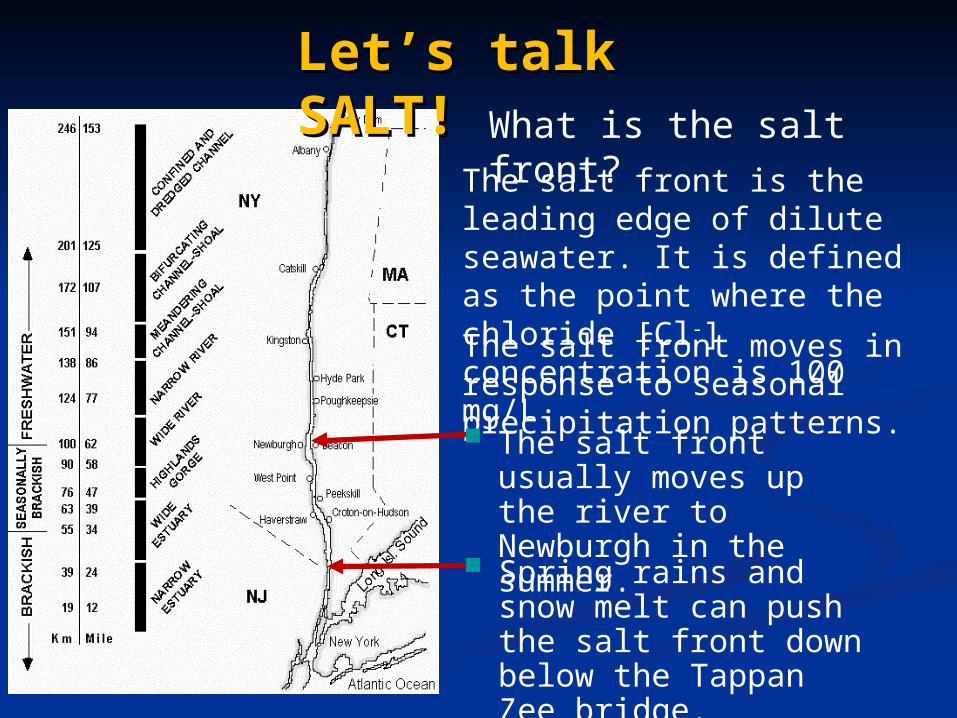
The salt front is the leading edge of dilute seawater. It is defined as the point where the chloride [Cl-] concentration is 100 mg/L.The salt front moves in response to seasonal precipitation patterns. The salt front usually
moves up the river to Newburgh in the summer.
What is the salt front?
Let’s talk Let’s talk SALT!SALT!
Spring rains and snow melt can push the salt front down below the Tappan Zee bridge.

Where will the salt front be Where will the salt front be onon
Day in the Life? Day in the Life?On past Days in the Life the salt On past Days in the Life the salt front has been located at:front has been located at:
2003 - RIVER MILE 602003 - RIVER MILE 60
2007 - RIVER MILE 78.2 2007 - RIVER MILE 78.2
2011 - RIVER MILE 35.72011 - RIVER MILE 35.7
What about this year? Consider What about this year? Consider the weather this fall, and visit the weather this fall, and visit the the HRECOS website to check salinity in the brackish section of the river.
Write down your prediction of Write down your prediction of where Clwhere Cl-- levels will reach 100 levels will reach 100 mg/L. After Day in the Life mg/L. After Day in the Life results are posted you can results are posted you can check the results online to see if check the results online to see if you are right!you are right!

Measurable Physical Measurable Physical Properties: TemperatureProperties: Temperature
Temperature is VERY Temperature is VERY IMPORTANT to fish and IMPORTANT to fish and to water chemistry. As to water chemistry. As water temperature rises water temperature rises and falls, biological and and falls, biological and chemical activity chemical activity adjusts. adjusts.
Atlantic tomcod, also called “frostfish” for their winter spawning
Dissolved Oxygen (DO) Dissolved Oxygen (DO) levels are inversely levels are inversely related to related to temperature. Can you temperature. Can you predict what happens predict what happens to DO in fall, around to DO in fall, around the time of Day in the the time of Day in the Life?Life?
Data for 2009 from HRECOS

Secchi diskSight tube
Measurable Physical Measurable Physical Properties: TurbidityProperties: Turbidity

Turbidity is Turbidity is ““water claritywater clarity””
Materials suspended in water can make it look dirty or “turbid.”
Examples include: silt, soil, or sand grains plankton: plants
(phytoplankton) and animals (zooplankton ) that drift in the water column
detritus: small pieces of dead plant material that are food for some creatures
Even salt where it meets the freshwater can add to the river’s turbidity
But, water that is not clear may or may not be dirty.
Estuaries are naturally turbid.
The HudsonThe Hudson’’s high turbidity s high turbidity limits photosynthesis in limits photosynthesis in deeper water, but creates deeper water, but creates nursery habitat for young fish, nursery habitat for young fish, hiding them from predators.hiding them from predators.

You Predict. You Predict. Will the Hudson be more turbid in Will the Hudson be more turbid in your location this year than last?your location this year than last?
Does weather affect Does weather affect turbidity...rain? turbidity...rain? wind? wind?
Look at data from Look at data from 2011 and check the 2011 and check the weather. weather.
How might that have How might that have affected turbidity?affected turbidity?
These students are using a secchi disk to determine water clarity.
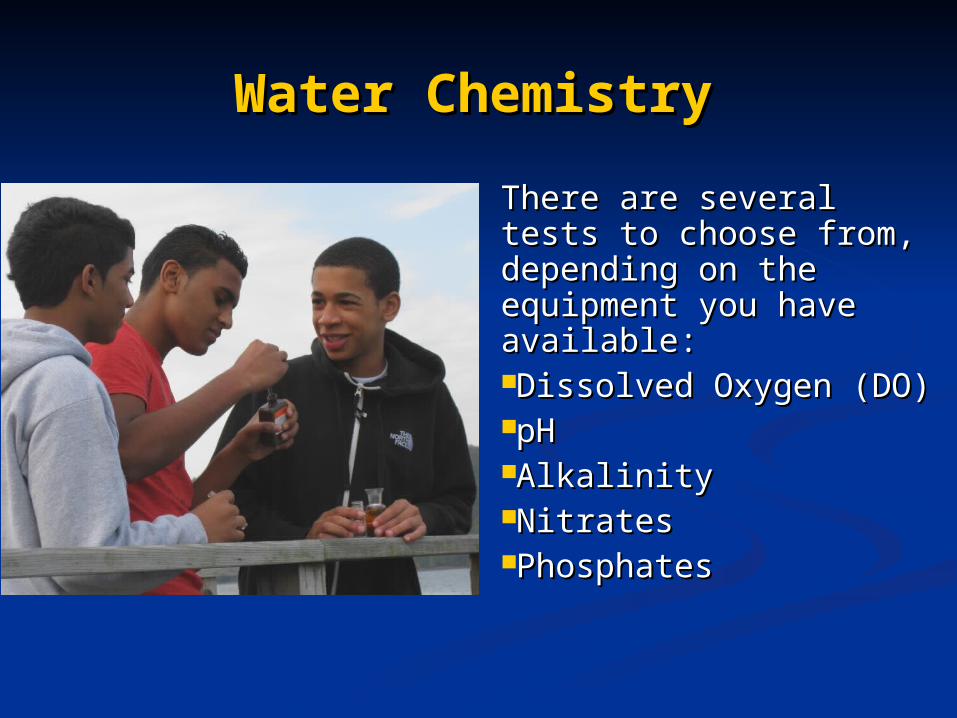
Water Chemistry Water Chemistry
There are several tests There are several tests to choose from, to choose from, depending on the depending on the equipment you have equipment you have available: available: Dissolved Oxygen (DO)Dissolved Oxygen (DO)pH pH AlkalinityAlkalinityNitratesNitratesPhosphatesPhosphates

Dissolved Oxygen (D.O.)Dissolved Oxygen (D.O.) Photosynthesis by Photosynthesis by
aquatic plants aquatic plants contributes dissolved contributes dissolved oxygen to water. oxygen to water.
DO levels can change DO levels can change quickly and throughout quickly and throughout the day – they are the day – they are generally lowest in AM, generally lowest in AM, highest at midday (why?).highest at midday (why?).
How do you think cloudy How do you think cloudy weather would affect DO weather would affect DO concentrations?concentrations?
How about wind?How about wind?
DO is needed for:DO is needed for:Respiration by animals, Respiration by animals, plants & bacteria plants & bacteria Breakdown of organic Breakdown of organic materialmaterial
……but how much is but how much is enough?enough?
alewives – a species of river herring

Dissolved OxygenDissolved Oxygen
Optimal DO for fish respiration is 5-11 mg/L.
With DO below 3 mg/L many fish can’t survive.
What is your prediction for your test site on Day in the Life?
Oxygen solubility in Oxygen solubility in water is poor - cold fresh water is poor - cold fresh water only holds 14.2 water only holds 14.2 mg/L when it is fully mg/L when it is fully saturated. Warm water saturated. Warm water and saltwater hold less.and saltwater hold less.
Fun Fact: Comparing people and fish! People need ~200,000 mg/L of oxygen to breathe. Fish need
~5 mg/L.
Atlantic silverside
banded killifish
pHpH
Look at the pH of Look at the pH of the Hudson River the Hudson River at your site. Is it:at your site. Is it:
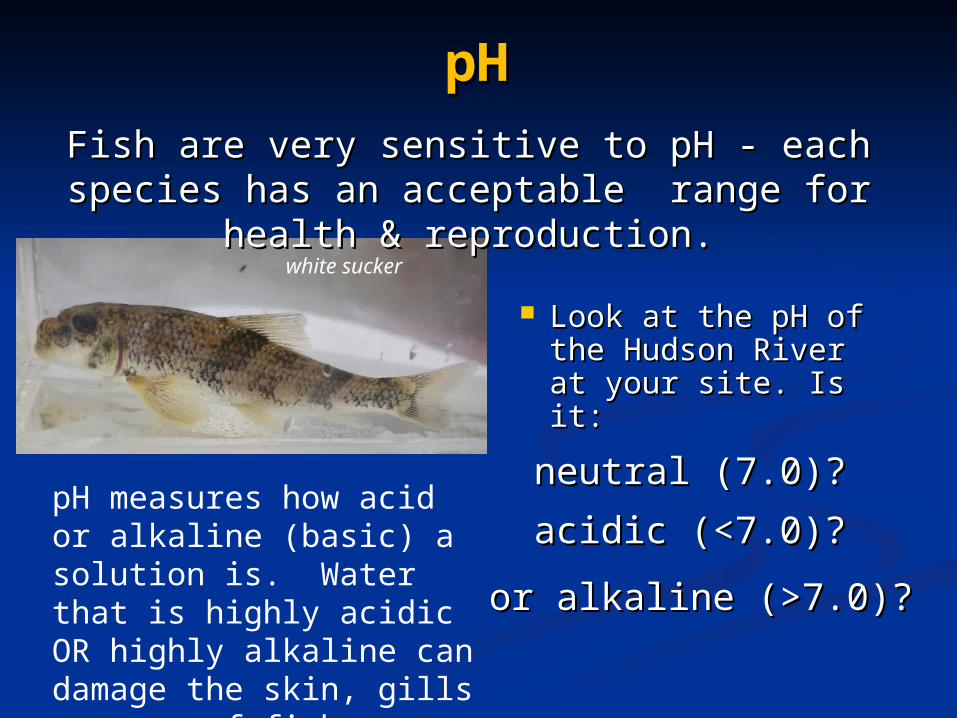
Fish are very sensitive to pH - each species Fish are very sensitive to pH - each species has an acceptable range for health & has an acceptable range for health &
reproduction.reproduction.
pH measures how acid or alkaline (basic) a solution is. Water that is highly acidic OR highly alkaline can damage the skin, gills or eyes of fish.
neutral (7.0)?neutral (7.0)?
acidic (<7.0)?acidic (<7.0)?
or alkaline (>7.0)?or alkaline (>7.0)?
white sucker

Fish: identify, Fish: identify, measure, count.measure, count.
striped bass
spottail shiner
mummichog hogchoker
white perch
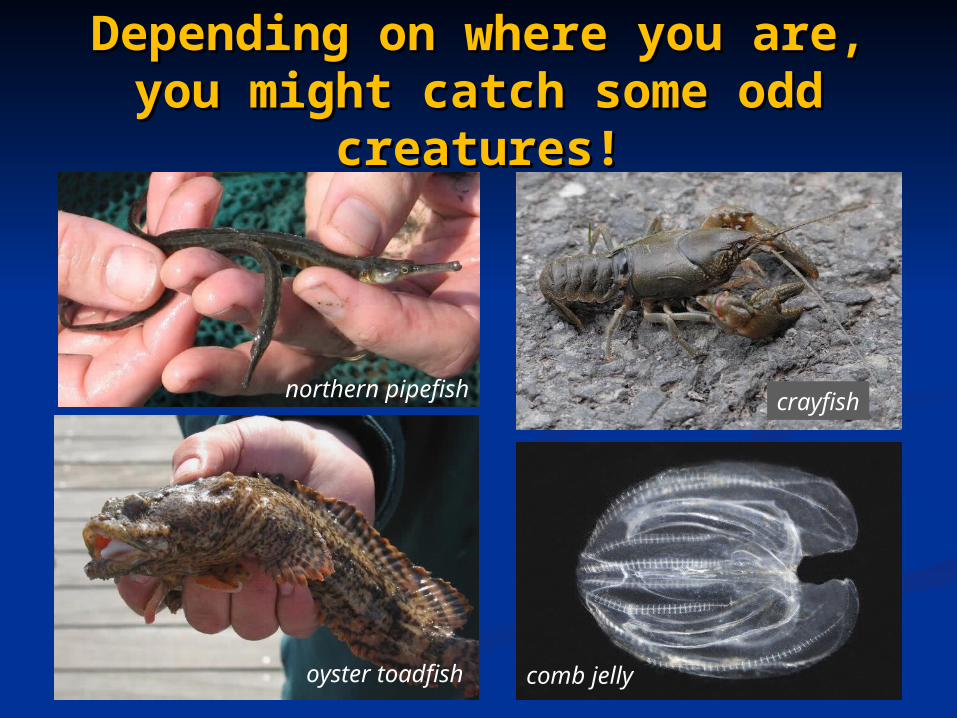
Depending on where you are, Depending on where you are, you might catch some odd you might catch some odd
creatures!creatures!
northern pipefish crayfish
oyster toadfish comb jelly

Look up information about Look up information about species caught at your site species caught at your site
Blue crab Blue crab ((Callinectes sapidus – Callinectes sapidus – “beautiful swimmer”“beautiful swimmer”) Females ) Females are most common in the salty are most common in the salty lower estuary; their eggs need lower estuary; their eggs need salt water to hatch and develop. salt water to hatch and develop. Males swim further upriver, Males swim further upriver, sometimes all the way to the Troy sometimes all the way to the Troy Dam!Dam!
American eel (American eel (Anguilla Anguilla rostratarostrata) Born in the ) Born in the Atlantic Ocean, these fish Atlantic Ocean, these fish swim into the freshwater swim into the freshwater Hudson and its tributaries Hudson and its tributaries to grow, then migrate back to grow, then migrate back to the sea to spawn.to the sea to spawn.

What’s at the Hudson’s What’s at the Hudson’s bottom?bottom?The Hudson has been around for many millions of years, but it hasn’t always looked the way it
does now.
For example, glaciers once filled the river channel. These powerful sheets of ice carved the river bottom and shoreline.

The river bottom has ridges and trenches carved by the glaciers. Sediment has partly filled them in, but the river is still deep. The deepest places are dark blue; the shallowest yellow and red. Off Manhattan, the river is 20 meters or about 60 feet deep.
Mapping the Hudson’s Mapping the Hudson’s bottombottom

In this portion of New York Harbor, the bottom is In this portion of New York Harbor, the bottom is dynamic - eroding in some areas, accumulating dynamic - eroding in some areas, accumulating sediment in others. The top several centimeters of sediment in others. The top several centimeters of sediment can be constantly moving.sediment can be constantly moving.
Sediments sometimes move like waves or sand dunes. Sediments sometimes move like waves or sand dunes. MMany of the waves shown here are 6 feet high - taller any of the waves shown here are 6 feet high - taller than most of us! than most of us!

We will examine the bottom We will examine the bottom of the river by taking a of the river by taking a
small coresmall core
Cores are used to study Cores are used to study the history of the river the history of the river bottom & describe bottom & describe habitats.habitats.
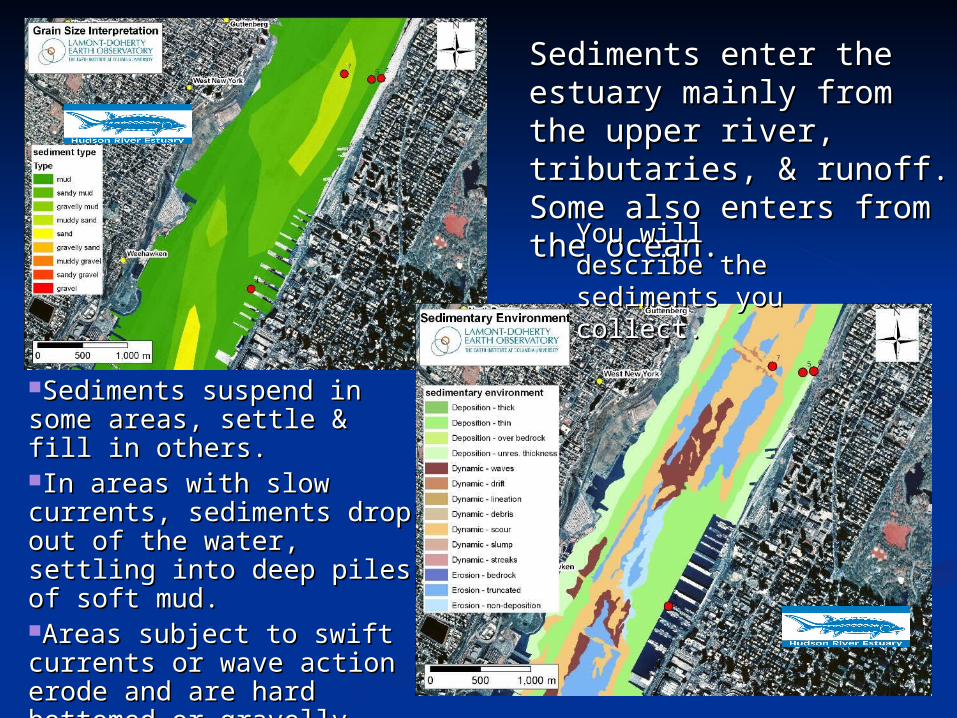
Sediments suspend in some Sediments suspend in some areas, settle & fill in others.areas, settle & fill in others.In areas with slow currents, In areas with slow currents, sediments drop out of the sediments drop out of the water, settling into deep water, settling into deep piles of soft mud. piles of soft mud. Areas subject to swift Areas subject to swift currents or wave action currents or wave action erode and are hard erode and are hard bottomed or gravelly.bottomed or gravelly.What is your site like?What is your site like?
Sediments enter the Sediments enter the estuary mainly from the estuary mainly from the upper river, tributaries, upper river, tributaries, & runoff. Some also & runoff. Some also enters from the ocean.enters from the ocean.
You will describe You will describe the sediments you the sediments you collect.collect.

Physical EnvironmentsPhysical EnvironmentsAssess physical conditions at your site. Is it:
•a marsh?
•a pier?
•a sandy beach?
•lined with rip-rap?

We will describe habitats We will describe habitats and identify plantsand identify plants

Describing your site so Describing your site so that other classes can that other classes can
visualize it visualize it
This site is on the Harlem River in Manhattan. Would the water be salty or fresh? How might salinity and the presence of marsh plants influence the species of fish found here?
Your description can help explain
some of your data.
Lots of mummichogs!

This is the beach at Kowawese, located at River Mile 58 near Newburgh. How would this site be different from the one in the previous slide? What might be caught here?
spottail shiners
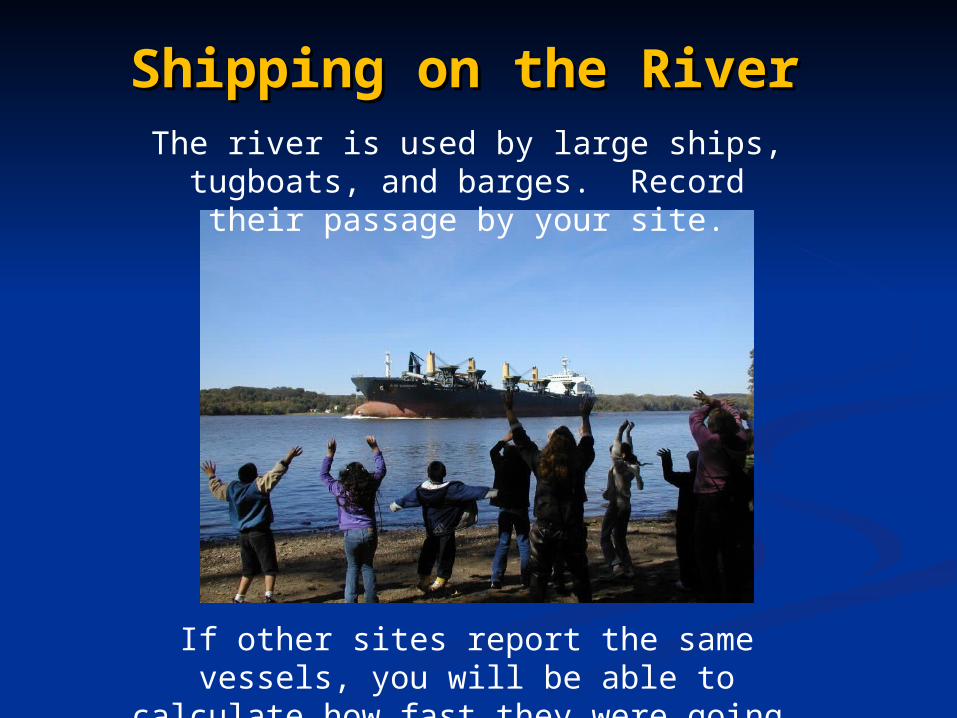
Shipping on the RiverShipping on the RiverThe river is used by large ships,
tugboats, and barges. Record their passage by your site.
If other sites report the same vessels, you will be able to calculate how fast they
were going.
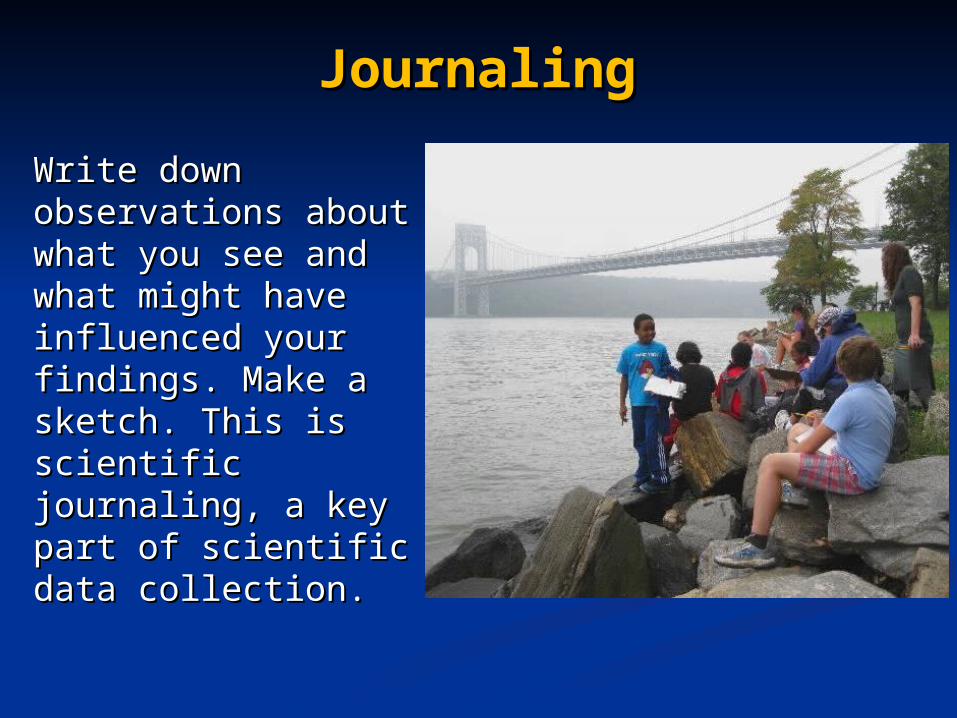
JournalingJournaling
Write down Write down observations about observations about what you see and what you see and what might have what might have influenced your influenced your findings. Make a findings. Make a sketch. This is sketch. This is scientific scientific journaling, a key journaling, a key part of scientific part of scientific data collection. data collection.

After all your hard work, make sure your results are sent in to be shared with other
classes!
Report your Report your data!data!

Compare your results to data from HRECOS
Hudson River Environmental Conditions Observing System

HRECOS Current Conditions page
Use dropdown menus to choose station, parameter, etc. Choose Units and whether to plot Continous readings or Daily averages. Use Start Date/End Date or Set Start/Set End to choose dates (within limits - click ? for more details). Plot one parameter or compare two in one graph.

And one last piece about the day…
HAVE FUN!!