A Criterion to Evaluate the Individual Raw-to-Scale … a testing program, the initial scale is...
22
A Criterion to Evaluate the Individual Raw-to-Scale Equating Conversions Hongwen Guo Gautam Puhan Michael Walker March 2013 Research Report ETS RR–13-05
Transcript of A Criterion to Evaluate the Individual Raw-to-Scale … a testing program, the initial scale is...

A Criterion to Evaluate the Individual Raw-to-Scale Equating Conversions
Hongwen Guo
Gautam Puhan
Michael Walker
March 2013
Research Report ETS RR–13-05
ETS Research Report Series
EIGNOR EXECUTIVE EDITOR James Carlson
Principal Psychometrician
ASSOCIATE EDITORS
Beata Beigman Klebanov Research Scientist
Heather Buzick Research Scientist
Brent Bridgeman Distinguished Presidential Appointee
Keelan Evanini Research Scientist
Marna Golub-Smith Principal Psychometrician
Shelby Haberman Distinguished Presidential Appointee
Gary Ockey Research Scientist
Donald Powers Managing Principal Research Scientist
Frank Rijmen Principal Research Scientist
John Sabatini Managing Principal Research Scientist
Matthias von Davier Director, Research
Rebecca Zwick Distinguished Presidential Appointee
PRODUCTION EDITORS
Kim Fryer Manager, Editing Services
Ruth Greenwood Editor
Since its 1947 founding, ETS has conducted and disseminated scientific research to support its products and services, and to advance the measurement and education fields. In keeping with these goals, ETS is committed to making its research freely available to the professional community and to the general public. Published accounts of ETS research, including papers in the ETS Research Report series, undergo a formal peer-review process by ETS staff to ensure that they meet established scientific and professional standards. All such ETS-conducted peer reviews are in addition to any reviews that outside organizations may provide as part of their own publication processes. Peer review notwithstanding, the positions expressed in the ETS Research Report series and other published accounts of ETS research are those of the authors and not necessarily those of the Officers and Trustees of Educational Testing Service.
The Daniel Eignor Editorship is named in honor of Dr. Daniel R. Eignor, who from 2001 until 2011 served the Research and Development division as Editor for the ETS Research Report series. The Eignor Editorship has been created to recognize the pivotal leadership role that Dr. Eignor played in the research publication process at ETS.

A Criterion to Evaluate the Individual Raw-to-Scale Equating Conversions
Hongwen Guo, Gautam Puhan, and Michael Walker
ETS, Princeton, New Jersey
March 2013

Action Editor: James E. Carlson
Reviewers: Lixiong Gu and Yanmei Li
Copyright © 2013 by Educational Testing Service. All rights reserved.
ETS, the ETS logo, and LISTENING. LEARNING. LEADING. are registered trademarks of Educational Testing Service (ETS).
SAT is a registered trademark of the College Board.
Find other ETS-published reports by searching the ETS
ReSEARCHER database at http://search.ets.org/researcher/
To obtain a copy of an ETS research report, please visit
http://www.ets.org/research/contact.html

i
Abstract
In this study we investigated when an equating conversion line is problematic in terms of gaps
and clumps. We suggest using the conditional standard error of measurement (CSEM) to
measure the scale scores that are inappropriate in the overall raw-to-scale transformation.
Key words: CSEM, equating, scaling, reporting scale

ii
Acknowledgments
The authors would like to thank Neil Dorans and Shelby Haberman for their consultation and
suggestion for the study. The authors are grateful to James Carlson, Yanmei Li, Lixiong Gu, Kim
Fryer, and Ruth Greenwood for their comments, suggestions, and editorial help.
1
For a testing program, the initial scale is usually well set up “to aid users in interpreting
test results” (Petersen, Kolen, & Hoover, 1989, p. 222). As stated by Kolen (2006, p. 169),
equating methods
…are used to maintain score scales as new forms are developed. Over time, however, the
information that was originally incorporated into the score scale can become less
relevant. For example, the norm group that was central to score interpretation might, over
time, become of less interest. The content of a test might slowly evolve, with the
cumulative effect that forms used in one year are different in content than forms used a
few years later.
Testing programs are almost always in a state of transition (Brennan, 2007; Eignor, 2007;
Liu & Walker, 2007). In addition, the accumulation of equating error may lead to scale drift
(Guo, Liu, Dorans, & Feigenbaum, 2011). At some point, the testing programs have to rescale
the test, which has been done for high-stakes programs like the SAT® assessment (Dorans, 2002)
and the ACT (Brennan, 1989).
After many administrations, the delivered equating conversions of a test program may
become less and less satisfactory to psychometricians and test users, even when sound equating
practices are followed. Over time, scaled scores tend to become unevenly distributed. Large gaps
and clumps may appear in the raw score-to-scale score conversion table. A gap occurs when a
one-point difference in raw scores translates to a multiple-point (two or more) difference in
scaled scores. A clump occurs when two or more raw scores convert to the same scaled score.
Gaps exaggerate differences while clumps can hide them. From a psychometric point of view,
gaps and clumps are undesirable because they depreciate the discrimination power of the test in
that score range. For high-stakes tests, especially tests used for certification or scholarship
competition, large gaps at the score range where important decisions are made may have severe
consequences (e.g., failure to get a scholarship). At what point does the conversion line become
inadequate for score reporting? In this paper, we propose a criterion using the conditional
standard error of measurement (CSEM) to evaluate the individual equating conversions.
Method
To set up the framework, we introduced three types of scales: (a) the operational scale
resulting from the raw-to-scale conversion, which was produced by equating and which will be
2
evaluated; (b) the target scale, which was set up initially for the program; and (c) the reasonable
scale based on the test length. The increment between two adjacent scale scores in the reasonable
scale is
Increment = (Max Scale Score – Min Scale Score) / Number of raw score points. (1)
For example, if the target scale scores are 40, 41, 42 …99, and 100, and the test has 52
valid raw score points, then the increment of two adjacent scores is 1.154. The reasonable scale
scores are 40, 41.2, 42.3, 43.5, 44.6, 45.8 …, 98.8, and 100.
We used data from a large-volume standardized test to illustrate the method. This test has
three measures: reading, math, and writing. For the reading test, there are 48 items on the test,
and the number of target scale points is 61, from 40 to 100. For the math test, there are 38 items
on the test, and the number of target scale points is 61, from 40 to 100. For the writing test, there
are 39 items on the test; the number of target scale points is 61, from 40 to 100. To calculate the
raw score CSEM, the three-parameter logistic (3PL) item response theory; the IRT model is used
to obtain the item parameter estimates and ability estimates, and then the raw score CSEM is
obtained by using the following equation:
1
( ) ( ) 1 ( ) ,K
j jj
CSEM P P
(2)
where 1.702 ( )
1( )
1 j j
jj j a b
cP c
e
for j = 1, 2,…, K and K is number of items on the test. For
illustration purposes, a simplified method of Dorans (1984) is adopted to approximate the scale
score CSEM.1 That is, the scale score CSEM [CSEM(SS)], where SS stands for scale score,
equals the slope (A1) of the line segments on the raw-to-scale conversions multiplied by the raw
score CSEM. For example, for raw scores (RS) = 33, 34, and 35, the corresponding SSs =
791.85, 801.85, and 812.41, respectively. The slope A for RS = 34 is (812.41-791.85) / (35-33) =
1.07. Then CSEM(SS = 801.85) = 1.07 * CSEM(RS = 34); CSEM(SS = 791.85) can be obtained
in a similar way. And then CSEM(SS = 800) can be linearly interpolated from CSEM(SS =
801.85) and CSEM(SS = 791.85).
Based on the CSEM(SS), the confidence interval (CI) for each scale score is computed by

3
CI Target or Reasonable Score 2*CSEM(SS). (3)
The operational equating conversions are not equally spaced in reality, as it is in the
target scale or the reasonable scale defined above. However, the ideal operational conversions
fluctuate around the target or the reasonable scales so that the discrimination power of the test is
fully evident in the conversions. Evaluation of the current equating conversion line would
include checking whether the equating conversions are within the CI range of the target scale and
the CI of the reasonable scale. The current conversion will be considered inadequate if many
scale scores in the conversions are outside the CI of the reasonable scale. We also evaluated the
current conversion with respect to the CI of the target scale. However, this comparison is
considered less important from a theoretical perspective because a target scale may not
necessarily be the most reasonable scale. Nevertheless, this comparison will be useful for the
testing program because it will be a direct evaluation of the current scale with the target scale
(i.e., the one that was originally set up by the program).
Results
Reading Results
Figure 1 displays the CSEM of raw scores for reading. The CSEM is relatively larger in
the middle score range (around 3) and smaller in the upper score range. Figure 2 shows the
CSEM of the target scale scores for reading. The CSEM is irregular because the slopes (Ai) of
the line segments on the raw-to-scale conversions fluctuate around 1.
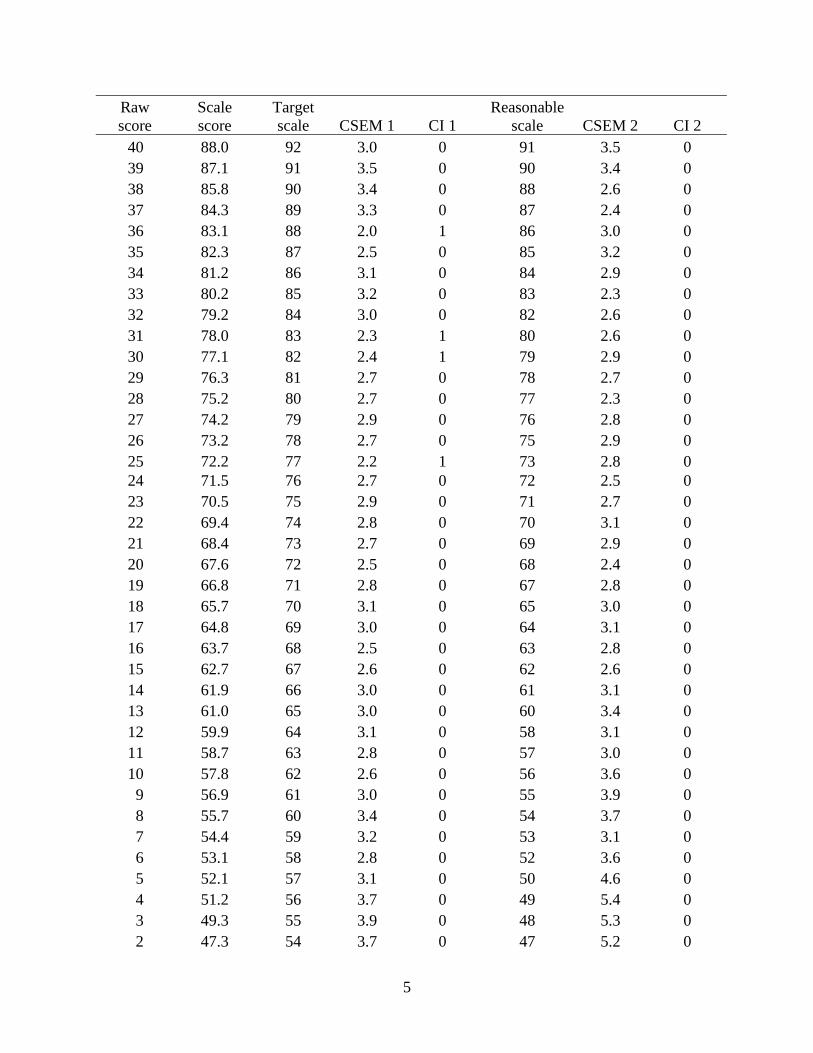
In Table 1, the first two columns are the raw-to-scale conversions produced by equating;
the third column is the target score; the fourth column, CSEM 1, is the CSEM of the target score;
and the fifth column, CI 1, is an indicator of whether the reported scale score in the second
column falls in the range defined in Equation 3 with target scores. The indicator is 0 if the scale
score is within the range, 1 otherwise. From column CI 1 (i.e., comparison with the target scale),
it can be observed that at raw scores -3 to 1, 25, 30, 31, 36, the score scores are outside the CI
range. The scale scores at the bottom of the score range usually have only limited impact on test
takers. The seventh column, CSEM 2, is the CSEM of the reasonable score. In column CI 2 (i.e.,
comparison with the reasonable scale), the index is zero at all score points indicating that the
entire conversion is within the CI range. Therefore, the reading conversion can be considered
relatively satisfactory.

4
Figure 1. The CSEM of raw scores for reading.
Figure 2. The CSEM of the target scale scores for reading.
Table 1
The Reading Conversions and Their CSEMs
Raw score
Scale score
Target scale CSEM 1 CI 1
Reasonable scale CSEM 2 CI 2
48 103.9 100 3.0 0 100 3.0 0 47 100.6 99 3.1 0 99 3.1 0 46 97.2 98 3.2 0 98 3.2 0 45 95.3 97 3.1 0 97 2.9 0 44 94.1 96 2.6 0 95 2.3 0 43 92.7 95 2.2 0 94 2.1 0 42 91.3 94 2.1 0 93 2.4 0 41 89.0 93 2.5 0 92 3.1 0
0
0.5
1
1.5
2
2.5
3
3.5
‐10 0 10 20 30 40 50 60
CSEM (Raw Score)
0
2
4
6
8
40 50 60 70 80 90 100
CSEM (Target)
5
Raw score
Scale score
Target scale CSEM 1 CI 1
Reasonable scale CSEM 2 CI 2
40 88.0 92 3.0 0 91 3.5 0 39 87.1 91 3.5 0 90 3.4 0 38 85.8 90 3.4 0 88 2.6 0 37 84.3 89 3.3 0 87 2.4 0 36 83.1 88 2.0 1 86 3.0 0 35 82.3 87 2.5 0 85 3.2 0 34 81.2 86 3.1 0 84 2.9 0 33 80.2 85 3.2 0 83 2.3 0 32 79.2 84 3.0 0 82 2.6 0 31 78.0 83 2.3 1 80 2.6 0 30 77.1 82 2.4 1 79 2.9 0 29 76.3 81 2.7 0 78 2.7 0 28 75.2 80 2.7 0 77 2.3 0 27 74.2 79 2.9 0 76 2.8 0 26 73.2 78 2.7 0 75 2.9 0 25 72.2 77 2.2 1 73 2.8 0 24 71.5 76 2.7 0 72 2.5 0 23 70.5 75 2.9 0 71 2.7 0 22 69.4 74 2.8 0 70 3.1 0 21 68.4 73 2.7 0 69 2.9 0 20 67.6 72 2.5 0 68 2.4 0 19 66.8 71 2.8 0 67 2.8 0 18 65.7 70 3.1 0 65 3.0 0 17 64.8 69 3.0 0 64 3.1 0 16 63.7 68 2.5 0 63 2.8 0 15 62.7 67 2.6 0 62 2.6 0 14 61.9 66 3.0 0 61 3.1 0 13 61.0 65 3.0 0 60 3.4 0 12 59.9 64 3.1 0 58 3.1 0 11 58.7 63 2.8 0 57 3.0 0 10 57.8 62 2.6 0 56 3.6 0 9 56.9 61 3.0 0 55 3.9 0 8 55.7 60 3.4 0 54 3.7 0 7 54.4 59 3.2 0 53 3.1 0 6 53.1 58 2.8 0 52 3.6 0 5 52.1 57 3.1 0 50 4.6 0 4 51.2 56 3.7 0 49 5.4 0 3 49.3 55 3.9 0 48 5.3 0 2 47.3 54 3.7 0 47 5.2 0

6
Raw score
Scale score
Target scale CSEM 1 CI 1
Reasonable scale CSEM 2 CI 2
1 45.4 53 3.2 1 46 4.9 0 0 43.7 52 3.0 1 45 4.7 0
-1 41.6 51 4.2 1 43 4.9 0 -2 39.0 50 4.9 1 42 5.6 0 -3 36.3 49 5.4 1 41 4.9 0
Note. CSEM = conditional standard error of measurement.
Math Results
Figure 3 displays the CSEM of raw scores for math. The CSEM is relatively larger in the
middle score range (around 2.5) and smaller in the upper score range. Figure 4 shows the CSEM
of the target scale scores for math. The CSEM is relatively smooth because the chosen
operational conversion was produced by the IRT equating, a smoother line compared to other
conversions produced by observed score equating methods. Therefore, the slope A for the
CSEM of the operational and the target scale scores is relatively stable and does not fluctuate
much.
In Table 2, the first two columns are the raw-to-scale conversions produced by equating;
the fifth column, CI, shows that the majority of the conversion (37 out of 42 raw score points) is
outside the CI range of the target scale, but the last column, CI 2, shows that the entire
conversion is within the CI range of the reasonable scale.
Figure 3. The CSEM of raw scores for math.
0
0.5
1
1.5
2
2.5
3
‐10 0 10 20 30 40 50
CSEM (Raw Score)

7
Figure 4. The CSEM of the target scale scores for math.
Table 2
The Math Conversions and Their CSEMs
Raw score
Scale score Target CSEM 1 CI 1
Reasonable scale CSEM 2 CI 2
38 100.6 100 0.48 0 100 0.48 0 37 96.8 99 1.28 0 99 1.62 0 36 93.9 98 2.08 0 97 2.76 0 35 91.7 97 2.87 0 96 3.08 0 34 90.0 96 3.06 0 94 3.15 0
33 88.6 95 3.11 1 93 3.00 0 32 87.3 94 3.17 1 91 2.78 0 31 86.0 93 3.03 1 90 2.56 0 30 84.7 92 2.87 1 89 2.50 0 29 83.4 91 2.71 1 87 2.51 0 28 82.0 90 2.56 1 86 2.59 0 27 80.7 89 2.52 1 84 2.71 0 26 79.3 88 2.50 1 83 2.85 0 25 77.9 87 2.52 1 81 2.97 0 24 76.6 86 2.57 1 80 3.08 0 23 75.2 85 2.65 1 79 3.16 0 22 73.9 84 2.74 1 77 3.21 0
0
1
2
3
4
5
6
40 50 60 70 80 90 100
CSEM (Target)

8
Raw score
Scale score Target CSEM 1 CI 1
Reasonable scale CSEM 2 CI 2
21 72.5 83 2.83 1 76 3.22 0 20 71.3 82 2.92 1 74 3.19 0 19 70.1 81 3.01 1 73 3.14 0 18 68.9 80 3.08 1 71 3.07 0 17 67.7 79 3.14 1 70 2.99 0 16 66.6 78 3.19 1 69 2.89 0 15 65.5 77 3.21 1 67 2.80 0 14 64.5 76 3.22 1 66 2.70 0 13 63.5 75 3.21 1 64 2.62 0 12 62.5 74 3.19 1 63 2.57 0 11 61.4 73 3.15 1 61 2.56 0 10 60.4 72 3.10 1 60 2.61 0 9 59.4 71 3.05 1 59 2.72 0 8 58.3 70 2.99 1 57 2.87 0 7 57.2 69 2.92 1 56 3.04 0 6 56.0 68 2.85 1 54 3.23 0 5 54.7 67 2.79 1 53 3.41 0 4 53.3 66 2.72 1 51 3.55 0 3 51.8 65 2.66 1 50 3.67 0 2 50.2 64 2.61 1 49 3.78 0 1 48.5 63 2.58 1 47 3.91 0 0 46.7 62 2.56 1 46 4.14 0 -1 44.7 61 2.57 1 44 4.39 0 -2 42.3 60 2.61 1 43 4.60 0 -3 39.5 59 2.68 1 41 4.81 0 0 36.3 58 2.78 1 40 5.03 0
Note. CSEM = conditional standard error of measurement.
Writing Results
Figure 5 displays the CSEM of raw scores for writing. The CSEM is relatively larger in
the middle score range (around 2.5) and smaller in the upper score range. Figure 6 shows the

9
CSEM of the target scale scores for writing. The CSEM is irregular again, as in reading, because
the slopes (Ai) of the line segments on the raw-to-scale conversions fluctuated.
Figure 5. The CSEM of raw scores for writing.
Figure 6. The CSEM of the target scale scores for writing.
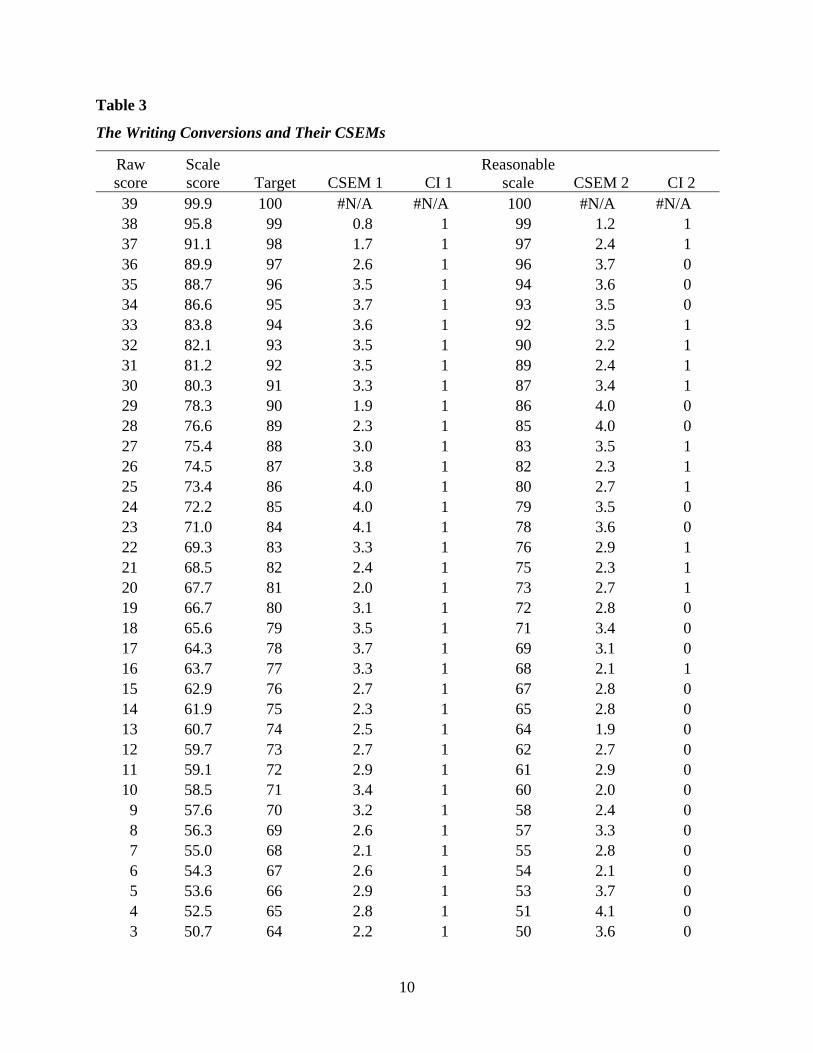
In Table 3, the first two columns are the raw-to-scale conversions produced by equating;
the fifth column, CI 1, shows that the entire conversion is outside the CI range of the target scale.
The last column, CI 2, also shows that, from Raw Score 16 to 38, 13 out of 23 scale score points
are outside the CI range of the reasonable scale.
0
0.5
1
1.5
2
2.5
3
‐10 0 10 20 30 40 50
CSEM (Raw Score)
0
2
4
6
8
40 50 60 70 80 90 100
CSEM (Target)
10
Table 3
The Writing Conversions and Their CSEMs
Raw score
Scale score Target CSEM 1 CI 1
Reasonable scale CSEM 2 CI 2
39 99.9 100 #N/A #N/A 100 #N/A #N/A 38 95.8 99 0.8 1 99 1.2 1 37 91.1 98 1.7 1 97 2.4 1 36 89.9 97 2.6 1 96 3.7 0 35 88.7 96 3.5 1 94 3.6 0 34 86.6 95 3.7 1 93 3.5 0 33 83.8 94 3.6 1 92 3.5 1 32 82.1 93 3.5 1 90 2.2 1 31 81.2 92 3.5 1 89 2.4 1 30 80.3 91 3.3 1 87 3.4 1 29 78.3 90 1.9 1 86 4.0 0 28 76.6 89 2.3 1 85 4.0 0 27 75.4 88 3.0 1 83 3.5 1 26 74.5 87 3.8 1 82 2.3 1 25 73.4 86 4.0 1 80 2.7 1 24 72.2 85 4.0 1 79 3.5 0 23 71.0 84 4.1 1 78 3.6 0 22 69.3 83 3.3 1 76 2.9 1 21 68.5 82 2.4 1 75 2.3 1 20 67.7 81 2.0 1 73 2.7 1 19 66.7 80 3.1 1 72 2.8 0 18 65.6 79 3.5 1 71 3.4 0 17 64.3 78 3.7 1 69 3.1 0 16 63.7 77 3.3 1 68 2.1 1 15 62.9 76 2.7 1 67 2.8 0 14 61.9 75 2.3 1 65 2.8 0 13 60.7 74 2.5 1 64 1.9 0 12 59.7 73 2.7 1 62 2.7 0 11 59.1 72 2.9 1 61 2.9 0 10 58.5 71 3.4 1 60 2.0 0 9 57.6 70 3.2 1 58 2.4 0 8 56.3 69 2.6 1 57 3.3 0 7 55.0 68 2.1 1 55 2.8 0 6 54.3 67 2.6 1 54 2.1 0 5 53.6 66 2.9 1 53 3.7 0 4 52.5 65 2.8 1 51 4.1 0 3 50.7 64 2.2 1 50 3.6 0

11
Raw score
Scale score Target CSEM 1 CI 1
Reasonable scale CSEM 2 CI 2
2 49.2 63 2.3 1 48 2.8 0 1 48.1 62 2.9 1 47 5.6 0 0 47.0 61 2.9 1 46 6.2 0
-1 43.5 60 2.3 1 44 6.8 0 -2 40.9 59 1.7 1 43 6.9 0 -3 37.8 58 2.5 1 41 6.5 0 -4 33.0 57 3.2 1 40 6.9 0
Note. CSEM = conditional standard error of measurement.
Composite Score Results
The composite score of the test is the sum of reporting scale scores of reading (R), math
(M), and writing (W). The composite scores are used for a scholarship competition. Figure 7
displays the CSEM of the composite score above 240. Composite scores below 240 may not be
eligible for participation of the scholarship competition. The CSEM is relatively larger in the
middle and lower score ranges (around 5) and smaller in the upper score range.
Figure 7. The CSEM for the composite score.
In Table 4, the first column shows the obtained composite scores, the second column is
the target scale score, the third column is the CSEM (R + M + W) of the target scale score, the
fourth and fifth are the lower and upper bounds of the CI of the target score, and the last column
(diff) is the index telling whether the obtained composite scores are within the CI. There is one
3-point gap in the obtained composite scores. However, it can be observed from the last column
in Table 4 that the obtained composite scores above 240 are all within the CI.
0
1
2
3
4
5
6
240 260 280 300
CSEM(R+M+W)
CSEM(R+M+W)

12
Table 4
The Composite Scores Above 180 and Their CSEMs
R + M + W Target CSEM (R + M + W) Upper Lower Diff 300 300 3.0 303.0 297.0 0 297 299 3.7 302.7 295.3 0 296 298 4.6 302.6 293.4 0 295 297 2.2 299.2 294.8 0 294 296 3.6 299.6 292.4 0 293 295 4.2 299.2 290.8 0 292 294 3.9 297.9 290.1 0 291 293 4.0 297.0 289.0 0 290 292 4.4 296.4 287.6 0 289 291 3.9 294.9 287.1 0 288 290 4.8 294.8 285.2 0 287 289 4.3 293.3 284.7 0 286 288 4.2 292.2 283.8 0 285 287 4.5 291.5 282.5 0 284 286 4.2 290.2 281.8 0 283 285 4.3 289.3 280.7 0 282 284 4.4 288.4 279.6 0 281 283 4.6 287.6 278.4 0 280 282 4.4 286.4 277.6 0 279 281 4.7 285.7 276.3 0 278 280 4.7 284.7 275.3 0 277 279 4.6 283.6 274.4 0 276 278 4.6 282.6 273.4 0 275 277 4.6 281.6 272.4 0 274 276 4.8 280.8 271.2 0 273 275 4.7 279.7 270.3 0 272 274 4.7 278.7 269.3 0 271 273 4.7 277.7 268.3 0 270 272 4.8 276.8 267.2 0 269 271 4.7 275.7 266.3 0 268 270 4.8 274.8 265.2 0 267 269 4.9 273.9 264.1 0 266 268 4.8 272.8 263.2 0 265 267 4.9 271.9 262.1 0 264 266 4.8 270.8 261.2 0 263 265 4.9 269.9 260.1 0 262 264 4.8 268.8 259.2 0 261 263 4.8 267.8 258.2 0

13
R + M + W Target CSEM (R + M + W) Upper Lower Diff 260 262 4.9 266.9 257.1 0 259 261 4.9 265.9 256.1 0 258 260 4.9 264.9 255.1 0 257 259 4.8 263.8 254.2 0 256 258 4.9 262.9 253.1 0 255 257 4.9 261.9 252.1 0 254 256 4.9 260.9 251.1 0 253 255 4.9 259.9 250.1 0 252 254 4.9 258.9 249.1 0 251 253 4.9 257.9 248.1 0 250 252 4.8 256.8 247.2 0 249 251 4.9 255.9 246.1 0 248 250 4.8 254.8 245.2 0 247 249 4.8 253.8 244.2 0 246 248 4.8 252.8 243.2 0 245 247 4.8 251.8 242.2 0 244 246 4.7 250.7 241.3 0 243 245 4.8 249.8 240.2 0 242 244 4.9 248.9 239.1 0 241 243 5.1 248.1 237.9 0
Note. CSEM = conditional standard error of measurement; R = reading; M = math; W = writing.
Discussion
For the reading test, there are 48 items on the test, and the number of target scale points is
61. The entire reading conversion is within the CI range of the reasonable scale, and only a few
scale scores are outside the CI range of the target scale.
For the math test, there are 38 items on the test, and the number of target scale points is
61, the same as in the reading test. The entire math conversion is within the CI range of the
reasonable scale, even though a large portion of scale scores are outside the CI range of the target
scale. This is somewhat expected because there are fewer items on the math test than on the
reading test. For a relative short test, some gaps are expected in the conversion. Therefore, the
target scale with 61 points is hard to satisfy.
For the writing test, there are 39 items on the test; the number of target scale points is 61,
again, the same as in the reading test. More than half of the scale scores in the writing conversion
are outside the CI range of the reasonable scale and the entire writing conversion is also outside
the CI range of the target scale. Compared to the math conversion, the writing conversion is

14
more problematic. Gaps at the upper portion of the writing conversion are too large compared to
the CSEM and unacceptable even when a reasonable scale is used. The overall test difficulty,
relatively easier compared to the math test, may be due to undesired gaps at the upper score
range as well as to fewer items on the writing test.
For the composite score, the gaps at the top are still acceptable compared to the CSEM.
Limitation and Recommendation
In this study, the CSEM is based on IRT models and approximations. More accurate
calculation of CSEMs can be used (Haberman, 2008; Kolen, Hanson, & Brennan, 1992) to
evaluate the conversions. The conditional standard error of equating is not considered in the
criterion because, for a single equating, the conditional standard error of equating is usually
much smaller than the CSEM (about one tenth for the test used in this study).
The study illustrates for practitioners that tests may be in a state of transition. Over
time, changes occur, in that the tests need to be revised in terms of content, statistical
specifications, number of items, and so on. In order to maintain a meaningful scale for a test,
practitioners are advised to monitor the individual conversions to see if they continue to be in a
reasonable range. If the conversions are deemed unacceptable for future use, it may be
necessary to revise or rescale the test.

15
References
Brennan, R. L. (Ed.). (1989). Methodology used in scaling the ACT Assessment and P-ACT+.
Iowa City, Iowa: ACT.
Brennan, R. L. (2007). Tests in transition: Discussion and synthesis. In N. J. Dorans,
M. Pommerich, & P. W. Holland (Eds.), Linking and aligning scores and scales
(pp. 158–176). New York, NY: Springer.
Dorans, N. J. (1984). Approximate IRT formula score and scaled score standard errors of
measurement at different ability levels (Statistical Report No. SR-84-118). Princeton, NJ:
Educational Testing Service.
Dorans, N. J. (2002). The recentering of SAT scales and its effects on score distributions and
score interpretations (College Board Research Report No. 2002-11). New York, NY:
The College Board.
Eignor, D. R. (2007). Linking scores derived under different modes of test administration. In
N. J. Dorans, M. Pommerich, & P. W. Holland (Eds.), Linking and aligning scores and
scales (pp. 135–157). New York, NY: Springer.
Guo, H., Liu, J., Dorans, N., & Feigenbaum, M. (2011). Multiple linking in equating and random
scale drift (Research Report No. RR-11-46). Princeton, NJ: Educational Testing Service.
Haberman, S. J. (2008). Reliability of scale scores (Research Report No. RR-08-70). Princeton,
NJ: Educational Testing Service.
Kolen, M. J. (2006). Scaling and norming. In R. L. Brennan (Ed.), Educational measurement
(4th ed., pp. 155–186). Westport, CT: Praeger.
Kolen, M. J., Hanson, B., & Brennan, R. (1992). Conditional standard errors of measurement for
scale scores. Journal of Educational Measurement, 29, 285–307.
Liu, J., & Walker, M. E. (2007). Score linking issues related to test content changes. In N. J.
Dorans, M. Pommerich, & P. W. Holland (Eds.), Linking and aligning scores and scales
(pp. 109–134). New York, NY: Springer.
Petersen, N. S., Kolen, M. J., & Hoover, H. D. (1989). Scaling norming and equating. In R. L.
Linn (Ed.), Educational measurement (3rd ed., pp. 221–262). New York, NY:
Macmillan.

16
Notes
1 Dorans’s method is based on an IRT model and empirical data. This method is simplified for
use in this study for illustrative purposes. The exact CSEM of scale scores using Dorans’s
approach can be computed in the ETS proprietary software GENASYS. A more accurate
estimation of scale score CSEM can be found in Haberman (2008).