A cost comparison between mechanisation and manual labour ...
89
A cost comparison between mechanisation and manual labour in a privately-owned forestry farm C Uys https://orcid.org/0000-0003-3180-9948 Mini-dissertation submitted in partial fulfilment of the requirements for the degree Master of Business Administration at the North-West University Supervisor: Prof AM Smit Graduation May 2018 Student number: 23057823
Transcript of A cost comparison between mechanisation and manual labour ...

A cost comparison between mechanisation and manual labour in a
privately-owned forestry farm
C Uys
https://orcid.org/0000-0003-3180-9948
Mini-dissertation submitted in partial fulfilment of the requirements for the degree Master of Business
Administration at the North-West University
Supervisor: Prof AM Smit
Graduation May 2018
Student number: 23057823

- 1 -
Acknowledgements
I would like to make use of this opportunity to thank my loving wife Tammlyn for the
tremendous support she gave me throughout the two years of this MBA studies by
always having a positive word of reinforcement when the motivation is low. To my
parents Anton and Mariaan a special thanks for the opportunity given to me to further
my studies by not only paying, but supporting and motivating (sometimes forcefully,
which was duly needed) me throughout the six years spent at university.
I would also like to thank my sister Antoinette and her husband Dr Theunis, whom on
very short notice helped me out with the technical editing of this dissertation. To
Professor Anet Smit a special thanks for giving me guidance and support in this
dissertation when I asked for help. To Michaela Haigh a special thanks for helping me
out with the last technical edits.
Then to each member of the BEE-TEAM (a-k-a, the winning team) a warm round of
applause. Without the support of a proper functioning team like us, this MBA would be
close to impossible to complete. Studying and working together on completing this
degree made me a better person and I learned a lot from each and every one of you.
To my Labrador retriever Marley. Thank you for lying beside me, sleeping and snoring
while I wrote this dissertation. You could have played with your friends on the farm but
you chose to stay with me. I thank you dearly.
Kind Regards

- 2 -
Abstract
Globally the world has mechanized most industries. South Africa still trails most
developed countries but is currently progressing into a 4th generation of
mechanization. In particular, the agricultural sector should investigate the possible
advantages to be obtained by mechanisation. Large technological advancements in
the forestry harvesting process have been developed over the last 2 decades
internationally. This technological advancements however comes at high cost as most
of the machines are imported and are costly to operate. Small scale forestry farmers
need to keep up to date and check whether it will be feasible for them to implement
such advancements. Failure to keep up with technological advancement may lead to
small scale farmers becoming uncompetitive and priced out of the market.
This research study aims to investigate the feasibility of implementing the mechanical
tree harvesting process compared to the traditional manual labour process, for the
small scale forestry farmer in the harvesting of eucalyptus trees. This study includes
5 case studies of forestry farmers on the Highveld area of Mpumalanga. Information
for each case study was obtained via oral interviews. The cost involved in mechanical
harvesting was obtained from literature and adapted to suit the purpose of this study.
The cost for manual labour harvesting was developed by analysing the literature as
well as from interviews conducted with manual tree harvesting companies and experts
in the field.
This study revealed that for one of the cases it would be advisable to mechanise the
harvesting process of the eucalyptus trees. For the other cases it was recommended
not to mechanise the process as the costs of manual labour was significantly less
compared to the cases that will benefit from mechanisation. On average the manual
labour harvesting method was R16.52 per ton less than for the mechanical process.
However if one takes into consideration the minimum wage increase to be
implemented in 2018 in South Africa and assuming that all other costs remains
constant, then things changed dramatically. The increase in minimum wage will result
in the mechanisation process being more profitable and an average saving of R4.05
as compared to manual labour.
Key words
Forestry, small-scale farmer, mechanisation, manual labour, costing.

- 3 -
Table of Contents
Chapter 1: An introduction to a cost comparison between mechanisation and manual labour in a
privately-owned farm ......................................................................................................................... - 7 -
Introduction ........................................................................................................................ - 7 -
Background information ..................................................................................................... - 7 -
1.2.1 Agriculture industry of South Africa ........................................................................... - 7 -
1.2.2 Forestry industry of South Africa ................................................................................ - 8 -
1.2.3 Mechanisation............................................................................................................. - 9 -
1.2.4 Manual labour ........................................................................................................... - 10 -
Problem statement ........................................................................................................... - 11 -
Objectives.......................................................................................................................... - 11 -
1.4.1 Main objective .......................................................................................................... - 11 -
1.4.2 Secondary objectives in literature ............................................................................ - 11 -
1.4.3 Secondary objectives in the empirical study ............................................................ - 11 -
Research design ................................................................................................................ - 12 -
1.5.1 Literature review ....................................................................................................... - 12 -
1.5.2 Empirical study .......................................................................................................... - 12 -
Demarcation or limitations of the study ........................................................................... - 14 -
Substantiation or contribution of the study ..................................................................... - 15 -
Proposed chapter layout ................................................................................................... - 16 -
Chapter 2: A literature review of mechanisation and manual labour in the forestry sector ........... - 17 -
Forestry industry ............................................................................................................... - 17 -
Mechanisation in forestry ................................................................................................. - 19 -
Tree harvesting processes................................................................................................. - 20 -
Manual labour in forestry ................................................................................................. - 22 -
Safety ................................................................................................................................ - 22 -
Costing .............................................................................................................................. - 23 -
2.6.1 Relevant costing ........................................................................................................ - 23 -
2.6.2 Process costing .......................................................................................................... - 23 -
Costing in the forestry industry ........................................................................................ - 24 -
Costs in forestry mechanisation............................................................................................ 27
Manual labour costs .............................................................................................................. 28
Conclusion ............................................................................................................................. 29
Chapter 3: An empirical study - Data collection, results and analysis .................................................. 31

- 4 -
Introduction .......................................................................................................................... 31
Research method .................................................................................................................. 31
Population ............................................................................................................................. 31
Sample ................................................................................................................................... 31
Data collection ...................................................................................................................... 32
Results ................................................................................................................................... 32
3.6.1 Productivity ................................................................................................................... 33
3.6.2 Mechanisation costs ..................................................................................................... 34
3.6.3 Manual labour costs ...................................................................................................... 36
3.6.4 Data collection for the forestry farmer scenarios ......................................................... 36
Data analysis ......................................................................................................................... 41
3.7.1 The mechanisation costing model ................................................................................ 41
3.7.2 The manual labour costing model ................................................................................ 42
Case analysis ......................................................................................................................... 46
3.8.1 Farmer 1 ........................................................................................................................ 49
3.8.2 Farmer 2 ........................................................................................................................ 51
3.8.3 Farmer 3 ........................................................................................................................ 53
3.8.4 Farmer 4 ........................................................................................................................ 55
3.8.5 Farmer 5 ........................................................................................................................ 57
Chapter 4: Conclusion & Recommendations ........................................................................................ 59
Introduction .......................................................................................................................... 59
Conclusions ........................................................................................................................... 59
4.2.1 Farmer 1 ........................................................................................................................ 59
4.2.2 Farmer 2 ........................................................................................................................ 60
4.2.3 Farmer 3 ........................................................................................................................ 60
4.2.4 Farmer 4 ........................................................................................................................ 61
4.2.5 Farmer 5 ........................................................................................................................ 61
Overall recommendation ...................................................................................................... 61
Limitations of the study ........................................................................................................ 62
Further research ................................................................................................................... 63
References ............................................................................................................................................ 64
Annexures ............................................................................................................................................. 72

- 5 -
List of figures
Figure 2.1 Plantation area by province and specie .................................................. 17
Figure 2.2 Mechanical tree harvester ....................................................................... 21
Figure 2.3 Forestry machine costing model ............................................................. 26
Figure 2.4 process costing breakdown ..................................................................... 27
Figure 3.1 Manual labour costing model part A ........................................................ 44
Figure 3.2 Manual labour costing model part B ........................................................ 45
Figure 3.3 Inputs in the costing model part A ........................................................... 46
Figure 3.4 Outputs from the costing model part A .................................................... 48
List of Tables
Table 2.1 Sales volumes of timber 2016 in SA ......................................................... 18
Table 2.2 Investments in forest products sector 2016 . ............................................ 18
Table 2.3 Consumption of a chainsaw ..................................................................... 29
Table 3.1 Machinery and equipment cost ................................................................. 37
Table 3.2 Fuel and oil proces ................................................................................... 35
Table 3.3 Prices for personal protective equipment and clothing ............................. 36
Table 3.4 Farmer 1 estimated production for the next 5 years ................................. 37
Table 3.5 Farmer 2 estimated production for the next 5 years ................................. 38
Table 3.6 Farmer 3 estimated production for the next 5 years ................................. 39
Table 3.7 Farmer 4 estimated production for the next 5 years ................................. 40
Table 3.8 Farmer 5 estimated production for the next 5 years ................................. 41
Table 3.9 Mechanical costing model part B .............................................................. 42
Table 3.10 Mechanisation costing part B farmer 1 ................................................... 49
Table 3.11 Manual labour costing farmer 1 .............................................................. 50
Table 3.12 Manual labour costing based on 2018 minimum wages ......................... 52
Table 3.13 Mechanisation costing part B farmer 2 ................................................... 53
Table 3.14 Manual labour costing summary farmer 2 .............................................. 54
Table 3.15 Manual labour costing based on 2018 minimum wages ......................... 54
Table 3.16 Mechanisation costing part B farmer 3 ................................................... 55
Table 3.17 Manual labour costing summary for farmer 3 ......................................... 56

- 6 -
Table 3.18 Manual labour costing based on 2018 minimum wages ......................... 56
Table 3.19 Mechanisation costing part B farmer 4 ................................................... 57
Table 3.20 Manual labour costing summary for farmer 4 ......................................... 58
Table 3.21 Manual labour costing based on 2018 minimum wages ......................... 58
Table 3.22 Mechanisation costing part B farmer 5 ................................................... 57
Table 3.23 Manual labour costing summary for farmer 5 ......................................... 58
Table 3.24 Manual labour costing based on 2018 minimum wages ......................... 58

- 7 -
CHAPTER 1: AN INTRODUCTION TO A COST COMPARISON
BETWEEN MECHANISATION AND MANUAL LABOUR IN A
PRIVATELY-OWNED FORESTRY FARM
INTRODUCTION
In difficult economic times, businesses need to investigate all the possibilities to
increase their profit and productivity. Farmers are constantly challenged with
increasing capital investments and severe droughts, al impacting their triple bottom
line (Schirmer, 2004; Mussa et al., 2014). As South Africa is currently moving into the
4th generation of mechanisation, the agriculture sector also needs to investigate the
possible advantages offered by mechanisation (RSG, 2017). As in most of their
processes, private small scale forestry farmers currently make use of manual labour
to harvest trees. The forestry industry is known for high labour turnover, absenteeism
and a high accident rate. Therefore, forestry farmers should investigate other options
to increase the productivity as well as the safety of their employees and possibly the
profits of their farming operations (ILO, 2012). This study aims to investigate the
profitability for the small scale forestry farmer to mechanise the tree harvesting
process. This study is based on real life scenarios of forestry farmers in the Highveld
region of Mpumalanga in South Africa. Calculations will be made by means of a
Microsoft Excel spread sheet where after a conclusion and recommendations will
follow on whether it would be profitable for the small scale forestry farmer to mechanise
the tree harvesting process.
BACKGROUND INFORMATION
1.2.1 Agriculture industry of South Africa
Agriculture in South Africa has a vital role to play in building a strong economy
(Department Agriculture, 2017). Farmers in South Africa and over the world are
constantly challenged by increasing costs of capital investments and if these costs are
not duly considered, farmers will go bankrupt (Schirmer, 2004).
South African farmers face unique challenges such as droughts, farm attacks and land
reform (Mussa et al., 2014). Drought in particular is a serious concern as South Africa
is a semi-arid country. The impact of drought, other than dwindling water supplies, is

- 8 -
the effect drought has on the production of staple crops in South Africa. In 1992/1993,
undoubtedly one of the most widespread droughts of the last 45 years, maize had to
be imported to South Africa (Department of environmental affairs, 2017). The knock-
on effect of crop failure resulted in the population moving from rural areas into urban
areas farm labour lay-offs, farm closures as well as an increasing financial debt in the
agricultural sector (Department of environmental affairs, 2017). The more recent
drought of 2015-2016 again affected the profitability of farmers and highlighted the
challenges faced by South African farmers. South African farmers should now, more
than ever, manage their cost of production to an absolute minimum while still achieving
the maximum productivity in order to operate sustainably over the long term.
The state land audit report of 2013 describes that 79% (96 550 791 ha) of land in
South Africa is privately owned of which 1.3% (1 340 268 ha) is used in the forestry
sector. Compared to other sectors like agriculture and fisheries (4 027 051 ha) forestry
takes up much less land usage (Department of Rural Development and Land Reform,
2013).
1.2.2 Forestry industry of South Africa
Timber plantations cover around 1.3 million hectares of land in South Africa (Forestry
South Africa, 2017) with 3 types of trees dominating these plantations: wattle, covering
12%; pine, covering 44% and eucalyptus, covering 44%. Of the 1.3 million hectares
49% of plantations are in Mpumalanga (305835ha), 20% in Natal (120920ha), 19% in
the Eastern Cape (118326ha), 8% in the Western Cape (47312ha) and 4% in Limpopo
(26919ha) (Forestry South-Africa, 2017). Of the commercial farms only 3.7%
(45 304.87ha) are small scale forestry farmers (Forestry South Africa, 2017). The
wood produced from all plantations are used in the manufacturing of hundreds of
products such as pulp and paper, cellulose (which is used in many other processes)
transmission poles, mining supports, furniture, charcoal, adhesives and many more.
According to the latest publication of Statistics South Africa (2017) on forestry, logging
and related services the total income for the forestry sector was R16 573 million, the
total expenditure R14 180 million, the carrying value of assets at the financial year end
R10 442 million and the capital expenditure on assets R1 146 million. According to
these statistics the capital expenditure of 6.92% per annum is the industry norm.

- 9 -
1.2.3 Mechanisation
Farm mechanisation is a vital consideration for agricultural production. Without
mechanization farmers would struggle to progress from merely self-sustaining
production sufficient to surplus production export. The continuous growth of demand
places pressure on the dwindling resources of mother earth. This increasing demand
drives the need for sustainable mechanisation (Kienzle et al., 2013). Mechanisation in
forestry is becoming increasingly vital due to the competitive nature of global timber
markets (SA Forestry, 2015). This means that in order to compete on an international
level, the South African forestry industry has to harvest and process timber as cost
effectively and sustainably as possible.
The first instances of mechanisation in the agricultural sector in South Africa occurred
in the 1850’s in the Cape colony mainly in wheat production which was caused by the
loss of control over labour (Schirmer, 2004). Changes in the forestry market with
higher pulp and cellulose demand, as well as, increasing labour cost has changed the
way in which pulp is produced. The changes in production were specifically done with
mechanisation in mind in order to increase productivity and drive down costs. Timber
must be harvested and handled in the shortest possible time to ensure maximized
output and increase profits. Considerable decreases in manual labour needs, together
with large increases in productivity, can be achieved by making use of mechanisation
processes in the forestry management activities (Bluszkowska & Nurek, 2014).
Historically timber harvesting was done manually in Southern Africa. In the forestry
environment, like most production environments, production operations requires
substantial physical input. The physical input can be provided by manual labour or
human operated machinery (Demir, 2010). In the current technological era, many
advancements have been made in the mechanisation of the timber harvesting
process. Machines such as the debarker (replacing the axe man), processor (replacing
the axe man and some parts of the chain saw operator), loaders, skidders, skylines,
tractors, forwarders and feller buncher have been developed to reduce manual labour,
increase the productivity and increase safety in the tree harvesting process. Safety is
one of the major concerns in forestry. Technology and mechanisation enables forest
workers to harvest timber in a safe manner (McEwan, 2017).

- 10 -
The level of harvesting mechanisation currently implemented at Mondi (largest
producer of timber in South Africa) stands at 82% and some areas of the Mondi
planation is 99% mechanised (Mondi, Sustainable development report. 2011). Similar
levels of mechanization is found in other major forestry companies in South Africa.
Thus, mechanisation appears to be beneficial to the forestry sector due to benefits
such as increased productivity, safety and reduction in labour problems (Marshall,
2004:158).
Timber harvesters are all very expensive in the South African market as most of them
are imported. Large capital investments are required for timber harvesting machines,
especially in South Africa since all machines are imported. The operating costs of
harvesting machines are significant with the ever fluctuating fuel prices and
maintenance costs (SA Forestry, 2015). The cost of a mechanical harvester can vary
from R 1 million up to R10 million depending on the brand and age of the machine and
what its capabilities are. The research and planning to mechanise the timber
harvesting process requires knowledge of the economic, technical and management
characteristics of the forest business and its trading environment (Demir, 2010).
Determining whether these capital investments are feasible against the traditional
manual labour method would be essential for the survival and economic progress of a
forestry company.
1.2.4 Manual labour
Forestry continues to be one of the most dangerous industrial sectors in the world and
there are discouraging trends of rising accident rates, high occurrence of occupational
diseases and early retirement among forestry workers. Physical hazards such as the
climate, motor manual work, noise and vibration, chemical hazards and machine
safety is some of the concerns to the safety of forestry workers (Department of Labour,
2017).
Before the forestry mechanisation process started a few years ago, tree harvesting
was regarded as desperation employment. The turnover of labour in the forestry sector
was at 20 to 50% and absenteeism ranged from 10 to 20% (Mondi, Sustainable
development report 2011). The total number of employees in the forestry sector in
2008 was 106 844 and decreased by 17.44% in 2016 to 88 200, (Forestry SA, 2017.
Forestry SA, 2008). Large labour consumption in forestry harvesting processes is

- 11 -
above all, the result of the character and task awareness mode in mechanisms
undertaken in forestry. Large quantities of labour is necessary to achieve the desired
output of pulp.
The current minimum wage as of 1 March 2017 in the forestry sector of South Africa
is R15.39 per hour (Ramutloa, 2017). The South African government announced that
the minimum wage will increase to R20 per hour by the 1st of May 2018 (Sefako-Musi,
2017). This increase will greatly impact the profits of forestry farmers. The increase in
minimum wage necessitates farmers to explore other avenues of reducing labour
costs. Mechanization provides one solution however great consideration is needed to
weigh the cost/benefit.
PROBLEM STATEMENT
The following problem statement was derived for this study.
A study on the profitability to mechanise the harvesting process for the small scale
forestry farmer. By comparing the costs associated between the manual and
mechanical harvesting process this problem could be resolved.
OBJECTIVES
1.4.1 Main objective
The main objective of this study is to determine the best cost solution between
mechanical timber harvesting and manual labour timber harvesting for the privately
owned small scale forestry farmer in South Africa.
1.4.2 Secondary objectives in literature
To provide a background of the forestry industry.
To conceptualize the trend of mechanisation in the forestry sector.
To put the role of manual labour in the tree harvesting process into context.
To explain the costs associated with mechanisation and manual labour in the
tree harvesting process.
1.4.3 Secondary objectives in the empirical study
To define the population and sample of the study.
To collect the necessary data by means of interviews and financial data.
To analyze the data.

- 12 -
To come to a conclusion and recommendation for the privately owned forestry
farmer.
RESEARCH DESIGN
1.5.1 Literature review
The literature review of this study will be based on information collected from scientific
journals, books, articles and other research documents. Databases such as
EBSCOhost, Lexus Nexus, Emerald, Google Scholar, Internet sources, and Sae
Publications were consulted to gather the secondary resources related to the study.
1.5.2 Empirical study
To gather the primary information an empirical study will be conducted with a
descriptive research design by using a qualitative survey method. The data will be
analysed by means of a case study research design.
1.5.2.1 Population
The population of the study will include all small scale forestry farmers in South Africa.
The study population is mostly located in Mpumalanga, Kwazulu-Natal (KZN),
Limpopo, Eastern Cape and the Western Cape where the most of the commercial
forests are located in South Africa. The population regarding the data collection in
relation to costs collection would be forestry machine manufactures and both
mechanical and manual labour timber harvesting companies.
Data on the cost involved in acquiring and maintaining a mechanical timber harvesting
operation as well as the cost for a manual labour operation will be collected. The data
will be analysed to obtain a cost comparison between a mechanical and manual labour
operation. For the purpose of this study only the harvesting and not the extraction and
loading of pulp, will be analysed.
1.5.2.2 Sample
The case study research method usually selects a small geographical area or a very
limited number of individuals as the subjects of study (Zainal, 2007). The sample size
for this study will include a mechanical and a manual labour harvesting company as
well as two companies that sell mechanical harvesters. The required financial data of

- 13 -
the sample population will be collected. Additionally, five case studies will be
conducted on actual timber farmers. A conclusion is made based on the financial data
and the result of the case studies. The sampling strategy for this study will be
conducted on a non-probability-purposive sampling. The harvesting companies are
currently harvesting on a contractual basis for larger forestry companies in the
Highveld region of Mpumalanga. The companies selling the harvesting equipment are
situated in Nelspruit and Richards Bay. The farmers that will participate in the study
are also situated in the Highveld region of Mpumalanga and deliver their pulp wood on
a contractual basis to paper manufacturers.
1.5.2.3 Research method
This study will take the form of an exploratory case study with multiple case studies as
design. The case studies aim to analyse the specific issues within a specific
environment, organization and situation. This study will analyse the timber harvesting
process in the forestry industry with regards to the small scale forestry farmer,
specifically with regards to costs. Exploratory case study data collection methods can
include interviews, questionnaires and experiments. Data collection and analysis
within the context of the study can include a combination of qualitative and quantitative
data analysis to be able to capture the complications of real-life situations, so that the
situation can be studied in depth and better understood (Dudovskiy, 2016).
1.5.2.4 Data collection
The data collection method for this study would be qualitative. The data collection will
be structured interviews with structured questions for the farmers and the harvesting
company managers to investigate the costs and productivity associated with both
mechanical and manual tree harvesting processes. By making use of the qualitative
data collection method, case studies can explain both the process and outcome of a
phenomenon through complete observation, reconstruction and analysis of the cases
under examination (Zainal, 2007). The review of financial data obtained from forestry
machine manufactures will also be analysed.
This study will be conducted at a specific point in time and therefore will be a cross-
sectional study. Costs and financial data can vary over time, therefore the data will

- 14 -
only be accurate for a specific period and should be adapted as changes in costs
occur.
Interviews with the financial managers of the harvesting companies were conducted
for relevant costs and the productivity for both mechanical and manual operations.
Data collection from the farmers are also done by means of interviews. Questions
included the amount of hectares planted, distance to the buyer, species of trees
planted and annual harvesting plans. These factors influence the costs as well as the
measured yield per hectare on the plantations. These factors can therefore provide an
indication of the profitability of the operation.
The running costs of the machinery will be collected from the manufacturers of the
machinery. Information such as the fuel consumption, repair costs and operating cost
will be collected.
1.5.2.5 Data analysis
The data collected from the literature and empirical study, will be analysed to calculate
the total costs associated with the harvesting process. A costing model for machine
costs in the forestry biomass supply chain, created for the European Cooperation in
Science and Technology (COST), will be used to calculate the costs of the mechanical
harvesting process (Ackerman et al., 2014). A costing model for the manual tree
harvesting process will be developed by taking information from the literature and the
empirical study. This cost will be expressed as a total cost per year and a cost per unit
of production. The costs of the mechanical and manual harvesting process will then
be compared to establish which process is the most profitable.
These calculations will be applied on the five forestry farming case studies to indicate
if the investment is profitable or not for each farmer. Thereafter overall conclusions
and recommendations will be made.
DEMARCATION OR LIMITATIONS OF THE STUDY
The industry that will be analyzed is the private forestry sector in South Africa. This
study will only look at the costs of the harvesting process of eucalyptus trees
(commonly referred to as gum trees) for the use of pulp, and not the loading and
extraction of the timber or the harvesting of pine trees.

- 15 -
Information will be collected from respondents on the Highveld area of Mpumalanga
in South Africa. Financial data will be collected from companies in the industry which
also operate in the Highveld area of Mpumalanga. The data is viewed with objectivity
to let the facts speak for themselves. The situation of five private forestry farmers is
analyzed with regards to their timber harvesting processes in isolation and the results
could therefore not be generalized to the whole population or complete processes
relating to production and processing of timber.
To analyze the costs of the different operations use is made of financial statements
and cost based information obtained from manual and mechanical harvesting process
orientated companies as well as companies that supply tree harvesting machinery. A
program is then created on Microsoft Excel with this financial information whereby real
life scenarios of private forestry owners is analyzed. Recommendations will be
provided on whether it would be financially viable to mechanise the timber harvesting
process for the farmer. Thereafter an overall recommendation will be given on whether
mechanisation for the private forestry owner is viable or not based on the conclusions
of the financial analysis.
SUBSTANTIATION OR CONTRIBUTION OF THE STUDY
The researcher will ensure that the sample is a correct and consistent representation
of the total population. The data collected is correct, accurate and consistent and gives
a true reflection of what is happening in the industry. The data collected will be aligned
with the literature study to ensure a high degree of reliability. The researcher will also
ensure that the conclusions that are drawn are reasonable and appropriate given the
aims and background of the study. Having obtained a reasonable sample size by
analyzing more than one case study gives the opportunity to the researcher to
generalize the findings to the population (Zainal, 2007). The researcher will therefore
conduct the analysis of the five forestry farmers’ situations.
All managers need to make decisions on whether to make capital investments in
machinery or expansion of workforce or to divest. . Sufficient, reliable data is the most
important factor in this decision and is not always available to base a well thought-
through decision on. This study will contribute to the forestry farmers’ decision making
in relation to mechanisation of the harvesting process in their own businesses in South
Africa. This study will give information of what would be the necessary amount of

- 16 -
capital to start up mechanical harvesting and maintenance versus the costs of manual
labour.
PROPOSED CHAPTER LAYOUT
For this research document the following layout is established:
Chapter 1: Introduction
Chapter 2: A literature review of mechanisation and manual labour in the
forestry sector
Chapter 3: The empirical study which includes the collection of the data,
analysing the results and the discussion.
Chapter 4: The conclusion and recommendations
References and annexures.
- 17 -
CHAPTER 2: A LITERATURE REVIEW OF MECHANISATION AND
MANUAL LABOUR IN THE FORESTRY SECTOR
FORESTRY INDUSTRY
A comparison of the South African forestry industry with the rest of the world’s forestry
industry reveals that South Africa has a distinct advantage in a valuable resource that
needs to be protected and managed in order to be sustainable and contribute to the
economy. South Africa is eleventh on the list of the largest plantation areas in the
world, with China, India and Russia at the top with 46.6, 32.5, and 17.3 million hectares
of forests each (Forestry SA, 2017). Forestry in South Africa is the second largest land
user in the agricultural sector where maize uses 3.2 million hectares, forestry 1.3
million hectares, wheat 0.8 million hectares and sugar 0.4 million hectares (Forestry
SA, 2017).
South Africa mainly produces 3 types of timber: eucalyptus (gum), acacia (wattle) and
pinus (pine). The pine tree species is primarily used for saw timber for the furniture
and building industry, eucalyptus species is used primarily for the pulp and paper
production and the wattle species is used for paper and charcoal production (Sappi,
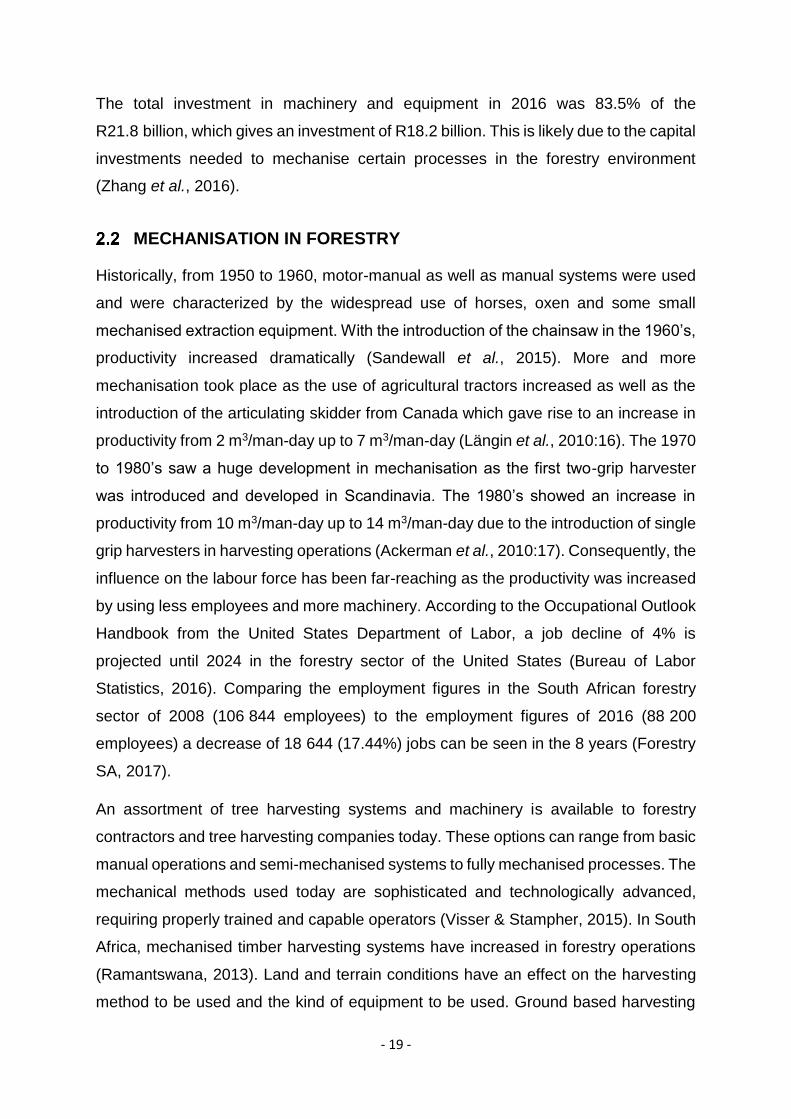
2017). South Africa’s 1.3 million hectares of plantations are spread over the country
as illustrated in figure 2.1.
Figure 0.1 Plantation area by province and specie (Adapted from: Forestry SA
2017, Facts and figures).
0 50000 100000 150000 200000 250000 300000 350000
Mpumalanga
KZN
E Cape
W Cape
Limp
Hectares
Pro
vin
ce
Plantation area by province and specie
Wattle Eucalyptus Pine

- 18 -
From figure 2.1 it is noticeable that the pine tree species takes the largest portion of
the land usage in Mpumalanga and the eucalyptus species the most land usage in
Kwazulu Natal (KZN). There are 175 032 ha eucalyptus planted in Mpumalanga and
239 404 ha eucalyptus planted in KZN (Forestry SA, 2017).
The value of the paper and pulp industry in South Africa for 2015 amounted to R28
billion and the direct contribution to the balance of trade of South Africa was R5 billion
(PAMSA, 2015). The sales volumes for timber in South Africa in 2016 is illustrated in
Table 2.1.
Table 2.1 Sales volumes of timber 2016 in SA (Adapted from: Forestry economic
services CC, 2016).
Product 2016
Poles 328 000 m3
Pulpwood 10 881 000 tons
Mining timber 433 000 tons
Saw logs 4 447 000 m3
Charcoal and other 353 000 tons
From the sales volumes in Table 2.1 it can be seen that the pulpwood is the largest
contributor in the forestry sector. This is mainly due to the large export market for paper
and packaging. Sappi exports 70% of the products manufactured at their Ngodwana
paper mill and most of their products are produced at their Saiccor mill (Sappi, 2017).
In 2016, a total of R42.9 billion was invested in the forestry sector of South Africa of
which 41.8% was invested in Mpumalanga (Forestry SA, 2017). The total book value
of investments in the forest products sector for 2016 was R 21.8 billion.
Table 2.2 Investments in forest products sector 2016 (Adapted from: Forestry
South Africa, 2017).
Machinery and equipment 83.5%
Movable assets 1.7%
Land and buildings 11.9%
Other 2.9%
- 19 -
The total investment in machinery and equipment in 2016 was 83.5% of the
R21.8 billion, which gives an investment of R18.2 billion. This is likely due to the capital
investments needed to mechanise certain processes in the forestry environment
(Zhang et al., 2016).
MECHANISATION IN FORESTRY
Historically, from 1950 to 1960, motor-manual as well as manual systems were used
and were characterized by the widespread use of horses, oxen and some small
mechanised extraction equipment. With the introduction of the chainsaw in the 1960’s,
productivity increased dramatically (Sandewall et al., 2015). More and more
mechanisation took place as the use of agricultural tractors increased as well as the
introduction of the articulating skidder from Canada which gave rise to an increase in
productivity from 2 m3/man-day up to 7 m3/man-day (Längin et al., 2010:16). The 1970
to 1980’s saw a huge development in mechanisation as the first two-grip harvester
was introduced and developed in Scandinavia. The 1980’s showed an increase in
productivity from 10 m3/man-day up to 14 m3/man-day due to the introduction of single
grip harvesters in harvesting operations (Ackerman et al., 2010:17). Consequently, the
influence on the labour force has been far-reaching as the productivity was increased
by using less employees and more machinery. According to the Occupational Outlook
Handbook from the United States Department of Labor, a job decline of 4% is
projected until 2024 in the forestry sector of the United States (Bureau of Labor
Statistics, 2016). Comparing the employment figures in the South African forestry
sector of 2008 (106 844 employees) to the employment figures of 2016 (88 200
employees) a decrease of 18 644 (17.44%) jobs can be seen in the 8 years (Forestry
SA, 2017).
An assortment of tree harvesting systems and machinery is available to forestry
contractors and tree harvesting companies today. These options can range from basic
manual operations and semi-mechanised systems to fully mechanised processes. The
mechanical methods used today are sophisticated and technologically advanced,
requiring properly trained and capable operators (Visser & Stampher, 2015). In South
Africa, mechanised timber harvesting systems have increased in forestry operations
(Ramantswana, 2013). Land and terrain conditions have an effect on the harvesting
method to be used and the kind of equipment to be used. Ground based harvesting

- 20 -
systems are generally restricted by a gradient between 0% to 60%, where after aerial
extraction (Sky lines and sometimes even helicopters) and manual felling operations
are necessary for steeper gradients (Ackerman et al., 2010).
TREE HARVESTING PROCESSES
Tree harvesting methods as practiced in South Africa are as follows:
•The full tree (FT) method occurs when trees are felled either by manual chainsaw or
a mechanical feller buncher, and all biomass above the stump is transported to the
roadside. This is one of the most widely used methods internationally and usually is
part of a mechanised operation as skidders are necessary to extract the full length
trees to roadside. This method has limited application in South Africa (Ramantswana
et al., 2013).
• The tree length (TL) method takes place when trees are felled, debranched and
topped in the compartment and only the stems are extracted to roadside. This method
is mostly moved away from as the cutting and the debranching of the tree is done by
means of manual chainsaw operators (Benjamin et al., 2013).
• The cut-to-length (CTL) method is where trees are felled, debranched, debarked,
crosscut and topped in the compartment. The round wood assortments are then
extracted to roadside. This method is the most widely used method internationally.
This method is largely used in South Africa especially with mechanised operations
where the trees are processed infield by means of a processor (Williams, 2017).
Tree harvesting equipment can be divided into 3 main categories:
Processing and felling equipment
Primary transport equipment (extraction from infield to roadside)
Loading equipment
Processing and felling can either be done manually, motor-manually or fully
mechanised. The equipment used in the manual felling and processing would include
the handsaw and axe. Equipment used in motor-manual operations would include the
chainsaw and axe. Fully mechanised felling and processing operations would make
use of highly sophisticated hydraulic harvesters (figure 2.2) which completes the whole
process from felling, de-limbing, debarking and cross-cutting the tree into preset

- 21 -
chosen lengths. Factors that can influence the productivity of tree harvesting machines
can include the size of the tree, the level of processing and quality required, species
of trees harvested, branching density and size, the terrain, the undergrowth of the
planation and the climate conditions (Alam et al., 2014:18). Some of the dis-
advantages of owning tree harvesting machine can include the high ownership and
operating cost, larger timber volumes needed to be viable and the mechanical
availability of the machine (Fath, 2001). All these factors need to be taken into
consideration when the harvesting planning is done.
Figure 2.2 Illustration of a mechanical tree harvester (SP Maskiner, 2017).
Primary transport, or commonly referred to as extraction, is the transport of timber from
the stump infield to the roadside or depot where larger trucks load and deliver the
wood to the buyer. Primary transport can be done either by manual labour or
mechanical machines. This mechanical extraction machines could include a 3
wheeled logger, tractor and trailer, skidder, or a forwarder (Mbosso et al., 2015:129).
Loading of the wood can be done either manually or by means of machines.
Depending on the size of operations and the task at hand, this machines can range
from 3 wheeled loggers up to a 20 ton hydraulic excavator with a grab (Kenney et al.,
2014).

- 22 -
MANUAL LABOUR IN FORESTRY
South Africa currently has 37 217 000 people in the active work force of which 6 177
000 are unemployed. 11 193 000 people are employed in the formal sector, 2 761 000
are employed in the informal sector and 835 000 are employed in agricultural sector
(Stats SA, 2017). The total number of employees in the forestry sector is 80 200 and
they earn an average annual salary of R83 895, which would include managers and
trained/skilled staff (Forestry SA, 2017).
The tree harvesting process by means of manual labour includes the use of chain
saws and axes. The chainsaw operator would fell, de-branch, and cross-cut the tree
to specific lengths, where after the axe men would de-bark the poles. The chainsaw
operator would usually earn a salary slightly above minimum wage as they require
specific skills as well as being involved in dangerous work while the axe men usually
earn a minimum wage as minimum skills are required (Walmsley, 2009).
The productivity per chainsaw per man day is determined by the tree size, tree
species, branch intensity, terrain, and climate conditions, especially wind (Gülci et al.,
2016:359; Ngulube et al., 2014). The advantages of the manual labour method
includes low capital costs and a large application scope as the slope, ground condition
and roughness and the tree size have little to no influence on the productivity (Dos
Santos & Migunga, 2014). The manual de-barking of eucalyptus trees involves a
person using an axe to remove the bark and cambium of the tree. The productivity of
the manual de-barker depends on the sharpness of the tools, the pole size, the tree
species, the branch size and quantity, the terrain slope and the health and fitness of
the labourer. The advantages of this method is job creation and low capital investment
while the disadvantages could be high labour turn over, low productivity and safety
risks (Ackerman et al., 2010).
SAFETY
Safety in both mechanical and manual tree harvesting operations is of great concern.
The accident rate in the forestry industry is significantly higher than in other sectors:
the fatal accident rate in the United States forestry in 2013 was 19 times higher than
other sectors, revealing that forest work is the most dangerous, with loggers being the
most exposed (Albizu-Urionabarrenetxea et al., 2013:395). One of the benefits of

- 23 -
mechanical harvesting operations is that it is regarded as safer because of less people
on the ground (Wall, 2012). Although mechanical harvesting is safer, there is still the
possibility of fatal accidents with mechanical harvesters which are often difficult to
avoid due to their unpredictable nature. For example, it has happened that a piece of
the cutting chain broke off from the mechanical harvester head and penetrated the
cabin of the machine hitting the operator in the neck and he subsequently died from
his injuries (Department of Labour and Industries, 2014).
As part of addressing the health, safety and environmental concerns raised in forestry,
the Forestry Stewardship Council (FSC) was established in 1993. Their main goal is
to promote sustainable forestry via means of ensuring that forests are managed in an
environmentally friendly, socially responsible and economically viable manner
(FSC.org, 2017).
COSTING
2.6.1 Relevant costing
All business decisions involves choosing between at least two alternatives in which
one must compare the costs between the situations or scenario’s (Seal et al., 2015).
The costs that differ between the scenarios are considered relevant costs as costs
that are the same will not impact on the outcome of the analysis. For example, in a
costing decision between mechanical and manual labour tree harvesting the office,
building and housing costs would be the same in each situation and would therefore
be irrelevant costs, and appointing a trained harvester operator would be relevant
costing as you would only need a trained harvester operator in a mechanical operation.
2.6.2 Process costing
The process costing method is used when a single product is mass produced or
manufactured on a continuous basis for long periods of time, and where the costs
related with individual units of production cannot be separated from each other (Seal
et al., 2015; Bragg, 2017). The process of manufacturing is usually divided into
departments as per the separately identifiable steps in the manufacturing process.
Different inputs and expenses such as materials, labour and overhead costs is added
to the product costs in each department. In process costing, the costs are accumulated
by the department and allocated to a unit of production.

- 24 -
COSTING IN THE FORESTRY INDUSTRY
Harvesting contractors and forestry farmers need to perform a process costing for
each project or contract that they will be conducting to be able to determine if a project
is economically viable. Each situation will be different as the location and external
factors such as the slope, tree size, tree species and volumes to be harvested will
differ (Saunders et al., 2012). The process costing in tree harvesting will include the
three departments of harvesting, extraction and loading/short hauling to the mill or
buyer. The costs in each department should then be converted to a price per ton or
m3 and added together to obtain the total cost for the process.
A costing model has been developed by the European Cooperation in Science and
Technology (COST) Action FP0902 to determine the costs of machines in the forest
bio-mass procurement chain as shown in figure 2.3 (Ackerman et al., 2014). All the
calculations in the costing have been standardised and are based on current costing
and procedures in forestry. This model requires the following inputs:
Machine type: Specifying the machine being studied in the model.
National currency in which the calculations must be done.
The costing unit: the unit of production the costs are expressed in (e.g. m3 or
tones).
Fixed cost inputs: Fixed or standing costs are costs that need to be recovered
by machine owners regardless of the amount of work a machine does or the
revenue it earns.
Variable cost inputs: Variable or running costs are incurred when the machine
is working.
Operator: The total cost of employing the operator, including wages, benefits
and overhead costs.
Productivity: Contains aspects of productivity, machine utilization, working days
or hours and the profit margin.
The costing model then gives a detailed breakdown of the costs per cubic meter (m3),
productive machine hour (PMH), scheduled machine hour (SMH), cost per day, week,
month or year from which conclusions can be drawn. Furthermore, it provides
indications and recommendations based on other studies to assist the user where

- 25 -
assumptions need to be made on costs and the productivity of the machine. The model
also splits the costs of the base machine and the attachments on the machine such
as the harvester head. The authors also noted that when calculating the cost for a
chainsaw, the cost must be added as an attachment machine as the base machine
calculation does not allow for the use of chains, cutter bars and sprockets

26
Figure 2.3 Forestry machine costing model (Source: Ackerman et al., 2014)

27
COSTS IN FORESTRY MECHANISATION
Costing for forestry machinery is usually sub-divided between capital cost, which
includes the fixed costs, and operational costs which includes the variable costs
(Saunders et al, 2012). Machines can include vehicles, harvesters, loggers, transport
trucks, forwarders and tractors. The machine costs can be divided into fixed costs and
variable costs. Fixed costs can include interest, depreciation, insurance and licensing
fees. Variable costs can include fuel, oil and lubricants, repairs and maintenance, and
tyres and or tracks. This costs is then expressed either as a cost per machine hour or
a cost per productivity in cubic-meters or tons (Belbo et al., 2014). Figure 2.4 indicates
that the process costing includes all machine costs, personnel costs and other
overheads.
Figure 2.4 Process costing breakdown. (Adopted from: Ackerman et al., 2010).
The hourly cost of the machine plus the operator is called the machine rate. The
machine rate is divided into labour costs, operating costs and ownership costs. Labour
costs includes the wages of the operator. Operating costs includes the variable costs
such as fuel, oil repairs and maintenance. Ownership costs includes the fixed costs of
the machine such as the purchase price of the machine, salvage value, depreciation
costs, interest costs, insurance and licensing fees. By adding all this costs together,
divided by the expected life span of the machine in hours, a cost per machine hour is

28
calculated. Dividing this per hour machine cost by the productivity in that machine
hour, would give the cost per ton or m3.
Assumptions and estimations need to be made to determine, for instance, machine
life in hours, maintenance costs as a percentage of the capital costs, life of the tracks
or tires of the machine as well as the downtime required for maintenance and break
downs (Belbo et al., 2014). Previous studies conducted in South African mechanical
harvesting companies have shown that the mechanical availability of a harvester is
about 74% and the utilization of the machine can be up to 68.8% (Ackerman et al.,
2017). Maintenance and repair costs expressed as a percentage of the capital cost of
the machine, can be the most unpredictable of all the costs (Adebayo et al., 2007) and
is highly dependent on the type an age of the machine as well as the availability of
parts and skills of available repairers. Other operating costs include fuel and oil costs.
According to the most manufacturers of hydraulic excavators, the recommended
service interval for hydraulic oil is 2000 machine hours and the service interval of the
engine oil is every 250 machine hours (Hitachi, Caterpillar, and Volvo). The average
oil and lubricant consumption per machine hour added up to 2.62 litre per machine
hour or 0.08l per m3 of production in a previous study conducted (Ackerman et al.,
2017).
MANUAL LABOUR COSTS
When looking at the motor-manual tree harvesting costs, the main factors are labour
and labour productivity (Liepins et al., 2015). The capital investments are much lower
compared to mechanical harvesting as the only machines and tools used is a chain
saw and axes. Fixed costs in manual harvesting includes the cost of obtaining
chainsaws and hatchets. Variable costs can include the labour, fuel and lubricants,
and personal protective clothing costs. Table 2.3 provides a summary of the
consumptions associated with the operation of a chainsaw excluding the investment
return and labour cost of the chainsaw. From table 2.3 can be derived that the largest
operating consumption associated with a chainsaw is the fuel consumption and then
chain lube. The life expectancy of a chainsaw is lower than other larger machineries
at1000 machine hours (Anna, Diego, 2011). Thus if the daily productivity of a chainsaw
is 28 m3 in a 8 hour productive day (Vusic et al, 2012), then the chainsaw can deliver
3500 m3 until the end of its life span. The chainsaw would then last 125 days which

29
would mean that for a full year’s production with 260 working days, 2.08 chainsaws
would be needed per chainsaw operator.
Table 3.1 Consumption of a chainsaw (Adapted from Popovici, 2013)
Specification Consumption
Fuel 0.428 l/m3
Chain lube 0.177 l/m3
Mixture oil 0.015 l/m3
Chains 0.01 pcs/m3
Auxiliary materials (Files) 0.02 pcs/m3
Personal protective equipment (PPE) is crucial for forest workers as the accident,
death and injury rate in the forestry sector is very high (Albizu-Urionabarrenetxea,
2013). The Occupation Health and Safety Act (181 of 1993) states that all employers
of forestry workers must, by law, provide the necessary protective clothing and
equipment free of charge to all the employees that require it. This equipment and
clothing includes: safety helmets, safety footwear, hearing protection, eye protection,
safety gloves, leg protection, rain coats and chainsaw operator pants (Department of
Labour, 2017).
Transportation costs must also be included in the cost of a manual labour team. A
study conducted in 2017 by the Department of Agriculture Fisheries and Forestry
showed that the total cost for a 3 ton truck stood at R6.88 per km (Department of
Agriculture, Forestry and Fisheries, 2017). The fuel price at the time was at R12.95
and the oil price at R29.46. Interest was calculated at 12%.
CONCLUSION
The forestry industry of South Africa makes a great contribution to the country’s
economy. Despite this promising outlook, forestry famers must still consider options
of improving productivity and increasing their profits in line with other countries’ efforts
to do the same. Determining the costs involved in mechanisation and manual labour
in the tree harvesting process requires for both situations that the relevant costs are
subdivided and allocated to fixed and variable cost. In mechanisation, the capital
investment is much larger than in manual labour harvesting. Managerial estimations

30
and assumptions are needed to do the costing for the mechanisation process, such
as the cost of repairs and the productivity of the operator. In manual labour the
productivity of the labour force has a significant impact on the production of the
company as absenteeism and safety greatly impact the cost. The following chapter
will take a more detailed look at the individual costs and the effects they have on a
small scale forestry farmer’s business.

31
CHAPTER 3: AN EMPIRICAL STUDY - DATA COLLECTION,
RESULTS AND ANALYSIS
INTRODUCTION
This chapter will outline the research method, population of the study, how the sample
was selected, data collection methods and the results of the study.
RESEARCH METHOD
This study undertakes the form of an exploratory case study with a multiple case study
design. This case study analyses the specific issues related to cost drivers within the
forestry environment with regards to the tree harvesting process, for small scale
forestry farmers in South Africa. This study design provides the opportunity to examine
what is unique and what is common across the individual cases and to reflect on the
theory developing from the findings.
POPULATION
The population of the study includes all small scale forestry farmers in South Africa.
The study population is mostly located in Mpumalanga, Kwazulu-Natal (KZN),
Limpopo, Eastern Cape and the Western Cape where the most of the commercial
forests are located in South Africa. The population regarding the cost collection would
be forestry machine manufactures and both mechanical and manual labour tree
harvesting companies.
SAMPLE
The sample size for the financial date required for the study includes a mechanical
and a manual labour harvesting company as well as two companies that sell
mechanical harvesters. The scenarios of five tree farmers in the Highveld area of
Mpumalanga were analysed. The sampling strategy for this study will be conducted
on a nonprobability-purposive sampling. Respondents in the Highveld region of
Mpumalanga will be selected. The harvesting companies are currently harvesting on
a contractual basis for larger forestry companies in the Highveld region of
Mpumalanga. The companies selling the harvesting equipment are situated in

32
Nelspruit and Richards Bay. The farmers that will participate in the study are situated
in the Highveld region of Mpumalanga and are delivering their timber on a contractual
basis to paper manufacturers.
DATA COLLECTION
Data collection methods for this study includes in-depth interviews and questionnaires.
Data collection and analysis within the context of the study includes a combination of
qualitative and quantitative data analysis to be able to capture the complications of the
real-life situations of the farmers, so that the situation can be studied in-depth and
better understood (Dudovskiy, 2016). The questionnaires were filled in by the
researcher while in interview with the forestry farmers. The interviews were conducted
at the respondents’ offices in order for them to have access to the required statistical
data concerning their forestry harvesting operations.
In-depth interviews were conducted with forestry harvesting managers. The interviews
took place at the offices of the respondents as in order for them to have access to the
data required. The conversations were recorded with the approval of the respondents.
The respondents gave permission for their names to be made available for research
purposes. Both Neethling and Bekker are the operational managers at mechanical
harvesting companies in the Highveld region of Mpumalanga. Bekker manages 3
harvesting machines and various other forestry equipment and has 4 years’
experience in this industry. Neethling is the operational manager of 8 mechanical
harvesters and various other forestry machines and has 6 years’ experience in this
field. Stansfield is the regional sourcing manager at a well-known forestry company in
the procurement department for tree harvesting contracts. Nthunzi is the owner of a
manual labour tree harvesting company that operates in the Highveld region of
Mpumalanga. He currently has 5 harvesting teams which consists of 1 chainsaw
operator, 1 pusher and 10 de-barkers in each team. They harvest eucalyptus year-
round and in summer they harvest wattle for small scale forestry farmers.
RESULTS
The following information was obtained in the in-depth interviews with the harvesting
managers as well as from quotations obtained from companies supplying the

33
machinery and equipment necessary for the costing. This data was used to populate
the excel spread sheet to analyse the scenarios of the forestry farmers.
3.6.1 Productivity
3.6.1.1 Mechanical harvester productivity
The productivity of a machine is dependent on the hours of operation vs the hours of
maintenance and breakdowns, the rest-allowances of the operator and other waiting
times as well as the tree size, number of trees per hectare and operator skill. For every
9 hour working shift there should be about 45min of daily maintenance where the
machine is greased, all the oils are checked and filled up and the cutting chain is
sharpened or changed as well as checking the rest of the machine for any
breakdowns. Machine availability for production depends on the age of the machine
and number of breakdowns. Machine breakdown time should be based on historical
information and estimated to determine the productive time as an accurate prediction
is not feasible. Machine availability is estimated to be at around 80% (Stansfield, 2017;
Bekker, 2017; Neethling, 2017). On a 9 hour shift, an operator should be allowed at
least 30 mins to eat and rest which translates to 6% of the hours per shift (Department
of Labour, 2017). Other waiting times include when the operator needs to change the
cutting chain or clean the guide bar of the saw unit. These tasks are usually simple
and take no more than 2% of the shift time. Taking all these factors into consideration
it can be concluded that of a 9 hour shift, only 6.02 hours are productive machine
hours which gives a machine utilization of 67%. A suitably qualified harvester operator
should be able to harvest 55 trees per machine hour with an average tree size of 0.2m3
(Neethling, 2017; Stansfield, 2017; Bekker, 2017). This translates to 11m3 or 8.46
tonnes per productive machine hour. The standard industry conversion for eucalyptus
pulp wood is 1 ton = 1.3m3 (Oester & Bowers, 2009).
3.6.1.2 Manual labour productivity
Time studies that have been conducted in eucalyptus harvesting showed that the
average chain saw operator can fell, de-limb and cross-cut 140 trees, with an average
size of 0.2m3 per tree, in a 9 hour work day, which should translate to an average of
21.5 tons per day depending on the species (Nthunzi, 2017). On an average 8 2.4
meter poles come from a tree that is 0.2m3 in size.

34
The average de-barker can debark 100 2.4 meter poles in a 9 hour working day
(Ciobanu, 2013; Montorselli et al., 2010). This means that for every chainsaw operator
felling and cross-cutting, a manual harvesting team should have 10-12 debarking
labourers. Each chainsaw operator should also have one person assisting them in the
felling of the tree to guide the felling direction of the tree as well as handling the
measuring stick for the cross cutting of the tree. The weather conditions should also
be taken into consideration when determining possible productivity. Rain and high fire
danger index periods prohibits the manual labour team from conducting their work
safely (Nthunzi, 2017).
3.6.2 Mechanisation costs
The cost of a machine should be consolidated towards determining annual ownership
cost, monthly ownership cost, a cost per ton or m3 and a cost per machine hour to get
clear understanding of what the machine costs entail (Stansfield, 2017).
For a new mechanical tree harvester (excavator with processor head) the rule of
thumb used in the industry for maintenance costs is around 80% of the capital cost of
the machine (Stansfield, 2017; Bekker, 2017; Neethling, 2017). The oil costs are
usually expressed as a percentage of fuel consumption of the specific machine as oil
is consumed at a consistent positively correlated rate with fuel (Stansfield, 2017). In
the industry, the oil cost for a machine with extensive hydraulics is calculated at 15%
of the fuel consumption of the machine (Bekker, 2017; Neethling, 2017). The life of the
tracks of the machine is also estimated at around 10 000 machine hours and should
be included in the costing (Stansfield, 2017). The average salary of a harvester
operator is at R450 per shift depending on the experience of the operator (Bekker,
2017; Neethling, 2017).
Table 3.1 shows the price, including Value Added Tax (VAT), for machinery and
equipment as per quotations received in 2017 (annexure 1, annexure 2, annexure 4
and annexure 7).

35
Table 3.1 Machinery and equipment cost
Product/machine Price per item
Hitachi ZX20056 excavator R 1 687 200.00
SP 591 LX G3 harvester processor R 2 290 260.00
Husqvarna 61 chain saw R 6 999.00
Hatchet R 279.51
Round file R 25.00
Flat file R 58.90
Guide bars R 530.00
Chainsaw chain R 325.00
Table 3.2 shows the price of fuel and other consumables as received by quotations in
2017. These prices however can fluctuate from month to month as its dependent on
the rand/dollar price and Brent-crude oil prices. See quotes in annexure 3 and
annexure 6.
Table 3.2 Fuel and oil prices
Product Price per liter excluding
vat
Petrol unleaded 93 R 13.74
Diesel 50 ppm (wholesale) R 11.91
Chain lube (210 L containers) R 15.52
2-Stroke oil (20 L containers) R 76.00
2-stroke oil cost per litre petrol (500ml 2-stroke per
20l fuel)
R 1.90
Hydraulic 68 oil (210 L containers) R 21.42
Engine oil (15w 40) (20L containers) R 39.50

36
3.6.3 Manual labour costs
Average salary of a chainsaw operator in South Africa is R22.50 per hour or R200 per
day (Nthunzi, 2017). The de-barker receives a wage based on production of R1.50 per
de-barked pole. Thus if the de-barker produces an average of 100 poles a day, they
will receive a wage of R150 per day (Nthunzi, 2017).
Other costs that need to be identified and negotiated on each project is whether
transportation is required for the labourers or not. In most operations, the workers are
transported by means of a 3 ton truck that’s fitted with the correct seats and protection
to transport the employees to and from work (Nthunzi, 2017).
As personal protective equipment (PPE) is required by law in any harvesting operation
it must be included in the costing. Quotations obtained from work wear companies and
consolidated in table 3.3 shows the average price per item in 2017. See annexure 5
for detail.
Table 3.3 Prices for personal protective equipment and clothing
Product Price excluding vat per item
Overalls R 133.00
Safety boots R 225.00
Rain coat R 212.00
Leg protectors R 130.00
Hard hat R 20.50
Gloves R 28.50
Reflector jackets R 45.00
Chainsaw helmet R 420.00
Chainsaw operator gloves R 240.00
Chainsaw operator pants R 853.00
Chainsaw operator jacket R 240.00
3.6.4 Data collection for the forestry farmer scenarios
The 5 interviews were conducted with the forestry farmers in the Highveld region of
Mpumalanga. Each farmer provided information on the hectares utilized for forestry
and methods of tree harvesting on their farms. The farmers all deliver their eucalyptus

37
trees to a pulp and paper mill in Ngodwana. The farmers are FSC approved and as
part of this FSC certification they require a harvesting plan spanning 5 years that
indicate the possible production for each year.
3.6.4.1 Farmer 1
Farmer 1 owns a 998 ha farm in the Carolina district and produces pine (72 ha), wattle
(35 ha) and eucalyptus (491 ha) trees for pulp wood on his farm. The farmer currently
makes use of a mechanised process to harvest the trees. They utilize their harvesting
machinery by harvesting the trees produced by them as a priority and any spare
capacity of the machines is contracted to other small scale forestry farmers The main
drivers for mechanizing their harvesting process was to limit the impact of loss of
control over, productivity of, the labour force. Introduction of machination also
increased productivity and profits for the company in his view. Transportation is
required for the employees to and from work. The farm is ±25 km from town where the
labourers are picked up. Only 10 ha of his eucalyptus trees is planted on a slope of
more than 35% which enabled the use of machinery. The timber production projections
for the next 5 years are shown in table 3.4.
Table 3.4 Farmer 1 estimated production for the next 5 years
Year Eucalyptus Pine Wattle
2018 8 500 Tons 0 m3 0 Tons
2019 7 000 Tons 0 m3 0 Tons
2020 9 000Tons 0 m3 0 Tons
2021 8 000 Tons 10 000 m3 1 150Tons
2022 7 800 Tons 6 500 m3 0 Tons
Total 40 300 Tons 16 500 m3 1 150 Tons
5 year Average
annual production
8060 Tons 3300 m3 230 Tons

38
3.6.4.2 Farmer 2
Farmer 2 owns a 780 ha farm in the Warburton district and produces pine (120 ha)
and eucalyptus (410 ha) trees for pulpwood. Use of a manual process is in place to
harvest the trees. Currently, they utilize manual labour in the harvesting process and
machinery is used to load and extract the pulp wood. He also indicated that they make
use of a contractor for labour as he currently does not have the time capacity to
oversee the harvesting process. They will consider mechanization of the harvesting
process as if the productivity and safety will be increased. A decrease in costs will also
be a driver for mechanising the harvesting process. Transportation is provided to
employees to and from work. The farm is ±30 km from the village where the labourers
live. 10 ha of his eucalyptus and 100 ha of his pine trees is planted on a slope of more
than 35%. His production projections for the next 5 years are shown in table 3.5.
Table 3.5 Farmer 2 estimated production for the next 5 years
Year Eucalyptus Pine Wattle
2018 9000 Tons 0 m3 0 Tons
2019 7 000 Tons 9 000 m3 0 Tons
2020 6 000Tons 12000 m3 0 Tons
2021 6 500 Tons 0 m3 0 Tons
2022 7 000 Tons 5000 m3 0 Tons
Total 35 500 Tons 26 000 m3 0 Tons
5 year average
annual production
7100 Tons 5 200 m3 0 Tons
3.6.4.3 Farmer 3
Farmer 3 owns a 2800 ha farm in the Warburton district and produces pine (970 ha)
and eucalyptus (820 ha) and wattle (210 ha) trees for pulp and saw wood on the farm.
Manual labour process is utilized to harvest the pine and wattle trees and a
mechanised process to harvest the eucalyptus trees. The loading and extraction is
done by means of mechanical machinery. He indicated that the main reason for

39
mechanising the harvesting process is the increase in productivity and the control over
production. Farmer 3 said “It is easier to control the amount produced in a month with
the use of machinery”. He makes use of contractors for labour for the manual tree
harvesting process. Transportation is provided for employees as the farm is 12 km to
the closest residential area. ±10 ha of his eucalyptus and ±40 ha of his pine trees is
planted on a slope of more than 35%. His production projections for the next 5 years
are shown in table 3.6.
Table 3.6 Farmer 3 estimated production for the next 5 years
Year Eucalyptus Pine Wattle
2018 14 000 Tons 12 000 m3 0 Tons
2019 12 000 Tons 9 800 m3 6 800 Tons
2020 14 900 Tons 10 000 m3 7 000 Tons
2021 13 400 Tons 12 500 m3 3 000 Tons
2022 13 000 Tons 11 000 m3 6 500 Tons
Total 67 300 Tons 55 300 m3 23 300 Tons
5 year average
annual production
13 460 Tons 11 060 m3 4 660 Tons
3.6.4.4 Farmer 4
Farmer 4 owns a 1700 ha farm in the Lothair district and produces pine (320 ha) and
eucalyptus (780 ha) trees for pulp and saw wood on his farm. They currently makes
use of manual labour process to harvest both the pine and eucalyptus trees. The
loading and extraction is done by means of machinery. It was indicated that the main
reason he will look into mechanising the harvesting process is for increased
productivity and loss of control over the labour force as absenteeism increases
tremendously. It was also indicated that transportation will be provided to the
employees to and from work. The farm is 20 km from town where the labourers are
picked up. ±25 ha of his eucalyptus and ±80 ha of his pine trees is planted on a slope
of more than 35%. The production projections for the next 5 years are shown in table
3.7.

40
Table 3.7 Farmer 4 estimated production for the next 5 years
Year Eucalyptus Pine Wattle
2018 12 500 Tons 9 000 m3 0 Tons
2019 13 000 Tons 0 m3 0 Tons
2020 13 900 Tons 0 m3 0 Tons
2021 11 500 Tons 10 500 m3 0 Tons
2022 14 300 Tons 7 800m3 0 Tons
Total 65 200Tons 27 300 m3 0 Tons
5 year average
annual production
13 040 Tons 5 460 m3 0 Tons
3.6.4.5 Farmer 5
Farmer 5 owns an 1840 ha farm in the Amsterdam district and produces pine (407 ha),
eucalyptus (812 ha) and wattle (133 ha) trees for pulp and saw wood on his farm. They
currently makes use of manual labour in the harvesting process. The loading and
extraction is done by means of machinery. It was indicated that the main reason he
will look into mechanising the harvesting process is for increased profits and increased
productivity as well as the safety factor for employees. It was also indicated that
transportation will be provided for his employees as his farm is 37 km to a township
and he does not have the capacity to house them on his farm. ±20 ha of his eucalyptus
and ±50 ha of his pine trees is planted on a slope of more than 35%. The production
projections for the next 5 years are shown in table 3.8.

41
Table 3.8 Farmer 5 estimated production for the next 5 years
Year Eucalyptus Pine Wattle
2018 11 900 Tons 0 m3 0 Tons
2019 13 300 Tons 7 200 m3 3 200 Tons
2020 12 500 Tons 0 m3 1 000 Tons
2021 10 800 Tons 0 m3 0 Tons
2022 13 500 Tons 13 000 m3 1 850 Tons
Total 62 000Tons 20 200 m3 6 050 Tons
5 year annual
average production
12 400 Tons 4 040 m3 1 210 Tons
DATA ANALYSIS
3.7.1 The mechanisation costing model
The model was adopted from literature. In the costing some assumptions have to be
made. The assumptions are based on a rule of thumb used in the industry and from
the literature. The assumptions includes:
Maintenance costs at 100% of the capital cost.
Oil costs at 15% of the fuel consumption.
A residual salvage value of 20% of the machine price.
16 000 hour machine life.
10 000 machine hour life of tracks.
An interest rate of 12%.
Licensing and insurance at 1% of the machine price.
Labour overheads as 10 % of labour wage.
An average tree size of 0.2 m3.
260 working days per year.
A production of 8.46 tones PMH.
Machine utilization of 70%

42
In order to come to a conclusion for each farmer the researcher had to add to the
costing model a part B in order to allow for non-productive days per year where the
harvesting work has been done and the machine is not working. The owner of the
machine will still have to pay the operator and allow for ownership cost of the machine.
In this costing model only the required annual production must be entered. This model
then gives the total cost per ton including the costs of the non-productive days. Table
3.9 shows an image of the costing model part B.
Table 3.9 Mechanical costing model part B
3.7.2 The manual labour costing model
This costing model was developed by the researcher by taking information from the
literature and the personal interviews. The following assumptions is based on the
literature and rule of thumb from the industry.
Assumptions:
A transport cost of R6.88 per km as per literature.
An interest rate of 12%.
Labour overheads as 10 % of labour wage.
An average tree size of 0.2 m3.
260 working days per year.
A chainsaw life span of 6 months.
Repair cost factor of 60% of a new machine for a chainsaw.
3% of the net wages allowed for medical expenses
1
R 137,96
8060
13857,5
5797,5
53,30
109
R 622,69
R 67 733,12
R 1 111 957,60
R 2 577,91
R 280 412,24
R 1 460 102,97
R 181,15
Farmer no:
per day
per annum
per annum
per tonTotal costs in Rands per ton
per ton
Tons
Tons
per annum
per day
days
per day
per annum
per annum
Labour cost per day
Labour costs of non-productive days
Total cost for productive days
Total fixed machine cost per non-productive day
Total fixed machine cost for non-productive days per year
Total cost per year
Gross cost per ton assuming a full years production
Required annual production
Estimated annual production assuming a full year production
Over prodcution capabilities
Production capabilities per day
Annual days of non-production

43
In this costing a breakdown of the labour, chainsaw, tools, PPE and transportation
costs is analyzed. All the grey and yellow filled areas are inputs to the model. The
model starts out by calculating the daily and monthly tons to be harvested.
The labour cost is divided into costs of leave, sick leave, unproductive days, statutory
costs such as UIF, and the staff costs. The productivity of each labourers is also
indicated in tons per day to give an indication of the production possible per day.
Management labour costs is allocated at 10% of the total labour costs. Transport costs
of the employees is calculated by the average distance per month times the cost per
km at R6.88 as per literature study, divided by the annual production. Protective
clothing and tools is allocated to the labourers with the number of pairs per year per
labourer and then worked to a cost per ton. The chainsaw costs is calculated with a
12% interest rate for financing the asset. The fuel usage is assumed at 7 liters per day
and the chain lube at 2 liters per day. The chainsaw repair costs by rule of thumb is
60% of the value of the machine.
The total harvesting cost per ton is then calculated by adding the cost of labour,
chainsaw costs, tool costs, PPE costs and the transportation costs. Figure 3.1 shows
part A of the costing model and figure 3.2 shows part B of the costing model

44
Figure 0.1 Manual labour costing model part A
Manual labour tree harvesting costing Farmer 0Eucalyptus manual harvesting Rate per ton
Tree size = 0,2 R 184,14
Felling task = 115 trees
Production - 23 tons/cutter
Terrain 0-35%
Calculation inclusive of leave and sickleave provision
NO overheads and/or indirect costs
CALCULATION OF HARVESTING RATEVOLUMES TO BE HARVESTED
complete
What is the annual (or annualized) tonnage or volume to be harvested? 10000 tons
month prod.day
Volume per: 833,3 40,3
What species to be harvested? Hardwood
PRODUCTION DAYS PER YEARcomplete
How many working days in this year? (5days times 52 weeks) 260 cst/day cst/month cst/year cst/ton
How many statutory leave days in this year? 12 249,02 5147 61758 6,18
How many days/labourer provided for sick leave/year? 10 207,52 4289 51465 5,15
How many days/labourer provided for leave/year? 15 311,28 6433 77198 7,72
How many days per year for un-productive time(red days etc.)? 3 62,26 1287 15440 1,54
Total 830,08 17155 205860,50 20,59
Labourer days available per year 220
Production days per year 248
Loss of production days / labourer / year 28
Average working days / month 20,67
STATUTORY COSTS AND PROVIDENT FUND
Indicate the relevant percentage in each case: % cst/mth cst/year cst/ton
WCA ( % of gross wage + salaries) 1,89 2092,44 25109 2,51
UIF (% as with workman's compensation) 1 1107,11 13285 1,33
What % of nett wage do you allow for medical expenses? 3 3019,40 36233 3,62
TOTAL= 6219 74627 7,46
CALCULATION OF STAFF COSTS.
PRODUCTIVITY
Cutter 13,44 ton/day
Stripper 1,68 ton/day
Salaried staff
OVERHEAD STAFF ONLY OVERHEAD STAFF ONLY UNSKILLED STAFF
No. of Name/ Gross No. of Name/ Gross No. of Name/ Nett
Managers describe monthly describe monthly describe daily
salary salary wage
1 Manager 10065
TOTALS: 1 R 10 064,67 0 0 0 0
Wage earners, daily paid staff.
SKILLED STAFF SKILLED STAFF UNSKILLED STAFF
No. of Name/ Nett No. of Name/ Nett No. of Name/ Nett
Supervisor describe daily describe daily describe daily
Drivers wage wage wage
1 Snr Induna 220,00 3 Chainsaw operator R 200,00 24 debarkers R 150,00
0
3 pushers R 150,00
TOTALS: 1 R 220,00 3 R 600,00 27 R 4 050,00
SUMMARY: UNITS /DAY /MTH /YEAR /TON
No. of overhead units = 1 Total overhead = 487,00 10 064,67 120 776,00 12,08
No. of skilled wage earners = 4 Total skilled = 820,00 16 946,67 203 360,00 20,34
No. of unskilled wage earners = 27 Total unskilled = 4 050,00 83 700,00 1 004 400,00 100,44
Total mandays/mth: 641 TOTAL = 5 357,00 110 711,33 1 328 536,00 132,85
AVERAGE WAGE Unskilled : = R 150,00 PER DAY
AVERAGE WAGE Unskilled : = R 3100,00 PER MONTH
AVERAGE WAGE Skilled : = R 205,00 PER DAY
AVERAGE WAGE Skilled : = R 4236,67 PER MONTH
COST OF TRANSPORT Your no. of salaried staff: = 1
Your no. of wage earners: = 31
complete
TRANSPORT
Cost per KM R 6,88
Distance traveled per day in km 74
Distance traveld annually in km 18352
Transport costs per annum R 126 261,76
Transporting vehicles needed 2
Total transport costs per annum R 252 523,52
/working /month /year /ton
day
Transport R 1 018,24 R 21 043,63 R 252 523,52 R 25,25
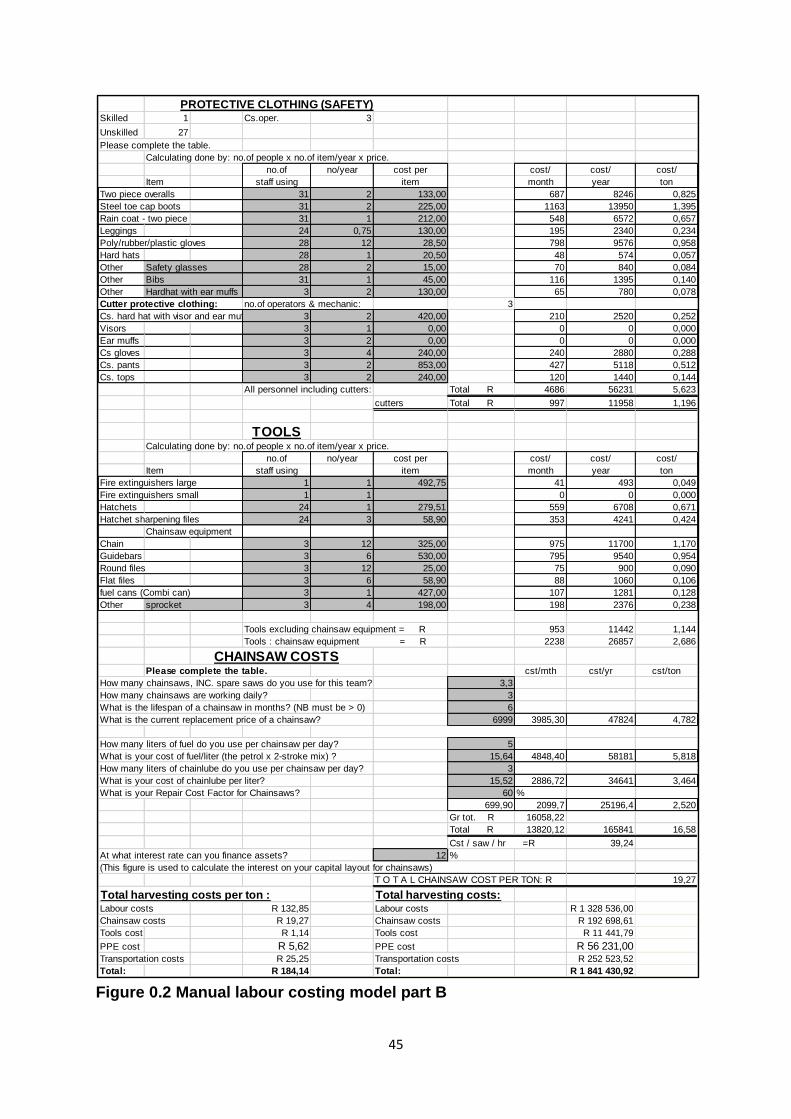
45
Figure 0.2 Manual labour costing model part B
PROTECTIVE CLOTHING (SAFETY)Skilled 1 Cs.oper. 3
Unskilled 27
Please complete the table.
Calculating done by: no.of people x no.of item/year x price.
no.of no/year cost per cost/ cost/ cost/
Item staff using item month year ton
Two piece overalls 31 2 133,00 687 8246 0,825
Steel toe cap boots 31 2 225,00 1163 13950 1,395
Rain coat - two piece 31 1 212,00 548 6572 0,657
Leggings 24 0,75 130,00 195 2340 0,234
Poly/rubber/plastic gloves 28 12 28,50 798 9576 0,958
Hard hats 28 1 20,50 48 574 0,057
Other Safety glasses 28 2 15,00 70 840 0,084
Other Bibs 31 1 45,00 116 1395 0,140
Other Hardhat with ear muffs 3 2 130,00 65 780 0,078
Cutter protective clothing: no.of operators & mechanic: 3
Cs. hard hat with visor and ear muffs 3 2 420,00 210 2520 0,252
Visors 3 1 0,00 0 0 0,000
Ear muffs 3 2 0,00 0 0 0,000
Cs gloves 3 4 240,00 240 2880 0,288
Cs. pants 3 2 853,00 427 5118 0,512
Cs. tops 3 2 240,00 120 1440 0,144
All personnel including cutters: Total R 4686 56231 5,623
cutters Total R 997 11958 1,196
TOOLSCalculating done by: no.of people x no.of item/year x price.
no.of no/year cost per cost/ cost/ cost/
Item staff using item month year ton
Fire extinguishers large 1 1 492,75 41 493 0,049
Fire extinguishers small 1 1 0 0 0,000
Hatchets 24 1 279,51 559 6708 0,671
Hatchet sharpening files 24 3 58,90 353 4241 0,424
Chainsaw equipment
Chain 3 12 325,00 975 11700 1,170
Guidebars 3 6 530,00 795 9540 0,954
Round files 3 12 25,00 75 900 0,090
Flat files 3 6 58,90 88 1060 0,106
fuel cans (Combi can) 3 1 427,00 107 1281 0,128
Other sprocket 3 4 198,00 198 2376 0,238
Tools excluding chainsaw equipment = R 953 11442 1,144
Tools : chainsaw equipment = R 2238 26857 2,686
CHAINSAW COSTSPlease complete the table. cst/mth cst/yr cst/ton
How many chainsaws, INC. spare saws do you use for this team? 3,3
How many chainsaws are working daily? 3
What is the lifespan of a chainsaw in months? (NB must be > 0) 6
What is the current replacement price of a chainsaw? 6999 3985,30 47824 4,782
How many liters of fuel do you use per chainsaw per day? 5
What is your cost of fuel/liter (the petrol x 2-stroke mix) ? 15,64 4848,40 58181 5,818
How many liters of chainlube do you use per chainsaw per day? 3
What is your cost of chainlube per liter? 15,52 2886,72 34641 3,464
What is your Repair Cost Factor for Chainsaws? 60 %
699,90 2099,7 25196,4 2,520
Gr tot. R 16058,22
Total R 13820,12 165841 16,58
Cst / saw / hr =R 39,24
At what interest rate can you finance assets? 12 %
(This figure is used to calculate the interest on your capital layout for chainsaws)
T O T A L CHAINSAW COST PER TON: R 19,27
Total harvesting costs per ton : Total harvesting costs:Labour costs R 132,85 Labour costs R 1 328 536,00
Chainsaw costs R 19,27 Chainsaw costs R 192 698,61
Tools cost R 1,14 Tools cost R 11 441,79
PPE cost R 5,62 PPE cost R 56 231,00Transportation costs R 25,25 Transportation costs R 252 523,52
Total: R 184,14 Total: R 1 841 430,92

46
CASE ANALYSIS
In the mechanisation costing process the costs for each farmer will be the same as
the machine capabilities and costs remains the same in each situation. The difference
comes in at the required annual production in part B of the costing. The costing model
for the manual labour team differs in each situation as the farmers have different
production needs thereby needing different amounts of labour. The inputs for the
mechanisation costing model part A can be seen in figure 3.3.
Figure 0.3 Inputs in the costing model part A

47
Inputs in the model included:
Base machine price at R1 687 200.00 including VAT.
Attachment price at R2 290 260.00 including VAT.
Salvage values at 20% of machine price.
Expected economic life of 16 000 machine hours.
Machine insurance at 1 % of the purchase price.
Fuel cost at R11.91.
Oil cost at 15% of fuel consumption.
Tracks at R100 000 per set with a life span of 10 000 machine hours.
Operator wage of R50 per hour.
Other operator costs at R1000 per year.
Social charges such as UIF, pension, sick pay, and holiday pay at 30 % of
wages.
PPE costs at R1500 per year.
Training at R2000 per year.
Operator phone charges at R1000 per year.
Insurance for employers’ liability at R2000 per year.
Machine insurance at R40 000 per annum
Operator transport at R2000 per year.
Maintenance and repair cost at 100% of the machine value.
Interest rate of 12%.
The productivity and operations input includes the following:
260 work days per year.
One shift per day.
9 scheduled hour per shift.
8.46 tons per PMH.
A machine utilization of 70%.
Overhead costs of 10% on fixed and variable costs.
The pre-emptive calculations from the costing indicates the following:
Scheduled hours per annum at 2 340 hours.
The productive hours per annum at 1 638 hours.

48
The estimated annual productivity at 13 857.48 tons.
The base machine and attachment’s expected economic life at 9.77 years.
A salvage value of R400 000 each for the base machine and the attachment.
The outputs from the costing model part A can be seen in Figure 3.4. From the output
of this model it can be seen that fuel cost makes up the most of the costs at 22.45%
of the total costs. Total fixed costs is R671 676.33 (35.13%) and variable cost R
919 139.54 (48.08%). Operator costs and company overheads is R161 900.00
(8.47%) and R 159 081.59 (8.32%) respectively. The total cost per ton is calculated at
R137.96 assuming a full years’ production.
Figure 0.4 Outputs from the costing model part A

49
3.8.1 Farmer 1
3.8.1.1 Mechanisation cost analysis
The production projection for farmer one is an average of 8060 tons per annum of
eucalyptus over the next 5 years. Table 3.10 shows the required production with the
total cost for the farmer if he would mechanise the harvesting process.
Table 3.10 Mechanisation costing part B farmer 1
From this calculation it can be seen that for farmer one, 109 of the 260 work days will
not be used on average over the next 5 years. The labour cost of non-productive days
amounts to R67 733.12 per annum, the total costs for productive days amounts to
R1 111 957.60 and the total fixed costs for non-productive days per year amounts to
R280 412.24. The total cost of mechanising the harvesting process for farmer one
would amount to R181.15 per ton or an average of R1 460 102.97 per year over the
next 5 years.
3.8.1.2 Manual labour cost analysis
An image of the complete costing for farmer 1 can be seen in annexure 8. Farmer
one’s average annual production over the next 5 years is 8 060 tons per annum which
translates to 32.5 tons per productive day and 671 tons per month. To reach the
production target, farmer one would need two chainsaw operators with a production
of 16.23 tons each per day, 16 de-barkers with a production of 2.03 tons each per day
and two pushers to assist the chainsaw operators. This would mean that the chainsaw
1
R 137,96
8060
13857,5
5797,5
53,30
109
R 622,69
R 67 733,12
R 1 111 957,60
R 2 577,91
R 280 412,24
R 1 460 102,97
R 181,15
Farmer no:
per day
per annum
per annum
per tonTotal costs in Rands per ton
per ton
Tons
Tons
per annum
per day
days
per day
per annum
per annum
Labour cost per day
Labour costs of non-productive days
Total cost for productive days
Total fixed machine cost per non-productive day
Total fixed machine cost for non-productive days per year
Total cost per year
Gross cost per ton assuming a full years production
Required annual production
Estimated annual production assuming a full year production
Over prodcution capabilities
Production capabilities per day
Annual days of non-production

50
operators will not work to full potential but with only one operator the target production
will not be made. The fuel consumption of each chainsaw would therefore decline to
5 liters per saw. Only one transport truck will be needed for this harvesting team. The
location of the farm is ±25 km from where the labourers will be picked up and the truck
would therefor drive about 50 km per day. Table 3.11 shows a summary of the manual
labour costing per ton and the total costs per year for farmer 1.
Table 3.11 Manual labour costing summary for farmer 1
From table 3.11 it can be seen that labour costs is the largest cost at R112.37 per ton
or R905 696 in total. The total cost to manually harvest trees for farmer one amounts
to R144.59 per ton or R1 165 403.35 in total.
3.8.1.3 Manual labour cost analysis based on 2018 minimum wages
Based on the 2018/2019 minimum wages of R20 per hour and the assumption that all
other costs remains constant the following will be true for farmer 1 in the next financial
year. In table 3.12 is a summary of the costing.
Table 3.12 Manual labour cost analysis based on 2018 minimum wages
From this table it can be seen that the labour cost will increase with R20.65 to R133.02.
The total harvesting cost will increase to R165.24 assuming that all other costs
remains the same.
Total harvesting costs per ton : Total harvesting costs:Labour costs R 112,37 Labour costs R 905 696,00
Chainsaw costs R 15,94 Chainsaw costs R 128 465,74
Tools cost R 0,97 Tools cost R 7 792,11
PPE cost R 4,73 PPE cost R 38 137,50Transportation costs R 10,58 Transportation costs R 85 312,00
Total: R 144,59 Total: R 1 165 403,35
R 133,02 R 1 072 104,00
R 15,94 R 128 465,74
R 0,97 R 7 792,11
R 4,73 R 38 137,50R 10,58 R 85 312,00
R 165,24 R 1 331 811,35
Total harvesting costs per ton : Total harvesting costs:Labour costs
Chainsaw costs
Tools cost
PPE cost
Transportation costs
Total:
Labour costs
Chainsaw costs
Tools cost
PPE cost
Transportation costs
Total:

51
3.8.2 Farmer 2
3.8.2.1 Mechanisation cost analysis
The production projection for farmer two is an average of 7100 tons per annum of
eucalyptus over the next 5 years. Table 3.13 shows the required production with the
total cost for the farmer if he would mechanise the harvesting process.
Table 3.13 Mechanisation costing part B farmer 2
From this calculation it can be seen that for farmer two, 127 of the 260 work days per
year, will not be used on average over the next 5 years. The labour cost of non-
productive days amounts to R78 948.96 per annum, the total costs for productive days
amounts to R979 516.00 and the total fixed costs for non-productive days per year
amounts to R326 845.32. The total cost of mechanising the harvesting process for
farmer two will amount to R195.11 per ton or a total cost of R1 385 310.28 on average
over the next 5 years.
3.8.2.2 Manual labour cost analysis
An image of the complete costing for farmer 2 can be seen in annexure 9. The average
annual production for farmer 2 over the next 5 years is 7 100 tons per annum which
translates to 28.6 tons per productive day and 591.7 tons per month. To reach the
production target, farmer two would need two chainsaw operators with a production of
14.31 tons each per day, 14 de-barkers with a production of 2.04 tons each per day
and two pushers to assist the chainsaw operators. This would mean that the chainsaw
2
R 137,96
7100
13857,5
6757,5
53,30
127
R 622,69
R 78 948,96
R 979 516,00
R 2 577,91
R 326 845,32
R 1 385 310,28
R 195,11
Farmer no:
per day
per annum
per annum
per tonTotal costs in Rands per ton
per ton
Tons
Tons
per annum
per day
days
per day
per annum
per annum
Labour cost per day
Labour costs of non-productive days
Total cost for productive days
Total fixed machine cost per non-productive day
Total fixed machine cost for non-productive days per year
Total cost per year
Gross cost per ton assuming a full years production
Required annual production
Estimated annual production assuming a full year production
Over prodcution capabilities
Production capabilities per day
Annual days of non-production

52
operators will not work to full potential but with only one operator the target production
will not be made. The fuel consumption of each chainsaw would therefor decline to 4.3
liters per saw. Only one transport truck will be needed for this harvesting team. The
location of the farm is ±30 km from where the labourers will be picked up and the truck
would therefore drive about 60 km per day. Table 3.14 shows a summary of the
manual labour costing per ton and the total cost per year for farmer 2.
Table 3.14 Manual labour costing farmer 2
From table 3.14 it can be derived that labour costs is the largest cost at R116.04 per
ton or R823 856 in total. The total cost to manually harvest trees for farmer one
amounts to R153.67 per ton or R1 091 049.62 in total.
3.8.2.3 Manual labour cost analysis based on 2018 minimum wages
Based on the 2018/2019 minimum wages of R20 per hour and the assumption that all
other costs remains constant the following will be true for farmer 2 in the next financial
year. In table 3.15 is a summary of the costing.
Table 3.15 Manual labour costing based on 2018 minimum wages
From this table it can be derived that the labour cost will increase with R21.13 to
R137.17. The total harvesting cost will increase to R175.57 assuming that all other
costs remains the same.
Total harvesting costs per ton : Total harvesting costs:Labour costs R 116,04 Labour costs R 823 856,00
Chainsaw costs R 17,33 Chainsaw costs R 123 035,53
Tools cost R 0,97 Tools cost R 6 879,69
PPE cost R 4,92 PPE cost R 34 904,00Transportation costs R 14,42 Transportation costs R 102 374,40
Total: R 153,67 Total: R 1 091 049,62
R 137,17 R 973 896,00
R 18,09 R 128 465,74
R 0,97 R 6 879,69
R 4,92 R 34 904,00R 14,42 R 102 374,40
R 175,57 R 1 246 519,83
Total harvesting costs per ton : Total harvesting costs:Labour costs
Chainsaw costs
Tools cost
PPE cost
Transportation costs
Total:
Labour costs
Chainsaw costs
Tools cost
PPE cost
Transportation costs
Total:

53
3.8.3 Farmer 3
3.8.3.1 Mechanisation cost analysis
The production projection for farmer three is an average of 13 460 tons per annum of
eucalyptus over the next 5 years. Table 3.16 shows the required production with the
total cost for the farmer if he would mechanise the harvesting process.
Table 3.16 Mechanisation costing part B farmer 3
From this calculation it can be seen that for farmer three, only 7 of the 260 work days
will not be used on average over the next 5 years. The labour cost of non-productive
days amounts to R4 644.06 per annum, the total costs for productive days amounts to
R1 856 941.60 and the total fixed costs for non-productive days per year amounts to
R19 226.20. The total cost of mechanising the harvesting process for farmer three
would amount to R139.73 per ton or R1 880 811.85 on average per annum over the
next 5 years.
3.8.3.2 Manual labour cost analysis
An image of the complete costing for farmer 3 can be seen in annexure 10. Farmer
three’s average annual production over the next 5 years is 13 460 tons per annum
which translates to 54.3 tons per productive day and 112.17 tons per month. To reach
the production target, farmer 3 would need three chainsaw operators with a production
of 18.09 tons each per day, 27 de-barkers with a production of 2.01 tons each per day
and three pushers to assist the chainsaw operators. This would mean that the
chainsaw operators will not work to full potential but with only one operator the target
3
R 137,96
13460
13857,5
397,5
53,30
7
R 622,69
R 4 644,06
R 1 856 941,60
R 2 577,91
R 19 226,20
R 1 880 811,85
R 139,73
Farmer no:
per day
per annum
per annum
per tonTotal costs in Rands per ton
per ton
Tons
Tons
per annum
per day
days
per day
per annum
per annum
Labour cost per day
Labour costs of non-productive days
Total cost for productive days
Total fixed machine cost per non-productive day
Total fixed machine cost for non-productive days per year
Total cost per year
Gross cost per ton assuming a full years production
Required annual production
Estimated annual production assuming a full year production
Over prodcution capabilities
Production capabilities per day
Annual days of non-production

54
production will not be made. The fuel consumption of each chainsaw would therefore
be 5.3 liters per saw. Two transport truck will be needed for this harvesting team. The
location of the farm is ±12 km from where the labourers will be picked up and the truck
would therefor drive about 25 km per day. Table 3.17 shows a summary of the manual
labour costing for farmer 3.
Table 3.17 Manual labour costing summary farmer 3
From table 3.17 it can be concluded that labour costs is the largest cost at R107.82
per ton or R1 451 296.00. The total cost to manually harvest trees for farmer three
amounts to R134.19 per ton or R1 806 227.88 in total.
3.8.3.3 Manual labour cost analysis based on 2018 minimum wages
Based on the 2018/2019 minimum wages of R20 per hour and the assumption that all
other costs remains constant the following will be true for farmer 3 in the next financial
year. In table 3.18 is a summary of the costing.
Table 3.18 Manual labour costing based on 2018 minimum wages
From this table it can be seen that the labour cost will increase with R20.27 to R128.09.
The total harvesting cost will increase to R154.20 assuming that all other costs
remains the same.
Total harvesting costs per ton : Total harvesting costs:Labour costs R 107,82 Labour costs R 1 451 296,00
Chainsaw costs R 14,58 Chainsaw costs R 196 189,46
Tools cost R 0,95 Tools cost R 12 810,42
PPE cost R 4,50 PPE cost R 60 620,00Transportation costs R 6,34 Transportation costs R 85 312,00
Total: R 134,19 Total: R 1 806 227,88
R 128,09 R 1 724 096,00
R 14,32 R 192 698,61
R 0,95 R 12 810,42
R 4,50 R 60 620,00R 6,34 R 85 312,00
R 154,20 R 2 075 537,03
Total harvesting costs per ton : Total harvesting costs:Labour costs
Chainsaw costs
Tools cost
PPE cost
Transportation costs
Total:
Labour costs
Chainsaw costs
Tools cost
PPE cost
Transportation costs
Total:

55
3.8.4 Farmer 4
3.8.4.1 Mechanisation cost analysis
The production projection for farmer four is an average of 13 040 tons per annum of
eucalyptus over the next 5 years. Table 3.19 shows the required production with the
total cost for the farmer if he would mechanise the harvesting process.
Table 3.19 Mechanisation costing part B farmer 4
From this calculation it can be seen that for farmer four, only 15 of the 260 work days
will not be used on average over the next 5 years. The labour cost of non-productive
days amounts to R9 550.98 per annum, the total costs for productive days amounts to
R1 798 998.40 and the total fixed costs for non-productive days per year amounts to
R39 540.67. The total cost of mechanising the harvesting process for farmer four
would amount to R141.72 per ton or a total of R1 848 090.05 on average per annum
over the next 5 years.
3.8.4.2 Manual labour cost analysis
An image of the complete costing for farmer 4 can be seen in annexure 11. The
average annual production for farmer 4 over the next 5 years is 13 404 tons per annum
which translates to 52.6 tons per productive day and 1086.7 tons per month. To reach
the production target, farmer four would need three chainsaw operators with a
production of 17.53 tons each per day, 26 de-barkers with a production of 2.02 tons
each per day and three pushers to assist the chainsaw operators. This would mean
4
R 137,96
13040
13857,5
817,5
53,30
15
R 622,69
R 9 550,98
R 1 798 998,40
R 2 577,91
R 39 540,67
R 1 848 090,05
R 141,72
Farmer no:
per day
per annum
per annum
per tonTotal costs in Rands per ton
per ton
Tons
Tons
per annum
per day
days
per day
per annum
per annum
Labour cost per day
Labour costs of non-productive days
Total cost for productive days
Total fixed machine cost per non-productive day
Total fixed machine cost for non-productive days per year
Total cost per year
Gross cost per ton assuming a full years production
Required annual production
Estimated annual production assuming a full year production
Over prodcution capabilities
Production capabilities per day
Annual days of non-production

56
that the chainsaw operators will not work to full potential but with only one operator the
target production will not be made. The fuel consumption of each chainsaw would
therefore be 5.3 liters per saw per day. Two transport trucks will be needed for this
harvesting team. The location of the farm is ±20 km from where the labourers will be
picked up and the truck would therefor drive about 40 km per day. Table 3.20 shows
a summary of the manual labour costing for farmer 4.
Table 3.20 Manual labour costing summary for farmer 4
From table 3.17 it can be seen that labour costs is the largest cost at R108.16 per ton
or R1 410 376.00. The total cost to manually harvest trees for farmer four amounts to
R139.18 per ton or R1 814 868.37 in total.
3.8.4.3 Manual labour cost analysis based on 2018 minimum wages
Based on the 2018/2019 minimum wages of R20 per hour and the assumption that all
other costs remains constant the following will be true for farmer 4 in the next financial
year. In table 3.21 is a summary of the costing.
Table 3.21 Manual labour costing based on 2018 minimum wages
From this table it can be seen that the labour cost will increase with R20.29 to R128.45.
The total harvesting cost will increase to R159.47 assuming that all other costs
remains the same.
Total harvesting costs per ton : Total harvesting costs:Labour costs R 108,16 Labour costs R 1 410 376,00
Chainsaw costs R 15,05 Chainsaw costs R 196 189,46
Tools cost R 0,95 Tools cost R 12 354,21
PPE cost R 4,56 PPE cost R 59 449,50Transportation costs R 10,47 Transportation costs R 136 499,20
Total: R 139,18 Total: R 1 814 868,37
R 128,45 R 1 674 992,00
R 15,05 R 196 189,46
R 0,95 R 12 354,21
R 4,56 R 59 449,50R 10,47 R 136 499,20
R 159,47 R 2 079 484,37
Total harvesting costs per ton : Total harvesting costs:Labour costs
Chainsaw costs
Tools cost
PPE cost
Transportation costs
Total:
Labour costs
Chainsaw costs
Tools cost
PPE cost
Transportation costs
Total:

57
3.8.5 Farmer 5
3.8.5.1 Mechanisation cost analysis
The production projection for farmer five is an average of 12 400 tons per annum of
eucalyptus over the next 5 years. Table 3.22 shows the required production with the
total cost for the farmer if he would mechanise the harvesting process.
Table 2.22 Mechanisation costing part B farmer 5
From this calculation it can be seen that for farmer five, 27 of the 260 work days will
not be used on average over the next 5 years. The labour cost of non-productive days
amounts to R17 028.21 per annum, the total costs for productive days amounts to
R1 710 704.00 and the total fixed costs for non-productive days per year amounts to
R70 496.05. The total cost of mechanising the harvesting process for farmer five would
amount to R145.02 per ton or R1 798 228.26 on average per annum over the next 5
years.
3.8.5.2 Manual labour cost analysis
An image of the complete costing for farmer five can be seen in annexure 12. Farmer
five’s average annual production over the next 5 years is 12 400 tons per annum which
translates to 50 tons per productive day and 1033.3 tons per month. To reach the
production target, farmer five would need three chainsaw operators with a production
of 16.67 tons each per day, 24 de-barkers with a production of 2.08 tons each per day
and three pushers to assist the chainsaw operators. This would mean that the
5
R 137,96
12400
13857,5
1457,5
53,30
27
R 622,69
R 17 028,21
R 1 710 704,00
R 2 577,91
R 70 496,05
R 1 798 228,26
R 145,02
Farmer no:
per day
per annum
per annum
per tonTotal costs in Rands per ton
per ton
Tons
Tons
per annum
per day
days
per day
per annum
per annum
Labour cost per day
Labour costs of non-productive days
Total cost for productive days
Total fixed machine cost per non-productive day
Total fixed machine cost for non-productive days per year
Total cost per year
Gross cost per ton assuming a full years production
Required annual production
Estimated annual production assuming a full year production
Over prodcution capabilities
Production capabilities per day
Annual days of non-production

58
chainsaw operators will not work to full potential but with only two operators the target
production will not be made. The fuel consumption of each chainsaw would therefore
decline to 5 liters per saw. Two transport trucks will be needed for this harvesting team.
The location of the farm is ±37 km from where the labourers will be picked up and the
truck would therefor drive about 74 km per day. Table 3.23 shows a summary of the
manual labour costing for farmer five.
Table 3.23 Manual labour costing summary for farmer 5
From table 3.24 it can be seen that labour costs is the largest cost at R107.14 per ton
or R1 328 536.00. The total cost to manually harvest trees for farmer one amounts to
R148.50 per ton or R1 841 430.92 annually. It is also noted that the transportation cost
for farmer 5 is much higher than for the other farmers at R20.36 per ton compared to
the average of R10.45 per ton for the other 4 farmers.
3.8.5.3 Manual labour cost analysis based on 2018 minimum wages
Based on the 2018/2019 minimum wages of R20 per hour and the assumption that all
other costs remains constant the following will be true for farmer 5 in the next financial
year. In table 3.24 is a summary of the costing.
Table 3.24 Manual labour costing based on 2018 minimum wages
From this table it can be derived that the labour cost will increase with R20.02 to
R127.16. The total harvesting cost will increase to R168.52 assuming that all other
costs remains the same.
Total harvesting costs per ton : Total harvesting costs:Labour costs R 107,14 Labour costs R 1 328 536,00
Chainsaw costs R 15,54 Chainsaw costs R 192 698,61
Tools cost R 0,92 Tools cost R 11 441,79
PPE cost R 4,53 PPE cost R 56 231,00Transportation costs R 20,36 Transportation costs R 252 523,52
Total: R 148,50 Total: R 1 841 430,92
R 127,16 R 1 576 784,00
R 15,54 R 192 698,61
R 0,92 R 11 441,79
R 4,53 R 56 231,00R 20,36 R 252 523,52
R 168,52 R 2 089 678,92
Total harvesting costs per ton : Total harvesting costs:Labour costs
Chainsaw costs
Tools cost
PPE cost
Transportation costs
Total:
Labour costs
Chainsaw costs
Tools cost
PPE cost
Transportation costs
Total:

59
CHAPTER 4: CONCLUSION & RECOMMENDATIONS
INTRODUCTION
The main goal of the study was to determine the best cost solution between
mechanical and manual labour timber harvesting for the privately owned forestry
farmer in South Africa. In the process of accomplishing the main goal certain
secondary goals were also reached. Determining the processes and methods used to
harvest timber and the costs associated with each method assumed a high degree of
importance in the literature and empirical study. In order to better understand the costs
associated with each harvesting method, five case studies on small scale forestry
farmers in the Highveld region of Mpumalanga was performed. The data from the
forestry farmers was collected by means of interviews. The data of the relevant costs
involved in the harvesting was collected from the literature and by means of interviews
and quotations from various timber harvesting companies and specialists in the
forestry sector.
A costing model was developed for the European Cooperation in Science and
Technology (COST) to calculate the cost of machines in the forestry bio-mass
procurement (Ackerman et al., 2014). The model was used to ensure more reliable
results, but for the purposes of the case study analysis, the model needed to continue
with a section B to analyse the results for drawing a conclusion. In this study a costing
for the manual labour harvesting method was developed by incorporating information
from literature and the empirical study.
CONCLUSIONS
By comparing the costs of each method in the specific farmers’ situation the following
conclusions can be derived.
4.2.1 Farmer 1
Farmer 1 has an average production projection of 8 060 tons per annum over the next
5 years. The costs to mechanise his harvesting process will amount to R181.15 per
ton or R1 460 102.97 in total per year on average. The cost of manual labour will be
much lower at R144.59 per ton or R1 165 403.35 annually. The mechanised
harvesting method results in a cost of to R36.56 per ton or R294 699.62 annually more

60
compared to the manual labour method. It is therefore not recommended for farmer 1
to mechanise his harvesting process.
Considering the 2018/2019 minimum wages increase to R20 per hour will substantially
increase the manual labour costing to R165.24 per ton, assuming all the other costs
remain constant. Therefore, even considering the minimum wage increase the cost
associated with mechanisation it is still not be viable for farmer 1 to mechanise the
harvesting process.
4.2.2 Farmer 2
Farmer 2 has an average production projection of 7 100 tons per annum over the next
5 years. The costs to mechanise his harvesting process will amount to R195.11 per
ton or R1 385 310.28 in total per year. The cost of manual labour will be much lower
at R153.67 per ton or R1 091 049.62 annually. The mechanised harvesting method
costs R41.44 per ton or R294 260.66 annually more for than the manual labour
method. It is therefore not recommended for farmer 2 to mechanise his harvesting
process.
The manual labour costs will substantially increase based on the 2018/2019 minimum
wages increase to R20 per ton, resulting in costs of R175.57 per ton, assuming all the
other costs remain constant. Compared to the cost to mechanise it will still not be
viable for farmer 2 to mechanise his harvesting process.
4.2.3 Farmer 3
Farmer 3 has an average production projection of 13 460 tons per annum over the
next 5 years. The costs to mechanise his harvesting process will amount to R139.73
per ton or R1 880 811.85 in total per year. The cost of manual labour will be lower at
R134.19 per ton or R1 806 227.88 annually. The difference in the costs amounts to
R5.54 per ton or R74 583.97 annually more for the mechanised harvesting method. It
is therefore not recommended for farmer 3 to mechanise the harvesting process.
Based on the 2018/2019 minimum wages of R20 per hour the costs will dramatically
increase in the manual labour costing to R154.20 per ton assuming all the other costs
remain constant. Compared to the mechanisation costing it will be viable for farmer 3
to mechanise the harvesting process with a saving of R14.47 per ton.

61
4.2.4 Farmer 4
Farmer 4 has an average production projection of 13 040 tons per annum over the
next 5 years. The costs to mechanise his harvesting process will amount to R141.72
per ton or R1 848 090.05 in total per year. The cost of manual labour will be lower at
R139.18 or R1 814 868.37. The difference in the costs amounts to R2.54 per ton or
R33 221.68 annually more for the mechanised harvesting method. It is therefore not
recommended for farmer 4 to mechanise the harvesting process.
Based on the 2018/2019 minimum wages of R20 per hour the costs will dramatically
increase in the manual labour costing to R159.47 per ton assuming all the other costs
remain constant. Compared to the mechanisation costing it will be viable for farmer 4
to mechanise the harvesting process with a saving of R17.75 per ton.
4.2.5 Farmer 5
Farmer 5 has an average production projection of 12 400 tons per annum over the
next 5 years. The costs to mechanise his harvesting process will amount to R145.02
per ton or R1 798 228.26 in total per year. The cost of manual labour will be higher at
R148.50 or R1 841 430.92. The difference in the costs amounts to R3.48 per ton or
R43 202.66 annually less for the mechanised harvesting method. It is therefore
recommended for farmer 5 to mechanise the harvesting process.
Based on the 2018/2019 minimum wages of R20 per hour the costs will dramatically
increase in the manual labour costing to R168.52 per ton assuming all the other costs
remain constant. Compared to the mechanisation costing it will be viable for farmer 5
to mechanise the harvesting process with a saving of R23.50 per ton.
OVERALL RECOMMENDATION
In 4 out of the 5 of the case studies it was concluded that mechanisation would not be
beneficial for the small scale forestry famer. The reason for the one exception is that
the location for farmer 5 is much further from where the labour is picked up therefore
increasing the labour costs dramatically. Farmer fives’ transport costs is at R20.36 per
ton where the other farmers transport costs is at R10.47, R 6.46, R14.42 and R10.58
per ton.
The average harvesting costs for the 5 farmers for mechanical harvesting is at
R160.55 per ton, and R144.03 per ton for manual labour. It would therefore translate
62
to an average saving of R16.52 per ton by making use of the manual labour harvesting
method for the small scale forestry farmer.
The largest cost in the mechanisation process is the cost of fuel which accounts for
22.37% of the total cost. The largest cost in the manual harvesting process is labour
which accounts for roughly 70% of the total cost. It can therefore be seen that the
increase in the labour costs as from May 2018 could change the costs significantly.
An increase in the fuel price could also have a dramatic effect on the costs of the
mechanical harvesting.
At this stage it is therefore not recommended for small scale forestry farmers to
mechanise the harvesting of eucalyptus trees. However, the result is different when
considering the 2018/2019 minimum wage of R20 per hour. Taking into consideration
the new minimum wage and assuming that all other costs remain the same, the
average manual harvesting cost for the 5 farmers is at R164.60 per ton. While, the
average mechanical harvesting costs of the 5 farmers is R160.55 per ton, it could
therefore be possible that from the next financial year it could be recommended for
certain small scale forestry farmers to mechanise the harvesting process.
Each farmer should however conduct his or her own costing to determine what is best
for their farming situation as each farmer has different circumstances.
LIMITATIONS OF THE STUDY
When looking at the limitations of this research, certain factors need to be taken into
consideration. Limited information pertaining to the cost of manual and mechanical
timber harvesting was found it literature. No others studies were found which
compared the cost of manual and mechanical harvesting. . As this study was only
conducted on the Highveld area of Mpumalanga and only dealt with the harvesting of
eucalyptus trees, it cannot be generalised for the whole population or for other
harvesting processes.
As this study works with costs that fluctuates from month to month, such as the fuel
price, the results can only valid at a specific time period. Since most of the machinery
is imported the cost of machinery can also fluctuate based on the fluctuation of the
exchange rate. A large amount of assumptions were made in the costings model. The
model can therefore not reflect the true cost associated with each process. As this

63
case analysis is based on the average production over the following 5 years, it is
assumed that costs will remain the same during this period. Since the study only
compared the cost of two methods, inflation was not taken into account.
Another factor that is not considered in this study is the absenteeism of labourers. The
costings are made on the assumption that the labourers do not take any unpaid or
unexpected leave. The labour cost could therefore be underestimated as absenteeism
will impact the daily production.
FURTHER RESEARCH
Further research can be conducted by taking the whole harvesting process into
consideration from the cutting of the trees until delivery to the buyer. This research
can also be replicated in the harvesting of pine trees. Different farmer situations can
also be investigated to get more accurate results. Other research can be conducted
by taking two blocks of eucalyptus trees with similar stand and yield and then
conducting mechanical harvesting in the one block and manual harvesting in the other.
Since the environment will be very similar a more direct measure of the time, costs
and possibly the increase in yield in between methods will be obtained.

64
REFERENCES
Acts see South Africa.
Ackerman, P., Williams, C., Ackerman, S. & Nati, C. 2017. Diesel consumption and
carbon balance in South African pine clear-felling CTL operations: a preliminary case
study. Croatian journal of forest engineering, 38(1):65-72.
Adebayo, A.B., Han, H.S. & Johnson, L. 2007. Productivity and cost of cut-to-length
and whole-tree harvesting in a mixed-conifer stand. Forest products journal, 57(6):59.
Alam, M., Walsh, D., Strandgard, M. & Brown, M. 2014. A log-by-log productivity
analysis of two Valmet 475EX harvesters. International journal of forest engineering,
25(1):14-22.
Albizu-Urionabarrenetxea, P., Tolosana-Esteban, E. & Roman-Jordan, E. 2013.
Safety and health in forest harvesting operations. Diagnosis and preventive actions. A
review. Forest Systems, 22(3):392-400.
Alex, S. & Ciobanu, V. 2013. Efficiency of motor-manual felling and horse logging in
small-scale firewood production. African Journal of Agricultural Research,
8(24):3126-3135.
Anna, R.K. & Diego, F.P.C. 2011. Life cycle assessment of chainsaws. A case study
of two Husqvarna products with different power systems. Göteborg: Chalmers
University of Technology. (Thesis – Phd).
Behjou, F.K., Majnounian, B., Dvořák, J., Namiranian, M., Saeed, A. & Feghhi, J.
2009. Productivity and cost of manual felling with a chainsaw in Caspian forests.
Journal of forest science, 55(2):96-100.
Bekker, A. 2017. Mechanical harvesting productivity [personal interview]. 25 Sept.,
Carolina.
Belbo, H., Eliasson, L., De Jong, A., Lazdins, A. & Lyons, J., Ackerman, P. 2014. The
COST model for calculation of forest operations costs. International journal of forest
engineering, 25(1):75-81.
Benjamin, J.G., Seymour, R.S., Meacham, E. & Wilson, J. 2013. Impact of whole-
tree and cut-to-length harvesting on postharvest condition and logging costs for early
commercial thinning in Maine. Northern Journal of Applied Forestry, 30(4):149-155.

65
Bernstein, H. 2013. Commercial agriculture in South Africa since 1994:‘Natural,
simply capitalism’. Journal of agrarian change, 13(1):23-46.
Bhorat, H., Kanbur, R. & Stanwix, B. 2014. Estimating the impact of minimum wages
on employment, wages, and non-wage benefits: the case of agriculture in South Africa.
American journal of agricultural economics, 96(5):1402-1419.
Bluszkowska, U. & Nurek, T. 2014. Effect of mechanisation level on manpower needs
in forestry. Folia forestalia polonica, 56(4):194–201.
Bragg, S. 2017. Process costing, Process cost accounting.
https://www.accountingtools.com/articles/2017/5/14/process-costing-process-cost-
accounting Date of access: 20 Oct. 2017.
Bryman, A., Bell E., Hirschsohn, P., Dos Santos, A., Du Toit, J. & Masenge, A. 2014.
Research methodology: business and management contexts. 1st ed. Cape Town,
South Africa: Oxford.
Bureau of Labor Statistics. 2016. Occupational outlook handbook. Farming fishing
and forestry, logging workers. https://www.bls.gov/ooh/farming-fishing-and-
forestry/logging-workers.htm Date of access: 20 Oct. 2017.
Burns, A.C. & Bush, R.F. 2014. Marketing Research. 7th Ed. Essex, England:
Pearson.
Demir, M. 2010. Investigation of timber harvesting mechanisation progress in Turkey.
African journal of biotechnology, 9(11):1628-1634.
Department of Agriculture and Land Affairs. see South Africa. Department of
Agriculture and Land Affairs.
Department of Agriculture, Forestry and Fisheries. see South Africa. Department of
Agriculture, Forestry and Fisheries.
Department of Environmental Affairs. see South Africa. Department of Environmental
Affairs.
Department of Labour and Industries. see United States of America. Department of
Labour and Industries.

66
Department of Rural Development and Land Reform. see South Africa. Department
of Rural Development and Land Reform.
Dos Santos, A.S. & Migunga, G.A. 2014. Productivity and costs modelling for tree
harvesting operations using chainsaws in plantation forests, Tanzania. International
journal of engineering & technology, 3(4):464.
Dudovskiy, J. 2016. The ultimate guide to writing a dissertation in business studies:
a step-by-step assistance. https://research-methodology.net/about-us/ebook/ Date of
access: 20 Oct. 2017.
Fath, H. 2001. Commercial timber harvesting in the natural forests of Mozambique.
Forest Harvesting Case-Study, 18:1-56.
Forestry South Africa. 2017. Forestry explained. http://forestryexplained.co.za/info-
graphics/homepage/introducing-our-timber-plantations/ Date of access: 10 May 2017.
Forestry South Africa. 2017. South African forestry facts.
http://www.forestry.co.za/uploads/File/industry_info/forestry%20facts/Forestry%20Fa
cts%20Pamphlet%202015-1.pdf Date of access: 20 Sept. 2017.
Forestry South Africa. 2017. Forestry facts and figures.
http://www.forestry.co.za/uploads/File/industry_info/statistical_data/Jan%202017%20
%20South%20African%20Forestry%20and%20Forest%20Products%20Industry%20
2015.pptx.pdf Date of access: 10 Oct. 2017.
Gülci, N., Akay, A.E. & Erdaş, O. 2016. Investigation of timber harvesting operations
using chainsaw considering productivity and residual stand damage: The case of
Bahçe forest enterprise chief. Journal of the faculty of forestry Istanbul University,
66(2):357-368.
Grobbelaar E. 2000. Systems approach to forest engineering costing. (In Owen, D.,
ed. South African Forestry Handbook. Menlo Park, Pretoria: South African Institute of
Forestry. p. 291-299).
ILO (International Labour Organization). 2012. Productive and safe work in forestry.
http://www.ilo.org/wcmsp5/groups/public/@ed_emp/documents/publication/wcms_15
8989.pdf Date of Access: 20 Oct. 2017.

67
Joubert, R. 16 Aug. 2013. The skills needed to make SA farming more profitable.
Farmer Weekly: https://www.farmersweekly.co.za/agri-business/agribusinesses/the-
skills-needed-to-make-sa-farming-more-profitable/ Date of access: 20 Sept. 2017.
Kenney, J., Gallagher, T., Smidt, M., Mitchell, D. & McDonald, T. 2014. Factors that
affect fuel consumption in logging systems. Paper presented at the 37th Council on
Forest Engineering Annual Meeting, Moline, IL, 22 – 25 June.
https://www.srs.fs.usda.gov/pubs/ja/2014/ja_2014_mitchell_003.pdf Date of access: 9
Oct. 2017.
Längin, D., Ackerman, P., Krieg, B., Immelman, A., Potgieter, C., Van Rooyen, J.,
Upfold, S. 2010. South African ground based harvesting handbook. 1st ed. Scottsville,
SA: Institute for Commercial Forestry Research.
Liepiņš, K., Lazdiņš, A., Liepiņš, J. & Prindulis, U. 2015. Productivity and cost-
effectiveness of mechanised and motor-manual harvesting of grey alder (Alnus incana
(L.) Moench): a Case Study in Latvia. Small-scale forestry, 14(4):493-506.
Maskiner, S.P. 2017. SP 591 LX G3 - high speed debarking for xtreme jobs.
http://www.spmaskiner.com/en-gb/sp591lxg3/ Date of access: 15 Oct. 2017.
Marx. J., De Swart, C., Beaumont Smith. M,. Erasmus. P. 2009. Financial
Management in Southern Africa. 3rd ed. Cape Town, South Africa: Pearson.
Mbosso, C., Degrande, A., Van Damme, P., Tsafack, S., Nimino, G. & Tchoundjeu, Z.
2015. Gender differences in knowledge, perception and use of the Ricinodendron
heudelotii (Baill. Pierre ex pax) kernel extraction machine. International forestry
review, 17(4):124-134.
McEwan, A. 2017. New technology focuses on operator safety and comfort. SA
Forestry. http://saforestryonline.co.za/articles/new-technology-focuses-operator-
safety-comfort/ Date of access: 20 Sept. 2017.
Montorselli, N.B., Lombardini, C., Magagnotti, N., Marchi, E., Neri, F., Picchi, G. &
Spinelli, R. 2010. Relating safety, productivity and company type for motor-manual
logging operations in the Italian Alps. Accident analysis & prevention, 42(6):2013-
2017.

68
Mussá, F.E.F., Zhou, Y., Maskey, S., Masih, I. & Uhlenbrook, S. 2014. Groundwater
as an emergency source for drought mitigation in the Crocodile River catchment,
South Africa. Hydrology and earth system sciences discussions, 11(3):2719-2757.
Neethling, M. 2017. Bostek. Mechanical harvesting productivity [personal interview]
24 Sept., Badplaas.
Ngulube, E., Brink, M. & Chirwa, P.W. 2014. Productivity and cost analysis of semi-
mechanised and mechanised systems on the Viphya forest plantations in Malawi.
Southern forests: a journal of forest science, 76(4):195-200.
Nthunzi, H. 2017. Nthunzi forestry services. Manual labour tree harvesting
productivity [personal interview]. 10 Oct., Carolina.
Oesters, P. Bowers, S. 2009. Measuring timber products harvested from your
woodland. Forest measurement, EC1127.
https://ir.library.oregonstate.edu/xmlui/bitstream/handle/1957/13600/EC1127.pdf
Date of access: 10 Oct. 2017.
PAMSA (Paper manufactures of South Africa). 2015. South African pulp and paper
industry. http://www.thepaperstory.co.za/wp-content/uploads/2017/05/PAMSA-2015-
stats-report-FINAL.pdf Date of access: 10 Oct. 2017.
Popovici, R. 2013. Estimating chainsaw operating costs based on fuel, lubricants and
spare parts. Agricultural food engineering, 6(55):63-68.
Ramantswana, M., McEwan, A. & Steenkamp, J. 2013. A comparison between
excavator-based harvester productivity in coppiced and planted Eucalyptus grandis
compartments in KwaZulu-Natal, South Africa. Southern forests, 75(4):239-246.
Ramutloa, L. 2017. Forestry Sector Minimum Wages, 1 March 2017.
http://www.labour.gov.za/DOL/downloads/legislation/sectoral-determinations/basic-
conditions-of-employment/forestrywagemarch17.pdf/view Date of Access: 20 Sept.
2017.
RSG (Radio Sonder Grense). 6 Nov. 2017. Monitor. http://www.rsg.co.za/potgooi-
soek.asp Date of access: 8 Nov. 2017. [web download].
Sandewall, M., Kassa, H., Wu, S., Khoa, P.V., He, Y. & Ohlsson, B. 2015. Policies to
promote household based plantation forestry and their impacts on livelihoods and the

69
environment: cases from Ethiopia, China, Vietnam and Sweden. International forestry
review, 17(1):98-111.
Sappi. 2017. Tree farming guidelines for private growers. https://cdn-
s3.sappi.com/s3fs-public/Part-2-Silviculture.pdf Date of access: 10 Oct. 2017.
Saunders, A.M., Aguilar, F.X., Dwyer, J.P. and Stelzer, H.E. 2012. Cost structure of
integrated harvesting for woody biomass and solid hardwood products in southeastern
Missouri. Journal of forestry, 110(1):7-15.
Schrimer, S. 2004. Motives for mechanisation in South African agriculture, c1940–
1980. African Studies, 63(1):3-28.
Scott, LM. 2016. MIRR Formula. http://incomepropertyanalytics.com/modified-
internal-rate-of-return-mirr/mirr-formula-3/ Date of access: 26 Jul 2016.
Sefako-Musi, G. 2017. Govt to implement R3500 minimum wage by 2018. SABC
News, 8 Feb.
http://www.sabc.co.za/news/a/cda955004000041ebb78bf777350442c/Govt-to-
implement-R3500-minimum-wage-by-2018-20170802 Date of access: 20 Sept. 2017.
South Africa. Department of Agriculture and Land Affairs. 2017. Agricultural policy
in South Africa. Pretoria.
South Africa. Department of Agriculture, Forestry and Fisheries. 2016. Abstract of
agriculture statistics 2016. Pretoria.
South Africa. Department of Agriculture, Forestry and Fisheries. 2017. Guide for
machinery costs 2015 – 2016. Pretoria.
South African. Department of Environmental Affairs. 2017. What kind of droughts
does South Africa experience? Pretoria.
South Africa. Department of Labour. 2017. Basic Guide to Working Hours. Pretoria.
South Africa. Department of Labour. 2017. Health and safety in forestry 2013.
Pretoria.
South Africa. Department of Water Affairs and Forestry. 2006. Commercial timber
resources and primary Roundwood processing in South Africa 2004/2005. Pretoria.

70
South Africa. Department of Rural Development and Land Reform. 2013. State land
audit report of 2013. Pretoria.
South Africa. 2014. Occupational health and safety act 181 of 1993.
Stansfield, P. 2017. Harvesting costings [personal interview]. 19 Sept., Nelspruit.
Statistics South Africa. 2017. D1200 - Forestry, logging and related services survey.
http://www.statssa.gov.za/?page_id=1861&PPN=D1200&SCH=6993 Date of access:
15 Jul. 2017.
Visser, R. & Stampfer, K. 2015. Expanding ground-based harvesting onto steep
terrain: a review. Croatian journal of forest engineering, 36(2):321-331.
Vogel, C. & van Zyl, K. 2016. Drought: In search of sustainable solutions to a
persistent, ‘wicked’ problem in South Africa. (In Salzmann, N., Huggel, C.,
Nussbaumer, S.U. & Ziervogel, G., ed. Climate Change Adaptation Strategies–An
Upstream-downstream Perspective. Switzerland:Springer. p.195-211).
United States of America. Department of Labour and Industries. 2014. Timber
harvester operator killed following a chain shot incident. Washington.
Vusić, D., Zečić, Ž. & Turk, Z. 2012. Productivity of chainsaw felling and processing
in selective forests of Croatia. Forest Engineering:8-12.
Wall, A. 2012. Risk analysis of effects of whole-tree harvesting on site productivity.
Forest ecology and management, 282(2012):175-184.
Walmsley, J.D., Jones, D.L., Reynolds, B., Price, M.H. & Healey, J.R. 2009. Whole
tree harvesting can reduce second rotation forest productivity. Forest ecology and
management, 257(3):1104-1111.
Whiteside, M. 2014. Living farms: encouraging sustainable smallholders in southern
Africa. London, UK:Earthscan.
Williams, C., Ackerman, S. & Nati, C. 2017. Diesel consumption and carbon balance
in South African pine clear-felling CTL Operations: a preliminary case study. Croatian
journal of forest engineering, 38(1):65-72.
Zainal, Z. 2007. Case study as a research method. Jurnal Kemanusiaan, 5(1):1-6.

71
Zhang, F., Johnson, D.M., Wang, J. & Yu, C. 2016. Cost, energy use and GHG
emissions for forest biomass harvesting operations. Energy, 114(2016):1053-1062.
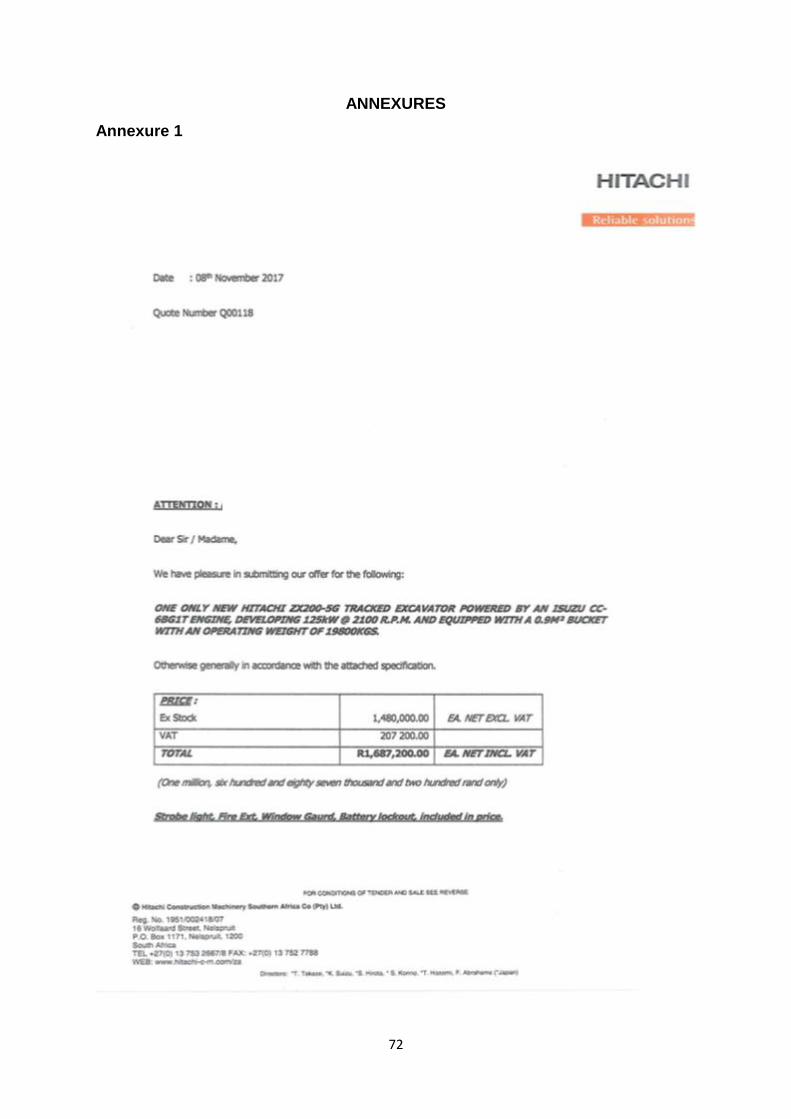
72
ANNEXURES
Annexure 1

73
Annexure 2

74
Annexure 3

75
Annexure 4

76
Annexure 5

77
Annexure 6

78
Annexure 7

79
Annexure 8: Manual labour costing farmer 1
Manual labour tree harvesting costing Farmer 1Eucalyptus manual harvesting Rate per ton
Tree size = 0,2 R 144,59
Felling task = 115 trees
Production - 23 tons/cutter
Terrain 0-35%
Calculation inclusive of leave and sickleave provision
NO overheads and/or indirect costs
CALCULATION OF HARVESTING RATEVOLUMES TO BE HARVESTED
complete
What is the annual (or annualized) tonnage or volume to be harvested? 8060 tons
month prod.day
Volume per: 671,7 32,5
What species to be harvested? Hardwood
PRODUCTION DAYS PER YEARcomplete
How many working days in this year? (5days times 52 weeks) 260 cst/day cst/month cst/year cst/ton
How many statutory leave days in this year? 12 166,02 3431 41172 5,11
How many days/labourer provided for sick leave/year? 10 138,35 2859 34310 4,26
How many days/labourer provided for leave/year? 15 207,52 4289 51465 6,39
How many days per year for un-productive time(red days etc.)? 3 41,50 858 10293 1,28
Total 553,39 11437 137240,33 17,03
Labourer days available per year 220
Production days per year 248
Loss of production days / labourer / year 28
Average working days / month 20,67
STATUTORY COSTS AND PROVIDENT FUND
Indicate the relevant percentage in each case: % cst/mth cst/year cst/ton
WCA ( % of gross wage + salaries) 1,89 1426,47 17118 2,12
UIF (% as with workman's compensation) 1 754,75 9057 1,12
What % of nett wage do you allow for medical expenses? 3 2058,40 24701 3,06
TOTAL= 4240 50875 6,31
CALCULATION OF STAFF COSTS.
PRODUCTIVITY
Cutter 16,25 ton/day
Stripper 2,03 ton/day
Salaried staff
OVERHEAD STAFF ONLY OVERHEAD STAFF ONLY UNSKILLED STAFF
No. of Name/ Gross No. of Name/ Gross No. of Name/ Nett
Managers describe monthly describe monthly describe daily
salary salary wage
1 Manager 6861
TOTALS: 1 R 6 861,33 0 0 0 0
Wage earners, daily paid staff.
SKILLED STAFF SKILLED STAFF UNSKILLED STAFF
No. of Name/ Nett No. of Name/ Nett No. of Name/ Nett
Supervisor describe daily describe daily describe daily
Drivers wage wage wage
1 Snr Induna 220,00 2 Chainsaw operator R 200,00 16 debarkers R 150,00
0
2 pushers R 150,00
TOTALS: 1 R 220,00 2 R 400,00 18 R 2 700,00
SUMMARY: UNITS /DAY /MTH /YEAR /TON
No. of overhead units = 1 Total overhead = 332,00 6 861,33 82 336,00 10,22
No. of skilled wage earners = 3 Total skilled = 620,00 12 813,33 153 760,00 19,08
No. of unskilled wage earners = 18 Total unskilled = 2 700,00 55 800,00 669 600,00 83,08
Total mandays/mth: 434 TOTAL = 3 652,00 75 474,67 905 696,00 112,37
AVERAGE WAGE Unskilled : = R 150,00 PER DAY
AVERAGE WAGE Unskilled : = R 3100,00 PER MONTH
AVERAGE WAGE Skilled : = R 206,67 PER DAY
AVERAGE WAGE Skilled : = R 4271,11 PER MONTH
COST OF TRANSPORT Your no. of salaried staff: = 1
Your no. of wage earners: = 21
complete
TRANSPORT
Cost per KM R 6,88
Distance traveled per day in km 50
Distance traveld annually in km 12400
Transport costs per annum R 85 312,00
Transporting vehicles needed 1
Total transport costs per annum R 85 312,00
/working /month /year /ton
day
Transport R 344,00 R 7 109,33 R 85 312,00 R 10,58

80
Annexure 8 continue farmer 1
PROTECTIVE CLOTHING (SAFETY)Skilled 1 Cs.oper. 2
Unskilled 18
Please complete the table.
Calculating done by: no.of people x no.of item/year x price.
no.of no/year cost per cost/ cost/ cost/
Item staff using item month year ton
Two piece overalls 21 2 133,00 466 5586 0,693
Steel toe cap boots 21 2 225,00 788 9450 1,172
Rain coat - two piece 21 1 212,00 371 4452 0,552
Leggings 18 0,75 130,00 146 1755 0,218
Poly/rubber/plastic gloves 19 12 28,50 542 6498 0,806
Hard hats 19 1 20,50 32 390 0,048
Other Safety glasses 19 2 15,00 48 570 0,071
Other Bibs 21 1 45,00 79 945 0,117
Other Hardhat with ear muffs 2 2 130,00 43 520 0,065
Cutter protective clothing: no.of operators & mechanic: 2
Cs. hard hat with visor and ear muffs 2 2 420,00 140 1680 0,208
Visors 2 1 0,00 0 0 0,000
Ear muffs 2 2 0,00 0 0 0,000
Cs gloves 2 4 240,00 160 1920 0,238
Cs. pants 2 2 853,00 284 3412 0,423
Cs. tops 2 2 240,00 80 960 0,119
All personnel including cutters: Total R 3178 38138 4,732
cutters Total R 664 7972 0,989
TOOLSCalculating done by: no.of people x no.of item/year x price.
no.of no/year cost per cost/ cost/ cost/
Item staff using item month year ton
Fire extinguishers large 1 1 492,75 41 493 0,061
Fire extinguishers small 1 1 0 0 0,000
Hatchets 16 1 279,51 373 4472 0,555
Hatchet sharpening files 16 3 58,90 236 2827 0,351
Chainsaw equipment
Chain 2 12 325,00 650 7800 0,968
Guidebars 2 6 530,00 530 6360 0,789
Round files 2 12 25,00 50 600 0,074
Flat files 2 6 58,90 59 707 0,088
fuel cans (Combi can) 2 1 427,00 71 854 0,106
Other sprocket 2 4 198,00 132 1584 0,197
Tools excluding chainsaw equipment = R 649 7792 0,967
Tools : chainsaw equipment = R 1492 17905 2,221
CHAINSAW COSTSPlease complete the table. cst/mth cst/yr cst/ton
How many chainsaws, INC. spare saws do you use for this team? 2,2
How many chainsaws are working daily? 2
What is the lifespan of a chainsaw in months? (NB must be > 0) 6
What is the current replacement price of a chainsaw? 6999 2656,87 31882 3,956
How many liters of fuel do you use per chainsaw per day? 5
What is your cost of fuel/liter (the petrol x 2-stroke mix) ? 15,64 3232,27 38787 4,812
How many liters of chainlube do you use per chainsaw per day? 3
What is your cost of chainlube per liter? 15,52 1924,48 23094 2,865
What is your Repair Cost Factor for Chainsaws? 60 %
699,90 1399,8 16797,6 2,084
Gr tot. R 10705,48
Total R 9213,41 110561 13,72
Cst / saw / hr =R 39,24
At what interest rate can you finance assets? 12 %
(This figure is used to calculate the interest on your capital layout for chainsaws)
T O T A L CHAINSAW COST PER TON: R 15,94
Total harvesting costs per ton : Total harvesting costs:Labour costs R 112,37 Labour costs R 905 696,00
Chainsaw costs R 15,94 Chainsaw costs R 128 465,74
Tools cost R 0,97 Tools cost R 7 792,11
PPE cost R 4,73 PPE cost R 38 137,50Transportation costs R 10,58 Transportation costs R 85 312,00
Total: R 144,59 Total: R 1 165 403,35

81
Annexure 9: Manual labour costing farmer 2
Manual labour tree harvesting costing Farmer 2Eucalyptus manual harvesting Rate per ton
Tree size = 0,2 R 153,67
Felling task = 115 trees
Production - 23 tons/cutter
Terrain 0-35%
Calculation inclusive of leave and sickleave provision
NO overheads and/or indirect costs
CALCULATION OF HARVESTING RATEVOLUMES TO BE HARVESTED
complete
What is the annual (or annualized) tonnage or volume to be harvested? 7100 tons
month prod.day
Volume per: 591,7 28,6
What species to be harvested? Hardwood
PRODUCTION DAYS PER YEARcomplete
How many working days in this year? (5days times 52 weeks) 260 cst/day cst/month cst/year cst/ton
How many statutory leave days in this year? 12 147,57 3050 36597 5,15
How many days/labourer provided for sick leave/year? 10 122,98 2541 30498 4,30
How many days/labourer provided for leave/year? 15 184,46 3812 45747 6,44
How many days per year for un-productive time(red days etc.)? 3 36,89 762 9149 1,29
Total 491,90 10166 121991,40 17,18
Labourer days available per year 220
Production days per year 248
Loss of production days / labourer / year 28
Average working days / month 20,67
STATUTORY COSTS AND PROVIDENT FUND
Indicate the relevant percentage in each case: % cst/mth cst/year cst/ton
WCA ( % of gross wage + salaries) 1,89 1297,57 15571 2,19
UIF (% as with workman's compensation) 1 686,55 8239 1,16
What % of nett wage do you allow for medical expenses? 3 1872,40 22469 3,16
TOTAL= 3857 46278 6,52
CALCULATION OF STAFF COSTS.
PRODUCTIVITY
Cutter 14,31 ton/day
Stripper 2,04 ton/day
Salaried staff
OVERHEAD STAFF ONLY OVERHEAD STAFF ONLY UNSKILLED STAFF
No. of Name/ Gross No. of Name/ Gross No. of Name/ Nett
Managers describe monthly describe monthly describe daily
salary salary wage
1 Manager 6241
TOTALS: 1 R 6 241,33 0 0 0 0
Wage earners, daily paid staff.
SKILLED STAFF SKILLED STAFF UNSKILLED STAFF
No. of Name/ Nett No. of Name/ Nett No. of Name/ Nett
Supervisor describe daily describe daily describe daily
Drivers wage wage wage
1 Snr Induna 220,00 2 Chainsaw operator R 200,00 14 debarkers R 150,00
0
2 pushers R 150,00
TOTALS: 1 R 220,00 2 R 400,00 16 R 2 400,00
SUMMARY: UNITS /DAY /MTH /YEAR /TON
No. of overhead units = 1 Total overhead = 302,00 6 241,33 74 896,00 10,55
No. of skilled wage earners = 3 Total skilled = 620,00 12 813,33 153 760,00 21,66
No. of unskilled wage earners = 16 Total unskilled = 2 400,00 49 600,00 595 200,00 83,83
Total mandays/mth: 393 TOTAL = 3 322,00 68 654,67 823 856,00 116,04
AVERAGE WAGE Unskilled : = R 150,00 PER DAY
AVERAGE WAGE Unskilled : = R 3100,00 PER MONTH
AVERAGE WAGE Skilled : = R 206,67 PER DAY
AVERAGE WAGE Skilled : = R 4271,11 PER MONTH
COST OF TRANSPORT Your no. of salaried staff: = 1
Your no. of wage earners: = 19
complete
TRANSPORT
Cost per KM R 6,88
Distance traveled per day in km 60
Distance traveld annually in km 14880
Transport costs per annum R 102 374,40
Transporting vehicles needed 1
Total transport costs per annum R 102 374,40
/working /month /year /ton
day
Transport R 412,80 R 8 531,20 R 102 374,40 R 14,42

82
Annexure 9: Manual labour costing farmer 2 continue:
PROTECTIVE CLOTHING (SAFETY)Skilled 1 Cs.oper. 2
Unskilled 16
Please complete the table.
Calculating done by: no.of people x no.of item/year x price.
no.of no/year cost per cost/ cost/ cost/
Item staff using item month year ton
Two piece overalls 19 2 133,00 421 5054 0,712
Steel toe cap boots 19 2 225,00 713 8550 1,204
Rain coat - two piece 19 1 212,00 336 4028 0,567
Leggings 16 0,75 130,00 130 1560 0,220
Poly/rubber/plastic gloves 17 12 28,50 485 5814 0,819
Hard hats 2 1 20,50 3 41 0,006
Other Safety glasses 17 2 15,00 43 510 0,072
Other Bibs 19 1 45,00 71 855 0,120
Other Hardhat with ear muffs 2 2 130,00 43 520 0,073
Cutter protective clothing: no.of operators & mechanic: 2
Cs. hard hat with visor and ear muffs 2 2 420,00 140 1680 0,237
Visors 2 1 0,00 0 0 0,000
Ear muffs 2 2 0,00 0 0 0,000
Cs gloves 2 4 240,00 160 1920 0,270
Cs. pants 2 2 853,00 284 3412 0,481
Cs. tops 2 2 240,00 80 960 0,135
All personnel including cutters: Total R 2909 34904 4,916
cutters Total R 664 7972 1,123
TOOLSCalculating done by: no.of people x no.of item/year x price.
no.of no/year cost per cost/ cost/ cost/
Item staff using item month year ton
Fire extinguishers large 1 1 492,75 41 493 0,069
Fire extinguishers small 1 1 0 0 0,000
Hatchets 14 1 279,51 326 3913 0,551
Hatchet sharpening files 14 3 58,90 206 2474 0,348
Chainsaw equipment
Chain 2 12 325,00 650 7800 1,099
Guidebars 2 6 530,00 530 6360 0,896
Round files 2 12 25,00 50 600 0,085
Flat files 2 6 58,90 59 707 0,100
fuel cans (Combi can) 2 1 427,00 71 854 0,120
Other sprocket 2 4 198,00 132 1584 0,223
Tools excluding chainsaw equipment = R 573 6880 0,969
Tools : chainsaw equipment = R 1492 17905 2,522
CHAINSAW COSTSPlease complete the table. cst/mth cst/yr cst/ton
How many chainsaws, INC. spare saws do you use for this team? 2,2
How many chainsaws are working daily? 2
What is the lifespan of a chainsaw in months? (NB must be > 0) 6
What is the current replacement price of a chainsaw? 6999 2656,87 31882 4,490
How many liters of fuel do you use per chainsaw per day? 4,3
What is your cost of fuel/liter (the petrol x 2-stroke mix) ? 15,64 2779,75 33357 4,698
How many liters of chainlube do you use per chainsaw per day? 3
What is your cost of chainlube per liter? 15,52 1924,48 23094 3,253
What is your Repair Cost Factor for Chainsaws? 60 %
699,90 1399,8 16797,6 2,366
Gr tot. R 10252,96
Total R 8760,89 105131 14,81
Cst / saw / hr =R 37,58
At what interest rate can you finance assets? 12 %
(This figure is used to calculate the interest on your capital layout for chainsaws)
T O T A L CHAINSAW COST PER TON: R 17,33
Total harvesting costs per ton : Total harvesting costs:Labour costs R 116,04 Labour costs R 823 856,00
Chainsaw costs R 17,33 Chainsaw costs R 123 035,53
Tools cost R 0,97 Tools cost R 6 879,69
PPE cost R 4,92 PPE cost R 34 904,00Transportation costs R 14,42 Transportation costs R 102 374,40
Total: R 153,67 Total: R 1 091 049,62
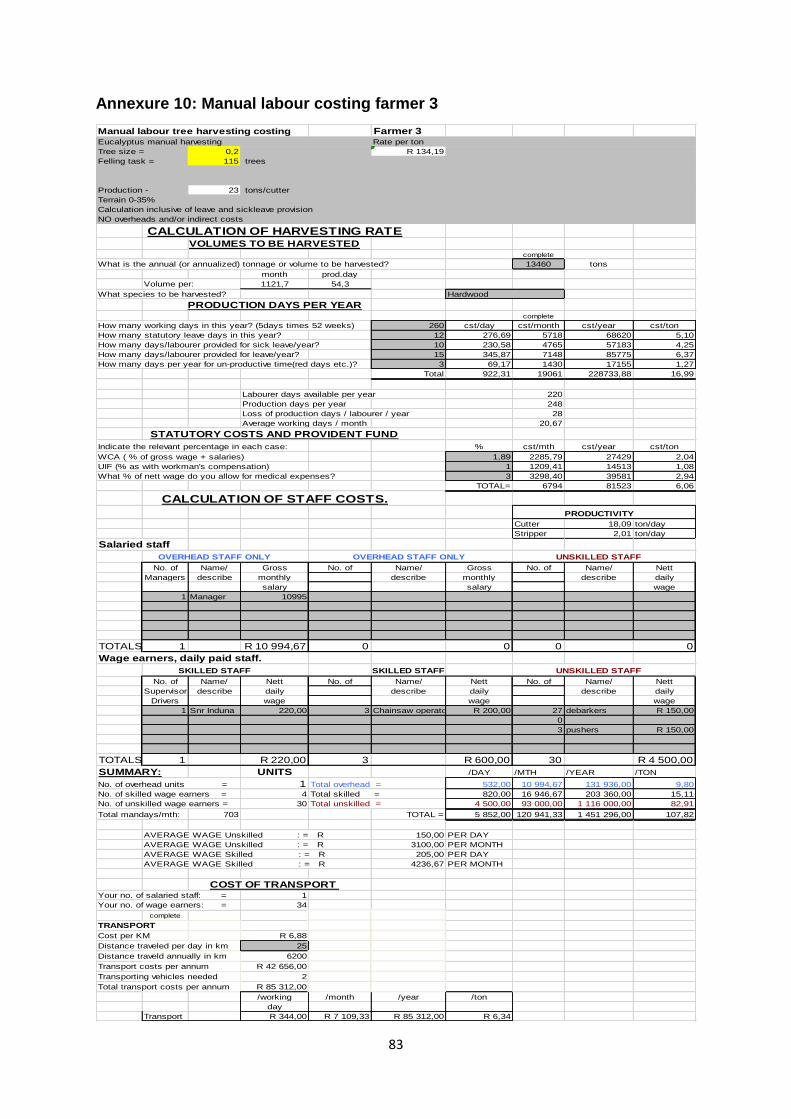
83
Annexure 10: Manual labour costing farmer 3
Manual labour tree harvesting costing Farmer 3Eucalyptus manual harvesting Rate per ton
Tree size = 0,2 R 134,19
Felling task = 115 trees
Production - 23 tons/cutter
Terrain 0-35%
Calculation inclusive of leave and sickleave provision
NO overheads and/or indirect costs
CALCULATION OF HARVESTING RATEVOLUMES TO BE HARVESTED
complete
What is the annual (or annualized) tonnage or volume to be harvested? 13460 tons
month prod.day
Volume per: 1121,7 54,3
What species to be harvested? Hardwood
PRODUCTION DAYS PER YEARcomplete
How many working days in this year? (5days times 52 weeks) 260 cst/day cst/month cst/year cst/ton
How many statutory leave days in this year? 12 276,69 5718 68620 5,10
How many days/labourer provided for sick leave/year? 10 230,58 4765 57183 4,25
How many days/labourer provided for leave/year? 15 345,87 7148 85775 6,37
How many days per year for un-productive time(red days etc.)? 3 69,17 1430 17155 1,27
Total 922,31 19061 228733,88 16,99
Labourer days available per year 220
Production days per year 248
Loss of production days / labourer / year 28
Average working days / month 20,67
STATUTORY COSTS AND PROVIDENT FUND
Indicate the relevant percentage in each case: % cst/mth cst/year cst/ton
WCA ( % of gross wage + salaries) 1,89 2285,79 27429 2,04
UIF (% as with workman's compensation) 1 1209,41 14513 1,08
What % of nett wage do you allow for medical expenses? 3 3298,40 39581 2,94
TOTAL= 6794 81523 6,06
CALCULATION OF STAFF COSTS.
PRODUCTIVITY
Cutter 18,09 ton/day
Stripper 2,01 ton/day
Salaried staff
OVERHEAD STAFF ONLY OVERHEAD STAFF ONLY UNSKILLED STAFF
No. of Name/ Gross No. of Name/ Gross No. of Name/ Nett
Managers describe monthly describe monthly describe daily
salary salary wage
1 Manager 10995
TOTALS: 1 R 10 994,67 0 0 0 0
Wage earners, daily paid staff.
SKILLED STAFF SKILLED STAFF UNSKILLED STAFF
No. of Name/ Nett No. of Name/ Nett No. of Name/ Nett
Supervisor describe daily describe daily describe daily
Drivers wage wage wage
1 Snr Induna 220,00 3 Chainsaw operator R 200,00 27 debarkers R 150,00
0
3 pushers R 150,00
TOTALS: 1 R 220,00 3 R 600,00 30 R 4 500,00
SUMMARY: UNITS /DAY /MTH /YEAR /TON
No. of overhead units = 1 Total overhead = 532,00 10 994,67 131 936,00 9,80
No. of skilled wage earners = 4 Total skilled = 820,00 16 946,67 203 360,00 15,11
No. of unskilled wage earners = 30 Total unskilled = 4 500,00 93 000,00 1 116 000,00 82,91
Total mandays/mth: 703 TOTAL = 5 852,00 120 941,33 1 451 296,00 107,82
AVERAGE WAGE Unskilled : = R 150,00 PER DAY
AVERAGE WAGE Unskilled : = R 3100,00 PER MONTH
AVERAGE WAGE Skilled : = R 205,00 PER DAY
AVERAGE WAGE Skilled : = R 4236,67 PER MONTH
COST OF TRANSPORT Your no. of salaried staff: = 1
Your no. of wage earners: = 34
complete
TRANSPORT
Cost per KM R 6,88
Distance traveled per day in km 25
Distance traveld annually in km 6200
Transport costs per annum R 42 656,00
Transporting vehicles needed 2
Total transport costs per annum R 85 312,00
/working /month /year /ton
day
Transport R 344,00 R 7 109,33 R 85 312,00 R 6,34

84
Annexure 10 continue farmer 3
PROTECTIVE CLOTHING (SAFETY)Skilled 1 Cs.oper. 3
Unskilled 30
Please complete the table.
Calculating done by: no.of people x no.of item/year x price.
no.of no/year cost per cost/ cost/ cost/
Item staff using item month year ton
Two piece overalls 34 2 133,00 754 9044 0,672
Steel toe cap boots 34 2 225,00 1275 15300 1,137
Rain coat - two piece 34 1 212,00 601 7208 0,536
Leggings 27 0,75 130,00 219 2633 0,196
Poly/rubber/plastic gloves 31 12 28,50 884 10602 0,788
Hard hats 31 1 20,50 53 636 0,047
Other Safety glasses 31 2 15,00 78 930 0,069
Other Bibs 34 1 45,00 128 1530 0,114
Other Hardhat with ear muffs 3 2 130,00 65 780 0,058
Cutter protective clothing: no.of operators & mechanic: 3
Cs. hard hat with visor and ear muffs 3 2 420,00 210 2520 0,187
Visors 3 1 0,00 0 0 0,000
Ear muffs 3 2 0,00 0 0 0,000
Cs gloves 3 4 240,00 240 2880 0,214
Cs. pants 3 2 853,00 427 5118 0,380
Cs. tops 3 2 240,00 120 1440 0,107
All personnel including cutters: Total R 5052 60620 4,504
cutters Total R 997 11958 0,888
TOOLSCalculating done by: no.of people x no.of item/year x price.
no.of no/year cost per cost/ cost/ cost/
Item staff using item month year ton
Fire extinguishers large 1 1 492,75 41 493 0,037
Fire extinguishers small 1 1 0 0 0,000
Hatchets 27 1 279,51 629 7547 0,561
Hatchet sharpening files 27 3 58,90 398 4771 0,354
Chainsaw equipment
Chain 3 12 325,00 975 11700 0,869
Guidebars 3 6 530,00 795 9540 0,709
Round files 3 12 25,00 75 900 0,067
Flat files 3 6 58,90 88 1060 0,079
fuel cans (Combi can) 3 1 427,00 107 1281 0,095
Other sprocket 3 4 198,00 198 2376 0,177
Tools excluding chainsaw equipment = R 1068 12810 0,952
Tools : chainsaw equipment = R 2238 26857 1,995
CHAINSAW COSTSPlease complete the table. cst/mth cst/yr cst/ton
How many chainsaws, INC. spare saws do you use for this team? 3,3
How many chainsaws are working daily? 3
What is the lifespan of a chainsaw in months? (NB must be > 0) 6
What is the current replacement price of a chainsaw? 6999 3985,30 47824 3,553
How many liters of fuel do you use per chainsaw per day? 5,3
What is your cost of fuel/liter (the petrol x 2-stroke mix) ? 15,64 5139,30 61672 4,582
How many liters of chainlube do you use per chainsaw per day? 3
What is your cost of chainlube per liter? 15,52 2886,72 34641 2,574
What is your Repair Cost Factor for Chainsaws? 60 %
699,90 2099,7 25196,4 1,872
Gr tot. R 16349,12
Total R 14111,02 169332 12,58
Cst / saw / hr =R 39,95
At what interest rate can you finance assets? 12 %
(This figure is used to calculate the interest on your capital layout for chainsaws)
T O T A L CHAINSAW COST PER TON: R 14,58
Total harvesting costs per ton : Total harvesting costs:Labour costs R 107,82 Labour costs R 1 451 296,00
Chainsaw costs R 14,58 Chainsaw costs R 196 189,46
Tools cost R 0,95 Tools cost R 12 810,42
PPE cost R 4,50 PPE cost R 60 620,00Transportation costs R 6,34 Transportation costs R 85 312,00
Total: R 134,19 Total: R 1 806 227,88

85
Annexure 11 manual labour costing farmer 4 Manual labour tree harvesting costing Farmer 4Eucalyptus manual harvesting Rate per ton
Tree size = 0,2 R 139,18
Felling task = 115 trees
Production - 23 tons/cutter
Terrain 0-35%
Calculation inclusive of leave and sickleave provision
NO overheads and/or indirect costs
CALCULATION OF HARVESTING RATEVOLUMES TO BE HARVESTED
complete
What is the annual (or annualized) tonnage or volume to be harvested? 13040 tons
month prod.day
Volume per: 1086,7 52,6
What species to be harvested? Hardwood
PRODUCTION DAYS PER YEARcomplete
How many working days in this year? (5days times 52 weeks) 260 cst/day cst/month cst/year cst/ton
How many statutory leave days in this year? 12 267,47 5528 66333 5,09
How many days/labourer provided for sick leave/year? 10 222,89 4606 55277 4,24
How many days/labourer provided for leave/year? 15 334,34 6910 82916 6,36
How many days per year for un-productive time(red days etc.)? 3 66,87 1382 16583 1,27
Total 891,57 18426 221109,42 16,96
Labourer days available per year 220
Production days per year 248
Loss of production days / labourer / year 28
Average working days / month 20,67
STATUTORY COSTS AND PROVIDENT FUND
Indicate the relevant percentage in each case: % cst/mth cst/year cst/ton
WCA ( % of gross wage + salaries) 1,89 2221,34 26656 2,04
UIF (% as with workman's compensation) 1 1175,31 14104 1,08
What % of nett wage do you allow for medical expenses? 3 3205,40 38465 2,95
TOTAL= 6602 79225 6,08
CALCULATION OF STAFF COSTS.
PRODUCTIVITY
Cutter 17,53 ton/day
Stripper 2,02 ton/day
Salaried staff
OVERHEAD STAFF ONLY OVERHEAD STAFF ONLY UNSKILLED STAFF
No. of Name/ Gross No. of Name/ Gross No. of Name/ Nett
Managers describe monthly describe monthly describe daily
salary salary wage
1 Manager 10685
TOTALS: 1 R 10 684,67 0 0 0 0
Wage earners, daily paid staff.
SKILLED STAFF SKILLED STAFF UNSKILLED STAFF
No. of Name/ Nett No. of Name/ Nett No. of Name/ Nett
Supervisor describe daily describe daily describe daily
Drivers wage wage wage
1 Snr Induna 220,00 3 Chainsaw operator R 200,00 26 debarkers R 150,00
0
3 pushers R 150,00
TOTALS: 1 R 220,00 3 R 600,00 29 R 4 350,00
SUMMARY: UNITS /DAY /MTH /YEAR /TON
No. of overhead units = 1 Total overhead = 517,00 10 684,67 128 216,00 9,83
No. of skilled wage earners = 4 Total skilled = 820,00 16 946,67 203 360,00 15,60
No. of unskilled wage earners = 29 Total unskilled = 4 350,00 89 900,00 1 078 800,00 82,73
Total mandays/mth: 682 TOTAL = 5 687,00 117 531,33 1 410 376,00 108,16
AVERAGE WAGE Unskilled : = R 150,00 PER DAY
AVERAGE WAGE Unskilled : = R 3100,00 PER MONTH
AVERAGE WAGE Skilled : = R 205,00 PER DAY
AVERAGE WAGE Skilled : = R 4236,67 PER MONTH
COST OF TRANSPORT Your no. of salaried staff: = 1
Your no. of wage earners: = 33
complete
TRANSPORT
Cost per KM R 6,88
Distance traveled per day in km 40
Distance traveld annually in km 9920
Transport costs per annum R 68 249,60
Transporting vehicles needed 2
Total transport costs per annum R 136 499,20
/working /month /year /ton
day
Transport R 550,40 R 11 374,93 R 136 499,20 R 10,47

86
Annexure 11 continue farmer 4
PROTECTIVE CLOTHING (SAFETY)Skilled 1 Cs.oper. 3
Unskilled 29
Please complete the table.
Calculating done by: no.of people x no.of item/year x price.
no.of no/year cost per cost/ cost/ cost/
Item staff using item month year ton
Two piece overalls 33 2 133,00 732 8778 0,673
Steel toe cap boots 33 2 225,00 1238 14850 1,139
Rain coat - two piece 33 1 212,00 583 6996 0,537
Leggings 29 0,75 130,00 236 2828 0,217
Poly/rubber/plastic gloves 30 12 28,50 855 10260 0,787
Hard hats 30 1 20,50 51 615 0,047
Other Safety glasses 30 2 15,00 75 900 0,069
Other Bibs 33 1 45,00 124 1485 0,114
Other Hardhat with ear muffs 3 2 130,00 65 780 0,060
Cutter protective clothing: no.of operators & mechanic: 3
Cs. hard hat with visor and ear muffs 3 2 420,00 210 2520 0,193
Visors 3 1 0,00 0 0 0,000
Ear muffs 3 2 0,00 0 0 0,000
Cs gloves 3 4 240,00 240 2880 0,221
Cs. pants 3 2 853,00 427 5118 0,392
Cs. tops 3 2 240,00 120 1440 0,110
All personnel including cutters: Total R 4954 59450 4,559
cutters Total R 997 11958 0,917
TOOLSCalculating done by: no.of people x no.of item/year x price.
no.of no/year cost per cost/ cost/ cost/
Item staff using item month year ton
Fire extinguishers large 1 1 492,75 41 493 0,038
Fire extinguishers small 1 1 0 0 0,000
Hatchets 26 1 279,51 606 7267 0,557
Hatchet sharpening files 26 3 58,90 383 4594 0,352
Chainsaw equipment
Chain 3 12 325,00 975 11700 0,897
Guidebars 3 6 530,00 795 9540 0,732
Round files 3 12 25,00 75 900 0,069
Flat files 3 6 58,90 88 1060 0,081
fuel cans (Combi can) 3 1 427,00 107 1281 0,098
Other sprocket 3 4 198,00 198 2376 0,182
Tools excluding chainsaw equipment = R 1030 12354 0,947
Tools : chainsaw equipment = R 2238 26857 2,060
CHAINSAW COSTSPlease complete the table. cst/mth cst/yr cst/ton
How many chainsaws, INC. spare saws do you use for this team? 3,3
How many chainsaws are working daily? 3
What is the lifespan of a chainsaw in months? (NB must be > 0) 6
What is the current replacement price of a chainsaw? 6999 3985,30 47824 3,667
How many liters of fuel do you use per chainsaw per day? 5,3
What is your cost of fuel/liter (the petrol x 2-stroke mix) ? 15,64 5139,30 61672 4,729
How many liters of chainlube do you use per chainsaw per day? 3
What is your cost of chainlube per liter? 15,52 2886,72 34641 2,656
What is your Repair Cost Factor for Chainsaws? 60 %
699,90 2099,7 25196,4 1,932
Gr tot. R 16349,12
Total R 14111,02 169332 12,99
Cst / saw / hr =R 39,95
At what interest rate can you finance assets? 12 %
(This figure is used to calculate the interest on your capital layout for chainsaws)
T O T A L CHAINSAW COST PER TON: R 15,05
Total harvesting costs per ton : Total harvesting costs:Labour costs R 108,16 Labour costs R 1 410 376,00
Chainsaw costs R 15,05 Chainsaw costs R 196 189,46
Tools cost R 0,95 Tools cost R 12 354,21
PPE cost R 4,56 PPE cost R 59 449,50Transportation costs R 10,47 Transportation costs R 136 499,20
Total: R 139,18 Total: R 1 814 868,37

87
Annexure 12: Manual labour costs for farmer 5
Manual labour tree harvesting costing Farmer 5Eucalyptus manual harvesting Rate per ton
Tree size = 0,2 R 148,50
Felling task = 115 trees
Production - 23 tons/cutter
Terrain 0-35%
Calculation inclusive of leave and sickleave provision
NO overheads and/or indirect costs
CALCULATION OF HARVESTING RATEVOLUMES TO BE HARVESTED
complete
What is the annual (or annualized) tonnage or volume to be harvested? 12400 tons
month prod.day
Volume per: 1033,3 50,0
What species to be harvested? Hardwood
PRODUCTION DAYS PER YEARcomplete
How many working days in this year? (5days times 52 weeks) 260 cst/day cst/month cst/year cst/ton
How many statutory leave days in this year? 12 249,02 5147 61758 4,98
How many days/labourer provided for sick leave/year? 10 207,52 4289 51465 4,15
How many days/labourer provided for leave/year? 15 311,28 6433 77198 6,23
How many days per year for un-productive time(red days etc.)? 3 62,26 1287 15440 1,25
Total 830,08 17155 205860,50 16,60
Labourer days available per year 220
Production days per year 248
Loss of production days / labourer / year 28
Average working days / month 20,67
STATUTORY COSTS AND PROVIDENT FUND
Indicate the relevant percentage in each case: % cst/mth cst/year cst/ton
WCA ( % of gross wage + salaries) 1,89 2092,44 25109 2,02
UIF (% as with workman's compensation) 1 1107,11 13285 1,07
What % of nett wage do you allow for medical expenses? 3 3019,40 36233 2,92
TOTAL= 6219 74627 6,02
CALCULATION OF STAFF COSTS.
PRODUCTIVITY
Cutter 16,67 ton/day
Stripper 2,08 ton/day
Salaried staff
OVERHEAD STAFF ONLY OVERHEAD STAFF ONLY UNSKILLED STAFF
No. of Name/ Gross No. of Name/ Gross No. of Name/ Nett
Managers describe monthly describe monthly describe daily
salary salary wage
1 Manager 10065
TOTALS: 1 R 10 064,67 0 0 0 0
Wage earners, daily paid staff.
SKILLED STAFF SKILLED STAFF UNSKILLED STAFF
No. of Name/ Nett No. of Name/ Nett No. of Name/ Nett
Supervisor describe daily describe daily describe daily
Drivers wage wage wage
1 Snr Induna 220,00 3 Chainsaw operator R 200,00 24 debarkers R 150,00
0
3 pushers R 150,00
TOTALS: 1 R 220,00 3 R 600,00 27 R 4 050,00
SUMMARY: UNITS /DAY /MTH /YEAR /TON
No. of overhead units = 1 Total overhead = 487,00 10 064,67 120 776,00 9,74
No. of skilled wage earners = 4 Total skilled = 820,00 16 946,67 203 360,00 16,40
No. of unskilled wage earners = 27 Total unskilled = 4 050,00 83 700,00 1 004 400,00 81,00
Total mandays/mth: 641 TOTAL = 5 357,00 110 711,33 1 328 536,00 107,14
AVERAGE WAGE Unskilled : = R 150,00 PER DAY
AVERAGE WAGE Unskilled : = R 3100,00 PER MONTH
AVERAGE WAGE Skilled : = R 205,00 PER DAY
AVERAGE WAGE Skilled : = R 4236,67 PER MONTH
COST OF TRANSPORT Your no. of salaried staff: = 1
Your no. of wage earners: = 31
complete
TRANSPORT
Cost per KM R 6,88
Distance traveled per day in km 74
Distance traveld annually in km 18352
Transport costs per annum R 126 261,76
Transporting vehicles needed 2
Total transport costs per annum R 252 523,52
/working /month /year /ton
day
Transport R 1 018,24 R 21 043,63 R 252 523,52 R 20,36

88
Annexure 12 continue: manual labour costing farmer 5
PROTECTIVE CLOTHING (SAFETY)Skilled 1 Cs.oper. 3
Unskilled 27
Please complete the table.
Calculating done by: no.of people x no.of item/year x price.
no.of no/year cost per cost/ cost/ cost/
Item staff using item month year ton
Two piece overalls 31 2 133,00 687 8246 0,665
Steel toe cap boots 31 2 225,00 1163 13950 1,125
Rain coat - two piece 31 1 212,00 548 6572 0,530
Leggings 24 0,75 130,00 195 2340 0,189
Poly/rubber/plastic gloves 28 12 28,50 798 9576 0,772
Hard hats 28 1 20,50 48 574 0,046
Other Safety glasses 28 2 15,00 70 840 0,068
Other Bibs 31 1 45,00 116 1395 0,113
Other Hardhat with ear muffs 3 2 130,00 65 780 0,063
Cutter protective clothing: no.of operators & mechanic: 3
Cs. hard hat with visor and ear muffs 3 2 420,00 210 2520 0,203
Visors 3 1 0,00 0 0 0,000
Ear muffs 3 2 0,00 0 0 0,000
Cs gloves 3 4 240,00 240 2880 0,232
Cs. pants 3 2 853,00 427 5118 0,413
Cs. tops 3 2 240,00 120 1440 0,116
All personnel including cutters: Total R 4686 56231 4,535
cutters Total R 997 11958 0,964
TOOLSCalculating done by: no.of people x no.of item/year x price.
no.of no/year cost per cost/ cost/ cost/
Item staff using item month year ton
Fire extinguishers large 1 1 492,75 41 493 0,040
Fire extinguishers small 1 1 0 0 0,000
Hatchets 24 1 279,51 559 6708 0,541
Hatchet sharpening files 24 3 58,90 353 4241 0,342
Chainsaw equipment
Chain 3 12 325,00 975 11700 0,944
Guidebars 3 6 530,00 795 9540 0,769
Round files 3 12 25,00 75 900 0,073
Flat files 3 6 58,90 88 1060 0,086
fuel cans (Combi can) 3 1 427,00 107 1281 0,103
Other sprocket 3 4 198,00 198 2376 0,192
Tools excluding chainsaw equipment = R 953 11442 0,923
Tools : chainsaw equipment = R 2238 26857 2,166
CHAINSAW COSTSPlease complete the table. cst/mth cst/yr cst/ton
How many chainsaws, INC. spare saws do you use for this team? 3,3
How many chainsaws are working daily? 3
What is the lifespan of a chainsaw in months? (NB must be > 0) 6
What is the current replacement price of a chainsaw? 6999 3985,30 47824 3,857
How many liters of fuel do you use per chainsaw per day? 5
What is your cost of fuel/liter (the petrol x 2-stroke mix) ? 15,64 4848,40 58181 4,692
How many liters of chainlube do you use per chainsaw per day? 3
What is your cost of chainlube per liter? 15,52 2886,72 34641 2,794
What is your Repair Cost Factor for Chainsaws? 60 %
699,90 2099,7 25196,4 2,032
Gr tot. R 16058,22
Total R 13820,12 165841 13,37
Cst / saw / hr =R 39,24
At what interest rate can you finance assets? 12 %
(This figure is used to calculate the interest on your capital layout for chainsaws)
T O T A L CHAINSAW COST PER TON: R 15,54
Total harvesting costs per ton : Total harvesting costs:Labour costs R 107,14 Labour costs R 1 328 536,00
Chainsaw costs R 15,54 Chainsaw costs R 192 698,61
Tools cost R 0,92 Tools cost R 11 441,79
PPE cost R 4,53 PPE cost R 56 231,00Transportation costs R 20,36 Transportation costs R 252 523,52
Total: R 148,50 Total: R 1 841 430,92