
Cost comparative price report with AHA data addition international comparison

i
A COST ANALYSIS OF THE ADDITION OF AN ONION PROCESSING LINE TO
TAYLOR FARMS: SALINAS, CALIFORNIA
Presented to the
Faculty of the Agribusiness Department
California Polytechnic State University
In Partial Fulfillment
of the Requirements for the Degree
Bachelor of Science
by
Garett Sabaska
June 2013

ii
APPROVAL PAGE
TITLE: A Cost Analysis of the Addition of an Onion Processing Line to
Taylor Farms: Salinas, California
AUTHOR: Garett Sabaska
DATE SUBMITTED: June 2013
__________________________ ___________________________
SENIOR PROJECT ADVISOR SIGNATURE

iii
ABSTRACT
Taylor Farms has been one of the leading foodservice companies for the past 17 years. It
is looking to expand its operations to include a line that would process red and yellow onions.
To determine if this expansion would prove to be profitable, a projected budget for three
scenarios was created. The scenarios were formulated to account for the “normal” base period, a
“worst” case scenario, and a “best” case scenario. These three scenarios would account for
periods where revenues and expenses were either higher or lower than the expected averages.
The initial start-up costs as well as expenses of day-to-day operations and revenues were
projected for each scenario for the period of 2012 to 2017. The addition of the line would prove
to be profitable if the cost of start-up was covered within a 5-year period and the internal rate of
return was 7% or higher.
The analysis of the projected budgets determined that the “normal” case scenario would
cover the initial start-up cost around June of 2017. This would be within the 5-year period, and
yield an internal rate of return was only 4.64%. The “worst” case scenario showed negative net
incomes and over the time frame would only pay off 4.76% of the initial start-up cost. The
internal rate of return was much lower at only 2.06%. The “best” case scenario projected that the
initial start-up cost would in fact be paid in full by the end of February of 2014. The internal
rate of return was 11,767.77% for the period of 2012 to 2017.

iv
TABLE OF CONTENTS
Chapter Page
I. INTRODUCTION………………………………..…..………………………………..1 Statement of the Problem….……………..……….…………………………. 3 Hypothesis…………………………….…...………………………………… 3 Objectives of the Study…….……………....………………………………… 3 Justification………………………………………………………………….. 4
II. REVIEW OF THE LITERATURE……………..…..………………………………… 5
Foodservice Industry Trends.…………………..…….……………………….5 Health Benefits of Onions…………………………………………….………6 Nutritional Facts………………….……………..…………………….………7 Processed Onion Marketing and Consumption…….….……………..……….8 Competition in Processed Onion Industry…...……………….……………….9 Cost Analysis………………………………………………………………….9
III. METHODOLOGY…………………………………………..……………………….12
Procedures for Data Collection………………………………………………12 Procedures for Data Analysis…………...……………………………………13 Assumptions………………...……..…………………………………………16 Limitations………...…………………………………………………………16
IV. DEVELOPMENT OF THE STUDY………………………………………………..17
Analysis of “Normal” Scenario……………………………..………………..18 Analysis of “Worst” Case Scenario……….……...………..…………………21 Analysis of “Best” Case Scenario……….……………...…………………….24
V. SUMMARY, CONCLUSIONS, AND RECCOMENDATIONS………..…………26
Summary…………………………………………………………..…………26 Conclusions…………………………………………………..………………26 Recommendations……………………………………………..……………..27
References Cited……………………………………………………………………………29

v
LIST OF TABLES
Table Page
1 Onion Nutritional Facts…………………………………………………………….…..7
2 Projected Income Statement for 2012-2017, “Normal” Scenario…………….…...…. 18
3 Projected Income Statement for 2012-2017, “Worst” Case Scenario………….…….. 21
4 Projected Income Statement for 2012-2017, “Best” Case Scenario…….……………..24

1
Chapter 1
INTRODUCTION
The bulb onion originated from the area comprising Afghanistan, Iran, and the southern
portion of the former Soviet Union. Onions are part of the genus Allium, which is extremely
diverse, containing over 600 species of perennial and biennial pungent bulbous plants including
garlic, leek, and chive. Goldman (2002) found that the bulb onion, Allium cepa, is the most
widely cultivated of the edible species. This species of onion has been cultivated for over 5,000
years by farmers throughout various temperate zones. Griffiths (2002) noted Allium cepa is no
longer known in the wild and may have either become extinct or be a hybrid from ancient
civilization.
Bulb onions spread through Asia to Europe and then were introduced to the United States
by European immigrants. For three centuries, the onion population in the United States was
maintained as an open-pollinated population. This meaning pollination is by wind, birds, insects,
or other natural mechanisms. An effort was then made to improve the quality of the onion
through breeding programs. Goldman (2002) indicated that four founding breeding populations
make up the majority of modern onion germplasm used in the United States today. These
include ‘Danvers Yellow Globe,’ ‘Valencia,’ ‘White Bermuda,’ and ‘Spanish.’
Onions are most commonly used as a vegetable ingredient that adds taste and flavor to
many recipes. Onions are often used in salads because of their unique taste that can be described
as is intensely pungent with a sharp bite. Onions have the versatility to be used in all types of

2
food, unlike many other ingredients. Per capita onion consumption has risen over 70%, from
12.2 pounds per person in 1982 to 20 pounds in 2009 (National Onion Association, 2011). Due
to rising grower prices observed in 2009 and 2010, onion plantings in 2012 were expected to
increase by 14 percent across the U.S. (National Onion Association, 2011). This widespread
increase in demand has increased potential opportunities for foodservice companies selling
products to distributors such as U.S. Foodservice, Sysco, and Produce Alliance. These
distributors are part of a large network across the United States including many popular
restaurants and fast-food establishments such as Taco Bell, Chipotle, McDonalds, and Pizza Hut.
This growing market has been identified as a potential area of profit for many foodservice
companies, such as Taylor Farms in Salinas, California. Taylor Farms has established itself as
the largest value-added produce company in North America. The company reported revenues of
$1.1 billion and an operating income of $26 million in 2008 (Bell, 2008). Recently, Taylor
Farms has expressed interest in expanding its operations to include a new onion processing line
in its production facilities. The new onion processing line at Taylor Farms will top and tail the
onions, a procedure that removes the roots as well as the upper unwanted portion of the onion.
The processing line will also remove the skin from the onions. This is accomplished by a
machine slicing a small incision on the outer layer of the skin, and then using a high pressure air
jet to completely remove the skin. The final step will be various sliced, chopped, or diced cuts
made by specialized machines. These cut sizes and quantities will vary based on customer
demand. By installing a new onion processing line, Taylor Farms could diversify its commodity
line and cover one more aspect of the menu for its many distribution customers. Many
distributors would find it desirable to purchase onions from Taylor along with their lettuce,
3
cabbage, carrots, and other current produce needs. The option of purchasing onions from Taylor
Farms could potentially cut down on freight costs to customers, as well as facilitating the
ordering process and time spent on orders for distributors, saving them money. Logistically, it
would make transportation much more cost effective by having produce in route on the same
truckload as opposed to on trucks scattered across the United States. However, in order to
accomplish this, Taylor Farms first needs to assess the current situation and determine whether
this is just a trend or a potential long-run market.
Problem Statement
Will the addition of a new onion processing line to the Taylor Farms facilities in Salinas,
California be profitable?
Hypothesis
The onion processing plant will yield an internal rate of return of 7% or higher. Within
five years of implementation, the onion line will have covered initial start-up costs and produce
positive income to Taylor Farms.
Objectives
1) To assess the costs of installing and operating an onion processing line capable of handling over 300,000 pounds of onions per day.
2) To assess the potential benefits/income from operations of a large scale onion processing line
at Taylor Farms. 3) To evaluate how long it will take for Taylor Farms to begin profiting from this investment.

4
Justification
As a whole, agriculture in California employs approximately 443,900 people (Third
Quarter, 2012). Burden (2011) stated that California is the number one producer of onions in the
United States, supplying over 25% of the total U.S. production in 2010. Nearly 149,670 acres
were harvested nationwide. The total value of onion production in 2010 was $1.155 billion, up
from $1.05 billion in 2009 (Burden, 2011). This data cements the significance of the onion
industry and the role it plays in the United States economy, specifically California’s. The onion
industry provides not only jobs, but also a reliable and safe food source for millions of
consumers. The opportunity to become a part of this expanding industry and capitalize on
market conditions is a goal for many companies, including Taylor Farms.
The results of this cost analysis will provide a sound resource for those interested in
expanding into the onion processing industry as the value of production continues to increase.
Information will be provided regarding the costs of installing and operating a large-scale onion
processing line. Potential income from operations will also be made available. The
combinations of these will determine whether or not this onion processing operation will be
profitable after 5 years, and if not how long before it would be. This will give those interested in
expanding into onion processing a base line to help make decisions.

5
Chapter 2
REVIEW OF THE LITERATURE
Foodservice Industry Trends
Per capita consumption of fresh vegetables has increased over the last 25 years. One of
the major factors that can be attributed to this is the fact that the consumer has become more
aware of the health benefits of fresh produce. A media driven society has educated the consumer
on these potential benefits through many channels including television, radio, health programs,
and school educational programs. As a result, fresh cut vegetable processors have been forced to
adapt and evolve with this increased demand for product. The industry has experienced a
demand for more conveniently cut and packaged produce items, as the consumer population has
become more time-oriented. This challenge has been met with the evolution of post-harvesting
techniques and distribution systems that have led to fresher products. This continued demand for
convenient, higher quality products will undoubtedly be met by foodservice companies as a
challenge in the coming years. Cook (2010) explains that as a result the industry will continue to
grow, diversify, and become more efficient at what it does.
With these changes taking place, successful produce marketing companies will become
more market driven. This will lead to advances in quality, packaging, product form,
merchandising, and information to meet the specific needs of each market. Forward-looking
companies will take the extra step and become more account driven, and will act as partners to

6
help meet the individual needs of each account. Many foodservice companies have already
taken this step, as consumer specifications become increasingly strict (Cook, 2010).
Health Benefits of Onions
As mentioned earlier, one of the major reasons for increased consumption of fresh
vegetables is the growing awareness of health benefits. Onions contain high levels of
phytochemicals, which have been known to prevent various diseases such as cardiovascular
disease, diabetes, Alzheimers, cataracs, cancer, and age-related functional decline (Griffiths,
2002). Onions contain two major groups of flavonoids, the flavonols and the anthocyanins.
Flavonoids are plant-based compounds that have powerful antioxidant properties such as
reducing inflammation, preventing aging, and reducing cellular damage (Temple, 2000). The
flavonols are typically concentrated in the skin of the onion, where there is a yellow to brownish
color, while the anthocyanins are usually found in the red pigment (Griffiths, 2002). Temple
(2000) estimated that one-third of all cancer deaths in the United States could be avoided through
proper diet modification. A proper diet modification would include receiving the required
vegetable servings per day, which could be supplemented heavily with onions. A study
conducted in Hawaii found that the consumption of quercetin in onions was inversely associated
with lung cancer risk (Marchand, et al. 2000). The effects of onions seemed to be especially
strong against squamous cell carcinoma.

7
Nutritional Facts
Darbyshire (1990) notes that water makes up approximately 80-95% of the fresh weight
of onions. Of the rest of the onion, more than 65% of the dry mass may be in the form of non-
structural carbohydrates. Onions store these non-structural carbohydrates in the form of fructan,
a fructose base polymer. In contrast, low dry matter onions have lower levels of fructan but
proportionately higher levels of glucose, fructose, and sucrose. An ordinary onion has only
around 40 calories. Onions are a good source of dietary fiber, vitamin B6, folate, potassium,
manganese, and vitamin C. The table below depicts the nutritional value of an onion into the
following categories: nutritional value, vitamins, electrolytes, minerals, and phyto-nutrients.
Table 1: Onion Nutritional Facts

8
Processed Onion Marketing and Consumption
In the United States, the onion industry is a $1.155 billion sector of the agricultural
market (Burden, 2011). The majority of the time, onions are used as complementary items that
add flavor. Onions bring new life and flare to dishes that are bland and need more depth and
texture. The unique taste makes onions extremely versatile and popular across a wide variety of
ethnicities and regions (Griffiths, 2002). There are two main types of onions that are marketed in
the United States: pungent and sweet. In general, pungent onions have been used in cooking.
These onions have white to yellow flesh and brown to yellow skins, or occasionally red and
purple. The “sweet” onions are typically less pungent and are more attractive for fresh,
uncooked use in dishes. Although the sweet, less pungent onions are becoming more popular,
the more pungent onion still dominates the market. The reasons for this include that they have
more flavor in cooked dishes, are easier to handle, and have a longer shelf-life (Griffiths, 2002).
Huang (et al., 2007) stated that onions now rank third in the United States for fresh
vegetable consumption. In 1983 consumption per capita was 13 pounds and in 2005 it was
nearly 21 pounds. The change is largely due to the increase in popularity of salad bars, salsa,
and away-from-home-foods (Huang, et al., 2007).
Restaurants and distributors are demanding a wider variety of options available to them
from the processors. Onions can now be purchased in a partially prepared form, such as sliced,
diced, or chopped (Cook, et al. 2010). Processors offer multiple options for the size of the cut
that is available to the consumer as well. The selection of products for sale makes it possible for
the customer to purchase exactly what they want. Slicing and dicing onions removes the
9
majority of preparation for the consumer, making the process of utilizing them in dishes quicker
and easier.
Competition in Processed Onion Industry
Gills Onions (Oxnard, CA) is one of the largest fresh onion processors in the state. Gills
peels, slices, and dices more than 100,000 tons of fresh onions per year (French, et al., 2009).
French et al. 2009, found that approximately 37% of the onions processed cannot be used by the
consumer and are discarded as waste. Concerned with building a sustainable environment, Gills
has been making efforts to minimize waste. Originally they returned this waste to the soil
through land application, but as volumes increased and waste costs rose, new ideas were needed
(French, et al., 2009). Gills has now implemented a $10.6 million proprietary process that
converts nearly 300,000 pounds per day of onion waste into clean energy. The process extracts
the juice from the onion peels and treats it in a high-rate anaerobic reactor to produce methane-
rich biogas that powers two 300-kilowatt fuel cells. The electricity produced is used to power
the onion processing plant, saving an estimated $700,000 annually in electrical costs. This
process reduces waste, opens new market opportunities, increases profitability, and improves the
company’s overall “green” image (French, et al., 2009).
Cost Analysis
According to Sarabakos and Kosaropoulos (2002), an economic analysis of orange
processing requires cost data and various calculations. The required data includes the
depreciation of the fixed capital, the costs of the raw material, labor, and utilities. The cost of the

10
oranges is said to be the most important cost component, responsible for up to 70%. The cost is
similar when processing onions, where the raw product is the largest portion of cost for the entire
processing operation. This cost can be extremely variable due to weather conditions and
agricultural policy or government price support. In extreme drought conditions, prices will rise
drastically.
The total cost or fixed capital of a processing plant can be found estimated on the basis of
the purchased cost of the main food processing equipment. Becker and Parsons (2007) note the
cost of the food processing equipment, as a percentage of the fixed cost, is higher than the cost of
chemical food processing equipment. Fixed costs include: the cost of equipment installation,
piping, buildings and construction, electrical, instrumentation and control, engineering fees, and
contingency. Evaluation of a plant 150% larger than his model, determined that “economies of
scale generate processing cost reductions between 7% and 13%”(Becker and Parsons, et al.,
2007). Based on this information, if there is room for increasing the total amount of onions
processed, it would be advantageous because it would lower processing costs as Becker found.
Wampler’s (2011) cost-benefit analysis of installing solar panels, he discusses the three
ratios that need to be calculated to determine if an investment will be profitable: the net present
value should be greater than zero, the internal rate of return should be greater than the initial
discount rate, and the cost-benefit calculation should be a positive number. He argues that the
best way to measure this cost saving is to find the difference in the present value of total
operating costs in the two cases and deduct the capital cost of the alternatives.
The IRR or internal rate of return is a calculation that is a form of break-even analysis.
The IRR will indicate the highest discount rate a project can support before a negative NPV is

11
generated. The IRR is a good calculation to use if the size of a project is infinitely variable
(Snyder, 2012). The IRR calculation for the onion processing line will show the rate of growth
that the project is expected to generate.
12
Chapter 3
METHODOLOGY
Procedures for Data Collection
This study will use information that has been gathered from Taylor Farms’ company
records, accounting records, and personal interviews with the fresh cut vegetable manager
(Marcus Shebl) at Taylor Farms. The costs of installing the onion processing line and also
operating costs will be obtained from company financial budget records. The following
information will be needed to create a budget: hours of operation daily, maintenance costs,
production overhead costs, number of employees on the line, wages, cost of raw product, cost of
onion packaging material, initial cost of machines, training for supervisors, total product output
of machine, freight, and administrative costs. Each of these variables will be needed in order to
compute the total costs of installing and operating the processing line.
The next piece of information that will be gathered in evaluating the onion processing
line is income from operations. This information will be gathered from personal interviews with
the fresh cut vegetable manager, Marcus Shebl, at Taylor Farms. The total revenue for the onion
processing line will be computed based on a per pound basis.
Finally, the revenue and cost variables will be used to evaluate objectives one, assessing
the costs of installing and operating an onion processing line capable of handling over 300,000
pounds of onions per day, and objective two, assessing the potential benefits/income from
operations of a large scale onion processing line at Taylor Farms. These two parts are needed to
formulate objective three, which is how long will it take Taylor Farms to make a profit from this
13
investment. This data will once again be gathered directly from Taylor Farms and will be
evaluated over a baseline of 5 years.
Procedures for Data Analysis
The basic structure for the analysis of this study will use a budget format. The
revenues and expenses will be entered into an excel template with formulas to calculate net
income. The income statements created will be for the period between 2012 and 2017. It is
important to note that for 2012, the income statement only reflects a two-month period as the
onion line began operations in November. The years of 2013-2017 are projections based on data
collected through the first 6 months of operation. Revenues and expenses for each year will be
calculated based on a 52-week work year. Note that revenues and expenses will be calculated on
a dollar basis per finished pound sold. For example, for each pound of finished product sold, the
revenue generated will be $0.7165/lb and the cost for freight will be $0.08/lb sold. If 10 pounds
of finished product were sold, the revenue will be a total of $7.16 and the cost of freight will be a
total of $0.80. Through the first six months of operation the following data will need to be
collected: Sales revenue, raw product, direct labor, freight, packaging, production overhead, and
operating expense (SAG). The total cost for each of these categories will be summed over the
six-month period. The total for each individual expense category will be divided by the total
number of finished pounds sold, resulting in a cost per pound sold. For example, to find the cost
per pound sold for freight expenses, the total number of pounds sold for the period would be
divided by the total cost of freight in the same period. If 4,626,625 pounds of onions are sold
and the cost of freight in the same period is $390,047 then 4,625,625 is divided by $390,047 to

14
find the cost of freight per pound sold, resulting in a $0.0843/lb cost for freight. Each expense
item and the revenue will follow this procedure until a per/lb cost and revenue is found for each.
The resulting per/lb data components will then be used to extrapolate the remainder of the 5-year
period. The income statement will show revenue minus all expenses. When the formulas have
been completed, net incomes for each year will be available, and a payback period of the
investment can be found.
Three tables will be used to display income statements for a normal period, “best case,”
and “worst” case scenario. The normal period income statement depicts the current market place
and is used as a base to evaluate the rest of the projections. The “best case” scenario projects for
the best possible conditions that the operation could encounter. Revenues would increase and
expenses would be lower than typical, giving a net income much higher than that of the “normal”
base period. The “worst case” scenario depicts a market where all the expenses of operation
increase. However, the “worst” case scenario also forces the price for finished product to rise
based on raw product prices. If the cost per unit sold to the customer did not change, a much
more drastic loss for net incomes for each year would be seen.
The variability of each item on the income statements for “best” and “worst” conditions
was given by the fresh cut vegetable manager at Taylor Farms, based on his experience in the
produce industry. The following are the potential changes that are projected for the “best case”
scenario: Increase in revenues by $0.40/lb, and decreases to raw product: Red onions $0.04 and
Yellow onions $0.03, decrease in direct labor of 5%, decrease in freight of 20%, decrease in
packaging of 5%, decrease in production overhead of 6%, and decrease in operating expenses
(SAG) of 2%.

15
The conditions for the projections of the “worst” case scenario are the inverse of the
percentages given for “best” case scenario, with expenses increasing, however keeping revenues
constant. The only difference is seen in the raw product: Red onions increase $0.75/lb and
Yellow onions increase $0.40/lb.
When making projections for the coming years, an increase of 5% for yield from raw
product of 5% will be used, based on the premise that efficiencies will increase. However, the
yield will reach a plateau and maintain at 72.9% of raw product. Also, income taxes will be 35%
of income from operations.
When comparing the three scenarios of normal, “best,” and “worst,” it will be easy to see
how the variation of expenses can affect the processing line’s chances of success. The net
incomes will give a clear idea of profitability of the onion line and how each item on the
statement affects the net income over the period of 2012 to 2017.
With the income statements complete, IRR and ROI can be calculated. Return on
Investment (ROI) can be calculated using the following equations: Return on investment (%) =
Net profit / Investment × 100 or Return on investment = (gain from investment - cost of
investment) / cost of investment. This number will tell Taylor Farms the percentage of the
investment that they are making back. Finally, there is the internal rate of return (IRR).
After calculating the IRR, if the IRR is greater than the cost of capital, Taylor Farms should keep
the onion processing line. If the IRR is less than the cost of capital, Taylor Farms should reject
the project.

16
The final step is to see how long it would take to pay off the initial investment of
$3,625,000. By taking the net incomes of the time period, the breakeven point for the onion line
can be determined comparing it to the cost of the initial investment.
Assumptions
This study assumes that there will be a variability of 5% for the cost of labor in
Salinas. If there were potential labor shortages due to immigration issues, the cost of labor
would increase drastically. This study also assumes that there will be normal weather and no
issues with drought or natural disasters. A drought could result in loss of crop and an extreme
shortage of onion supply, resulting in high prices for raw product. The most that raw product
costs could increase by will be $0.75 for red onions and $0.40 for yellow onions. The
assumption for the remainder of the expenses is that they will stay within the projected
variability range that has been created, an increase or decrease based on the normal base period:
Freight 20%, Packaging 5%, Production Overhead 6%, and Operating Expenses (SAG) 2%.
Another assumption is that the yield from raw product will increase 5% each year, starting in
2012 at 52.9% and reaching a plateau of 72.9%, where it can no longer be improved.
Limitations
Limitations of the project are that data collected pertain to Taylor Farms in
Salinas and may not be applicable to other companies in the industry. Production methods,
machinery, and management styles are most likely different between companies and the results
of a similar line could vary greatly.

17
Chapter 4
DEVELOPMENT OF THE STUDY
Analysis
The analysis of the onion processing line is broken down into three separate scenarios: a
“normal” base period, a “worst” case, and a “best” case. The normal period accounts for normal
market conditions, where there are no extreme changes in production costs or revenues. This
scenario is used as the base line to make all other projections on the income statements. The
“worst” case scenario accounts for a period where Taylor Farms would be in the worst condition
possible. Expenses of the onion processing line would be much higher than typical. The “best”
case projects a period in which expenses are lower than the base period and revenues are higher.
Net incomes will be much higher in this case. The reason for creating the three separate sets of
income statements is to account for any possible variability in the expenses and revenues, giving
a more realistic set of results to make decisions.

18
Table 2: Projected Income Statement for 2012-2017, “Normal” Scenario
The table above is the set of income statements for the “normal” base period between
2012 and 2017. The revenues and expenses in 2012 are much lower than the following years
because it accounts for only November and December, as the processing line started operation in
November. The revenue was calculated for each year by multiplying the revenue/lb by the total
amount of pounds sold in that year. Revenue/lb was determined by taking the total pound of
onions sold in the first six months of production, then dividing this number by the total revenue
19
of the same time period. The result was $3,314,783 of total revenue divided by 4,626,675 total
lbs sold, giving a revenue/lb of $0.7165. In the first full year of production (2013), 10,971,539
pounds of onions were sold, so the revenue was 10,971,539 multiplied by $0.7165 producing a
total revenue of $7,860,563. In each year following, the yield from raw product increased by 5%
until it reached a plateau at 72.9%. The revenues from 2014 to 2017 account for this change in
yield, as revenues increase until the plateau is reached in 2017.
The cost for raw product/lb was determined by the same process as the revenue/lb,
however total raw product cost had to account for both red and yellow onions, which have
different costs. The total cost for raw product was found by combining the individual cost for
the red and yellow per pound and multiplying this by the total pounds sold of each per year. The
raw product cost in 2013 is high due to current market conditions, forcing prices to skyrocket. In
2013 the red onion cost was approximately $0.53/lb and the cost of yellow onion was at $0.26/lb,
combined to total $3,788,523. However, based on the projections for better market conditons,
the prices for 2014-2017 are much lower at $0.135/lb for red onions and $0.185/lb for yellow
onions.
Direct labor, freight, packaging, production overhead, and operating expenses (SAG)
were all calculated in the same manner as described above. A cost per pound was found for each
item. This cost/lb was then multiplied by the total number of pounds sold in that year, increasing
at 5% until reaching a maximum yield at 72.9% in 2016.
Once all the revenues and expenses had been calculated, gross profit was found by
subtracting the total cost of goods sold from the revenue. Total Operating expenses were then
subtracted from the gross profit, resulting in an operating income before taxes. Depending on

20
whether or not the year had a positive income, a tax rate of 35% was applied and then subtracted
from the operating income before taxes, yielding net income.
The net income for the years of 2012 and 2013 was negative, however 2014-2017 saw
positive incomes. The total net income from the onion processing line summed over the 6-year
period was $4,681,853. Based on the initial investment cost of $3,625,000, the onion processing
line would cover the start-up costs and begin to make profit around June of 2017.
The IRR for the time period was 4.64%. This was calculated using the initial investment
costs and the inflows of net income in each year.

21
Table 3: Projected Income Statement for 2012-2017, “Worst” Case Scenario
The table above shows the “worst” case scenario that the onion line could see from 2012-
2017. This was created to help Taylor Farms plan for the worst possible conditions that could be
seen and allow them to plan accordingly. All of the items on the income statement were
projected using the “normal” period as a guideline for the calculations. The changes in the items
22
are as follows: Revenue will increase $0.40/lb, raw product will increase $0.40/lb for yellow
onions and $0.75/lb for red onions, direct labor will increase 5%, freight will increase 20%,
packaging will increase 5%, production overhead will increase 6%, and operating expenses
(SAG) will increase 2%. These projected changes are relevant due to the variability in the
produce industry.
The revenue per pound increases in the “worst” case scenario due to the fact that
foodservice companies must raise their selling price in response to change in raw product prices.
If they do not, then the net income will be dramatically affected and most likely become
negative. With this increase, the total revenue/lb would be $1.11/lb, however the amount of total
finished product sold stayed at the same level as the “normal” period.
Raw product was calculated by increasing the cost for yellow onions by $0.40/lb and red
onions by $0.75/lb. This increase could be applied due to reasons such as drought, natural
disasters, and other events causing shortages of onions. The cost per pound was multiplied by
the total pounds sold for the year.
All other costs that are in the form of percentages were calculated simply by
extrapolating data based on the “normal” period. For example, the direct labor is projected to
increase 5% each year. To calculate the direct labor cost used for the “worst” case scenario, the
direct labor cost from the “normal” period of 2013 was taken, ($1,881,523) and multiplied by
1.05, resulting in $1,975,599. This new cost for direct labor accounts for any potential changes
that may take place.
23
The remainder of the expense items were calculated using the method described above.
The necessary pieces were taken from the “normal” income statements and multiplied by the
respective percentage increase in order to find the new projected expenses.
Based on these projected changes, the “worst” case scenario has only 3 years in which it
has a positive net income. The total sum of all the net incomes over the period of 2012-2017 is
only $172,716. With the initial start-up of the onion processing line costing $3,625,000, the
processing operation would only cover 4.76% of the initial cost.
The IRR for the time period was 2.06%. This was calculated using the initial investment
costs and the inflows of net income in each year.
24
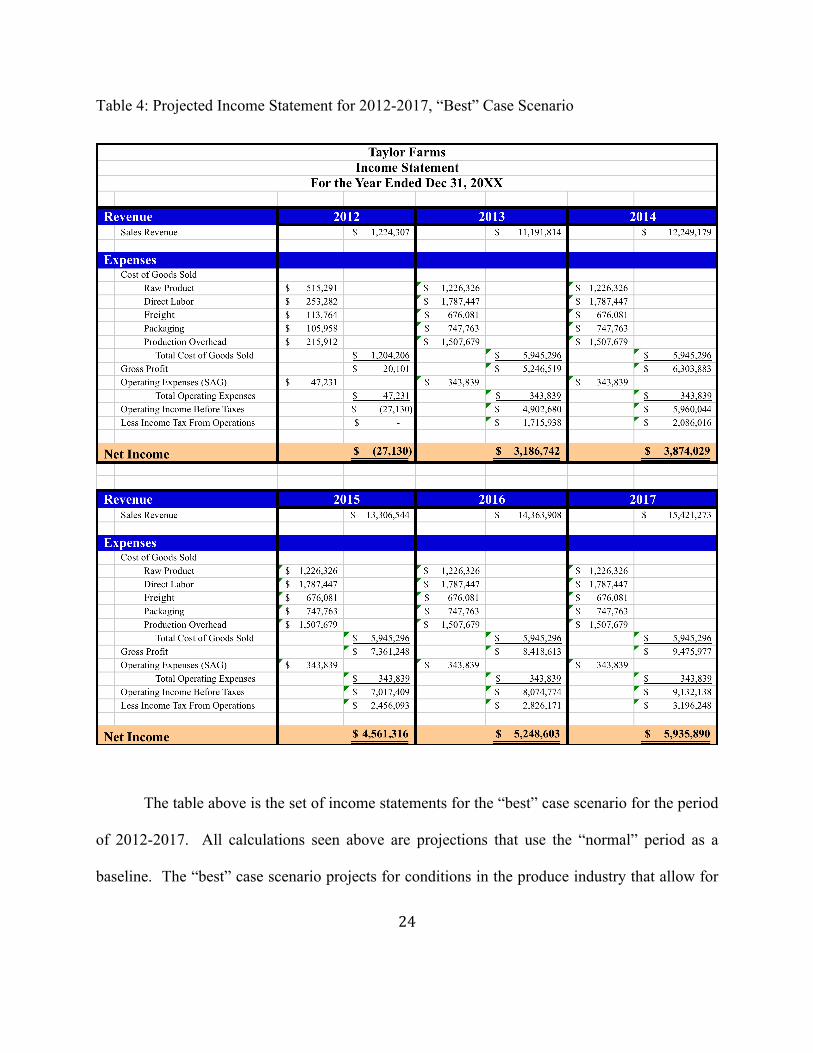
Table 4: Projected Income Statement for 2012-2017, “Best” Case Scenario
The table above is the set of income statements for the “best” case scenario for the period
of 2012-2017. All calculations seen above are projections that use the “normal” period as a
baseline. The “best” case scenario projects for conditions in the produce industry that allow for

25
revenues to increase and for all expenses to decrease. This is the best possible scenario that the
onion processing would ever see, and net incomes are expected to be much higher than that of
the “normal” period.
The raw product cost for red onions decreases by $0.04/lb and the yellow onion cost
decreases by $0.03/lb. These assumptions are made based on the probability that there could be
a potential surplus of onions, causing prices to decrease. The remainder of the calculations are
made using the same process as the “worst” case scenario. The only difference is that all
expenses decrease, rather than increase as seen in the “worst” case scenario. For example, the
direct labor cost from the “normal” period of 2013 ($1,881,523), would be multiplied by 0.95,
yielding a new cost of $1,787,447.
Based on the projections for the “best” case scenario, the onion processing line would see
positive net incomes in each year after the initial start-up in 2012. Net incomes are much higher
than that of the “normal” period, with a total of $22,779,449 over the period of 6 years. The
initial cost of $3,625,000 could potentially be paid off by the end of February of 2014.
The IRR for the time period was 11,767.77%. This was calculated using the initial
investment costs and the inflows of net income in each year.
26
Chapter 5
SUMMARY, CONCLUSIONS, AND RECOMMENDATIONS
Summary
The objective of this study was to determine whether the addition of an onion processing
line would be profitable to Taylor Farms of Salinas. The expenses associated with the initial
start-up of the operation were determined. The revenues for each year form 2012 to 2017 were
determined. The variable and fixed costs of the processing line were projected for the years
2012 to 2017. Three separate scenarios were accounted for, giving Taylor Farms a more in depth
look at the possible returns and costs of operating the onion line. The three scenarios were the
“normal” base period, “worst” case scenario, and “best” case scenario. With the revenues and
expenses determined, net income was calculated for each year of operation for the 2012 to 2017
time frame. The total net incomes of each year were compared with the initial start-up cost of
$3,625,000 to find a break-even point at which the company would begin to make profit.
Internal rate of return was calculated for the “normal” scenario and then compared with the IRR
of the “worst” and “best” scenarios.
Conclusions
Analysis of the onion processing line showed that the net incomes of the “normal” case
scenario would break-even with the initial start-up cost around June of 2017. This would be
within the 5-year period, proving the hypothesis to be correct. The internal rate of return was

27
only 4.64%, lower than that of the hypothesis at 7%. The “worst” case scenario showed negative
net incomes and over the time frame would only pay off 4.76% of the initial start-up cost. The
internal rate of return was much lower at only 2.06%. The “worst” case scenario would not
allow for the onion processing line to break-even and make a profit before the end of 2017. The
major factor affecting a positive net income was the raw product cost being much higher and
accounting for the majority of the expenses. Under these conditions the hypothesis would be
proven false. The “best” case scenario projected that the initial start-up cost would in fact be
paid in full by the end of February of 2014. The decreases in expenses allowed for this scenario
to be paid off the fastest. The internal rate of return was 11,767.77% for the period of 2012 to
2017. This scenario was by far the best return for the onion line and satisfied the hypothesis.
The purpose for presenting these three scenarios was to show how the potential payback period
for the investment could vary. The three data sets provide a baseline for the future and allow for
comparison to make decisions.
Recommendations
Based on the initial start-up cost, projected revenues, and expenses for 2012 to 2017, the
addition of an onion processing line to Taylor Farms of Salinas will prove to be a revenue
enhancing operation. It would be recommended for Taylor Farms to make contracts with its
onion suppliers for an extended period of time once prices begin to decrease. This would allow
for a more stable cost of raw product and could help to control overall costs if market swings
were to occur. It is also recommended to continue to increase the total amount of pounds each
28
year if the line has the capacity for it. Increasing the total production by 150% could decrease
the processing costs from 7%-13%, and increase net incomes.
29
References Cited
Becker, K.M. and R.L. Parsons. 2007. “A Cost and Returns Evaluation of Alternative Dairy
Products to Determine Capital Investment and Operational Feasibility of a Small-Scale Dairy Processing Facility.” Journal of Dairy Science (90:5). May. pp. 2506–2516.
Bell, David, Natalie Kindred, and Mary Shelman. 2008. “Taylor Fresh Foods.” Unpublished
M.S. Thesis, Harvard Business School. pp. 3-38. Burden, Dan. 2011. “Onion Profile.” Agricultural Marketing Resource Center. Iowa State
University. pp. 1-3 Cook, Roberta. 2000. “The Fresh Fruit and Vegetable Value Chain Faces New Forces for
Change.” Paper presented at the AAEA Pre-Conference Workshop, Tampa, Florida, July. Cook, Roberta. 2010. “An Industry in Transition.” University of California, Davis. The U.S.
Fresh Produce Industry. pp. 5-29. Darbyshire, B and BT Steer. 1990. Carbohydrate Biochemistry in Onions and Allied Crops,
Brewster JL, Rabinowitch HD (eds). Boca Raton: CRC Press Inc.
French, LeeAnne, Laura Hamman, Stacy Katz, and Yuji Kozaki. 2010. “Zero Waste Strategies for Gills Onions Sustainable Innovation and Waste Management.” Donald Bren School of Environmental Science and Management, University of Calif., Santa Barbara. pp. 2-3.
Goldman, Irwin and Geoffrey Schroeck. 2002. “History of Public Onion Breeding Programs in
the United States.” Volume 20. Hobeneck, New Jersey: John Wiley and Sons Inc. pp. 68-80.
Griffiths G, L. Trueman, T. Crowther, B. Thomas, and B. Smith. 2002. “Onions: A Global
Benefit to Health.” Phytotherapy Reasearch (16:7). November. pp. 603-615 Huang, Sophia and Kuo Huang. 2007. “Increased U.S. Imports of Fresh Fruit and Vegetables.”
Washington, D.C.: USDA, September. pp. 2-13. Marchand, Le L, S.P. Murphy, J.H. Hankin, L.R. Wilkens, and L.N. Kolonel. 2000. “Intake of
flavonoids and lung cancer.” Journal of the National Cancer Institute (92:(2): Jan 154-60)
National Onion Association. 2011. “[Onion] Consumption.” Greeley, CO. 80631. Sarabakos, Geōrgios D. and Athanasios E. Kosaropoulos. 2002. Handbook of Food Processing
Equipment. New York City: Kluwer Academic/Plenum Publishers. pp. 7-37.

30
Shebl, Marcus. 2013. Fresh Cut Vegetable Manager, Taylor Farms. Personal Interview, Salinas
(April 15). Snyder, Dylan. 2012. “Feasibility Analysis of a Microbrewery.” Unpublished Senior Project.
California Polytechnic State University, San Luis Obispo. Temple, Norman J. 2000. “Antioxidants and Disease: More Questions Than Answers.”
Nutrition Research (20:3). March pp. 449-559. “Third Quarter, 2012: Quick Facts.” 2012. California Agricultural Bulletin. Employment
Development Department, State of California. pp. 1-2 Wampler, Morgan. 2011. “Cost-Benefit Analysis of Installing Solar Panels on the Schnoor
Almond Ranch.” Unpublished Senior Project. California Polytechnic State University, San Luis Obispo.