A content analysis study of Portable Assisted Study ...
331
Walden University ScholarWorks Harold L. Hodgkinson Award for Outstanding Dissertation University Awards 1996 A content analysis study of Portable Assisted Study Sequence mathematics curricular materials for migrant students using the National Council of Teachers of Mathematics Standards Karen I. Conger Follow this and additional works at: hp://scholarworks.waldenu.edu/hodgkinson is Dissertation is brought to you for free and open access by the University Awards at ScholarWorks. It has been accepted for inclusion in Harold L. Hodgkinson Award for Outstanding Dissertation by an authorized administrator of ScholarWorks. For more information, please contact [email protected].
Transcript of A content analysis study of Portable Assisted Study ...
Walden UniversityScholarWorks
Harold L. Hodgkinson Award for OutstandingDissertation University Awards
1996
A content analysis study of Portable Assisted StudySequence mathematics curricular materials formigrant students using the National Council ofTeachers of Mathematics StandardsKaren I. Conger
Follow this and additional works at: http://scholarworks.waldenu.edu/hodgkinson
This Dissertation is brought to you for free and open access by the University Awards at ScholarWorks. It has been accepted for inclusion in Harold L.Hodgkinson Award for Outstanding Dissertation by an authorized administrator of ScholarWorks. For more information, please [email protected].

INFORMATION TO USERS
This manuscript has been reproduced from the microfilm master. UMI
films the text directly from the original or copy submitted. Thus, some
thesis and dissertation copies are in typewriter face, while others may be
from any type o f computer printer.
The quality of this reproduction is dependent upon the quality of the
copy submitted. Broken or indistinct print, colored or poor quality
illustrations and photographs, print bleedthrough, substandard margins,
and improper alignment can adversely afreet reproduction.
In the unlikely event that the author did not send UMI a complete
manuscript and there are missing pages, these will be noted. Also, if
unauthorized copyright material had to be removed, a note will indicate
the deletion.
Oversize materials (e.g., maps, drawings, charts) are reproduced by
sectioning the original, beginning at the upper lefi-hand comer and
continuing from left to right in equal sections with small overlaps. Each
original is also photographed in one exposure and is included in reduced
form at the back of the book.
Photographs included in the original manuscript have been reproduced
xerographically in this copy. Higher quality 6” x 9” black and white
photographic prints are available for any photographs or illustrations
appearing in this copy for an additional charge. Contact UMI directly to
order.
UMIA Bell & Howell Information Company
300 North Zeeb Road, Ann Arbor MI 48106-1346 USA 313/761-4700 800/521-0600
Reproduced with permission of the copyright owner. Further reproduction prohibited without permission.

Reproduced with permission of the copyright owner. Further reproduction prohibited without permission.

A CONTENT ANALYSIS STUDY OF PORTABLE ASSISTED STUDY SEQUENCE MATHEMATICS
CURRICULAR MATERIALS FOR MIGRANT STUDENTS USING THE NATIONAL COUNCIL OF TEACHERS OF
MATHEMATICS STANDARDS
A DISSERTATION SUBMITTED TO THE FACULTY OF WALDEN UNIVERSITY
IN PARTIAL FULFILLMENT OF THE REQUIREMENTS FOR THE DEGREE OF
DOCTOR OF PHILOSOPHY
EDUCATION
BY
KAREN I. CONGER
August 1996
Reproduced with permission of the copyright owner. Further reproduction prohibited without permission.

UMI Number: 9705725
Copyright 1997 by Conger, Karen I.All rights reserved.
UMI Microform 9705725 Copyright 1996, by UMI Company. All rights reserved.
This microform edition is protected against unauthorized copying under Title 17, United States Code.
UMI300 North Zeeb Road Ann Arbor, MI 48103
Reproduced with permission of the copyright owner. Further reproduction prohibited without permission.

DOCTOR OF PHILOSOPHY DISSERTATION
OF
KAREN I. CONGER
APPROVED:
J. KENT MORRISONVICE PRESIDENT FOR ACADEMIC AFFAIRS
WALDEN UNIVERSITY 1996
Reproduced with permission of the copyright owner. Further reproduction prohibited without permission.
WALDEN UNIVERSITY
EDUCATION
This is to certify that I have examined the doctoral dissertation by
Karen Israelson Conger
and have found that it is complete and satisfactory in all respects, and that any and all revisions required by the review committee have been made.
Dr. Marilyn K. Simon Committee Chair
Signature
Date
Reproduced with permission of the copyright owner. Further reproduction prohibited without permission.
WALDEN UNIVERSITY
EDUCATION
This is to certify that I have examined the doctoral dissertation by
Karen Israelson Conger
and have found that it is complete and satisfactory in all respects.
Dr. Paul Bloland Committee Member
(Ljia.Signature
) u i y 1
Date
Reproduced with permission of the copyright owner. Further reproduction prohibited without permission.

WALDEN UNIVERSITY
EDUCATION
This is to certify that I have examined the doctoral dissertation by
Karen Israelson Conger
and have found that it is complete and satisfactory in all respects.
Dr. Barry Persky Committee Member
Signature
i \ \<\\ <\zDate
Reproduced with permission of the copyright owner. Further reproduction prohibited without permission.

Walden UniversityEDUCATION
This is to certify that I have examined the doctoral dissertation by
Karen Conger
and have found that it is complete and satisfactory in all respects.
Dr. Barbara Knudson, OAA Representative Professor of Education
Signature
~7. 3 ^ . 9 G>Date
Reproduced with permission of the copyright owner. Further reproduction prohibited without permission.

ABSTRACT
A CONTENT ANALYSIS STUDY OF PORTABLE ASSISTED STUDY SEQUENCE MATHEMATICS
CURRICULAR MATERIALS FOR MIGRANT STUDENTS USING THE NATIONAL COUNCIL OF TEACHERS OF
MATHEMATICS STANDARDS
A DISSERTATION SUBMITTED TO THE FACULTY OF WALDEN UNIVERSITY
IN PARTIAL FULFILLMENT OF THE REQUIREMENTS FOR THE DEGREE OF
DOCTOR OF PHILOSOPHY
EDUCATION
BY
KAREN I. CONGER
August 1996
Reproduced with permission of the copyright owner. Further reproduction prohibited without permission.

ABSTRACT
The need for change in the mathematics curricula in our public schools
has been well documented (Kirwan, 1990; National Commission on
Excellence in Education, 1983; National Research Council, 1989; Overby,
1993). Testing surveys show low overall performance at every age
throughout the K-12 levels. The Curriculum and Evaluation Standards for
School Mathematics. (Standards! issued by the National Council of Teachers
of Mathematics (NCTM) in 1989 are designed to move mathematics curricula
forward to meet the needs of students for the future. The analysis of new
curricular materials is essential in order to produce materials that meet
recommended standards.
Migrant students represent one segment of the student population with
deficiencies in mathematics training at the K-12 level. The Portable Assisted
Study Sequence (P.A.S.S.) Program serves migrant students in 165 schools in
California, and must provide materials which comply with the Standards.
This study analyzed and compared this compliance in two mathematics
courses written in 1989 and 1995 for P.A.S.S. An evaluative instrument was
designed to measure the extent to which reform ideas in the Standards are
represented in the curricular materials. Content analysis procedures were
used to analyze the curricula with the assistance of Nud*Ist software.
Reproduced with permission of the copyright owner. Further reproduction prohibited without permission.

Research design for the instrument included procedures for content validation
and interrater reliability. The results of this study showed the 1995 P.A.S.S.
curricular materials measurably improve upon the 1989 curricular materials
with respect to the Standards. The evaluative instrument was found to
effectively and reliably measure the extent to which curricular materials meet
the Standards.
This study provides guidance and direction for teachers, students,
curriculum developers, and future researchers at local, state, and national
levels. Standards are a major component of education, and this study
represents a pioneering effort to quantify the changes that can hopefully help
our society meet these goals. This process can be replicated in other
disciplines, which increases the potential for social change. Significant
curricular reform will have significant social impact.
Reproduced with permission of the copyright owner. Further reproduction prohibited without permission.

Dedication
I dedicate this dissertation
to Rosebud, Patches, and Sapphire, who were always by my side,
but most of all to my 3 best friends-
my husband Thurston, my daughter Kaarstin, and my son-in-law Mike.
Your thoughtfulness, patience, love, and help sustained me throughout,
and I will always treasure the memories.
Reproduced with permission of the copyright owner. Further reproduction prohibited without permission.

Acknowledgments
I wish to express sincere appreciation to my Doctoral Committee
Chair and faculty advisor, Dr. Marilyn K. Simon, for her unfailing support,
inspirational advice, and timely encouragement throughout this study. Her
great wisdom and unique humor helped me, in chaotic terminology, to find
order masquerading as randomness. I also wish to thank the other members
of my Doctoral Committee, Dr. Paul A. Bloland and Dr. Bany Persky, for
their willingness to serve on my committee, as well as their insights,
expertise, and support throughout the Walden program.
To my validation panel, comprised of Dr. Jane D. Gawronski, Dr.
Carol Fry Bohlin, and Dr. Roy M. Bohlin, and the mathematics department at
my school, I express thanks for their guidance, assistance, expertise, and
time which were invaluable to this study. To the administration at my school,
I express profound gratitude for the encouragement and supportive working
environment they have given me to pursue this dream.
To the assistant coders and computer programmer who assisted me in
this study, I express my eternal gratitude for their help with coding, scanning,
programming, typing, and computer maintenance. I am appreciative beyond
measure for their devotion to this study and their sharing in the vision.
ii
Reproduced with permission of the copyright owner. Further reproduction prohibited without permission.
TABLE OF CONTENTS
LIST OF FIGURES............................................................................ vii
LIST OF TABLES.............................................................................. viii
CHAPTER 1Introduction.......................................................................................... 1
Statement of the Problem.......................................................... 4Background of the Problem...................................................... 5
Curriculum and Reform Standards................................. 6The Migrant Student....................................................... 9California Portable Assisted Study Sequence
(P.A.S.S.) Program............................................... 11Study Background.......................................................... 12
Purpose of the Study................................................................. 13Significance of the Study.......................................................... 13Nature of the Study.................................................................. 16Theoretical Framework............................................................ 17Hypotheses and Research Questions........................................ 22Limitations and Scope of Study................................................ 23
CHAPTER 2The Literature Review....................................................................... 27
Societal Changes..................................................................... 27Educational Response............................................................. 31
Curriculum and Standards............................................. 35Teaching Strategies....................................................... 43Teachers' Experiences and Recommendations.............. 45
Immigration and the Migrant Student..................................... 46California Portable Assisted Study Sequence
(P.A.S.S.) Program............................................. 57The Methodology of Content Analysis................................... 59
Content Analyses of Curriculum.................................. 66Summary.................................................................................. 70
iii
Reproduced with permission of the copyright owner. Further reproduction prohibited without permission.

CHAPTER 3Methodology..................................................................................... 72
Design of the Study................................................................ 74Procedures.............................................................................. 75
Population.................................................................... 78Instrumentation............................................................. 78
Content Validity................................................. 80Interrater Reliability........................................... 83
Data Collection Methodology...................................... 86Data Computerization Process..................................... 88Data Analysis............................................................... 94
CHAPTER 4Findings............................................................................................. 104
Hypothesized Findings............................................................ 106Null Hypothesis 1......................................................... 106Null Hypothesis 2......................................................... 109
Unhypothesized Findings........................................................ 110Research Question 1..................................................... 110Research Question 2..................................................... 138
Other Findings......................................................................... 141
CHAPTER 5Summary, Conclusions, Significance, and Recommendations 145
Summary................................................................................ 146Conclusions from Hypothesized Findings............................... 148Conclusions from Findings of Research Questions................. 150Significant Findings................................................................ 155Impact on Society.................................................................. 155Future Research Recommendations........................................ 160
REFERENCES.................................................................................. 162
iv
Reproduced with permission of the copyright owner. Further reproduction prohibited without permission.

APPENDIXES 174
Appendix A. Mathematics Materials Analysis Instrument IMMATL 174
Appendix B. Instructions for Using Mathematics Materials AnalysisInstrument (MMAD......................................................... 192
Appendix C. General Coding Rubric for Mathematics MaterialsAnalysis Instrument (MMAD...................................... 193
Appendix D. Scope and Summary of National Council of Teachersof Mathematics (NCTM) Standards........................... 194
Appendix E. Worksheet for Coding MMAI.................................... 200
Appendix F. Letter to Validation Panel Dated January 7,1996...... 208
Appendix G. Letters to Validation Panel Dated March 31,1996..... 209
Appendix H. Data Collection Worksheets....................................... 211
Appendix I. Nud*Ist Node Listing Report for Mathematics MaterialsAnalysis Instrument (MMAD..................................... 215
Appendix J. Letter from Rudy Miranda, EdD................................ 219
Appendix K. Examples of Word Problems from 1989 and 1995P.A.S.S. Curricula....................................................... 220
Appendix L. Examples of Projects and Investigations from1989 and 1995 P.A.S.S. Curricula.............................. 222
Appendix M. Tables of Contents - 1989 P.A.S.S. Curriculum 224
v
Reproduced with permission of the copyright owner. Further reproduction prohibited without permission.

Appendix N. Tables of Contents - 1995 P.A.S.S. Curriculum 235
Appendix O. Rationale, Primary Idea, and Instructional Goals
for 1989 P.A.S.S. Curriculum.................................... 238
Appendix P. General Directions and Requirementsfor 1989 P.A.S.S. Curriculum.................................... 248
Appendix Q. Introduction, Guidelines and Directions for 1995P.A.S.S. Curriculum.................................................. 249
Appendix R. Examples of Problems Using Technology for1995 P.A.S.S. Curriculum......................................... 254
Appendix S. Assignment of Ordinal Values to P.A.S.S. Curriculaby Coder 3 (Nud*Ist) Using the Mathematics Materials Analysis Instrument (MMAD.................... 266
Appendix T. Unique Activities -1989 P.A.S.S. Curriculum 278
Appendix U. Unique Activities - 1995 P.A.S.S. Curriculum 287
VITA................................................................................................... 309
vi
Reproduced with permission of the copyright owner. Further reproduction prohibited without permission.

LIST OF FIGURES
Figure Page
1 Distributions of Coded Values for Grades 5-8 ofP.A.S.S. Curricula............................................................... 124
2 Distributions of Coded Values for Grades 9-12 ofP.A.S.S. Curricula............................................................... 124
3 Comparisons of Types of Problems in P.A.S.S. Curricula... 127
4 Comparisons of Combined Types of Problems from
Figure 3 in P.A.S.S. Curricula............................................ 127
5 Comparisons of Major Sections of P. A.S.S. Curricula 129
vii
Reproduced with permission of the copyright owner. Further reproduction prohibited without permission.

LIST OF TABLES
Table Page
1 Assignment of Ordinal Values to the P.A.S.S. Curriculum by Coder 3 (Nud*Ist) Using the Mathematics Materials Analysis Instrument fMMAD.................................................. 97
2 Chi-square Analysis of Observed and Expected Coding Values Using Mathematics Materials Analysis Instrument (MMAD on P.A.S.S. Curricula.......................................... 108
3 Kruskal-Wallis H-test to Establish Interrater ReliabilityBetween Coders Using the Mathematics Materials Analysis Instrument fMMAD on 1989 Curriculum............. 112
4 Kruskal-Wallis H-test to Establish Interrater Reliability Between Coders Using the Mathematics Materials Analysis Instrument (MMAD on 1995 Curriculum.............. 114
5 Unit Titles of P.A.S.S. Curricula.......................................... 117
6 Measures of Dispersion for Coding Values on MMAIfor 1989 P.A.S.S. Curriculum............................................. 121
7 Measures of Dispersion for Coding Values on MMAIfor 1995 P.AS.S. Curriculum.............................................. 122
8 Frequency Counts and Percentages of Types of ProblemsforP.A.S.S. Curricula......................................................... 126
9 Number of Pages and Percentages of Major Sections inP.A.S.S. Curricula................................................................ 129
Reproduced with permission of the copyright owner. Further reproduction prohibited without permission.

Table Page
10 Number of Words and Percentages Relating to MajorCategories in P.A.S.S. Curricula........................................ 131
11 Number of Words and Percentages Relating to Ethnic andGender Categories in P.A.S.S. Curricula............................ 136
12 Kruskal-Wallis H-test to Establish Interrater ReliabilityBetween Coders in Pilot Study Using the Mathematics Materials Analysis Instrument fMMAD............................. 143
ix
Reproduced with permission of the copyright owner. Further reproduction prohibited without permission.

CHAPTER 1
Introduction
Up in the mountains, he knew, the ants changed with the season. Bees
hovered and darted in a dynamical buzz. Clouds skidded across the
sky. He could not work the old way any more.
-J. Gleick (1987, p. 317)
The need for change in the mathematics curricula in our public schools
is well documented (Kirwan, 1990; National Commission on Excellence in
Education, 1983; National Research Council, 1989; Overby, 1993). The
National Research Council's Committee for the Mathematical Sciences in the
year 2000 released a final report in January 1991. The chairman of the
committee, William Kirwan, reported that "too few people are learning
mathematics at all levels of our educational system" (Kirwan, 1990, p. 23).
Our attrition rate in mathematics from ninth grade on is about 50%. We fail
to keep women and minorities in mathematics, and "mathematics has one of
the poorest attrition rates of all the sciences for women from the bachelor's to
the Ph.D" (p. 24). Children of migrant workers are reflected in these dismal
statistics. Overby (1993) reports dropout rates for migrant students of 43%
Reproduced with permission of the copyright owner. Further reproduction prohibited without permission.
2
as compared to Mexican-Americans of 35.8%. Many of the reasons for these
failures point to deficiencies in mathematics training at the K-12 level.
Testing surveys show low overall performance at every age throughout the
K-12 levels. Even "the most able U.S. students—the top 1% in ability-scored
the lowest in algebra and among the lowest in calculus" (Kirwan, 1990,
p. 25) when compared to high school seniors from 13 countries. The
Curriculum and Evaluation Standards for School Mathematics (the Standards)
issued by the National Council of Teachers of Mathematics (NCTM) in 1989
are designed to move mathematics curriculum forward to meet the needs of
students for the future. The NCTM News Bulletin (1995) cites a study by the
Council of Chief State School Officers that indicates "that a majority of states
are now involved in developing, revising, and implementing state frameworks
in mathematics . . . [and]. . . that many mathematics frameworks agree with
the thrust of the Standards" (p. 1).
The analysis of new curricular materials is essential in order to produce
materials that meet recommended standards. Assessing the curriculum in
relationship to the Standards is not an easy task. The Standards states this
explicitly:
Reproduced with permission of the copyright owner. Further reproduction prohibited without permission.
3
A deep, thorough analysis is necessary to determine the extent to which a curriculum and its materials are compatible with the Standards. The Standards offer a framework for curriculum development but not a scope and sequence. Simply checking topics on a scope-and-sequence chart is insufficient to determine the extent to which a curriculum and its materials are compatible with the Standards. A comparative analysis must provide qualitative documentation of the degree of consistency between the Standards and the curriculum. Such results can then be used to make decisions about the adoption of materials and how the curriculum needs to be modified to be more consistent with the Standards, (pp. 241 - 242)
The migrant student population in California is served through the
Portable Assisted Study Sequence (P.A.S.S.) Program. The students
frequently relocate to other school districts in California and in other states
throughout the school year. This creates a problem when transferring
academic credits because generic descriptions such as "algebra" or
"geometry" do not readily define the content in the student's mathematics
experience. The P.A.S.S. Program meets the needs of migrant students by
providing courses designed in units. Students carry the portable units with
them to other school sites to continue the course of study. Each mathematics
course is divided into 10 units, and each unit is self-contained with content
clearly defined. A multiple-choice test is given upon completion of the unit
and students must exhibit mastery at 70% before they can continue to the
Reproduced with permission of the copyright owner. Further reproduction prohibited without permission.
next unit. This process enables teachers and counselors to more easily
determine credits for transferring students.
This study analyzed the content of a lst-year mathematics course
written for P.A.S.S. and compared it to the course it replaced with respect to
the NCTM Standards. A major contribution of this process included the
design of an evaluative instrument meeting the Standards that can be used for
both development and assessment of further mathematical curriculum. The
instrument was used in this study to analyze the P.A.S.S. curricular materials
in relationship to NCTM Standards.
Statement of the Problem
Educating the migrant student population is one of the greatest
challenges that the California educational system and the United States
educational systems face today. Students from this population frequently
relocate to other schools and to other states. The Portable Assisted Study
Sequence (P.A.S.S.) Program serves 165 schools in California and was
created to help assuage some of the difficulties that these students encounter.
The PA.S.S. Program must not only provide materials that will be
appropriate for the migrant student, but must also comply with the National
Reproduced with permission of the copyright owner. Further reproduction prohibited without permission.

Council of Teachers of Mathematics Standards for School Mathematics
(NCTM Standards or Standards!. Until now, no study has been conducted
that has analyzed the P.A.S.S. mathematics curricular materials in relationship
to the Standards. Furthermore, an evaluative instrument designed to measure
the extent to which reform ideas in the Standards are represented in the
curricular materials has been sorely needed, and to date, has not existed.
Background of the Problem
Everyone depends on the success of mathematics education,
everyone is hurt when it fails.
- National Research Council (1989, p. 7)
This study focuses on the content analysis of the mathematics
curricular materials designed for the migrant student in relationship to
National Council of Teachers of Mathematics (NCTM) reform Standards
ideals. The development of curriculum aligned to reform standards is a
complex process. Furthermore, developing curriculum for the migrant student
requires an understanding of the issues surrounding that segment of the school
population.
Reproduced with permission of the copyright owner. Further reproduction prohibited without permission.

Curriculum and Reform Standards
Curriculum is "a plan, a set of directions whose chief purpose is to
guide the work of the schools. That work is called teaching or instruction"
(English, 1987, p. 9). Curriculum has a variety of forms such as textbooks,
study guides, district, state, and board regulations and policies, and any
supplementary materials which are used to make decisions pertaining to
content or subject matter. The National Council of Teachers of Mathematics
defines curriculum as
an operational plan for instruction that details what mathematics students need to know, how students are to achieve the identified curricular goals, what teachers are to do to help students develop their mathematical knowledge, and the context in which learning and teaching occur. (Standards. 1989, p. 1)
The Commission on Standards for School Mathematics was established
in 1986 by the Board of Directors of NCTM. This was in response to a need
to improve school mathematics expressed in publications such as A Nation at
Risk (National Commission on Excellence in Education, 1983). Many of the
reform ideas in the Standards are supported by data found in publications
such as Everybody Counts (National Research Council, 1989). One of the
major recommendations made in this report involved the inclusion of all
permission of the copyright owner. Further reproduction prohibited without permission.

students in a core of broadly useful mathematics. Furthermore, "all students
should study mathematics every year they are in school" (p. 50). The NCTM
Standards were published in 1989 as a response to this need for mathematics
reform.
A standard is a "statement about what is valued" (National Council of
Teachers of Mathematics, 1989, p. 2) and ensures quality, indicates goals,
and promotes change. The Standards assert that the educational system must
meet new social goals. These are defined as providing for society
mathematically literate workers, lifelong learning, opportunity for all, and an
informed electorate. Students must learn to value mathematics, become
confident in their mathematical abilities, become mathematical problem
solvers, learn to communicate mathematically, and leam to reason
mathematically (p. 5).
The Standards emphasize the need to "do" rather than "know" (1989,
p. 7). Interdisciplinary curriculum must be included to supplement and
replace portions of traditional engineering and physical science applications.
Technology must be included and updated to reflect the nature of
mathematics. The curriculum must be available to all students if "they are to
Reproduced with permission of the copyright owner. Further reproduction prohibited without permission.
be productive citizens in the twenty-first century” (p. 9). Students must
participate in activities that model genuine problems, and be encouraged to
experiment, discuss, and discover ideas and concepts.
An important component in meeting Standards recommendations is
determining the extent to which curriculum is aligned to the reform ideas.
Assistance is given in A Guide for Reviewing School Mathematics Programs
(NCTM, 1991). This publication provides guides for the K-12 mathematics
program to "determine the level of implementation that currently exists.. . .
Users should feel free to modify these outlines or develop new ones" (p. 1).
The general guides for two curricular areas, Grades 5-8, and Grades 9-12,
which were considered to be "the most useful for systematically analyzing
textbooks or other materials that are being considered for adoption" (p. 3),
were followed for this study. These guidelines were used in the design of an
evaluative instrument meeting the Standards that can also be used in
curriculum development.
Reproduced with permission of the copyright owner. Further reproduction prohibited without permission.

9
The Migrant Student
The ethnic population of our public schools is rapidly changing. It is
estimated that by the year 2010 more than one half of our children "under 18
years of age will be minorities: Hawaii (80%), New Mexico (77%),
California (57%), Texas (57%), District of Columbia (93%)" (Klauke, 1989,
p. 1). Projections to 2020 indicate an Hispanic population o f over 47 million
in the U.S., representing 15% of the total population (Bedard, Eschholz, &
Gertz, 1994, p. 72). The U.S. Census Bureau reported nearly 13,000,000
Mexican-Americans living in the United States in 1989. Headden (1995)
reports nearly three million students in the American educational system are
designated as limited English proficient (LEP), and 45% of these students live
in California. Most of the LEP students in California are Latino (p. 45), and
many of these students are children of migratory workers.
The migrant student is a child defined by family mobility and type of
labor. Migratory workers move from one state to another for the purpose of
finding temporary or seasonal employment (U. S. Department of Education,
1985). Most are agricultural workers or migratory fishermen who move from
one district to another during the regular school year (Cahape, 1993;
Reproduced with permission of the copyright owner. Further reproduction prohibited without permission.
10
California Department of Education, Handbook, 1992). Cahape (1993)
reports there are over half a million migrant children enrolled in public
education in the 50 states, the District of Columbia, and Puerto Rico. Trotter
(1992) argues that many migrant children are unidentified and claims
"estimates of all those engaged in migrant labor range between 1.7 million
and 6 million" (p. 16). The Migrant Education Program was authorized in
1965 through the Elementary and Secondary Education Act. Federal program
regulations require state Departments of Education to identify and educate
migratory children. The California Department of Education assumes
responsibility for all statutory and regulatory requirements of the program
including subgrantees. Funding is based on a "Full-time Equivalent (F I E)
count of each individual child for each day of residence in the State. This
count is based upon the entry of data into the Migrant Student Record
Transfer System (MSRTS) for each State for each year" (California
Department of Education, Handbook, 1992, p. 1-2). The California Portable
Assisted Study Sequence (P.A.S.S.) program is based in part on a newer
Federal Law, P. L. 100-297, which was passed in 1988, and California
Assembly Bill No. 1382, which was passed in 1981. This program serves the
Reproduced with permission of the copyright owner. Further reproduction prohibited without permission.

migrant students in California and provides services throughout the U.S. to
other migrant programs.
California Portable Assisted Study Sequence fP.A.S.S.') Program
The California Portable Assisted Study Sequence (P.A.S.S.) program
serves migrant students throughout California. The P.A.S.S. Program's goals
are described in the P.A.S.S. Handbook:
Provide portable learning packages adapted for migrant students, enabling them to proceed at their own pace, provide competency-based credits for skills, interests, and educationally related-life experiences, supplement the regular instruction for targeted migrant students at secondary-level schools in California, and utilize existing counseling and tutorial support through regular migrant education personnel, and the California Mini-Corps to accomplish the goals of the P. A.S.S. Program, (p. 1)
The P.A.S.S. Program allows migrant students to accumulate credits
that are transferable within the state and to many other states. The list of
states include Arkansas, Arizona, California, Colorado, Florida, Georgia,
Idaho, Illinois, Indiana, Kansas, Michigan, Montana, Nevada, New York,
North Dakota, Oregon, Texas, Utah, Washington, and Wisconsin. Ten units
provide credits for two semesters. The portable units can be continued at
new school sites throughout California "thanks to the coordination of services
Reproduced with permission of the copyright owner. Further reproduction prohibited without permission.
among the migrant staff at the school sites" (p. 2). The California P.A.S.S.
Program is accredited through Fresno Unified School District, and the
Western Association of Schools and Colleges.
Study Background
The investigator is a mathematics teacher at a secondary school in a
small community of approximately 10,000 residents in California. The
school's student population of approximately 1,100 is comprised largely of
rural students with two thirds from Latino ethnic backgrounds, many of whom
are migrant students from Mexico.
The P.A.S.S. Program offers four sequential 1-year mathematics
courses to secondary migrant students. The 1989 general mathematics course
General Math A and General Math B was the first course in the sequence
until it was replaced with the 1995 P.A.S.S. integrated mathematics course
Integrated Math A and Integrated Math B. The 1995 course was written to
update the 1989 curriculum by emphasizing interdisciplinary connections and
higher-order thinking skills in alignment with the California Framework
Reproduced with permission of the copyright owner. Further reproduction prohibited without permission.

13
(California Department of Education, 1992). The NCTM Standards affirm
and enhance the goals of the California Framework.
Purpose of the Study
This study was undertaken because no research has analyzed the
Portable Assisted Study Sequence (P.A.S.S.) mathematics curricular materials
in relationship to the NCTM Standards. Furthermore, an evaluative
instrument designed to measure the extent to which reform ideas in the
Standards are represented in the curricular materials did not exist. These are
needed because it is becoming increasingly important to evaluate curriculum
with respect to the Standards if we intend to radically change our
mathematics curriculum.
Significance of the Study
This study has value at three levels: local, state, and national. The
P.A.S.S. materials are used locally, throughout the state, and manually carried
by students to many other states as part of the P.A.S.S. program. The
P.A.S.S. Program offers four sequential 1-year mathematics courses to
secondary migrant students. The 1989 general mathematics course is the first
Reproduced with permission of the copyright owner. Further reproduction prohibited without permission.
14
course in the sequence. The 1995 materials are intended to provide content
and experiences in alignment with NCTM Standards to direct and guide
teachers and students. This updated curriculum can be developed further as
sequential courses are written. This will result in a new curriculum designed
around the concepts and transitions inherent in the NCTM Standards.
Analysis of this important first course (1995) is valuable for future course
developers as they make decisions to continue developing the courses to meet
NCTM Standards.
Mathematics teachers throughout the state and nation can benefit from
this study. The flexibility and adaptability of curriculum to meet NCTM
Standards require mathematics teachers to provide and evaluate
supplementary material to determine its applicability to the Standards. The
analysis of content in relationship to the Standards is complex and time-
consuming. This study can help secondary mathematics educators interpret
and select the supplementary materials they produce or provide in their own
mathematics classroom. The instrument itself will provide guidance and
direction in curriculum selection and development.
Reproduced with permission of the copyright owner. Further reproduction prohibited without permission.

The process of content analysis of mathematics curricular materials in
respect to their relationship to the NCTM Standards, and the evaluative
instrument that was developed and used in this study will have value to
further researchers. Content analysis was conducted to determine the best
way to analyze the units. The NCTM Standards are replete with subjective
goals. This study examined previous content analysis studies that have dealt
with subjective text, as well as objective text. An instrument and methods for
reliable and valid content analysis were also investigated and developed.
The culminating research produced an evaluative instrument meeting NCTM
Standards that can be used in curricular materials development, and which
was used in this study.
Finally, this study can help mathematics educators at all levels identify
problems that are encountered by the classroom teacher in the process of
implementing NCTM Standards. The Standards reflect "a vision of
appropriate mathematical goals for all students" (NCTM, 1995, p. 1). It
assumes that all students are capable of learning mathematics, and that
previous curriculum has "underestimated the mathematical capability of
most students and perpetuated costly myths about students' ability and
Reproduced with permission of the copyright owner. Further reproduction prohibited without permission.
16
effort” (p. 1). The Standards were enacted to address this vision, and "many
schools and teachers have responded enthusiastically . . . by changing both
the mathematical content o f their courses and the way in which the content is
taught” (p. 3). This study can serve to simplify and demonstrate some of the
problems faced in the distribution of the Standards' ideals to the mathematics
curriculum.
Nature of the Study
This study utilized the methodology of content analysis to analyze the
content of the 1989 and 1995 Portable Assisted Study Sequence (P.A.S.S.)
mathematics curricular materials in relationship to the goals and spirit of the
National Council of Teachers of Mathematics (NCTM) Curriculum and
Evaluation Standards for School Mathematics (1989). Narrative descriptions
and comparisons, manual data collection and coding, and computer analyses
using Nud*Ist qualitative data analysis software (Richards & Richards, 1995)
have been performed. This combination of analyses has resulted in a concise
and complete analysis of the curricular materials.
Reproduced with permission of the copyright owner. Further reproduction prohibited without permission.

An evaluative instrument to measure the relationship between the
curricular materials and the recommendations made in the NCTM Standards
(1989) was also developed for this study. This process included content
validation using an expert panel consisting of three educators who are familiar
with, and experienced in, the vision of the NCTM Standards. Interrater
reliability was established through a pilot study.
Theoretical Framework
Mathematics curriculum in the period from the 1970s to the 1980s has
been influenced by two types of thought. One is the fixed, static view
described by Dossey (1992) as external conceptions. This view establishes a
body of knowledge that is available in curriculum materials. An extended
version of this view allows adjustment of the curriculum, but still focuses on
student mastery and applications of technology to mathematics instruction.
The second view is one of internal conception (Dossey, 1992; Polya,
1965; Romberg, 1988; Schoenfeld, 1988; Steffe, 1988; von Glasersfeld,
1988). There are three groups of thought in this second view. First,
mathematics is a process and is the result of "experimenting, abstracting,
Reproduced with permission of the copyright owner. Further reproduction prohibited without permission.

generalizing, and specializing,. . . not a transmission of a well-formed
communication1' (Dossey, 1992, p. 45) This is the view of constructivists.
The second group employs psychological models of cognitive procedures and
schemata. The third group views mathematics as knowledge resulting from
social interaction. Context is important and students must "participate
aggressively in analyzing, conjecturing, structuring, and synthesizing
numerical and spatial information in problem settings" (p. 45).
In mathematics education, Stefife and Kieren (1994) identify a
"preconstructivist revolution in research. . . beginning in 1970 and
proceeding on up to 1980" (p. 711). They consider the publication of von
Glasersfeld's work in the early 1980s on radical constructivism as the
beginning of the constructivist revolution that marks the "reform movement
that is currently underway in school mathematics" (p. 711). Radical
constructivism in mathematics education means "although there can be well-
defined tasks or spaces for experience, there are no pregiven prescribed ends
toward which this construction strives" (p. 721). This translates into "no
optimal selection of the individual's actions or ideas by the environment, nor
Reproduced with permission of the copyright owner. Further reproduction prohibited without permission.
19
is some perfect internal representation or match against an external
environment the test of the constructed 'reality'" (pp. 721 - 722).
The constructivist view is a strong component of many of the
recommendations made in the Curriculum and Evaluation Standards for
School Mathematics (NCTM, 1989). NCTM Standards are based upon the
belief that all students should learn more (and different) content than is
contained in traditional programs, and new teaching strategies need to be
introduced. The thinking processes of problem solving, communication,
reasoning, and connections are emphasized at all levels. Bridging the gap
between constructivist theory and teaching practice is a major challenge for
mathematics educators. Teachers must become "facilitators of learning
rather than imparters of information" (NCTM, 1989, p. 41.)
The Commission on Standards for School Mathematics was established
in 1986 by the Board of Directors of NCTM. This was in response to a need
to improve school mathematics expressed in publications such as A Nation at
Risk (National Commission on Excellence in Education, 1983). Many of the
reform ideas in the Standards are supported by data found in publications
such as Everybody Counts (National Research Council, 1989). One of the
Reproduced with permission of the copyright owner. Further reproduction prohibited without permission.

20
major recommendations made in this report involved the inclusion of all
students in a core of broadly useful mathematics. Furthermore, "all students
should study mathematics every year they are in school” (p. 50). The NCTM
Standards were published in 1989 as a response to this need for mathematics
reform. A comparative analysis of the P.A.S.S. courses required the
researcher to thoroughly understand the recommendations made in the NCTM
Standards for grades 5-8 and grades 9-12.
Educating our youth depends upon understanding the complexity of the
changing world. Our universe is experiencing tremendous turmoil and
disruption. Famine, plague, violence, poverty, overpopulation, environmental
pollution, and geological disasters demand our attention at the same time that
changing political systems are bringing new freedom as well as tyranny to
nations of the world. Segments of our society enjoy health, wealth, and
opportunity while other segments of our society experience despair. The
societal forces that impact our students and our world are economic,
psychological, environmental, ecological, biological, political, social, and
moral. They are interrelated, as are the specific events or situations that
result. For example, overpopulation may result in famine, plague, violence,
Reproduced with permission of the copyright owner. Further reproduction prohibited without permission.

21
poverty, and environmental pollution. Geological disasters may cause
poverty, famine, plague, and environmental pollution. Moral attitudes may
encourage overpopulation, disease, and violence. Economic inequities may
produce poverty, poverty may produce violence. Biological discoveries may
affect the environment and the economy. Political upheavals may affect the
economy and the social structure. Psychology may affect ecology, and so on.
Everybody Counts states the mathematical connection to these problems in
this way:
Our students need to know enough about chance to understand health and environmental risks, enough about change and variability to understand investments, enough about data and experiments to understand the grounds for scientific conclusions, enough about representation to interpret graphs, and enough about the nature of mathematics to be supportive parents to their children who will learn aspects of mathematics that their parents never studied. (National Research Council, 1989, p. 49).
Providing curriculum that is aligned to the Standards requires an
understanding that
the Standards offers a vision of, and a direction for, a mathematics curriculum but does not constitute a curriculum in itself. If a mathematics program is to be consistent with the Standards, its goals, objectives, mathematical content, and topic emphases should be
Reproduced with permission of the copyright owner. Further reproduction prohibited without permission.
22
compatible with the Standards' vision and intent. Likewise, the instructional approaches, materials, and activities specified in the curriculum should reflect the Standards' recommendations and be articulated across grade levels. In addition, the assessment methods and instruments should measure the student outcomes specified in the Standards. (NCTM, 1989, p.241)
Hypotheses and Research Questions
This study stated the following hypotheses and asked the following
research questions:
Hypotheses:
1. The 1995 P.A.S.S. curricular materials are more likely than the
1989 P.A.S.S. curricular materials to reflect reform ideas expressed in
the Standards.
2. There is no difference between coding performed by human coders
and coding performed with a computer in relationship to the 1989 and 1995
P.A.S.S. curricula.
Research questions:
1. To what extent do the 1995 P.A.S.S. curricular materials
improve upon the 1989 P.A.S.S. curricular materials with respect to the
Reproduced with permission of the copyright owner. Further reproduction prohibited without permission.
23
Standards of mathematics education delineated by the National Council of
Teachers of Mathematics?
2. Can a researcher-designed evaluative instrument measure the extent
to which curricular materials meet the NCTM Standards ?
Limitations and Scope of Study
This study focused on specific material that is available to migrant
students throughout California. The material that has been analyzed in this
study is the 1995 1-year course in the Portable Assisted Study Sequence
(P.A.S.S.) Program curricular materials entitled Integrated Math A and
Integrated Math B. It was designed to replace the 1989 1-year course
entitled General Math A and General Math B for migrant students in grades
9-12 that was also analyzed.
The content analysis findings cannot be generalized to other courses
because the P.A.S.S. course is unique. The P.A.S.S. Program's goals are
described in the P.A.S.S. Handbook:
Provide portable learning packages adapted for migrant students,
Reproduced with permission of the copyright owner. Further reproduction prohibited without permission.

24
enabling them to proceed at their own pace, provide competency- based credits for skills, interests, and educationally related-life experiences, supplement the regular instruction for targeted migrant students at secondary-level schools in California, and utilize existing counseling and tutorial support through regular migrant education personnel, and the California Mini-Corps to accomplish the goals of the P.A.S.S. Program, (p. 1)
The contact person on-site is responsible for providing instruction,
grading the unit, and administering the unit tests. However, the tests are
scored by the P.A.S.S. office. Two thirds of the final semester grade is based
on the average of unit tests, and multiple choice tests must be used for the
convenience of the scorers. Other assessment methods can be used within
the unit as one third of the semester grade is based on the student's
performance in the unit books. The semester grade, based upon completion
of five unit books, must be at least 60% to receive credit, and students receive
five academic units per semester.
The P.A.S.S. Program allows migrant students to accumulate credits
that are transferable within the state and to many other states. The list of
states include Arkansas, Arizona, California, Colorado, Florida, Georgia,
Idaho, Illinois, Indiana, Kansas, Michigan, Montana, Nevada, New York,
North Dakota, Oregon, Texas, Utah, Washington, and Wisconsin. Ten units
Reproduced with permission of the copyright owner. Further reproduction prohibited without permission.
25
provide credits for two semesters. The portable units can be continued at
new school sites throughout California "thanks to the coordination of services
among the migrant staff at the school sites" (p. 2). The California P.A.S.S.
Program is accredited through Fresno Unified School District, and the
Western Association of Schools and Colleges.
The agreement with P.A.S.S. for the 1995 course entitled Integrated
Math A and Integrated Math B was to provide materials aimed mainly at
Latino students because they comprise the majority (99%) of the migrant
population served by P.A.S.S. The course is therefore designed primarily for
Latino migrant students in Grades 9-12, many of whom are academically
below grade level 9. This study therefore developed and utilized an
evaluative instrument geared to grade levels 5-8 and grade levels 9-12 to
cover the scope of content in the 1989 and 1995 curricular materials.
Specific instructions from P.A.S.S. for the 1995 curriculum also included
instructions to use Latino surnames and problems that are relevant to Latino
life experiences and ambitions. Content analysis of this material was
therefore also performed from a multicultural perspective. This emphasis on
the Latino migrant population and the broad range of academic grade levels
Reproduced with permission of the copyright owner. Further reproduction prohibited without permission.

26
represented in the curriculum also restrict the applicability of this study.
Content analysis methodology for this study required extensive coding
and interpretation by the researcher. However, the researcher's in-depth
knowledge of the material can be viewed as valuable to coding the materials,
and ultimately the integrity of any researcher must also be considered.
Reproduced with permission of the copyright owner. Further reproduction prohibited without permission.
CHAPTER 2The Literature Review
The mathematician does not study mathematics because it is useful, he
studies it because he delights in it and he delights in it because it is
beautiful.
- Henri Poincar'e
Educational needs are determined by the society in which we live. We
will first examine the changes in western society and the respective needs in
mathematics education from an historical perspective. The professional
response from the educational community and the specific issues surrounding
migrant students will then be addressed. Finally, the methodology of content
analysis will be discussed, and the studies which relate to content analysis of
new curricula will be reviewed.
Societal Changes
To appreciate the changes that are needed in our mathematics
curriculum requires an historical perspective of the changes in our society.
Our western society has developed in three distinct stages or eras of change
called waves (Toffler, 1980). Toffler describes the first era from 8000 B.C.
Reproduced with permission of the copyright owner. Further reproduction prohibited without permission.
28
to A.D. 1650-1750 as the first wave of change. The population could easily
be divided into two categories: primitive and civilized. The primitive
population lived in small tribes. The civilized population fanned and
produced their own goods and food. Villages were organized, labor was
divided, and religious and governmental authority was established. Scientists
and mathematicians such as Galileo Galilei, Johannes Kepler, and Rene
Descartes lived in this time, but their contributions were not greatly
appreciated until the second wave.
The second wave has lasted 300 years and has become known as the
Industrial Revolution and the Age of Enlightenment (Toffler, 1980, Etzioni,
1968). A mechanistic viewpoint emerged as scientific discoveries and
theories became known. The Age of Scientific Revolution began in the 16th
century with "Nicolas Copernicus, who overthrew the geocentric view of
Ptolemy and the Bible that had been accepted dogma for more than a
thousand years" (Capra, 1982, p. 54). Descartes, a brilliant mathematician
who is regarded as the founder of modem philosophy, "did not accept any
traditional knowledge, but set out to build a whole new system of thought"
(p. 56). The scientific method of deduction was bom, and mathematics was
Reproduced with permission of the copyright owner. Further reproduction prohibited without permission.

29
an integral part of it. Mind was separate from matter, and the universe was a
machine that man could leam to manipulate and control. Scientific theory
became reductionist theory in the biological sciences allowing life organisms
to be studied as mechanisms. Isaac Newton completed the vision. "Newton
developed a complete mathematical formulation of the mechanistic view of
nature, and thus accomplished a grand synthesis of the works of Copernicus
and Kepler, Bacon, Galileo, and Descartes" (Capra, 1982, p. 63). His
methodology combined the inductive, empirical method with the deductive,
rational method, and is the method of scientific inquiry today.
Mechanistic elements are evident in the second wave civilization. A
"half-dozen principles-standardization, specialization, synchronization,
concentration, maximization, and centralization-were applied in both the
capitalistic and socialist wings of industrial society" (Toffler, 1980, p. 76).
Class structure becomes important in maintaining these relationships. A
property class inherits rights of ownership, an acquisition class acquires their
property and rights of ownership, and the social class determines the
individual's rights, lifestyle, prestige, and power within the society. (Parsons,
1947). The second wave is evident in our western society, but it is becoming
Reproduced with permission of the copyright owner. Further reproduction prohibited without permission.
30
engulfed by the third wave.
Toffler (1980) describes the third wave as interrelated spheres:
technosphere, biosphere, infosphere, sociosphere, and psychosphere. He sees
the need for decentralized reorganization to meet the needs of the changing
world. Third wavers are "a combination of consumers, environmentalists,
scientists, and entrepreneurs in the leading-edge industries, along with their
various allies" (p. 153). They are proficient at technology, which is
distinguished as "new industries—computers and data processing, aerospace,
sophisticated petrochemicals, semiconductors, advanced communications,
and scores of others" (p. 155). This technology has already given us fiber
optics, antinoise technology, neural networks, antisense technology and
recombinant DNA technology; we are familiar with terms such as virtual
reality and artificial intelligence (Simon, 1995). In the public arena, the
newest computer program for personal computers was introduced with a
1-year advertising budget of 1 billion dollars: Windows 95 sells for $89 and
"has moved stock markets worldwide. . . and has attracted the attention of
Washington antitrust officials" (Murphy, 1995, p. D l). It is obvious that
technology has impacted every area of our fives, and that second wave skills
Reproduced with permission of the copyright owner. Further reproduction prohibited without permission.

and knowledge are rapidly becoming extinct.
31
Educational Response
Educational practices can be seen to respond to these changes. In the
first wave, formal education was reserved for the privileged few who
assumed the powers of authority. Kilpatrick (1992) describes mathematics in
the curriculum of liberal arts, and as providing the foundation for mechanics
and the ensuing revolutions in science and technology. Textbooks included
Socratic dialogue to deal with matters of proof, definition, and understanding.
Students were given opportunities to discover rules by induction.
The second wave provided impetus for mathematical study and public
education. The Industrial Revolution required skilled workers and
mechanistic responses. The Age of Enlightenment inspired a desire for
higher levels of education for the public. Mathematics did not develop as a
field of study until the end of the 19th century in "response to the need for
more and better prepared teachers" (Kilpatrick, 1992, p. 5). Teaching
methodology began to emerge with concrete experience and educational aims
influencing the teaching of mathematics in the U.S. throughout the entire
public school system.
Reproduced with permission of the copyright owner. Further reproduction prohibited without permission.

32
The establishment of standards became important. Kilpatrick (1992)
discusses the use of testing to establish standards, which began in earnest in
the U.S. with the published doctoral dissertation in 1908 of Cliff W. Stone. It
provided data concerning the measured achievement of 3,000 sixth graders in
26 school systems. Stone recommended standards of achievement to make
courses of study more uniform and to reduce the variability in average test
scores.
Controversies arose over topics in elementary curricula. Another
doctoral thesis published in 1919 described by Kilpatrick (1992) refers to the
unnecessary inclusion of traditional processes in arithmetic at elementary
grade level. This study analyzed the everyday use of arithmetic and found
real-life problems to be concrete and business-oriented. This reductionist
movement caused many reactions. Kilpatrick (1992) discusses the social
value of arithmetic and the "informational, sociological, and psychological
functions of arithmetic" (p. 18). Readiness theory came into being in the
1930s and 1940s with one researcher even claiming to have found the
"minimum mental age at which each of the topics should be taught" (p. 19).
Extreme proponents of readiness theory advocated the elimination of formal
Reproduced with permission of the copyright owner. Further reproduction prohibited without permission.

33
instruction in mathematics altogether, thereby allowing the child the freedom
to discover mathematics by experience (p. 19).
Secondary education felt the effects of these controversies. Unified
courses, also called integrated courses, were developed and tested from 1903
to 1923 by the University of Chicago; the resulting findings favored unified
courses, but evidence was rather weak (Kilpatrick, 1992, p. 21). All students
were required to study mathematics in secondary school in the 1920s and
1930s (Kilpatrick, 1992). This was seriously challenged and the National
Council of Teachers of Mathematics (NCTM) was formed as a result of the
crisis. Research was also undertaken at this time on such questions as ability
grouping, and unified mathematics versus traditional separated courses.
Many of the findings were published in NCTM yearbooks and journals.
Mathematics education was influenced primarily by psychological
theory in the period from the 1930s to the 1960s. The ideas of Piaget,
Bruner, humanistic psychology, Marxist psychology, and contemporary
behaviorism flourished (Kilpatrick, 1992, p. 24). Mathematicians reentered
the educational field in the 1960s in response to declining enrollments in
university mathematics courses. The mathematics curricula had changed in
Reproduced with permission of the copyright owner. Further reproduction prohibited without permission.

34
the lower schools and students were unmotivated and unprepared for the
traditional university curriculum.
Mathematics curricula in the period from the 1970s to the 1980s has
been influenced by two types of thought. One is the fixed, static view
described by Dossey (1992) as external conceptions. This view establishes a
body of knowledge that is available in curriculum materials. An extended
version of this view allows adjustment of the curriculum, but still focuses on
student mastery and applications of technology to mathematics instruction.
The second view is one of internal conception (Dossey, 1992; Polya, 1965;
Romberg, 1988; Schoenfeld, 1988; Steffe, 1988; von Glasersfeld, 1988).
There are three groups of thought in this second view. First, mathematics is a
process and is the result of "experimenting, abstracting, generalizing, and
specializing,. . . not a transmission of a well-formed communication"
(Dossey, 1992, p. 45) This is the view of constructivists and is a strong
component of many of the recommendations made in the Curriculum and
Evaluation Standards for School Mathematics (NCTM, 1989). The second
group employs psychological models of cognitive procedures and schemata.
The third group views mathematics as knowledge resulting from social
Reproduced with permission of the copyright owner. Further reproduction prohibited without permission.
35
interaction. Context is important and students must "participate aggressively
in analyzing, conjecturing, structuring, and synthesizing numerical and spatial
information in problem settings" (Dossey, 1992, p. 45).
The National Council of Teachers of Mathematics (NCTM) has played
a major role in curriculum reform since it was founded. It began publishing
summaries and analyses of research as well as analyses of math textbooks. In
1950, NCTM became affiliated with the National Education Association
(NEA). The Journal for Research in Mathematics Education was published in
January 1970, and provided reports of research aimed at mathematics
teachers (Kilpatrick, 1992, p. 26).
Curriculum and Standards
The third wave creates the demand that environmental, biological,
sociological, and technological issues be confronted (Shane, 1990). Many
educators believe integrated curriculum design is the only way to meet the
challenge of holistic learning.
An integrative curriculum is one which gives both knowledge of past systems and the desire and power to create new ones.. . . Students who experience opportunities to construct their own integrating structures must also possess the knowledge of structures common to
Reproduced with permission of the copyright owner. Further reproduction prohibited without permission.
36
their culture, so that they may take advantage of the collective wisdom of past generations. The common structures provide the tools to converse with others about the world they share, while their own new structures provide avenues for new ideas. (Harter & Gehrke, 1989, p. 13)
English defines curriculum as "a plan, a set of directions whose chief
purpose is to guide the work of the schools. That work is called teaching or
instruction" (English, 1987, p. 9). It has a variety of forms such as textbooks,
study guides, district, state, and board regulations and policies, and any
supplementary material that is used to make decisions pertaining to content or
subject matter. English believes there are three types of curriculum: written,
taught, and tested. They are interactive and work together in a tight
relationship if they have a definite purpose.
Glatthom (1987) proposes there are at least six types of curriculum:
recommended, written, taught, supported, tested, and learned. The
recommended curriculum is ideal and is recommended through state
frameworks and national guidelines. The written curriculum is found in the
district's scope and charts, site and board policies and goals, study booklets,
and any "attempts to translate district policies and goals into documents that
will enable teachers to implement those policies and meet those goals"
Reproduced with permission of the copyright owner. Further reproduction prohibited without permission.
37
(Glatthom, 1987, p. 3). The taught curriculum is what is occurring in the
classroom. The supported curriculum is the staff, time, texts, space, training,
and other essential resources that support the curriculum. The tested
curriculum measures performance.
The learned curriculum is what the students actually learn. Pratt
(1994) sees the curriculum as overt and hidden. The overt curriculum is "the
blueprint for teaching and learning that is publicly planned and adopted"
(Pratt, 1994, p. 29). The hidden curriculum "refers to conscious or
unconscious intentions reflected in the structure of schools and classrooms
and the actions of those who inhabit them" (p. 29). Curriculum development
concerns itself mainly with the overt curriculum, but elements of the hidden
curriculum should be considered.
Glatthom (1987) believes a sound program of studies is goal oriented,
balanced between knowledge and skills versus special interests, and is
integrated and interdisciplinary. Interdisciplinary studies require an
improvement in critical thinking across the curriculum. Glatthom asserts
"you may safely experiment with integrated courses as long as you keep your
eyes on the basic skills" (p. 50). He also believes "interdisciplinary courses
Reproduced with permission of the copyright owner. Further reproduction prohibited without permission.

38
are as effective as separate-subject courses in teaching basic skills" (p. 50).
Forman and Steen (1995) discuss the need to prepare all students for
the world of work. "Math at work is concrete. It is spreadsheets and
perspective drawings, error analysis and combinatorics" (p. 6). It is
estimating, exploring, classifying, optimizing, representation of relationships,
process modeling, and anticipation of consequences. "Most people now
recognize that doing mathematics (reasoning logically, solving problems) is
more important that just knowing it (remembering formulas, memorizing
algorithms)" (p. 7).
The Curriculum and Evaluation Standards for School Mathematics
(NCTM, 1989) addresses the needs of the third wave. The Standards reflect
the reform needed in mathematics. They define curriculum as the "intended
curriculum" or the "plan for a curriculum."
A curriculum is an operational plan for instruction that details what mathematics students need to know, how students are to achieve the identified curricular goals, what teachers are to do to help students develop their mathematical knowledge, and the context in which learning and teaching occur. (National Council of Teachers of Mathematics, 1989, p. 1)
A standard is a "statement about what is valued" (p. 2) and ensures
quality, indicates goals, and promotes change. The Standards assert that the
Reproduced with permission of the copyright owner. Further reproduction prohibited without permission.

educational system must meet new social goals. These are defined as
providing for society mathematically literate workers, lifelong learning,
opportunity for all, and an informed electorate. Students must learn to value
mathematics, become confident in their mathematical abilities, become
mathematical problem solvers, learn to communicate mathematically, and
learn to reason mathematically (p. 5).
The Standards emphasize the need to "do" rather than "know" (1989,
p. 7). Interdisciplinary curricula must be included to supplement and replace
portions of traditional engineering and physical science applications.
Technology must be included and updated to reflect the nature of
mathematics. The curriculum must be available to all students if "they are to
be productive citizens in the twenty-first century" (p. 9). Students must
participate in activities that model genuine problems, and be encouraged to
experiment, discuss, and discover ideas and concepts.
The NCTM Standards (1989) are based upon the belief that all
students should leam more (and different) content than is contained in
traditional programs, and new teaching strategies need to be introduced.
"Cultural background and language must not be a barrier to full participation
Reproduced with permission of the copyright owner. Further reproduction prohibited without permission.

in the mathematics programs" (NCTM, 1995-1996, p. 20). The thinking
processes of problem solving, communication, reasoning, and connections are
emphasized at all levels . Content standards are separated into elementary,
middle, and high school grades with specific topics and subtopics that should
be addressed. Content in the elementary grades consists of estimation,
number sense and numeration, whole number operations and computation,
geometry and spatial sense, measurement, statistics and probability, fractions
and decimals, and patterns and relationships. Content in the middle school
grades consists of number and number relationships, number systems and
number theory, computation and estimation, patterns and functions, algebra,
statistics, probability, geometry, and measurement. Content in the high
school grades consists of mathematical connections, algebra, functions,
geometry from a synthetic perspective, geometry from an algebraic
perspective, trigonometry, statistics, probability, discrete mathematics,
conceptual underpinnings of calculus, and mathematical structure.
Mathematics curriculum within the classroom is defined largely by the
textbook used for instruction (Flanders, 1994; Chandler & Brosnan, 1995).
Dossey (1992) lists four textbook models: mechanistic, structuralist,
empiricist, and the realistic or applied. The texts are used in three ways:
Reproduced with permission of the copyright owner. Further reproduction prohibited without permission.

41
instrumental, subjective, or fundamental. Instrumental use is linear and rule-
oriented; teachers follow the table of contents and the teacher guidelines.
Subjective use is flexible; teachers use the text as a guide but employ their
own experiences and constructive overview. Fundamental use is the
development of curriculum from a constructivist viewpoint; teachers and
students develop the curriculum as they learn together. In many classrooms,
the prevailing model is mechanistic-instrumental. Modem reform documents
such as the Standards advocate the use of a realistic-fundamental model
(Dossey, 1992, p. 43).
The adequacy of the textbook is integral to the implementation of the
Standards. A study of mathematics textbooks for grades 1-8 published after
the Standards were implemented in 1989 found publishers have moved
towards the Standards by adding "more material rather than making decisions
of what to omit" (Chandler & Brosnan, 1994, p. 8). The mismatch of material
was confirmed in a later study by the same researchers. "The content in the
mathematics textbooks studied was disproportionate to the content of the
proficiency test studied" (Chandler & Brosnan, 1995, p. 122) which is based
on NCTM Standards. The researchers conclude that the major changes in
Reproduced with permission of the copyright owner. Further reproduction prohibited without permission.

42
textbooks are "superficial changes such as rewording headings and adding
more pages" (p. 123).
Garet and Mills (1995) emphasize the lack of research "on the effects
that the Standards document has had on practice" (p. 380). An interim survey
was conducted in the Midwest in 1991 and will be completed in 1996.
Department chairs were asked to reflect upon practices in lst-year algebra
between 1986 and 1991, and anticipated practices in 1996. Four areas were
selected: curriculum content, technology, methods, and assessment. "The
evidence indicates that in all four areas, change has occurred, at least in
norms and beliefs, and that more change is anticipated by 1996" (Garet &
Mills, 1995, p. 383). The use of technology reflected the greatest increase.
However, the variation in school responses was substantial. The schools
experienced consistent practices before 1986, but displayed inconsistencies of
practice after 1986. "By 1996, schools in the major urban centers also
anticipate practice more consistent with the Standards document than do the
smaller cities and rural areas" (Garet & Mills, 1995, p. 383).
Webb (1995) discusses the political and marketing strategies used to
provide textbooks, and claims "there is little evidence to suggest that
Reproduced with permission of the copyright owner. Further reproduction prohibited without permission.
43
classroom practice has changed much since the late 1970s" (p. 1).
"The best teachers are not using textbooks very much anymore,” says Harold Howe II, former U.S. Commissioner of Education. "Good teachers help kids to discover the sources of learning and create their own texts in the process." (Webb, 1995, p. 3).
Teaching Strategies
The NCTM Standards (1989) emphasize new teaching strategies are
needed to help students at all levels develop new thinking processes of
problem solving, communication, reasoning, and connections. Teaching
strategies are part of curriculum development and may be experiential or
systematic, or a combination of both:
The experiential approach emphasizes creativity and encourages learners to choose their own curriculum, but does not teach basic skills. The systematic approach teaches basic skills, but does not encourage creativity and learner choice. (Nelson, 1990, p. 17).
Instructional strategies are important to successful adaptation of the
Standards proposed by NCTM. Students must have access to manipulatives,
calculators, computers, and other appropriate tools and techniques.
Interactive, cooperative groupwork is essential, and students must work
independently and collaboratively. Assessment must be varied, practical,
Reproduced with permission of the copyright owner. Further reproduction prohibited without permission.

fair, and meet new standards of quality. Students should be given time to
master material and opportunities to improve the quality of their work.
Projects and investigations should be large-scale, and reflect social issues that
help connect mathematics to society. Students should learn to communicate
their learning and ideas in mathematics through written, oral, and electronic
reports.
Teachers must adapt their styles in the classroom to the new
instructional strategies. Teachers must become "facilitators of learning rather
than imparters of information" (NCTM, 1989, p. 41.) They must be
conscious of their prejudices and overcome them in the classroom. They
must provide equal learning opportunities for all students, and adapt
curriculum to multicultural needs in the classroom. Teachers must become
practicing mathematicians to provide role models for their students and
thereby encourage an interest in mathematics. Teachers must encourage
discussion and freedom for students to make errors, while exercising caution
to fit their own teaching style. They must "produce a classroom climate that
encourages students to take risks and venture incomplete thoughts, knowing
Reproduced with permission of the copyright owner. Further reproduction prohibited without permission.

45
that others will try to understand and will value the individual's thinking"
(NCTM, 1989, p. 53).
Teachers' Experiences and Recommendations
Teachers have been involved in rewriting curricula on a regular basis
since the Standards were published. There are numerous articles that itemize
and categorize recommendations for implementation of the Standards.
Schmalz (1994) proposes an exploration of themes at a leisurely pace. She
divides the year's content into broad categories that contain subcategories
traditionally taught in sequential order. Her recommendation is to integrate
the material and provide richer learning experiences. Wiske and Levinson
(1993) discuss the survey results from 50 teachers who reach consensus on
the need to overcome barriers of incompatible texts and materials,
inaccessible technology, inappropriate assessments, and inadequate
professional knowledge. The motivation for these teachers to overcome the
barriers is "the gratification they receive from seeing engaged, achieving
students" (p. 10).
The successful implementation of NCTM Standards depends on the
Reproduced with permission of the copyright owner. Further reproduction prohibited without permission.

46
classroom teacher. Webb (1995) states there is "little evidence to suggest
that classroom practice has changed much since the late 1970s" (p. 1). Many
textbook publishers are not helping to implement the Standards. Webb cites
observations from the Textbook Letter that claims "not nearly enough
American textbook publishers are prepared to take on real world issues, and
that with every passing year, with each passing textbook production cycle, the
books get farther and farther from reality" (p. 3).
Classroom teachers must find and develop curricula to supplement their
texts. They must also evaluate the degree of success to which they align
their curricula to the Standards.
Immigration and The Migrant Student
The impact of immigrants upon our society is often touted in economic
terms. Their contribution to our economic system is generally divided into
skilled and unskilled labor. "Immigrants constitute the main workforce for
firms that operate by informal labor subcontracting, and/or produce goods and
services directed at the affluent or low-income sectors of the population"
(Ziolniski, 1994, p. 2307). These firms use immigrants as the primary labor
Reproduced with permission of the copyright owner. Further reproduction prohibited without permission.

force for low-wage jobs in industries such as apparel, electronics, or
footwear. In addition, immigrant workers work in unskilled jobs as
subcontractors in janitorial, landscaping, construction, and restaurant
industries. "Many Mexican immigrants have found. . . casual employment as
home and street vending, house cleaning, baby-sitting, day labor, and
recycling" (p. 2308). Many are migratory workers who move from one state
to another for the purpose of finding temporary or seasonal employment
(U. S. Department of Education, 1985). Most migratory workers are
agricultural workers or migratory fishermen who move from one district to
another during the regular school year (Cahape, 1993; California Department
of Education, Handbook, 1992). Their children are deemed "migrant
students" in our school system, and therefore, the migrant student is a child
defined by family mobility and type of labor.
Many of these immigrants are illegal. Immigration arrests have
rocketed from "1.6 million during the 1960s to 8.3 million in the 1970s"
(p.86) and are continuing to rise dramatically. Federal legislation is
constantly in a state of change to alleviate economic pressures on our system
as "newcomers, both legal and illegal, are taking jobs from U.S. citizens and
Reproduced with permission of the copyright owner. Further reproduction prohibited without permission.

48
straining public assistance programs" (Idelson, 1996, p. 698).
California is presently struggling with the issue of illegal immigration
due to the great influx of two to three million illegal residents (Schuck, 1995;
O'Halloran, 1994). Proposition 187, approved by California voters in
November 1994, is an anti-illegal immigrant initiative that has caused much
controversy and alarm throughout the United States and even the world. It
seeks to eliminate educational, medical, and welfare funding for illegal
residents, with many Mexican-Americans supporting the proposition (Schuck,
1995). Support for the proposition is fueled by the illegal immigrant's fierce
allegiance to Mexican nationalism and defiance of Americanization
(assimilation, acculturation, and citizenship) (Aldama, 1995). The California
"voters responded angrily to the vivid television images of Mexican officials
denouncing the measure and to the marchers in Los Angeles waving Mexican
flags and protesting its limits on welfare benefits" (Schuck, 1995, p. 90).
Proposition 187 is being challenged in court by opponents who claim it
violates federal and state guarantees of equal protection, of state and federal
privacy rights, and of international law. The federal courts have temporarily
blocked the amendment as many citizens favor continuance of benefits.
Reproduced with permission of the copyright owner. Further reproduction prohibited without permission.
49
California laws specifically give its citizens "a right to a basic education and
the Legislature has a constitutional duty to provide one" (OHalloran, 1994,
p. 370).
The migrant worker is in the midst of this battle. Agriculture is
California's largest industry and it now produces "more than half the fruits,
nuts, and vegetables consumed in the United States" (Schlosser, 1995, p. 80).
Schlosser maintains from 30% to 60% of the migrant workers in California
are illegal immigrants. "Illegal immigrants, widely reviled and depicted as
welfare cheats, are in effect subsidizing the most important sector of the
California economy" (p. 82). Illegal immigrants are so essential to the U.S.
agricultural economy that legislators often find ways to provide temporary
guest worker programs for states that are dependent upon them. "Skillful
manipulation of an increasingly vulnerable administrative system" (Schuck,
1995, p. 92) provides that the legal status of aliens "who enter surreptitiously
should be called 'undocumented' rather than 'illegal' because their legal status
remains uncertain for months or years during which the aliens can usually
obtain work permits" (p. 92).
The agricultural employment is a lifeline to the migrant families. The
cheap wages in the U.S. are up to 10 times the wages earned by Mexican
Reproduced with permission of the copyright owner. Further reproduction prohibited without permission.
peasants in their native villages. It is at a cost to Mexico and the United
States. Mexico loses its surplus workers and the United States increasingly
pays higher costs as migrants marry and raise children within the U.S. The
Immigration and Naturalization Service "has traditionally rounded up and
deported illegal immigrants in California immediately after the harvest"
(Schlosser, 1995, p. 99). The workers who are overlooked often become
American citizens and eventually find less physically demanding and more
financially rewarding kinds of work in factories and other skilled trades. "As
a result, the whole system now depends on a steady supply of illegal
immigrants to keep firm wages low and to replace migrants who have either
retired to Mexico or found better jobs in California" (p. 99).
This is having a dramatic effect on the ethnic population in our schools.
It is estimated that by the year 2010 more than one half of our children "under
18 years of age will be minorities: Hawaii (80%), New Mexico (77%),
California (57%), Texas (57%), District of Columbia (93%)" (Klauke, 1989.
p. 1). Projections to 2020 indicate a Latino population of over 47 million in
the U.S., representing 15% of the total population (Bedard, Eschholz, &
Gertz, 1994, p. 72). The U.S. Census Bureau reported nearly 13,000,000
Mexican-Americans living in the United States in 1989. Headden (1995)
Reproduced with permission of the copyright owner. Further reproduction prohibited without permission.
reports nearly three million students in the American educational system are
designated as limited English proficient (LEP), and 45% of these students live
in California. Most of the LEP students in California are Latino
(p. 45), and many of these students are children of migratory workers.
Velazquez (1994) discusses the movement of migrant workers along
three identifiable streams: Eastern, Mid-Continent, and Western. The
Western stream is the largest, "extending from California and Arizona to
Oregon and Washington" (p. 32). The migrant student is a child defined by
family mobility and type of labor. Migratory workers move from one state to
another for the purpose of finding temporary or seasonal employment (U. S.
Department of Education, 1985). Most are agricultural workers or migratory
fishermen who move from one district to another during the regular school
year (Cahape, 1993; California Department of Education, Handbook, 1992).
Cahape (1993) reports there are over half a million migrant children enrolled
in public education in the 50 states, the District of Columbia, and Puerto
Rico. Trotter (1992) argues that many migrant children are unidentified and
"estimates of all those engaged in migrant labor range between 1.7 million
and 6 million" (p. 16). Illegal immigration plays a major role in these
Reproduced with permission of the copyright owner. Further reproduction prohibited without permission.

52
statistics.
There is some disagreement on statistics relating to these farm workers.
"The vast majority of aliens [foreigners] who enter illegally are more or less
seasonal migrants" (Schuck, 1995, p. 90). Trotter (1992) estimates that 95%
of illegal immigrants are farm workers, and 90% of these are Latino.
Velazquez (1994) claims undocumented workers comprise only 15% of all
migrants. Doyle (1990) cites studies that support this smaller number, and
claims that many of the labeled migrant students maintain stable residences.
OHalloran (1994) claims more than two million of those enrolled in public
institutions in the last decade were immigrant youth, and 70% reside in just
five states, "the majority having settled in California" (p. 371). The Migrant
Student Record Transfer System (MSRTS) is a computerized information
network used by approximately 17,000 sites in the U. S. that regulates and
transfers data on migratory students as they move from school site to school
site. MSRTS figures for 1990 show there are approximately 600,000
migrant children in the U.S. with the following concentrations:
California (209,006), Texas (123,187), Florida (59,195), Washington
(30,000), Arkansas (20,000), Oregon (20,000), New York (10,000), and the
Reproduced with permission of the copyright owner. Further reproduction prohibited without permission.

53
least, District of Columbia (190), and West Virginia (94).
Authorized recruiters for the migrant student programs identify these
students, but many are not found. The 1993-1994 National Report for the
California Portable Assisted Study Sequence (P.A.S.S.) Program, which
serves migrant students in California, shows it served only 8,326 of the
estimated 209,006 migrant students in California in 1993-1994. Nearly all of
these students (8,243 or 99%) were Latino. The California Handbook for
Identification and Recruitment (California Department of Education, 1992)
discusses the difficulty of finding children in rural settings who may be living
temporarily in abandoned buildings, orchards, and cars. The "culture of
migrancy" (Velazquez, 1994, p. 32) contributes to the difficulty. Children
assume adult roles in the fields, and "most migrant children drop out of school
when they are able to work in the fields and earn money" (p. 33). MSRTS
reports that the drop-out rate for migrant students is between 35% and 60%,
and that most have dropped out by 10th grade. Overby (1993) reports
dropout rates for migrant students of 43% as compared to Mexican-
Americans of 35.8%. This reflects an improvement for migrant students over
previous dropout rates as high as 90% in the 1970s, however (Cahape, 1993),
and graduation rates have also increased. "Between 1984 and 1990, the
Reproduced with permission of the copyright owner. Further reproduction prohibited without permission.

54
number of migrant students enrolled in 12 th grade climbed from 21,493 to
30,745~a 43% rise" (Trotter, 1992, p. 17). Trotter points out that most do
not graduate however, and that student enrollment had actually increased by
13% during the same period. He reports only 13.8% of migrant students
graduate, compared to 87.8% of the general population, and 67.6% of the
Latino population.
Grade level retention rates are also a problem. Migrant students are
retained at grade level at least 1 year twice as often as the general population,
largely due to academic deficiencies that result from problems associated with
their lifestyle. MSRTS reports "33% are one year below grade level and 17%
are two years or more below grade level" (Cahape, 1993).
The types of problems faced by migrant students are varied. Prewitt-
Diaz (1991) lists four factors affecting migrant children in school: ecological,
educational, psychological, and economical. Many families are seeking
refuge from tyranny in their native countries. Others seek a better lifestyle
and job opportunities. Children move regularly from district to district, and
experience absenteeism and falling behind in academic areas. Their self-
image is affected as they struggle with their language and new relationships.
Reproduced with permission of the copyright owner. Further reproduction prohibited without permission.

55
Cultural differences create problems of inclusion within the classroom.
Children are contributors in their families and "are essential in the economy of
the migrant family" (Prewitt-Diaz, 1991, p. 485). They have power and may
control their parents as they become the interpreters between the school and
the home. Romo (1993) lists similar problems, and adds that many
secondary-age students have only attended grades 1-6 in Mexico. Velazquez
(1994) describes their feeling of powerlessness combined with their respect
for authority. Families have little formal education and trust the schools.
They "feel that their questions about the appropriateness of their children's
educational program will be construed as a challenge to the teacher's authority
and prestige" (p. 33).
In a study conducted by Bedard, Eschholz, and Gertz (1994), the
Latino community ranked its most important problems facing the
community as:
Crime 21%
Gangs 17%
Drugs 18%
Unemployment 12%
Reproduced with permission of the copyright owner. Further reproduction prohibited without permission.
56
Education 7%
Economy 5%
Racism 2%
Health care 1%
Not sure 10%
Other 7%
Furthermore, 49% of Latinos surveyed who were bom in Mexico
considered lack of parental involvement to be the major cause of Latino youth
dropping out of school. The next highest ranking (19%) cause of dropping
out of school was considered to be gangs and delinquency (Bedard, Eschholz,
& Gertz, 1994, p. 77).
The federal government remains dedicated to its commitment to
migrant children and families as demonstrated by the government's blocking
of Proposition 187 and other legislation. The Migrant Education Program
was authorized in 1965 through the Elementary and Secondary Education
Act. Federal program regulations require state Departments of Education to
identify and educate migratory children. The California Department of
Reproduced with permission of the copyright owner. Further reproduction prohibited without permission.

Education assumes responsibility for all statutory and regulatory requirements
of the program including subgrantees. Funding is based on a "Full-time
Equivalent (FTE) count of each individual child for each day of residence in
the State. This count is based upon the entry of data into the Migrant Student
Record Transfer System (MSRTS) for each State for each year" (California
Department of Education, Handbook, 1992, p. 1-2). The California Portable
Assisted Study Sequence (P.A.S.S.) program is based in part on a newer
Federal Law, P. L. 100-297, which was passed in 1988, and California
Assembly Bill No. 1382, which was passed in 1981. This program serves the
migrant students in California and provides services throughout the U.S. to
other migrant programs.
California Portable Assisted Study Sequence (P.A.S.S.1 Program
The California Portable Assisted Study Sequence (P.A.S.S.) program
serves 165 schools in California and was created to help assuage some of the
difficulties that migrant students encounter. The P.A.S.S. Program's goals
are described in the P.A.S.S. Handbook:
Provide portable learning packages adapted for migrant students,
Reproduced with permission of the copyright owner. Further reproduction prohibited without permission.

58
enabling them to proceed at their own pace, provide competency-based credits for skills, interests, and educationally related-life experiences, supplement the regular instruction for targeted migrant students at secondary-level schools in California, and utilize existing counseling and tutorial support through regular migrant education personnel, and the California Mini-Corps to accomplish the goals of the P.A.S.S. Program, (p. 1)
The P.A.S.S. program allows migrant students to accumulate credits
that are transferable within the state and to many other states. The list of
states include Arkansas, Arizona, California, Colorado, Florida, Georgia,
Idaho, Illinois, Indiana, Kansas, Michigan, Montana, Nevada, New York,
North Dakota, Oregon, Texas, Utah, Washington, and Wisconsin. Ten units
provide credits for two semesters. The portable units can be continued at
new school sites throughout California "thanks to the coordination of services
among the migrant staff at the school sites" (p. 2).
The P.A.S.S. Program courses "have the same content as the regular
high school courses" (p. 2). The mathematics courses are sequential. The
first course in the program was General Math A and General Math B. which
has now been replaced by Integrated Math A and Integrated Math B. Other
math courses include Consumer Math. Pre-Algebra, and Algebra A and
Algebra B. A fifth course, Geometry is planned for 1997. The Consumer
Reproduced with permission of the copyright owner. Further reproduction prohibited without permission.
59
Math course is being rewritten for 1996-1997 as Consumer Education to
integrate new reform ideas with career math into the program.
The California P.A.S.S. Program is accredited through Fresno Unified
School District, and the Western Association of Schools and Colleges.
The Methodology o f Content Analysis
Krippendorff (1980) discusses the historical growth of content analysis
methodology. He finds it has been dated to the late 1600s in church-
conducted research to assess nonreligious content in newspapers. Early
content analysis, in fact, came to be called quantitative newspaper analysis.
The emergence of social sciences and electronic media produced survey
research and polling. Opinion research and attitude surveys appeared in the
early 1900s. Propaganda analysis was conducted during World War II as an
"instrument for identifying individuals as 'unethical' sources of influence"
(Krippendorff, 1980, p. 16). It became useful in other areas as well.
Among the most outstanding predictions actually made by British analysts was the date of deployment of the German V-weapon against Great Britain. Monitoring Goebbel's speeches, the analyst inferred interferences with the production of these weapons and extrapolated the launching date which was accurate within a few weeks, (p. 17)
Reproduced with permission of the copyright owner. Further reproduction prohibited without permission.

60
Content analysis became useful in many disciplines after World War II.
The methodology was used in television surveys, population trends, cultural
indicators, and political surveys. Psychology found applications to discover
motivational, psychological, and personality characteristics. Anthropologists
analyzed myths, folktales, and riddles to determine kinship terminology.
Historians added the methodology as another systemic tool to examine
historical documents. Educational material was analyzed to "understand
larger political, attitudinal, and value trends" (Krippendorff, 1980, p. 18).
The first conference on content analysis, sponsored by the Social Science
Research Council's Committee on Linguistics and Psychology, was held in
1955. Participants "came from such disciplines as psychology, political
sciences, literature, history, anthropology, and linguistics" (Krippendorff,
1980, p. 19).
Computers began to be used in analysis at this time. Weber (1990)
discusses two computer-aided studies conducted in the 1970s. One analyzed
differences in narrative form in American black and white song lyrics, and the
other studied differences in sex-roie relationships. Frisbie (1986) used
computer-aided analysis to establish its value in creating and coding survey
Reproduced with permission of the copyright owner. Further reproduction prohibited without permission.

category responses. Some contemporary studies that relate to textbook
analysis are those conducted in mathematics, science, history, and health.
Flanders (1994) analyzed the content of nonalgebra mathematics books and
compared them to items on the Second International Mathematics Study
(SIMS) test. Lumpe and Scharmann (1991) analyzed the content of lab
activities in biology as they related to the Task Section of the Laboratory
Structure and Task Analysis Inventory. Wolf (1992) analyzed eighth grade
history books and compared them to multicultural content in the California
History Social-Science Framework. Huetteman (1989) analyzed six college
health textbooks to assess coverage of the Surgeon General's Report on
Health Promotion and Disease Prevention. The four studies provide a broad
perspective of the methodology as it is used in textbook content analysis.
Researchers offer varied definitions of content analysis. Berelson
(1952) defines content analysis as "a research technique for the objective,
systematic and quantitative description of the manifest content of
communication" (p. 18). His definition implies structure and quantifiable
content, and "manifest content means the apparent content, which means that
content must be coded as it appears rather than as the content analyst feels it
Reproduced with permission of the copyright owner. Further reproduction prohibited without permission.

62
is intended" (Stempel & Westley, 1989, p. 125). Krippendorff (1980)
believes "content analysis is a research technique for making replicable and
valid inferences from data to their context" (p. 21). He states it must be
specific about the data, context, and target, but it is an intuitive "method of
inquiry into symbolic meaning of messages" (p. 22). Messages are
interpreted by the researcher, and inferences are made. Weber (1990) states
that "content analysis is a research method that uses a set of procedures to
make valid inferences from text" (p. 9). He states there is "no simple right
way to do content analysis. Instead, investigators must judge what methods
are most appropriate for their substantive problems" (p. 13).
Weber (1990) describes content analysis as a process that involves
selecting a unit of analysis, constructing category systems, selecting a sample
of content, and providing reliable and valid coding. The unit of analysis may
be a word, a phrase, a sentence, a paragraph, or a theme. Categories should
be mutually exclusive to prevent interpretative errors. The categories may be
narrowly defined or broad with many entries. Stempel and Westley (1989)
say the categories should be pertinent to the objectives of the study,
functional, and manageable. They believe 10 to 20 categories are adequate
Reproduced with permission of the copyright owner. Further reproduction prohibited without permission.

for most studies. Weber (1990) states "the best test of the clarity of category
definitions is to code a small sample of the text. Testing not only reveals
ambiguities in the rules, but also often leads to insights suggesting revisions
of the classification scheme" (p. 23). Krippendorff (1980) discusses the
sampling schemes that can be employed: random, stratified, systematic,
clustered, or proportional. Multistage sampling uses one or more of these
procedures at different time periods. The sample size can be limited
to a cost-effective point "at which a further increase will not appreciably
improve the generalizability of the findings" (Krippendorff, 1980, p. 69).
There is a large variety of computer software available to today's
qualitative researcher (Kelle, 1996; Prein, Kelle, & Bird, 1995). Kelle
(1996) discusses the software as first-, second-, and third-generation
programs. First-generation programs are largely "word-processors and
standard database management systems" (p. 34). Second-generation
programs provide techniques for coding and retrieval and have "facilitated the
mechanization of rather mundane mechanical tasks, namely the building of
indexes, concordances and index card systems" (p. 34). Third-generation
Reproduced with permission of the copyright owner. Further reproduction prohibited without permission.
programs extend the capabilities of second-generation software and "require a
coding of qualitative data that is much closer to that applied in classical
content analysis" (p. 34). This includes building indexes, cross references,
and decontextualization and comparison of text passages (cut-and-paste
techniques). The advanced features of these programs allow coding linkages,
network building, hypothesis testing, and theory building. The extended
features "are only seldom used" (p. 34) and "offer fascinating new
possibilities for analysts to 'play' with their data and thereby help to open up
new perspectives and to stimulate new insights" (p. 59). He warns, however,
that the "qualitative researcher runs the danger of reifying the codes and
losing the investigated phenomenon by confusing two analysis strategies"
(p. 59).
Finally, the reliability and validity of coding is imperative to assure a
reputable study. Reliability of coding is "consistency of classification"
(Stempel & Westley, 1989, p. 132). Coding can be performed manually or
with computers. Frisbie (1986) found that computer programming output did
not help participants create more reliable and valid category systems for the
responses to open-ended survey questions, but did help participants to "more
reliably and validly code the open-ended responses in terms of the category
Reproduced with permission of the copyright owner. Further reproduction prohibited without permission.

system (p. 32). Krippendorff (1980) proposes reliability should be
established through the duplication of efforts. He distinguishes between three
types: stability, reproducibility, and accuracy. Stability can be established by
the repetition of coding by the same coder. Reproducibility requires more
than one coder and is "a minimum standard for content analysis" (Weber,
1990, p. 17). Coders must work independently to prevent agreement through
communication as the "lack of independence is likely to make data appear
more reliable than they are" (Krippendorff, 1980, p. 132). Accuracy is the
"strongest reliability test available" (p. 131).
Validity is the most important test, it is the assurance that the analytical
results are true, predictive, and consistent with established knowledge.
Content analysis is "valid to the extent its inferences are upheld in the face of
independently obtained evidence" (Krippendorff, 1980, p. 155). Internal
validity is synonymous with reliability. External validity "assesses the degree
to which variations inside the process of analysis correspond to variations
outside that process and whether findings represent the real phenomena in the
context of data as claimed" (p. 156). Weber (1990) divides validity into
themes of correspondence and generalization. Krippendorff (1980) provides
Reproduced with permission of the copyright owner. Further reproduction prohibited without permission.
66
five types. He differentiates between data-related validity (semantical validity
and sampling validity), pragmatical or product-oriented validity (correlational
validity and predictive validity), and process-oriented validity or construct
validity. He states it is important to decide on standards of reliability and
validity "before an analysis is conducted" (p. 175).
Content Analyses of Curriculum
Many of the ideas in the Standards are complex and subjective. It is
difficult to evaluate subjective ideas, but it is essential for successful
implementation of the Standards. Evaluation of curricula is integral to
successful mathematics reform, and establishing criteria for content analysis
is essential.
One useful breakdown comes from a study conducted in the early
1980s by the International Association for the Evaluation of Educational
Achievement (IEA). The Second International Mathematics Study (SIMS)
included an extensive curriculum analysis. It studied the mathematics
curriculum at three levels: intended curriculum, implemented curriculum, and
attained curriculum (Robitaille & Travers, 1992, p. 693). The intended
Reproduced with permission of the copyright owner. Further reproduction prohibited without permission.

67
curriculum is defined at the national or system level, the implemented
curriculum is that which is taught by the teachers in the classroom, and the
attained curriculum is what is learned by students and demonstrated through
their achievement and attitudes.
Content analysis of textbooks should "concentrate on the
characteristics of the textbook which emphasize the main objectives of the
curriculum" (Dreyfus, 1992, p.8). The main objectives of the curriculum are
stated in the intended curriculum. In this researcher's study, they are stated in
the NCTM Standards. Subjective interpretation is necessary for many of the
objectives. Other objectives are can be measured with descriptive statistics.
A combination of these was used in a study that compared American
and Japanese mathematics textbooks (Robitaille & Travers, 1992). The
researchers found that many topics were introduced 1 year later in American
textbooks than in Japanese textbooks except for ratio and proportion, problem
solving, fractions, and weight (p. 707). Material was spiraled or reviewed in
American textbooks more often than in Japanese textbooks. More than 70%
of the concepts were reviewed at least once, almost 25% were reviewed
twice, and 10% were reviewed three times. Japanese textbooks reviewed
Reproduced with permission of the copyright owner. Further reproduction prohibited without permission.
68
38% of the concepts once and only 6% more than once (p. 707). American
texts were longer and less complicated than Japanese texts. Problems began
simply in the Japanese texts but quickly became difficult. The process of
mathematics was explained in detail in American textbooks; steps were
omitted in Japanese textbooks. American mathematics texts were also longer
than Japanese texts. American texts ranged from 400 to 856 pages with an
average of 540 pages; Japanese texts averaged 178 pages with a maximum of
230 pages.
Content analysis of two secondary biology textbooks was carried out
byLumpeand Scharmann (1991). They used an instrument from a previous
study that was "designed specifically for content analysis of written lab
activities" (p. 232). Lumpe acted as one of two judges and worked
independently to assess 10% of the lab activities with the instrument.
Interrelater reliability was established and Lumpe then proceeded to judge the
remaining activities from both texts.
Linguistic content analysis was used to measure science as a process of
inquiry in a high school biology textbook series (Eltinge & Roberts, 1993,
p. 65). The researchers used a scheme developed by a previous researcher,
Tamir, for use on chapters of science textbooks. Sentences were classified as
Reproduced with permission of the copyright owner. Further reproduction prohibited without permission.
69
"rhetoric of conclusions" or "narrative of inquiry" (p. 67). The categorization
scheme included 23 items that listed examples of what might appear in a
narrative of inquiry. Eltinge and Roberts write that two general techniques of
content analysis were used. The first involved the researcher's "subjective,
impressionistic application of a classification scheme to the phenomena of
interest" (p. 68). The second applied "computers in classifying words and
phrases from texts of transcripts" (p. 68). They caution against the varying
interpretations of subjective schemes, while also pointing out the limitations
of computer-aided interpretations taken out of context.
Another approach to content analysis is the evaluation and analysis of
two eighth grade history books with respect to the California History Social-
Science Framework (Wolf, 1992). The author isolated multicultural
perspectives and criteria for evaluating instructional materials from the
Framework. He employed an instrument from previous studies that used
"descriptive concepts and quantitative data (number of pages and pictures)"
(p. 24). A narrative compared and contrasted the findings.
Krippendorff (1980) considers content analysis to be "fundamentally
empirical in orientation, exploratory, concerned with real phenomena, and
Reproduced with permission of the copyright owner. Further reproduction prohibited without permission.
70
predictive in intent.. . . (It) enables the researcher to plan, to communicate,
and to critically evaluate a research design independently of its results" (p. 9).
Data must be unitized, separated, and identified. Recording and coding of
data can be done manually or with computers, but it must be replicable.
Finally, it must be understood that "although a good content analysis will
answer some question, it is also expected to pose new ones. . . . The
beginning and end of a content analysis mark but an arbitrary segment in
time" (p. 169).
Summary
In summary, the changes in society have created a new need for
mathematics reform in the 1990s. The issues are interrelated and require a
flexible, holistic viewpoint, and complex problem-solving abilities. Students
in today's educational system will need to solve these complex problems. The
NCTM Standards (1989) address these needs, but purposely do not provide
an easy checklist for curriculum developers (pp. 241-242). Mathematics
teachers need assistance in aligning their curriculum to NCTM Standards
(Chandler & Brosnan, 1995; Rivers, 1990). Subjective, interpretative
Reproduced with permission of the copyright owner. Further reproduction prohibited without permission.

71
analysis, as well as objective analysis, is needed to determine if new
curricular materials are meeting many of the objectives. This researcher was
unable to locate an adequate evaluative instrument based upon the NCTM
Standards for textbook analysis. Therefore, the researcher developed an
instrument that was used in this study to analyze the P.A.S.S. curricular
materials with respect to the Standards.
Reproduced with permission of the copyright owner. Further reproduction prohibited without permission.

CHAPTER 3
Methodology
A considerable portion of my high school trigonometry course was devoted to the solution of oblique triangles. I pride myself on the fact that I was the best triangle solver my high school ever turned out. When I went to Princeton I found that I was up against very stiff competition. But whereas other freshmen might outdo me in many ways, I felt confident that I would shine when the time came to solve triangles. All through my undergraduate years I was waiting for that golden moment. Then I waited all through graduate school, through my work with Einstein, at Los Alamos, and while teaching and consulting for more than a dozen years. I have still not had an excuse for using my talents for solving oblique triangles.
If a professional mathematician never uses these dull techniques in a highly varied career, why must all high school students devote several weeks to the subject?
- John G. Kemeny (Schmalz, 1993, p. 260)
This lengthy quote succinctly expresses the vision behind the National
Council of Teachers of Mathematics (NCTM) Standards. Mathematics
curricula must reflect the needs of the society. The California Portable
Assisted Study Sequence (P.A.S.S.) Program is a unique program that
provides educational opportunities to students who are often underserved in
Reproduced with permission of the copyright owner. Further reproduction prohibited without permission.

73
the regular system. The P.A.S.S. mathematics curriculum is periodically
rewritten to reflect changes in educational theory and instruction.
Educating the migrant student population is one of the greatest
challenges that the California educational system and the United States
educational systems face today. Students from this population frequently
relocate to other schools and to other states. The P.A.S.S. Program serves
165 schools in California and was created to help assuage some of the
difficulties that these students encounter. However, the P.A.S.S. Program
must not only provide materials that will be appropriate for the migrant
student, but must also comply with the National Council of Teachers of
Mathematics Standards for School Mathematics (NCTM Standards or
Standards!. Until now, no study has been conducted that has analyzed the
P.A.S.S. mathematics curricular materials in relationship to the Standards.
This study analyzed the 1-year secondary level courses entitled
Integrated Math A and Integrated Math B written in 1995 and the 1989
course General Math A and General Math B. This analysis compared the
curricula in relationship to the National Council of Teachers of Mathematics
(NCTM! Curriculum and Evaluation Standards for School Mathematics
Reproduced with permission of the copyright owner. Further reproduction prohibited without permission.

74
(1989). An evaluative instrument was designed to measure the extent to
which the curricular materials meet NCTM Standards and was used in this
study to analyze the P.A.S.S. curricular materials.
Design of the Study
This study used content-analysis as the main methodology to analyze
the text of the P.A.S.S. curricula for 1989 and 1995. The 1995 curricular
materials entitled Integrated Math A and Integrated Math B replaced the
1989 curricular materials entitled General Math A and General Math B.
Comparisons were made in reference to the NCTM Curriculum and
Evaluation Standards for School Mathematics (1989).
Content analysis is a specialized technique in research that can provide
important information. Krippendorff (1980) defines content analysis as "a
research technique for making replicable and valid inferences from data to
their context" (p. 21). Berelson (1952) defines it as "a research technique for
the objective systematic and quantitative description of the manifest content
of communication" (p. 18). Borg and Gall (1989) describe its use in
education as being "aimed at answering questions directly relating to the
Reproduced with permission of the copyright owner. Further reproduction prohibited without permission.
75
material analyzed" (p. 520). They point out that "recent content-analysis
studies consider not only content frequencies but also the interrelationships
among several content variables, or the relationship between content variables
and other research variables" (p. 521).
Content analysis methodology requires the research design to remain
open and flexible during the study. Krippendorff (1980) considers the
content analysis research design to be sequential. Outcomes from one step
determine the next step, and "in sequential processing of information, errors
are thus cumulative or multiplicative" (p. 50). Therefore, the design must
allow room to compensate for any loss of information or an opportunity to
recreate what was destroyed if results are to be trusted. With this caveat in
mind, this study adhered to the following recommended procedures.
Procedures
Krippendorff (1980) lists the components or steps o f content analysis
as the process as (a) data making, which includes unitization, sampling, and
recording, (b) data reduction, (c) inference, (d) analysis, (e) direct validation,
(f) testing for correspondence with other methods, and (g) testing hypotheses
Reproduced with permission of the copyright owner. Further reproduction prohibited without permission.
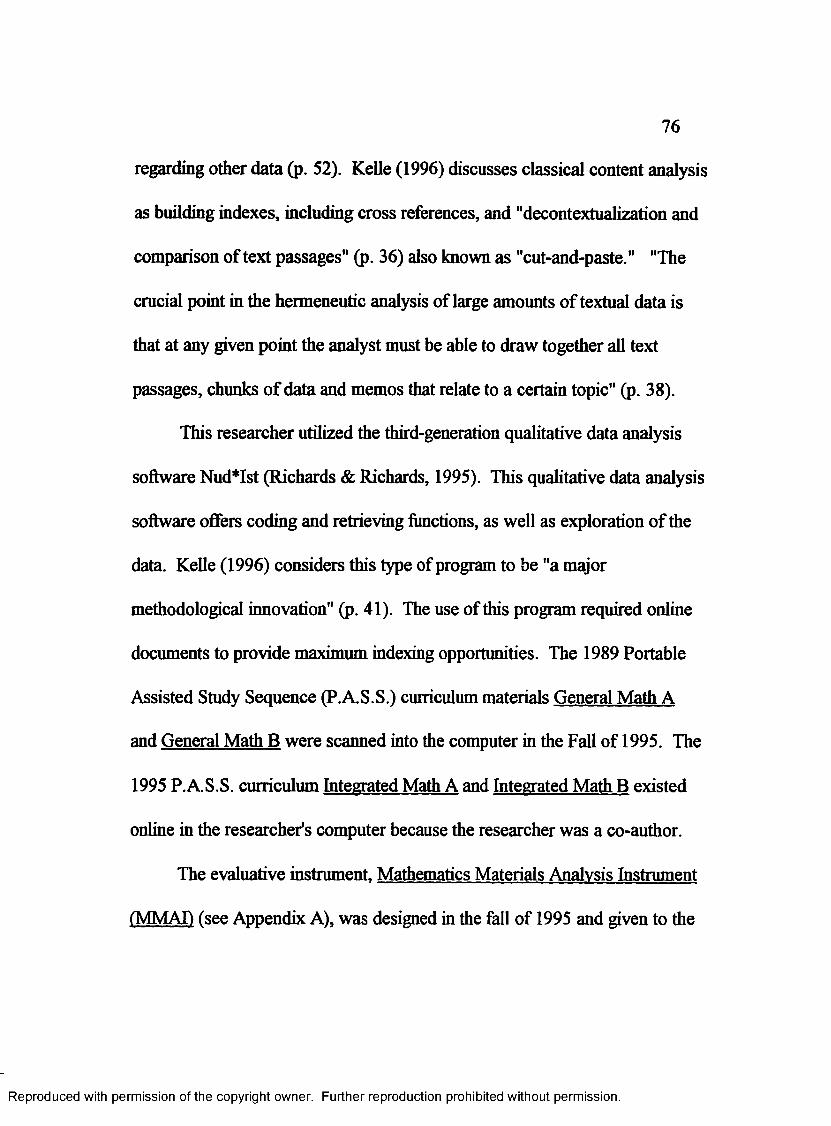
76
regarding other data (p. 52). Kelle (1996) discusses classical content analysis
as building indexes, including cross references, and "decontextualization and
comparison of text passages" (p. 36) also known as "cut-and-paste." "The
crucial point in the hermeneutic analysis of large amounts of textual data is
that at any given point the analyst must be able to draw together all text
passages, chunks of data and memos that relate to a certain topic" (p. 38).
This researcher utilized the third-generation qualitative data analysis
software Nud*Ist (Richards & Richards, 1995). This qualitative data analysis
software offers coding and retrieving functions, as well as exploration of the
data. Kelle (1996) considers this type of program to be "a major
methodological innovation" (p. 41). The use of this program required online
documents to provide maximum indexing opportunities. The 1989 Portable
Assisted Study Sequence (P.A.S.S.) curriculum materials General Math A
and General Math B were scanned into the computer in the Fall of 1995. The
1995 P.A.S.S. curriculum Integrated Math A and Integrated Math B existed
online in the researcher's computer because the researcher was a co-author.
The evaluative instrument, Mathematics Materials Analysis Instrument
(MMAD (see Appendix A), was designed in the fall of 1995 and given to the
Reproduced with permission of the copyright owner. Further reproduction prohibited without permission.
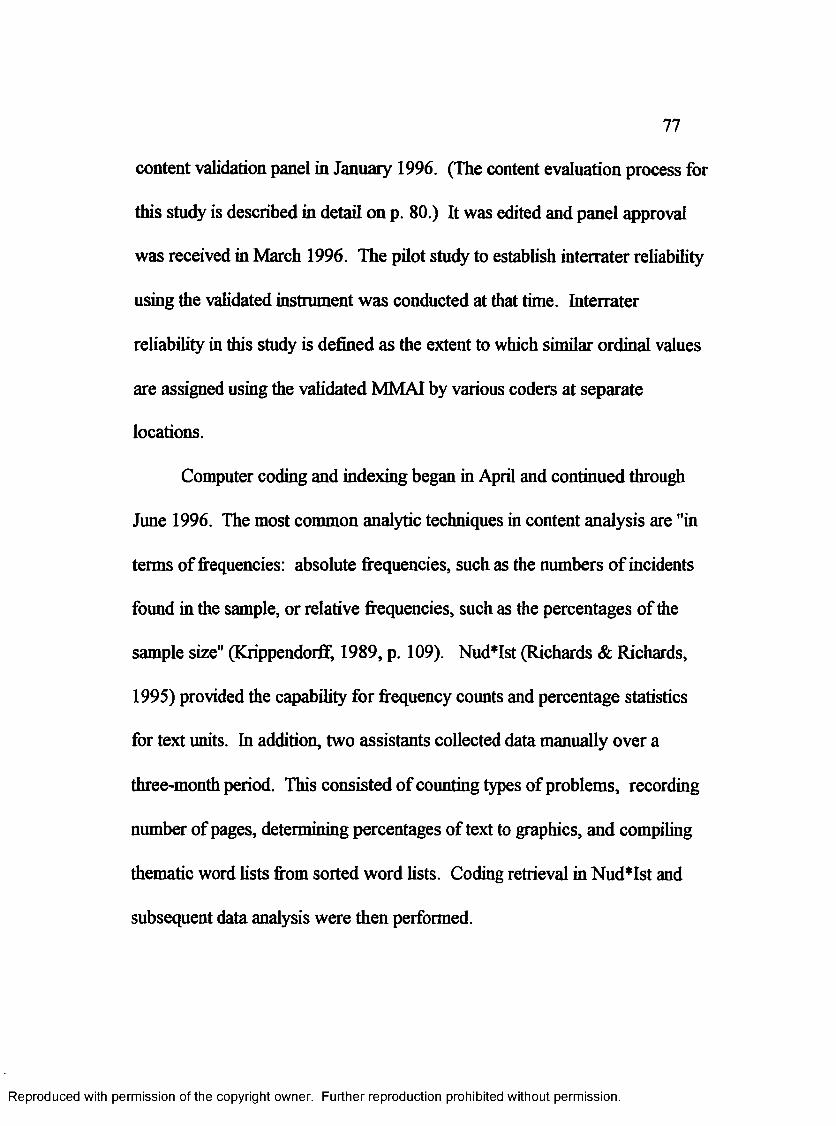
77
content validation panel in January 1996. (The content evaluation process for
this study is described in detail on p. 80.) It was edited and panel approval
was received in March 1996. The pilot study to establish interrater reliability
using the validated instrument was conducted at that time. Interrater
reliability in this study is defined as the extent to which similar ordinal values
are assigned using the validated MMAI by various coders at separate
locations.
Computer coding and indexing began in April and continued through
June 1996. The most common analytic techniques in content analysis are "in
terms of frequencies: absolute frequencies, such as the numbers of incidents
found in the sample, or relative frequencies, such as the percentages of the
sample size" (Krippendorff, 1989, p. 109). Nud*Ist (Richards & Richards,
1995) provided the capability for frequency counts and percentage statistics
for text units. In addition, two assistants collected data manually over a
three-month period. This consisted of counting types of problems, recording
number of pages, determining percentages of text to graphics, and compiling
thematic word lists from sorted word lists. Coding retrieval in Nud*Ist and
subsequent data analysis were then performed.
Reproduced with permission of the copyright owner. Further reproduction prohibited without permission.

78
Population
The population affected by this study are the California Portable
Assisted Study Sequence (P.A.S.S.) 1989 and 1995 mathematics curricula
titled respectively General Math A and General Math B. and Integrated
Math A and Integrated Math B. The courses are themselves the units of
analysis. "Regarding unitization, the general recommendation is to aim for
the empirically most meaningful and productive units that are efficiently and
reliably identifiable and that satisfy the requirements of available techniques"
(Krippendorff, 1980, p. 64).
The appropriateness of the 1995 P.A.S.S. curriculum materials for
migrant students has been attested to in a letter (see Appendix J) submitted by
Dr. Rudy Miranda, an educational consultant and the Director of Counseling
at the researcher's school site. Dr. Miranda is directly involved with Latino
students and the P.A.S.S. program and reviewed the materials for this study.
Instrumentation
An evaluative instrument was designed for this study to quantify the
relationship between mathematics materials and the recommendations in the
Reproduced with permission of the copyright owner. Further reproduction prohibited without permission.

79
NCTM Standards. This instrument is entitled Mathematics Materials
Analysis Instrument (MMAD (see Appendix A) and is divided into two grade
levels: grades 5-8 and grades 9-12. A Guide for Reviewing School
Mathematics Programs (NCTM, 1991) provided guides for the K-12
mathematics program to "determine the level of implementation that currently
exists.. . . Users should feel free to modify these outlines or develop new
ones" (p. 1). The researcher and a validation panel modified guides from
two curricular areas, Grades 5-8, and Grades 9-12. The materials chosen
were considered to be "the most useful for systematically analyzing textbooks
or other materials that are being considered for adoption" (p. 3). These
modified materials were used to create MMAI that has been used in this
study to analyze the P.A.S.S. curricular materials.
The evaluative instrument MMAI consists of eight categories for
grades 5-8 and eight categories for grades 9-12. There are 3 to 12
subcategories for each category in grades 5-8 and 6 subcategories for each
category in grades 9-12. The instrument includes an ordinal value scale
that measures the extent to which material in the curricular materials meet
NCTM Standards. The ordinal values assigned to each subcategory are
"1-None, 2-Low, 3-Moderate, 4-High." These values measure the extent of
Reproduced with permission of the copyright owner. Further reproduction prohibited without permission.

80
alignment of content in the curricular materials to the content in the
subcategories on MMAI that reflects the NCTM Standards. Supplementary
attachments were included with MMAI to assist the coders in assigning
values (see Appendixes B-E).
Content Validity. The content validity of the evaluative instrument
was determined by a panel of three expert educators who are familiar with
and experienced in the vision of the NCTM Standards. Dr. Jane D.
Gawronski is co-author of the NCTM Assessment Standards, and is the
Superintendent of Escondido Union High School District in Escondido,
California. Dr. Carol Fry Bohlin is an Associate Professor of Mathematics
Education at California State University, Fresno, and Director of the
California Mathematics Project for the San Joaquin Valley. Dr. Roy M.
Bohlin is an Associate Professor of Instructional Technology at California
State University, Fresno, Principal Investigator for the California
Mathematics Project for the San Joaquin Valley, and the Coordinator of
Evaluation for the National Science Foundation (NSF) Project PROMPT
(Professors Rethinking Options in Mathematics for Preservice Teachers).
The California Mathematics Project is designed to update teacher knowledge
Reproduced with permission of the copyright owner. Further reproduction prohibited without permission.

81
in the California Framework (California Department of Education, 1992) and
NCTM Standards.
The panel was approached in the fall of 1995, and agreed to review
and edit the instrument. A draft copy of the evaluative instrument, various
supplementary attachments, and a letter of instructions (see Appendix F) were
submitted to the panel in January 1996. Several revisions to the instrument
occurred over the next two months; the supplementary attachments were
accepted with minor editing changes. The panel gave their approval of
content to the final revision in March 1996 (see Appendix G). The final
instrument was titled Mathematics Materials Analysis Instrument fMMAD
and included supplementary attachments (see Appendixes A-E).
The following changes were made to the original draft of the
instrument based upon recommendations and suggestions from the panel.
1. Categories and subcategories: The weighting of items in categories
was deemed reasonable for Grades 5-8, which contained eight categories with
each category containing from 3 to 12 subcategories. This distribution was
maintained in the final instrument. The distribution for Grades 9-12 was
deemed unreasonable because there were six categories with each category
containing from 4 to 22 subcategories. This distribution was changed
Reproduced with permission of the copyright owner. Further reproduction prohibited without permission.

82
to eight categories with each category containing six subcategories.
2. The words curriculum and curricula were replaced with curricular
materials and materials throughout much of the instrument. This was done to
reflect the intent of use for the instrument to measure curricular materials
rather than curriculum as a whole. The title of the instrument was also
changed to reflect this emphasis, and the acronym MMAI was added.
3. Editing changes were made throughout the instrument to separate
compound statements, to correct the improper use of terms such as reference
materials instead of source materials, and other semantical errors.
4. The instrument worksheet was edited to provide more detail and
consistency of wording to ensure ease of use.
5. Ordinal values originally included the subcategory "0 - Not
Applicable." The panel recommended deleting this subcategory. This was
done during the pilot study when participants found the subcategory to be
confusing.
Reproduced with permission of the copyright owner. Further reproduction prohibited without permission.

83
Interrater Reliability. Reproducibility requires more than one coder
and is "a minimum standard for content analysis" (Weber, 1990, p. 17).
Coders must work independently to prevent agreement through
communication as the "lack of independence is likely to make data appear
more reliable than they are" (Krippendorff, 1980, p. 132). Accuracy is the
"strongest reliability test available" (p. 131).
Interrater reliability in using the evaluative instrument MMAI was
established through a pilot test conducted with secondary mathematics
teachers from the researcher's school site. A team of five secondary
mathematics teachers presently teaching all levels of secondary mathematics
from general mathematics to calculus participated in the study. Two of the
teachers each have over 25 years of teaching experience; both have served or
are serving as chairman of the mathematics department. Both teachers
unabashedly subscribe to a traditional philosophy of mathematics teaching
based upon their experience and training. The remaining three teachers have
less extensive experience. The third team member has approximately 5 years
teaching experience. The fourth and fifth team members are new to the
Reproduced with permission of the copyright owner. Further reproduction prohibited without permission.

84
profession: one is in her 2nd year of teaching, and the other is in his 3rd year.
The newest members have been exposed to contemporary training in the
Standards and updated teaching techniques in their college programs.
The five teachers were divided into two teams of three members, with
one teacher participating on both teams. Teams were given the choice of two
textbooks: Integrated Mathematics. (Rubenstein, Craine, & Butts, 1995) or
Informal Geometry (Cummins, Kenney, & Kanold, 1988). The researcher
chose these textbooks because their publishing dates suggested there might be
recognizable philosophical differences in the curricula. The instrument could
therefore be tested from two distinctly different viewpoints.
The two traditional teachers immediately selected Informal Geometry
because they were interested in obtaining it as a replacement text in their
geometry courses. Their comments included statements to the extent that the
text was advertised as a transition text between traditional teaching and
teaching strategies recommended by the Standards. The other team
enthusiastically agreed to assess Integrated Mathematics and recognized it as
the first published mathematics text advertised in California as meeting the
Standards. The third team member also agreed to assess Informal Geometry.
Reproduced with permission of the copyright owner. Further reproduction prohibited without permission.
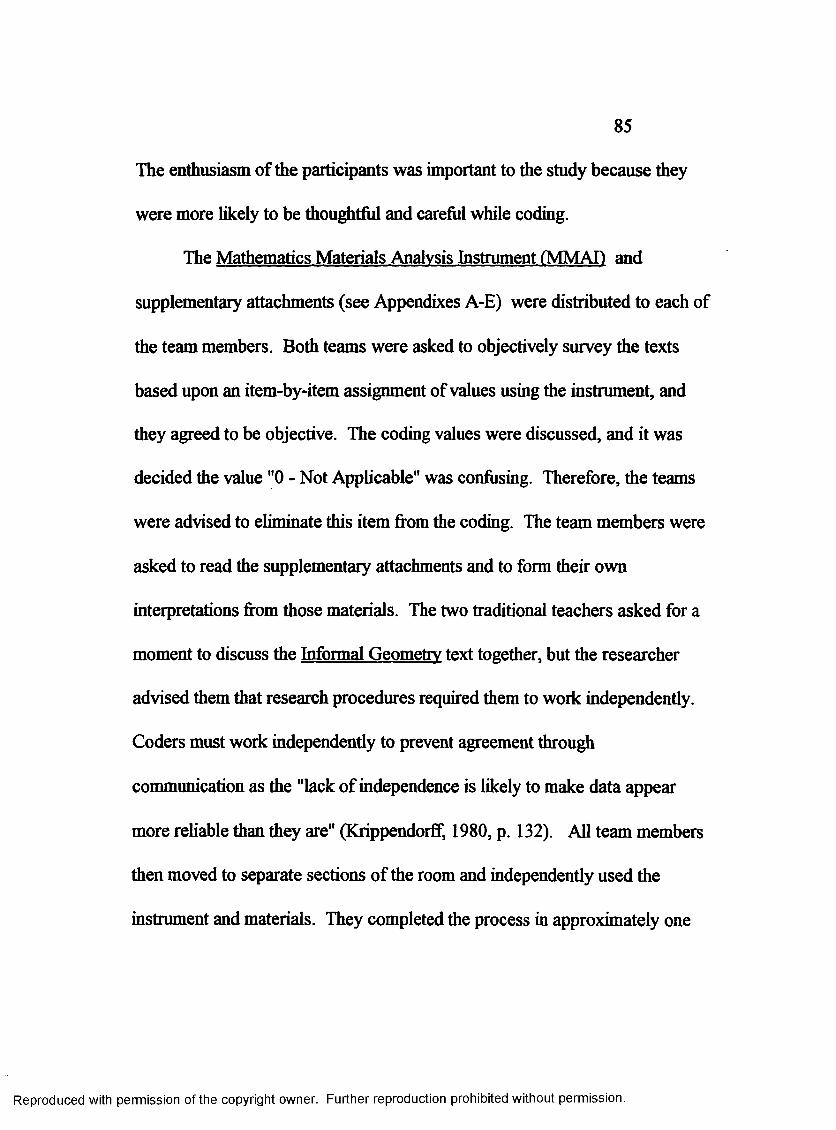
85
The enthusiasm of the participants was important to the study because they
were more likely to be thoughtful and careful while coding.
The Mathematics Materials Analysis Instrument (MMAD and
supplementary attachments (see Appendixes A-E) were distributed to each of
the team members. Both teams were asked to objectively survey the texts
based upon an item-by-item assignment of values using the instrument, and
they agreed to be objective. The coding values were discussed, and it was
decided the value "0 - Not Applicable" was confusing. Therefore, the teams
were advised to eliminate this item from the coding. The team members were
asked to read the supplementary attachments and to form their own
interpretations from those materials. The two traditional teachers asked for a
moment to discuss the Informal Geometry text together, but the researcher
advised them that research procedures required them to work independently.
Coders must work independently to prevent agreement through
communication as the "lack of independence is likely to make data appear
more reliable than they are" (Krippendorff, 1980, p. 132). All team members
then moved to separate sections of the room and independently used the
instrument and materials. They completed the process in approximately one
Reproduced with permission of the copyright owner. Further reproduction prohibited without permission.

86
hour and offered comments to the extent that they felt the instrument was
straightforward and relatively easy to use.
Data Collection Methodology
Content analysis is "valid to the extent its inferences are upheld in the
face of independently obtained evidence" (KrippendorfF, 1980, p. 155).
Triangulation refers to the use of multiple methods of data collection to
ensure trustworthiness and enhance the validity of research (Kelle, 1995;
Patton, 1990). The triangulation in this study consisted of (a) qualitative
examination of the materials, (b) descriptive statistics compiled from manual
counts and observations, and (c) computer analysis using Nud*Ist (Richards
& Richards, 1995), a third-generation qualitative data analysis software. The
materials examined were the California Portable Assisted Study Sequence
(P.A.S.S.) mathematics curricula for 1989 and 1995 entitled respectively
General Math A and General Math B. and Integrated Math A and Integrated
MatfaB.
Qualitative data were compiled by the researcher from examinations of
the 1989 and 1995 curricula. This included an examination of unit titles,
Reproduced with permission of the copyright owner. Further reproduction prohibited without permission.

tables of contents, introductory instructions, student directions, and other
topics of interest Descriptive statistics were accumulated with the use of a
data collection worksheet (see Appendix H) given to two assistants who
worked diligently and carefully to manually record the data from the 1989 and
1995 curricula. Krippendorff (1980) discusses the need to choose observers
and coders not only "familiar with the nature of the material to be recorded
but also capable of handling the categories and terms of the data language
reliably" (p. 72). The assistants were chosen because they are
mathematically inclined and data-oriented. One is a manager for a major
engineering corporation and is an electrical engineer in computer design; he
compiled the data on the data collection worksheet for the 1995 curriculum.
The other is a secondary mathematics teacher with 2 years teaching
experience and 6 years engineering experience as an intern in high school and
during college. She has a mathematics degree from California State
University, Bakersfield, CA., which included updated training in reform
curriculum in mathematics. Her real-world experience, teaching experience,
and updated training made her an ideal candidate for coding the 1989 and
1995 curriculum using the evaluative instrument Mathematics Materials
Reproduced with permission of the copyright owner. Further reproduction prohibited without permission.

88
Analysis Instrument (MMAD. She also searched sorted word lists and
compiled topical or categorical word lists for both years, and compiled data
for the 1989 curriculum on the data collection worksheet.
The 1989 and 1995 curricula were then assigned quantitative coding
values by the researcher and the secondary mathematics teacher previously
described, using the validated Mathematics Materials Analysis Instrument
(MMAD and supplementary attachments (see Appendixes A-E). This
provided two human coders (Coder 1 and Coder 2) as well as computer
coding (Coder 3). "Classification by multiple human coders permits the
quantitative assessment of achieved reliability. Classification by computer,
however, leads to perfect coder reliability” (Weber, 1980, p. 15). The
researcher then began the computerization process of coding.
Data Computerization Process
Classical content analysis consists of several basic steps. Weber
(1990) lists these steps as (a) defining recording units, (b) defining the
categories, (c) test coding on a sample of text, (d) assessing accuracy and
reliability, (e) revising coding rules if necessary, (f) return to step d until
Reproduced with permission of the copyright owner. Further reproduction prohibited without permission.

89
reliability is achieved, (g) coding all the text, (h) assessing achieved
reliability and accuracy, and reexamining subtle meanings.
The recording unit or "unit of analysis (for example, sentences or
paragraphs) has to be determined and a precise coding strategy has to be
constructed" (Seidel & Kelle, 1995, p. 53). Text units can be defined in
several ways. Weber (1990) lists six commonly used options: word, word
sense, sentence, theme, paragraph, and whole text.
The size of a single text unit for this study varied from a sentence to
several paragraphs depending on theme or context. For example, the text unit
was often an entire word problem including all questions pertaining to that
word problem. Another text unit would often be an entire page of skill-and-
drill exercises that required the same thought processes. A text unit would
sometimes be a simple one-line definition or sentence that was dissimilar to
surrounding text. The researcher's objective in determining text units was to
isolate meaningful information while minimizing the amount of raw data.
This is considered to be "condensing the information contained in the raw
data to a minimum" (Seidel & Kelle, 1995, p. 53).
In classical content analysis, once the recording units are established
Reproduced with permission of the copyright owner. Further reproduction prohibited without permission.

90
the researcher then assigns codes to text units "in a systematic and consistent
way. . . (that i s) . . . inclusive and exhaustive.. . . A precise coding scheme
is developed before coding starts" (Seidel & Kelle, 1995, p. 54). This is a
deductive process, which fit nicely with this study.
The validated content in the Mathematics Materials Analysis
Instrument (MMAD had been established as a third-order hierarchy of items
and categories. The first order applied to the grade levels of the instrument:
grades 5-8 or grades 9-12. These were assigned nodes 1 and 2. The second
order applied to eight categories A - H for each grade level. These were
assigned nodes with spaces included: 1 1,1 2,1 3,1 4,1 5,1 6 ,1 7,1 8,2 1,
2 2 ,2 3 ,2 4 ,2 5,2 6,2 7, and 2 8. For example, node 2 7 referred to grades
9-12, category G, node 1 4 referred to grades 5-8, category D. The third
order applied to the specific items in each category: there were 3 to 12 items
in the eight categories in grades 5-8, and 6 items in each of the eight
categories in grades 9-12. An example of node assignment for this hierarchy
level were nodes: 1 1 1,1 1 2,1 1 3,1 1 4,1 1 5,1 1 6,1 1 7,
1 1 8,1 1 9,1 1 10,1 1 11, and 1 1 12 for category A in grades 5-8, and
2 1 1 , 2 1 2 , 2 1 3 , 2 1 4 , 2 1 5 , and 2 1 6 for category A in grades 9-12.
Reproduced with permission of the copyright owner. Further reproduction prohibited without permission.
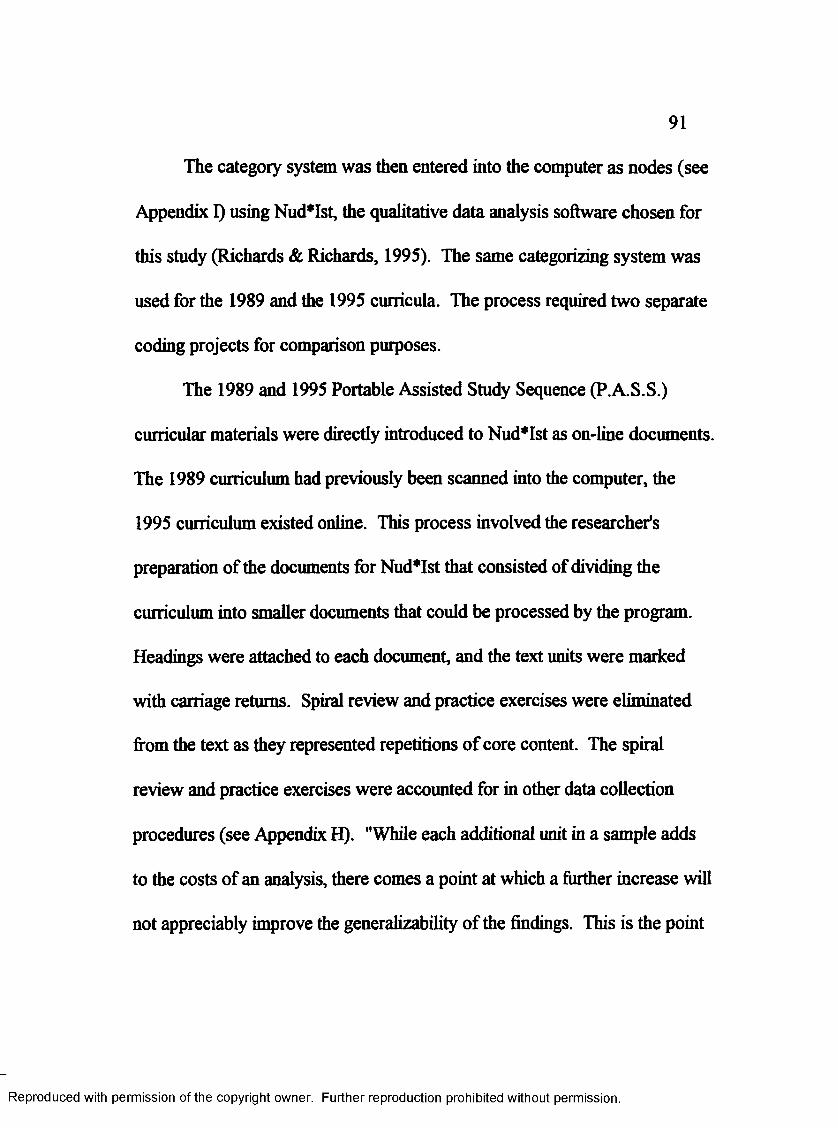
91
The category system was then entered into the computer as nodes (see
Appendix I) using Nud*Ist, the qualitative data analysis software chosen for
this study (Richards & Richards, 1995). The same categorizing system was
used for the 1989 and the 1995 curricula. The process required two separate
coding projects for comparison purposes.
The 1989 and 1995 Portable Assisted Study Sequence (P.A.S.S.)
curricular materials were directly introduced to Nud*Ist as on-line documents.
The 1989 curriculum had previously been scanned into the computer, the
1995 curriculum existed online. This process involved the researcher’s
preparation of the documents for Nud*Ist that consisted of dividing the
curriculum into smaller documents that could be processed by the program.
Headings were attached to each document, and the text units were marked
with carriage returns. Spiral review and practice exercises were eliminated
from the text as they represented repetitions of core content. The spiral
review and practice exercises were accounted for in other data collection
procedures (see Appendix H). "While each additional unit in a sample adds
to the costs of an analysis, there comes a point at which a further increase will
not appreciably improve the generalizability of the findings. This is the point
Reproduced with permission of the copyright owner. Further reproduction prohibited without permission.

92
at which the sample size is most efficient" (KrippendorfF, 1980, p. 69). The
documents were then introduced to Nud*Ist.
The Nud*Ist program was then tested for accuracy and reliability. Test
coding on sample text was performed by the researcher, and no errors were
found. The researcher had previously participated in a 2-day training seminar
in Portland, OR., with Lyn Richards, the co-author of Nud*Ist. This
experience undoubtedly smoothed the process of using the program. Nud*Ist
is also recognized as a reputable software for research (Prein, Kelle, & Bird,
1995; Kelle, 1996) and has eliminated many of the programming bugs.
Text units were then indexed to nodes. "The best practical strategy is
to classify each word, word sense, or phrase in the category where it most
clearly belongs . . . (and). . . each investigator will have to find the resolution
that makes the most sense in light of the goals of the analysis" (Weber, 1990,
p. 36). The researcher looked at every text unit and compared them to
every item on the Mathematics Materials Analysis Instrument (MMAD
(see Appendix A) for grades 5-8 and grades 9-12. The text units were then
indexed to single or multiple nodes. This process lasted several months. It
was performed on the 1989 and 1995 curricula, and coding reliability
Reproduced with permission of the copyright owner. Further reproduction prohibited without permission.

93
depended largely at this point on the researcher's own integrity and
understanding of the materials.
It should be mentioned at this point that a sample of text units were
selected and indexing was discussed with the other coder in this study prior to
computer coding. Agreement was reached as to basic coding strategies, but
there was not a prolonged pilot study. Kelle and Laurie (1995) discuss this
type of coding as referential coding, which in many cases do "not represent
specific, precisely defined facts or incidents, but generally, vaguely defined
topics" (p. 25). Therefore, while consistency of coding is important, "a more
sophisticated investigation of the reliability problem is needed" (p. 25). The
researcher thus decided consistency would be maintained as much as humanly
possible. This consistency would later be measured by checking interrater
reliability between the two human coders who manually coded the curriculum
using MMAI, and the data retrieved from this computer analysis. This is, in
fact, in line with the strategies recommended by Weber (1990) and
Krippendorff (1980). Weber lists the assessment of reliability and accuracy
as the last step of the coding scheme. Krippendorff proposes reliability
should be established through the duplication of efforts. He distinguishes
between three types: stability, reproducibility, and accuracy. Stability can be
Reproduced with permission of the copyright owner. Further reproduction prohibited without permission.

94
established by the repetition of coding by the same coder. Reproducibility
requires more than one coder and is "a minimum standard for content
analysis1' (Weber, 1990, p. 17). Coders must work independently to prevent
agreement through communication as the "lack of independence is likely to
make data appear more reliable than they are" (Krippendorff, 1980, p. 132).
Accuracy is the "strongest reliability test available" (p. 131).
Data Analysis
Content data analysis involves "word-frequency counts, key-word-in-
context listing, concordances, classification of words into content categories,
content category counts, and retrievals based on content categories and co
occurrences" (Weber, 1990, p. 41). Krippendorff (1980) considers
measurement in terms of frequencies to be the most "common form of
representation of data" (p. 109).
Measurement in this study involved calculating percentages and
proportions of text units, word counts, category topics, and other items.
Nud*Ist and human coders provided frequency counts and calculated
percentages. Excel spreadsheet software for Windows was used to calculate
Reproduced with permission of the copyright owner. Further reproduction prohibited without permission.
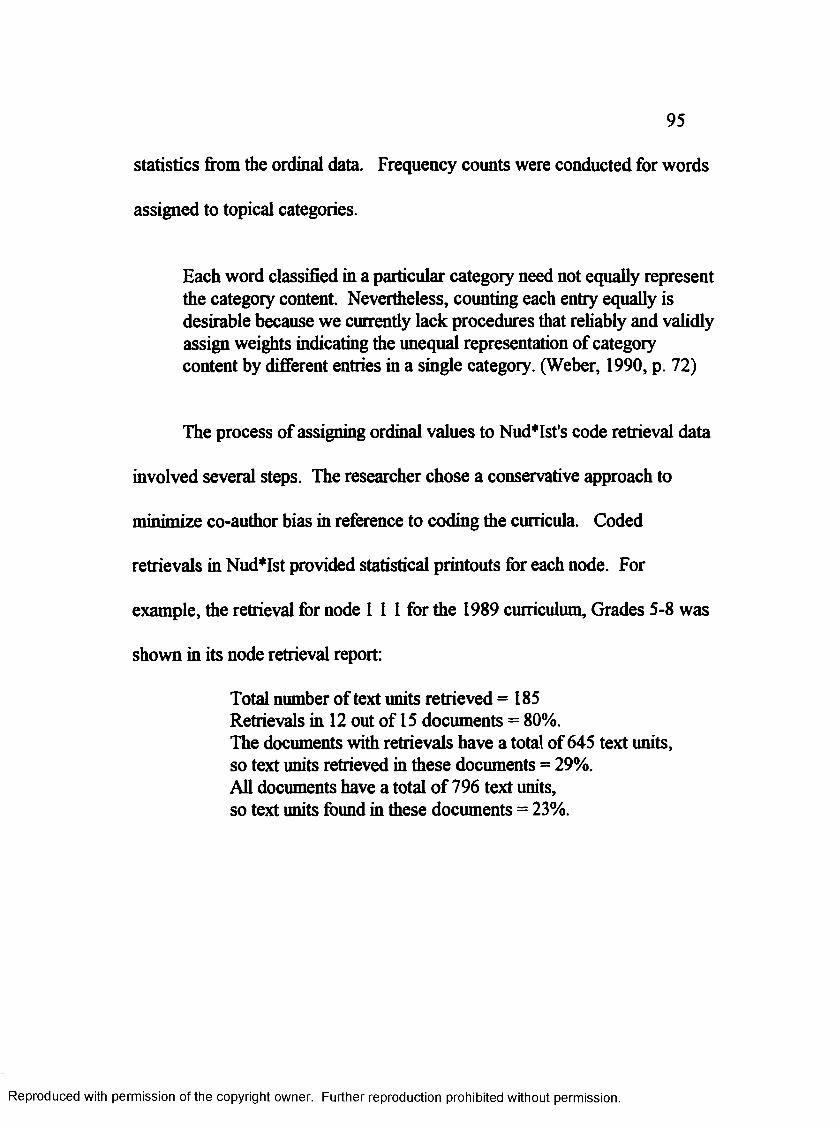
95
statistics from the ordinal data. Frequency counts were conducted for words
assigned to topical categories.
Each word classified in a particular category need not equally represent the category content. Nevertheless, counting each entry equally is desirable because we currently lack procedures that reliably and validly assign weights indicating the unequal representation of category content by different entries in a single category. (Weber, 1990, p. 72)
The process of assigning ordinal values to Nud*Ist's code retrieval data
involved several steps. The researcher chose a conservative approach to
minimize co-author bias in reference to coding the curricula. Coded
retrievals in Nud*Ist provided statistical printouts for each node. For
example, the retrieval for node 1 1 1 for the 1989 curriculum, Grades 5-8 was
shown in its node retrieval report:
Total number of text units retrieved =185 Retrievals in 12 out of 15 documents = 80%.The documents with retrievals have a total of 645 text units, so text units retrieved in these documents = 29%.All documents have a total of 796 text units, so text units found in these documents = 23%.
Reproduced with permission of the copyright owner. Further reproduction prohibited without permission.
96
There were 61 nodes for grades 5-8, and 48 nodes for grades 9-12 for
each of the 1989 and 1995 curriculum. Node retrieval reports were compiled
for each of the nodes, and three distinct percentages were retrieved for each
node report. The first percentage was deemed highly misleading since one
text unit would automatically qualify as retrieval from a document.
Therefore, the second and third percentages were deemed to be the most
useful and were used in the calculations for the mean as a percentage for each
row or item (see Table 1).
The weighted average was then calculated for each category for each
grade level of MMAI. For example, category A for grades 5-8 contained 12
out of 61 items or a weighted average of 19.7%. The weighted averages were
established for each category (see Table 1 and Appendix S). Grades 5-8
had 61 items in 8 categories with 3 to 12 items in each category; thus,
weighted averages varied for each of those categories. Grades 9-12 had
6 out of 48 items in each of 8 categories so the weighted average was 12.5%
for each of those 8 categories.
Reproduced with permission of the copyright owner. Further reproduction prohibited without permission.

97
Table 1
Assignment of Ordinal Values to P. A.S.S. Curricula bv Coder 3 (Nud*Isf) Using the Mathematics Materials Analysis Instrument (MMAD
Node X Y MaOrdinalValue
1995 curriculum, grades 1 00
1 1 1 62.0 59.0 60.5 41 12 20.0 11.0 15.5 21 13 54.0 51.0 52.5 41 14 63.0 56.0 59.5 41 15 31.0 15.0 23.0 31 16 19.0 1.5 10.3 21 17 68.0 47.0 57.5 41 1 8 49.0 46.0 47.5 41 19 44.0 38.0 41.0 41 1 10 74.0 58.0 66.0 41 1 11 44.0 39.0 41.5 41 1 12 46.0 38.0 42.0 4
1 2 1 73.0 73.0 73.0 41 2 2 39.0 36.0 37.5 4123 15.0 6.6 10.8 21 2 4 26.0 16.0 21.0 31 25 50.0 23.0 36.5 41 2 6 31.0 17.0 24.0 31 2 7 25.0 18.0 21.5 3Note. X = % of retrieved text to retrieved documents. Y = % of retrieved
text to all documents. M = (X + Y)/2. “The weighted average for node 1 1 is
19.7% and for node 1 2,11.5%.
Reproduced with permission of the copyright owner. Further reproduction prohibited without permission.
98
The third step in this process involved assigning the weighted averages
to ordinal values on the instrument (MMAI). The evaluative instrument
includes an ordinal value scale that measures the extent of alignment of
content in the curricular materials to content reflecting the NCTM Standards
in the subcategories. The ordinal values are assigned to each subcategory as
follows: 1-None, 2-Low, 3-Moderate, 4-High. As mentioned, a conservative
rating strategy was chosen to alleviate measurable researcher bias. The
ordinal value 1 was assigned to weighted averages between 0% and 1%. The
ordinal value 2 was assigned to weighted averages greater than 1% and less
than the computed weighted average to the next greatest integer, e.g., 19.7%
became 20%. The ordinal value 3 was assigned to the weighted averages
exceeding the previously calculated upper boundary, e.g., 20%, and less than
approximately twice this boundary, e.g., 40%. The ordinal value 4 was
assigned to all weighted average percentages greater than the prior upper
boundary, e.g., 40%. An example of this assignment follows for category A
in grades 5-8 with a computed weighted average of 19.7%. Appendix S
shows the assignment of ordinal values for Coder 3 using this ordinal scale
for the mean percentages (M) for the 1989 and 1995 curricula.
Reproduced with permission of the copyright owner. Further reproduction prohibited without permission.
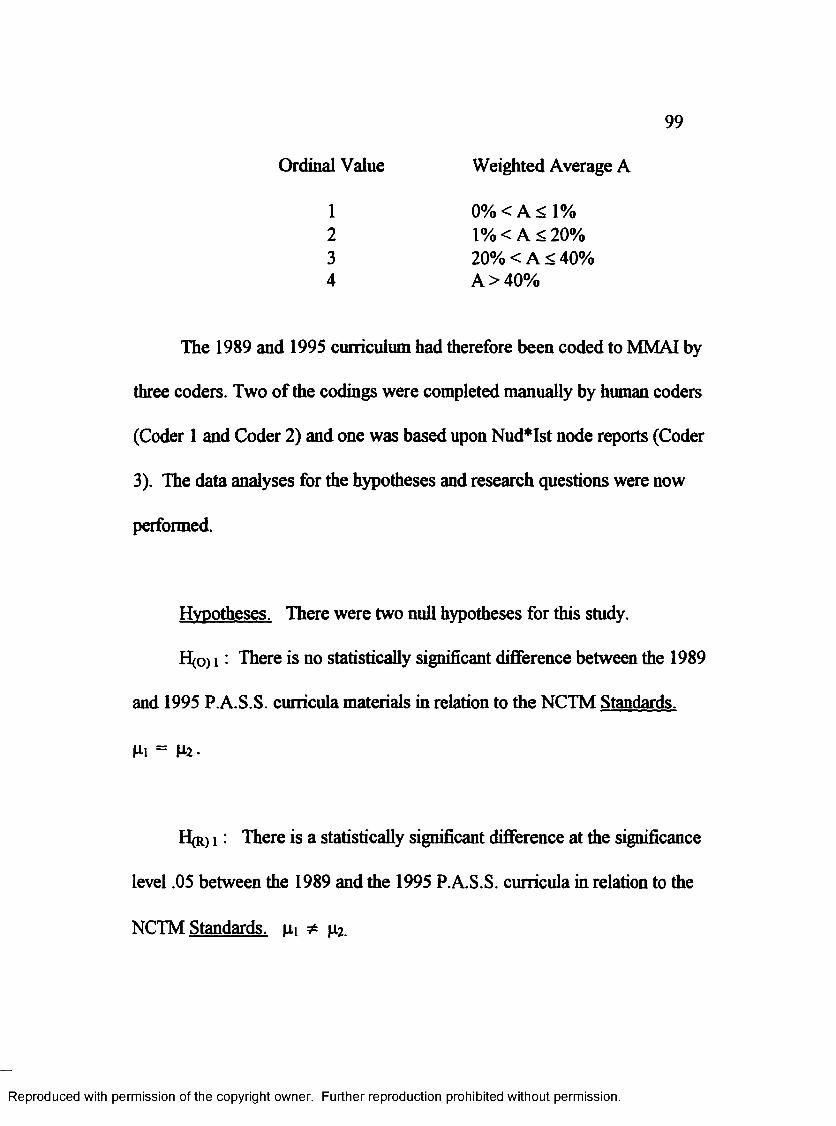
99
Ordinal Value Weighted Average A
1234
0% < A < 1% 1% < A < 20% 20% < A <40% A >40%
The 1989 and 1995 curriculum had therefore been coded to MMAI by
three coders. Two of the codings were completed manually by human coders
(Coder 1 and Coder 2) and one was based upon Nud*Ist node reports (Coder
3). The data analyses for the hypotheses and research questions were now
performed.
Hypotheses. There were two null hypotheses for this study.
H(o) i • There is no statistically significant difference between the 1989
and 1995 P.A.S.S. curricula materials in relation to the NCTM Standards.
H(R) i : There is a statistically significant difference at the significance
level .05 between the 1989 and the 1995 P.A.S.S. curricula in relation to the
NCTM Standards, jxi * p2.
Pi = P2 .
Reproduced with permission of the copyright owner. Further reproduction prohibited without permission.

100
H<o) 2 : There is no statistically significant difference between human
coders and computer coding in relationship to the 1989 and 1995 P.A.S.S.
curricula, pi = P2 = P3-
H(R) 2: There is a statistically significant difference at the .05
significance level between human coders and computer coding in relationship
to the 1989 and 1995 P.A.S.S. curricula, pi * p2 * P3 •
The evaluative instrument designed for this study, Mathematics
Materials Analysis Instrument fMMAD (see Appendix A), includes an
ordinal value scale that measures the extent of alignment of content in the
curricular materials to content reflecting the NCTM Standards in the
subcategories. The ordinal values are assigned to each subcategory as
follows: 1-None, 2-Low, 3-Moderate, 4-High. Supplementary attachments
were included with MMAI to assist the coders in assigning values (see
Appendixes B-E). Nonparametric statistical tests were used to test the data
for these hypotheses.
The first hypothesis was tested with a nonparametric test designed for
Reproduced with permission of the copyright owner. Further reproduction prohibited without permission.

101
ordinal data. Chi-square analysis was used to determine if there were any
significant differences between the frequencies of ordinal value coding and
the 1989 and 1995 curricula.
The second hypothesis was tested with the nonparametric Kruskal-
Wallis H-test for ordinal data. This test was used to determine interrater
reliability between the two human coders and Nud*Ist computer coding.
The mean of ordinal values for each category for each coder was computed
for each grade level 5-8 and 9-12. This was done for the 1989 and 1995
curricula. The H-test was then used to test for significant differences
between the rankings of the category means for each year.
Research Questions. There were two research questions for this
study.
1. To what extent do the 1995 P.A.S.S. curricular materials improve
upon the 1989 P.A.S.S. curricular materials with respect to the Standards
of mathematics education delineated by the National Council of Teachers of
Mathematics?
Reproduced with permission of the copyright owner. Further reproduction prohibited without permission.

102
2. Can a researcher-designed evaluative instrument measure
the extent to which curricular materials meet the NCTM Standards ?
The research questions were answered in multiple ways. Qualitative
analysis allows the researcher to maintain flexibility while considering new
findings and discoveries. Descriptive statistics and narrative descriptions
were used to answer the first research question. This also completed the
triangulation process of analysis for comparing the 1989 and 1995 curricula.
The triangulation in this study consisted of (a) qualitative examination of the
materials, (b) descriptive statistics compiled from manual counts and
observations, and (c) computer analysis using Nud*Ist (Richards & Richards,
1995), a third-generation qualitative data analysis software.
The second research question involved multiple steps of analysis. The
first step involved content validation of the evaluative instrument designed for
this study. This was accomplished through the use of a validation panel.
The second step involved interrater reliability of coding using the validated
instrument. This was accomplished through a pilot study with different
curriculum materials and different coders than were used in this study. This
Reproduced with permission of the copyright owner. Further reproduction prohibited without permission.

pilot study was evaluated through the use of the nonparametric Kruskal-
Wallis statistical test at the .05 level of significance. The third step involved
interrater reliability for three coders who used the validated instrument
MMAI to code the 1989 and 1995 P.A.S.S. curricular materials. The three
coders included two human coders (Coder I and Coder 2) and Nud*Ist
computer coding (Coder 3). Hypothesis 2 refers to this portion of the
analysis.
Reproduced with permission of the copyright owner. Further reproduction prohibited without permission.

CHAPTER 4
Findings
A content analyst is obligated to make everything transparent,. . . at
least for those interested in using the findings, replicating the analysis,
or further developing the techniques.
- K. Krippendorff (1980, p. 180)
This study utilized the methodology of content analysis to analyze the
content o f the 1989 and 1995 Portable Assisted Study Sequence (P.A.S.S.)
mathematics curricular materials in relationship to the goals and spirit of the
National Council of Teachers of Mathematics (NCTM) Curriculum and
Evaluation Standards for School Mathematics (1989). Narrative descriptions
and comparisons, manual data collection and coding, and computer analyses
using Nud*Ist qualitative data analysis software (Richards & Richards, 1995)
have been performed. This combination of analyses has resulted in a concise
and complete analysis of the curricular materials.
An evaluative instrument, Mathematics Materials Analysis Instrument
(MMAD (see Appendix A), to measure the relationship between the
Reproduced with permission of the copyright owner. Further reproduction prohibited without permission.

105
curricular materials and the recommendations made in the NCTM Standards
(1989) was designed for this study. This process included content validation
by an expert panel familiar with and experienced in the vision of the NCTM
Standards. Interrater reliability was established through a pilot study as well
as for this study.
Ordinal data from the 1989 and 1995 curricula were obtained through
coding using the evaluative instrument MMAI. Coding was performed by
three coders (two human coders and Nud*Ist computer coding). These data
were converted to statistical measures of dispersion for analysis.
Content data analysis involves "word-frequency counts, key-word-in-
context listing, concordances, classification of words into content categories,
content category counts, and retrievals based on content categories and co
occurrences" (Weber, 1990, p. 41). Krippendorff (1980) considers
measurement in terms of frequencies to be the most "common form of
representation of data" (p. 109). These types of data were collected through
the use of a data collection worksheet (see Appendix H) and word sort lists
containing frequency counts for each curriculum. These word lists were
manually examined for key-word-in-context listings, classifications of words
Reproduced with permission of the copyright owner. Further reproduction prohibited without permission.

106
into content categories, content category counts, and retrievals based on
content categories and co-occurrences.
The 1989 and 1995 curricula were also examined by comparing titles,
subheadings, sections headings, student directions, and teacher guidelines.
Discoveries made during this process led to further examination of
classifications of words into content categories, content category counts, and
other interpretative analyses.
This chapter is divided into five sections. The first two sections list the
two hypotheses and discuss the findings for each. The next two sections list
the two research questions and discuss the findings for each. The final
section discusses other findings that were discovered in the process of this
qualitative study.
Hypothesized Findines
Null Hypothesis 1
H(0 ) i : There is no statistically significant difference between the 1989
and 1995 P.A.S.S. curricula materials in relation to the NCTM Standards.
M'l = M-2 •
Reproduced with permission of the copyright owner. Further reproduction prohibited without permission.
107
% ) i : There is a statistically significant difference at the significance
level .05 between the 1989 and the 1995 P.A.S.S. curricula in relation to the
NCTM Standards, pi * p2.
One of the most commonly used nonparametric methods for testing
ordinal data is the chi-square test (Borg & Gall, 1989; Vaillant & VaiUant,
1985). Chi-square analysis was used in this study to determine if there were
any significant differences between the frequencies of ordinal value coding
using Mathematics Materials Analysis Instrument (MMAD on the 1989 and
1995 curricula. Table 2 shows the data and findings for these computations.
The coded values for each of the three coders were tallied for the 1989 and
1995 curricula for each grade level 5-8 and 9-12. The total frequencies for
each coder were inserted in 4x2 contingency tables. Expected values were
also calculated in 4x2 contingency tables. The null hypothesis was rejected at
both grade levels. This was interpreted as there is a statistically significant
difference between the 1989 and the 1995 P.A.S.S. curricula in relation to the
NCTM Standards.
Reproduced with permission of the copyright owner. Further reproduction prohibited without permission.

108
Table 2
Chi-square Analysis of Observed and Expected Coding Values Using
Mathematics Materials Analysis Instrument (MMAD on P.A.S.S. Curricula
CodingValue
Observed 1989 1995
Exnected 1989 1995
Grades 5-8
1 63 2 32.5 32.52 65 35 50.0 50.03 40 77 58.5 58.54 15 69 42.0 42.0
X2= 112.66 a = .05 df=3
Grades 9-12
1 73 17 45 452 42 25 33.5 33.53 20 56 38 384 9 46 27.5 27.5
X2 = 81.1 a = .05 df=3
Reproduced with permission of the copyright owner. Further reproduction prohibited without permission.

109
Null Hypothesis 2
H(0 )2 : There is no statistically significant difference between human
coders and computer coding in relationship to the 1989 and 1995 P.A.S.S.
curricula, pi = P2 = M-3 •
H(R) 2 : There is a statistically significant difference at the .05
significance level between human coders and computer coding in relationship
to the 1989 and 1995 P.A.S.S. curricula, pi * \x.z *= p.3 .
Interrater reliability in this study was defined as the extent to which
similar ordinal values were assigned by various coders at separate locations
using the evaluative instrument Mathematics Materials Analysis Instrument
(MMAD (see Appendix A). This involved testing to see if there were
significant differences in the coding assigned by two human coders (Coder 1
and Coder 2) and Nud*Ist computer coding (Coder 3) using Mathematics
Materials Analysis Instrument (MMAD on the 1989 and 1995 P.A.S.S.
curricula. The nonparametric Kruskal-Wallis H-test was chosen to test for
these differences. The means of ordinal values assigned by each coder were
Reproduced with permission of the copyright owner. Further reproduction prohibited without permission.

110
computed and ranked for the 1989 and 1995 curricula at each grade level 5-8
and 9-12. The H-test was then performed for each curriculum at each grade
level, and no significant differences were found in any of the tests. Therefore,
the null hypotheses were retained for both years and both grade levels. This
was interpreted to establish interrater reliability between the coders using
MMAI on the P.A.S.S. curricula in this study. These computations are
shown in Tables 3-4.
Unhvpothesized Findings
Research Question 1
To what extent do the 1995 P.A.S.S. curricular materials improve upon
the 1989 P.A.S.S. curricular materials with respect to the Standards of
mathematics education delineated by the National Council of Teachers
of Mathematics?
NCTM Standards are based upon the belief that all students should
learn more (and different) content than is contained in traditional programs,
and new teaching strategies need to be introduced. The thinking processes of
Reproduced with permission of the copyright owner. Further reproduction prohibited without permission.
Ill
problem solving, communication, reasoning, and connections are emphasized
at all levels. The Standards assert that the educational system must meet new
social goals. These are defined as providing for society mathematically
literate workers, lifelong learning, opportunity for all, and an informed
electorate. Students must learn to value mathematics, become confident in
their mathematical abilities, become mathematical problem solvers, learn to
communicate mathematically, and leam to reason mathematically (p. 5).
The Standards emphasize the need to "do" rather than "know" (1989, p. 7).
Interdisciplinary curriculum must be included to supplement and replace
portions of traditional engineering and physical science applications.
Technology must be included and updated to reflect the nature of
mathematics. The curriculum must be available to all students if "they are to
be productive citizens in the twenty-first century" (p. 9). Students must
participate in activities that model genuine problems, and be encouraged to
experiment, discuss, and discover ideas and concepts.
The researcher began the analysis for this question with an examination
of unit titles, which offered a cursory overview of contents in the 1989 and
1995 curricula. Table 5 lists the unit titles for each curriculum. Tables of
Reproduced with permission of the copyright owner. Further reproduction prohibited without permission.

Table 3
Kruskal-Wallis H-test to Establish Interrater Reliability Between Coders Using the Mathematics Materials Analysis Instrument (MMAD on 1989 Curriculum
MMAICategory
Coder 1 Rank Coder 2 Rank Coder 3 Rank
Grades 5-8
A 2.08 11.5 2.08 11.5 2.17 13.0B 1.71 4.5 1.86 6.5 1.86 6.5C 2.25 16.0 2.25 16.0 2.25 16.0D 2.44 20.0 2.22 14.0 2.56 21.0E 2.40 19.0 2.60 22.5 2.60 22.5F 1.71 4.5 2.00 9.0 2.29 18.0G 1.00 2.0 1.00 2.0 1.00 2.0H 2.00 9.0 2.00 9.0 3.33 24.0
Ni = 8 N 2= 8 N 3 = 8Rsum= 86.5 Rsum = 90.5 Ram, = 123
H = 2.004 a = .05
table continued
Reproduced with permission of the copyright owner. Further reproduction prohibited without permission.

113
MMAICategory
Coder 1 Rank Coder 2 Rank Coder 3 Rank
Grades 9-12
A 1.83 13.0 2.17 22.0 2.33 24.0B 1.67 9.0 2.00 18.0 1.83 13.0C 2.00 18.0 2.00 18.0 1.50 6.5D 1.83 13.0 1.83 13.0 2.17 22.0E 1.33 5.0 1.17 4.0 1.50 6.5F 1.67 9.0 1.83 13.0 2.17 22.0G 1.00 2.0 1.00 2.0 1.00 2.0H 2.00 18.0 1.67 9.0 2.00 18.0
H = 0.915
Ni = 8
a = .05Rsum 00
<
II 00
Rsum = 99N3 = 8
Rsum= 114
Reproduced with permission of the copyright owner. Further reproduction prohibited without permission.

114Table 4
Kruskal-Wallis H-test to Establish Interrater Reliability Between Coders Using the Mathematics Materials Analysis Instrument (MMAD on 1995 Curriculum
Category Coder 1 Rank Coder 2 Rank Coder 3 Rank
Grades 5-8
A 3.42 17.0 3.25 11.5 3.58 22.0B 3.14 8.5 3.57 20.0 3.29 13.0C 3.75 23.0 3.25 11.5 3.50 19.0D 2.78 4.0 2.44 2.0 2.56 3.0E 3.40 16.0 3.20 10.0 3.30 14.0F 3.43 18.0 3.14 8.5 3.57 20.5G 2.22 1.0 3.00 6.5 2.89 5.0H 3.33 15.0 3.00 6.5 4.00 24.0
2! ll 00 n 00 ll 00Rsum- 102..5 Rsum = 77 Rsum = 120.5
H = 2.389 a = .05
Grades 9-12Category Coder IRank Coder 2 Rank Coder 3 Rank
A 3.17 21.0 3.00 17.0 3.83 24.0B 3.00 17.0 3.00 17.0 3.00 17.0C 2.33 1.5 2.50 3.5 2.83 10.5D 2.83 10.5 3.00 17.0 3.00 17.0E 3.50 22.0 2.50 3.5 3.67 23.0F 2.33 1.5 2.67 6.0 2.67 6.0G 2.83 10.5 2.83 10.5 3.00 17.0H 2.83 10.5 2.67 6.0 2.83 10.5
Ni = 8 N2= 8 N 3 = 8Rsum =94.5 Rsum = 80.5 Rsum =125
H - 2.589 a = .05
Reproduced with permission of the copyright owner. Further reproduction prohibited without permission.

115
contents for each unit were also examined (see Appendixes M-N). The 1995
curriculum titles clearly indicate a broader range of content and an implied
potential for greater opportunities to engage higher-level thinking skills than
are represented by the 1989 curriculum titles. The titles for the 1995
curriculum are, in fact, 10 of the curriculum standards (NCTM, 1989,
pp. 65, 123) The 13 curriculum standards for grades 5-8 are problem
solving, communication, reasoning, mathematical connections, number and
number relationships, number systems and number theory, computation and
estimation, patterns and functions, algebra, statistics, probability, geometry,
and measurement. The 14 curriculum standards for grades 9-12 are problem
solving, communication, reasoning, mathematical connections, algebra,
functions, geometry from a synthetic perspective, geometry from an algebraic
perspective, trigonometry, statistics, probability, discrete mathematics,
conceptual underpinnings of calculus, and mathematical structure.
The tables of contents for all units in both courses were also examined.
This examination further supported the researcher's viewpoint that the 1995
Reproduced with permission of the copyright owner. Further reproduction prohibited without permission.

116
curriculum was more aligned to the Standards than the 1989 curriculum (see
Appendixes M-N).
Descriptive statistics were used to explore the curricula in more detail.
Data were obtained from data collection worksheets (see Appendix H) and
from coding values obtained in the use of the evaluative instrument designed
for this study, Mathematics Materials Analysis Instrument (MMAD (see
Appendix A). This instrument includes an ordinal value scale that
measures the extent of alignment of content in the curricular materials to
content reflecting the NCTM Standards in the subcategories. The ordinal
values are assigned to each subcategory as follows: 1-None, 2-Low, 3-
Moderate, 4-High. Three coders assigned values on MMAI to the 1989 and
1995 P.A.S.S. curricula. This included two human coders (Coder 1 and
Coder 2) and the Nud*Ist computer coding (Coder 3). Supplementary
attachments were included with MMAI to assist the coders in assigning
values (see Appendixes B-E).
Krippendorff (1980) states "the most common form of representing
data is in terms of relations between variables" (p. 111). The mean of ordinal
values, group mean, and standard deviation for each category for each coder
Reproduced with permission of the copyright owner. Further reproduction prohibited without permission.
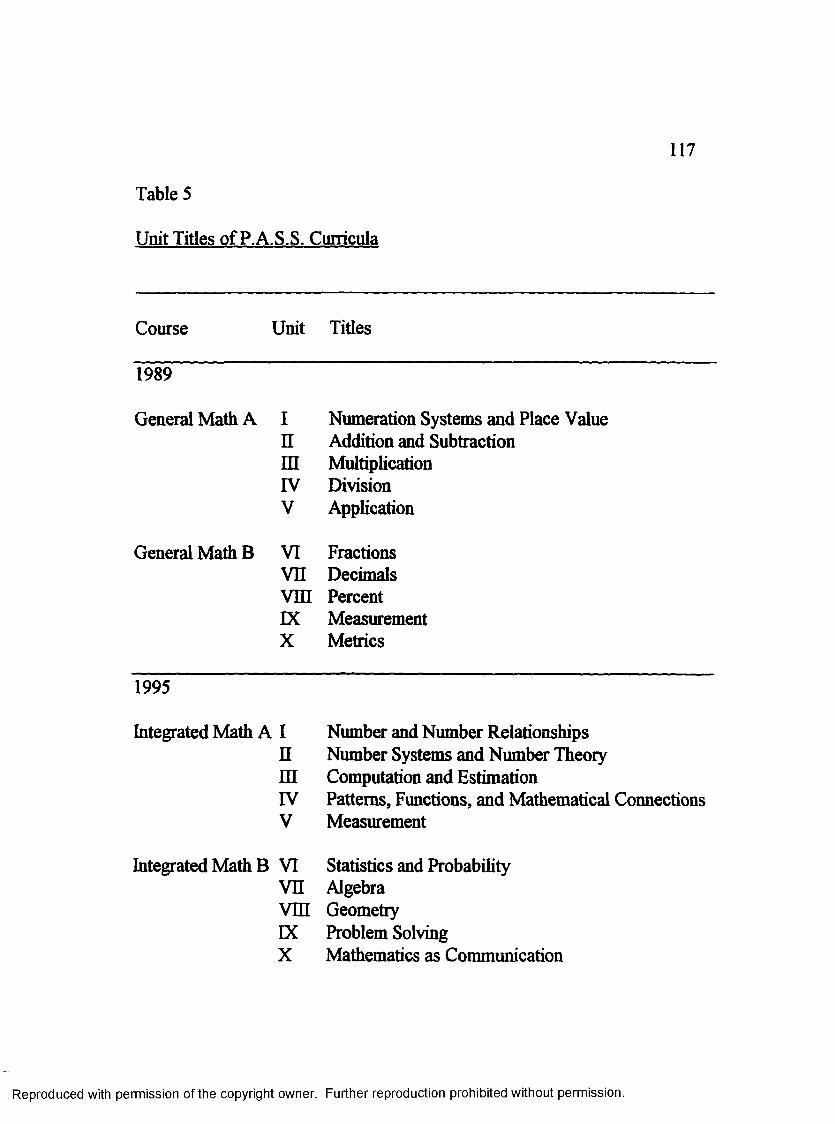
117
Table 5
Unit Titles of P.A.S.S. Curricula
Course Unit Titles
1989
General Math A I Numeration Systems and Place Valuen Addition and Subtractionin Multiplicationrv DivisionV Application
General Math B VI Fractionsvn Decimalsvm PercentDC MeasurementX Metrics
1995
Integrated Math A I Number and Number Relationshipsn Number Systems and Number Theorym Computation and EstimationIV Patterns, Functions, and Mathematical ConnectionsV Measurement
Integrated Math B VI Statistics and Probabilityvn Algebravm GeometryDC Problem SolvingX Mathematics as Communication
Reproduced with permission of the copyright owner. Further reproduction prohibited without permission.

118
were computed for grade levels 5-8 and 9-12. This was done for the 1989
and 1995 curricula. The median, mean, group mean, and standard deviation
were also computed for each coder. Tables 6-7 present the central measures
of tendency for the assigned coding values for the 1989 and 1995 curricula.
The 1989 data in Table 6 clearly show the mean and median measures
centering around or below 2.0 with small standard deviations (with one
exception). This indicates the coders agreed that the 1989 curriculum
represented low levels of content relating to the NCTM Standards.
Category H in grades 5-8 has an exceptionally high standard deviation of 0.77
compared to the other categories. Closer examination shows a higher rating
by Nud*Ist that clearly affected this standard deviation. This proved to be
true for most categories in both grade levels. This is not surprising because
the computer does not forget data and the assignment of ordinal values
depended upon memory. Human coders are more likely to forget specific
details and therefore assign lower ordinal values on MMAI. At any rate, the
group standard deviation remained small showing agreement between the
three coders.
Reproduced with permission of the copyright owner. Further reproduction prohibited without permission.
119
The 1995 data in Table 7 clearly show the mean and median measures
centering around or above 3.0 with small standard deviations (with several
exceptions). This indicates the coders agreed that the 1995 curriculum
represented moderate levels of content relating to the NCTM Standards.
Categories G and H in grades 5-8 have standard deviations of 0.42 and 0.51,
and categories A and £ have standard deviations of 0.44 and 0.63. These
measurements are a little higher than the other standard deviations. Closer
examination again shows a higher rating by Nud*Ist that clearly affected
these standard deviations. Again, this seems to indicate the computer coding
isolated more applicable text units than the human coders were able to
observe and remember.
Figures 1-2 demonstrate the distributions of the group means data in
Tables 6-7. The scatterplot in Figure 1 compares the distributions of the
group means for grade level 5-8 for the 1989 and the 1995 curricula. The
scatterplot in Figure 2 compares the distributions for grade level 9-12 for the
1989 and the 1995 curricula. The graphs confirm the interpretations made
from the dispersion measurements. The distributions are fairly consistent and
Reproduced with permission of the copyright owner. Further reproduction prohibited without permission.
120
the scatterplots depict the higher ratings for the 1995 curriculum in grades 5-8
and 9-12.
Content analysis involves "word-frequency counts, key-word-in-
context listing, concordances, classification of words into content categories,
content category counts, and retrievals based on content categories and co
occurrences'' (Weber, 1990, p. 41). Krippendorff (1980) considers
measurement in terms of frequencies to be the most "common form of
representation of data" (p. 109).
The completed data collection worksheets (see Appendix H) provided
frequency counts for various categories. Three major categories chosen for
analysis in this study were word problems, skill and drill problems, and
projects and investigations. The category for skill and drill problems was
chosen as highly representative of problems found in traditional mathematics
courses. The category for word problems was chosen as representative of
problems found in both traditional and integrated courses. The category for
projects and investigations was chosen as indicative of problems requiring
the higher order thinking processes envisioned in the NCTM Standards.
Projects and investigations were combined into one category because they
Reproduced with permission of the copyright owner. Further reproduction prohibited without permission.

121
Table 6
Measures o f Dispersion for Coding Values on MMAI for 1989 P.A.S.S. Curriculum
MMAI Category
Coder 1 Coder 2 Coder 3
Mean Mean MeanGroup
MeanStandardDeviation
Grades 5-8
A 2.08 2.08 2.17 2.11 0.05B 1.71 1.86 1.86 1.81 0.09C 2.25 2.25 2.25 2.25 0.00D 2.44 2.22 2.56 2.41 0.17E 2.40 2.60 2.60 2.53 0.12F 1.71 2.00 2.29 2.00 0.29G 1.00 1.00 1.00 1.00 0.00H 2.00 2.00 3.33 2.44 0.77
Median 2.08 2.08 2.25 2.11Mean 1.95 2.00 2.26 2.07 0.17Standard Deviation 0.47 0.46 0.67 0.50
Coder 1 Coder 2 Coder 3Group Standard
MMAI Category Mean Mean Mean Mean Deviation
Grades 9-12
A 1.83 2.17 2.33 2.11 0.26B 1.67 2.00 1.83 1.83 0.17C 2.00 2.00 1.5 1.83 0.29D 1.83 1.83 2.17 1.94 0.20E 1.33 1.17 1.5 1.33 0.17F 1.67 1.83 2.17 1.89 0.26G 1.00 1.00 1.00 1.00 0.00H 2.00 1.67 2.00 1.89 0.19
MedianMeanStandard Deviation
1.671.67 0.35
1.831.710.42
1.831.810.45
1.831.730.37
0.08
Reproduced with permission of the copyright owner. Further reproduction prohibited without permission.

122
Table 7
Measures of Dispersion for Coding Values on MMAI for 1995 P.A.S.S. Curriculum
Coder 1 Coder 2 Coder 3
MMAI Category Mean Mean MeanGroupMean
StandardDeviation
Grades 5-8
A 3.42 3.25 3.58 3.42 0.17B 3.14 3.57 3.29 3.33 0.22C 3.75 3.25 3.50 3.50 0.25D 2.78 2.44 2.56 2.59 0.17E 3.40 3.20 3.30 3.30 0.10F 3.43 3.14 3.57 3.38 0.22G 2.22 3.00 2.89 2.70 0.42H 3.33 3.00 4.00 3.44 0.51
Median 3.37 3.17 3.40 3.36Mean 3.15 3.09 3.30 3.18 0.11Standard Deviation 0.51 0.34 0.47 0.37
table continued
Reproduced with permission of the copyright owner. Further reproduction prohibited without permission.

123
Coder 1 Coder 2 Coder 3
MMAI Category Mean Mean MeanGroupMean
StandardDeviation
Grades 9-12
A 3.17 3.00 3.83 3.33 0.44B 3.00 3.00 3.00 3.00 0.00C 2.33 2.50 2.83 2.55 0.25D 2.83 3.00 3.00 2.94 0.10E 3.50 2.50 3.67 3.22 0.63F 2.33 2.67 2.67 2.56 0.20G 2.83 2.83 3.00 2.89 0.10H 2.83 2.67 2.83 2.78 0.09
Median 2.83 2.75 3.00 2.92Mean 2.81 2.74 3.00 2.85 0.14Standard Deviation 0.40 0.21 0.32 0.24
Reproduced with permission of the copyright owner. Further reproduction prohibited without permission.

124
nw£S 2 2 *I *
f t . ■ ' ■ -S " p^s'^. ■'<'■* mvtw^ b 3 8 f ..i '.- 'a s ,' ■* - ^ i , ' . ~ f t s■:<<::i:v±y.:->yy.<k<-
■♦
■
,#•♦.
• 1989 ■ 1995
Categories A-H
Figure 1: Distributions of coded values for grades 5-8 of P.A.S.S. curricula
mmmmm
Mmmsm jftts • 1989 ■ 1995
Categories A-H
Figure 2; Distributions of coded values for grades 9-12 of P.A.S.S. curricula
Reproduced with permission of the copyright owner. Further reproduction prohibited without permission.

125
had similar requirements relating to time frames and critical thinking
processes. Examples are shown in Appendixes K-L, R, and U.
The data from the data collection worksheets were analyzed and
computed as percentages of the total number of problems (see Table 8). The
1989 curriculum showed nearly all (86%) of its problems emphasized skill
and drill exercises. There were no projects or investigations, and only 14%
of the problems were considered to be word problems. The 1995 curriculum
showed nearly two thirds (64%) of its problems emphasized skill and drill
exercises. Projects, investigations, and word problems comprised the
remaining one third (36%) of its contents. These percentages were
interpreted as showing that the 1989 curriculum was largely traditional, and
the 1995 curriculum more adequately reflected recommendations from the
Standards. Figures 3-4 graphically depict this information. Figure 4
combines the data for the word problem and projects and investigations
categories as representative of types of problems recommended by NCTM.
Reproduced with permission of the copyright owner. Further reproduction prohibited without permission.

126
Table 8
Frequency Counts and Percentages of Types of Problems for P.A.S.S. Curricula
Word Skill and Drill Projects andYear Problems Problems Investigations
1989 609 3866 -
1995 430 1124 195As a percent of total problems
1989 14% 86%
1995 25% 64% 11%
The 1989 and 1995 curricula were examined for major content areas.
Three major conceptual sections were found in both curricula: spiral review
exercises, core content, and practice exercises. Core content was defined for
this study as relating to new ideas and problems exclusive to each of the
20 units in the two courses. In addition, the 1989 curriculum included a
glossary for each of its 10 units in the course. The number of pages in each
category were then counted and entered on the data collection worksheets.
Reproduced with permission of the copyright owner. Further reproduction prohibited without permission.

127
m
12 £
100 80 60 - 40 • - 20 0
v< iZ iSC.Sif'fcv x> Af / Av"-’V ' "fe * ■’SwEjV'*-✓ ✓ ^ '■■5-
Word Robtenv Ski and Dr* FTojects & hvestigations
■ 1989■ 1995
Figure 3: Comparisons of types of problems in P.A.S.S.curricula.
f &?&>'&*& -
' ' 'aiKBSi
yXvIS?WS¥:l i i l
x-ivx:
1196911995
TradUonal NCTM-probtema reconm nded
probleim
Fioure 4: Comparisons of combined types of problems from Figure 3 in P.A.S.S. curricula
Reproduced with permission of the copyright owner. Further reproduction prohibited without permission.

128
Percentages of total pages were then computed in each category for
each curriculum (see Table 9). There were 842 pages in the 1989 curriculum
and 544 pages in the 1995 curriculum. The pages devoted to core content
represented over one half (59%) of the 1989 curriculum and nearly four fifths
(78%) of the 1995 curriculum. There was very little spiral review in
either curricula with only 1% of the total pages devoted to this type of
exercise in the 1989 curriculum and 9% in the 1995 curriculum. More pages
were devoted to practice exercises in the 1989 curriculum (38%) than in the
1995 curriculum (12%). Upon closer examination, these exercises were
found to be mostly skill and drill exercises that have been discussed and
shown in Figures 3-4. The 1989 curriculum devoted 1% of its pages to a
glossary; the 1995 curriculum did not include a glossary in any of its units. A
graphical depiction of these percentages is shown in Figure 5.
The 1989 and 1995 curricula, excluding spiral review and practice
exercises, existed as on-line documents from the computer content analysis
using Nud*Ist. A computer programmer was employed to compile a sorted
Reproduced with permission of the copyright owner. Further reproduction prohibited without permission.

129
Table 9
Number of Pages and Percentages of Maior Sections in P.A.S.S. Curricula
YearSpiral
ReviewCoreContent
PracticeExercises Glossary
1989 11 500 321 10
1995 51 427 66 0
As a percent of total pages
1989 1% 59% 38% 1%
1995 9% 78% 12% 0%
Spiral Core ftactice GlossaryReview Exercises
Figure 5: Comparisons of major sections of P.A.S.S. curricula
Reproduced with permission of the copyright owner. Further reproduction prohibited without permission.
130
word list with frequency counts from these documents. No words were
eliminated from the list. The 1989 word list contained 57,416 words; the
1995 word list contained 64,691 words. This similarity made an interesting
observation because there were 842 pages in the 1989 curriculum and 544
pages in the 1995 curriculum. This seemed to support the previous findings
relative to the preponderance of skill-and-drill exercises in the 1989
curriculum, which were numeral in nature rather than verbal.
The word lists were then sorted manually by the female assistant into
selected categories that seemed relevant to traditional curriculum as well as
curriculum recommended by NCTM Standards. The researcher and assistant
discussed the types of words to be included for each category. The assistant
then compiled the word lists with each relevant word treated as mutually
exclusive, i.e., assigned to only one category. The selected categories were
"traditional," "application," "reflective," and "technology." Table 10 shows
the breakdowns for these categories.
Reproduced with permission of the copyright owner. Further reproduction prohibited without permission.
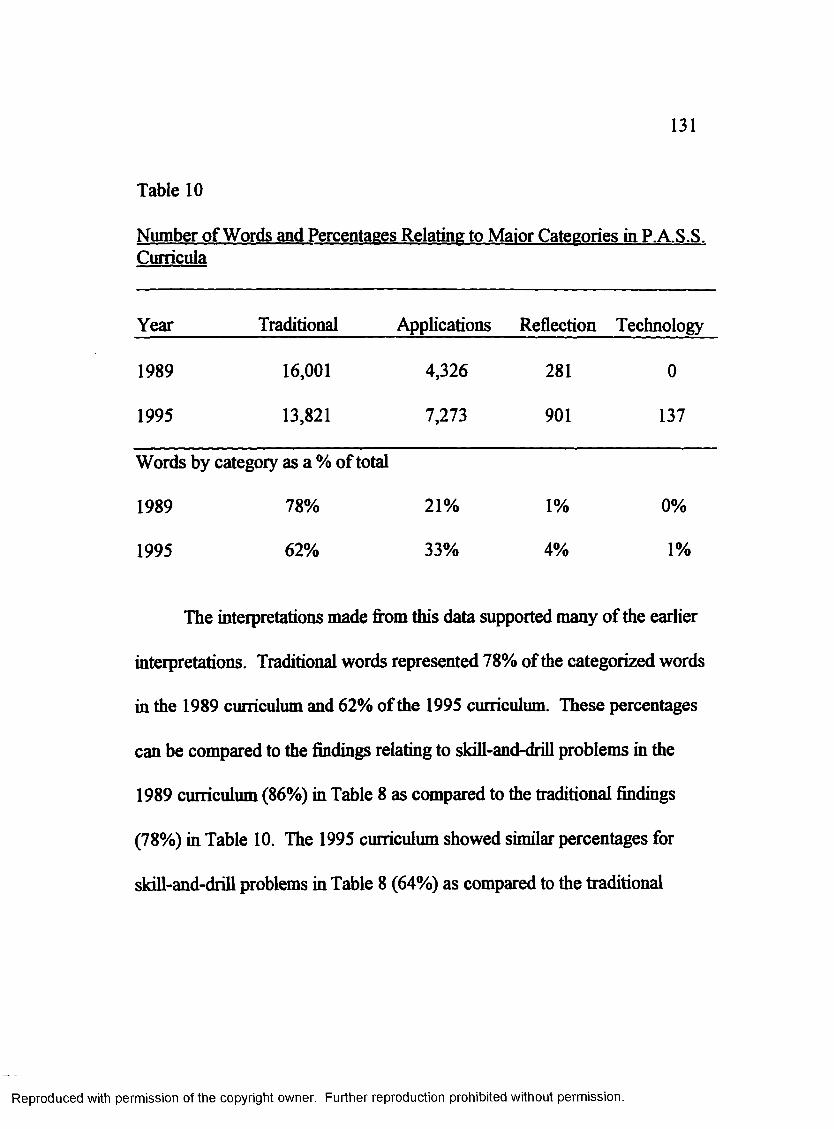
131
Table 10
Curricula
Year Traditional Applications Reflection Technology
1989 16,001 4,326 281 0
1995 13,821 7,273 901 137
Words by category as a % of total
1989 78% 21% 1% 0%
1995 62% 33% 4% 1%
The interpretations made from this data supported many of the earlier
interpretations. Traditional words represented 78% of the categorized words
in the 1989 curriculum and 62% of the 1995 curriculum. These percentages
can be compared to the findings relating to skill-and-drill problems in the
1989 curriculum (86%) in Table 8 as compared to the traditional findings
(78%) in Table 10. The 1995 curriculum showed similar percentages for
skill-and-drill problems in Table 8 (64%) as compared to the traditional
Reproduced with permission of the copyright owner. Further reproduction prohibited without permission.
132
findings (62%) in Table 10. This manual observation therefore supports the
computer data.
Similar relationships existed for the other categories. Table 10 shows
22% of the categorized words in the 1989 curriculum represent the
application category (21%) and the reflection category (1%). This compares
to the 1995 curriculum where 37% of the categorized words represent the
application category (33%) and the reflection category (4%). These
percentages can be compared to the findings in Table 8 where the 1989
curriculum showed word problems, and projects and investigations (14%)
as compared to the application and reflection categories (22%) in Table 10.
Similarly, the 1995 curriculum showed word problems, and projects and
investigations (36%) as compared to the application and reflection categories
(37%) in Table 10. This manual observation again supports the computer
data. The findings for Table 10 were interpreted for this study as further
validating the 1995 curriculum's movement toward NCTM Standards
recommendations in relationship to the 1989 curriculum.
The low percentages reflected in the technology category stood out to
this researcher as understated for the 1995 curriculum. Many problems in the
Reproduced with permission of the copyright owner. Further reproduction prohibited without permission.
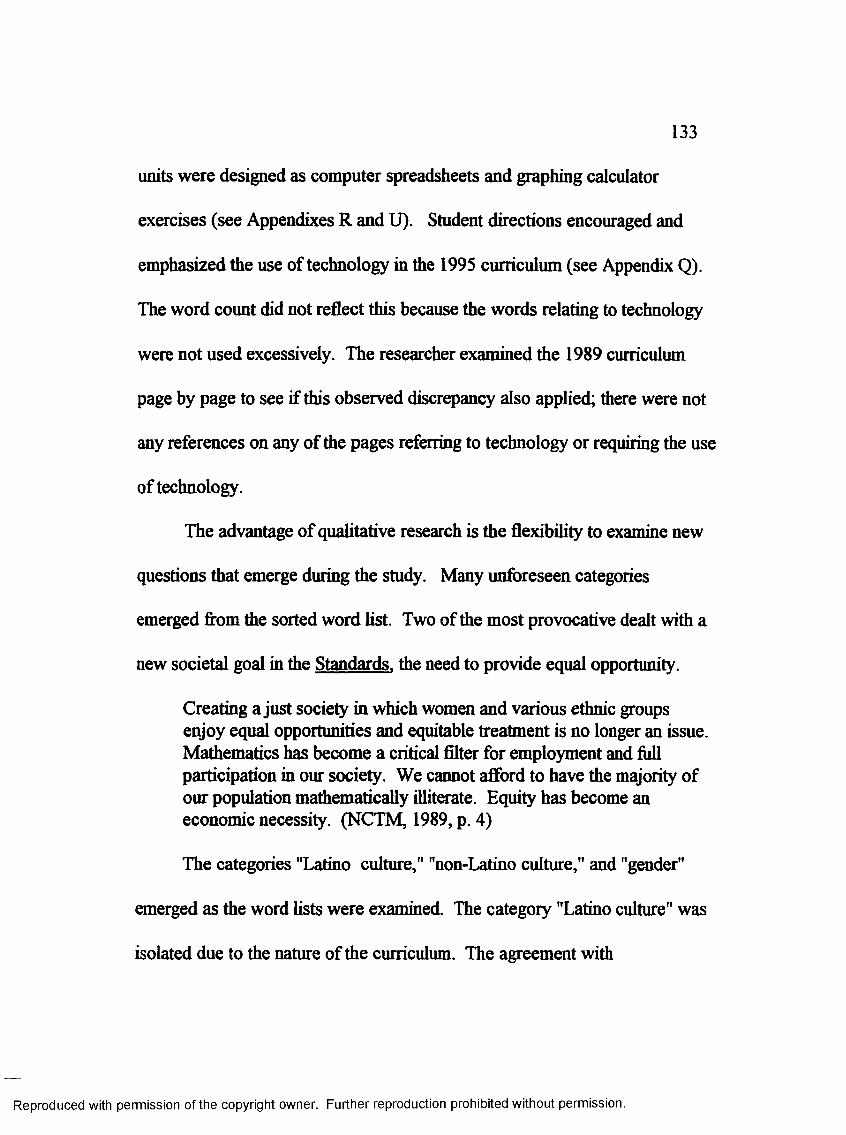
133
units were designed as computer spreadsheets and graphing calculator
exercises (see Appendixes R and U). Student directions encouraged and
emphasized the use of technology in the 1995 curriculum (see Appendix Q).
The word count did not reflect this because the words relating to technology
were not used excessively. The researcher examined the 1989 curriculum
page by page to see if this observed discrepancy also applied; there were not
any references on any of the pages referring to technology or requiring the use
of technology.
The advantage of qualitative research is the flexibility to examine new
questions that emerge during the study. Many unforeseen categories
emerged from the sorted word list. Two of the most provocative dealt with a
new societal goal in the Standards, the need to provide equal opportunity.
Creating a just society in which women and various ethnic groups enjoy equal opportunities and equitable treatment is no longer an issue. Mathematics has become a critical filter for employment and full participation in our society. We cannot afford to have the majority of our population mathematically illiterate. Equity has become an economic necessity. (NCTM, 1989, p. 4)
The categories "Latino culture," "non-Latino culture," and "gender"
emerged as the word lists were examined. The category "Latino culture" was
isolated due to the nature of the curriculum. The agreement with
Reproduced with permission of the copyright owner. Further reproduction prohibited without permission.
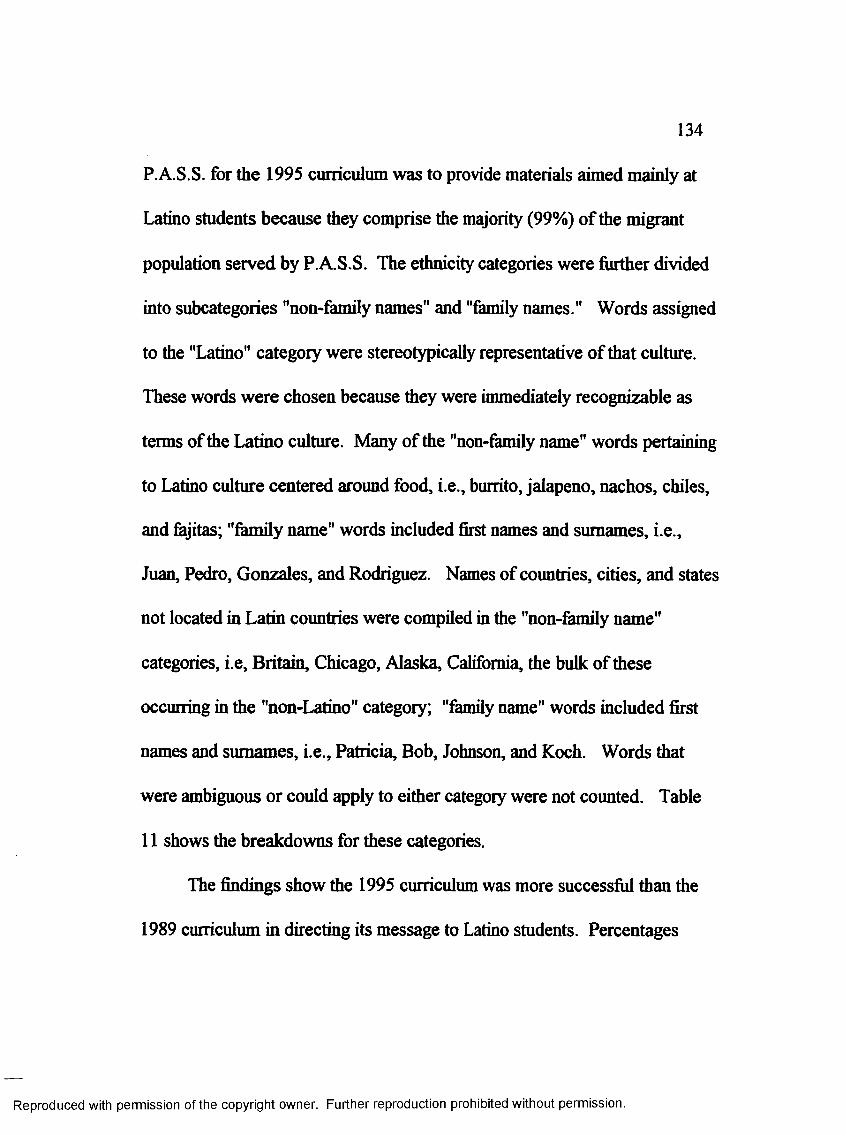
134
P.A.S.S. for the 1995 curriculum was to provide materials aimed mainly at
Latino students because they comprise the majority (99%) of the migrant
population served by P.A.S.S. The ethnicity categories were further divided
into subcategories "non-family names" and "family names." Words assigned
to the "Latino" category were stereotypically representative of that culture.
These words were chosen because they were immediately recognizable as
terms of the Latino culture. Many of the "non-family name" words pertaining
to Latino culture centered around food, i.e., burrito, jalapeno, nachos, chiles,
and fajitas; "family name" words included first names and surnames, i.e.,
Juan, Pedro, Gonzales, and Rodriguez. Names of countries, cities, and states
not located in Latin countries were compiled in the "non-family name"
categories, i.e, Britain, Chicago, Alaska, California, the bulk of these
occurring in the "non-Latino" category; "family name" words included first
names and surnames, i.e., Patricia, Bob, Johnson, and Koch. Words that
were ambiguous or could apply to either category were not counted. Table
11 shows the breakdowns for these categories.
The findings show the 1995 curriculum was more successful than the
1989 curriculum in directing its message to Latino students. Percentages
Reproduced with permission of the copyright owner. Further reproduction prohibited without permission.

135
were computed based on total words in each category. Latino terms and
words were used in only 8% of the total ethnic words in the 1989 curriculum,
as compared to 44% in the 1995 curriculum. Latino names were used in 28%
of the total ethnic names used in the 1989 curriculum, as compared to an
impressive 70% in the 1995 curriculum.
Gender equity did not fare as well. The 1989 and 1995 curricula were
somewhat equally biased toward males as shown by the percentages in
Table 11. Words denoting males accounted for 57% of the 1989 curriculum
(43% females), and 60% of the 1995 curriculum (40% females) when
compared to total words denoting gender. Names and surnames were not
counted in the gender word count, however, which may have skewed the
findings. Social equity has been addressed strongly since the 1960s and
1970s, however, and so it is not surprising the 1989 curriculum did show
sensitivity to this issue.
The researcher finalized the analysis for this research question by
examining introductory pages in each unit in the hopes of gleaning implied
objectives and goals that may not have appeared in the previous data analysis.
The 1989 curriculum began each unit with the first page consisting of three
Reproduced with permission of the copyright owner. Further reproduction prohibited without permission.
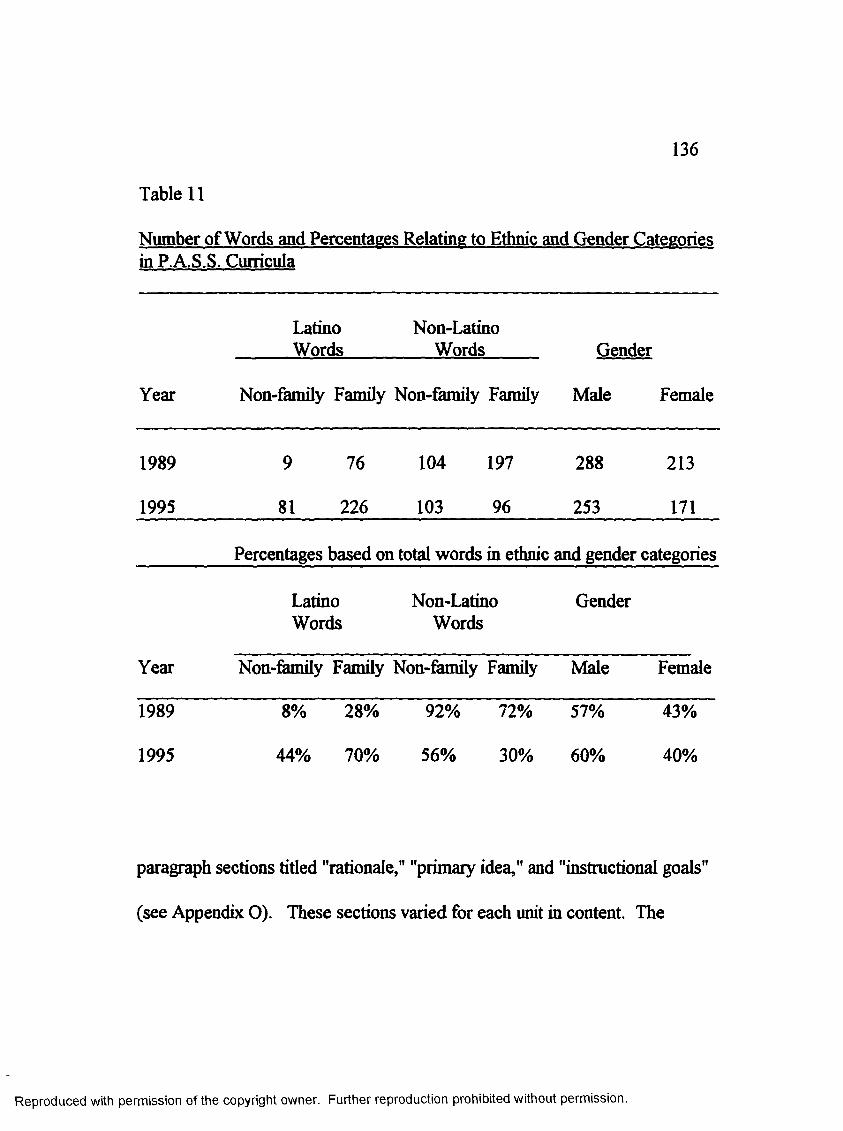
136
Table 11
in P.A.S.S. Curricula
Latino Non-LatinoWords Words Gender
Year Non-family Family Non-family Family Male Female
1989 9 76 104 197 288 213
1995 81 226 103 96 253 171
Percentages based on total words in ethnic and gender categories
Latino Non-Latino GenderWords Words
Year Non-family Family Non-family Family Male Female
1989
1995
8% 28% 92%
44% 70% 56%
72% 57% 43%
30% 60% 40%
paragraph sections titled "rationale," "primary idea," and "instructional goals"
(see Appendix O). These sections varied for each unit in content. The
Reproduced with permission of the copyright owner. Further reproduction prohibited without permission.
137
second page was titled "general directions and requirements" and was
identical for each unit (see Appendix P). The 1995 curriculum began each
unit with the first two pages consisting of two paragraph sections titled
"introduction" and "guidelines and directions." There were slight variations in
each unit for these two pages, with key words substituted within the
paragraph to fit the unit. Several unit examples are shown in Appendix Q.
The examination of these introductory pages in the 1989 course did not
add to the researcher's analysis in any significant way. Instructional goals
seemed to emphasize the mastery of skills, and previous analysis of data in
this study had shown the preponderance of skill and drill problems in the
1989 curriculum. The examination of the introductory pages of the 1995
course did add insight to this analysis. The first paragraph in each unit
emphasized the unit requirement for students to engage in cooperative
learning, use technology, express themselves creatively through writing, art,
and the use of other communicative skills. This emphasis is interpreted by
the researcher as alerting the student to new ways of thinking in mathematics,
which are recommended in the NCTM Standards.
Reproduced with permission of the copyright owner. Further reproduction prohibited without permission.

138
Research Question 2
Can a researcher-designed evaluative instrument measure the extent to
which curricular materials meet the NCTM Standards?
Content validity and interrater reliability are essential elements of
instrument design. Interrater reliability in coding is an essential component
of content analysis. The findings for this research question are therefore
presented for each of these processes.
The evaluative instrument Mathematics Materials Analysis Instrument
fMMAD and supplementary attachments (see Appendixes A-E) designed for
this study were validated for content by a panel of three expert educators who
are familiar with and experienced in the vision of the NCTM Standards. The
instrument was designed in the fall of 1995 and given to the content
validation panel in January 1996. It was edited and panel validation was
received in March 1996.
Interrater reliability for the instrument was established by
nonparametric testing of data collected in a pilot study. This study is
reviewed briefly. A team of five secondary mathematics teachers presently
teaching all levels of secondary mathematics from general mathematics to
Reproduced with permission of the copyright owner. Further reproduction prohibited without permission.
139
calculus participated in the pilot study. Two of the teachers each have over
25 years of teaching experience, the third team member has approximately 5
years teaching experience, and the fourth and fifth team members are in their
2nd and 3rd years of teaching. The teachers with the greatest experience
generally subscribe to a traditional philosophy of mathematics teaching based
upon their experience and training. The teachers with the least experience
have been exposed to contemporary training in the Standards and updated
teaching techniques in their college programs.
Two texts were offered to the team members for analysis: Informal
Geometry (Cummins, Kenney, & Kanold, 1988), and Integrated Mathematics.
(Rubenstein, Craine, & Butts, 1995). The traditional teachers chose Informal
Geometry, and the newly trained teachers chose Integrated Mathematics.
One of the newly trained teachers agreed to analyze both texts to complete
teams of three for each book. This provided more data for the pilot study
because two different texts were analyzed by two different teams. Ordinal
values were assigned to each subcategory of the evaluative instrument
MMAI. The mean of ordinal values for each coder was then computed for
each category.
Reproduced with permission of the copyright owner. Further reproduction prohibited without permission.

140
The null hypothesis used for the pilot study was:
H(0 ): There is no statistically significant difference between coders in
relationship to sample textbooks in the pilot study, pi = = jj.3 .
H(R): There is a statistically significant difference between coders in
relationship to sample textbooks in the pilot study. Hi ^ p.2 * M-3 •
The nonparametric Kruskal- Wallis H-test was chosen to test the
collected data (see Table 12). No significant difference was found in coding
and the null hypothesis was retained for each sample text. This was
interpreted as establishing interrater reliability between the coders using
MMAI on the sample textbooks.
An interesting observation resulting from this pilot study was a
subsequent decision made by the two traditional teachers. They had chosen
their text sample because they were interested in obtaining it as a replacement
text in their geometry courses. Their bias had been shown by comments prior
to the study to the extent that the text was advertised as a transition text
between traditional teaching and teaching strategies recommended by the
Reproduced with permission of the copyright owner. Further reproduction prohibited without permission.
141
Standards. After participating in the study, they decided the text did not
provide enough transitional materials and was in fact "very traditional."
Therefore, they decided not to pursue the text as a replacement text in their
courses. This decision provided an unmeasureable validation of the
evaluative instrument MMAI.
The last step in the instrumentation process was to establish interrater
reliability in coding for the actual study. These findings have been presented
in Hypothesis 2. They confirmed the reliability between the two human
coders and Nud*Ist computer coding using the 1989 and 1995 curricula in
this study.
Other Findings
Content analysis is "valid to the extent its inferences are upheld in the
face of independently obtained evidence" (Krippendorff, 1980, p. 155). The
materials were examined manually by the researcher for uniqueness that could
be overlooked in the major data collection strategies. The 1989 curriculum
maintained a traditional curriculum although it did offer unique puzzles and
formats as motivational incentives to enhance skill-and-drill exercises (see
Appendix T). The 1995 curriculum provided an easily recognizable
Reproduced with permission of the copyright owner. Further reproduction prohibited without permission.

142
integrated and interdisciplinary curriculum in its unique variety of
assignments, investigations and projects (see Appendix U). These examples
further supported the researcher's interpretations that the 1995 curriculum
more adequately represented Standards ideals than did the 1989 curriculum.
Reproduced with permission of the copyright owner. Further reproduction prohibited without permission.

Table 12
Kruskal-Wallis H-test to Establish Interrater Reliability Between Coders in Pilot Study Using the Mathematics Materials Analysis Instrument (MMAD
Text: Integrated Math
MMAICategory
Coder 1 Rank Coder 2 Rank Coder 3 Rank
A 3.50 13.5 3.50 13.5 3.50 13.5B 3.17 6.5 3.83 20.5 4.00 24.0C 2.67 2.0 3.17 6.5 3.50 13.5D 2.83 3.0 3.83 20.5 3.33 9.5E 3.17 6.5 3.50 13.5 3.67 17.0F 3.50 13.5 3.17 6.5 3.83 20.5G 3.83 20.5 3.83 20.5 3.83 20.5H 2.50 1.0 3.00 4.0 3.33 9.5
Ni = 8 N2 = 8 N3 = 8Rsum=66.5 Rsum= 105.5 Rsum= 1 2 8
H = 4.841 a = .05
table continued
Reproduced with permission of the copyright owner. Further reproduction prohibited without permission.

Text: Informal Geometry
144
MMAI Category Coder 1 Rank Coder 2 Rank Coder 3 Rank
A 1.33 6.0 1.67 14.5 1.83 20.0B 2.00 23.0 1.83 20.0 2.17 24.0C 1.17 2.5 1.83 20.0 1.50 9.5D 1.67 14.5 1.33 6.0 1.67 14.5E 1.33 6.0 1.17 2.5 1.17 2.5F 1.50 9.5 1.17 2.5 1.67 14.5G 1.67 14.5 1.83 20.0 1.67 14.5H 1.83 20.0 1.50 9.5 1.50 9.5
N i = 8 * ii 00 n 3 = 8Rsum=96 Rsum ~ 95 Rsum = 1 0 9
H = 0.305 P ll ©
Reproduced with permission of the copyright owner. Further reproduction prohibited without permission.

CHAPTER 5
Summary, Conclusions, Significance,
and Recommendations
Up in the mountains, he knew, the ants changed with the season. Bees
hovered and darted in a dynamical buzz. Clouds skidded across the
sky. He could not work the old way any more.
-J. Gleick(1987, p. 317)
Developing world-class standards is the cornerstone of our efforts to
improve our schools.. . . The global economy is not standing still
while we fiddle educationally.
- Delaine EastinState Superintendent of Public Instruction (California Department of Education, 1996)
The first quote was used in Chapter 1 to acknowledge the complex and
chaotic discoveries in mathematics which are helping us visualize our world
in a new way. The second quote represents the immediacy and timeliness of
the concerns presented in this study.
Reproduced with permission of the copyright owner. Further reproduction prohibited without permission.

146
Summary
The need for change in the mathematics curricula in our public schools
has been well documented. Testing surveys show low overall performance at
every age throughout the K-12 levels. The Curriculum and Evaluation
Standards for School Mathematics, issued by the National Council of
Teachers of Mathematics (NCTM) in 1989 are designed to move
mathematics curriculum forward to meet the needs of students for the future.
The analysis of new curricular materials is essential in order to produce
materials that meet recommended standards.
Migrant students represent one segment of the student population with
deficiencies in mathematics training at the K-12 level. Educating the migrant
student population is one of the greatest challenges that the California
educational system and the United States educational systems face today.
Students from this population frequently relocate to other schools and to other
states. The Portable Assisted Study Sequence (P.A.S.S.) Program serves 165
schools in California and was created to help assuage some of the difficulties
that these students encounter. The P.A.S.S. Program must not only provide
Reproduced with permission of the copyright owner. Further reproduction prohibited without permission.

147
materials that will be appropriate for the migrant student, but must also
comply with the NCTM Standards (1989).
The researcher conducted this study to analyze the content of a lst-
year mathematics course written for P.A.S.S. to meet the NCTM Standards
and compare it to the course it replaced. The 1995 curricular materials
entitled Integrated Math A and Integrated Math B replaced the 1989
curricular materials entitled General Math A and General Math B. An
evaluative instrument, Mathematics Materials Analysis Instrument (MMAD.
was designed to measure the extent to which reform ideas in the Standards
are represented in the curricular materials.
The review of literature established that profound societal influences
determine our educational needs. Our technological society today demands
sophisticated, literate workers who are able to interpret complex biological,
sociological, and technological issues. Integrated curricular design is
proposed to meet the challenge of holistic learning. The Standards emphasize
technology and the need for curriculum to be available equitably to all
students if "they are to be productive citizens in the twenty-first century"
(p. 9).
Reproduced with permission of the copyright owner. Further reproduction prohibited without permission.
148
Content analysis was used to analyze the 1989 and 1995 P.A.S.S.
curricula with respect to the Standards. The researcher utilized third-
generation qualitative data analysis software, Nud*Ist, (Richards & Richards,
1995) to assist in the analysis. An evaluative instrument entitled
Mathematics Materials Analysis Instrument fMMAD was designed for the
study. This involved validation from a panel of experts familiar with the
Standards, and a pilot study to establish interrater reliability using MMAI
with other curricular materials.
Data were obtained from various sources other than MMAI. Data
collection worksheets were used to gather selected categorical information.
The P.A.S.S. curricula were individually examined for uniqueness that might
remain hidden from MMAI coding and data collection worksheets. The
hypotheses and research questions were answered based upon data obtained
in the collection and interpretation of these varied sources.
Conclusions from Hypothesized Findings
This study stated two hypotheses. The findings for each are based on
nonparametric tests for ordinal data.
Reproduced with permission of the copyright owner. Further reproduction prohibited without permission.

149
Substantive Hypothesis 1: The 1995 P.A.S.S. curricular materials are
more likely than the 1989 P.A.S.S. curricular materials to reflect reform ideas
expressed in the Standards.
Chi-square analysis was used to determine if there were any significant
differences between the frequencies of ordinal value coding using
Mathematics Materials Analysis Instrument (MMAD on the 1989 and 1995
curricula. The analyses found significant differences at .05 level of
significance for grades 5-8 and 9-12. The researcher concluded there were
statistically significant differences in the 1989 and 1995 curricula, and that
further analysis would delineate these differences.
Substantive Hypothesis 2: There is no difference between coding
performed by human coders and coding performed with a computer in
relationship to the 1989 and 1995 P.A.S.S. curricula.
Kraskal-Wallis H-test was used to determine if there were any
significant differences in the coding assigned by two human coders and
Reproduced with permission of the copyright owner. Further reproduction prohibited without permission.

150
Nud*Ist computer coding using Mathematics Materials Analysis Instrument
(MMAD on the 1989 and 1995 curricula. The tests found no significant
differences at .05 level of significance for grades 5-8 and 9-12. The
researcher concluded that data obtained from using MMAI for the study
exhibited coding reliability and could therefore be used in data analysis.
Conclusions from Findings of Research Questions
This study asked the following research questions:
1. To what extent do the 1995 P.A.S.S. curricular materials improve
upon the 1989 P.A.S.S. curricular materials with respect to the Standards of
mathematics education delineated by the National Council of Teachers of
Mathematics?
2. Can a researcher-designed evaluative instrument measure the extent
to which curricular materials meet the NCTM Standards?
The first research question was answered with a combination of
descriptive statistics and qualitative analyses. An examination of unit titles
Reproduced with permission of the copyright owner. Further reproduction prohibited without permission.

151
and tables of contents for the 1989 and 1995 curricula showed distinct topical
differences in content. The researcher concluded this analysis showed the
1995 P.A.S.S. curriculum was more aligned to the Standards than the 1989
P.A.S.S. curriculum.
Descriptive statistics from the coded values obtained on Mathematics
Materials Analysis Instrument (MMAD further illuminated the emerging data.
Measures of central tendency, frequency distributions, and scatterplots
substantiated that the 1989 curriculum contained low levels of content
relating to the Standards and the 1995 curriculum contained moderate levels
relating to the Standards. These levels were defined by a general coding
rubric used in conjunction with MMAI as supplementary worksheets (see
Appendix C).
Content analysis strategies such as "word-frequency counts,. . .
classification of words into content categories, content category counts, and
retrievals based on content categories and co-occurrences” (Weber, 1990,
p. 41) clarified the analyses. Categories pertaining to Standards ideals were
represented in the 1995 curriculum in higher percentages than in the 1989
curriculum. The researcher concluded the 1995 curriculum was measurably
Reproduced with permission of the copyright owner. Further reproduction prohibited without permission.

152
superior to the 1989 curriculum to the extent that Standards ideals were
reflected in the curricula.
Other findings and conclusions that emerged as the data were analyzed
involved societal equity issues. The 1995 curriculum exhibited many more
references to terms and names easily recognizable as Latino in nature. This
finding was important to the P.A.S.S. program because the curriculum is
targeted primarily at Latino students. Gender equity was not a major problem
in either curriculum, although males were targeted more often than females,
approximately 60:40 in each curriculum. Perhaps in the future this will be
more balanced.
The use of technology is integral to mathematics reform ideals. The
previously mentioned content analysis strategies did not highlight this issue to
the extent that was truly representative of the 1995 curriculum. Word counts
showed a minimal number of words assigned to the technology category. The
researcher’s manual examination of student directions and specific problems
showed numerous opportunities in the 1995 curriculum for the use of
computers, graphing calculators, and scientific calculators. The 1989
curriculum did not provide these opportunities.
Reproduced with permission of the copyright owner. Further reproduction prohibited without permission.

153
The answer to the first research question is that the 1995 P.A.S.S.
curricular materials improve upon the 1989 P.A.S.S. curricular materials with
respect to the Standards of mathematics education delineated by the National
Council of Teachers of Mathematics to a measurable extent. Mathematics
Materials Analysis Instrument (MMAD quantified the content as moderate in
the 1995 curriculum as compared to low in the 1989 curriculum. These levels
were defined by a general coding rubric used in conjunction with MMAI as
supplementary worksheets (see Appendix C). The qualitative analyses
verified this conclusion.
The second research question, "Can a researcher-designed evaluative
instrument measure the extent to which curricular materials meet the NCTM
Standards?", was answered in terms of processes integral to instrumentation
design. These processes are the validation of content and interrater
reliability in using the instrument.
The evaluative instrument Mathematics Materials Analysis Instrument
(MMAD and supplementary attachments (see Appendixes A-E) designed for
this study were validated for content over a three-month period by a panel of
three expert educators familiar with and experienced in the vision of the
Reproduced with permission of the copyright owner. Further reproduction prohibited without permission.

154
NCTM Standards. A pilot study was then conducted with sample textbooks
different from the study curricula to determine if differences in coding the
same textbooks using the validated MMAI were statistically significantly
different.
This question generated a new hypothesis for the pilot study: There is
no statistically significant difference between coders in relationship to sample
textbooks in the pilot study. The nonparametric Kruskal-Wallis H-test was
used to determine if there were any significant differences in the coding
assigned by the participants in the pilot study using the validated MMAI on
the sample textbooks. The tests found no significant differences at .05 level
of significance between coders. This was true for two independent trials.
The researcher concluded that coding could be performed accurately and
reliably by independent coders with the validated MMAI.
The last step in the instrumentation process had been anticipated in
hypothesis 2. These findings have been presented earlier. They confirmed
the reliability between the two human coders and Nud*Ist computer coding
using the validated instrument on the 1989 and 1995 P.A.S.S. curricula.
Mathematics Materials Analysis Instrument (MMAI) quantified the content as
Reproduced with permission of the copyright owner. Further reproduction prohibited without permission.

155
moderate in the 1995 curriculum as compared to low in the 1989 curriculum.
These levels were defined by a general coding rubric used in conjunction with
MMAI as supplementary worksheets (see Appendix C). The researcher
concluded the instrument was effective and reliable, and can be used to
measure the extent to which curricular materials meet the NCTM Standards.
Significant Findings
This study found the 1995 Portable Assisted Study Sequence
(P.A.S.S.) curriculum to be measurably superior to the 1989 curriculum with
respect to meeting NCTM Standards ideals and recommendations. An
evaluative instrument, Mathematics Materials Analysis Instrument (MMAO.
was designed for the study and was proven to be effective and reliable for
purposes of this study.
Impact on Society
This study has value at three levels: local, state, and national. The
P.A.S.S. materials are used locally, throughout the state, and manually carried
by students to many other states as part of the P.A.S.S. program. The
Reproduced with permission of the copyright owner. Further reproduction prohibited without permission.

P.A.S.S. Program offers four sequential 1-year mathematics courses to
secondary migrant students. The 1989 general mathematics course is the first
course in the sequence. The 1995 integrated mathematics course is intended
to provide content and experiences in alignment with NCTM Standards to
direct and guide teachers and students. This updated curriculum can be
developed further as sequential courses are written. This can result in a new
curriculum for migrant students designed around the concepts and transitions
inherent in the NCTM Standards. Analysis of this important first course in
the sequence can be valuable for future course developers as they make
decisions to continue developing the courses to meet NCTM Standards.
Mathematics teachers throughout the state and nation can benefit from
this study. The flexibility and adaptability of curriculum to meet NCTM
Standards require mathematics teachers to provide and evaluate
supplementary material to determine its applicability to the Standards. The
analysis of content in relationship to the Standards is complex and time-
consuming. This study can help all secondary mathematics educators who
interpret and select the supplementary materials they produce or provide in
their own mathematics classroom. The evaluative instrument, Mathematics
Reproduced with permission of the copyright owner. Further reproduction prohibited without permission.
157
Materials Analysis Instrument (MMAD. can provide guidance and direction
during the process of curriculum development as well as for curriculum
selection.
The process of content analysis of mathematics curricular materials in
respect to their relationship to the NCTM Standards, and the evaluative
instrument MMAI, which was developed and used in this study can have
value to further researchers. Research into content analysis was conducted to
determine the best way to analyze the P.A.S.S. curricula. The NCTM
Standards are replete with subjective goals. This study examined previous
content analysis studies that have dealt with subjective text, as well as
objective text. Processes for instrumentation were investigated. The
culminating research produced an evaluative instrument, Mathematics
Materials Analysis Instrument (MMAD. meeting NCTM Standards that can
be used in curricular materials development.
This study can help the education profession at all levels identify
problems that are encountered by the classroom teacher in the process of
implementing NCTM Standards. The Standards reflect "a vision of
appropriate mathematical goals for all students" (NCTM, 1995, p. 1). It
Reproduced with permission of the copyright owner. Further reproduction prohibited without permission.

158
assumes that all students are capable of learning mathematics, and that
previous curriculum has "underestimated the mathematical capability of most
students and perpetuated costly myths about students' ability and effort"
(p. 1). The Standards were enacted to address this vision, and "many schools
and teachers have responded enthusiastically. . . by changing both the
mathematical content of their courses and the way in which the content is
taught" (p. 3). This study can serve to simplify and demonstrate some of the
problems faced in the distribution of the Standards' ideals to the mathematics
curriculum.
The need for change in the mathematics curricula in our public schools
has been well documented (Kirwan, 1990; National Commission on
Excellence in Education, 1983; National Research Council, 1989; Overby,
1993). Testing surveys show low overall performance at every age
throughout the K-12 levels. The Curriculum and Evaluation Standards for
School Mathematics, issued by the National Council of Teachers of
Mathematics (NCTM) in 1989 are designed to move mathematics curriculum
forward to meet the needs of students for the future. The analysis of new
Reproduced with permission of the copyright owner. Further reproduction prohibited without permission.
159
curricular materials is essential in order to produce materials that meet
recommended standards.
The 1989 Standards are not the last word. A February 1996, press
release from the California Department of Education heralds the formation of
the Commission for the Establishment of Academic Content and Performance
Standards. The goal of this commission is to "develop rigorous state
standards in all major subject areas and for all grade levels The first
proposed standards will be for reading, writing, and mathematics in order to
facilitate the development of statewide tests in those subjects" (p. 1). It is
clear that standards are a major component of education and that this study
can be extremely useful across all disciplines.
The potential for significant social change in mathematics education is
enormous given the appropriate mathematics curricula, equitable
opportunities for all students, and motivation for all concerned parties. This
study represents a pioneering effort to quantify the changes that can hopefully
help our society meet these goals. This process can be replicated in other
disciplines, which increases the potential for social change. Significant
curricular reform will have significant social impact.
Reproduced with permission of the copyright owner. Further reproduction prohibited without permission.

Future Research Recommendations
160
Although a good content analysis will answer some question, it is also
expected to pose new ones.. . . The beginning and end of a content
analysis mark but an arbitrary segment in time.
(Krippendorff, 1980, p. 169)
This study represents a pioneering effort to quantify changes in our
mathematics curriculum through the design and introduction of the evaluative
instrument Mathematics Materials Analysis Instrument fMMAD. Future
research can improve the validity and reliability of this instrument through
rigorous statistical treatments such as factor analysis, and more complex
studies to improve interrater reliability and content validation. Interrater
reliability studies using participants from dissimilar environments holding
varied philosophical viewpoints could improve the reliability of MMAI. The
instrument can be further streamlined, for example, by consolidation of
categories. The study can be replicated with other curricular materials and in
other disciplines to further strengthen its effectiveness and usefulness to
education. The research design for this study can be used to analyze other
educational issues. Finally, the power of third-generation content analysis
Reproduced with permission of the copyright owner. Further reproduction prohibited without permission.

software such as Nud*Ist has not been fully utilized in this study. Third-
generation programs offer opportunities for qualitative theory building.
Future researchers can unleash this power and build immensely on this
pioneering study.
Reproduced with permission of the copyright owner. Further reproduction prohibited without permission.
REFERENCES
162
Aldama, A. J. (1995). Border consciousness: The crisis of the
discursive and the real in "The Mexican immigrant: His life story" (1931) by
Manuel Gamio. Discourse. 18(1-2), 122-145.
Bedard, L., Eschholz, S., & Gertz, M. (1994). Perceptions of crime
and education within the Hispanic community and the impact on corrections.
Journal of Correctional Education. 45(2). 72-80.
Berelson,B. (1952). Content analysis in communications research.
New York: Free Press.
Borg, W. R., & Gall, M. D. (1989). Educational research (5th ed.).
New York: Longman.
Cahape, P. (1993). The migrant student record transfer system
(MSRTS): An update. Charleston, W.VA.: ERIC Clearinghouse on Rural
Education and Small Schools.
California Department of Education. (1992). California Handbook for
Identification and Recruitment. Sacramento, CA: Author.
Reproduced with permission of the copyright owner. Further reproduction prohibited without permission.

163
California Department of Education. (1992). Mathematics framework:
for California public schools, kindergarten through grade twelve.
Sacramento, CA: Author.
California Department of Education. (1996, February 22). Eastin
Announces Standards Commission Appointments. News Release (#96-11),
1- 2 .
Capra, F. (1982). The turning point: Science, society, and the rising
culture. New York: Simon and Schuster.
Chandler, D. G., & Brosnan, P. A. (1994). Mathematics textbook
changes from before to after 1989. Focus on Learning Problems in
Mathematics. 16(4). 1-9.
Chandler, D. G., & Brosnan, P. A. (1995). A comparison between
mathematics textbook content and a statewide mathematics proficiency.
School science and mathematics. 95(31. 118-123.
Christensen, L. B., & Stoup, C. M. (1986). Introduction to statistics
for the social and behavioral science. Belmont, CA: Brooks/Cole.
Cummins, J. J., Kenney, M., & Kanold, T. D. (1988). Informal
geometry. Columbus, OH: Merrill.
Reproduced with permission of the copyright owner. Further reproduction prohibited without permission.

Davis, R. B., Maher, C. A., & Noddings, N. (1992). Constructivist
views on the teaching and learning of mathematics. Journal for Research in
Mathematics Education. 4* 1-3.
Dossey, J. (1992). A history of research in mathematics education. In
D. Grouws (Ed.), Handbook of Research on Mathematics Teaching and
Learning, (pp. 39-48). New York: Macmillan.
Dreyfus, A. (1992). Content analysis of school textbooks: The case
of a technology-oriented curriculum. International Journal of Science
Education. 14. 3-12.
Eltinge, E. M., & Roberts, C. W. (1993). Linguistic content analysis:
A method to measure science as inquiry in textbooks. Journal of Research in
Science Teaching. 30. 65-83.
English, F. W. (1987). Curriculum management for schools, colleges,
business. Springfield, EL: Charles C. Thomas.
Etzioni, A. (1968). The active society: A theory of societal and
political processes. New York: Free Press.
Flanders, J. R. (1994). Textbooks, teachers, and the SIMS test.
Journal for Research in Mathematics Education. 25(3), 260-278.
Reproduced with permission of the copyright owner. Further reproduction prohibited without permission.

Forman, S., & Steen, L. A. (May/June, 1995). How school
mathematics can prepare students for work, not just for college. The Harvard
Education Letter. 6-8.
Frisbie, R. D. (1986, April). The use of microcomputers to improve
the reliability and validity of content analysis in evaluation. Paper presented
at the Annual Meeting of the American Educational Research Association,
San Francisco.
Garet, M. S., & Mills, V. L. (1995). Change in teaching practices:
The effects of the Curriculum and Evaluation Standards. The Mathematics
Teacher. 88(5). 380-389.
Glatthom, A. A. (1987). Curriculum renewal. Alexandria, VA:
Association for Supervision and Curriculum Development.
Harter, P. D., & Gehrke, N. J. (1989, Fall). Integrative curriculum: A
kaleidoscope of alternatives. Educational Horizons. 68. 12-17.
Headden, S. (1995, September 25). Tongue-tied in the schools. U.S.
World & News Report, p. 45.
Reproduced with permission of the copyright owner. Further reproduction prohibited without permission.

166
Huetteman, J. D. (1989). Content assessment of selected college
health textbooks. Paper presented at the National Convention of the
American College Health Association, Washington, D. C.
Idelson, H. (1996). Economic anxieties bring debate on immigration
to a boil. Congressional Quarterly. 54(11). 697-701.
Kelle, U. (1996). Computer-aided qualitative data analysis: An
overview. Paper presented at the Text Analysis and Computers Conference,
Mannheim, Germany.
Kelle, U., & Laurie, H. (1995). Computer use in qualitative research
and issues of validity. In U. Kelle's (Ed.), Computer-aided qualitative data
analysis, (pp. 19-28). London: Sage.
Kilpatrick, J. (1992). A history of research in mathematics education.
In D. Grouws (Ed.), Handbook of Research on Mathematics Teaching and
Learning, (pp. 1-38). New York: Macmillan.
Kirwan, W. E. (1990). Meeting the mathematical needs of our
nation's work force. Educational Horizons. 69. 22-27.
Klauke, A. (1989). Coping with changing demographics.
Eugene, OR: ERIC Clearinghouse on Educational Management.
Reproduced with permission of the copyright owner. Further reproduction prohibited without permission.
167
Krippendorff, K. (1980). Content Analysis. Newbury Park, CA:
Sage.
Lumpe, A. T., & Scharmann L. C. (1991). Meeting contemporary
goals for lab instruction: A content analysis of two secondary biology
textbooks. School Science and Mathematics. 91(6). 231-235.
Murphy, T. (1995, August 20). $89 product causing billion-dollar
fuss. The Bakersfield Californian, p. Dl.
National Commission on Excellence in Education. (1983). A nation at
risk: The imperative for educational reform. Washington, D.C.: U. S.
Government Printing Office.
National Council of Teachers of Mathematics. (1989). Curriculum
and evaluation standards for school mathematics. Reston, VA: Author.
National Council of Teachers of Mathematics. (1991). A guide for
reviewing school mathematics programs. Reston, Va.: Author.
National Council of Teachers of Mathematics. (September, 1995).
Study finds most states are developing new curriculum frameworks. NCTM
News Bulletin, p. 1,11.
Reproduced with permission of the copyright owner. Further reproduction prohibited without permission.

168
National Council of Teachers of Mathematics. (1995). Assessment
Standards for school mathematics. Reston, Va.: Author.
National Council of Teachers of Mathematics. (1996). NCTM 1995-
1996 handbook. Reston, Va.: Author.
National Research Council. U989V Everybody counts. Washington,
D. C: National Academy Press.
Nelson, A. (1990). Curriculum design techniques. Dubuque, IA: Wm.
C. Brown.
OHalloran, S. R. (1994). "Educational financing mandates in
California: Reallocating the cost of educating immigrants between state and
local government entities". Santa Clara Law Review. 35. 367-396.
O'Neal, J. S. (1993). Restructuring a mathematics program using the
NCTM Standards and outcome-based education. (Doctoral dissertation,
Georgia State University, 1993). Dissertation Abstracts International.
9335069.
Overby, L. Y. (1993). Are Hispanic dropout rates related to
migration? Washington, D.C.: ERIC Clearinghouse for National Center for
Education Statistics.
Reproduced with permission of the copyright owner. Further reproduction prohibited without permission.

169
Parsons, T. (Ed.) (1947). Max Weber: The theory of social and
economic organizations (A. M. Henderson and T. Parsons, Trans.) New
York: Free Press.
Patton, M. W. (1990). Qualitative evaluation and research methods.
Newbury Park, CA: Sage.
Polya, G. (1965). Mathematical discovery: On understanding
learning and teaching problem solving. (Vol. 2). New York: Wiley.
Pratt, D. (1994). Curriculum planning. Fort Worth, TX: Harcourt
Brace.
Prein, G., Kelle, U., & Bird, K. (1995). An overview of software. In
U. Kelle's (Ed.), Computer-aided qualitative data analysis, (pp. 190-210).
London: Sage.
Prewitt-Diaz, J. O. (1991). "The factors that affect the educational
performance of migrant children". Education. 111(4). 483-486.
Richards, L., & Richards, T. (1995). QSR Nud*Ist (Version 3.0)
[Computer software]. Thousand Oaks, CA: Sage.
Reproduced with permission of the copyright owner. Further reproduction prohibited without permission.

170
Rivers, J. (1990). Contextual analysis of problems in Algebra I
textbooks. Paper presented at the Annual Meeting of the American
Educational Research Association, Boston.
Robitaille, D. F., & Travers, K. J. (1992). International studies of
achievement in mathematics. In D. Grouws (Ed.), Handbook of Research on
Mathematics Teaching and Learning, (pp. 687-709). New York: Macmillan.
Romberg, T. (1988). Can teachers be professional? In D. Grouws,
T. Cooney, & D. Jones (Eds.), Perspectives on research on effective
mathematics teaching (pp. 224-244). Reston, VA: National Council of
Teachers of Mathematics.
Romo, H. (1993). Mexican immigrants in high schools: Meeting their
needs. Charleston, W. Va.: ERIC Clearinghouse on Rural Education and
Small Schools.
Rubenstein, R. N., Craine, T. V., & Butts, T. R. (1995). Integrated
mathematics. Boston: Houghton Mifflin.
Schlosser, E. (1995, November). In the strawberry fields. The
Atlantic Monthly. 80-108.
Reproduced with permission of the copyright owner. Further reproduction prohibited without permission.
171
Schmalz, R. (1993). Out of the mouths of mathematicians.
Washington, D.C.: Mathematical Association of America.
Schmalz, R. (1994). The mathematics textbook: How can it serve the
NCTMs standards? Arithmetic Teacher. 41(61. 330-332.
Schoenfeld, A. H. (1988). Problem solving in contexts). In R.
Charles & E. Silver, The teaching and assessing of mathematical problem
solving (pp. 82-92). Reston, VA: National Council of Teachers of
Mathematics.
Schuck, P. H. (1995). "The message of 187". The American Prospect.
2L 85-92.
Seidel, J., & Kelle, U. (1995). Different functions of coding in the
analysis of textual data. In U. Kelle's (Ed.), Computer-aided qualitative data
analysis, (pp. 52-61). London: Sage.
Shane, H. G. (1990, Fall). Improving education for the twenty-first
century. Educational Horizons. 69. 11-15.
Simon, M. K. (1995, August). Prospering from the understanding of
the new sciences and new technologies in the communication age. Futurics.
19(3), 53-57.
Reproduced with permission of the copyright owner. Further reproduction prohibited without permission.
172
Steffe, L. (1988). Children's construction of number sequences and
multiplying schemes. In J. Hiebert & M. Behr (Eds.), Number concents and
operations in the middle grades (pp. 119-140). Reston, VA: National
Council of Teachers of Mathematics.
Steffe, L. P., & Kieren, T. (1994). Radical constructivism and
mathematics education. Journal for Research in Mathematics Education.
25(6), 711-733.
Stempel, G. H. HI, & Westley, B. H. (1989). Research methods in
mass communication. (2nd ed.). Englewood Cliffs, NJ: Prentice Hall.
Toffler, A. (1980). The third wave. New York: William Morrow.
Trotter, A. (1992, August). Harvest of dreams. The American School
Board Journal. 14-18.
U. S. Department of Education. (1985). A review and description of
services for migrant children. Washington, D. C.: U. S. Government Printing
Office.
Velazquez, L. C. (1994). "Addressing migrant farmworkers'
perceptions of schooling". The Rural Educator. 16(2), 32-36.
Reproduced with permission of the copyright owner. Further reproduction prohibited without permission.

173
von Glasersfeld, E. (1987). Learning as a constructive activity. InC.
Janvier (Ed.), Problems of representation in the teaching and learning of
mathematics (pp. 3-17). Hillsdale, NJ: Lawrence Erlbaum.
Webb, N. (1995). The textbook business: Education's big dirty
secret. The Harvard Education Letter. XI(4), 1-3. Weber, R. P. (1990).
Basic content analysis. (2nd ed.). Newbury Park, CA: Sage.
Wiske, M. S., & Levinson, C. Y. (1993). How teachers are
implementing the NCTM standards. Educational Leadership. 50(8). 8-12.
Wolf, A. (1992). Multicultural content in California's adopted eighth
grade history textbooks: An analysis. Social Studies Review. 31(3). 22-45.
Ziolniski, C. (1994). The informal economy in an advanced
industrialized society. The Yale Law Journal. 103(8). 2305-2335.
Reproduced with permission of the copyright owner. Further reproduction prohibited without permission.
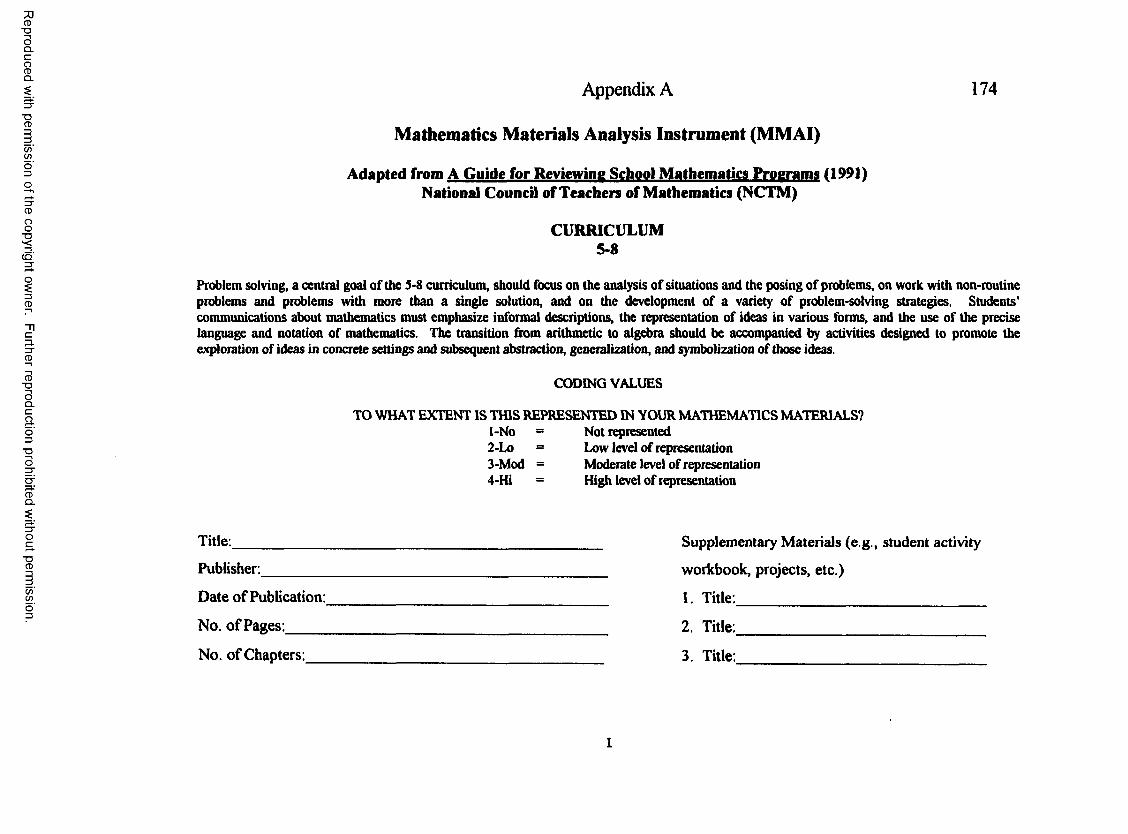
Reproduced
with perm
ission of the
copyright ow
ner. Further
reproduction prohibited
without
permission.
Appendix A 174
Mathematics Materials Analysis Instrument (MMAI)
Adapted from A Guide for Reviewing School Mathematics Programs (1991)National Council of Teachers of Mathematics (NCTM)
CURRICULUM5-8
Problem solving, a central goal of the 5*8 curriculum, should focus on the analysis of situations and the posing o f problems, on work with non-routine problems and problems with more than a single solution, and on the development of a variety of problem-solving strategies. Students’ communications about mathematics must emphasize informal descriptions, the representation of ideas in various forms, and the use of the precise language and notation of mathematics. The transition from arithmetic to algebra should be accompanied by activities designed to promote the exploration of ideas in concrete settings and subsequent abstraction, generalization, and symbolization of those ideas.
CODING VALUES
TO WHAT EXTENT IS THIS REPRESENTED IN YOUR MATHEMATICS MATERIALS?1-No = Not represented2-Lo = Low level of representation3-Mod = Moderate level of representation4-Hi = High level of representation
Title:_______________________________________________________ Supplementary M aterials (e .g ., student activity
Publisher:_____________________________________________ workbook, projects, etc.)
Date of Publication:____________________________________ 1. Title:________________________________
No. o f Pages:__________________________________________ 2. Title:_________________________________
No. o f Chapters:_______________________________________ 3. Title:________________________________
l
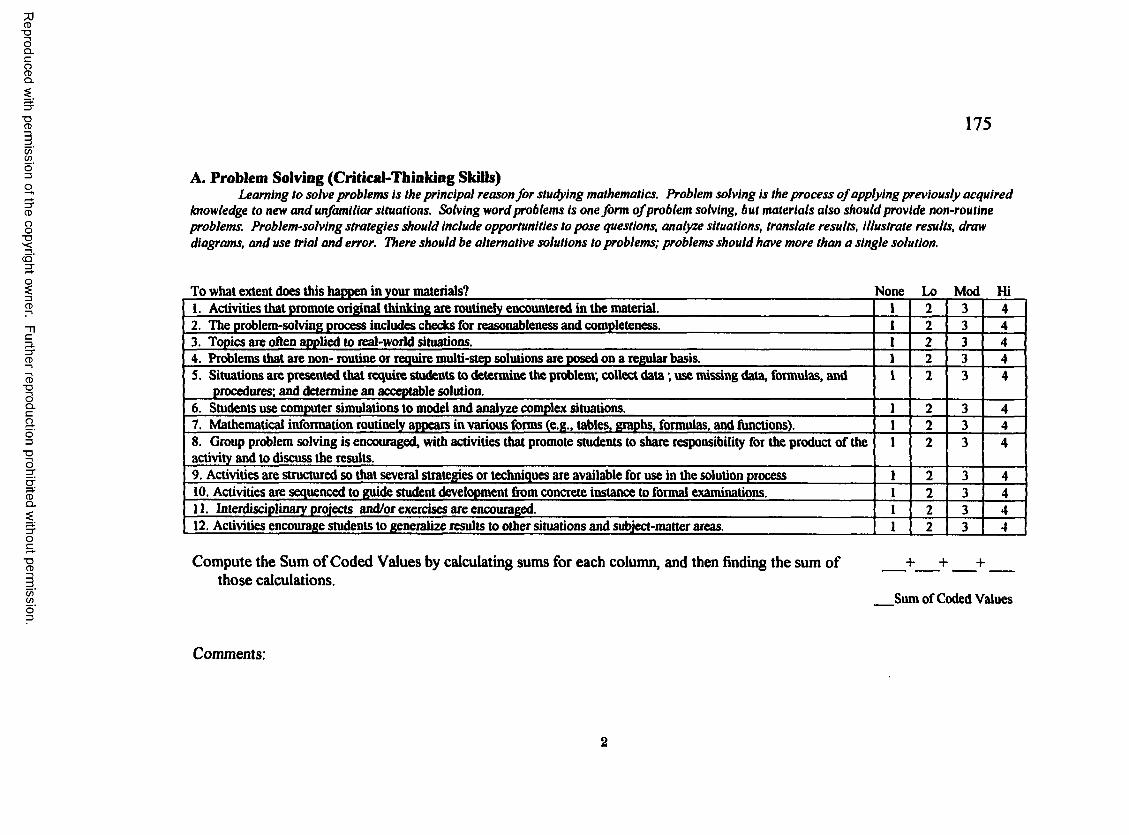
Reproduced
with perm
ission of the
copyright ow
ner. Further
reproduction prohibited
without
permission.
175
A. Problem Solving (Critical-Thinking Skills)Learning to solve problems is the principal reason for studying mathematics. Problem solving is the process o f applying previously acquired
knowledge to new and unfamiliar situations. Solving word problems is one form ofproblem solving, but materials also should provide non-routine problems. Problem-solving strategies should Include opportunities to pose questions, analyze situations, translate results, illustrate results, draw diagrams, and use trial and error. There should be alternative solutions to problems; problems should have more than a single solution.
To what extent does this happen in your materials? None Lo Mod Hi1. Activities that promote original thinking are routinely encountered in the material. 1 2 3 42. The problem-solving process includes checks for reasonableness and completeness. 1 2 3 43. Topics are often applied to real-world situations. 1 2 3 44. Problems that are non- routine or require multi-step solutions are posed on a regular basis. 1 2 3 45. Situations are presented that require students to determine the problem; collect data; use missing data, formulas, and 1 2 3 4
procedures; and determine an acceptable solution.6. Students use computer simulations to model and analyze complex situations. 1 2 3 47. Mathematical information routinely appears in various forms (e.g., tables, graphs, formulas, and functions). 1 2 3 48. Group problem solving is encouraged, with activities that promote students to share responsibility for the product of the 1 2 3 4activity and to discuss the results.9. Activities are structured so that several strategies or techniques are available for use in the solution process 1 2 3 410. Activities are sequenced to guide student development from concrete instance to formal examinations. 1 2 3 411. Interdisciplinary projects and/or exercises are encouraged. 1 2 3 412. Activities encourage students to generalize results to other situations and subject-matter areas. 1 2 3 4
Compute the Sum of Coded Values by calculating sums for each column, and then finding the sum of + + ___+ ___those calculations.
Sum of Coded Values
Comments:
2

Reproduced
with perm
ission of the
copyright ow
ner. Further
reproduction prohibited
without
permission.
176
B. CommunicationThe 5-8 program should provide opportunities for students to develop and use the language and notation o f mathematics. Vocabulary that is
unique to mathematics and terms that have a common, as well as a mathematical, connotation should be used throughout the materials. Opportunities to express mathematical ideas by writing, speaking, making models, drawing diagrams, and preparing graphs should be provided.
To what extent does this happen in your materials?_____________________________________________________________None Lo Mod Hi1. Mathematical situations are represented or described in a variety of ways (e.g., verba), concrete, pictorial, graphical, algebraic).
1 2 3 4
2. The understanding of mathematics is developed through open-ended activities and exercises which promote reflection, organization, and communication of ideas.
1 2 3 4
3. Activities and exercises are designed in such a manner that students are required to take positions on mathematical processes and defend their solutions through sound argument.
1 2 3 4
4. The need for formal mathematical symbolism is demonstrated. 1 2 3 4S. The ability to read and analyze mathematics is emphasized. 1 2 3 46. The ability to write mathematics problems from real-world situations is emphasized. 1 2 3 47. Activities encourage students to demonstrate proper mathematical vocabulary and notation. 1 2 3 4
Compute the Sum of Coded Values by calculating sums for each column, and then finding the sum of + + ___+ ___those calculations.
Sum of Coded Values
Comments:
3

Reproduced
with perm
ission of the
copyright ow
ner. Further
reproduction prohibited
without
permission.
177
C. ComputationThe 5-8 program should offer opportunities to compute with whole numbers, decimals, and fractions. Calculators or computers should be
usedfor long, tedious computations. Additional mathematics topics should be providedfor all levels o f ability in addition to exercises promoting mastery o f computational algorithms. Exercises should promote rapid approximate calculations using mental arithmetic and a variety o f computational estimation techniques. When computation is needed, an estimate should be used to check reasonableness, examine a conjecture, or make a decision. Simple techniques fo r estimating measurements such as length, area, volume, and mass (weights) should be demonstrated. Appropriate levels o f precision should be required.
To what extent does this happen in your materials?____________________________________________________________ None Lo Mod Hi1. Students are required to use pencil and paper to add, subtract, multiply, and divide decimals and fractions with common
denominators.1 2 3 4
2. A calculator is used to add, subtract, multiply, and divide more cumbersome fractions and decimals. 1 2 3 43. Computational algorithms are developed with an emphasis on having students understand the underlying principles
(the whys).1 2 3 4
4. Estimation is encouraged to check for reasonableness of computations (i.e., guess-and-check, mental arithmetic). 1 2 3 4
Compute the Sum of Coded Values by calculating sums for each column, and then finding the sum of + + ___+those calculations.
Sum of Coded Values
Comments:
4

Reproduced
with perm
ission of the
copyright ow
ner. Further
reproduction prohibited
without
permission.
178
D. MeasurementMathematics should be presented as having power, usefulness, and creative aspects so it is not viewed by students as a static, bounded set o f
rules and procedures to be memorized but quickly forgotten. When measurement is explored through rich, investigative, purposeful activity, it affords such opportunity. Fundamental concepts o f measurement should be demonstrated through concrete experiences.
To what extent'does this happen in your materials?____________________________________________________________ None Lo Mod Hi1. Basic units of measurement in the metric system and the relationships among those units of measurement-both within the dimension (e.g., length or volume)—are included.
1 2 3 4
2. Basic units of measurement in the English system and the relationships among those units within a dimension (e.g., feet in a yard or pints in a quart) are included.
1 2 3 4
3. Activities and exercises encourage students to select appropriate instruments to measure a dimension accurately. 1 2 3 44. Activities and projects encourage students to make and interpret scale drawings. 1 2 3 45. Activities and projects encourage students to develop and use procedures as well as formulas to determine area and volume.
1 2 3 4
6. Students are required to estimate measurements in both the metric system and the English system. 1 2 3 47. Student-developed systems of measurement are encouraged. 1 2 3 48. Concepts of perimeter, area, and volume are developed intuitively through the use of activities designed for counting units, covering surfaces, and filling containers.
1 2 3 4
9. Real-world activities encourage the use of measurements to generate student-collected data. 1 2 3 4
Compute the Sum o f Coded Values by calculating sums for each column, and then finding the sum of + + ___+ ___those calculations.
Sum of Coded Values
Comments:
5
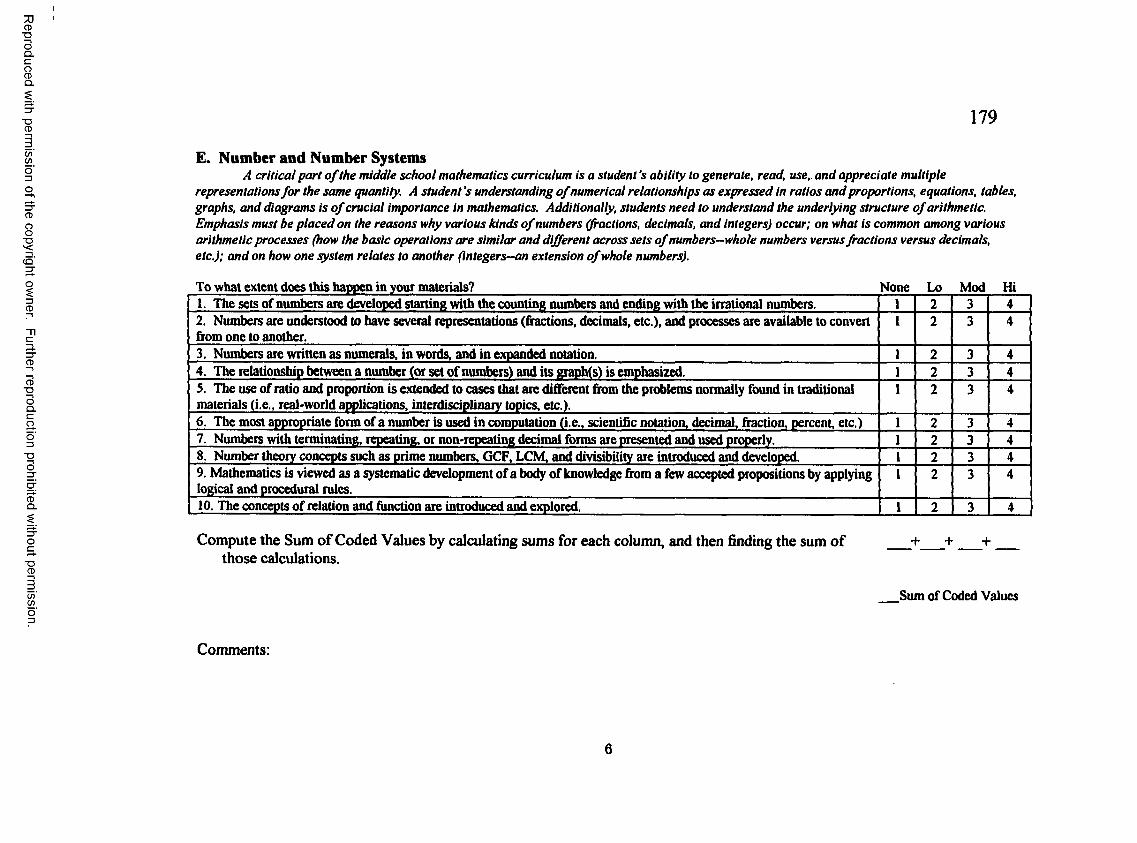
Reproduced
with perm
ission of the
copyright ow
ner. Further
reproduction prohibited
without
permission.
179
E. Number and Number SystemsA critical part o f the middle school mathematics curriculum is a student's ability to generate, read, use,, and appreciate multiple
representations fo r the same quantity. A student's understanding o f numerical relationships as expressed in ratios and proportions, equations, tables, graphs, and diagrams is o f crucial importance in mathematics. Additionally, students need to understand the underlying structure o f arithmetic. Emphasis must be placed on the reasons why various kinds o f numbers 0-actions, decimals, and integers) occur; on what is common among various arithmetic processes (how the basic operations are similar and different across sets o f numbers—whole numbers versus fractions versus decimals, etc.); and on how one system relates to another (integers—an extension o f whole numbers).
To what extent does this happen in your materials?____________________________________________________________ None Lo Mod Hi1. The sets of numbers are developed starting with the counting numbers and ending with the irrational numbers. 1 2 3 42. Numbers are understood to have several representations (fractions, decimals, etc.), and processes are available to convert from one to another.
1 2 3 4
3. Numbers are written as numerals, in words, and in expanded notation. 1 2 3 44. The relationship between a number (or set of numbers) and its graph(s) is emphasized. 1 2 3 45. The use of ratio and proportion is extended to cases that are different from the problems normally found in traditional materials (i.e., real-world applications, interdisciplinary topics, etc.).
1 2 3 4
6. The most appropriate form of a number is used in computation (i.e., scientific notation, decimal, fraction, percent, etc.) 1 2 3 47. Numbers with terminating, repeating, or non-repeating decimal forms are presented and used properly. 1 2 3 48. Number theory concepts such as prime numbers, GCF, LCM, and divisibility are introduced and developed. 1 2 3 49. Mathematics is viewed as a systematic development of a body of knowledge from a few accepted propositions by applying logical and procedural rules.
I 2 3 4
10. The concepts of relation and function are introduced and explored. 1 2 3 4
Compute the Sum of Coded Values by calculating sums for each column, and then finding the sum of ___+ ___those calculations.
Sum of Coded Values
Comments:
6

Reproduced
with perm
ission of the
copyright ow
ner. Further
reproduction prohibited
without
permission.
180
F. GeometryStudents should have knowledge o f concepts such as parallelism, perpendicularity, congruence, similarity, and symmetry. They should know
properties ofsimple plane and solid geometric figures and should be able to visualize and verbalize how objects move in the world around them using terms such as slides, flips, and turns. Geometric concepts should be explored in settings that involve problem solving and measurement.
To what extent does this happen in your materials?_____________________________________________________________None Lo Mod Hi1. The identification and description of geometric figures in 1,2. and 3 dimensions are emphasized. 1 2 3 42. Opportunities to visualize, represent, and manipulate one-, two-, and three-dimensional figures are provided. 1 2 3 43. The relationships between geometric properties and other mathematical concepts are explored (i.e., similarity to ratio, congruence to equivalence, etc.).
1 2 3 4
4. Geometric relationships and their consequences are developed through non-classroom experiences and activities (i.e., research activities which explore community engineering projects, etc.).
1 2 3 4
S. Appreciation of geometry and its relationship to the physical world is developed. 1 2 3 46. Constructing, drawing, and measuring are used to further understanding of geometric properties. 1 2 3 47. Technology is used to explore geometric properties. 1 2 3 4
Compute the Sum of Coded Values by calculating sums for each column, and then finding the sum of + + ___+ ___those calculations.
Sum of Coded Values
Comments:
7
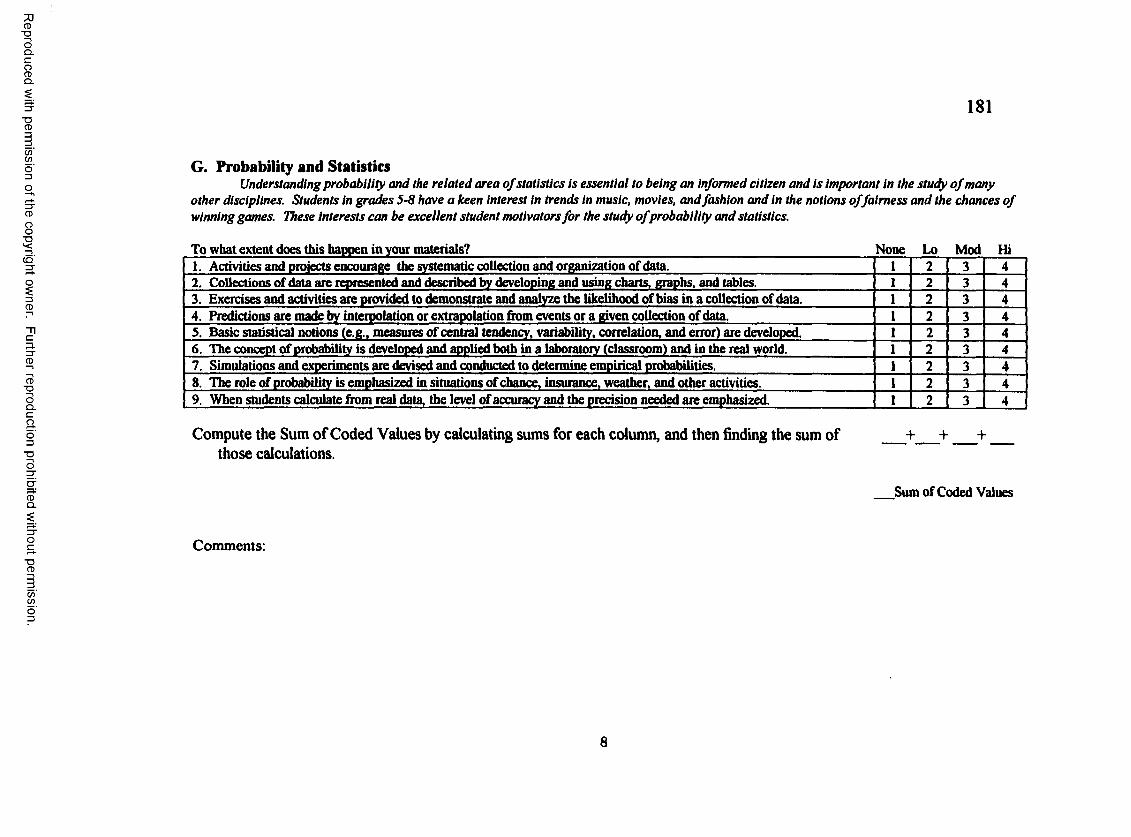
Reproduced
with perm
ission of the
copyright ow
ner. Further
reproduction prohibited
without
permission.
181
G. Probability and StatisticsUnderstanding probability and the related area o f statistics is essential to being an informed citizen and is important in the study o f many
other disciplines. Students in grades 5-8 have a keen interest in trends in music, movies, and fashion and in the notions offairness and the chances o f winning games. These Interests can be excellent student motivators for the study ofprobability and statistics.
To what extent does this happen in your materials?____________________________________________________________ None Lo Mod Hi1. Activities and projects encourage the systematic collection and organization of data. 1 2 3 42. Collections of data are represented and described by developing and using charts, graphs, and tables. 1 2 3 43. Exercises and activities are provided to demonstrate and analyze the likelihood of bias in a collection of data. 1 2 3 44. Predictions are made by interpolation or extrapolation from events or a given collection of data. 1 2 3 45. Basic statistical notions (e.g., measures of central tendency, variability, correlation, and error) are developed. 1 2 3 46. The concept of probability is developed and applied both in a laboratory (classroom) and in the real world. 1 2 3 47. Simulations and experiments are devised and conducted to determine empirical probabilities. 1 2 3 48. The role of probability is emphasized in situations of chance, insurance, weather, and other activities. 1 2 3 49. When students calculate from real data, the level of accuracy and the precision needed are emphasized. 1 2 3 4
Compute the Sum of Coded Values by calculating sums for each column, and then finding the sum of + + ___ +those calculations.
Sum of Coded Values
Comments:
8

Reproduced
with perm
ission of the
copyright ow
ner. Further
reproduction prohibited
without
permission.
182
H. AlgebraOne o f the most important roles o f the middle grade mathematics curriculum is to provide a transition from arithmetic to algebra. It is
crucial that students in grades 5-8 explore algebraic concepts in an informal way in order to build a foundation for the subsequent formal stuffy o f algebra.
To what extent does this happen in your materials? None Lo Mod Hi1. A variety of mathematical representations (e.g., physical models, data, tables, graphs, matrices, etc.) are demonstrated and required in informal explorations with algebraic ideas (e.g., variable, expression, equation).
1 2 3 4
2. Concrete experiences with situations that allow students to investigate patterns in number sequences, make predictions, and formulate verbal rules to describe patterns are emphasized.
1 2 3 4
3. Students’ use of algebraic concepts in applications is emphasized with a concurrent de-emphasis on routine algebraic manipulations.
1 2 3 4
Compute the Sum o f Coded Values by calculating sums for each column, and then finding the sum of + + -+those calculations.
Sum of Coded Values
Comments:
9
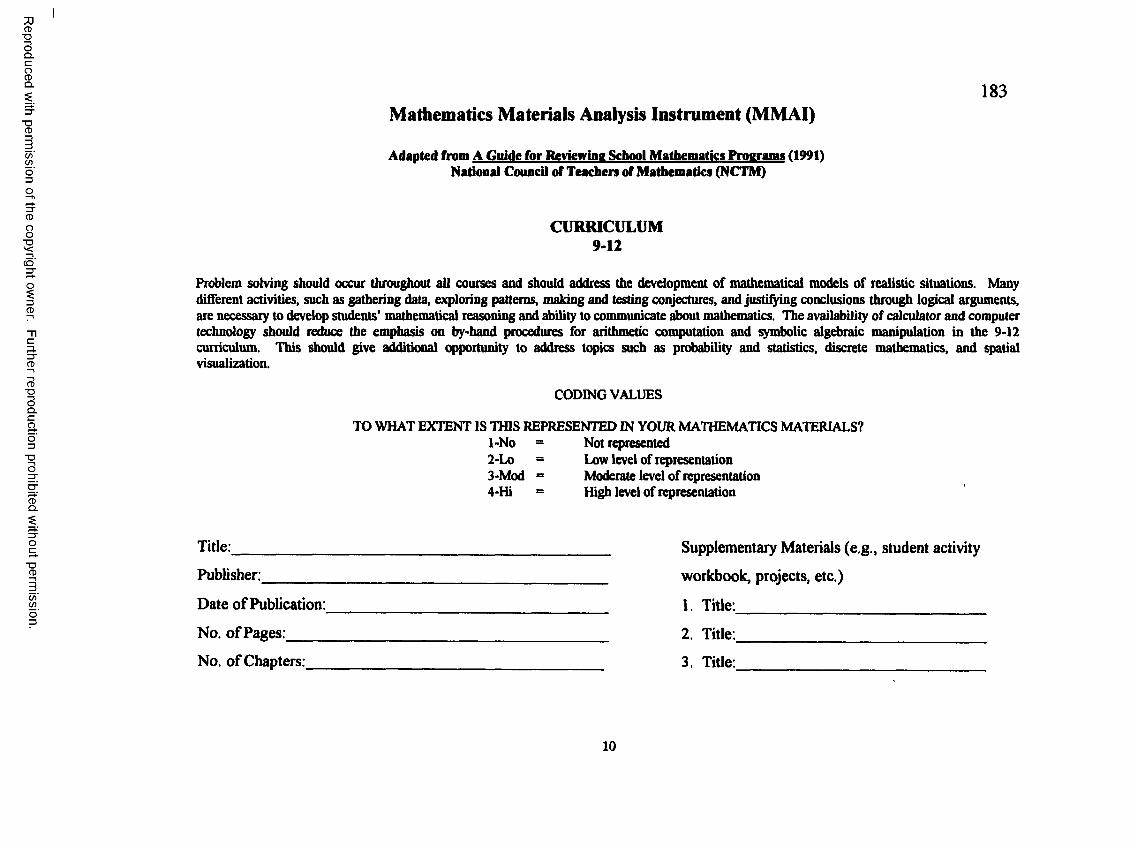
Reproduced
with perm
ission of the
copyright ow
ner. Further
reproduction prohibited
without
permission.
183Mathematics Materials Analysis Instrument (MMA1)
Adapted from A Guide for Reviewing School Mathematics Pm oram * (1991)National Council of Teachers of Mathematics (NCTM)
CURRICULUM9-12
Problem solving should occur throughout all courses and should address the development of mathematical models of realistic situations. Many different activities, such as gathering data, exploring patterns, making and testing conjectures, and justifying conclusions through logical arguments, are necessary to develop students’ mathematical reasoning and ability to communicate about mathematics. The availability of calculator and computer technology should reduce the emphasis on by-hand procedures for arithmetic computation and symbolic algebraic manipulation in the 9-12 curriculum. This should give additional opportunity to address topics such as probability and statistics, discrete mathematics, and spatial visualization.
CODING VALUES
TO WHAT EXTENT IS THIS REPRESENTED IN YOUR MATHEMATICS MATERIALS?1-No = Not represented2-Lo = Low level of representation3-Mod - Moderate level of representation4-Hi = High level of representation
Title:_________________________________________________ Supplementary Materials (e.g., student activity
Publisher:_____________________________________________ workbook, projects, etc.)
Date of Publication:____________________________________ 1. Title:_________________________________
No. o f Pages:__________________________________________ 2. Title:_________________________________
No. of Chapters:_______________________________________ 3. Title:_________________________________
10

Reproduced
with perm
ission of the
copyright ow
ner. Further
reproduction prohibited
without
permission.
184CURRICULUM: 9-12
A. Problem solving (Critical-Thinking Skills)Learning to solve problems is the principal reason for studying mathematics. Problem solving is the process o f applying previously acquired
knowledge to new and unfamiliar situations. Solving word problems in texts is one form ofproblem solving, but materials should also contain nonroutine problems. Problem solving involves posing questions, drawing diagrams, analyzing situations, using guess and check, and illustrating and interpreting results. Materials should provide opportunities for alternative solutions to problems, and problems with more than a single solution. Problems and applications should be used to stimulate the study o f mathematical concepts
To what extent does this happen in your materials?___________________________________________________________ None Lo Mod Hi1. Problems are designed to introduce, develop, and review mathematical topics. 1 2 3 42. Concrete models are used to demonstrate realistic situations. 1 2 3 43. Activities and exercises encourage the use of a variety of problem-solving strategies to solve a broad range of problems.
1 2 3 4
4. Non-routine problems encourage the application of previous knowledge to unfamiliar situations. 1 2 3 45. The complexity of problem-solving is demonstrated through problems requiring more than one solution. 1 2 3 46. Exercises and activities are designed in such a manner as to encourage students to analyze incorrect solutions to identify errors in the problem-solving process.
1 2 3 4
Compute the Sum of Coded Values by calculating sums for each column, and then finding the sum of + + ___+ ___those calculations.
Sum of Coded Values
Comments:
11

Reproduced
with perm
ission of the
copyright ow
ner. Further
reproduction prohibited
without
permission.
185
B. CommunicationThe 9-12 program should give students opportunities to develop, learn, and use the language and notation o f mathematics. Vocabulary that
is unique to mathematics and terms that have a common, as well as a mathematical, connotation should be developed and used throughout the curriculum. Mathematical ideas should be expressed by writing, speaking, making models, drawing diagrams, and preparing graphs. Opportunities should be provided for discussing mathematical topics.
To what extent does this happen in your materials?___________________________________________________________ None Lo Mod Hi1. Activities, projects, and exercises encourage students to work in small groups. 1 2 3 42. Mathematical concepts are demonstrated with a variety of communication strategies (i.e., speaking, writing, drawing diagrams, graphing, and demonstrating with concrete models).
1 2 3 4
3. Symbolism and mathematical notation are demonstrated throughout the materials. 1 2 3 44. Exercises and activities encourage students to use appropriate symbols and mathematical notation. 1 2 3 4S. Exercises and activities encourage students to use appropriate mathematical vocabulary. 1 2 3 46. Writing deductive arguments in paragraph form is encouraged. 1 2 3 4
Compute the Sum of Coded Values by calculating sums for each column, and then finding the sum of + + __ + ___those calculations.
Sum of Coded Values
Comments:
12

Reproduced
with perm
ission of the
copyright ow
ner. Further
reproduction prohibited
without
permission.
186
C. Computation and EstimationThe 9-12 program gives students a variety o f opportunities to gain facility in computing with whole numbers, decimals, andfractions and in
using the four basic operations. It also provides opportunities for students to develop and use estimation skills and concepts on a continuing basis throughout the materials.
To what extent does this happen in your materials?___________________________________________________________ None Lo Mod Hi1. Choosing appropriate computational methods (mental arithmetic, paper-and-pencil algorithms, or calculating device) is emphasized in the materials.
1 2 3 4
2. Selecting the appropriate computation to be performed is stressed as well as performing the computations. 1 2 3 43. Activities and exercises encourage students to use estimation to judge reasonableness of results. 1 2 3 44. Activities and exercises encourage students to use estimation frequently as part of the problem-solving process. 1 2 3 45. Situations are presented for which the precision of results must be determined. 1 2 3 46. Activities and exercises encourage students to question the reasonableness of a solution to a problem as an important part of the problem-solving process.
1 2 3 4
Compute the Sum of Coded Values by calculating sums for each column, and then finding the sum of + + ___ + ___those calculations.
Sum of Coded Values
Comments:
13
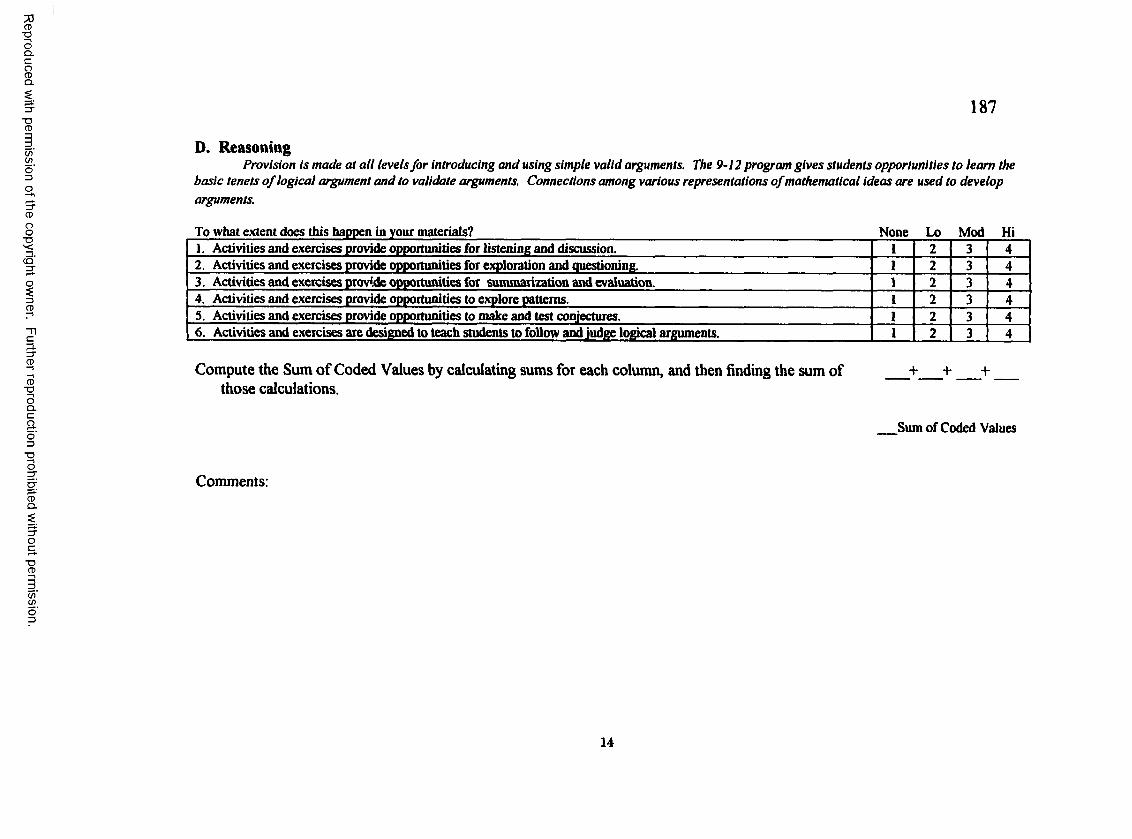
Reproduced
with perm
ission of the
copyright ow
ner. Further
reproduction prohibited
without
permission.
187
D. ReasoningProvision is made at all levels for introducing and using simple valid arguments. The 9-12 program gives students opportunities to team the
basic tenets o f logical argument and to validate arguments. Connections among various representations o f mathematical ideas are used to develop arguments.
To what extent does this happen in your materials?___________________________________________________________ None Lo Mod Hi1. Activities and exercises provide opportunities for listening and discussion. 1 2 3 42. Activities and exercises provide opportunities for exploration and questioning. 1 2 3 43. Activities and exercises provide opportunities for summarization and evaluation. 1 2 3 44. Activities and exercises provide opportunities to explore patterns. 1 2 3 45. Activities and exercises provide opportunities to make and test conjectures. 1 2 3 46. Activities and exercises are designed to teach students to follow and judge logical arguments. 1 2 3 4
Compute the Sum o f Coded Values by calculating sums for each column, and then finding the sum of ___+___+ ___+ ___those calculations.
Sum of Coded Values
Comments:
14

Reproduced
with perm
ission of the
copyright ow
ner. Further
reproduction prohibited
without
permission.
188
E. IntegrationThe 9-12 program should provide integrated mathematics topics across the curriculum.
To what extent does this happen in your materials?___________________________________________________________ None Lo Mod Hi1. Function, as introduced in algebra, serves as a unifying concept across all mathematics courses (e.g., geometric transformations, trigonometric functions, and sequences).
1 2 3 4
2. The concepts of limit, maximum, and minimum are developed informally throughout the algebra strand. 1 2 3 43. The study of geometric properties is not restricted to formal geometry courses. 1 2 3 44. Discrete mathematics topics are included in the materials (i.e., finite graphs, matrices, sequences, series, combinations, permutations, and discrete probability).
1 2 3 4
5. Opportunities are provided in the materials to encourage students to collect, organize, and display data. 1 2 3 46. Activities and exercises promote the formulation of original problems which integrate mathematical content. 1 2 3 4
Compute the Sum o f Coded Values by calculating sums for each column, and then finding the sum of + + ___+ ___those calculations.
Sum of Coded Values
Comments:
15

Reproduced
with perm
ission of the
copyright ow
ner. Further
reproduction prohibited
without
permission.
189
F. Interdisciplinary EmphasisThe 9-12 program should provide real-world applications in realistic situations. A variety o f mathematical topics should be extended to
other curricular areas.To what extent does this happen in your materials?___________________________________________________________ None Lo Mod Hi1. Problems are chosen to integrate strands of mathematics with applications from other curricular areas. 1 2 3 42. Data from real-world situations are used to illustrate the propct lies of trigonometric functions. 1 2 3 43. Applications of probability in related fields such as business and sports are integrated into the materials. 1 2 3 44. Charts, tables, and graphs are used to draw inferences from real-world situations. 1 2 3 45. Students are required to apply statistical techniques to other subject areas. 1 2 3 46. The approach to computation reflects the ways in which computation is, and may be, used outside the school setting. 1 2 3 4
Compute the Sum of Coded Values by calculating sums for each column, and then finding the sum o f __+ ___ + ___ +__those calculations.
Sum of Coded Values
Comments:
16

Reproduced
with perm
ission of the
copyright ow
ner. Further
reproduction prohibited
without
permission.
190
G. TechnologyThe 9-12 program should use calculators and computers as tools fo r graphing, problem solving, performing tedious calculations, generating
data, and developing concepts. Materials should allow students to appropriately choose calculators or computers to perform calculations that warrant their use.
To what extent does this happen in your materials?___________________________________________________________ None Lo Mod Hi1. The systematic use of calculators and/or computers to explore algebraic concepts reduces the need for paper-and-pencil graphing.
1 2 3 4
2. The use of the scientific calculator is encouraged to reduce the need for tables and pencil-and-paper interpolation skills. 1 2 3 43. Students are encouraged in the materials to use calculators and computers as tools in statistical investigations. 1 2 3 44. Students are encouraged in the materials to use calculators in daily work and on examinations. I 2 3 43. Students are encouraged in the materials to use computers in daily work and on examinations. 1 2 3 46. Students are encouraged to use calculators to develop estimation skills and to check for reasonableness of results. 1 2 3 4
Compute the Sum o f Coded Values by calculating sums for each column, and then finding the sum of __+___ + ___+___those calculations.
Sum of Coded Values
Comments:
17

Reproduced
with perm
ission of the
copyright ow
ner. Further
reproduction prohibited
without
permission.
191
H. Other Curriculum EmphasisThere should be a change in the content emphasis in the secondary school curriculum. The strong emphasis traditionally placed on
computational algorithms in the curriculum fo r non-college-bound students should give way to the inclusion o f a broad range o f studies, including problem solving, estimation, geometric concepts, applications, and mathematical reasoning. The program fo r college-bound students should integrate the same concepts and reduce the emphasis on algebraic manipulation skills. Lack o f mastery ofpaper-and-pencil computation should not prohibit students from stutfying additional mathematics topics.
To what extent does this happen in your materials?___________________________________________________________ None Lo Mod Hi1. Opportunities are provided to study additional mathematics topics that do not require competence with paper-and- pencil computations.
1 2 3 4
2. The materials emphasize algebraic concepts such as linearity, function, equivalence, and solution. 1 2 3 43. Investigations and comparisons of various geometries are used to enhance the study of geometric concepts. 1 2 3 44. Materials encourage the use of three-dimensional figures to develop spatial skills. 1 2 3 4S. Opportunities are provided for students to analyze the validity of statistical conclusions. 1 2 3 46. Opportunities are provided to analyze the uses and abuses of data interpretation. 1 2 3 4
Compute the Sum of Coded Values by calculating sums for each column, and then finding the sum o f __+___ + ___ + ___those calculations.
Sum of Coded Values
Comments:
18

Appendix B192
Instructions for using Mathematics Materials Analysis Instrument (MMAI)
Materials on hand:1) Scope and Summary of National Council of Teachers of Mathematics (NCTM)
Standards - 6 pages2) General Coding Rubric for Mathematics Materials Analysis Instrument (MMAI)3) Mathematics Materials Analysis Instrument (MMAI)
- Grades 5-8 (pp. 1-9)- Grades 9-12 (pp. 10-18)
4) Worksheet (pp. 1-4) with Example-Grades 9-12 (pp. 5-8)
1) Preview the above materials to understand the topics and areas involved in the NCTM Standards and the MMAI. The evaluator can refer to the reference materials listed below for further clarification.
2) Review the mathematics curricular materials and supplementary materials that are being evaluated to obtain a vision of the contents, and to provide insight into the scope and direction of the content and objectives.
3) Complete the MMAI. The General Coding Rubric should be used to help focus on general considerations that are part of the vision of the NCTM Standards A coding value from1 to 4 is circled on the instrument for each subcategory. The materials listed at the top of this page, the mathematics curricular materials, supplementary materials, and the reference materials listed below may be referred to as often as necessary during the completion of the instrument.
4) The worksheet is completed after the instrument is completed. The Sum o f coded values for each category is transferred to the appropriate section on the worksheet. The worksheet provides details for calculating and interpreting the results.
Recommended reference materials:
Mathematical Sciences Education Board. (1989). Everybody counts. Sacramento, CA Author.
National Council of Teachers of Mathematics. (199S). Assessment standards for school mathematics. Reston, V A Author.
National Council of Teachers of Mathematics. (1995). Connecting mathematics across the curriculum. Reston, VA: Author.
National Council of Teachers of Mathematics. (1989). Curriculum and evaluation standards for school mathematics. Reston, VA Author.
Reproduced with permission of the copyright owner. Further reproduction prohibited without permission.

193Appendix C
General Coding Rubric for Mathematics Materials Analysis Instrument fMMAD
To what extent is this represented in your curriculum?1-No Not represented2-Lo Low level of representation3-Mod Moderate level of representation4-Hi High level of representation
The following considerations are important in determining which code is most applicable.
1 - No • Traditional - non-integrated. Mathematics is presented in a linear fashion, i.e.,Algebra, Geometry, Trigonometry, and so on.
• Rote learning, memorization, deductive reasoning is emphasized.• Problems are close-ended; computational skills are emphasized.• Calculators may be optional.• Teacher is the expert and students are encouraged to work alone.• The "decreased attention” topics are emphasized. (See 'Scope and Summary of
NCTM Standards - Summary o f Changes in Content and Emphases).
2 - Lo • Traditional - non-integrated. Mathematics is presented in a linear fashion, i.e.,Algebra, Geometry, Trigonometry, and so on.
• Rote learning and memorization are emphasized but there is some flexibility.• Problems are more complex and alternate solutions occasionally exist• Teacher is the expert but students are encouraged at times to work together.• Computers and calculators are encouraged for computational exercises.
3- Mod • Integrated mathematics curriculum (broad range of topics within mathematics).• Students work periodically in cooperative groups.• Projects, portfolios, manipulatives, and models are used to a limited degree.• Computers and calculators are used for exploration as well as computational
exercises.• Students use several methods to communicate their ideas.• The teacher and students share the 'expert* role, but the teacher is the
ultimate authority.
4- High • Integrated mathematics curriculum (broad range of topics within mathematics).• Interdisciplinary curriculum.• Teacher is facilitator, provides resources, and introductory information.• Students are team members, explorers, discoverers, and predictors.• Computers, calculators (including graphing calculators), and multimedia are
used extensively.• Concrete models and manipulatives are available or are constructed by students to
explore and refine ideas.• Real-world applications are emphasized; students are encouraged to explore in their
own community.• Projects and investigations replace rote exercises.• Students learn to compute through rote exercises but quickly advance to more
complex ideas and problems.• Problems emphasize open-ended responses.• Students use a variety of communication methods.
Reproduced with permission of the copyright owner. Further reproduction prohibited without permission.
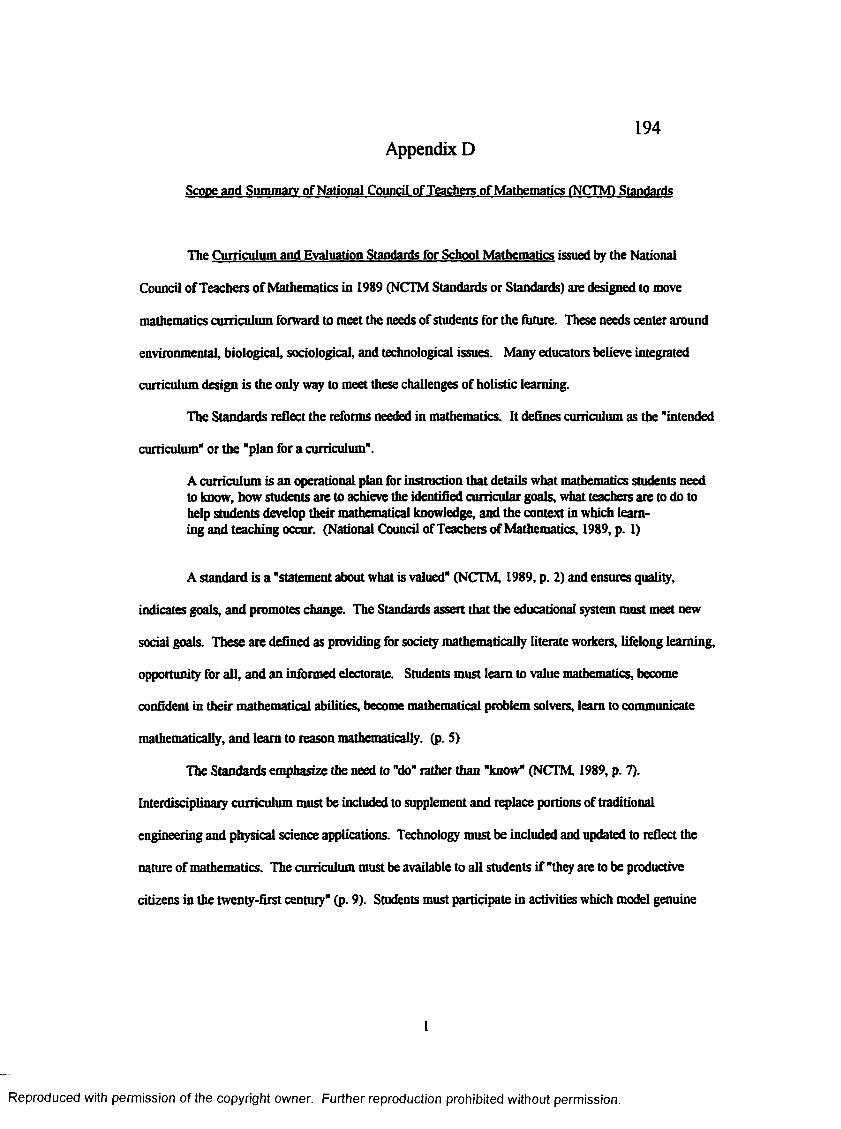
194Appendix D
Scone and Summary of National Council of Teachers of Mathematics fNCTMl Standards
The Curriculum and Evaluation Standards for School Mathematics issued by the National
Council of Teachers of Mathematics in 1989 (NCTM Standards or Standards) are designed to move
mathematics curriculum forward to meet the needs of students for the future. These needs center around
environmental, biological, sociological, and technological issues. Many educators believe integrated
curriculum design is the only way to meet these challenges of holistic learning.
The Standards reflect the reforms needed in mathematics. It defines curriculum as the "intended
curriculum" or the "plan for a curriculum".
A curriculum is an operational plan for instruction that details what mathematics students need to know, how students are to achieve the identified curricular goals, what teachers are to do to help students develop their mathematical knowledge, and the context in which learning and teaching occur. (National Council of Teachers of Mathematics, 1989, p. 1)
A standard is a "statement about what is valued" (NCTM, 1989, p. 2) and ensures quality,
indicates goals, and promotes change. The Standards assert that the educational system must meet new
social goals. These are defined as providing for society mathematically literate workers, lifelong learning,
opportunity for all, and an informed electorate. Students must learn to value mathematics, become
confident in their mathematical abilities, become mathematical problem solvers, learn to communicate
mathematically, and learn to reason mathematically, (p. S)
The Standards emphasize the need to "do” rather than "know" (NCTM, 1989, p. 7).
Interdisciplinary curriculum must be included to supplement and replace portions of traditional
engineering and physical science applications. Technology must be included and updated to reflect the
nature of m athematics. The curriculum must be available to all students if "they are to be productive
citizens in the twenty-first century" (p. 9). Students must participate in activities which model genuine
1
Reproduced with permission of the copyright owner. Further reproduction prohibited without permission.

195
problems, and be encouraged to experiment, discuss, and discover ideas and concepts. The thinking
processes of problem solving, communication, reasoning, and connections are emphasized at all levels.
Content standards are separated into elementary, middle, and high school grades with specific
topics and sub-topics which should be addressed. Content in the elementary grades consists of estimation:
number sense and numeration; whole number operations and computation; geometry and spatial sense;
measurement; statistics and probability; fractions and decimals; and patterns and relationships. Content
in the middle school grades consists o f number and number relationships; number systems and number
theory; computation and estimation; patterns and functions; algebra; statistics; probability, geometry, and
measurement Content in the high school grades consists of mathematical connections; algebra;
functions; geometry from a synthetic perspective; geometry from an algebraic perspective; trigonometry,
statistics; probability, discrete mathematics; conceptual underpinnings of calculus; and mathematical
structure.
Instructional strategies are important to successful adaptation of the Standards proposed by
NCTM. Students must have access to manipulatives, calculators, computers, and other appropriate tools
and techniques. Interactive, cooperative groupwork is essential, and students must work independently
and collaboratively. Assessment must be varied, practical, fair, and meet new standards of quality.
Students should be given time to master material and opportunities to improve the quality of their work.
Projects and investigations should be large-scale, and reflect social issues that help connect mathematics
to society. Students should learn to communicate their learning and ideas in mathematics through
written, oral, and electronic reports.
Teachers must adapt their styles in the classroom to the new instructional strategies. Teachers
must become "facilitators of learning rather than imparters of information" (NCTM 1989, p. 41.) They
must be conscious of their prejudices and overcome them in the classroom. They must provide equal
learning opportunities for all students, and adapt curriculum to multicultural needs in the classroom.
Teachers must become practicing mathematicians to provide role models for their students and thereby
2
Reproduced with permission of the copyright owner. Further reproduction prohibited without permission.
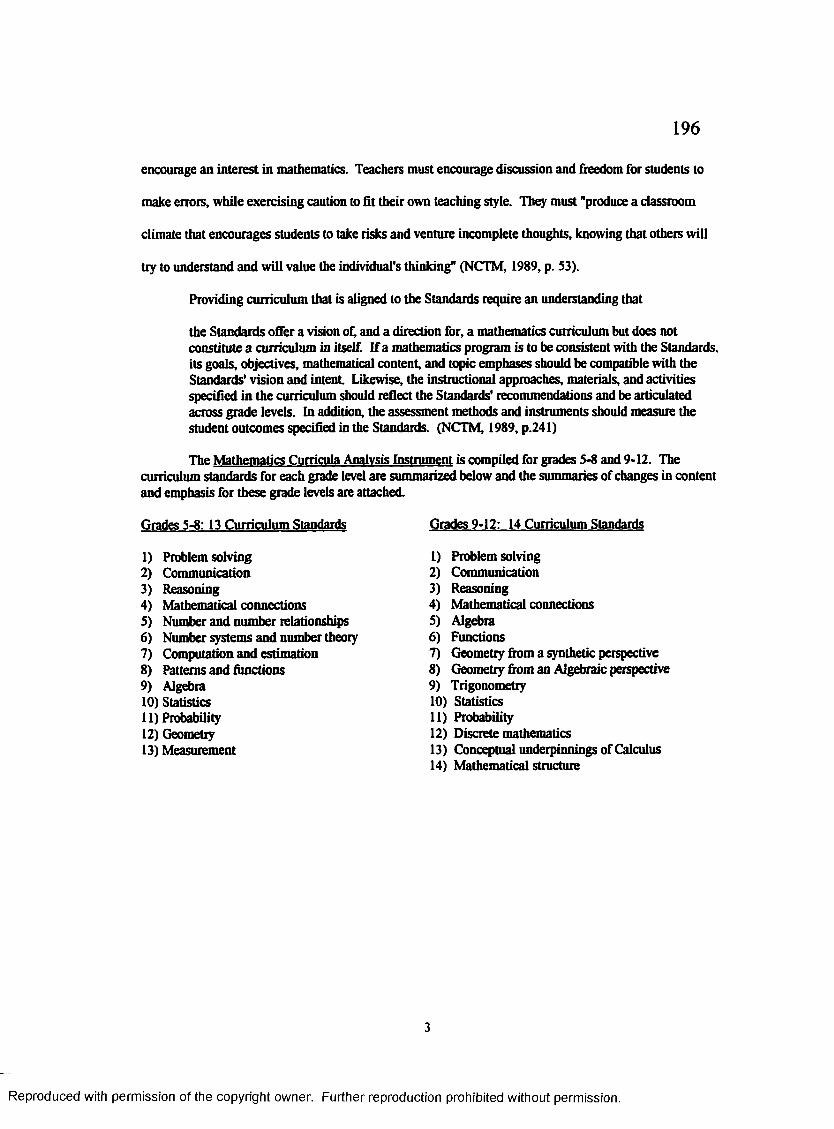
196
encourage an interest in mathematics. Teachers must encourage discussion and freedom for students to
make errors, while exercising caution to fit their own teaching style. They must "produce a classroom
climate that encourages students to take risks and venture incomplete thoughts, knowing that others will
try to understand and will value the individual's thinking" (NCTM, 1989, p. S3).
Providing curriculum that is aligned to the Standards require an understanding that
the Standards offer a vision of, and a direction for, a mathematics curriculum but does not constitute a curriculum in itself. If a mathematics program is to be consistent with the Standards, its goals, objectives, mathematical content, and topic emphases should be compatible with the Standards' vision and intent Likewise, the instructional approaches, materials, and activities specified in the curriculum should reflea the Standards' recommendations and be articulated across grade levels. In addition, the assessment methods and instruments should measure the student outcomes specified in the Standards. (NCTM, 1989, p.241)
The M athem atics Curricula Analysis Instrument is compiled for grades 5-8 and 9-12. The curriculum standards for each grade level are summarized below and the summaries of changes in content and emphasis for these grade levels are attached.
Grades 5-8: 13 C urriq ilnm Standards Grades 9-12: 14 Curriculum Standards
1) Problemsolving2) Communication3) Reasoning4) Mathematical connections5) Number and number relationships6) Number systems and number theory7) Computation and estimation8) Patterns and functions9) Algebra10) Statistics11) Probability12) Geometry13) Measurement
1) Problemsolving2) Communication3) Reasoning4) Mathematical connections5) Algebra6) Functions7) Geometry from a synthetic perspective8) Geometry from an Algebraic perspective9) Trigonometry10) Statistics11) Probability12) Discrete mathematics13) Conceptual underpinnings of Calculus14) Mathematical structure
3
Reproduced with permission of the copyright owner. Further reproduction prohibited without permission.

197
Summary of Changes in Content and Emphasis - Grades 5-8
Increased Attention____________________
Problem Solving:•Pursuing open-ended problems and extended
problem-solving projects.•Investigating and formulating questions from
problem situations.•Representing situations verbally, numerically,
graphically, geometrically, or symbolically.
Communication:•Discussing, writing, reading, and listening to
mathematics ideas.
Reasoning:•Reasoning in spatial contexts.•Reasoning with proportions.•Reasoning from graphs.•Reasoning inductively and deductively.
Connections:•Connecting mathematics to other subjects
and to the world outside the classroom.•Connecting topics within mathematics.•Applying mathematics.
Number/Operations/Computation:•Developing number sense.•Developing operation sense.•Creating algorithms and procedures.•Using estimation both in solving problems and
in checking the reasonableness of results.•Exploring relationships among representations
o f and operations on, whole numbers, fractions, decimals, integers, and rational numbers.
•Developing an understanding of ratio, proportion, and percent
Patterns and Functions:•Identifying and using functional relationships.•Developing and using tables, graphs, and rules
to describe situations.•Interpreting among different mathematical
representations.
Decreased Attention
Problem Solving:•Practicing routine, one-step problems.•Practicing problems categorized by types (e.g., coin
problems, age problems).
Communication:•Doing fill-in-the-blank worksheets.•Answering questions that require only yes, no, or
a number as responses.
Reasoning:•Relying on outside authority (teacher or an answer
key).
Connections:•Learning isolated topics. •Developing skills out o f context
Number/Operations/Computation:•Memorizing rules and algorithms.•Practicing tedious paper-and-pencil computations. •Finding exact forms of answers.•Memorizing procedures, such as cross
multiplication, without understanding.•Practicing rounding numbers out of context
Patterns and Functions:•Topics seldom in the current curriculum.
Reproduced with permission of the copyright owner. Further reproduction prohibited without permission.

198
Summary of Changes in Content and Emphasis - Grades 5-8 - p. 2
Increased Attention:___________________ Decreased Attention:__________
Algebra:•Developing an understanding of variables,
expressions, and equations.•Using a variety of methods to solve linear equations and informally investigate inequalities and nonlinear equations.
Statistics:•Using statistical methods to describe, analyze, evaluate, and make decisions.
Probability:•Creating experimental and theoretical models of situations involving probabilities.
Geometry:•Developing an understanding of geometric objects and relationships.
•Using geometry in solving problems.
Measurement:•Estimating and using measurement to
solve problems.
Instructional Practices:•Actively involving students individually and
in groups in exploring, conjecturing, analyzing,•Using appropriate technology for computation and exploration.
•Using concrete materials.•Being a facilitator of learning.•Assessing learning as an integral part of
instruction.
Algebra:•Manipulating symbols.•Memorizing procedures and drilling on equation solving.
Statistics:•Memorizing formulas.
Probability:•Memorizing formulas.
Geometry:•Memorizing geometric vocabulary. •Memorizing facts and relationships.
Measurement:•Memorizing and manipulating formulas. •Converting within and between measurement
systems.
Instructional Practices:•Teaching computations out of context •Drilling on paper-and-pencil algorithms. •Teaching topics in isolation.•Stressing memorization.•Being the dispenser of knowledge.•Testing for the sole purpose of assigning grades.
5
Reproduced with permission of the copyright owner. Further reproduction prohibited without permission.
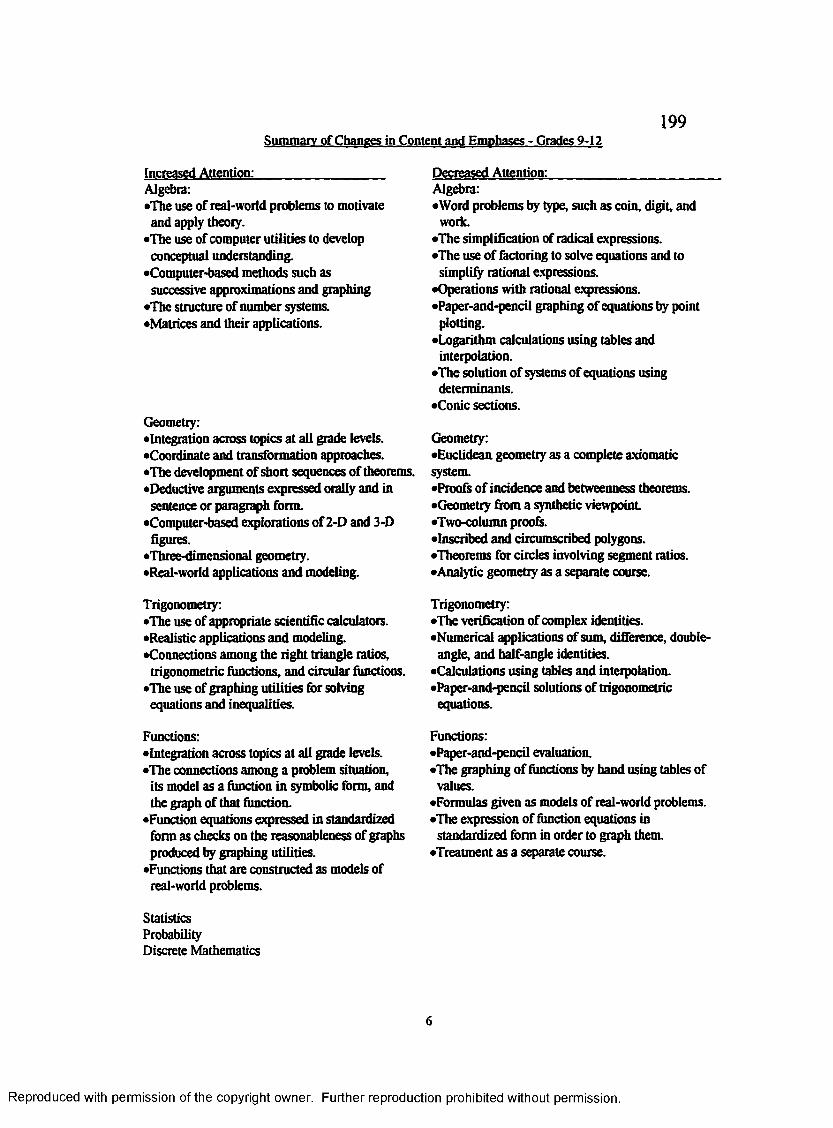
Summary of Changes in Content and Emphases - Grades 9-12
Increased Attention:_______________________ Decreased Attention:_____
199
Algebra:•The use of real-world problems to motivate
and apply theory.•The use of computer utilities to develop conceptual understanding.
•Computer-based methods such as successive approximations and graphing
•The structure of number systems.•Matrices and their applications.
Geometry:•Integration across topics at all grade levels.•Coordinate and transformation approaches.•The development of short sequences of theorems.•Deductive arguments expressed orally and in
sentence or paragraph form.•Computer-based explorations of 2-D and 3-D
figures.•Three-dimensional geometry.•Real-world applications and modeling.
Trigonometry:•The use of appropriate scientific calculators.•Realistic applications and modeling.•Connections among the right triangle ratios,
trigonometric functions, and circular functions.•The use of graphing utilities for solving
equations and inequalities.
Functions:•Integration across topics at all grade levels.•The connections among a problem situation,
its model as a function in symbolic form, and the graph of that function.
•Function equations expressed in standardized form as checks on the reasonableness of graphs produced by graphing utilities.
•Functions that are constructed as models of real-world problems.
Algebra:•Word problems by type, such as coin, digit, and
work.•The simplification of radical expressions.•The use o f factoring to solve equations and to
simplify rational expressions.•Operations with rational expressions.•Paper-and-pencil graphing of equations by point
plotting.•Logarithm calculations using tables and
interpolation.•The solution of systems of equations using
determinants.•Conic sections.
Geometry:•Euclidean geometry as a complete axiomaticsystem.•Proofs of incidence and betweenness theorems.•Geometry from a synthetic viewpoint•Two-column proofs.•Inscribed and circumscribed polygons.•Theorems for circles involving segment ratios.•Analytic geometry as a separate course.
Trigonometry:•The verification of complex identities.•Numerical applications of sum, difference, doubleangle, and half-angle identities.
•Calculations using tables and interpolation.•Paper-and-pencil solutions of trigonometric equations.
Functions:•Paper-and-pencil evaluation.•The graphing of functions by hand using tables of
values.•Formulas given as models of real-world problems.•The expression of function equations in
standardized form in order to graph them.•Treatment as a separate course.
Statistics Probability Discrete Mathematics
6
Reproduced with permission of the copyright owner. Further reproduction prohibited without permission.

200Appendix E
W O R K SH E E T for C oding M M AITitle:Publisher:__Date of Pub.:
Enter the Total Sums of Coded Values from each subcategory on the MMAI to the appropriate curriculum section Grades 5*8 or 9*12.
No. of Sum ofItems Curriculum: fi-ft Coded
Values
12 A. Problem Solving (Critical-Thinking Skills) ___7 B. Communication ___4 C. Computation ___9 D. Measurement ___
10 E. Number and Number Systems________________________________7 F. Geometry ___9 G. Probability and Statistics ____3 H. Algebra ___61
Total:
No. of Sum ofItem s Curriculum: 9-12 Coded
Values
6 A. Problem Solving (Critical-Thinking Skills)6 B. Communication6 C. Computation and Estimation6 D. Reasoning6 E. Integration6 F. Interdisciplinary Emphasis6 G. Technology6 H. Other Curriculum Emphasis48
Total:
Reproduced with permission of the copyright owner. Further reproduction prohibited without permission.

CALCULATIONS and INTERPRETATIONS 201
This instrument can be used by one evaluator or by a team of two or more evaluators. The calculations in subheading I apply to both cases. The calculations in subheading H are to be used for two or more evaluators and should be made in addition to those made in subheading I.
I: One Evaluator:Finding thf> mpan (x ) for all categories:T = Total Sum of Coded ValuesA = No. of Applicable Items:
[ Grades 5-8: (A = 61) or Grades 9-12: (A = 48) ]Enter the sums from the worksheet:T = _______ A = _________
Tx = — = _________(to at least 3 decimal places)
A
Interpretation: The mean indicates the degree of movement toward the Standards, Compare it to the Coding Values: 1= None; 2= Low; 3 = Moderate; 4 = High.Conclusions:______________________ _____________
Finding the mean for each subcategorv: Further statistical tests can be done on each subcategory. The easiest comparisons can be made by simply finding the median and mean of each subcategory and comparing them to the Coding Values: 1 = None; 2 = Low, 3 = Moderate;4 = High. This is a quick check to find weaknesses and strengths within the categories.(For Grades 9*12, use the formula shown below. For Grades 5-8, refer to page 1 o f the worksheet and change the 6 in the formula to match the number of items in each subrategory.)
CodedFdim* :6
Conclusions:
Formula MeanA =_________B =___ ____C =_________D =_________E =___ ____F = _____G =_________H
Interpretation:Categories with means above 3.0 can be seen to be moving toward the Standards and can be compared to the Coding Values: 3 - Moderate and 4 - H igh. Categories below 3.0 can be compared to the Coding Values: 1 - None, 2 - Low and 3 - Moderate. The materials will need to be supplemented in these categories with activities and exercises reflecting higher movement toward the Standards. Coding Values for each item can be examined in these categories to help in determining the type of supplementary activities that will be needed.
2
Reproduced with permission of the copyright owner. Further reproduction prohibited without permission.

202II: Two or More Evaluators:
Finding the mean ( X ) and Standard Deviation (SD or d ) for all categories: n = number of evaluators
i = 1 ,2 ,3 , . . . n
Tj = Total Sum of Coded Values for Evaluator i
Aj = No. o f Applicable Item s for Evaluator i:[ Grades 5-8: (Ai = 61) or Grades 9-12: (Ai = 48) ]
i Xi Ai1234
n
TotalAs
Ts = 2 Ti As = Ai
Ts = As -
— TsX (group m ean): — - (to at least 3 decimal places)
As
xj - x (mean) from calculations in Part I for each evaluator
a*
n-1
a =
Interpretation:The mean indicates the degree of movement toward the Standards. Compare it to the Coding Values: 1= None; 2 = Low; 3 = Moderate; 4 = High.C o n c l u s i o n s : ___________________________ _______ ___________________________
3
Reproduced with permission of the copyright owner. Further reproduction prohibited without permission.
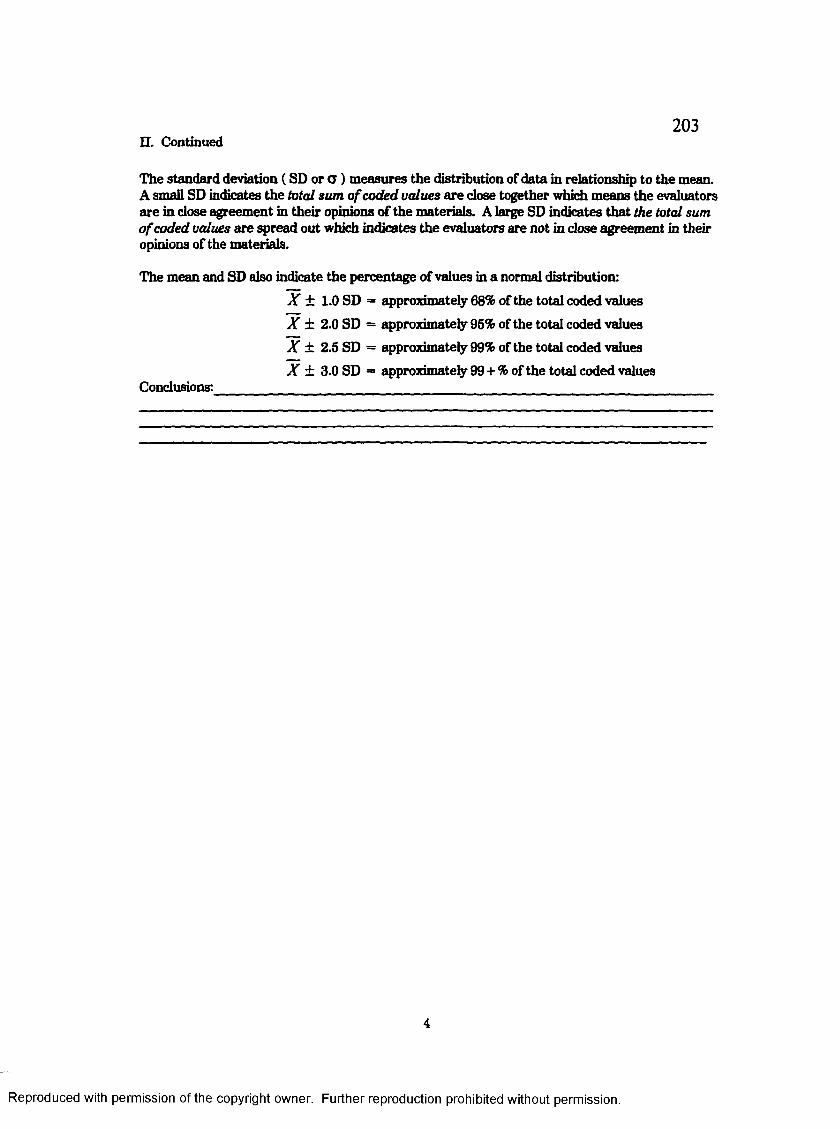
n. Continued203
The standard deviation ( SD or o ) measures the distribution of data in relationship to the mean. A small SD indicates the total sum o f coded values are close together which means the evaluators are in close agreement in their opinions o f the materials. A large SD indicates that the total sum o f coded values are spread out which indicates the evaluators are not in close agreement in their opinions of the materials.
The mean and SD also indicate the percentage o f values in a normal distribution:
X ± 1.0 SD = approximately 68% of the total coded values
X ± 2.0 SD = approximately 95% of the total coded values
X ± 2.5 SD = approximately 99% of the total coded values
X ± 3.0 SD = approximately 99 + % of the total coded values C o n c l u s i o n s : _________________________________ _____________
4
Reproduced with permission of the copyright owner. Further reproduction prohibited without permission.

204EXAMPLE - Grades 9-12
WORKSHEETTitle: INTEGRATED MATH Publisher: XYZ PUBLICATIONS Date of Pub.: 1995
Enter the Total Sum s o f Coded Values from each subcategory on the MMAI to the appropriate curriculum section Grades 5-8 or 9-12.
No. of Sum ofItems P.uwipulum: 5-8 Coded
Values
12 A. Problem Solving (Critical-Thinking Skills) ____7 B. Communication ____4 C. Computation ____9 D. Measurement ____
10 E. Number and Number System s ____7 F. Geometry________________________________________________________9 G. Probability and Statistics ____
_3 H. Algebra_____________________________________________________ ____61
Total:
Sum ofCodedValues
2116151118112215
141
5
No. ofItems Curriculum: 9-12
6 A. Problem Solving (Critical-Thinking Skills)6 B. Communication6 C. Computation and Estimation6 D. Reasoning6 E. Integration6 F. Interdisciplinary Emphasis6 G. Technology6 H. Other Curriculum Emphasis
48Total:
Reproduced with permission of the copyright owner. Further reproduction prohibited without permission.
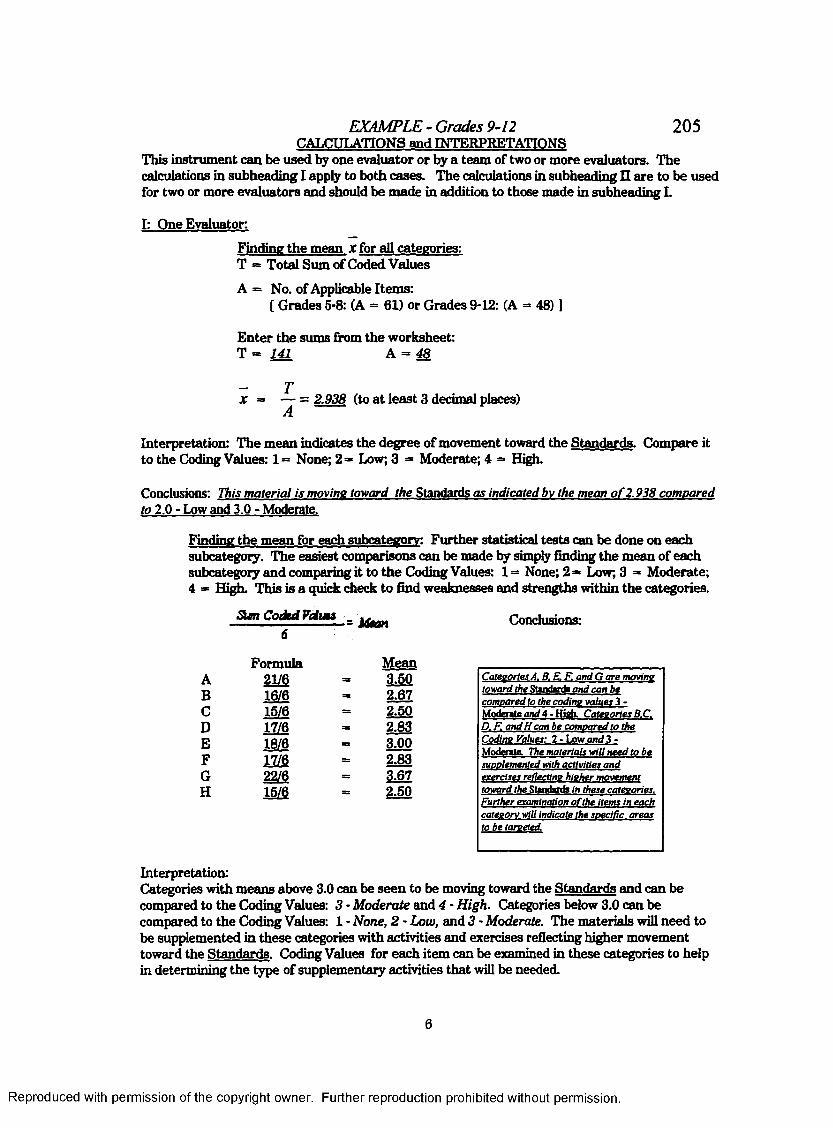
EXAMPLE- Grades 9-12 205CALCULATIONS and INTERPRETATIONS
This instrument can be used by one evaluator or by a team of two or more evaluators. The calculations in subheading I apply to both cases. The calculations in subheading II are to be used for two or more evaluators and should be made in addition to those made in subheading L
I: One Evaluator:
Finding the mean X for all categories:T = Total Sum of Coded Values
A = No. of Applicable Items:[ Grades 5-8: (A = 61) or Grades 9-12: (A = 48) ]
Enter the sums from the worksheet:T = 141 A = 48
x = — = 2.938 (to at least 3 decimal places)A
Interpretation: The mean indicates the degree of movement toward the Standards. Compare it to the Coding Values: 1= None; 2=» Low; 3 = Moderate; 4 = High.
Conclusions: This material is movine toward the Standards as indicated by the mean o f2.938 compared to 2.0 - Low and 3.0 - Moderate.
Finding the mean for each subcategorv: Further statistical tests can be done on each subcategory. The easiest comparisons can be made by simply finding the mean of each subcategory and comparing it to the Coding Values: 1 - None; 2 ** Low; 3 =• Moderate; 4 = High. This is a quick check to find weaknesses and strengths within the categories.
Sum Coded Vdms Conclusions:
Formula MeanA 21/6 = 3.50B m . 2.67C 15/6 = 2.50D m = 2.83E m => 3.00F m = 2.83G 22/6 = 3.67H 15/6 = 2.50
Categories A. B.E.F. and G are movinetoward the Rt«mtorfc and can be compared to the coding values 3 - Moderate and i - Hitfr. Categories B.C. D. F. and H can be compared to theCoding Values: 2 - Low and 3 - Moderate; The materials will need to be supplemented with activities and exercises reflecting higher movementtoward the Standards in these categories. Further examination o f the items in each category will indicate the specific areas to be targeted.
Interpretation:Categories with means above 3.0 can be seen to be moving toward the Standards and can be compared to the Coding Values: 3 - M oderate and 4 - H igh. Categories below 3.0 can be compared to the Coding Values: 1 - None, 2 - Low, and 3 - Moderate. The materials will need to be supplemented in these categories with activities and exercises reflecting higher movement toward the Standards. Coding Values for each item can be examined in these categories to help in determining the type of supplementary activities that will be needed.
6
Reproduced with permission of the copyright owner. Further reproduction prohibited without permission.

EXAMPLE - Grades 9-12 206II: Two or More Evaluators:
Finding the mean ( X ) and Standard Deviation (SD or <t) o f all categories: n = number of evaluators i = 1 ,2 ,3 ,. . . nTi = Total Sum of Coded Values for Evaluator i Ai = No. of Applicable Items for Evaluator L*
[ Grades 5-8: (Aj = 61) or Grades 9-12: (Ai = 48) ]
(For purposes o f this example, assume three additional worksheets fo r Calculation I (Grades 9-12) have been completedfor three additional evaluators. The totals fo r T; are enteredfrom the four worksheets).
i Ti Aii 141 482 166 483 126 484 175 48
Total 192Tg Ag
Tg = Ti Ag = ^ Ai■ i
Tg - 60S As = 192
— ISX (m ean): — = 3.167 (to at least 3 decimal places)As
*i = x (mean) from calculations in part I for each evaluator
For purposes o f this example, assume the calculated means x; are as follows:Xi = 3.065 x2 = 3.458 x3 = 2.930 x< = 3.723
n-1
a = 0.39
Interpretation:The mean indicates the degree of movement toward the Standards. Compare it to the Coding Values: 1= None; 2 = Low; 3 = Moderate; 4 = High.Conclusions: This material is movine toward the Standards as indicated by the mean o f 3.167 as compared to 3.0 - Moderate and 4.0 - High.
7
Reproduced with permission of the copyright owner. Further reproduction prohibited without permission.

EXAMPLE - Grades 9-12 II: Two or More Evaluators (Continued):
207
The standard deviation ( SD or a ) measures the distribution of data in relationship to the mean. A small SD indicates the total sum o f coded values are close together which means the evaluators are in close agreement in their opinions o f the materials. A large SD indicates that the total sum o f coded values are spread out which indicates the evaluators are not in close agreement in their opinions of the materials.
The mean and SD also indicate the percentage o f values in a normal distribution:
X ± 1.0 SD = approximately 68% of the total coded values
X ± 2.0 SD = approximately 95% of the total coded values
X ± 2.5 SD = approximately 99% of the total coded values
X ± 3.0 SD = approximately 99 + % of the total coded values
Conclusions: The mean 3.167 ± 0.39 - 3.557 or 2.778. This means 68% o f the total coded values are between 2.778 and 3.557. These values can be compared to the Coding Value: 3 - Moderate. Furthermore. the mean 3.167 ± 2.0SD = 3.167 ± 2.0 x 0.39 = 3.947 or 2.387. This means 95% o f the total coded values are between 2.387 and 3.947. The materials therefore seem to be movine toward the Standards.
8
Reproduced with permission of the copyright owner. Further reproduction prohibited without permission.

Appendix F208
Letter to Validation Panel Dated January 7,1996(Identical letters to all three members of the panel)
January 7,1996
Dr. Jane D. Gawronski Escondido Union High School District District Service Center 302 North Midway Drive Escondido, CA 92027-2741
Dear Dr. Gawronski:
Thank you for agreeing to look at the instrument and supplementary attachments for my dissertation with Walden University (iaculty advisor Dr. Marilyn K. Simon). I am enclosing the following documentation:
Instructions -1 page
Scope and Summary of NCTM Standards - 6 pages (numbered 1-6)
Coding Rubric for Mathematics Curricula Analysis Instrument - 1 page
Mathematics Curricula Analysis Instrument -
Grades 5-8: 9 pages (numbered 1-9)
Grades 9-12: 8 pages (numbered 10-17)
Worksheet - 1 page
The material to be evaluated in my dissertation is the 1995 ten unit course "Integrated Math A" and "Integrated Math B”, and the 1989 ten unit course "General Mathematics A” and "General Mathematics B". This material is written for secondary level migrant students who are below grade level. Therefore, the instrument includes Grades 5-8 and Grades 9-12. The appropriate categories will be used in the content analysis of the curricula.
As a member of my panel, I need your comments and suggestions regarding the appropriateness of this package to evaluate curriculum with regards to NCTM Standards. This package is intended to stand alone for evaluation; sources are recommended but are not needed unless the evaluator is unfamiliar with the NCTM Standards.
I look forward to your response.
Sincerely,
Karen Conger
Enclosures: 26
Reproduced with permission of the copyright owner. Further reproduction prohibited without permission.

Appendix G209
Letters to Validation Panel Dated March 31.1996
March 31, 1996
Dr. Jane D. Gawronski Escondido Union High School District District Service Center 302 North Midway Drive Escondido, CA 92027-2741
Dear Dr. Gawronski:
The final instrument and supplementary attachments for my dissertation with Walden University (faculty advisor Dr. Marilyn K. Simon) are enclosed. Your comments and the comments of the other panel members have resulted in the following changes:
The instrument has been changed by redistributing subcategories to give a more balanced treatment This has occurred primarily with the 9-12th section because the original draft had so many items in the final category. Wording has been changed to reflect its intended use with curriculum materials as they relate to student activities, exercises, and projects. The instrument is not intended as a measuring tool for curriculum which requires evaluation by observation and other means.
The panel is asked to approve content rather than statistical treatment The statistical treatment has been approved by Dr. Simon.
Again, thank you so much for your time and expertise.
Sincerely,
Karen Conger
Reproduced with permission of the copyright owner. Further reproduction prohibited without permission.
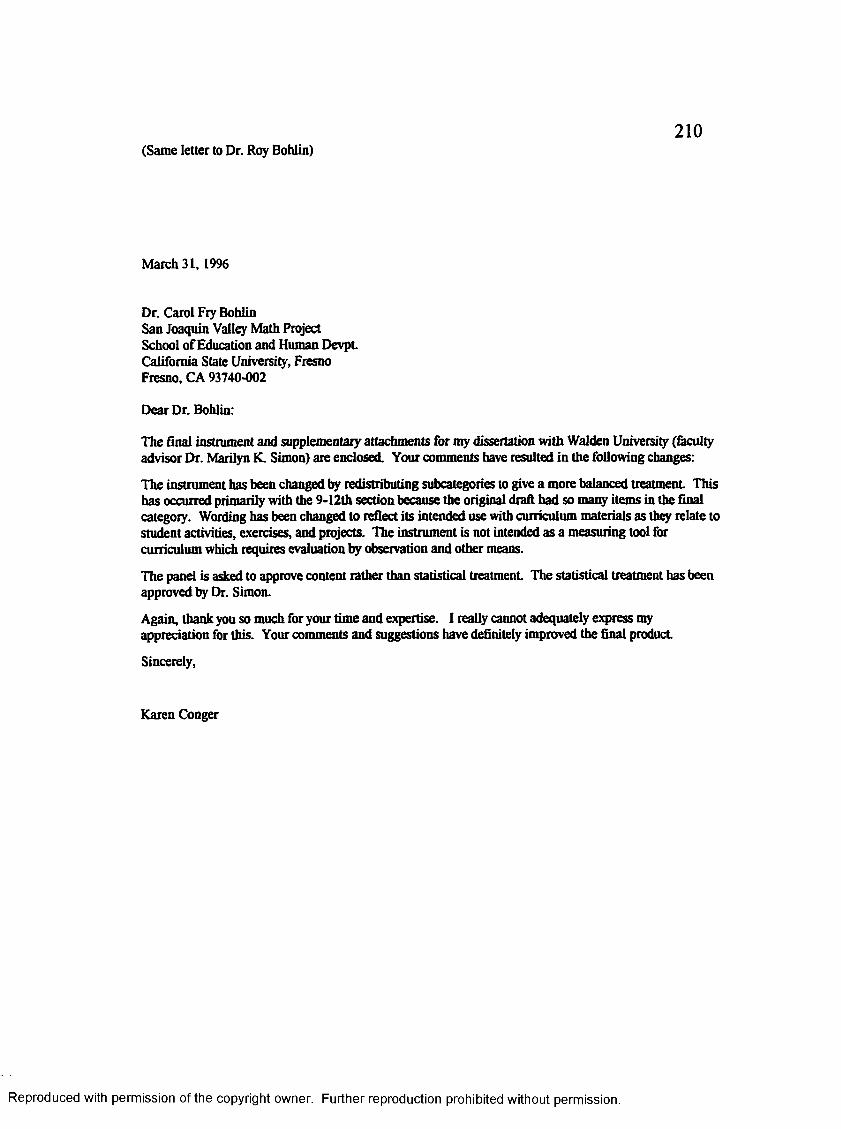
(Same letter to Dr. Roy Bohlin)210
March 31, 1996
Dr. Carol Fry Bohlin San Joaquin Valley Math Project School of Education and Human Devpt California State University, Fresno Fresno, CA 93740-002
Dear Dr. Bohlin:
The final instrument and supplementary attachments for my dissertation with Walden University (faculty advisor Dr. Marilyn K. Simon) are enclosed. Your comments have resulted in the following changes:
The instrument has been changed by redistributing subcategories to give a more balanced treatment This has occurred primarily with the 9-12th section because the original draft had so many items in the final category. Wording has been changed to reflect its intended use with curriculum materials as they relate to student activities, exercises, and projects. The instrument is not intended as a measuring tool for curriculum which requires evaluation by observation and other means.
The panel is asked to approve content rather than statistical treatment The statistical treatment has been approved by Dr. Simon.
Again, thank you so much for your time and expertise. I really cannot adequately express my appreciation for this. Your comments and suggestions have definitely improved the final product
Sincerely,
Karen Conger
Reproduced with permission of the copyright owner. Further reproduction prohibited without permission.

Appendix H211
Data Collection Worksheet1989 Curriculum
Unit# # o f # of lines # o f #o f # of projects/pages excl. spaces word prob. skill & drill invest/etc.
1Review
CorePr. Ex.
GlossaryTotal
2Review
CorePr. Ex.
GlossaryTotal
3Review
CorePr. Ex.
GlossaryTotal
4Review
CorePr. Ex.
GlossaryTotal
5Review
CorePr. Ex.
GlossaryTotal
Reproduced with permission of the copyright owner. Further reproduction prohibited without permission.

Data Collection Worksheet1989 Curriculum
212
Unit# # o f # of lines # of # of # of projects/pages excl. spaces word prob. skill & drill invest/etc.
6Review
CorePr. Ex.
GlossaryTotal
7Review
CorePr. Ex.
GlossaryTotal
8Review
CorePr. Ex.
GlossaryTotal
9Review
CorePr. Ex.
GlossaryTotal
10Review
CorePr. Ex.
GlossaryTotal
Reproduced with permission of the copyright owner. Further reproduction prohibited without permission.
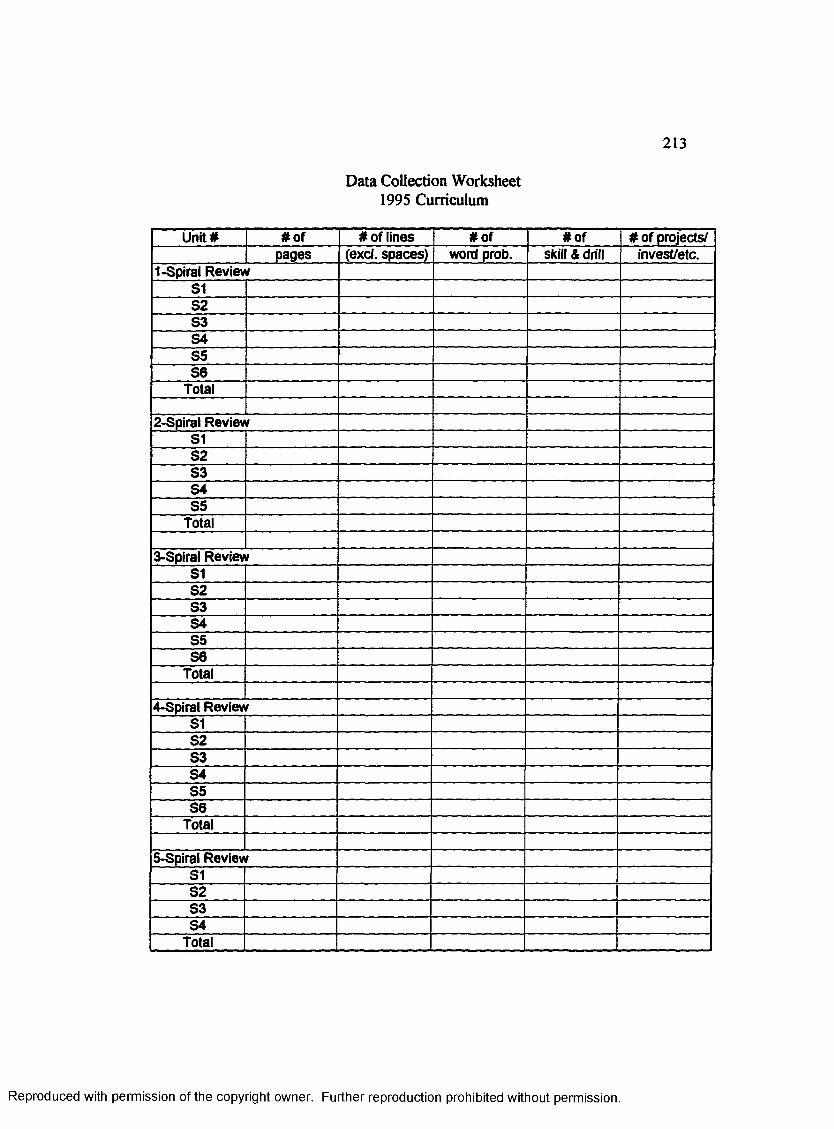
Data Collection Worksheet1995 Curriculum
213
Unit# #o f # of lines # of #of # of projects/oaaes fexcl. spaces) word prob. skill & drill invest/etc.
Reproduced with permission of the copyright owner. Further reproduction prohibited without permission.
9543379

Data Collection Worksheet1995 Curriculum
214
Unit# # of # of lines # o f # of # of projects/pages (excl. spaces) word prob. skill & drill invest/etc.
6-Spiral ReviewS1S2S3S4
Total
7-Spiral ReviewS1S2S3S4S5
Total
8-Spiral ReviewS1S2S3S4S5S6
Total
9-Spiral ReviewS1S2S3S4S5
Total
10-AllTotal
Reproduced with permission of the copyright owner. Further reproduction prohibited without permission.

Appendix I 215
NUD*IST Node Listing Report for Mathematical Materials Analysis Instrument (MMAI)
1) /Grades 5-81 I) /Grades 5-8/Problem Solving (CritThinking)1 1 1) /Grades 5-8/Problem Solving (Crit.Thinking)/Original thinking1 1 2) /Grades 5-8/Problem Solving (Crit.Thinking)/Chk reasonable-completeI 1 3) /Grades 5-8/Problem Solving (Crit.Thinking)/Topics apply to real worldI 1 4) /Grades 5-8/Problem Solving (Crit.Thinking)/Probs.non-routine;multi-step1 1 5) /Grades 5-8/Problem Solving (Crit.Thinking)/Determine prob;colIect data;
etc.116) /Grades 5-8/Problem Solving (Crit.Thinking)/Computer simulationsI 1 7) /Grades 5-8/Problem Solving (Crit.Thinking)/Info in various forms
(tables,graphs, formulas, & functions)1 1 8) /Grades 5-8/Problem Solving (Crit.Thinking)/Group problem solving 1 1 9) /Grades 5-8/Problem Solving (Crit.Thinking)/Several strategies-
techniquesd1 1 10) /Grades 5-8/Problem Solving (Crit.Thinking)/Concrete to formal1111) /Grades 5-8/Problem Solving (Crit.Thinking)/Interdisciplinary projects-
exercises1 1 12) /Grades 5-8/Problem Solving (Crit.Thinking)/Generalize results to other
situations & subject-matter areas I 2) /Grades 5-8/Communication1 2 1) /Grades 5-8/Communication/Variety - verbal,concrete,gr.,pictorial,etc.1 2 2) /Grades 5-8/Communication/Open ended; reflection,org.,& communication1 2 3) /Grades 5-8/Communication/Take positions & defend12 4) /Grades 5-8/Communication/Formal symbolism demonstrated1 2 5) /Grades 5-8/Communication/Read, analyze math emphasized12 6) /Grades 5-8/Communication/Write math from real-world12 7) /Grades 5-8/Communication/Demonstrate vocab & notation1 3) /Grades 5-8/Computation13 1) /Grades 5-8/Computation/Pencil, paper fractions common denom13 2) /Grades 5-8/Computation/Calculator for more cumbersome fractions &
decimals13 3) /Grades 5-8/Computation/Develop algorithms - whys13 4) /Grades 5-8/Computation/Guess-ck, mental arith used for reasonableness1 4) /Grades 5-8/Measurement14 1) /Grades 5-8/Measurement/Metric system - length,vol,etc1 4 2) /Grades 5-8/Measurement/English system & relationships1 4 3) /Grades 5-8/Measurement/Appropriate instruments1 4 4) /Grades 5-8/Measurement/Make & interpret scale drawingsI 4 5) /Grades 5-8/Measurement/Area,volume formulas,procedures1 4 6) /Grades 5-8/Measurement/Estimate metric & English____________________________________________________________ listing continued
Reproduced with permission of the copyright owner. Further reproduction prohibited without permission.

216
NUD*IST Node Listing Report for Mathematical Materials Analysis Instrument (MMAI)
14 7) /Grades 5-8/Measurement/Student developed-systems14 8) /Grades 5-8/Measurement/Perimeter,area,vol intuitive14 9) /Grades 5-8/Measurement/Real-world data collected1 5) /Grades 5-8/Number and Number Systems15 1) /Grades 5-8/Number and Number Systems/Sets: counting irrational15 2) /Grades 5-8/Number and Number Systems/Numbers - several representations
(fr.,dec.,etc.) & processes to convert I 5 3) /Grades 5-8/Number and Number Systems/Nos.written num.,word,exp.not.15 4) /Grades 5-8/Number and Number Systems/No.& graph relationships1 5 5) /Grades 5-8/Number and Number Systems/Ratio & proportion -nontraditional
uses15 6) /Grades 5-8/Number and Number Systems/Appropriate forms o f nos.used
(sc.not.,dec.,ff.,etc.)1 5 7) /Grades 5-8/Number and Number Systems/Term.,non-term,repeating1 5 8) /Grades 5-8/Number and Number Systems/GCF,LCM, divisibility15 9) /Grades 5-8/Number and Number Systems/Math as body o f knowledge -
logical & rules15 10) /Grades 5-8/Number and Number Systems/Relation & function I 6) /Grades 5-8/Geometry1 6 1) /Grades 5-8/Geometry/Identify, describe 1-2-3 dimensions16 2) /Grades 5-8/Geometry/Visualize, represent, manipulate 1-2-3 dim.1 6 3) /Grades 5-8/Geometry/Geom prop: sim:ratio; congrequiv.,etc.16 4) /Grades 5-8/Geometry/Geom.reltnshps-non-classroom projectsI 6 5) /Grades 5-8/Geometry/Geom & physical world16 6) /Grades 5-8/Geometry/Constr.,draw,measure geom properties1 6 7) /Grades 5-8/Geometry/T echnology-geom properties1 7) /Grades 5-8/Probability & Statistics17 1) /Grades 5-8/Probability & Statistics/Collection & org. of data1 7 2) /Grades 5-8/Probability & Statistics/Data described charts,gr,tables17 3) /Grades 5-8/Probability & Statistics/Bias in collection of data17 4) /Grades 5-8/Probability & Statistics/11 7 5) /Grades 5-8/Probability & Statistics/Basis stat notions (measures o f central
tend., variab.,correlation, error)17 6) /Grades 5-8/Probability & Statistics/Probability in lab & real world1 7 7) /Grades 5-8/Probability & Statistics/Simulations-expmts - empirical
probabilities1 7 8) /Grades 5-8/Probability & Statistics/Prob. in chance,ins.,weather,etc.1 7 9) /Grades 5-8/Probability & Statistics/Level o f accuracy, precision needed
emphasized_________________________________________________________ listing continued
Reproduced with permission of the copyright owner. Further reproduction prohibited without permission.

NUD*IST Node Listing Report for Mathematical Materials Analysis Instrument (MMAI)
(18) /Grades 5-8/Algebra(1 8 1) /Grades 5-8/Algebra/Models,data,tables,gr,matrices-used with
variables,expressions,equations (18 2) /Grades 5-8/Algebra/Concrete to invest.pattems in no.seq.,make predictions,
formulate verbal rules (18 3) /Grades 5-8/Algebra/De-emphasis on routine alg.manipulations(2) /Grades 9-12(2 1) /Grades 9 -12/Problem Solving (Crit. thinking)(2 11) /Grades 9 -12/Problem Solving (Crit.thinking)/Introduce,devl,review math
topics(2 1 2) /Grades 9-12/Problem Solving (Crit.thinking)/Concrete models - realistic
situations(2 1 3) /Grades 9-12/Problem Solving (Crit.thinking)/Variety strategies; broad range
o f problems(2 1 4) /Grades 9-12/Problem Solving (Crit.thinking)/Application knowledge to
unfamiliar situations(2 1 5) /Grades 9-12/Problem Solving (Crit.thinking)/More than one solution(2 1 6) /Grades 9 -12/Problem Solving (Crit.thinking)/Analyze incorrect solutions to
identify errors in problem-solving process (2 2) /Grades 9-12/Communication(2 2 1 ) /Grades 9-12/Communication/Small groups(2 2 2) /Grades 9-12/Communication/Variety - speaking,writing,etc.(2 2 3) /Grades 9-12/Communication/Sym.,notation demonstrated(2 2 4) /Grades 9-12/Communication/Students use sym.,notation(2 2 5) /Grades 9-12/Communication/Students use math vocab(2 2 6) /Grades 9-12/Communication/Write deduct argum in paragraph form(2 3) /Grades 9-12/Computation & Estimation(2 3 1) /Grades 9-12/Computation & Estimation/Choice: mental,calc,pencil(2 3 2) /Grades 9-12/Computation & Estimation/Appropriate computation stressed(2 3 3) /Grades 9-12/Computation & Estimation/Estimation - judge reasonableness(2 3 4) /Grades 9-12/Computation & Estimation/Estimation frequently as part of
problem-solving process (2 3 5) /Grades 9-12/Computation & Estimation/Precision of results determined(2 3 6) /Grades 9-12/Computation & Estimation/Reasonableness as important part of
process
(2 4) /Grades 9-12/Reasoning(2 4 1) /Grades 9-12/Reasoning/Listen & discuss(2 4 2) /Grades 9-12/Reasoning/Explore & question(2 4 3) /Grades 9-12/Reasoning/Summarize & evaluate listing continued
permission of the copyright owner. Further reproduction prohibited without permission.

218
NUD*IST Node Listing Report for Mathematical Materials Analysis Instrument (MMAI)(2 4 4) /Grades 9-12/Reasoning/Explore patterns(2 4 5) /Grades 9-12/Reasoning/Make & test conjectures(2 4 6) /Grades 9-12/Reasoning/Follow & judge logical arguments(2 5) /Grades 9-12/Integration(2 5 1) /Grades 9-12/Integration/Function, unifying across all math courses(2 5 2) /Grades 9-12/Integration/Limit, max,min throughout Algebra strand
(2 5 3) /Grades 9-12/Integration/Geom properties not restricted to formal geometrycourses
(2 5 4) /Grades 9-12/Integration/Discrete math - matrices, finite graphs, seq.,series,comb., perm.,& discrete prob.)
(2 5 5) /Grades 9-12/Integration/Collect, organize, & display data(2 5 6) /Grades 9-12/Integration/Original problems integrate math content(2 6) /Grades 9-12/Interdisciplinary Emphasis(2 6 1) /Grades 9-12/Interdisciplinary Emphasis/Integrate with other curricular areas(2 6 2) /Grades 9-12/Interdisciplinary Emphasis/Data real-world - trig functions(2 6 3) /Grades 9-12/Interdisciplinary Emphasis/Probability in sport, business, etc.(2 6 4) /Grades 9-12/Interdisciplinary Emphasis/Charts,tables,graphs -inferences from
real-wold(2 6 5) /Grades 9-12/Interdisciplinary Emphasis/Apply stat techniques other subject
areas(2 6 6) /Grades 9-12/Interdisciplinary Emphasis/Computation outside school setting(2 7) /Grades 9-12/Technology(2 7 1) /Grades 9-12/Technology/Calc&comp.for graphings(2 7 2) /Grades 9-12/Technology/Sc.calc instead o f interp & tables(2 7 3) /Grades 9-12/Technology/Calc & comp in stat invest.(2 7 4) /Grades 9-12/Technology/Calculators daily work & exams(2 7 5) /Grades 9-12/Technology/Computers daily work & exams(2 7 6) /Grades 9-12/Technology/Calc for estim & reasonableness(2 8) /Grades 9-12/Other Curriculum Emphasis(2 8 1) /Grades 9-12/Other Curriculum Emphasis/Math topics not requiring
competence with paper-and-pencil skills (2 8 2) /Grades 9-12/Other Curriculum Emphasis/Alg concepts:
linearity, fhctn,equiv., solution (2 8 3) /Grades 9- 12/Other Curriculum Emphasis/Various geometries(2 8 4) /Grades 9-12/Other Curriculum Emphasis/3-d figures develop spatial skills(2 8 5) /Grades 9-12/Other Curriculum Emphasis/Validity o f stat conclusions(2 8 6) /Grades 9-12/Other Curriculum Emphasis/Uses & abuses o f data
interpretation
Reproduced with permission of the copyright owner. Further reproduction prohibited without permission.

Appendix J M I R A N D A 219
Educational Consultants 2619 San Pablo
Bakersfield, California 93306 805 872-0374
http://www.kera.coin/miranda/
To whoa I t may concern:I have known Karen Conger for severa l years and found h e r professional work to be c rea tive and challang lng . She has passed th is c re a tiv ity to the published work she has been doing fo r the m igrant Pass program.
I fin d the migrant educational m ate ria l th a t Mrs. Karen Conger has published very u se fu l in the m igrant pass program. I t i s a concise m atrix of mathematical m ateria l th a t challenges the student in a program th a t r e l ie s on the students m otivation and in e r t ia in accomplishing an assigned ta sk . Mrs. Conger has brought together mathematical m a te ria l in a way th a t the student i s ab le to accomplish th e ir ob jec tive and gain c re d it toward th e ir f in a l goal. This m ate ria l, as a l l Pass program m ateria l, i s e s se n tia l in the accomplishment o f th is schools m ission.
Rudy Miranda, Ed.D D irector of Guidance Shafter High School
Scholarships •Grants •FsUousbips • College Loans
College Selections • College Visitations • CoBtge Forms • Tutoring
Reproduced with permission of the copyright owner. Further reproduction prohibited without permission.

220Appendix K
Examples of Word Problems from 1989 and 1995 P.A.S.S. Curricula
1989 P.A.S.S. Curriculum (selected problems)
1. Pedro has a fruit stand. He sells each flat of boysenberries for 11 dollars. How much will he make if he sells 45 flats?
2. Patty earned 8,625 dollars for working 125 days. If she earned the same amount each day, how much did she earn each day?
3. At $ .33 per pound, how many pounds of apples can you buy for $1.65?
4. What is the volume of a can of soup if the radius of its base is 3 inches and its height is 6 inches?
5. Dr. Fixmeup prescribed 25 ml of protein supplement to be taken five times per day. How much protein supplement must the patient buy for 20 days?
Other: There were several problems requiring students to read charts and answer questions, e.g., temperature charts, bushels of com harvested, but most word problems were of the caliber shown above.
1995 P.A.S S Curriculum(selected problems. Also see Appendix U)
1. A section of land is defined as one mile square and 640 acres. An acre- foot of water is the amount of water required to cover an acre of land one foot deep. If cotton requires three acre-feet to grow to maturity during the season, how many acre-feet of water are required to water a section of cotton?
Reproduced with permission of the copyright owner. Further reproduction prohibited without permission.

221
2. Cotton lint sells for $0.80 per pound and cotton seeds sell for $0.10. The farmer retains 40% of the seeds for replanting the following years crop. How much total revenue will the cotton lint and cotton seeds produce for the farmer:
a) per acre? b) per section?
3. The foreman at an oil company has a well drilled to a depth of 10,000 ft. with cylindrical tubing going all the way to the bottom of the hole. If the tubing has an inside diameter of 2.5 in., what is the volume, in gallons to the nearest thousandth, of the tubing:a) per ft.? b) to the bottom of the well?
4. An oil well produces 185 bbls. of oil per day (BOPD). How many gallons of oil does the well produce per day?
5. A high powered drag racing vehicle has an elapsed time of 4.5 seconds in a 1/4 mile run. What is the average speed in miles per hour o f the vehicle?
6. A baseball pitcher throws a ball that register 95 mph at home plate. If the ball travels at a constant rate of speed from the pitcher’s mound to home plate (a distance of 60 feet), find the time (to the nearest hundredth second) required for the ball to travel from the pitcher’s mound to home plate.
7. The distance from the Earth to the Moon is approximately 240,000 miles and light travels at approximately 186,000 miles per second. Find the time required for light to travel from the Earth to the Moon (to the nearest hundredth second)?
Reproduced with permission of the copyright owner. Further reproduction prohibited without permission.

222Appendix L
Examples of Projects and Investigations from 1989 and 1995 P.A.S.S. Curricula
1989: None
199S: (in addition to those found in Appendixes R and U)
From: Unit IV - Patterns. Functions, and Mathematical Connections
■ R e s e a r c h P r o j e c t : F in d p ic tu r e s o f
g r e a t a r t a n d a rc h ite c tu r e t h a t a r e
k n o w n fo r th e ir e x c e lle n c e . M a k e
m e a su r e m e n ts a n d d e ter m in e w h e th e r
th e g o ld e n r e c ta n g le or o th er
F ib o n a cc i r a t io i s p resen t. D is p la y
sk e tc h e s o f y o u r f in d in g s in th e
cla ssroom .
D e s ig n P r o j e c t : C r e a te a d r a w in g th a t u s e s th e g o ld e n r e c ta n g le r a t io or
o th er F ib o n a c c i r a tio . Y o u m a y d e s ig n a b u ild in g or crea te a n a r t is t ic
d ra w in g t h a t d e m o n s tr a te s th e ratio .
C la s s P r o je c t* E x a m in e b ra n ch es from d iffe r e n t p la n ts an d d e te r m in e i f
th e y d is p la y p h y llo ta c t ic r a tio s . M ake a c h a r t a n d l is t th e ty p e o f p la n t
an d i t s r a tio . D is p la y th e p la n ts w ith p h y llo ta c t ic r a tio s in a s e p a r a te
colu m n.
Reproduced with permission of the copyright owner. Further reproduction prohibited without permission.

T e s s e l l a t i o n P r o j e c t ; U s e th e o c ta g o n -sq u a r e g r id
p a p e r o n t h e n e x t p a g e to d e s ig n a te s s e lla t io n . B e
th e b e s t t e s s e l la t io n s . D is p la y th e w in n e r s in th e
c la ssroom !
c r e a t iv e a n d co lo r fu l! H a v e a c la s s c o n te s t a n d v o te for
223
P r o j e c t : M . C . E sc h e r w a s a fa m o u s D u tc h a r t is t w h o l iv e d from 1 8 9 8 to
1 9 7 2 . H e i s fa m o u s for h is t e s s e l la t io n d r a w in g s a n d M o o r ish m o sa ics .
c o n tr ib u tio n s . S e p a r a te y o u r r e se a r c h in to grou p rep o r ts to m a k e
p r e s e n ta t io n s to th e c la ss .
C o o p e r a t iv e L e a r n in g P r o b l e m 6 : D r a w a d e s ig n u s in g sy m m etry . T h is
m e a n s y o u w i l l d r a w a p o r tio n o f th e d e s ig n , a n d th e n r e f le c t i t in to m irror
im a g e s . T h e p r o c e ss i s s h o w n w it h a s im p le l in e d r a w in g . T h e d e s ig n i s
d r a w n in F ig u r e 1.
d e s ig n i s r o ta te d or
t i l te d a n d t h e n f lip p e d h o r iz o n ta lly . T h er e a r e m a n y v a r ia t io n s . Y o u c a n
f lip th e d e s ig n v e r t ic a l ly ft o r d ia g o n a l ly / or \ a lso . U s e y o u r im a g in a t io n
o n ce y o u h a v e d r a w n you r o r ig in a l d e s ig n . It m a y h e lp i f y o u th in k o f
sp e c if ic u s e s for y o u r d e s ig n su c h a s a k ite , a te e -sh ir t , a q u ilt , or a p oster .
C on d u ct r e se a r c h to fin d o u t fa c ts a b o u t h is l i f e a n d h is a r t is t ic
In F ig u r e 2 , th e
d e s ig n i s f lip p e d
h o r iz o n ta lly =>. I n
F ig u r e 3 , t h e o r ig in a l F icuze 1 Fieuc© 2 Figure 3
Reproduced with permission of the copyright owner. Further reproduction prohibited without permission.

Appendix M 224
Tables of Contents -1989 P.A.S.S. Curriculum(Subheadings are typed directly from tables of contents, and errors have not been corrected. Headings have been added for clarity.)
Unit I - Numeration Systems and Place ValueRationale 1Primary idea 1instructional Goals 1General Directions 2An Introduction to Numeration Systems 3Recognizing whole Numbers 4
Activity 1 5Place value and Whole Numbers 6
Understanding Place Value 6Activity 2 7
Looking at Larger Numbers 8Activity 3 9
More on Larger Numbers 11Activity 4 12
Word Number 13Activity 5 15
Face Value, Place Value, and Total Value 17Activity 6 19
Expanded Notation 20Activity 7 22
Word Numbers Review 23Activity 8 24
Expanded Notation Review 26Activity 9 28
The Roman Numeral system 29Activity 10 32
Roman Numeral Review 35Activity 11 36
Application 37Activity 12 38
Glossary 41Progress Report 42Sample Problem Answers 43Bibliography 46Unit II - Addition and SubtractionRationale 1Primary idea 1instructional Goals 1General Directions 2An Introduction to Addition 3Basic Addition Facts 4
Activity 1 6Basic Addition Facts - Greater sums 9
Activity 2 11
Reproduced with permission of the copyright owner. Further reproduction prohibited without permission.

225Basic Facts Applications 13
Activity 3 14Addition Without Regrouping 15
Activity 4 18Two Digit Addition Regrouping 20
Activity 5 22Two Digit Addition With Regrouping Review 24
Activity 6 25Two Digit Addition With Regrouping Application 27
Activity 7 29Two Digit Addition - Regrouping in the Tens Place 31
Activity 8 33Three Digit Addition With Zeros 35
Activity 9 37Three Digit Addition with Regrouping 38
Activity 10 40Three Digit Addition Application 41
Activity 11 43Multiple Addends with Regrouping 45
Activity 12 47Four Digit Addition with Regrouping 48
Activity 13 49Four Addends Application 50
Activity 14 51An introduction to subtraction 52Basic subtraction Facts 53
Activity 15 55Basic Facts Application 58
Activity 16 59Subtraction Without Regrouping 60
Activity 17 64Subtraction of Two digits With Regrouping 66
Activity 18 69Two Digit Subtraction Application 71
Activity 19 73Three Digit subtraction With Regrouping 75
Activity 20 84Three Digit subtraction Application 86
Activity 21 88Four Digit Subtraction With Regrouping 90
Activity 22 93More on Four Digit subtraction 94
Activity 23 97six Digit Subtraction With Regrouping 98
Activity 24 104Multiple Digit subtraction Application 105
Activity 25 107Glossary 109Sample Problem Answers 110Progress Report 118Bibliography 120
Reproduced with permission of the copyright owner. Further reproduction prohibited without permission.

Unit HI - Multiplication 226Rationale 1Primary idea 1Instructional Objectives 1General Directions 2An Introduction to Multiplication 3Basic Multiplication Facts 5
Activity 1 9Basic Pacts Application 14
Activity 2 15Two Digit Multiplication without Regrouping 17
Activity 3 20Two Digit Multiplication with Regrouping 21
Activity 4 23Three Digit Multiplication With Zero 24
Activity 5 28Two Digits Times Two Digit Multiplication 29
Activity 6 34Two Digit Times Two Digit Application 36
Activity 7 38Three Digit Multiplication 40
Activity 8 49More on Three Digit Multiplication 51
Activity 9 57Three Digit Multiplication Application 59
Activity 10 61sample Problem Answers 63Glossary 79Progress Report 80Bibliography 81Unit IV - DivisionPurpose 1Primary idea 1Instructional Goals 1student Directions 2introduction to Division 3
Activity I 86 Basic Steps of Division 10
Activity II 12Basic Facts Review 14
Activity III 14simple Division Application 17
Activity IV 19One Digit Divisor And Two Digit Dividend With Remainders 21
Activity v 24Activity VI 25
one Digit Divisor And Three or Four Digit Dividend with zero 26Activity VII 28
More on one Digit with Remainders 29Activity VIII 34Activity IX 35
One Digit Divisor Application 36Activity X 37
Reproduced with permission of the copyright owner. Further reproduction prohibited without permission.

227Two Digit Divisor And Two Digit Dividend Without Remainder 39
Activity XI 40Two Digit Divisor And Two Digit Dividend With Remainder 42
Activity XII 43Two Digit Divisor And Two Digit Dividend with zero 45
Activity XIII 46Two Digit Divisor And Three Digit Dividend Without Remainder 47
Activity XIV 49Two Digit Divisor And Three Digit Dividend with Remainder 50
Activity XV 55Two Digit Divisor And Multiple Digit Dividend without Remainder 56
Activity XVI 58Two Digit Divisor Application 59
Activity XVII 60Three Digit Divisor And Multiple Digit Dividend Without Remainder 62
Activity XVIII 65Three Digit Divisor And Multiple Digit Dividend with Remainder 66
Activity XIX 69Three Digit Divisor And Dividend With Zero 70
Activity XX 72Multiple Dividends 73
Activity XXI 76Three Digit Divisor Application 78
Activity XXII 80sample Problem Answers 81Glossary 92Progress Report 93Bibliography 94Unit V - ApplicationRationale 1Primary Idea 1Instructional Goals 1General Directions 2Review of Addition 3
Activity 1 3Review of Subtraction 5
Activity 2 5Review of Multiplication 6
Activity 3 6Activity 4 8Activity 5 10
Review of Division 11Activity 6 11Activity 7 13
An introduction to Problem solving 14Estimation 18
Activity 8 17Using Estimation 19
Activity 9 20Choosing the operation 22
Activity 10 26Strategies for Problem Solving 29
Reproduced with permission of the copyright owner. Further reproduction prohibited without permission.
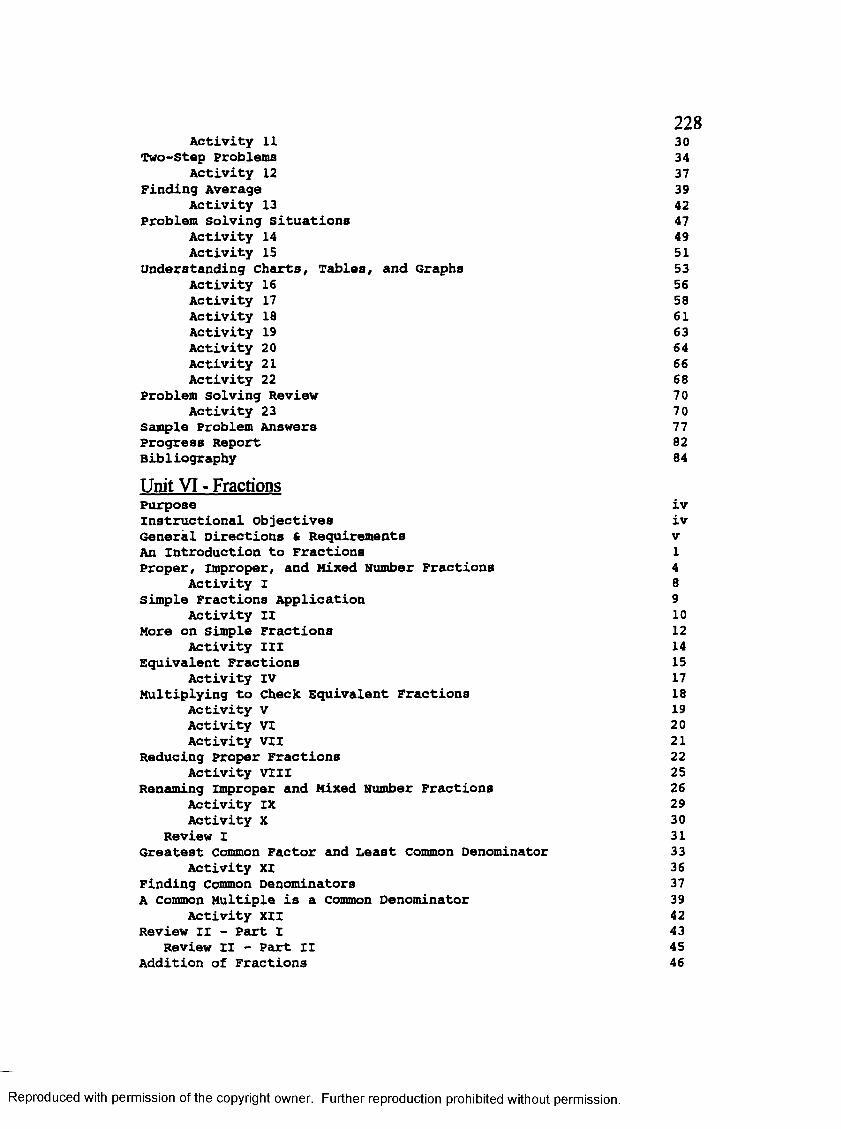
228Activity 11 30
Two-Step Problems 34Activity 12 37
Finding Average 39Activity 13 42
Problem solving situations 47Activity 14 49Activity 15 51
understanding charts, Tables, and Graphs 53Activity 16 56Activity 17 58Activity 18 61Activity 19 63Activity 20 64Activity 21 66Activity 22 68
Problem Solving Review 70Activity 23 70
Sample Problem Answers 77Progress Report 82Bibliography 84
Unit VI - FractionsPurpose ivInstructional objectives ivGeneral Directions 6 Requirements vAn Introduction to Fractions 1Proper, improper, and Mixed Number Fractions 4
Activity I 8simple Fractions Application 9
Activity II 10More on simple Fractions 12
Activity III 14Equivalent Fractions 15
Activity IV 17Multiplying to Check Equivalent Fractions 18
Activity V 19Activity VI 20Activity VII 21
Reducing proper Fractions 22Activity VIII 25
Renaming Improper and Mixed Number Fractions 26Activity IX 29Activity x 30
Review I 31Greatest Common Factor and Least Common Denominator 33
Activity XI 36Finding Common Denominators 37A common Multiple is a common Denominator 39
Activity XII 42Review II - Part I 43
Review II - Part II 45Addition of Fractions 46
Reproduced with permission of the copyright owner. Further reproduction prohibited without permission.

229Activity XIII 52Activity XIV 54
Addition of Unlike Fractions 57Activity XV 63Activity XVI 64
Addition of Fractions Application 68Activity XVII 70
Subtraction of Fractions 72Activity XVIii 73
Subtraction of unlike Fractions 78Activity XIX 81
Subtraction of Mixed Fractions 82Activity XX 83
Subtraction of Mixed Fractions with No Regrouping 83Activity XXI 84
Mixed Fractions with Regrouping 85Activity XXII 89
Review III 92subtraction of Fractions Application 93
Activity XXIII 94Multiplication of Fractions 96
Activity XXIV 100Activity XXV 102
Cancellation 102Activity x x v i 105
Multiplication of Fractions Application 108Activity x x v n 110
Division of Fractions 112Activity XXViii 115Activity XXIX 116
Division of Fractions Application 119Activity XXX 120
Sample Problem Answers 122Glossary 141Progress Report 142Bibliography 144Unit YE - DecimalsPurpose ivInstructional objectives ivGeneral Directions vAn Introduction To Decimals 1Understanding Decimal Place Value 3
Activity I 7Reading and writing Decimals 8
Activity II 10Activity III 11
ordering Decimals By size 12comparing Decimals with Different Number of Decimal Places 15
Activity IV 16Activity v 17
Application of Decimals 18Activity VI 19
Reproduced with permission of the copyright owner. Further reproduction prohibited without permission.

230Changing Decimals To Fractions 19
Activity VII 21Changing Fractions to Decimals When the Denominator
is a Multiple of Ten 22Activity VIII 23
Review I 24Addition of Decimals 25
Activity IX 28Activity X 29
Application - Addition of Decimals 30Activity XI 32
Subtraction of Decimals 34Activity XII 37
Application - subtraction of Decimals 38Activity XIII 41
Review II 42Multiplication of Decimals 43Multiplication by a one-place Digit 43
Activity XIV 44Multiplication by a Two-place Digit 45
Activity XV 46Multiplying by Multiples of 10 47Application - Multiplication of Decimals 49
Activity XVI 51Division of Decimals 52Whole Number Divisor 52□sing a Decimal Divisor 55
Activity XVII 56Adding Zeros as Placeholders 57
Activity XVIII 58Rounding Decimals 59
Activity XIX 62Changing Fractions to Decimals when the Denominator
is Not a Multiple of Ten 63Activity XX 65Activity XXI 65
Application - Division of Decimals 66Activity XXII 68
Review III 69Application - Review 70Activity XXIII 70
Progress Report 72Sample Problem Answers 73Glossary 85Bibliography 86Unit Yin - PercentPurpose iiiInstructional objectives iiiStudent Directions ivAn introduction to Percents 1
Reproduced with permission of the copyright owner. Further reproduction prohibited without permission.

231Changing Common Fractions and Mixed Numbers to Percents 4
Activity I 6Activity II 8Activity III 10
Application - Changing common Fraction and Mixed Numbersto Percents 11Activity IV 13
changing Percent to Decimals 14Activity V 17
Finding a Percent of a Number 18Activity VI 21
Application - Changing Percent to Decimal 22Activity vii 24
Application - Finding Discounts 25Activity VIII 28
Application - Finding sales Tax 30Activity IX 32
Application - Finding commission 33Activity X 34
Application - Finding simple Interest 35Activity XI 36
Review 37Finding what Percent One Number Is of Another 39
Activity XII 41Application - Finding What Percent one Number is of Another 42
Activity XIII 44Finding A Number When A Percent is Known 46
Activity XIV 48Ratio and Proportion 49
Activity XV 56Application - Ratio and Proportion 57
Activity XVI 60Solving Percent By Using Ratio and Proportion In An Equation 60
Activity XVII 6 4sample Problem Answers 66Glossary 69Progress Report 70Bibliography 71Unit IX - MeasurementRationale 1Primary Idea 1instructional Goals 1student Directions 2Introduction to Measurement 3Informal Geometry Using Units of Measure 5Points, Lines, and Line segments 5Kinds and Positions of Lines 7
Activity I 9Measuring and Drawing Line Segments 10
Activity II 12Activity III 13
Planes and space 14
Reproduced with permission of the copyright owner. Further reproduction prohibited without permission.

232Angle Measurement 16
Activity IV 18Activity V 20
Measuring Angles of a Triangle 22Activity VI 23
Perimeter 25The Perimeter of a Rectangle 25
Activity VII 27The Perimeter of a square 28
Activity VIII 29The Perimeter of a Triangle 30
Activity IX 31Circumference 32Finding the Circumference of a Circle 32
Activity X 35Finding the Radius of a Circle 37
Activity XI 38Finding the Diameter of a circle 39
Activity XII 40Application - Perimeter 42
Activity XIII 45Review I 47units of Measure 51changing a Smaller Unit to a Larger Unit 52
Activity xiv 54changing a Larger Unit to a smaller Unit 55
Activity XV 56comparing Units of Liquid Measure 57changing a smaller unit to a Larger unit 57
Activity XVI 58changing a Larger Unit to a smaller Unit 59
Activity xvil 60comparing Units of Weight Measurement 61changing a smaller unit to a Larger unit 61
Activity x v ili 62Changing a Larger Unit to a Smaller Unit 63
Activity XIX 63Expanded Lineal Measurement 64
Activity XX 65Expanded Liquid and Dry Measurement 66
Activity XXI 67Addition of Measures 68
Activity XXII 70Subtraction of Measures 71
Activity XXIII 73Multiplication of Measures 74
Activity XXIII 76Division of Measures 77
Activity xxv 78Application of Measure 79conversions 79
Activity xxvi 81operations 83
Reproduced with permission of the copyright owner. Further reproduction prohibited without permission.

233Activity XXVII 85
Measuring Area 86Area of a Rectangle 88
Activity XXVIII 90Area of a Square 90Area of a Parallelogram 92Area of a Triangle 93
Activity XXIX 95Area of a Trapezoid 96Area of a Circle Using a Radius 97
Activity x x x 99Area of a Circle using a Diameter 100
Activity XXXI 102Application - Finding Area 103
Activity XXXII 107volume 108volume of Rectangular Solids 108
Activity XXXIII 111Activity XXXIV 112
volume of Pyramids 115Activity XXXV 116Activity XXXVI 117
Volume of cones 119Activity XXXVII 121Activity XXXVIII 121
volume of a Cylinder 123Activity XXXIX 125
Review II 126Application - Measuring Volume 127
Activity x x x x 130Glossary 132sample Problem Answers 134Progress Report 141Bibliography 143
Unit X - MetricsRationale 1Primary Idea 1Instructional objectives 1students Directions 2introduction To The Metric system 3Renaming Metric Units 6Length 9
Activity I 11Activity II 13Activity III 15Activity r v 16Activity V 20Activity VI 21Activity VII 22Activity VIII 24
Review I 25Application Measuring Distance Over Time 28
Reproduced with permission of the copyright owner. Further reproduction prohibited without permission.

234Activity IX 30Activity x 32Activity XI 33
sewing With Metric Measures 35Activity XII 37
Review II 38Finding Perimeter 40
Activity XIII 41Application Perimeter 42
Activity xiv 44Area 45
Activity XV 48Activity XVI 49Activity xvil 50Activity xvili 51
Application Finding Area With A Scale Drawing 52Activity XIX 53
Application Area 54Activity XX 56
Review III 57Volume 60
Activity XXI 62Activity XXII 66Activity XXIII 69
Application volume or capacity 70Activity XXIV 73
weight or Mass 74Activity xxv 79Activity xxvi 80
Application weight or Mass 81Activity xxvn 83Activity x x v m 86
Temperature 87Activity XXIX 88
Application Using A Temperature chart 90Activity XXX 92
Glossary 93Answer Key 94Progress Report 100Bibliography 102
Reproduced with permission of the copyright owner. Further reproduction prohibited without permission.
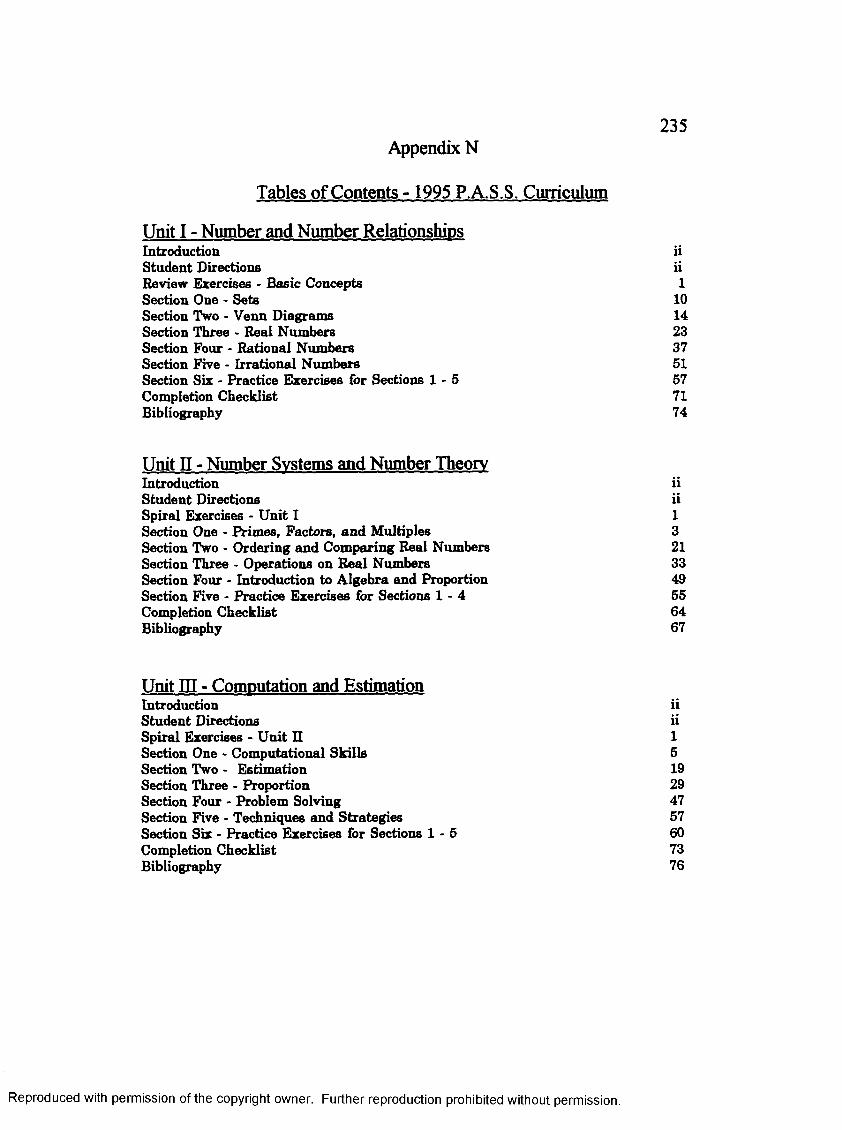
235Appendix N
Tables of Contents - 1995 P.A.S.S. Curriculum
Unit I - Number and Number RelationshipsIntroduction iiStudent Directions iiReview Exercises - Basic Concepts 1Section One - Sets 10Section Two - Venn Diagrams 14Section Three - Real Numbers 23Section Four - Rational Numbers 37Section Five - Irrational Numbers 51Section Six - Practice Exercises for Sections 1 - 5 57Completion Checklist 71Bibliography 74
Unit II - Number Systems and Number TheoryIntroduction iiStudent Directions iiSpiral Exercises - U nit I 1Section One - Primes, Factors, and Multiples 3Section Two - Ordering and Comparing Real Numbers 21Section Three - Operations on Real Numbers 33Section Four - Introduction to Algebra and Proportion 49Section Five - Practice Exercises for Sections 1 - 4 55Completion Checklist 64Bibliography 67
Unit HI - Computation and EstimationIntroduction iiStudent Directions iiSpiral Exercises - U nit II 1Section One - Computational Skills 5Section Two - Estimation 19Section Three - Proportion 29Section Four - Problem Solving 47Section Five - Techniques and Strategies 57Section Six - Practice Exercises for Sections 1 - 5 60Completion Checklist 73Bibliography 76
Reproduced with permission of the copyright owner. Further reproduction prohibited without permission.

2 3 6Unit IV - Patterns. Functions, and Mathematical ConnectionsIntroduction iiStudent Directions iiSpiral Exercises - Unit III 1Section One - Patterns 4Section Two - Fibonacci Patterns 16Section Three - Graphs and Functions 28Section Four - More on Functions 37Section Five - Mathematical Connections 41Section Six - Practice Exercises for Sections 1 - 5 58Completion Checklist 68Bibliography 71
Unit V - MeasurementIntroduction iiStudent Directions iiSpiral Exercises • Units I-IV 1Section One - Measurable Properties of Physical Objects 15Section Two - Systems of Measurement 45Section Three - Applications o f Measurement 56Section Four - Practice Exercises for Sections 1 - 3 76Completion Checklist 82Bibliography 86
Unit VI - Statistics and ProbabilityIntroduction iiStudent Guidelines and Directions iiSpiral Exercises - Units I-V 1Section One - Data Collection and Representation 7Section Two - Data Analysis 35
- Probability 47Section Three - Investigation 61Section Four - Practice Exercises for Sections 1 - 2 65Completion Checklist 72Bibliography 74
Unit VII - AlgebraIntroduction iiStudent Guidelines and Directions iiSpiral Review - Unit VI 1Section One - Abstraction and Symbolism 9Section Two - Variables, Expressions, and Linear Equations 16Section Three - Nonlinear Equations and Inequalities 26Section Four - Matrices 35Section Five - Practice Exercises for Sections 1-4 44Completion Checklist 53Bibliography 55
Reproduced with permission of the copyright owner. Further reproduction prohibited without permission.
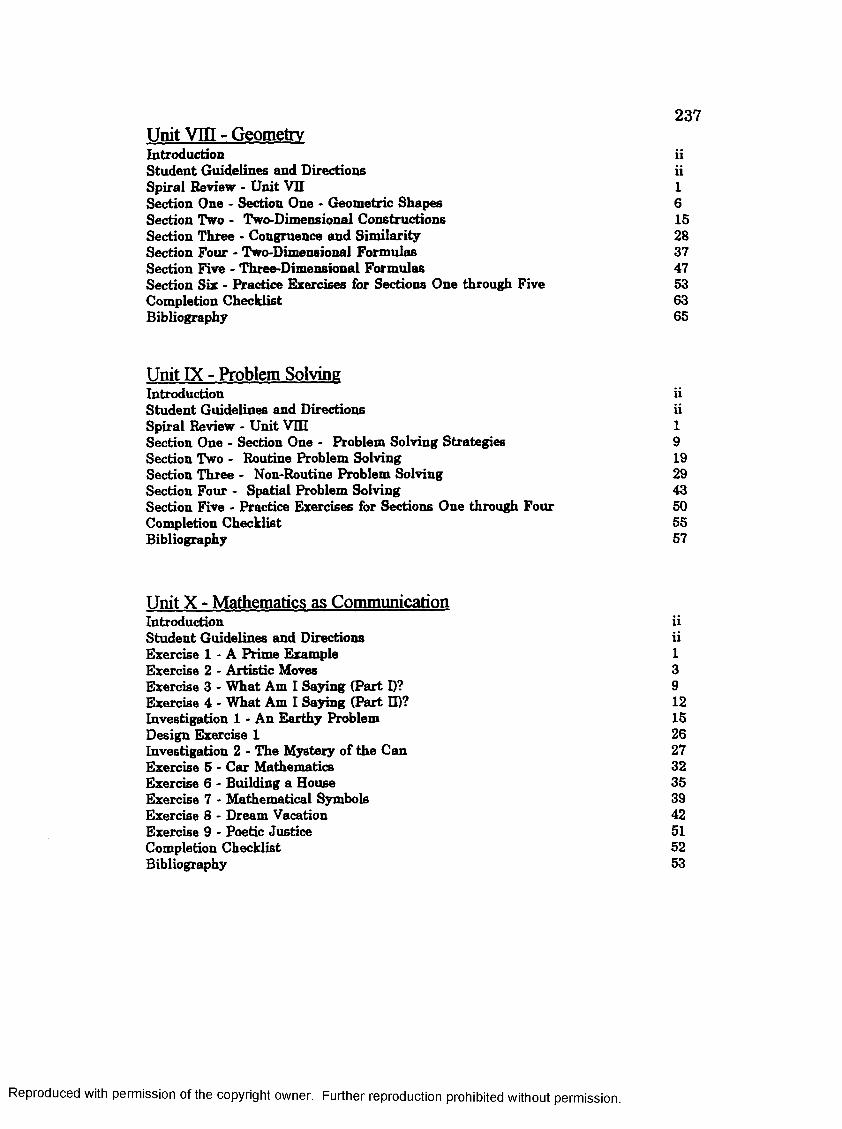
237Unit Vm - GeometryIntroduction iiStudent Guidelines and Directions iiSpiral Review - Unit VU 1Section One - Section One - Geometric Shapes 6Section Two • Two-Dimensional Constructions 15Section Three - Congruence and Similarity 28Section Four - Two-Dimensional Formulas 37Section Five - Three-Dimensional Formulas 47Section Six - Practice Exercises for Sections One through Five 53Completion Checklist 63Bibliography 65
Unit IX - Problem SolvingIntroduction iiStudent Guidelines and Directions iiSpiral Review - Unit V m 1Section One - Section One - Problem Solving Strategies 9Section Two - Routine Problem Solving 19Section Three - Non-Routine Problem Solving 29Section Four - Spatial Problem Solving 43Section Five - Practice Exercises for Sections One through Four 50Completion Checklist 55Bibliography 57
Unit X - Mathematics as CommunicationIntroduction iiStudent Guidelines and Directions iiExercise 1 - A Prime Example 1Exercise 2 - Artistic Moves 3Exercise 3 - What Am I Saying (Part D? 9Exercise 4 - What Am I Saying (Part ID? 12Investigation 1 - An Earthy Problem 15Design Exercise 1 26Investigation 2 - The Mystery of the Can 27Exercise 5 - Car Mathematics 32Exercise 6 - Building a House 35Exercise 7 - Mathematical Symbols 39Exercise 8 - Dream Vacation 42Exercise 9 - Poetic Justice 51Completion Checklist 52Bibliography 53
Reproduced with permission of the copyright owner. Further reproduction prohibited without permission.

Appendix O 238Rationale, Primary Idea, and Instructional Goals for 2989 P.A.S.S. Curriculum
1989-U nit IRATIONALE: In mathematics, symbols have special meaning, and are
found in addition, subtraction, multiplication, and division sentences. Through activities in this unit, you will learn
UnitI - General Math A about symbols and their value. This understanding makes itpossible to work math computations.
PRIMARY IDEA: Using your understanding of numbers and their value, youwill be able to find answers to math problems in your daily life.
INSTRUCTIONAL GOALS: When you complete this unit, you will show these skills on a written test:
Place Value and Whole Numbers
1. Recognize whole numbers.
2. Identify place value of digits.
3. Write, in words and numbers, the total value of a whole number.
4. Write the total for an expanded notation.
5. Round whole numbers to the nearest hundred.
Roman Numerals
1. Identify Roman Numerals.
2. Write Roman-Numerals using the principal of addition.
3. Write Roman Numerals using the principal o f subtraction.
4. Identify Roman Numerals in real-life situations.
Application
I. Use place value in real-life situations.
- 1-
Reproduced with permission of the copyright owner. Further reproduction prohibited without permission.

1989-Unit IIRATIONALE:
PRIMARY IDEA:
INSTRUCTIONAL GOALS:
239Whether you are adding up your hours on a job, or purchasing something at a store, your understanding of addition and subtraction will be helpful to you. When you have a checking account or pay taxes, it is so: important that you be able to calculate numbers. This unit offers you an opportunity to become skillful at addition and subtraction .
When you learn the basic math facts and can add and subtract, you'l 1 find you have improved your computation skills.
When you complete this unit, you will show these skills on a written test:
Identify the sum(s) of:
1. The basic addition facts
2. Two addends with no regrouping
3. Two addends with regrouping
4. Multiple addends with regrouping.
Find the difference (s) between:
1. The basic subtraction facts
2. Two numbers with no regrouping
3. Two numbers with regrouping
- 1-
Reproduced with permission of the copyright owner. Further reproduction prohibited without permission.
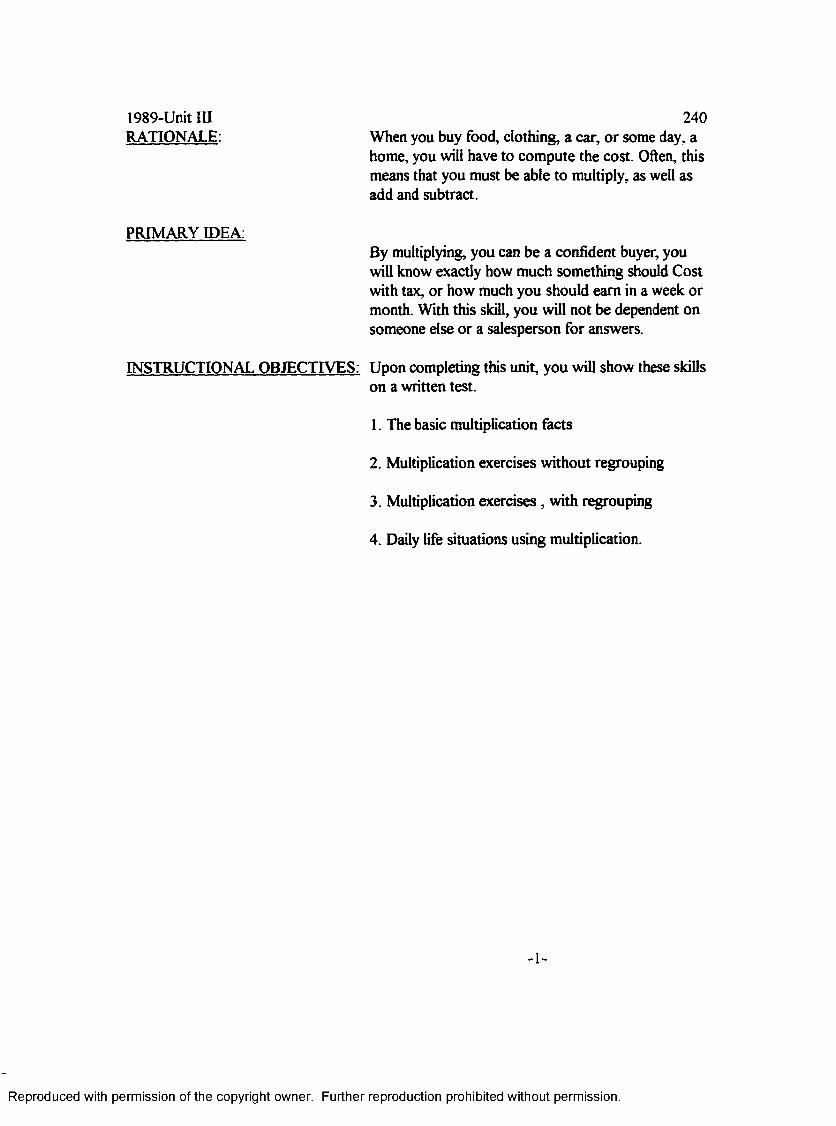
1989-Unit III 240RATIONALE: When you buy food, clothing, a car, or some day, a
home, you will have to com pute the cost. Often, this means that you must be able to multiply, as well as add and subtract.
PRIMARY IDEA:B y multiplying, you can be a confident buyer, you will know exactly how much something should Cost with tax, or how much you should earn in a week or month. With this skill, you will not be dependent on someone else or a salesperson for answers.
INSTRUCTIONAL OBJECTIVES: Upon completing this unit, you will show these skillson a written test.
1. The basic multiplication facts
2. Multiplication exercises w ithout regrouping
3. Multiplication exercises, with regrouping
4. Daily life situations using multiplication.
Reproduced with permission of the copyright owner. Further reproduction prohibited without permission.

1989 Unit-IVRATIONALE:
PRIMARY ID E A
INSTRUCTIONAL GOALS:
241Division is one o f the basic skills, along with addition, subtraction, and multiplication, that are necessary in an adult's daily life. With these skills, you can be confident in earning, saving and spending money.
Understanding how to divide will help you become a confident and independent adult in this society.
Upon completing this unit, you will show the following skills on a written test.
Identify the quotients for
1. Single Digit Divisors and Dividends with and without remainders.
2. Multiple Digit Divisors and Dividends with and without remainders.
3. Real life division situations.
- I -
Reproduced with permission of the copyright owner. Further reproduction prohibited without permission.

1989-Unit V 242RATIONALE: In order to use the skills o f addition, subtraction,multiplication, and division, you must be able to apply these skills in problem solving situations.
PRIMARY ID E A With the ability to so lve real life mathematicalproblems, you can be successful on a job or owning a business, or at making the wisepurchase with your money.
INSTRUCTIONAL OBJECTIVES: U pon completion o f these lessons, you will show the following on a written test:
1. Solve word problems using addition, subtraction, multiplication, and division.
2. Solve two-step problems.
3. Find averages.
4. Use charts, tables, and graphs to solve wordproblems.
Reproduced with permission of the copyright owner. Further reproduction prohibited without permission.

1989-Unit VI 243GENERAL MATH B UNIT VI
Purpose
The study of mathematics helps students develop thinking skills, order thoughts, develop logical thought processes and make valid inferences. An understanding o f fractions will assist the student in such varied activities as cooking, telling timer sewing, shopping and mechanics. An independent adult will have a working knowledge o f fractions.
Upon completion o f this unit, the student will be able to:
1. Identify proper, improper, and mixed number fractions.
2. Write equivalent fractions.
3. Reduce fractions to lowest terms.
4. Rename improper and mixed number fractions.
5. Identify the greatest common factor and the least common factor.
6. Add, subtract, multiply, and divide fractions.
7. Solve real-life problems involving fractions.
Objectives
IV
Reproduced with permission of the copyright owner. Further reproduction prohibited without permission.

1989-Unit VII 244GENERAL MATH B UNIT VII
PurposeThe study o f mathematics helps students develop thinking, logic and inference skills. As the age o f technology unfolds, the importance o f mathematical skills grows stronger. An understanding o f decimals will increase your ability to find measurements, handle money successfully and compete for a variety o f jobs or careers.
Upon completion o f this unit, the student will be able to:
1. Change regular fractions to decimal fractions.
2. Change decimal factions to regular factions.
3. Name the place value for any digit in a decimal number.
4. Add, subtract, multiply, and divide decimals.
5. Use decimals to solve problems in real life situations.
Instructional Objectives
IV
Reproduced with permission of the copyright owner. Further reproduction prohibited without permission.
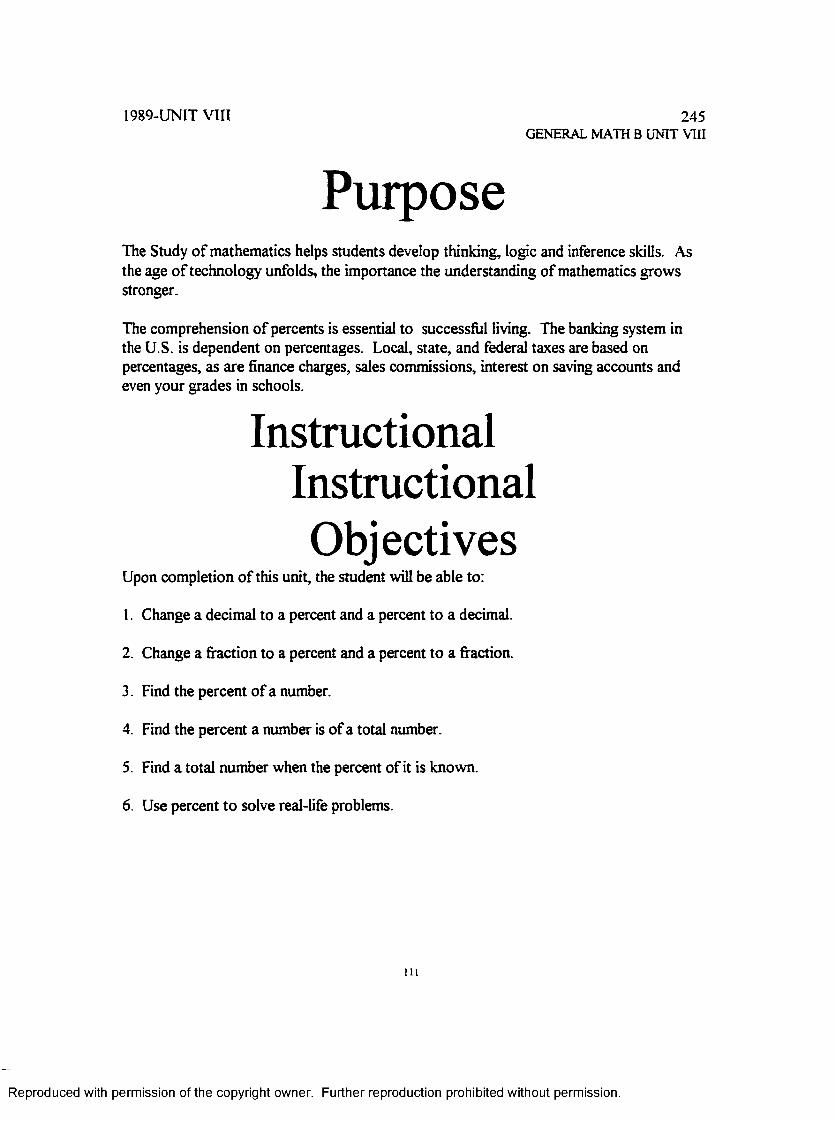
1989-UNIT VIII 245GENERAL M ATH B U N IT V III
PurposeThe Study o f mathematics helps students develop thinking, logic and inference skills. As the age o f technology unfolds, the importance the understanding o f mathematics grow s stronger.
The comprehension o f percents is essential to successful living. The banking system in the U .S. is dependent on percentages. Local, state, and federal taxes are based on percentages, as are finance charges, sales comm issions, interest on saving accounts and even your grades in schools.
Upon com pletion o f this unit, the student will be able to:
1. Change a decimal to a percent and a percent to a decimal.
2. Change a fraction to a percent and a percent to a fraction.
3. Find the percent o f a number.
4. Find the percent a number is o f a total number.
5. Find a total number when the percent o f it is known.
6. Use percent to solve real-life problems.
Instructional Objectives
m
Reproduced with permission of the copyright owner. Further reproduction prohibited without permission.
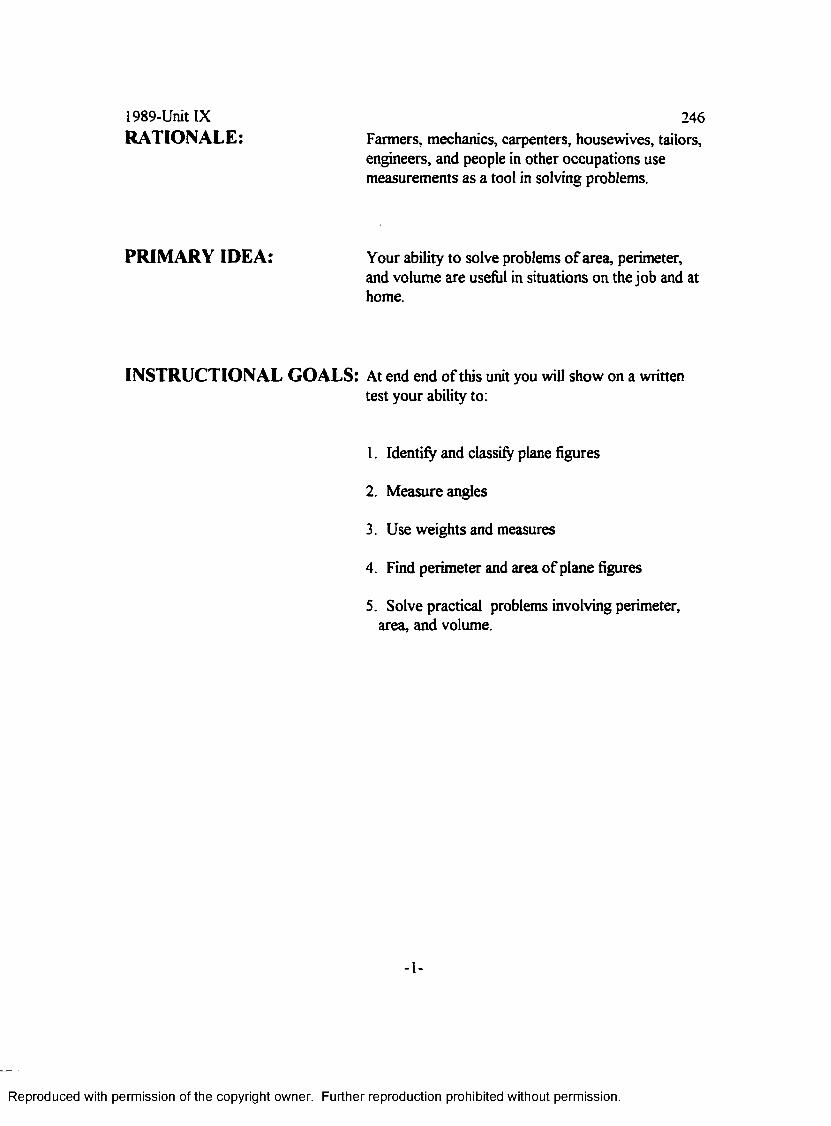
1989-Unit IX 246RATIONALE: Farmers, mechanics, carpenters, housewives, tailors,
engineers, and people in other occupations use measurements as a tool in solving problems.
PRIMARY IDEA: Your ability to solve problems o f area, perimeter,and volum e are useful in situations on the job and at home.
INSTRUCTIONAL GOALS: At end end o f this unit you will show on a writtentest your ability to:
1. Identify and classify plane figures
2. M easure angles
3. U se weights and measures
4. Find perimeter and area o f plane figures
5. Solve practical problems involving perimeter, area, and volume.
- 1-
Reproduced with permission of the copyright owner. Further reproduction prohibited without permission.

1989-Unit XRATIONALE:
247The metric system is used world-wide by 92% o f the population. In the United States, the system is being used more frequently by businesses and in industry. You may find a need to understand the metric system in the workplace.
PRIMARY IDEA: It is important that you be able to solve problems using the metric system.
INSTRUCTIONAL GORLS: On a written test, you will show yourability to:
1. U se metric measures to find length, area, perimeter, volume, and weight.
2. Convert metric units to other metric units.
3. Read a Celsius thermometer.
4. Solve real-life problems using metric units.
- I -
Reproduced with permission of the copyright owner. Further reproduction prohibited without permission.

A p p e n d ix P 248General Directions and Requirements for 1989 P .A .S.S . Curriculum
1989-Ail Units
GENERAL DIRECTIONS AND REQUIREM ENTS
Working on the unit:
* Read each example carefully and complete the sample problem before starting on the assigned activities.
* Remember, you must complete the entire unit to receive credit.
* If you have any questions while working the unit, talk with your contact person or teacher.
* After you finish an activity, check it o f f on the Progress Report, on page 42.
When you're finished:
Return the completed unit to your contact person. H e or she will give you directions for taking the unit test.
- 2 -
Reproduced with permission of the copyright owner. Further reproduction prohibited without permission.
Appendix Q
Introduction. Guidelines and Directions for
249
1995 P.A.S.S. Curriculum
Unit I - Number and Number RelationshipsIntroduction
Welcome to U n it I - Number and Number Relationships. This is the first book in the five book series for Integrated Math A. It has been designed to help you explore mathematics with your friends and learn important concepts and ideas. It is based on the latest research which is aimed at the needs o f all students. You w ill still have to do worksheets and sharpen your skills, but you w ill also be able to be creative and express yourself through writing, art, and other ideas which you think upt You w ill use calculators for much of the work, and you w ill have opportunities to use the computer if it is available. The success o f this program depends on you! You must be w illing to work with your friends and be serious about your work. Wasting time while you are having fun w ill prevent you from successfully completing this book. Having fun while you are learning w ill help you speed through this book. You will be successful when you complete the U nit Test at 70% mastery level. That means you must complete 35 out of 50 questions correctly.
Guidelines and Directions To understand the arrangement of this book, go through the steps below:• Refer now to the Table of Contents to help you get comfortable with the book. The
Table o f Contents tells you the page numbers so you can easily turn to them as you continue with these directions.
• The Review Exercises are arithmetic problems that you have encountered in earlier grades. Look at them now. They should be familiar. You need to be certain you have these concepts and skills nailed down! If you do not, you w ill need to work with other worksheets and problems before you can continue with this book. When you can complete these worksheets at mastery level, you may continue with the Sections.
• Look at the Table o f Contents again and notice Sections One through Five. They are the main lessons in U nit L You must listen carefully during all instruction, work through the examples, and ask lots of questions to be sureyou understand the material. You need to take notes during the discussion and explanations. You should write down definitions and be certain you understand them. Do not be afraid to ask questions! Use the dictionary if you do not understand the meaning of words. The students who are the most successful are the ones who ask for help when they do not understand!
• Look a t Section One now. Notice it is divided into headings such as Discussion, Definition, Example, Problems, and Cooperative Learning Problems. The Problems and Cooperative Learning Problems are your classwork and homework. They must be completed! The problems may seem strange to you if you have only been in traditional math classrooms. These problems sometimes ask you to think about things other than math. They are designed to help you see how the concepts of math fit into the real world. Have fun with them and work intelligently through them.Be a leader in your group and insist that the others work hard. Math is hard work
Reproduced with permission of the copyright owner. Further reproduction prohibited without permission.

250but it is also fun to do. You feel really good about yourself when you succeed in math!
• Use your Table o f Contents and turn now to Section Six . This section gives additional practice exercises for the main sections. Successful completion o f this section w ill help you understand the material for the Unit Test.
• The Completion Checklist is to help you check your progress. As you move through the classwork and homework, check off the box for each problem in each section. When you have completed the worksheets in the Review Exercises - Basic Concepts, and the problems in Sections One through Six you w ill be asked to sign the Completion Checklist. Your teacher w ill also sign the Checklist to affirm that you have mastered the material in the book. You are now ready to take the U nit Test.
• The U nit Test is multiple choice. You are required to perform at mastery level in order to continue to U nit Two. This means you must answer 35 out of 50 questions correctly.
• The last page in the book i6 the Bibliography. It is a list of books that have been used for reference material in the preparation of U nit I.
You are now ready to begin your work in this book. Have lots of fun and be sure torefer back to these pages when you start feeling lost. You can be successful in math!Your teacher w ill help you, but most importantly, you will help yourself and your friendsas you work together. They w ill help you too.
Reproduced with permission of the copyright owner. Further reproduction prohibited without permission.

Unit VII - Algebra251
Introduction
Welcome to U nit VH - Algebra. This is the second book in the five book series for Integrated Math B. You should be more comfortable with group learning now and the variety o f exercises and problems that are in the Units. Your success depends on your determination to learn the material in each Unit before proceeding to the next Unit. All Units require that you complete the U nit Test at 70% mastery level. That means you must complete 35 out of 50 questions correctly.
Guidelines and Directions To remind you o f the arrangement o f this book, go through the step6 below:• Refer now to the Table of Contents to help you get comfortable with the book. The
Table o f Contents tells you the page numbers so you can easily turn to them as you continue with these directions.
• The Spiral Exercises are problems you encountered in Unit VI. You need to do these carefully and be certain you understand them. This will help you retain what you have learned.
• Look a t the Table o f Contents again and notice Sections One through Four. They are the main lessons in Unit VII. You must listen carefully during all instruction, work through the examples, and ask lots of questions to be sure you understand the material. You need to take notes during the discussion and explanations. You should write down definitions and be certain you understand them. Do not be afraid to ask questions! Use the dictionary i f you do not understand the meaning of words. The students who are the most successful are the ones who ask for help when they do not understand!Look at Section One now. Notice i t is divided into headings such as Discussion, Definition, Example, Problems, Cooperative Learning Problems, and E3 C om puter or G raphing C alculator E xercises. (M any o f the S Computer or G raphing C alcu lator E xercises can b e d o n e b y hand i f com puters or graphing ca lcu la to rs are n ot ava ilab le . O thers w ill be d ifficu lt and should be om itted.) The Exercises, Problems, and Cooperative Learning Problems are your classwork and homework. They must be completed! The problems may seem 6trange to you i f you have only been in traditional math classrooms. These problems sometimes ask you to think about things other than math. They are designed to help you 6ee how the concepts o f math fit into the real world. Have fun with them and work intelligently through them. Be a leader in your group and insist that the others work hard.Math is hard work but it is also fun to do. You feel really good about yourself when you succeed in math!
• Use your Table o f Contents and turn now to Section Five. This section gives additional practice exercises for the main 6ection6. Successful completion of this section will help you understand the material for the Unit Test.
• The Completion Checklist is to help you check your progress. As you move through the classwork and homework, check off the box for each problem in each section.
When you have completed the worksheets in the Spiral Review - Unit VI, and the problems in Sections One through Five you will be asked to sign the Completion
Checklist. Your teacher w ill also sign the Checklist to affirm that you have mastered the material in the book. You are now ready to take the U nit Test.
Reproduced with permission of the copyright owner. Further reproduction prohibited without permission.

252• The Unit Test is multiple choice. You are required to perform at mastery level
before you continue to U nit VUL This means you must answer 35 out o f 50 questions correctly.
• The last page in the book is the Bibliography. It is a list of books that have beenused for reference material in the preparation of Unit VIL
Reproduced with permission of the copyright owner. Further reproduction prohibited without permission.

Unit X - Mathematics as Communication253
Introduction
Welcome to Unit X - Mathematics as Communication. This is the final book in the five book 6erie6 for Integrated Math B. You should be more comfortable with group learning now and the variety of exercises and problems that are in the Units. Your success depends on your determination to learn the material in each U nit before proceeding to the next Unit. All Units require that you complete the Unit Test a t 70% mastery level. That means you must complete 35 out o f 50 questions correctly.
Guidelines and Directions This unit is different from the other units. It consists of exercises and investigations designed to activate your creating writing and artistic talents. You will still do mathematics but you will also write and draw. Some of the exercises will allow you to be quite creative; others will require you use a dictionary and glossary to find precise definitions. Mathematics cannot be communicated without these skills. Your class should discuss each exercise and investigation, and make presentations of their findings. Oral, verbal, artistic, and written skills are essential communication tools!
The Completion Checklist is to help you check your progress. As you move through the exercises and investigations, check off the box for each problem in each section. When you have completed this work, you w ill be asked to sign the Completion Checklist Your teacher will also sign the Checklist to affirm that you have mastered the material in the book. You are now ready to take the U n it T e st
The Unit Test is multiple choice. You are required to perform at mastery level to pass the te s t This means you must answer 35 out of 50 questions correctly.The last page in the book is the Bibliography. It i6 a list of books that have been used for reference material in the preparation o f U nit X.
Congratulations on your progress! You are almost finished with the entire course Integrated Math A and Integrated Math B. You will soon be a first-class graduate of this course!
Reproduced with permission of the copyright owner. Further reproduction prohibited without permission.
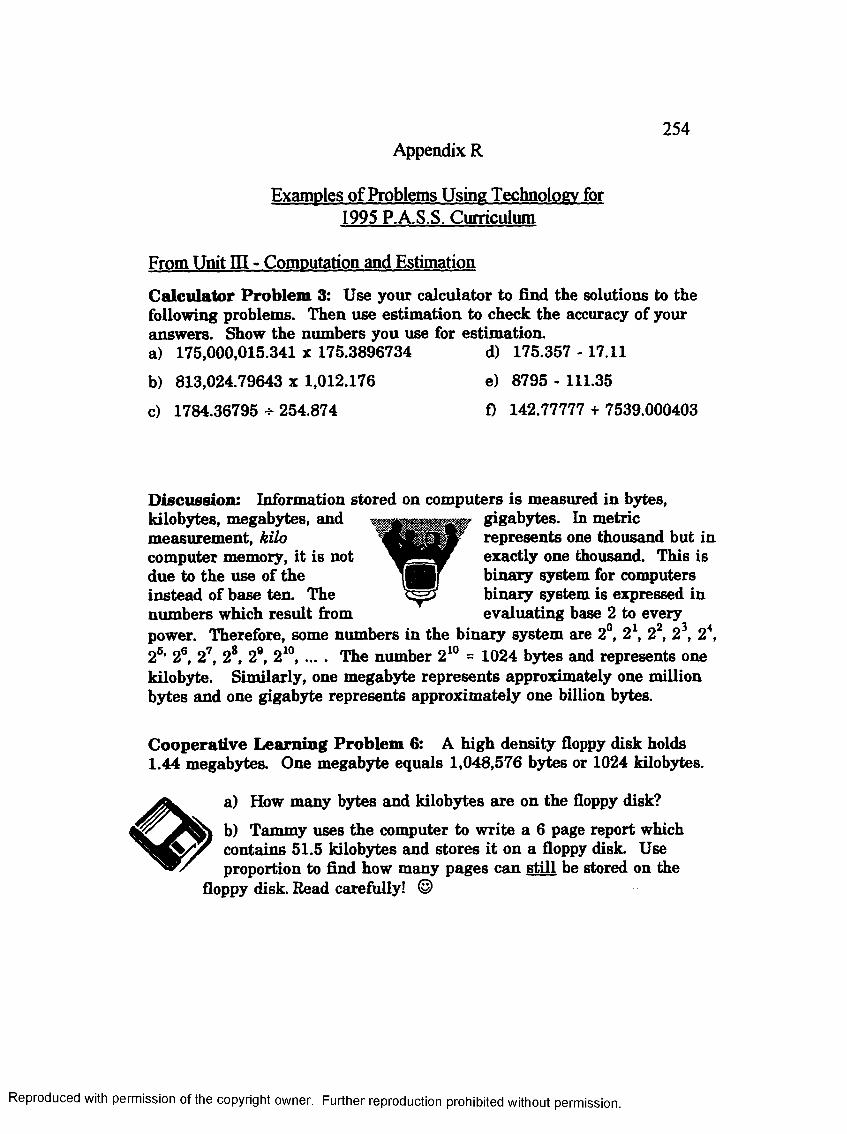
Appendix R254
Examples of Problems Using Technology for 1995 P.A.S.S. Curriculum
From Unit HI - Computation and Estimation
Calculator Problem 3: Use your calculator to find the solutions to the following problems. Then use estimation to check the accuracy of your answers. Show the numbers you use for estimation.a) 175,000,015.341 x 175.3896734 d) 175.357 - 17.11
b) 813,024.79643 x 1,012.176 e) 8795 - 111.35
c) 1784.36795 * 254.874 f) 142.77777 + 7539.000403
Discussion: Information stored on computers is measured in bytes,kilobytes, megabytes, and measurement, kilo computer memory, it is not due to the use of the instead of base ten. The numbers which result from
□gigabytes. In metric represents one thousand but in exactly one thousand. This is binary system for computers binary system is expressed in evaluating base 2 to every
power.>6, 06
Therefore, some numbers in the binary system are 2°, 21, 22, 23, 24,2 2 , 2 ', 2 , 2 , 210 The number 210 = 1024 bytes and represents onekilobyte. Similarly, one megabyte represents approximately one million bytes and one gigabyte represents approximately one billion bytes.
Cooperative Learning Problem 6: A high density floppy disk holds 1.44 megabytes. One megabyte equals 1,048,576 bytes or 1024 kilobytes.
a) How many bytes and kilobytes are on the floppy disk?
b) Tammy uses the computer to write a 6 page report which contains 51.5 kilobytes and stores it on a floppy disk Use proportion to find how many pages can still be stored on the
floppy disk Read carefully! ©
permission of the copyright owner. Further reproduction prohibited without permission.

255Cooperative Learning Problem 4: Determine the value of the number of
Table 1:# of Pizzas $ Given Total $ Given
Small 10 $8.0018 10.0012 20.00
Large 9 21.0016 25.0015 30.00
Total $ Given
Table 2:# of Pizzas Price each Total Sales
Small 40 $7.50 $Large 40 20.37
Total Sales $
9
Table 3:# of Bills
Denomination or Coins $ Value$1 184 $$5 15
$10 12Quarters 160Dimes 40Pennies 120
Total $ Value $
Table 4: Check Work ITotal $ Given - Total Sales = $ Value of change
Total $ Given $Less Total Sales
$ Value of Change $
Reproduced with permission of the copyright owner. Further reproduction prohibited without permission.
Project: Contact local business owners and find out the ways they use
estimation. Ask them how they determine how much change they need.
Each group can contact a different type of business. Examples are real
estate, insurance, farming and ranching, and many others. Use your
library to research information about the business you have selected. Your
group should decide together what information will be needed. Write a
report and use diagrams such as spreadsheets and tables to illustrate your
information. Assign responsibilities within the group so everyone is
participating. You will need interviewers, researchers, writers, artists, and
speakers. Your report will be presented to the class when you are finished.
Reproduced with permission of the copyright owner. Further reproduction prohibited without permission.

From Unit VI - Statistics and Probability
257
Problem 2 (Computer Spreadsheet): You are an aide in Mrs. Martinez's math class. She asks you to enter the grades from the last test on the computer and to prepare a bar chart using the spreadsheet software. If you do not have access to a computer, do this by hand. Label the students as numbers 1 - 17. The grades are as follows:
75, 84, 96, 37, 65, 44, 92, 89, 75, 35, 45, 98, 87, 79, 55, 92, 84
What conclusions can you draw from the graph?
Cooperative Learning Problem 8 (Computer): Juan is a zoologist at the Los Angeles Zoo. He finds the following data in an Almanac and is curious whether there is any relationship between the number of species in a zoo and the number of acres in the zoo. You are a college student working as an intern for him and he tells you to make a scatterplot on the computer from the data in the table to see if there is a relationship. Make the scatterplot and see if there is a relationship. What interpretation can you make from the plot?
Acres Speciesi 198 i 200!
58! 500!265i 670!23! 206!
215! 400!f 67! 761!
165! 563!70! 329!
! 76! 310!125! 413!50! 596!
! 35! 339!113! 500!133! 395!
I 70! 445!290! 281!200! 350!163! 509!
* Acresi............. ....'110!...
Species ............. 500*
li'dlC 1 . . .Z ....U l l . . .
475 560 i
125!31?
i eoli 39!
324 i " 450f
292'! 483!
83| 665:40) 700
100i 800140! 27030! 40064! 16692! 300
Reproduced with permission of the copyright owner. Further reproduction prohibited without permission.
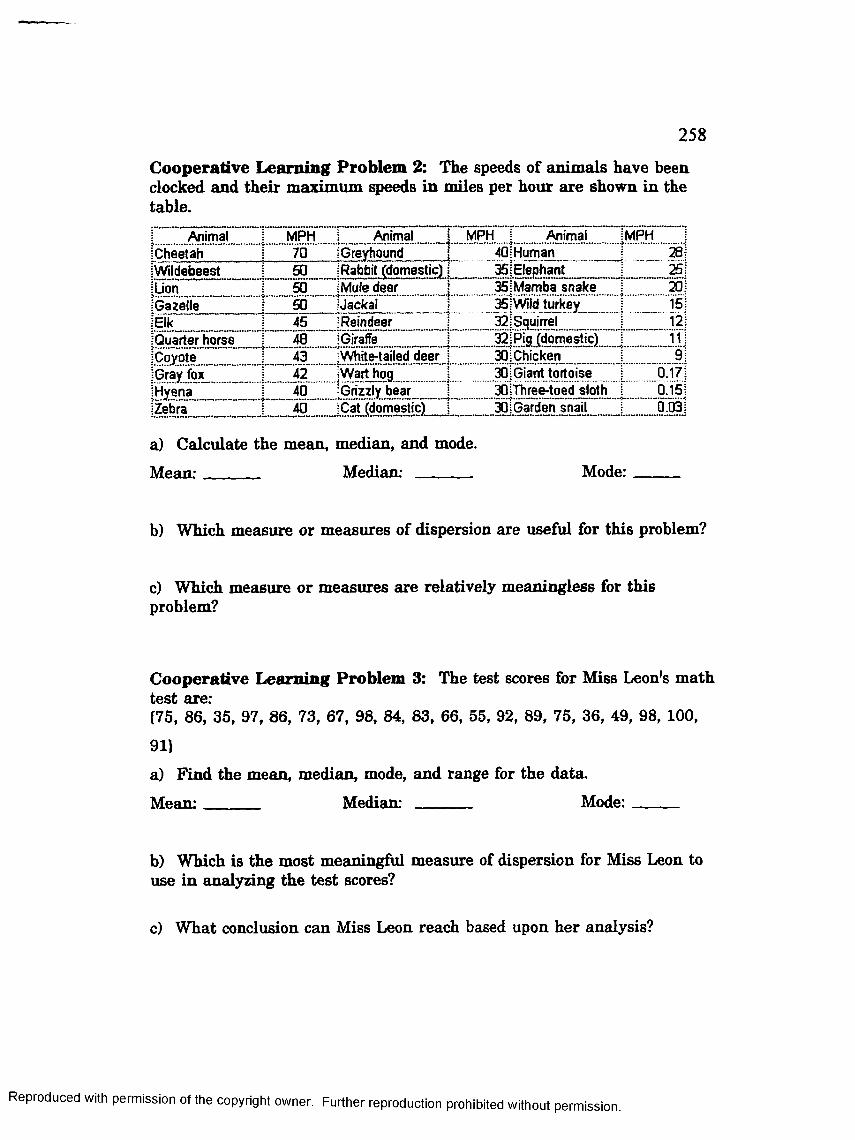
258
Cooperative Learning Problem 2: The speeds of animals have been clocked and their maximum speeds in miles per hour are shown in the table.
Animal MPH Animal | MPH i Animal IMPHi Cheetah 70 ! Greyhound j 40! Human 28!iWildebeest 60 i Rabbit (domestic) i 35! Elephant 25;ILion 50 iMuie deer I 35iMamba snakeIGazelle 50 iJackal ! 35!Wild turkey 15!"Elk 45 ;Reindeer 32; Squirrel 12!'Quarter horse iGiraffe 32iPig (domestic) 11!ICoyote 43 jWhite-tailed deer j 30iChicken 9!jGrayfox^______ 42 jWart hog 1 30; Giant tortoise 0.17!iHyena 40 Grizzly bear I
a) Calculate the mean, median, and mode.Mean:______ Median: Mode:
b) Which measure or measures of dispersion are useful for this problem?
c) Which measure or measures are relatively meaningless for this problem?
Cooperative Learning Problem 3: The test scores for Miss Leon's math test are:{75, 86, 35, 97, 86, 73, 67, 98, 84, 83, 66, 55, 92, 89, 75, 36, 49, 98, 100,
91}a) Find the mean, median, mode, and range for the data.M ean: Median: ______ Mode:_____
b) Which is the most meaningful measure of dispersion for Miss Leon to use in analyzing the test scores?
c) What conclusion can Miss Leon reach based upon her analysis?
Reproduced with permission of the copyright owner. Further reproduction prohibited without permission.
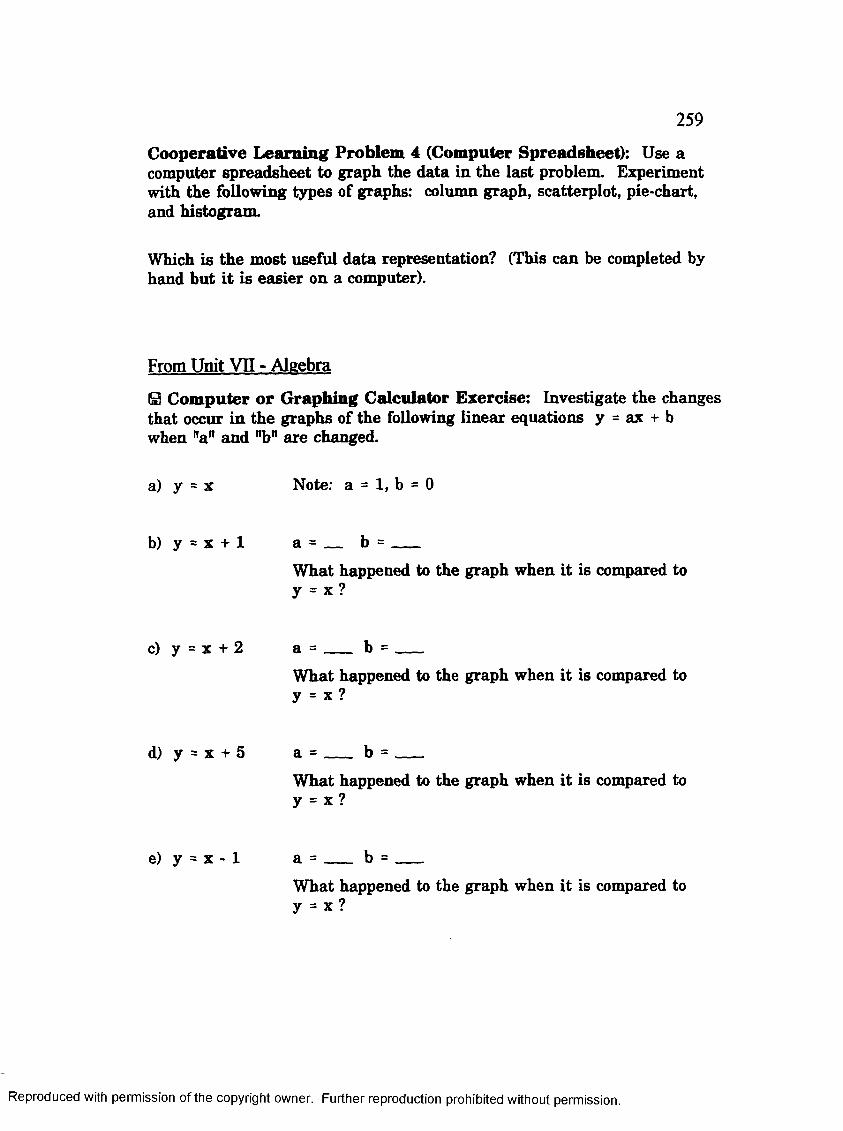
259
Cooperative Learning Problem 4 (Computer Spreadsheet): Use a computer spreadsheet to graph the data in the last problem. Experiment with the following types of graphs: column graph, scatterplot, pie-chart, and histogram.
Which is the most useful data representation? (This can be completed by hand but it is easier on a computer).
From Unit VII - Algebra
IS! Computer or Graphing Calculator Exercise: Investigate the changes that occur in the graphs of the following linear equations y = ax + b when "a" and "b" are changed.
a) y = x Note: a = 1, b = 0
b) y = x + 1 a = ___ b = __What happened to the graph when it is compared to y = x ?
c) y = x + 2 a = ____ b = ____
What happened to the graph when it is compared to y = x ?
d ) y = x + 5 a = ____ b = ___What happened to the graph when it is compared to y = x ?
e ) y = x - l a = ____ b = ___What happened to the graph when it is compared to y = x ?
Reproduced with permission of the copyright owner. Further reproduction prohibited without permission.

260
f) y = x - 10 a = ___ b = -----What happened to the graph when it is compared toy = x ?
g) Predict what the graph of y = x - 3 will look like.
h) y = 2x a = ----- b = -----What happened to the graph when it is compared to y = x ?
i) y = 2x + 1 a = ---- b =What happened to the graph when it is compared to y = x ?
j) y = 2x - 5 a = ------ b = -----What happened to the graph when it is compared to y = x ?
k) y = 3x a-= ------ b = -----What happened to the graph when it is compared to y = x ?
1) y = 3x + 2 a = ___ b =What happened to the graph when it is compared to y = x ?
m) y = 3x - 8 a = b =What happened to the graph when it is compared to y = x ?
Reproduced with permission of the copyright owner. Further reproduction prohibited without permission.

261
n) Predict what the graph of y = 5x + 3 will look like?
o) y = -2x a = — b = —What happened to the graph when it is compared to y = x ?
p ) y = -4x a = — b = —What happened to the graph when it is compared to y = x ?
q) y = -lOx a = — b = —What happened to the graph when it is compared to y = x ?
r) y = -—x a = — b = —2
4
What happened to the graph when it is compared to y = x ?
s) y = -—x a = ___ b = ___
What happened to the graph when it is compared to y = x ?
t) Predict what the graph of y = x will look like?4
u) Predict what the graph of y = - x will look like?4
Write your conclusions from this
exercise.
Reproduced with permission of the copyright owner. Further reproduction prohibited without permission.

262
□Computer or Graphing Calculator Exercise 1:Graph the following equations and sketch the graphs below.
a) y = -x2 + 5xb) y = x3
c) y = Ixl (This means every value of y is positive evenwhen x is positive or negative).
nDiscussion: Examine the graph y = -x + 5x for the values of x > 0 .A real-world example for this graph is the path of a ball when it is thrown. We will label the horizontal axis t for time in seconds, and the vertical axis will be labeled h for height in feet. The equation is now h = -t2 + 5t. At t = 0 we throw the ball. Tracing this curve on the graphing calculator or computer shows the ball rises until it reaches the m axim um height of 6 .2 feet and then falls back to the ground at t = 5 or in 5 seconds. Is this problem realistic? A young child might not be able to throw a basketball any higher than this.
h = - t 2 * 5t
□Computer or Graphing Calculator Exercise 2:Use the same equation h = -t2 + 5t and find out what changes need to be made to make the equation realistic for someone your age who is throwing a ball in the air. Vary the coefficients of t2 and t. What equation will you need to enter into the computer or graphing calculator? What equation(s) did you find that would work?
Reproduced with permission of the copyright owner. Further reproduction prohibited without permission.

263
Use the trace command to find the maximum height. You will trace the curve to find the y-coordinate at the top of the curve. Remember that the y-coordinate on your calculator or computer is the ^ ^ same as the h-coordinate in your equation. The x-coordinate is the same as the t-coordinate in your equation. When will the ball hit the ground?
Maximum height:____________
Time when ball hits the ground:
Cooperative Learning Problem 1: Complete the table using the equation h = - 12 + 5t with the values shown for t. Then answer the following questions:
a) What does the table tell you about the maximum height and when does it occur?b) What does the table tell you about the times the ball is at ground level?c) What is wrong with the graph? Can you think of a scenario that would make this table true?
t h = - t Z+ St012345678910111213
Reproduced with permission of the copyright owner. Further reproduction prohibited without permission.
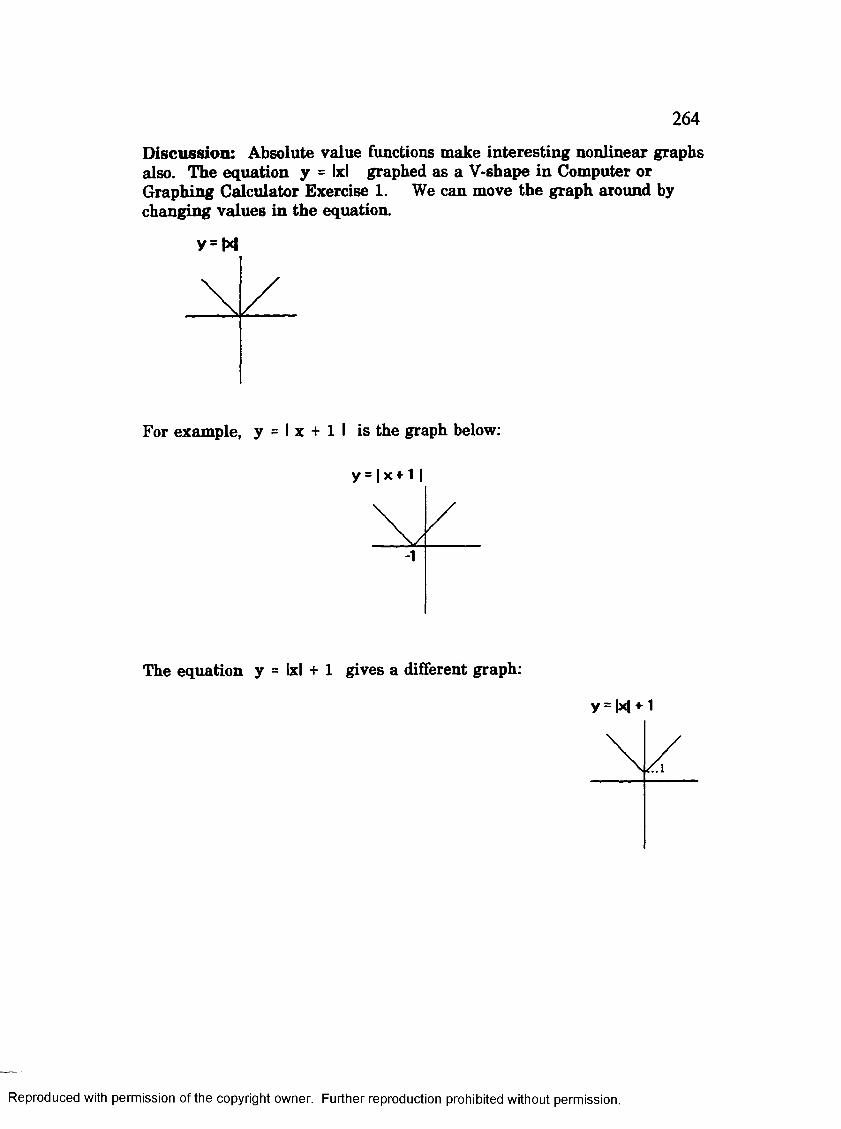
264
Discussion: Absolute value functions make interesting nonlinear graphs also. The equation y = Ixl graphed as a V-shape in Computer or Graphing Calculator Exercise 1. We can move the graph around by changing values in the equation.
y=M
For example, y = I x + 1 I is the graph below:
The equation y = Ixl + 1 gives a different graph:
Reproduced with permission of the copyright owner. Further reproduction prohibited without permission.

ElComputer or Graphing Calculator Exercise 3:Experiment with the computer or graphing calculator and write the equation for each graph:
\ \ / f \2 \ /
/ \ - 4 /3
(a) (b) (c) (d) (e)
Reproduced with permission of the copyright owner. Further reproduction prohibited without permission.

Appendix S 266
Assignment o f Ordinal Values to P.A.S.S. Curricula bv Coder 3 (Nud*IsflUsing the Mathematics Materials Analysis Instrument fMMAD
OrdinalNode X___________ Y____________ Value1995 curriculum, grades 5-8
111 62.0 59.0 60.5 41 12 20.0 11.0 15.5 21 13 54.0 51.0 52.5 41 14 63.0 56.0 59.5 41 15 31.0 15.0 23.0 31 16 19.0 1.5 10.3 21 17 68.0 47.0 57.5 41 18 49.0 46.0 47.5 41 19 44.0 38.0 41.0 41 1 10 74.0 58.0 66.0 41 1 11 44.0 39.0 41.5 41 1 12 46.0 38.0 42.0 4
121 73.0 73.0 73.0 4122 39.0 36.0 37.5 4123 15.0 6.6 10.8 21 2 4 26.0 16.0 21.0 31 25 50.0 23.0 36.5 41 2 6 31.0 17.0 24.0 31 27 25.0 18.0 21.5 3Note. X = % of retrieved text to retrieved documents. Y = % of retrieved
text to all documents. M = X + Y / 2. aThe weighted average for node 1 1 is
19.7% and for node 1 2,11.5%. Ordinal value scale at end of table.
table continues
Reproduced with permission of the copyright owner. Further reproduction prohibited without permission.

267Ordinal
Node X Y Mb Value1995 curriculum, grades 5-8
131 5.2 0.3 2.8 2132 27.0 7.7 17.4 4133 52.0 17.0 34.5 4134 35.0 11.0 23.0 4
141 17.0 2.4 9.7 2142 38.0 20.0 29.0 3143 21.0 6.4 13.7 2144 22.0 6.0 14.0 2145 51.0 11.0 31.0 4146 26.0 4.2 15.1 3147 7.1 0.3 3.7 2148 44.0 5.3 24.7 3149 22.0 2.8 12.4 2
151 48.0 7.7 27.9 3152 46.0 13.0 29.5 3153 40.0 6.9 23.5 3154 25.0 9.5 17.3 3155 48.0 23.0 35.5 3156 37.0 6.0 21.5 3157 68.0 8.2 38.1 4158 100.0 6.6 53.3 4159 63.0 5.3 34.2 31 5 10 80.0 10.0 45.0 4Note. X = % of retrieved text to retrieved documents. Y = % of retrieved
text to all documents. M = X + Y / 2. hThe weighted average and for node 1
3 is 6.6%; for node 1 4,14.8% and for node 1 5,16.4%. Ordinal value scale
at end of table.table continues
Reproduced with permission of the copyright owner. Further reproduction prohibited without permission.

268Ordinal
Node X____________ Y___________ M*___________ Value1995 curriculum, grades 5-8
161 63.0 23.0 43.0 4162 55.0 20.0 37.5 4163 69.0 19.0 44.0 4164 12.0 1.8 6.9 2165 42.0 17.0 29.5 4166 44.0 12.0 28.0 4167 33.0 2.7 17.9 3
171 28.0 3.8 15.9 3172 25.0 5.1 15.1 3173 8.7 0.5 4.6 2174 8.7 0.5 4.6 2175 50.0 2.0 26.0 3176 49.0 4.1 26.6 3177 67.0 3.7 35.4 4178 67.0 3.7 35.4 4179 6.5 0.3 3.4 2
181 58.0 19.0 38.5 4182 56.0 12.0 34.0 4183 66.0 31.0 48.5 4Note. X = % of retrieved text to retrieved documents. Y = % of retrieved
text to all documents. M = X + Y / 2. °The weighted average and for node 1
6 is 11.5%; for node 1 7, 14.8% and for node 1 8,4.9%. Ordinal value scale
at end of table.
table continues
Reproduced with permission of the copyright owner. Further reproduction prohibited without permission.

269Ordinal
Node X____________ Y___________ M*___________ Value1995 curriculum, grades 9-12
2 1 1 71.0 71.0 71.0 42 1 2 42.0 24.0 33.0 42 1 3 58.0 53.0 55.5 42 1 4 60.0 51.0 55.5 42 1 5 48.0 36.0 42.0 42 1 6 19.0 9.3 14.2 3
22 1 46.0 43.0 44.5 42 2 2 72.0 69.0 70.0 42 2 3 28.0 16.0 22.0 32 2 4 27.0 14.0 20.5 32 2 5 24.0 17.0 20.5 32 2 6 1
23 1 14.0 5.0 9.5 22 3 2 42.0 4.5 ' 23.3 32 3 3 35.0 3.7 19.4 32 3 4 35.0 3.7 19.4 32 3 5 28.0 9.5 18.8 32 3 6 19.0 10.0 14.5 3
24 1 49.0 48.0 48.5 42 4 2 32.0 28.0 30.0 42 4 3 23.0 19.0 21.0 32 4 4 38.0 10.0 24.0 32 4 5 12 4 6 44.0 1.2 22.6 3Note. X = % of retrieved text to retrieved documents. Y = % of retrieved
text to all documents. M = X + Y / 2. dThe weighted average for nodes 2 1,
2 2 , 23 and 2 4 is 12.5%. Ordinal value scale at end of table.
table continues
Reproduced with permission of the copyright owner. Further reproduction prohibited without permission.
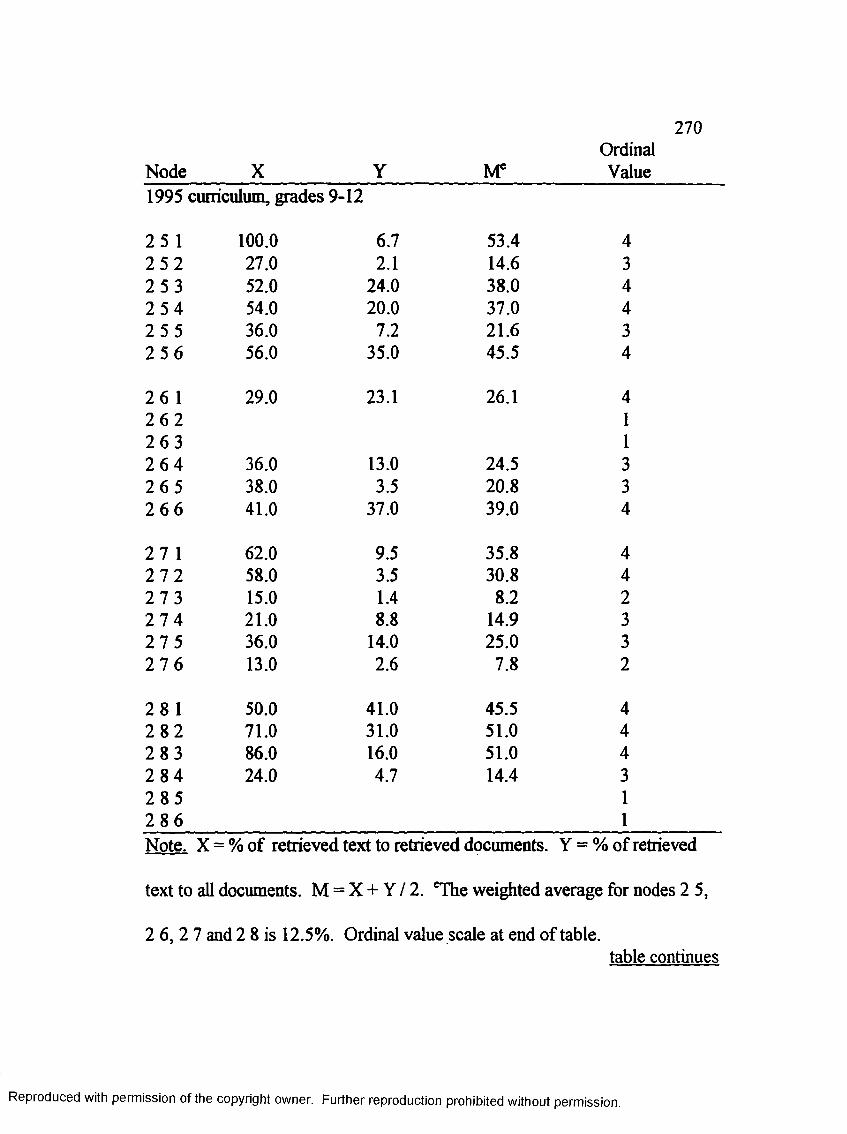
270Ordinal
Node X____________ Y___________M*___________ Value1995 curriculum, grades 9-12
25 1 100.0 6.7 53.4 42 5 2 27.0 2.1 14.6 32 5 3 52.0 24.0 38.0 42 5 4 54.0 20.0 37.0 42 5 5 36.0 7.2 21.6 32 5 6 56.0 35.0 45.5 4
26 1 2 6 2 2 6 3
29.0 23.1 26.1 411
2 6 4 36.0 13.0 24.5 32 6 5 38.0 3.5 20.8 32 6 6 41.0 37.0 39.0 4
27 1 62.0 9.5 35.8 42 7 2 58.0 3.5 30.8 42 7 3 15.0 1.4 8.2 22 7 4 21.0 8.8 14.9 32 7 5 36.0 14.0 25.0 32 7 6 13.0 2.6 7.8 2
2 8 1 50.0 41.0 45.5 42 8 2 71.0 31.0 51.0 42 8 3 86.0 16.0 51.0 42 8 42 8 52 8 6
24.0 4.7 14.4 311
Note. X = % of retrieved text to retrieved documents. Y = % of retrieved
text to all documents. M = X + Y / 2. eThe weighted average for nodes 2 5,
2 6 , 21 and 2 8 is 12.5%. Ordinal value scale at end of table.table continues
Reproduced with permission of the copyright owner. Further reproduction prohibited without permission.

271Ordinal
Node X____________ Y___________ M[___________Value1989 curriculum, grades 5-8
111 29.0 23.0 26.0 31 12 5.0 0.5 2.8 21 13 49.0 49.0 49.0 41 14 24.0 10.0 17.0 21 15 11 1 6 11 17 16.0 10.0 13.0 21 18 11 19 7.0 0.9 4.0 21 1 10 18.0 4.0 11.0 21 1 11 25.0 7.0 16.0 21 1 12 77.0 37.0 57.0 4
1 21 33.0 21.0 27.0 41 2 2 1123 11 2 4 7.0 2.0 4.5 21 2 5 4.0 0.3 2.1 21 2 6 112 7 4.0 1.0 2.5 2Note. X = % of retrieved text to retrieved documents. Y = % of retrieved
text to all documents. M = X + Y / 2. fThe weighted average for node 1 1 is
19.7% and for node 1 2,11.5%. Ordinal value scale at end of table.
table continues
Reproduced with permission of the copyright owner. Further reproduction prohibited without permission.

Node X Y Mg
272
OrdinalValue
1989 curriculum, grades 5-8
1 3 1 100.01 3 21 33I 3 4 13.0
7.0
2.0
53.5
7.5
4113
14 1 70.0 12.0 41.0 41 4 2 50.0 17.0 33.5 4143 16.0 3.0 9.5 21 4 4 17.0 1.0 9.0 2145 49.0 8.0 28.5 31 4 6 15.0 1.0 8.0 21 4 7 2.0 0.3 1.1 2148 36.0 10.0 23.0 31 4 9 I
1 5 1 62.0 8.0 35.0 31 5 2 43.0 14.0 28.5 3153 15.0 2.0 8.5 21 54 3.0 0.5 1.8 2155 68.0 11.0 39.5 41 5 6 76.0 14.0 45.0 41 5 7 100.0 6.0 53.0 41 5 8 12.0 0.9 6.5 21 5 9 115 10 1Note. X = % of retrieved text to retrieved documents. Y = % of
retrievedtext to all documents. M = X + Y / 2. 8The weighted average for
node 1 3 is 6.6%, for node 1 4, 14.8% and for node 1 5, 16.4%. Ordinal
value scale at end.of table.
table continues
Reproduced with permission of the copyright owner. Further reproduction prohibited without permission.

273Ordinal
Node X Y M* Value1989 curriculum, grades 5-8
161 30.0 6.0 18.0 31 6 2 42.0 9.0 25.5 41 6 3 11 6 4 11 6 5 14.0 2.0 8.0 21 6 6 44.0 7.0 25.5 41 6 7 1
1 7 1 11 7 2 11 7 3 11 7 4 11 7 5 11 7 6 11 7 7 11 7 8 11 7 9 1
1 81 68.0 9.0 38.5 41 8 2 8.0 0.3 4.1 21 8 3 33.0 16.0 24.5 4Note. X = % of retrieved text to retrieved documents. Y = % of retrieved
text to all documents. M = X + Y / 2. hThe weighted average for node 1 6 is
11.5%; for node 1 7,14.8% and for node 1 8,4.9%. Ordinal value scale at
end of table.
table continues
Reproduced with permission of the copyright owner. Further reproduction prohibited without permission.

274Ordinal
Node X Y M‘ Value1989 curriculum, grades 9-12
2 1 1 38.0 29.0 33.5 42 1 2 10.0 3.0 6.5 22 1 3 16.0 6.0 11.0 22 1 4 48.0 25.0 36.5 42 1 5 12 1 6 1
22 1 12 2 2 33.0 21.0 27.0 42 2 3 6.0 2.0 4.0 22 2 4 4.0 1.0 2.5 22 2 5 2.0 0.1 1.1 12 2 6 1
23 1 12 3 2 12 3 3 13.0 2.0 7.5 22 3 4 20.0 1.5 10.8 223 5 12 3 6 5.0 0.5 2.8 2
2 4 1 52.0 52.0 52.0 42 4 2 46.0 46.0 46.0 42 4 3 12 4 4 2.0 0.5 1.3 22 4 5 12 4 6 1Note. X = % of retrieved text to retrieved documents. Y = % of retrieved
text to all documents M = X + Y / 2. ‘The weighted average for nodes 2 1,2
2, and 2 3 is 12.5%. Ordinal value scale at end of table.
table continues
Reproduced with permission of the copyright owner. Further reproduction prohibited without permission.
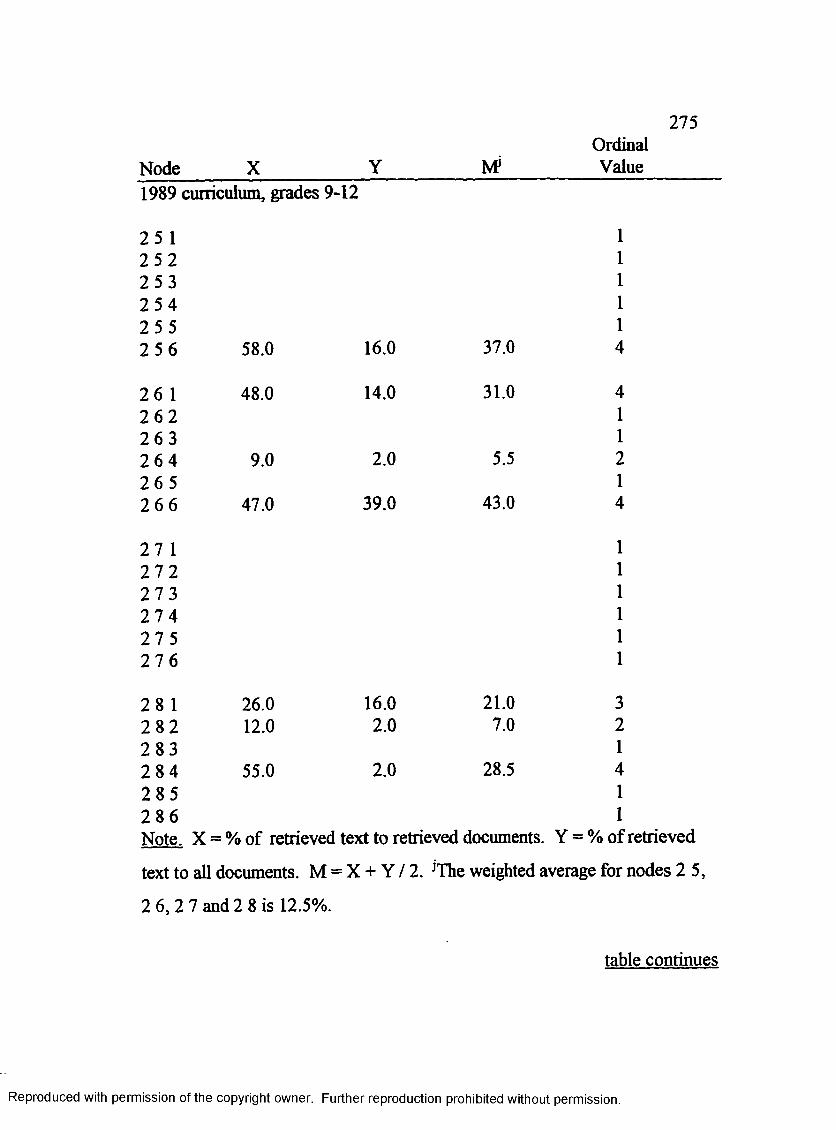
275Ordinal
Node X Y MJ Value1989 curriculum, grades 9-12
25 1 125 2 125 3 I25 4 125 5 I25 6 58.0 16.0 37.0 4
26 1 48.0 14.0 31.0 426 2 126 3 126 4 9.0 2.0 5.5 226 5 126 6 47.0 39.0 43.0 4
27 1 127 2 I27 3 127 4 127 5 127 6 1
28 1 26.0 16.0 21.0 328 2 12.0 2.0 7.0 228 3 128 4 55.0 2.0 28.5 428 5 128 6 1Note. X = % of retrieved text to retrieved documents. Y = % of retrieved
text to all documents. M = X + Y / 2. JThe weighted average for nodes 2 5,
2 6,2 7 and 2 8 is 12.5%.
table continues
Reproduced with permission of the copyright owner. Further reproduction prohibited without permission.
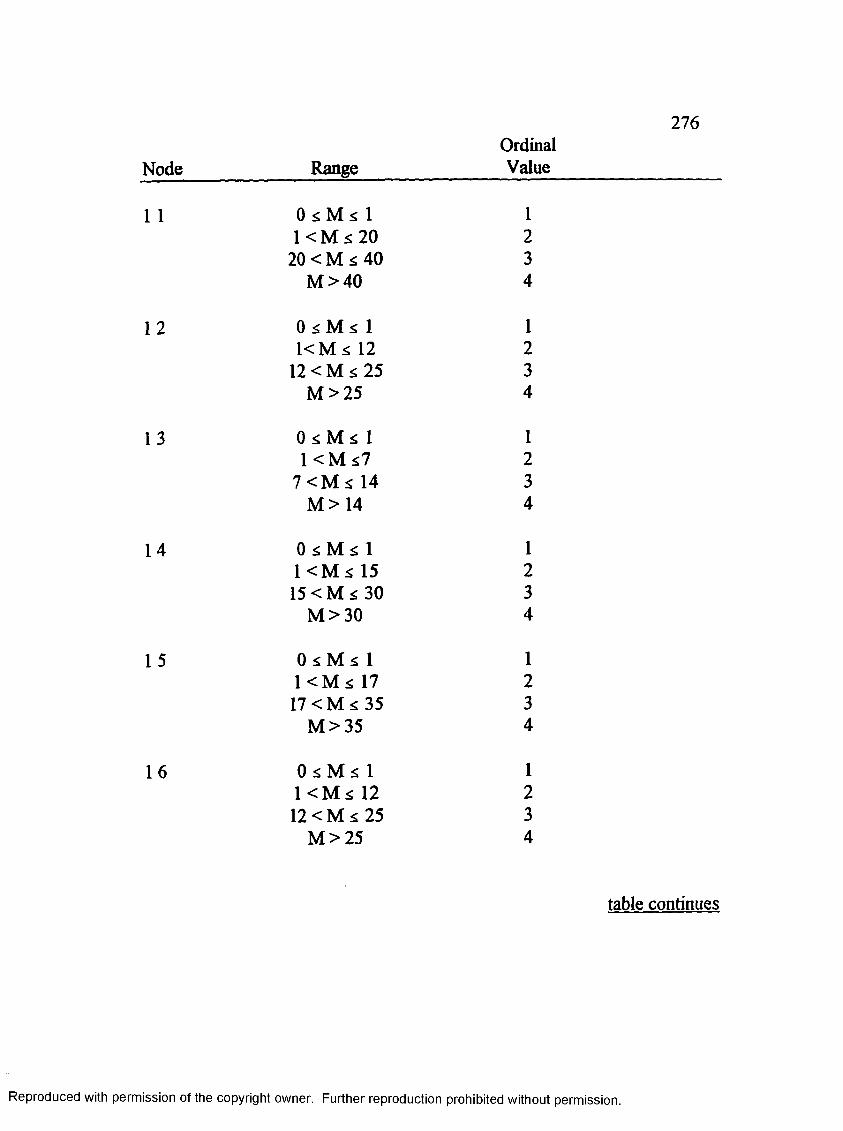
Node RangeOrdinalValue
276
1 1 0 £ M s 1 11 < M s 20 2
20 < M s 40 3M >40 4
12 0 ^ M £ 1 11<M £ 12 2
12 < M £ 25 3M >25 4
13 0 s M £ 1 11 <M *7 2
7 <M s 14 3M > 14 4
14 0 £ M £ 1 11 <M s 15 215 < M £ 30 3
M > 30 4
15 0 M s 1 11 <M s 17 217 < M £ 35 3
M > 35 4
16 0 s M $ 1 11 <M £ 12 212 < M s 25 3
M > 25 4
table continues
Reproduced with permission of the copyright owner. Further reproduction prohibited without permission.

NodeM
RangeOrdinalValue
277
1 7 O jsM s I 11 <M £ 15 215 <M £ 30 3
M >30 4
18 0 ^ M <; 1 11 <M s 5 2
5 < M £ 10 2M > 10 4
2, All 0 £ M s 1 11 <M s 13 213 <M £ 26 3
M >26 4
Reproduced with permission of the copyright owner. Further reproduction prohibited without permission.

Appendix T Unique Activities -1989 P.A.S.S. Curriculum
278
ACTIVITY 6
Write the letter in the crossword puzzle that matches the quotient for that letter. ^
A
3 p r
"T"6 ( sT
T3 f T
DjjprM
l E
T3 nn
example:IS
3 /4 53IS
9
Reproduced with permission of the copyright owner. Further reproduction prohibited without permission.
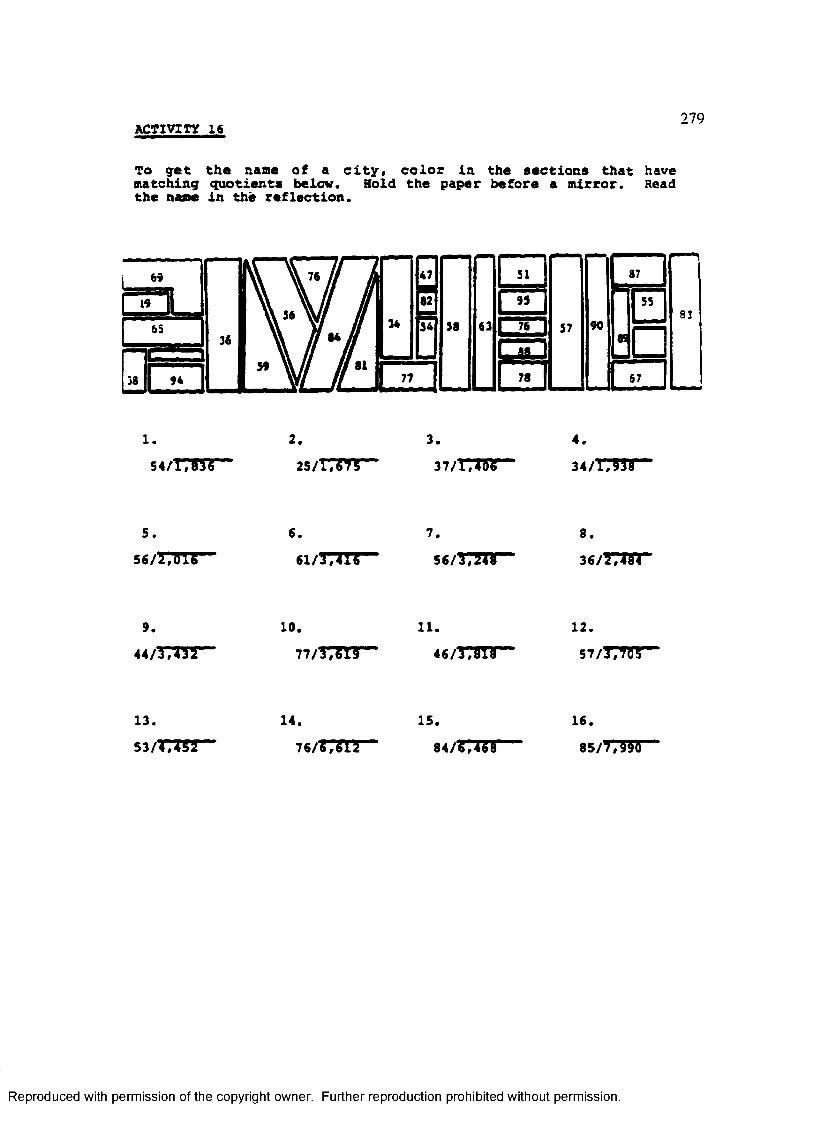
ACTIVITY 16279
To get the name of a city, color in the sections that have matching quotients below. Bold the paper before a mirror. Read the name in the reflection.
51 871
95 I 5583
S8 63 76 57 90 J =
g S L 178 67
1.54/T7S3T
2 .25/T7Tfr
3 .
37/1', JffiF
4.34/1', 938'
5 .
56/TT7TT
6 .61/T 7H T
7 .
56/Trsnr8 .36/TTT5T
9.
44/1,43210.
77/T ^ T T
11.46/TTSTT
1 2 .5 7 / 3 , 7 o l
13.5 3 /m 5 r
14.76/5,^12
15.
84/6,44116.
8 5 /7 7 W
Reproduced with permission of the copyright owner. Further reproduction prohibited without permission.

ACTIVITY 19
W hale C h a rt
280
Slue Vhale ( le s s e e s a a la a l which, ever Li'
le e f th : 95 fee s w eighs: 150 eoee
leogeh: 30 ferew eighs: 10 to ss
leogeh : 65 feee w eighs: 60 sm s
Use the chart to answer these questions. Show your work.
1. How much lonqer is the Blue Whale than the Narwhal?
2. How many Bottle**Nosed Whales would it take to equal the weight of one Right Whale?
3. One ton * 2000 pounds. Row much does a Blue Whale weigh in pounds?
Reproduced with permission of the copyright owner. Further reproduction prohibited without permission.

ACTIVITY 20281
B ird Chart
RiCbaac ( lia r j F astest f ila r largaac | n a lla s tGoose __ Faragrlae. te lea s
26,000 fa s t j 110 w*h ' 300 psuads 1 2 laehaaEroot esc H » |s h m < F astest raoaar Oldest | G reatest traveler
Albatross
S f /
L - ^ I s o a n Tara J .
■ ' A ■-*•“ f"
12 faae SO apt 69 yaars 11,000 a lia s
Use this chart to answer thass questions. Show your work.
1. Tha old*at parson lived to ba about 130 yaars. How such oldar Is this than tha "old" ravan?
2. So m jat airlinars eruisa at 35,000 feat. How auch higher is this than tha highest flying bird?
3. The fastest a parson can run is about 25 alias par hour. How aany tiaas faster can tha ostrich run?
Reproduced with permission of the copyright owner. Further reproduction prohibited without permission.
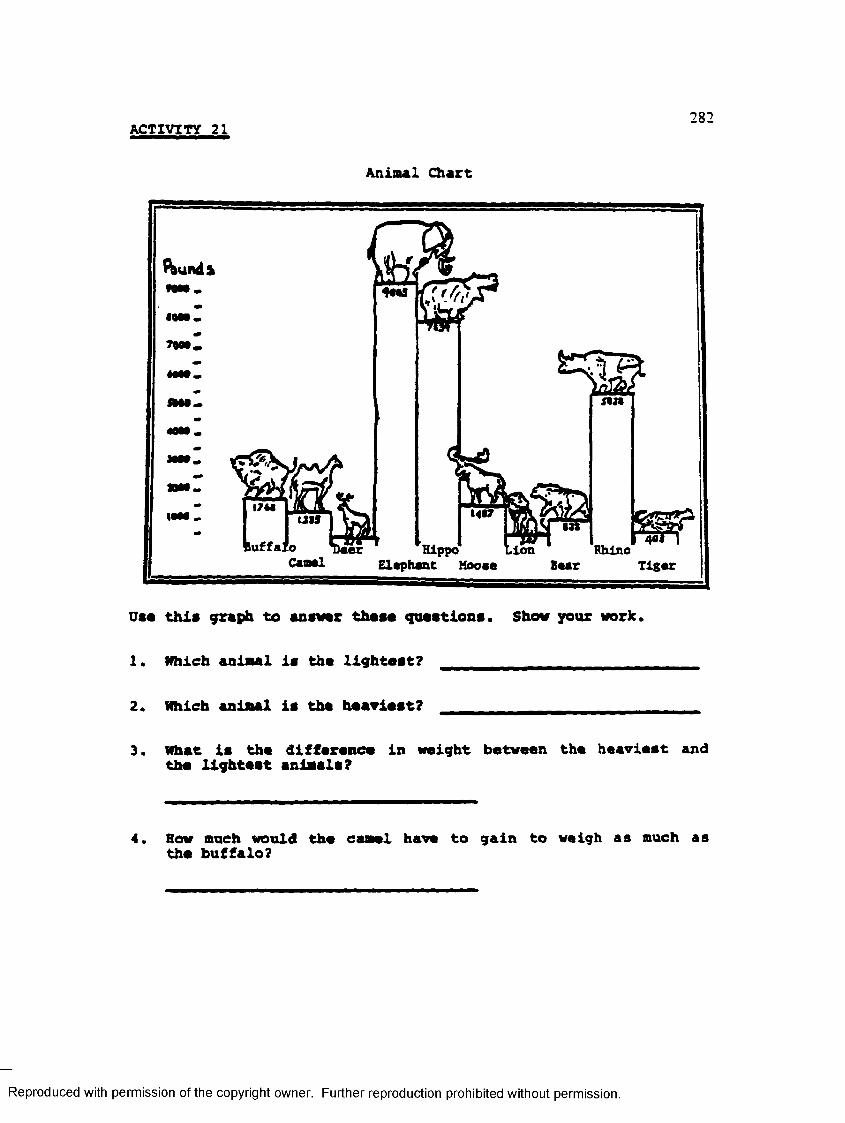
ACTIVITY 21282
A n im a l C h a rt
Suffalo Rhino
Use this graph to answer these questions. Show your work.
1. Which animal is tha lightest? _ _ _ _ _ _ _ _ _ _ _ _
2. Which animal is tha heaviest? .
3. What is tha diffaranca in weight between the heaviest and tha lightast animals?
4. Hew much would the camel have to gain to weigh as much as the buffalo?
Reproduced with permission of the copyright owner. Further reproduction prohibited without permission.

283
ACTIVITY Z
Write a fraction for each shaded part of the robot.
(D
n W m
n s B iL^99mm
9 © ® ©
Reproduced with permission of the copyright owner. Further reproduction prohibited without permission.

leimn nzzPut thass fra c tio n s in to tha "s h rin k in g aach in s ." Raduca to lo v s s t ta rs s .
©* ©* ©■S’ ® A ®&®i ©■& ©a ®§ ®&®* ©* ©■& ®& ®#©£ © ©♦ ® A ® ji
© ______ . © . . . © .. ® ®
© . © _______. ® .. ® . ®
© . © , ®_ ... ® ©
©______ . ©. . . © . © ®
Reproduced with permission of the copyright owner. Further reproduction prohibited without permission.

285
ACTIVITY V
Are
1.
the measurements equivalent?
450 cm, 4.5 m
Write yes
2.
or no.
7.2 m. 7200 cm
3. 200 m. 2 cm 4. 54 mm, 0.54 cm
5. 925 mm. 92.5 cm 6. 4.1 cm, 41 mm
7. 36.2 cm. 3620 am 8. 1.94 am. 194 cm
9. 56 cm. 0.56 m — 10. 14 m. 140 cm
11. 6.8 mm. 86 cm 12. 9.2 a. 209 cm
' It is 56 centimeters I o n a
Iona!m i l l i m e t e r s
13. Who is correct?
Reproduced with permission of the copyright owner. Further reproduction prohibited without permission.
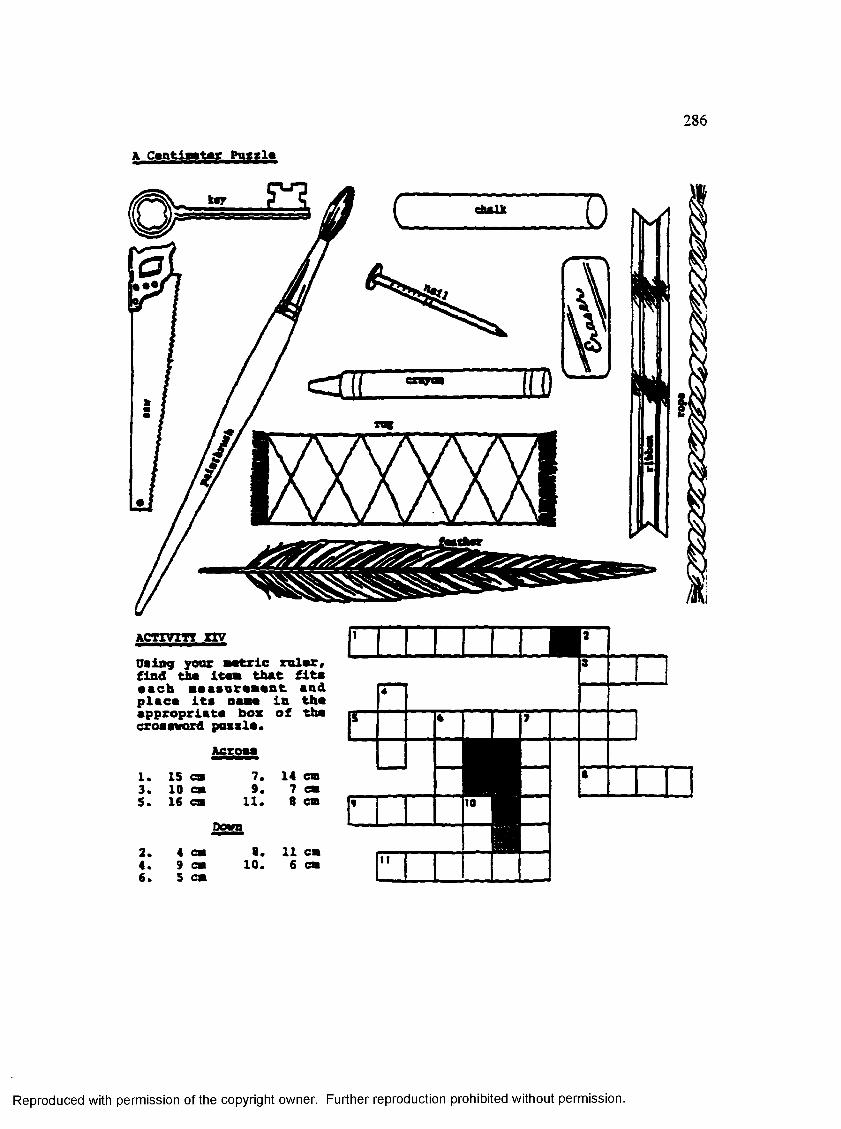
A Csntlaatar Putzla
c cfeslk D
0)
m
ACTIVITY XIV
Using your a a tr ic r o ls r , fin d tha its a th a t f i t s e a c h a a s s a ra a a n t and p la c a i t s naaa in th a a p p ro p ria te bos o f tha crossaord p asx le .
1 . 153 . 105 . 16
Across
7. 9 .
11.14 ca
7 ca8 ca
Doan
2 .4.6 .
4 ca9 ca5 ca
8. 11 ca10. 6 ca
Reproduced with permission of the copyright owner. Further reproduction prohibited without permission.
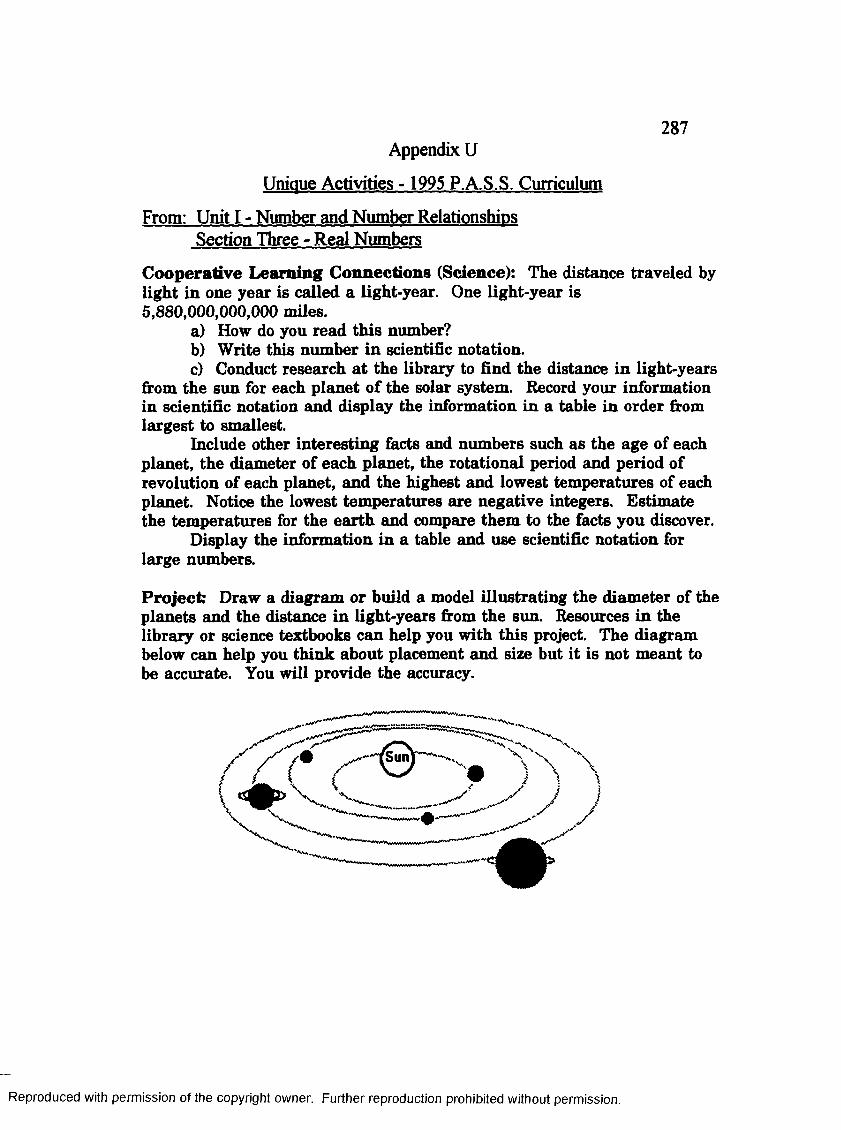
Appendix U287
Unique Activities -1995 P.A.S.S. Curriculum
From: Unit I - Number and Number Relationships Section Three - Real Numbers
Cooperative Learning Connections (Science): The distance traveled by light in one year is called a light-year. One light-year is 5,880,000,000,000 miles.
a) How do you read this number?b) Write this number in scientific notation.c) Conduct research at the library to find the distance in light-years
from the sun for each planet of the solar system. Record your information in scientific notation and display the information in a table in order from largest to smallest.
Include other interesting facts and numbers such as the age of each planet, the diameter of each planet, the rotational period and period of revolution of each planet, and the highest and lowest temperatures of each planet. Notice the lowest temperatures are negative integers. Estimate the temperatures for the earth and compare them to the facts you discover.
Display the information in a table and use scientific notation for large numbers.
Project: Draw a diagram or build a model illustrating the diameter of the planets and the distance in light-years from the sun. Resources in the library or science textbooks can help you with this project. The diagram below can help you think about placement and size but it is not meant to be accurate. You will provide the accuracy.
/yc y\ \
Reproduced with permission of the copyright owner. Further reproduction prohibited without permission.

From: Unit III - Computation and Estimation Section Three - Proportion
288
Cooperative Learning Problem 5: In the United States, Cinco de Mayo is the day reserved to celebrate Mexican independence from Spanish rule. Mariachis stroll freely during the festivities to serenade the crowds. Your group is in charge of the food and have decided you want to serve chili. Your recipe is designed for 6 people.
Chili recine3 ib. ground beef dash red pepper2 large chopped onions 1 Tbs. flour2 chopped garlic buttons 1/4 c. ch ili powder1 tsp. salt 3 cup6 boiling water1/2 tsp. pepper 1 can tomato paste
a) What are the conversion ratios?b) Estimate and then calculate the exact ingredients needed in the recipe to serve 350 people. Were your estimates close?
From: Unit I J - Computation and Estimation Section Four: ProblemSolving
Project: Quinceanera parties are given by Latino families for fifteen year olds and can be very expensive. It is very helpful to make a budget to plan large parties such as these. Your group project is to make a budget for this type of party or some other gathering of your choice. Estimate costs for food, entertainment such as musicians, hall rental, clothing, and all other costs associated with your party. Use a spreadsheet to itemize your costs.
nc: ■<!:
Reproduced with permission of the copyright owner. Further reproduction prohibited without permission.
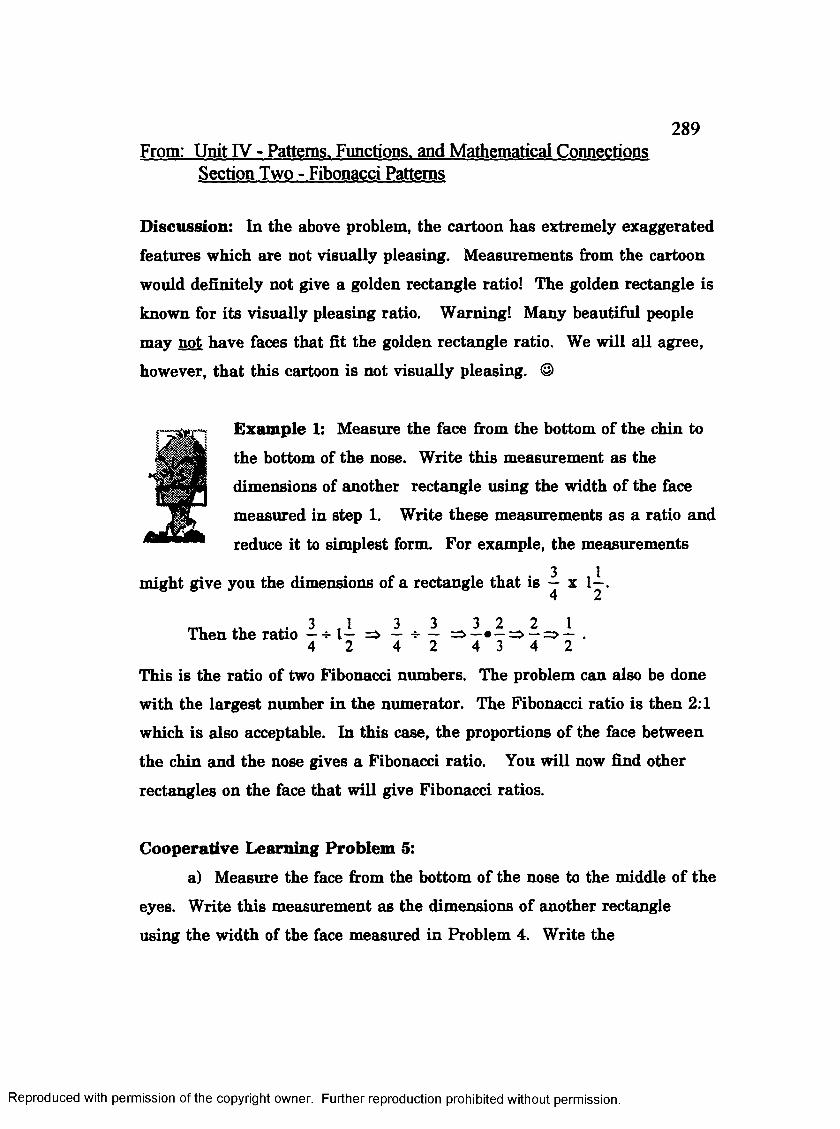
289From: Unit IV - Patterns. Functions, and Mathematical Connections
Section Two - Fibonacci Patterns
Discussion: In the above problem, the cartoon has extremely exaggerated
features which are not visually pleasing. Measurements from the cartoon
would definitely not give a golden rectangle ratio! The golden rectangle is
known for its visually pleasing ratio. Warning! Many beautiful people
may not have faces that fit the golden rectangle ratio. We will all agree, however, that this cartoon is not visually pleasing. ©
Example 1: Measure the face from the bottom of the chin to
the bottom of the nose. Write this measurement as the dimensions of another rectangle using the width of the face
measured in step 1. Write these measurements as a ratio and
reduce it to simplest form. For example, the measurements3 1might give you the dimensions of a rectangle that is — x 1—.4 2
,, , 1 3 3 3 2 2 1Then the ratio —-s-l— => — * —4 2 4 2 4 3 4 2
This is the ratio of two Fibonacci numbers. The problem can also be donewith the largest number in the numerator. The Fibonacci ratio is then 2:1which is also acceptable. In this case, the proportions of the face betweenthe chin and the nose gives a Fibonacci ratio. You will now find other
rectangles on the face that will give Fibonacci ratios.
Cooperative Learning Problem 5:
a) Measure the face from the bottom of the nose to the middle of the
eyes. Write this measurement as the dimensions of another rectangle
using the width of the face measured in Problem 4. Write the
Reproduced with permission of the copyright owner. Further reproduction prohibited without permission.
290
measurements as a ratio and determine whether it fits the Fibonacci ratio
or the golden rectangle ratio.b) Find other rectangles by measuring the features of the face and
determine whether the ratios fit the Fibonacci ratios or the golden
rectangle.
c) Share your findings with the other groups. Discuss the ideas
behind the golden rectangle.
What is visually pleasing?
Does "visually pleasing" differ between cultures?
Were models used in the class who are considered beautiful but whose
dimensions did not fit these ratios?
Reproduced with permission of the copyright owner. Further reproduction prohibited without permission.
291
Is there a new ratio that your class can create from your measurements to
define the beauty of your class members?
The Fibonacci ratio was named after Leonardo Fibonacci. Make up a name
for your class ratio.
Reproduced with permission of the copyright owner. Further reproduction prohibited without permission.
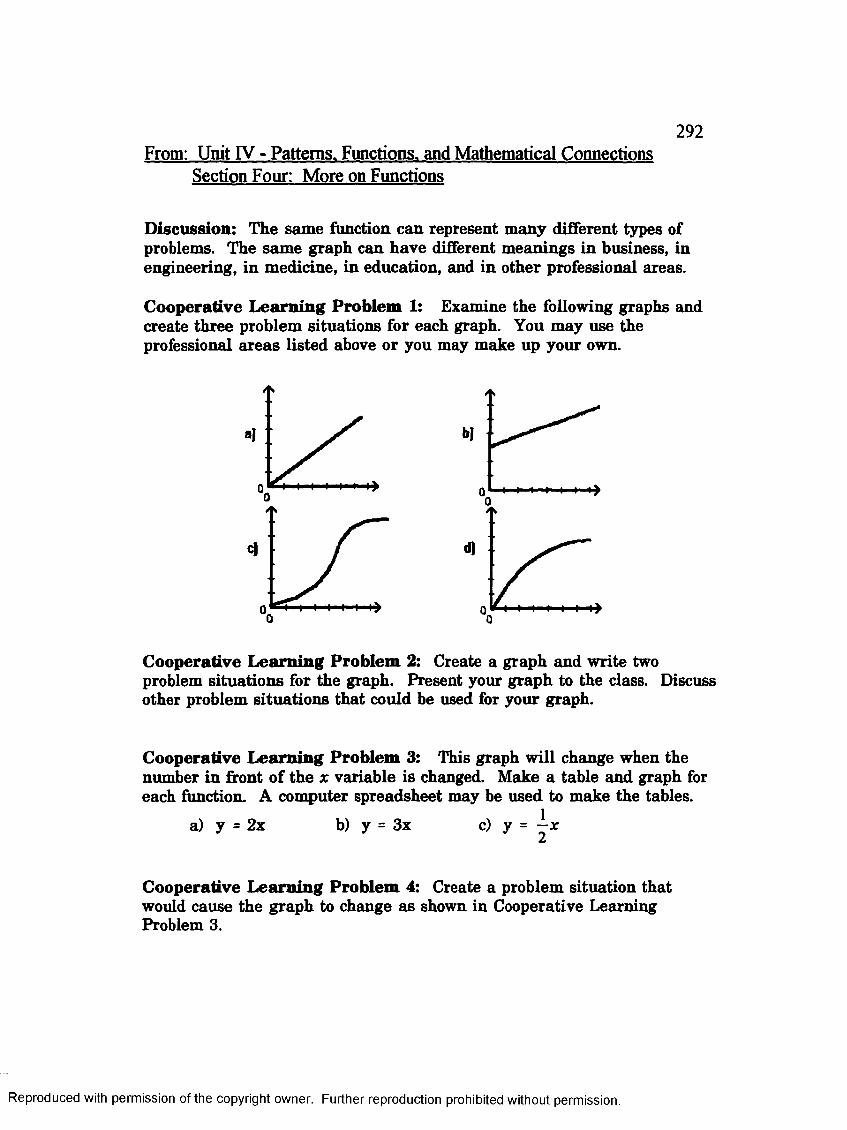
292From: Unit IV - Patterns. Functions, and Mathematical Connections
Section Four: More on Functions
Discussion: The same function can represent many different types of problems. The same graph can have different meanings in business, in engineering, in medicine, in education, and in other professional areas.
Cooperative Learning Problem 1: Examine the following graphs andcreate three problem situations for each graph. You may use the professional areas listed above or you may make up your own.
bl
Cooperative Learning Problem 2: Create a graph and write two problem situations for the graph. Present your graph to the class. Discuss other problem situations that could be used for your graph.
Cooperative Learning Problem 3: This graph will change when the number in front of the x variable is changed. Make a table and graph for each function. A computer spreadsheet may be used to make the tables.
a) y = 2x b) y = 3x c) y = — x
Cooperative Learning Problem 4: Create a problem situation that would cause the graph to change as shown in Cooperative Learning Problem 3.
Reproduced with permission of the copyright owner. Further reproduction prohibited without permission.

293From: Unit IV - Patterns. Functions, and Mathematical Connections
Section Five: Mathematical Connections
Problem 4: Frederico is a graduate student in biology and is studying
the growth rate of cancer cells in mice. He measures the width of the new
growth at regular intervals of time and records the data in a table.
a) Fill in the table.
b) Using t for the time in seconds, and s for the
size of the cell, write an equation which
expresses the pattern in the table.
c) Use the equation to find the size of the cell
in one minute. (Careful - one minute, not one second. Change the one
minute to seconds.)
d) Use the equation to find the size of the cell in one hour. (Careful - one
hour, not one minute. How many seconds are in one hour?)
e) Does this problem seem reasonable? Use a ruler to determine
how large the tumor would be for your answer in part d.
What are the conclusions that might be drawn by Frederico?
Time in Size ofseconds cell
1 ,02 mm2 .04 mm3 .06 mm4 .08 mm5 ?6 ?7 ?8 ?9 ?
10 ?
Reproduced with permission of the copyright owner. Further reproduction prohibited without permission.

294From: Unit V - Measurement
Section One: Measurable Properties of Physical Objects
Cooperative Learning Problem 14:
Practice drawing a picture of therectangular prism with dimensions \5" x 8,r x 3" . ' h
............. .. .. .!
K8
Mentally unfold it and draw a picture
of the resulting two-dimensional figure.
Label the measurements on each edge.
Definition: Surface area is the total area of the faces of a solid. To find
the surface area of a solid, the areas of each face are added together.
Problem 15:a) How many faces are on a cube?b) How many faces are on a rectangular prism?c) Find the surface area of a 4" x 4" x 4" cube.d) Find the surface area of a 5" x 8" x 3" rectangular prism.e) Write a formula for surface area of a rectangular prism. Use
the variables S, I, w, h. Hint: Use the drawing you made in
Cooperative Learning Problem 14 and label the edges with
the variables to help you write the formula.
Reproduced with permission of the copyright owner. Further reproduction prohibited without permission.

295Cooperative Learning Problem 16: The solid below has the following dimensions:
a bSquare cube 1" 3"Small rectangular length 5" 6"Large rectangular length 10" 10"
Find the volumes of the solids a and b.
From: Unit V - Measurement Section One: Measurable Properties of Physical Objects
Project:Victor has a very disorganized closet.He sees an advertisement from your
group to build closet organizers. These
are groups of shelves and cubby holes to
hold shoes, sweaters, shirts, pants, suits, and other items. Victor wants separate
compartments for 10 pairs of shoes, and
Reproduced with permission of the copyright owner. Further reproduction prohibited without permission.

296
a space large enough to hang 5 suits, 10 shirts, and 12 pairs of pants. He
wants separate compartments for 10 pairs of shoes, and a space large
enough to hang 5 suits, 10 shirts, and 12 pairs of pants. He wants
separate spaces to store 10 sweaters and 15 ties, and space for
miscellaneous items. His closet is a rectangular prism with the following
dimensions: 1 = 10' w = 3' and
h = 12' .
a) Name your company.b) Design a closet organizer for Victor. Make a sketch of your design
with measurements included on the sketch.c) You will need to paint it when you are finished. How many square feet
will need to be painted?
From: Unit VI - Statistics and Probability Section Two: Data Analysis
Project (Endangered Species): Conduct research in the library and/or
on the Internet concerning endangered species. Collect data, make tables, matrices, and graphs to represent your data. Write a report and present it to the class (or to your contact person) using your graphs for displays.
3
Reproduced with permission of the copyright owner. Further reproduction prohibited without permission.

297
Cooperative Learning Problem 3: The test scores for Miss Leon's math test are:
{75, 86, 35, 97, 86, 73, 67, 98, 84, 83, 66, 55, 92, 89, 75, 36, 49, 98, 100,
91)a) Find the mean, median, mode, and range for the data.
Mean:______ Median:_______ Mode:_____
b) Which is the most meaningful measure of dispersion for Miss Leon to use in analyzing the test scores?
c) What conclusion can Miss Leon reach based upon her analysis?
Cooperative Learning Problem 4 (Computer Spreadsheet): Use a computer spreadsheet to graph the data in the last problem. Experiment with the following types of graphs: column graph, scatterplot, pie-chart, and histogram.Which is the most useful data representation? (This can be completed by hand but it is easier on a computer).
Cooperative Learning Problem 7: Make up stories for each of the following graphs. Share them with the other groups. Who has the best story? Who has the funniest story? Who has the most unbelievable story?
a) i b)
-1.
1 2 3 4 5 6 7
Reproduced with permission of the copyright owner. Further reproduction prohibited without permission.

298
8) Pablo and Luis enjoy playing marbles, and each of them has 24 marbles. They have decided to trade each other one marble in a random
selection by reaching into the other’s bag and selecting a marble without looking. Pablo has 5 green, 4 clear, 8 blue, 3 red swirls, 3 yellow swirls, and 1 agate. Luis has 4 blue, 2 white, 5 orange swirls, 3 green, 5 clear, 3 yellow swirls, and 2 agates,a) Create one large matrix to display
the information about Pablo's and Luis’ collections of marbles.
Reproduced with permission of the copyright owner. Further reproduction prohibited without permission.

299b) Find the probability of Pablo selecting each of the following from Luis’ collection:
i) P(red swirl)ii) P(not choosing an agate)iii) P(blue)iv) P(orange swirl or green)
c) Find the probability of Luis selecting each of the following from Pablo’s collection:
i) P(clear)ii) P(agate)iii) P(white, green, or blue)iv) P(not choosing yellow swirl or white
d) Find the probability of Pablo choosing a type of marble he already owns.
e) Find the probability of Luis choosing a type of marble he already owns.
f) What could the boys do to make sure that they each get a new type of marble? Find the probability of each boy getting one of the “new” marbles.
From: Unit VII - Algebra Section One: Abstraction and Symbolism
Brainstorm: You are explorers in a new world and you cannot communicate with the citizens.You are hungry and want to buy a Dagwood sandwich. Describe this new world and brainstorm the various ways you can solve this problem.Share your findings with the other groups.
Reproduced with permission of the copyright owner. Further reproduction prohibited without permission.

300Problem 1: Answer the following questions:
a) List at least three symbols for patriotism in a country of your choice.b) List at least five abstract ideas and three symbols for each.
Cooperative Learning Problem 2: Your group has been chosen to take inventory of the school supplies in the Principal's supply closet in her office because you are considered to be quick-witted problem solvers. You must finish as quickly as possible because Dr. Soto needs her office. You look in the supply closet and see there are the following items that need to be counted: boxes of pencils, pens, paper clips, staples, and binder clips; scotch tape, staplers, memo pads, post-it notes, typing paper, and stationery. In each box there are 20 pencils, 10 pens, 100 paper clips, 5000 staples, 12 binder clips, 1 scotch tape, and 1 stapler. The memo pads and post-it notes are in packs of 10 each, and the typing paper and school stationery are each in reams of 500.
Devise an inventory method to simplify your task so that you are in the supply closet for as little time as possible.
Cooperative Learning Problem 3: Take a piece of 8—"x 11" paper and2
cut it in half. How many pieces are there? Cut each piece in half again. Now how many pieces are there? Continue doing this and writing down the number of pieces. How long can you do this? How many pieces arethere?
Cut #1 - Number of pieces:__Cut #2 - Number of pieces:__Cut #3 - Number of pieces:__Cut #4 - Number of pieces:__Cut #5 - Number of pieces:__Cut #6 - Number of pieces:__Cut #7 - Number of pieces:__Cut #8 - Number of pieces:__Cut #9 - Number of pieces:__Cut #10- Number of pieces:__Cut #11- Number of pieces:__Cut #12- Number of pieces:__Cut #13- Number of pieces:__
and so on.
Reproduced with permission of the copyright owner. Further reproduction prohibited without permission.
301
Discussion: You should have discovered that you could not continue cutting the paper because the pieces were too small to cut. However, you can mentally visualize being able to continue cutting this paper forever and there would be an infinite number of pieces.
Infinity ( the symbol is oo ) is an abstract idea. The sum of the number of pieces can be written as
1 + 2 + 4 + 8 + 16 + 32 + 64 + 128 + 256 + 512 + 1024 + 2048 + 4096 + ...
This is an infinite arithmetic series whose sum is infinity. Prove this by adding the terms shown above of the series, and then continuing to add one term at a time to see that the sum is continuously increasing.
Project (Symbols): There are many symbols used in mathematics. Use textbooks, library resources, and other resources to find math symbols. When the class has found a large variety of symbols, use colored markers to make posters for the classroom by arranging the symbols in categories or in collages.
Reproduced with permission of the copyright owner. Further reproduction prohibited without permission.

From: Unit VIII - Geometry Section Three: Congruence and Similarity
302
Brainstorm: Look in a dictionary or math text for the definitions of congruence and similarity. Examine the following figures. Which concept applies? Write the words congruence or similarity on the blank lines.
c) d)
v j \ j \. j \ j , x, j
nwwrwrwn
e) f)
Reproduced with permission of the copyright owner. Further reproduction prohibited without permission.
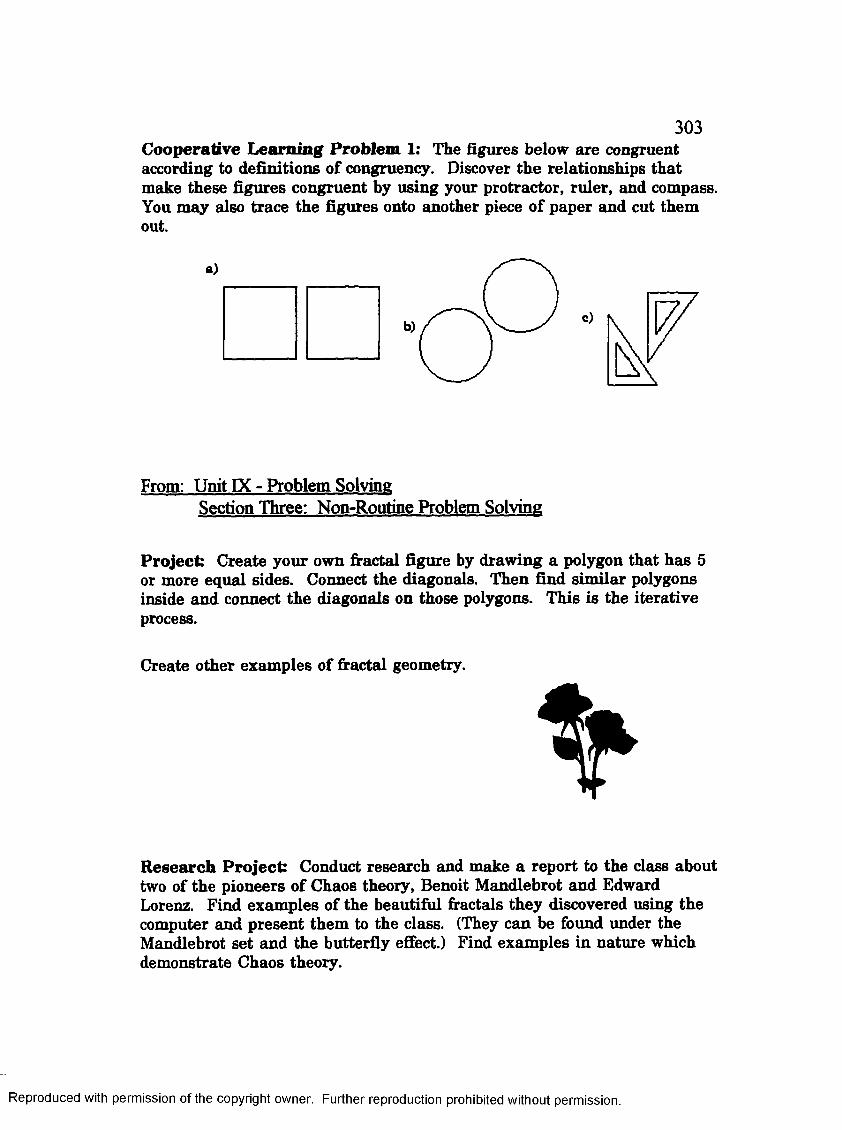
303Cooperative Learning Problem 1: The figures below are congruent according to definitions of congruency. Discover the relationships that make these figures congruent by using your protractor, ruler, and compass. You may also trace the figures onto another piece of paper and cut them out.
b) c)
From: Unit IX - Problem Solving Section Three: Non-Routine Problem Solving
Project: Create your own fractal figure by drawing a polygon that has 5 or more equal sides. Connect the diagonals. Then find similar polygons inside and connect the diagonals on those polygons. This is the iterative process.
Create other examples of fractal geometry.
*
Research Project: Conduct research and make a report to the class about two of the pioneers of Chaos theory, Benoit Mandlebrot and Edward Lorenz. Find examples of the beautiful fractals they discovered using the computer and present them to the class. (They can be found under the Mandlebrot set and the butterfly effect.) Find examples in nature which demonstrate Chaos theory.
Reproduced with permission of the copyright owner. Further reproduction prohibited without permission.

From: Unit X - Mathematics as Communication304
Exercise 3 • What Am I Saying (Part I)?: Writing instructions clearly is an important communications skill. The reader must be able to follow the instructions and reproduce the design. The reader cannot ask the writer for further clarification because the writer is not present. In this exercise, you will strengthen your writing and reading skills. Read the following steps before you begin this exercise.
Step 1: Create a simple design using the properties of reflection, rotation, and symmetry.
Step 2: Write instructions for creating your design. Do not use diagrams.
Step 3: Use your instructions to duplicate your design. Do the instructions work? If not, edit your instructions and make them more precise.
Step 4: Give your instructions to a classmate as an exercise. Can the classmate duplicate your design? If not, go through each step with your classmate and see where the difficulty lies. Rewrite those steps.
Step 5: Give the edited instructions to another classmate and repeat Step 4.
Step 6: This exercise is complete when your instructions can be used correctly.
Reproduced with permission of the copyright owner. Further reproduction prohibited without permission.
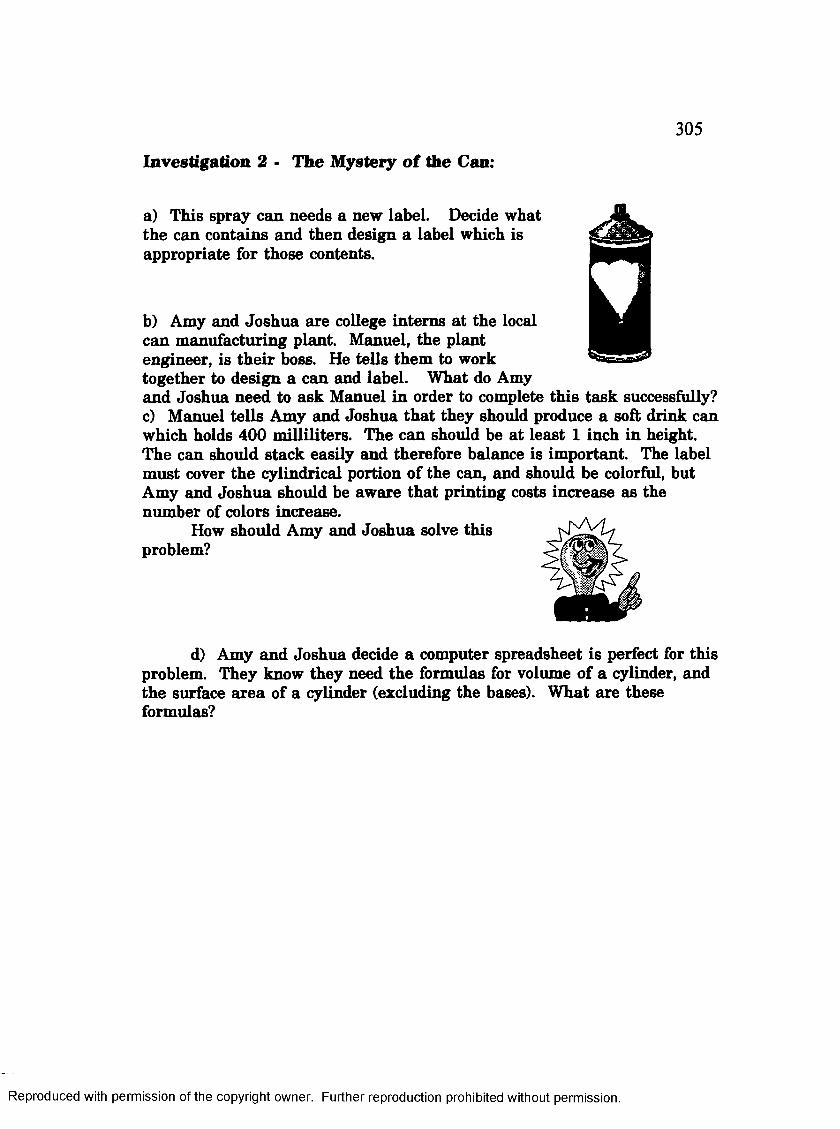
Investigation 2 - The Mystery o f the Can:
305
a) This spray can needs a new label. Decide what the can contains and then design a label which is appropriate for those contents.
b) Amy and Joshua are college interns at the local can manufacturing plant. Manuel, the plant engineer, is their boss. He tells them to work together to design a can and label. What do Amy and Joshua need to ask Manuel in order to complete this task successfully?c) Manuel tells Amy and Joshua that they should produce a soft drink can which holds 400 milliliters. The can should be at least 1 inch in height. The can should stack easily and therefore balance is important. The label must cover the cylindrical portion of the can, and should be colorful, but Amy and Joshua should be aware that printing costs increase as the number of colors increase.
How should Amy and Joshua solve this problem?
d) Amy and Joshua decide a computer spreadsheet is perfect for this problem. They know they need the formulas for volume of a cylinder, and the surface area of a cylinder (excluding the bases). What are these formulas?
Reproduced with permission of the copyright owner. Further reproduction prohibited without permission.

They fill in the data they know on a spreadsheet. Why did they stop at h=20?__________________
306
Volume r height h SA400 1400 2400 3400 4400 5400 6400 7400 8400 9400 10400 11400 12400 13400 14400 15400 16400 17400 18400 19400 20
Use the formulas below to fill in the spreadsheet for Amy and Joshua. The computer can do this easily for you. Otherwise, you can do the calculations with a calculator.
r = V400/ 3.14/i SA = 2(3.14)rh
Reproduced with permission of the copyright owner. Further reproduction prohibited without permission.

e) Write your reason(s) for your recommendations in complete sentences.
Size of can - radius:________ height:______Size of label - radius:________ height:---------
Design label - Number of colors:___
Draw your design label here:
Reproduced with permission of the copyright owner. Further reproduction prohibited without permission.
308
Exercise 5 - Car Mathematics: Most careers require
an understanding of mathematics. The design,
manufacturing, and selling of automobiles is an example of an industry whichdepends on mathematics. Write a
2-3 page essay which discusses the uses of mathematics
in the automotive industry.
Exercise 6 - Building a House:Another industry which requires an understanding of mathematics is the
construction industry. Write a 3-4 page essay which discusses the
mathematics involved in building a house. Attach diagrams which
demonstrate your understanding of the geometry involved in building a
house.
Exercise 9 - Poetic Justice:
You have now completed the ten-unit course Integrated Math A and
Integrated Math B. Write a poem or limerick comparing your feelings
about mathematics when you started the program and your feelings now
that you are completing the program.
Reproduced with permission of the copyright owner. Further reproduction prohibited without permission.

309
VITA
Karen I. Conger
1983 .......................................... B.S. - FinanceManagement Science Option University of Tennessee at Knoxville
1989.......................................... M.A. - EducationCurriculum and Instruction California State University, Bakersfield
1986 - present........................... Teacher of Secondary Mathematics,Kern High School District, Bakersfield, CA.
Other - ....................................... GTE Gift Fellow, 1994-1995;Various curriculum development projects; California Math Project, 1991.
Reproduced with permission of the copyright owner. Further reproduction prohibited without permission.