A Consolidated Approach for Estimation of Data Security ...malaiya/p/breachcostAlgarni2016.pdf · A...
15
A Consolidated Approach for Estimation of Data Security Breach Costs Abdullah M. Algarni Computer Science Department Colorado State University Fort Collins, USA [email protected] Yashwant K. Malaiya Computer Science Department Colorado State University Fort Collins, USA [email protected] Abstract—Many security breaches have been reported in the past few years impacting both large and small organizations. There has often been considerable disagreement about the overall cost of such breaches. No significant formal studies have yet addressed this issue, though some proprietary approaches exist. A few computational models for evaluating partial data breach costs have been implemented, but these approaches have not been formally compared and have not been systematically optimized. There is a need to develop a more complete and formal model that will minimize redundancy among the factors considered and will confirm with the available data regarding the costs of data breaches. Existing approaches also need to be validated using the data for some of the well documented breaches. It is noted that the existing models yield widely different estimates. The reasons for this variation are examined, and the need for better models is identified. Keywords—Information security, risk assessment, data breach cost, market valuation I. INTRODUCTION The risk of compromising the confidentiality of records has increased with the increasing trend of businesses collecting, storing, and transmitting financial and personal information in electronic form. A data breach incident refers to malicious data disclosure to unauthorized parties [1]. Such breaches occur for different reasons. The hackers’ intent is often to steal data for financial gain, but they may also intend to harm individuals or organizations by disclosing their confidential information or intellectual property. In the past few years there have been several well-publicized data breaches. In spite of significant effort by government agencies, those involved in such cybercrimes are often caught only after a long period of activity, and some are never caught. The potential victims of such crime thus have the burden of assessing their risk and investing in countermeasures. Estimates of the costs incurred in such data breaches are published frequently. However, those estimates vary widely. Without proper disclosure by the impacted organizations, it is hard to compare the risk of information loss and its potential costs. Thus, the collection and aggregation of such information is vital. A careful quantitative analysis of data from the disclosures can be used to allocate resources for prevention and recovery after a breach. However, there is no established approach, although a few organizations such as the Ponemon Institute and NetDiligence are involved in data collection. This makes empirical cost estimation challenging. To assist in prioritizing potential actions and obtain more information on the nature of data breaches, the assessment of immediate and long-term costs, and the development of effective countermeasures, detailed studies are needed. Data breaches impact a large fraction of all organizations. For instance, 43% of companies in the United States experienced a data breach in 2013 [2]. In 2015, there were 781 data breaches that were reported in U.S. companies (including small businesses), and according to the Identity Theft Resource Center [3], more than 169 million records were exposed. The cost of data breaches has increased 23% since 2013 according to studies conducted by IBM and the Ponemon institute [4]. According to the Ponemon Institute’s studies of U.S. data breaches, the average cost of a compromised record has not changed significantly over the last five years. However, according to the NetDiligence studies, the average cost per record steadily increased between 2012 and 2015 (Fig.1) because the median number of records exposed was very small. The average data breach cost has also been increasing over the last three years (2013, 2014, and 2015) for most countries included in the Global Analysis study of the Ponemon Institute (Fig.2) . For Germany and Australia, the average cost per record has varied slightly or remained almost the same. Some data costs of Canada and the Arabian Cluster (including Saudi Arabia and United Arab Emirates) are not available for some of the years. A systematic study of data breach costs can help optimize data breach response plans, and this can potentially lead to a reduction in the costs related to breaches of up to 47% according to a Symantec/Ponemon Institute study [5]. The objective of this paper is to examine, compare, and evaluate the existing approaches for assessing data breach costs and identifying the issues that need to be addressed. This is a major challenge that requires significant effort for the methods to have good predictive capability, as can be seen from the following sections. Some organizations have developed online cost calculators based on their collection of data and modeling assumptions. Unfortunately, the computations incorporated in the calculators are proprietary.
Transcript of A Consolidated Approach for Estimation of Data Security ...malaiya/p/breachcostAlgarni2016.pdf · A...

A Consolidated Approach for Estimation of Data Security Breach Costs
Abdullah M. Algarni
Computer Science Department
Colorado State University
Fort Collins, USA
Yashwant K. Malaiya
Computer Science Department
Colorado State University
Fort Collins, USA
Abstract—Many security breaches have been reported in the
past few years impacting both large and small organizations.
There has often been considerable disagreement about the
overall cost of such breaches. No significant formal studies have
yet addressed this issue, though some proprietary approaches
exist. A few computational models for evaluating partial data
breach costs have been implemented, but these approaches have
not been formally compared and have not been systematically
optimized. There is a need to develop a more complete and
formal model that will minimize redundancy among the factors
considered and will confirm with the available data regarding
the costs of data breaches. Existing approaches also need to be
validated using the data for some of the well documented
breaches. It is noted that the existing models yield widely
different estimates. The reasons for this variation are examined,
and the need for better models is identified.
Keywords—Information security, risk assessment, data breach
cost, market valuation
I. INTRODUCTION
The risk of compromising the confidentiality of records
has increased with the increasing trend of businesses
collecting, storing, and transmitting financial and personal
information in electronic form. A data breach incident refers
to malicious data disclosure to unauthorized parties [1]. Such
breaches occur for different reasons. The hackers’ intent is
often to steal data for financial gain, but they may also intend
to harm individuals or organizations by disclosing their
confidential information or intellectual property. In the past
few years there have been several well-publicized data
breaches. In spite of significant effort by government
agencies, those involved in such cybercrimes are often caught
only after a long period of activity, and some are never caught.
The potential victims of such crime thus have the burden of
assessing their risk and investing in countermeasures.
Estimates of the costs incurred in such data breaches are
published frequently. However, those estimates vary widely.
Without proper disclosure by the impacted organizations, it is
hard to compare the risk of information loss and its potential
costs. Thus, the collection and aggregation of such
information is vital. A careful quantitative analysis of data
from the disclosures can be used to allocate resources for
prevention and recovery after a breach. However, there is no
established approach, although a few organizations such as the
Ponemon Institute and NetDiligence are involved in data
collection. This makes empirical cost estimation challenging.
To assist in prioritizing potential actions and obtain more
information on the nature of data breaches, the assessment of
immediate and long-term costs, and the development of
effective countermeasures, detailed studies are needed.
Data breaches impact a large fraction of all organizations.
For instance, 43% of companies in the United States
experienced a data breach in 2013 [2]. In 2015, there were 781
data breaches that were reported in U.S. companies (including
small businesses), and according to the Identity Theft
Resource Center [3], more than 169 million records were
exposed. The cost of data breaches has increased 23% since
2013 according to studies conducted by IBM and the
Ponemon institute [4].
According to the Ponemon Institute’s studies of U.S. data
breaches, the average cost of a compromised record has not
changed significantly over the last five years. However,
according to the NetDiligence studies, the average cost per
record steadily increased between 2012 and 2015 (Fig.1)
because the median number of records exposed was very
small. The average data breach cost has also been increasing
over the last three years (2013, 2014, and 2015) for most
countries included in the Global Analysis study of the
Ponemon Institute (Fig.2) . For Germany and Australia, the
average cost per record has varied slightly or remained almost
the same. Some data costs of Canada and the Arabian Cluster
(including Saudi Arabia and United Arab Emirates) are not
available for some of the years.
A systematic study of data breach costs can help optimize
data breach response plans, and this can potentially lead to a
reduction in the costs related to breaches of up to 47%
according to a Symantec/Ponemon Institute study [5].
The objective of this paper is to examine, compare, and
evaluate the existing approaches for assessing data breach
costs and identifying the issues that need to be addressed. This
is a major challenge that requires significant effort for the
methods to have good predictive capability, as can be seen
from the following sections. Some organizations have
developed online cost calculators based on their collection of
data and modeling assumptions. Unfortunately, the
computations incorporated in the calculators are proprietary.

Since these tools represent a significant effort by individuals
with access to detailed data, we begin by examining these data
breach cost calculators. The calculators have been
implemented independently and vary considerably in their
approaches. The results obtained by these calculators can be
different by as much as two orders of magnitude. We attempt
to extract the trends and logical assumptions used in the model
and identify the questions that need to be resolved to obtain a
consolidated approach that can be explained and calibrated
using available data.
Utilizing an exhaustive range and combinations of inputs,
we examine how each calculator computes the cost of data
breaches for difference scenarios. We identify the factors that
affect the costs of data breaches used in the various calculators
and then classify those factors into logically related
categories. We then attempt to identify the factors that are
correlated in the same category to remove redundancy among
factors. Further simplification is possible by identifying
factors that have a significant impact in these calculators as
well as ones that have little or no impact. We then model an
approach needed to construct complete systemic models for
data breach costs based on the calculators and actual data
regarding data breach costs. We validate components of the
model using data from some recent well-documented
breaches.
Layton and Waters [6] estimated the tangible costs of data
breaches using two case studies (Telstra and LinkedIn),
focusing on a salary guide and rough estimation of the work
hours of the people who were involved to manage the data
breach. They estimate labor costs, regarding them as the only
tangible cost. Here we consider many types of data breaches
and a more complete set of costs. In terms of intangible costs,
Layton and Waters only consider the loss of reputation. It is
interesting to note that they argue that the stock price was not
negatively impacted after announcement of data breach in the
two cases considered.
The paper is organized as follows. Section 2 presents the
background. Section 3 introduces our approach. The next
section presents our analysis of the calculators examined. In
Section 5, we outline a proposed consolidated factor model for
data breachs. In Section 6, the applicability of the existing
models is examined. Some challenges and limitations are
presented in Section 7. Finally, conclusions are presented and
some future work is identified.
II. BACKGROUND
This section presents background information necessary
to discussing data breaches and their impact.
A. Types of Data Breaches
Data breaches have significant impacts on the economics
and finances of individuals, organizations, and in some cases
may even impact segments of the economies in various
countries. There are several classes of data breaches, such as
misuse of systems by employees or partners, intrusions with
no theft of data, intrusions leading to the theft of personal data
such as credit card numbers or social security numbers, and
intrusions leading to the theft of intellectual property or
confidential correspondence/documents.
B. Causes of Data Breaches
There are several possible causes of data breaches. These
include exploiting weak or stolen login credentials, malware,
presence of vulnerabilities or accessible back doors, and social
engineering.
C. Economic Costs (impact) of Data Breaches
The cybercrimes that occur following data breaches and
the impact of these crimes on the economy in terms of damage
and cost can be enormous. In many cases, the damages to
individual organizations have been estimated in the hundreds
of millions of dollars. Some costs are not easily measurable,
such as impact on segments of the economy or national
security.
D. Databases of Data Breaches
There are several databases that provide information about
security data breaches and help researchers analyze and
contribute their results to reduce the impacts that result from
data breaches. The main databases include Privacy Rights
Clearinghouse (PRC) [7], DATALOSSdb [8], the Veris
Community Database (VCDB) [9], and Web Hacking
Figure 1: Average cost per compromised record over the last five
years according to Ponemon and NetDiligence.
Figure 2: Average cost per compermised record of data breaches in 11
countries over the last three years according to Ponemon.

Incident Database (WHID) [10]. While the information in
these databases was not directly applicable to this phase of the
study, they can be valuable for validation of results once a
computational model, based on the observations here, has
been constructed.
E. Main Cyber Insurers
Several insurance companies cover parts of the costs due
to security breaches. For some of the breaches, a significant
fraction of the costs was covered by insurance. The data
collected by NetDiligence, which was used for the Hub
International Calculator, was based on insurance claims.
III. APPROACH
To study the existing approaches for calculating the cost of
data security, we identified and examined the existing data
breach cost calculators that are available online. While there
exist some reports on the overall observations of the data that
some of the calculators are based on, details of the approaches
taken by the calculators are not available. These calculators
are intended for estimating the costs of data breaches. They
require values of several factors as inputs. Here we examined
the factors impacting the calculations and attempt to classify
the factors into those impacting breach costs and those
impacting the probability of breaches. Then, we developed a
methodology for obtaining the breach costs (in most cases, the
cost is per record) for several values of each factor. In some
cases, we examined several combinations of factors that could
have a mutual impact. Some calculators only generate the cost
while others also generate the probability of a breach of the
type examined.
After collecting the necessary data, we systematically
identified the factors that appeared to be somewhat redundant.
The redundant factors were merged. We also identified the
factors that emerged as significant and removed the
insignificant factors. Some calculators apparently do not use
any built-in data and require users to input all the parameters
needed for computations. In addition, some of the calculators
did not provide any breakdown of the overall costs and thus
were not useful at this time.
We noted that using different calculators can result in very
different estimates. To evaluate the calculators, we examined
two major cases involving massive data breaches in large
companies.
IV. ANALYSIS OF CALCULATORS
Here we examine the existing online data breach cost
calculators and the factors they use. We use a large number of
different input combinations to estimate how the calculators
(in some cases: some calculators) compute both the cost and
probability of a specific data breach.
A. Basic Information on Data Breach Cost Calculators
Various calculators for estimating data breach costs are
available online for educational, illustrative, or other
purposes. The calculators examined include Hub
International/NetDiligence[11], Symantec/Ponemon Institute
[12], MegaPath/Ponemon [13], Identity Theft (IDT911) [14],
CyberTab [15], and IBM/Ponemon [16] (Table I). Note that
three of the calculators were implemented in conjunction with
the Ponemon Institute, although they were released at
TABLE I. DATA BREACH COST CALCULATORS EXAMINED
Calculator Date of
Calculator
Data Source
(powered by) # Factors Cost Computed
Computes
Probability Output
Hub Int'l &
NetDiligence 2012
NetDiligence: 2011 Cyber Liability &
Data Breach Insurance
Claims
7 cost per breach No
Four partial costs: Investigation
Management Sanctions
Lawsuit
Overall results: Total cost of breach
Cost per record
Symantec &
Ponemon 2010
2011 Cost of Data Breach Study: United
States.
13 (9 only
has impact) cost per record Yes
Avg. cost/record
Avg. cost/breach
Likelihood of data breach in next 12 months
MegaPath &
Ponemon 2013
The Ponemon Institute
study (2012) 10 - No
Lower data breach cost estimate
Upper data breach cost estimate
IDT911 2014 Three different
sources 9 cost per breach No Estimate 1st party response amount
CyberTab 2014 2014 The Economist Intelligence Unit Ltd.
report.
Many cost based on
user’s input No
Attack cost
Security spending
Prevention cost Return on prevention
IBM &
Ponemon 2014
2015 Cost of Data
Breach Study: Global Analysis
16
(14 have impact)
cost per record Yes
Avg. cost/record
Avg. cost/breach Chance of data breach in next 12 months
different times. It is likely that they were implemented using
the data collected immediately prior to the implementation of
the calculator. Only two of the calculators compute the
probability of the exploit of the type examined.
1) Hub International and NetDiligence Calculator
Hub International provides risk services, insurance
brokers, and consultants. Since it was formed through the
merger of 11 Canadian insurance brokerages in 1998, it has
been a global insurance broker. Hub International launched its
calculator (eRisk portal) on July 18, 2012 [17] to assist and
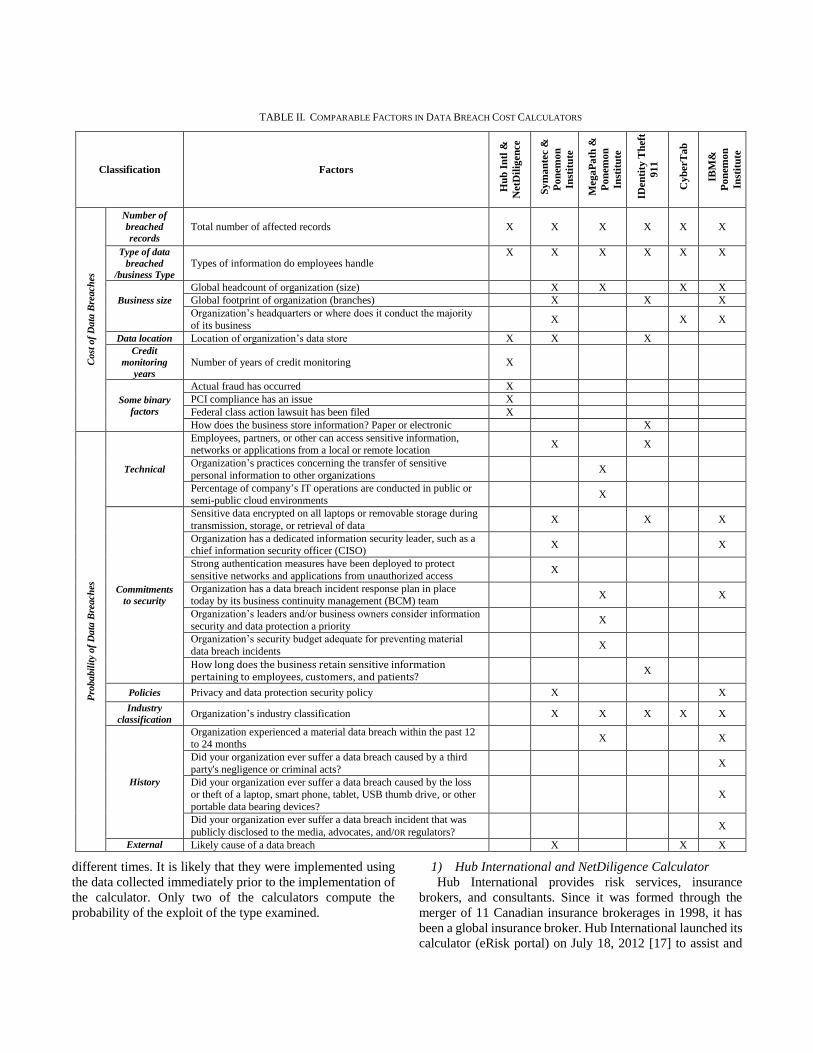
TABLE II. COMPARABLE FACTORS IN DATA BREACH COST CALCULATORS
Classification Factors
Hu
b I
ntl
&
NetD
ilig
en
ce
Sy
ma
nte
c &
Po
nem
on
Inst
itu
te
Mega
Pa
th &
Po
nem
on
Inst
itu
te
IDen
tity
Th
eft
911
Cy
berT
ab
IBM
&
Po
nem
on
Inst
itu
te
Cost
of
Da
ta B
reach
es
Number of
breached
records Total number of affected records X X X X X X
Type of data
breached
/business Type
Types of information do employees handle X X X X
X
X
Business size
Global headcount of organization (size) X X X X
Global footprint of organization (branches) X X X
Organization’s headquarters or where does it conduct the majority
of its business X X X
Data location Location of organization’s data store X X X
Credit
monitoring
years Number of years of credit monitoring X
Some binary
factors
Actual fraud has occurred X
PCI compliance has an issue X
Federal class action lawsuit has been filed X
How does the business store information? Paper or electronic X
Pro
ba
bil
ity
of
Da
ta B
reach
es
Technical
Employees, partners, or other can access sensitive information, networks or applications from a local or remote location
X X
Organization’s practices concerning the transfer of sensitive
personal information to other organizations
X
Percentage of company’s IT operations are conducted in public or semi-public cloud environments
X
Commitments
to security
Sensitive data encrypted on all laptops or removable storage during
transmission, storage, or retrieval of data X X X
Organization has a dedicated information security leader, such as a chief information security officer (CISO)
X X
Strong authentication measures have been deployed to protect
sensitive networks and applications from unauthorized access X
Organization has a data breach incident response plan in place
today by its business continuity management (BCM) team X X
Organization’s leaders and/or business owners consider information
security and data protection a priority X
Organization’s security budget adequate for preventing material
data breach incidents X
How long does the business retain sensitive information pertaining to employees, customers, and patients?
X
Policies Privacy and data protection security policy X X
Industry
classification Organization’s industry classification X X X X X
History
Organization experienced a material data breach within the past 12 to 24 months
X X
Did your organization ever suffer a data breach caused by a third
party's negligence or criminal acts?
X
Did your organization ever suffer a data breach caused by the loss or theft of a laptop, smart phone, tablet, USB thumb drive, or other
portable data bearing devices?
X
Did your organization ever suffer a data breach incident that was
publicly disclosed to the media, advocates, and/OR regulators?
X
External Likely cause of a data breach X X X

protect information businesses against cyber loss. The
calculator is powered by the data collected for a NetDiligence
study that was apparently done in 2011 [18]. The calculator
generates four partial costs as well as the total cost and the cost
per record.
2) Symantec and Ponemon Institute Calculator
This calculator is presented through the cooperation of
Symantec (as sponsor) and the Ponemon Institute (as the
organization behind the data source). The calculator was
launched in 2010 based on archive.org archives, and its most
recent version appears to be based on the data included in
“2011 Cost of Data Breach Cost Study: United States” [19].
This study was based on the actual data breach experiences of
49 U.S. companies in 14 different industry sectors, including
data collected from 400 interviewed individuals and 268
organizations. It takes into account a wide range of direct and
indirect business costs. The Ponemon Institute has been
collecting similar data since 2005 and has published annual
reports based on that data.
3) MegaPath and Ponemon Institute Calculator
MegaPath Corporation is a provider of secure access
solutions. It launched its data breach risk calculator on
November 19, 2013 [20]. The calculator was developed by
Ponemon Institute experts and is apparently based on the 2012
study, “Data Security in Small Healthcare Organizations” [20]
based on the numbers used.
4) IDentity Theft (IDT911) Calculator
IDT911 is a Canadian insurer of major credit unions and
banks. It was established in 2003 [21] and focuses on
providing services related to identity protection, identity theft
recovery, and data risk management. Based on archive.org
archives, it appears to have launched its calculator in 2014.
The calculator is based on three sources of information:
proprietary data collected from IDT911’s experiences
handling data breaches; information available to the public
through many public, private, and non-profit groups and
sources; and information collected from the users of a website
that tracks breach statistics.
5) CyberTab Calculator
CyberTab is a tool intended for information security and
other senior executives for assessing the potential damage to
their organizations from electronic attacks. It was released in
2014 [22]. Its calculator was developed by The Economist
Intelligence Unit and sponsored by the well-known consulting
organization Booz Allen Hamilton.
6) IBM and Ponemon Institute Calculator
The IBM Calculator is sponsored by IBM and based on
data used in the study “2015 Cost of Data Breach Study:
Global Analysis [4]”. This study is the tenth annual survey
conducted by the Ponemon Institute, and it includes data from
250 organizations across 12 countries: Australia, Brazil,
Canada, France, Germany, India, Italy, Japan, UK, USA,
Saudi Arabia, and the UAE. The calculator appears to have
been launched in 2014.
B. Factors used as determinants of Data Breach Costs
After analyzing the factors used to estimate the costs of
data breaches in the data breach calculators, we divided the
main factors into two main groups—those affecting the data
breach costs and those affecting the likelihood of a breach—
based on our logic and judgment. Most calculators calculate
only data breach costs, but a few estimate the likelihood of
breaches as well. Table II shows some of the factors that are
common among calculators. The Cost group includes the
following subgroups/factors: the number of affected records,
the breach type/business type, business size indicators, data
location, credit monitoring years, and a group of four binary
(Yes/No) factors. The second group includes the main factors
affecting the probability of a data breach. They include:
organizational attributes (technical, commitment to security,
policies), industry classification, and history of data breaches.
Table II clearly demonstrates that there is considerable
divergence among the calculators, which may be based on the
different perspectives used by the calculator developers.
C. Analyzing the Data Breach Cost Calculators
Careful and thorough exercising of the available data
breach cost calculators is critical for modeling their
functionality in terms of the factors they consider. We
carefully compiled the outputs generated using a large
number of strategically used input combinations. We
summarize our observations as follows.
1) Hub International and NetDiligence Calculator
The Hub International Calculator uses seven factors and
computes the four partial costs for the two types of data
breaches (records): (1) Personal Health information (PHI)
and Social Security Number (SSN), and (2) credit cards (CC).
The partial costs are influenced by the following binary
factors:
a) Whether the data is centralized store,
b) Whether actual fraud (actual fraud means the data
has been stolen and used already before) has occurred,
c) Whether there has been a Payment Card Industry
(PCI) compliance issue, and
d) Whether a federal class action lawsuit has been
filed.
The overall cost is divided into four partial costs: i) costs
associated with incident investigation, ii) customer
notification and crisis management, iii) regulatory and
industry sanctions, and iv)class action lawsuits. Not all factors
directly impact all the partial costs. Therefore, we have
analyzed each partial cost individually. For the analysis, we
examined all 16 binary cases (since there are 4 different binary

factors). Each case is represented using 4 bits, starting from
0000 to 1111, where each bit represents each binary factor as
Yes/No. We used sample sizes from 100 to 100 million for the
number of records compromised. The sizes of affected records
were incremented by a multiplication factor of 10 (100, 1000,
10000, up to 100,000,000). Then, we collected the partial cost
values generated for each size for each binary case. We
repeated the analysis for each of the two types of data breaches
with one year of credit monitoring, which is generally offered
to affected customers.
We obtained the relationship of each partial cost with the
number of records from each binary case using the trendline
of each chart. An example is shown in Fig. 3. Generally, linear
regression provided the best fit. Next we analyzed for all
linear equations (y= ax + b) for each partial cost for all binary
cases. We made two main observations, as discussed below.
First, as shown in Tables III.a and III.b, we can observe
the impacted factors for each partial cost in Hub International.
For instance, the incident investigation costs are impacted by
the factors of centralized data, actual fraud, and action lawsuit.
The column marked Yes indicates the numbers when the factor
applies. The cost of incident investigation will be high in cases
of non-centralized data, actual fraud, or the filing of a federal
class action lawsuit since the costs of forensic investigation,
security remediation, legal defense, litigation, and damages
are high. In addition, customer notification/crisis management
costs are impacted by only one factor: the number of years of
credit monitoring for each victim. Usually, the average length
of credit monitoring is one year. The third cost, regulatory and
industry sanctions, is affected by one factor, which is the
existence of issues related to PCI compliance. This cost will
be high in cases of PCI compliance issues for large numbers
of affected records. The last cost, the cost of a class action
lawsuit, is impacted by two factors: the occurrence of actual
fraud and the filgni of a federal class action lawsuit. If the two
factors are applied, costs will be high since eDiscovery
litigation, legal defense, and damages are also high. In
addition, we collect both costs of a and b for each impacted
factor in each partial cost when the factor has impacted the
partial cost or not.
Second, Tables IV.a and IV.b demonstrate two important
facts: which factor has significant impact on the partial cost
and what is the initial status of the factor (i.e., if the factor
impacts a or b). However, we examine how a (cost per record)
and b (fixed cost regardless of cost per record) work in the
linear equation y = ax + b, where x is the number of affected
records in the data breach, a is the cost per record, and b is the
static cost for any partial cost, even when the number of
affected records is zero, depending on other factors. We use
the binary cases of each a and b. We use the Logisim program
to minimize the binary combinations to one case if possible,
or as few as possible. Finally, we observe how a and b are
impacted by the factors of the calculator. All the observations
are mentioned under each partial cost. In Tables IV.a and IV.b,
xxxx means the four factors that impact or might impact the
partial costs. The first digit of xxxx represents the centralized
data, the second represents actual fraud, the third represents
Figure 3: Partial costs from Hub International calculator for credit cards for
the binary case: 0000 (all four factors a,b,c,d are false).
TABLE III.A: PARAMETERS a AND b FOR EACH PARTIAL COSTS OF CREDIT
CARDS TYPE IN HUB INTERNATIONAL DEPENDING ON THE BNARY FACTOR
Partial
costs
Impacting
factor
Avg. a Avg. b
if Yes if No if Yes if No
Investigation
Centralized 0.59 1.71 124625 124625
Fraud 1.19 1.10 129000 120250
Lawsuit 1.45 0.84 155250 94000
Crisis
management
Credit
monitoring 3.52 3.52 23742.9 23742.9
Sanctions PCI comp. 1.62 0.002 814282 854326
Lawsuit Fraud 7.75 6.44 -21971.7 -5897.95
Lawsuit 8.19 6 -27869.7 0
TABLE IV.A: IMPACT OF BIANRY FACTORS FOR CREDIT CARDS IN HUB
INTERNATIONAL CALCULATOR IN LINEAR EQUATION y=ax+b
Partial Costs a b
Investigation (1xxx +1xx1)= 1xxx (0xx0 +0xx1)= 0xxx
xxx0 xxx1
Observations Centralized data
increases expected
investigation cost by 190%. While, lawsuit
has some impact.
Lawsuit increases
expected
investigation cost by about 65%. Other
factors are not
significant.
Crisis Management 1 (xxxx) 1 (xxxx)
Observations Constant regardless
of the other factors.
Constant regardless
of the other factors.
Sanctions 0x0x + x00x + xx00
1101 0x1x + xx10
1x11
1x11
1101 0x1x+xx10
0x0x + x00x + xx00 Observations PCI compliance
increases expected
sanctions cost.
Small Change between different
two numbers (cases)
about 4.7%.
Lawsuit (b is negative) xxx0
x0x1 x1x1
xxx0
1011 00x1 + x001
x1x1
Observations Lawsuit increases
expected lawsuit cost
by about 36.5%, while actual fraud
has some impact.
Lawsuit decreases
expected lawsuit
cost, while actual fraud has some
impact.

PCI compliance, and the fourth represents action lawsuit. A
one or zero in xxxx indicates the transmission impact of the
factor, while x means the factor does not impact the partial
cost. For instance, if a has 1xx0 and 1xx1, that means that the
data is 1xxx - combination just for one value different, and
that means it is centralized data has full impact on the cost.
From the previous tables and observations, the partial
costs equations for both types of data breaches are computed
using the observation factor change status in Tables IV.a and
IV.b and the amount of change from Tables III.a and III.b.
The partial costs equations in case of the factor are impacted
in the following way in Table V: incident investigation cost
in equations (1) and (2), customer notification and crisis
management cost in equations (3) and (4), regulatory and
industry sanctions cost in equations (5) and (6), and the class
action lawsuit cost in equations (7) and (8).
After we compute each partial cost in the Hub
International calculator, the total cost of breach and, then, the
cost per record can be computed in equations (9) and (10),
respectively. The total cost will generally be affected by the
type of data breach and the number of affected records. Here
we have not examined the computation of probabilities.
𝑻𝒐𝒕𝒂𝒍 𝑪𝒐𝒔𝒕 𝒐𝒇 𝒂 𝑩𝒓𝒆𝒂𝒄𝒉= 𝐼𝑛𝑐𝑖𝑑𝑒𝑛𝑡 𝑖𝑛𝑣𝑒𝑠𝑡𝑖𝑔𝑎𝑡𝑖𝑜𝑛 𝑐𝑜𝑠𝑡+ 𝐶𝑢𝑠𝑡𝑜𝑚𝑒𝑟 𝑛𝑜𝑡𝑖𝑓𝑖𝑐𝑎𝑡𝑖𝑜𝑛 𝑜𝑟 𝑐𝑟𝑖𝑠𝑖𝑠 𝑚𝑎𝑛𝑎𝑔𝑒𝑚𝑒𝑛𝑡 𝑐𝑜𝑠𝑡+ 𝑅𝑒𝑔𝑢𝑙𝑎𝑡𝑜𝑟𝑦 𝑎𝑛𝑑 𝑖𝑛𝑑𝑢𝑠𝑡𝑟𝑦 𝑠𝑎𝑛𝑐𝑡𝑖𝑜𝑛𝑠 𝑐𝑜𝑠𝑡+ 𝐶𝑙𝑎𝑠𝑠 𝑎𝑐𝑡𝑖𝑜𝑛 𝑙𝑎𝑤𝑠𝑢𝑖𝑡 𝑐𝑜𝑠𝑡 (9)
A widely used measure is cost per record, as defined below.
𝑪𝒐𝒔𝒕 𝒑𝒆𝒓 𝑹𝒆𝒄𝒐𝒓𝒅 = 𝑇𝑜𝑡𝑎𝑙 𝑐𝑜𝑠𝑡𝑠 𝑜𝑓 𝑏𝑟𝑒𝑎𝑐ℎ
𝑇𝑜𝑡𝑎𝑙 𝑛𝑢𝑚𝑏𝑒𝑟 𝑜𝑓 𝑎𝑓𝑓𝑒𝑐𝑡𝑒𝑑 𝑟𝑒𝑐𝑜𝑟𝑑𝑠, (10)
where the number of affected records is entered by a
user/organization.
2) Symantec & Ponemon Institute Calculator
There are 13 factors impacting the cost and probability of
a data breach. Four of these factors do not directly impact cost
or probability in the computation; instead they are used to
determine the currency of the cost and the number of affected
records to be used when the total cost of breach is calculated.
For most of the rest of factors (six out of nine), there is a
correlation between the cost per record and the probability,
such that the maximum cost per record matches the maximum
probability and the minimum cost per record matches the
minimum probability.
Ultimately, this calculation represents two costs and one
probability: the average cost per record (taken by averaging
the cost for each of the 9 factors), the average cost per breach
(obtained by multiplying the average cost per record by the
number of affected records), and the probability of
experiencing a data breach in the next year (obtained the
taking the average of the probabilities for each of the 9
factors).
3) MegaPath & Ponemon Institute Calculator
The information for this calculator is limited since there
are no data about the probabilities or the cost per record for
each of the 10 factors. Therefore, we do not know exactly how
the calculator estimates the overall data breach cost as a range
from a lower cost to an upper cost of data breach. However, it
appears that the calculator uses minimum and maximum costs
per factor and calculates an average to provide the lower and
upper costs based on 1,000 affected lost or stolen records as
mentioned on the result report.
TABLE III.B: PARAMETERS a AND b FOR EACH PARTIAL COSTS OF PHI AND
SSN TYPES IN HUB INTERNATIONAL DEPENDING ON THE BINARY FACTOR
Partial
costs
Impacting
factors
Avg. a Avg. b
if Yes if No if Yes if No
Investigation
Centralized 0.84 2.44 173750 173750
Fraud 1.7 1.58 180000 167500
Lawsuit 2.08 1.2 217500 130000
Crisis
management Credit
monitoring 4.57 4.57 33924.25 33924.25
Sanctions PCI comp. 1.62 0.0018 996005.5 1000000
Lawsuit Fraud 2.5 0.63 -31388.5 -8425.75
Lawsuit 3.13 0 -39814.3 0
TABLE IV.B: IMPACT OF BIANRY FACTORS FOR PHI AND SSN IN HUB
INTERNATIONAL CALCULATOR IN LINEAR EQUATION y=ax+b
Partial Costs a b
Investigation 1xxx
0xxx
xxx0
xxx1
Observations Centralized data
increases expected investigation cost by
about 190.5%. Other
factors are not significant.
Lawsuit increases
expected investigation cost by
about 67%. Other
factors are not significant.
Crisis
management(one year
credit monitoring)
1 (xxxx) 1 (xxxx)
Observations Constant regardless
of the other factors.
Constant regardless
of the other factors.
Sanctions 0x0x + x00x +xx00
1101 0x1x + xx10
1x11
1x11
0xxx + xx0x + xxx0
Observations PCI compliance
increases expected sanctions cost.
Small Change
between different two numbers (cases)
about 0.4%.
Lawsuit (b is negative) xxx0
(x0x1+ x1x1) = xxx1
xxx0
1011 00x1 + x001
x1x1
Observations Lawsuit increases
expected lawsuit cost, while actual fraud has
some impact.
Lawsuit decreases
expected lawsuit cost, while actual fraud has
some impact.

The media report published by MegaPath Corporation in
2013 mentioned that, in addition to calculating breach costs,
the calculator could compute the probability of a data breach
within the next 12 months [20]. To do so, the calculator
generates five sub-steps of data breaches: detection and
escalation, containment and remediation, information loss,
business interruption, and reputational impact. From our
experiments, we could not determine all the previous analyses
related to the calculation of the data breach cost since we did
not have actual data and we did not receive a response from
MegaPath when we contacted it.
4) IDentity Theft (IDT911) Calculator
This calculator is impacted by nine factors. Each factor
includes several options for estimating cost through a one-part
response. The calculator does not include a third-party
estimation. It is visually organized like a lookup table for
different factors or options. The total cost is determined by
computing the cumulative costs of all factors (equation 11).
However, there is no information on probability or the number
of affected records to allow us to calculate the cost per record.
𝑬𝒔𝒕𝒊𝒎𝒂𝒕𝒆 𝟏𝒔𝒕 𝒑𝒂𝒓𝒕𝒚 𝒓𝒆𝒔𝒑𝒐𝒏𝒔𝒆 𝒂𝒎𝒐𝒖𝒏𝒕= 𝑠𝑢𝑚𝑚𝑎𝑡𝑖𝑜𝑛 𝑜𝑓 𝑡ℎ𝑒 𝑡ℎ𝑒 𝑐𝑜𝑠𝑡𝑠 𝑓𝑜𝑟 𝑎𝑙𝑙 𝑡ℎ𝑒 𝑓𝑎𝑐𝑡𝑜𝑟𝑠 (11)
5) CyberTab Calculator
As with the other calculators, CyberTab offers no
information on the number of affected records or the
probability of a data breach. This calculator is based on users’
estimates of incident response, business expenses and losses,
and returns on prevention. Users answer many factors to
compute different costs. One of the costs is attack or breach
cost, which contains the different costs when the data breach
occurs (equation 12). The incident response expenses include
technology costs and outsourced third-party services costs
such as consulting and forensic services. The business
expenses or costs include c-suite and executives cost,
customer services cost, credit monitoring cost, legal services
cost, crisis management expenses, notifications and fines.
Meanwhile, lost business includes reputation loss such as
grant loss, lost sales, customer loss, and customer retention.
The CyberTab calculator can be used in one of two modes:
a planning mode, which gauges the potential cost of an attack
to determine and understand the risks and the choices for
security investment, and reporting mode, which discovers the
specific attack costs that remain for a company and which
assists in benchmarking.
𝑨𝒕𝒕𝒂𝒄𝒌 𝑪𝒐𝒔𝒕= 𝐼𝑛𝑐𝑖𝑑𝑒𝑛𝑡 𝑟𝑒𝑠𝑝𝑜𝑛𝑠𝑒 𝑒𝑥𝑝𝑒𝑛𝑠𝑒𝑠 + 𝑏𝑢𝑠𝑖𝑛𝑒𝑠𝑠 𝑐𝑜𝑠𝑡+ 𝑙𝑜𝑠𝑡 𝑏𝑢𝑠𝑖𝑛𝑒𝑠𝑠 (12)
6) IBM & Ponemon Institute Calculator
This calculator is similar to the Symantec and Ponemon
Institute calculators since their data come from the same
source. However, IBM uses newer data from the 2015
Ponemon Institute study. IBM incorporates 16 impacted
factors, 3 of which have no direct impact on the cost or
probability of a data breach. These are used to determine the
currency of the cost or the number of affected records—both
of which are used to compute the total cost of the breach.
TABLE V: LINEAR RELATIONS FOR THE PARTIAL COSTS IN THE HUB INTERNATIONAL
Partial Costs Partial Costs Equations
Investigation Cost
CC: (0.59 * Centralized factor) X # of affected records + (94000 * Lawsuit factor) (1)
PHI & SSN: (0.84 * Centralized factor) X # of affected records + (130,000 * Lawsuit factor) (2)
Centralized factor= 1, if the data is centralized, 2.9 otherwise.
Lawsuit factor= 1, if the lawsuit is not filed, 1.66 otherwise.
Crisis management Cost CC: 3.52 X # of affected records + 23742.9 (3)
PHI & SSN: 4.57 X # of affected records + 33924.25 (4)
Sanctions Cost
CC: (0.002 * PCI complaince1 factor) X # of affected records + (854326 * PCI complaince2 factor) (5)
PCI compliance1 factor= 1, if not an issue, 810 otherwise.
PCI complaince2 factor= 1, if it is not an issue, 0.95 otherwise.
PHI & SSN: (0.0018 * PCI complaince1 factor) X # of affected records + (996005.5 * PCI complaince2 factor) (6)
PCI compliance1 factor= 1 if not an issue, 900, otherwise.
PCI complaince2 factor= 1, if it is an issue, 1.004 otherwise.
Lawsuit Cost
CC: (6 * Lawsuit1 factor) X # of affected records + fixed lawsuit cost (7)
Lawsuit1 factor= 1, if lawsuit is not filed, 1.37 otherwise.
Fixed lawsuit cost= 0, if lawsuit is not filed, -27869.7 otherwise. PHI & SSN: Lawsuit cost per record X # of affected records + fixed lawsuit cost (8)
Lawsuit cost per record= 0, if lawsuit is not filed, 3.13, otherwise.
Fixed lawsuit cost= 0, if lawsuit is not filed, -39814.3, otherwise.
The calculator calculates the average cost per record, the
average cost per breach, and the likelihood of a data breach in
the next 12 months.
We observed that, for six factors, there is a correlation
between the cost per record and the probability, such that the
maximum cost per record has the maximum probability and
the minimum cost per record has the minimum probability. In
addition, three factors exhibit the opposite behavior, such that
the maximum cost per record matches the minimum
probability and the minimum cost per record matches the
maximum probability.
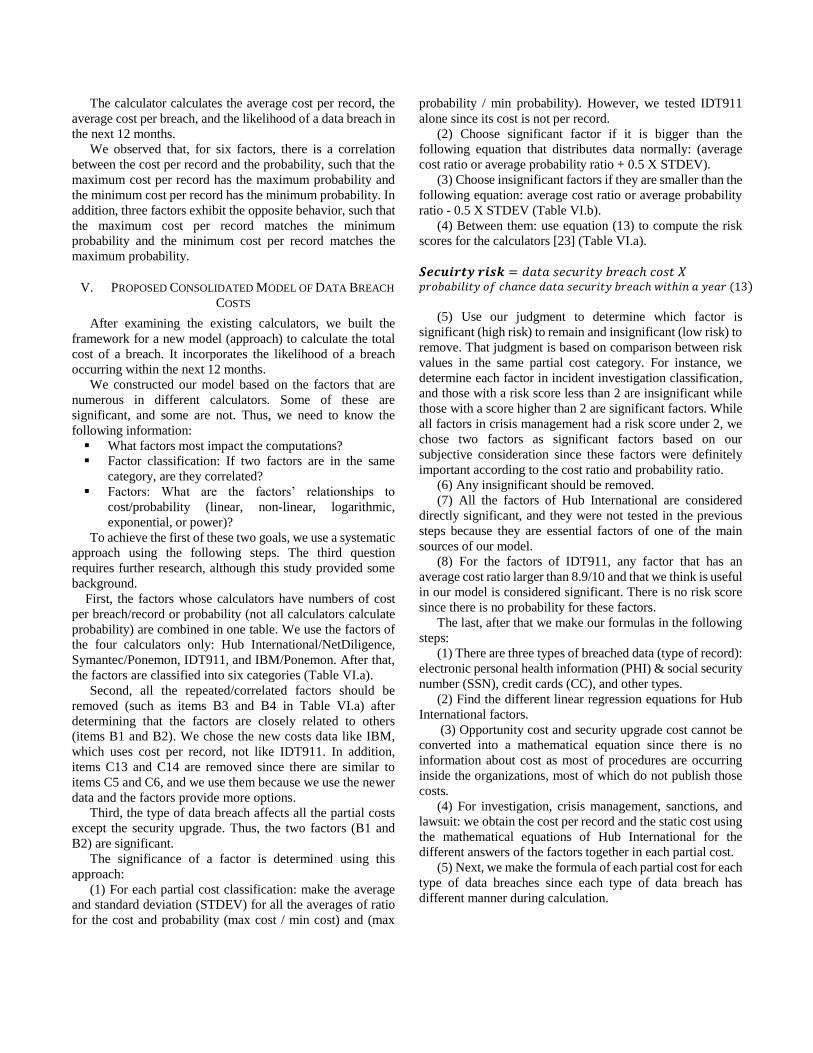
V. PROPOSED CONSOLIDATED MODEL OF DATA BREACH
COSTS
After examining the existing calculators, we built the
framework for a new model (approach) to calculate the total
cost of a breach. It incorporates the likelihood of a breach
occurring within the next 12 months.
We constructed our model based on the factors that are
numerous in different calculators. Some of these are
significant, and some are not. Thus, we need to know the
following information:
What factors most impact the computations?
Factor classification: If two factors are in the same
category, are they correlated?
Factors: What are the factors’ relationships to
cost/probability (linear, non-linear, logarithmic,
exponential, or power)?
To achieve the first of these two goals, we use a systematic
approach using the following steps. The third question
requires further research, although this study provided some
background.
First, the factors whose calculators have numbers of cost
per breach/record or probability (not all calculators calculate
probability) are combined in one table. We use the factors of
the four calculators only: Hub International/NetDiligence,
Symantec/Ponemon, IDT911, and IBM/Ponemon. After that,
the factors are classified into six categories (Table VI.a).
Second, all the repeated/correlated factors should be
removed (such as items B3 and B4 in Table VI.a) after
determining that the factors are closely related to others
(items B1 and B2). We chose the new costs data like IBM,
which uses cost per record, not like IDT911. In addition,
items C13 and C14 are removed since there are similar to
items C5 and C6, and we use them because we use the newer
data and the factors provide more options.
Third, the type of data breach affects all the partial costs
except the security upgrade. Thus, the two factors (B1 and
B2) are significant.
The significance of a factor is determined using this
approach:
(1) For each partial cost classification: make the average
and standard deviation (STDEV) for all the averages of ratio
for the cost and probability (max cost / min cost) and (max
probability / min probability). However, we tested IDT911
alone since its cost is not per record.
(2) Choose significant factor if it is bigger than the
following equation that distributes data normally: (average
cost ratio or average probability ratio + 0.5 X STDEV).
(3) Choose insignificant factors if they are smaller than the
following equation: average cost ratio or average probability
ratio - 0.5 X STDEV (Table VI.b).
(4) Between them: use equation (13) to compute the risk
scores for the calculators [23] (Table VI.a).
𝑺𝒆𝒄𝒖𝒊𝒓𝒕𝒚 𝒓𝒊𝒔𝒌 = 𝑑𝑎𝑡𝑎 𝑠𝑒𝑐𝑢𝑟𝑖𝑡𝑦 𝑏𝑟𝑒𝑎𝑐ℎ 𝑐𝑜𝑠𝑡 𝑋 𝑝𝑟𝑜𝑏𝑎𝑏𝑖𝑙𝑖𝑡𝑦 𝑜𝑓 𝑐ℎ𝑎𝑛𝑐𝑒 𝑑𝑎𝑡𝑎 𝑠𝑒𝑐𝑢𝑟𝑖𝑡𝑦 𝑏𝑟𝑒𝑎𝑐ℎ 𝑤𝑖𝑡ℎ𝑖𝑛 𝑎 𝑦𝑒𝑎𝑟 (13)
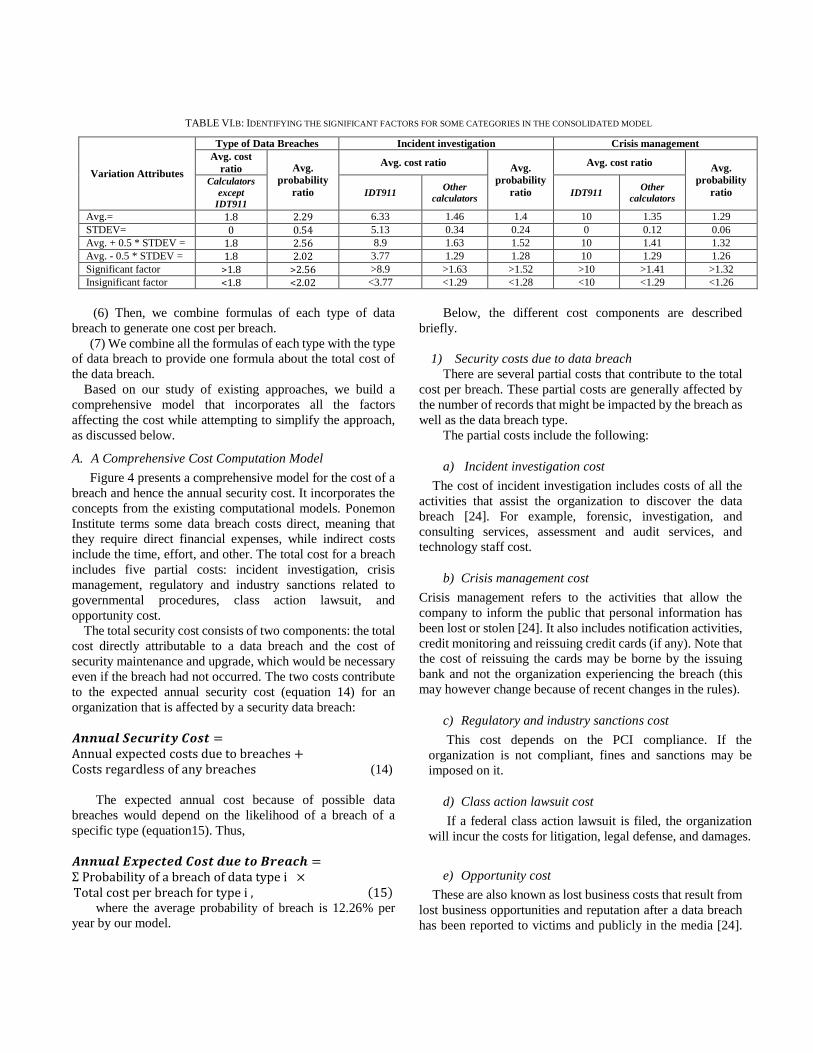
(5) Use our judgment to determine which factor is
significant (high risk) to remain and insignificant (low risk) to
remove. That judgment is based on comparison between risk
values in the same partial cost category. For instance, we
determine each factor in incident investigation classification,
and those with a risk score less than 2 are insignificant while
those with a score higher than 2 are significant factors. While
all factors in crisis management had a risk score under 2, we
chose two factors as significant factors based on our
subjective consideration since these factors were definitely
important according to the cost ratio and probability ratio.
(6) Any insignificant should be removed.
(7) All the factors of Hub International are considered
directly significant, and they were not tested in the previous
steps because they are essential factors of one of the main
sources of our model.
(8) For the factors of IDT911, any factor that has an
average cost ratio larger than 8.9/10 and that we think is useful
in our model is considered significant. There is no risk score
since there is no probability for these factors.
The last, after that we make our formulas in the following
steps:
(1) There are three types of breached data (type of record):
electronic personal health information (PHI) & social security
number (SSN), credit cards (CC), and other types.
(2) Find the different linear regression equations for Hub
International factors.
(3) Opportunity cost and security upgrade cost cannot be
converted into a mathematical equation since there is no
information about cost as most of procedures are occurring
inside the organizations, most of which do not publish those
costs.
(4) For investigation, crisis management, sanctions, and
lawsuit: we obtain the cost per record and the static cost using
the mathematical equations of Hub International for the
different answers of the factors together in each partial cost.
(5) Next, we make the formula of each partial cost for each
type of data breaches since each type of data breach has
different manner during calculation.

TABLE VI.A: FACTORS IMPACTING THE PARTIAL COSTS BEFORE AND AFTER CONSOLIDATION
Classification Item Factors Source Risk
score
Significant
factors
Insignificant
factors
Total number
of affected
records
A Total number of affected records? All - X
Type of data
breaches
B1 What is your organization's industry classification? Symantec
& IBM 3.42 X
B2 What types of information do your employees handle? Symantec
& IBM 4.81 X
B3 On whom do you collect sensitive or personally identifiable information (PII)?
IDT911 Redundant, removed.
B4 What types of information does the business collect on
employees? Hub Int’l Redundant, removed.
Incident
investigation
cost
C1 Data is in a centralized system/location? Hub Int’l - X
C2 Actual fraud is expected already? Hub Int’l - X
C3 Federal class action lawsuit filed? Hub Int’l - X
C4 What do you think is the most likely cause of a data breach? Symantec
& IBM 2.94 X
C5 Do your employees store sensitive data on laptops or on removable storage?
Symantec 1.28 X
C6 Is sensitive data encrypted on all laptops or removable storage? Symantec
& IBM 3.31 X
C7 Did your organization ever suffer a data breach caused by a third party’s negligence or criminal acts?
IBM 1.86 X
C8
Did your organization ever suffer a data breach caused by the
loss or theft of a laptop, smart phone, tablet, USB thumb drive, or other portable data bearing device?
IBM 1.22 X
C9 Did your organization suffer a data breach incident involving the
loss or theft of 5,000 or more records over the past 24 months? IBM 1.84 X
C10 Did your organization ever suffer a data breach incident that was publicly disclosed to the media, advocates, and/or regulators?
IBM 1.76 X
C11 Who has access to sensitive information on employees,
customers, and patients? IDT911 - X
C12 How does the business store information? (paper or electronic) IDT911 - X
C13 How does the business store information? (on-site, off-site, cloud)
IDT911 Redundant, removed.
C14
Is document, email, and device/hard drive encryption used to
protect sensitive electronic information about employees,
customers, and/or patients during transmission, storage, and retrieval of data?
IDT911 Redundant, removed.
C15 How long does the business keep/retain sensitive information
pertaining to employees, customers, and patients? IDT911 - X
C16 What best describes your organization's privacy and data protection program?
Symantec & IBM
2.5 X
Crisis
management
cost
D1 Number of Years for credit monitoring? Hub Int’l - X
D2 What is the global headcount of your organization? Symantec
& IBM 1.93 X
D3 What is the global footprint of your organization? Symantec
& IBM 1.62 X
D4 Does your organization have a dedicated information security leader, such as a chief information security officer (CISO)?
Symantec & IBM
1.69 X
D5 Is your organization's business continuity management team
involved in the data breach incident response process? IBM 1.73 X
D6 Approximately how many employee records do you store and retain that contain social security numbers, account numbers,
medical records information, and/or other personal information?
IDT911 - X
D7 How many states does the business have employees, customers,
and patients in? IDT911 - X
Regulatory and
sanction cost E Is PCI compliance an issue? Hub Int’l - X
Lawsuit cost
F1 Actual fraud is expected already? (This factor impacts again
here) Hub Int’l - X
F2 Federal class action lawsuit filed? (This factor impacts again here)
Hub Int’l - X
(6) Then, we combine formulas of each type of data
breach to generate one cost per breach.
(7) We combine all the formulas of each type with the type
of data breach to provide one formula about the total cost of
the data breach.
Based on our study of existing approaches, we build a
comprehensive model that incorporates all the factors
affecting the cost while attempting to simplify the approach,
as discussed below.
A. A Comprehensive Cost Computation Model
Figure 4 presents a comprehensive model for the cost of a
breach and hence the annual security cost. It incorporates the
concepts from the existing computational models. Ponemon
Institute terms some data breach costs direct, meaning that
they require direct financial expenses, while indirect costs
include the time, effort, and other. The total cost for a breach
includes five partial costs: incident investigation, crisis
management, regulatory and industry sanctions related to
governmental procedures, class action lawsuit, and
opportunity cost.
The total security cost consists of two components: the total
cost directly attributable to a data breach and the cost of
security maintenance and upgrade, which would be necessary
even if the breach had not occurred. The two costs contribute
to the expected annual security cost (equation 14) for an
organization that is affected by a security data breach:
𝑨𝒏𝒏𝒖𝒂𝒍 𝑺𝒆𝒄𝒖𝒓𝒊𝒕𝒚 𝑪𝒐𝒔𝒕 =Annual expected costs due to breaches +Costs regardless of any breaches (14)
The expected annual cost because of possible data
breaches would depend on the likelihood of a breach of a
specific type (equation15). Thus,
𝑨𝒏𝒏𝒖𝒂𝒍 𝑬𝒙𝒑𝒆𝒄𝒕𝒆𝒅 𝑪𝒐𝒔𝒕 𝒅𝒖𝒆 𝒕𝒐 𝑩𝒓𝒆𝒂𝒄𝒉 = Σ Probability of a breach of data type i × Total cost per breach for type i , (15)
where the average probability of breach is 12.26% per
year by our model.
Below, the different cost components are described
briefly.
1) Security costs due to data breach
There are several partial costs that contribute to the total
cost per breach. These partial costs are generally affected by
the number of records that might be impacted by the breach as
well as the data breach type.
The partial costs include the following:
a) Incident investigation cost
The cost of incident investigation includes costs of all the
activities that assist the organization to discover the data
breach [24]. For example, forensic, investigation, and
consulting services, assessment and audit services, and
technology staff cost.
b) Crisis management cost
Crisis management refers to the activities that allow the
company to inform the public that personal information has
been lost or stolen [24]. It also includes notification activities,
credit monitoring and reissuing credit cards (if any). Note that
the cost of reissuing the cards may be borne by the issuing
bank and not the organization experiencing the breach (this
may however change because of recent changes in the rules).
c) Regulatory and industry sanctions cost
This cost depends on the PCI compliance. If the
organization is not compliant, fines and sanctions may be
imposed on it.
d) Class action lawsuit cost
If a federal class action lawsuit is filed, the organization
will incur the costs for litigation, legal defense, and damages.
e) Opportunity cost
These are also known as lost business costs that result from
lost business opportunities and reputation after a data breach
has been reported to victims and publicly in the media [24].
TABLE VI.B: IDENTIFYING THE SIGNIFICANT FACTORS FOR SOME CATEGORIES IN THE CONSOLIDATED MODEL
Variation Attributes
Type of Data Breaches Incident investigation Crisis management Avg. cost
ratio Avg.
probability
ratio
Avg. cost ratio Avg.
probability
ratio
Avg. cost ratio Avg.
probability
ratio Calculators
except
IDT911 IDT911
Other
calculators IDT911
Other
calculators
Avg.= 1.8 2.29 6.33 1.46 1.4 10 1.35 1.29 STDEV= 0 0.54 5.13 0.34 0.24 0 0.12 0.06 Avg. + 0.5 * STDEV = 1.8 2.56 8.9 1.63 1.52 10 1.41 1.32 Avg. - 0.5 * STDEV = 1.8 2.02 3.77 1.29 1.28 10 1.29 1.26 Significant factor >1.8 >2.56 >8.9 >1.63 >1.52 >10 >1.41 >1.32 Insignificant factor <1.8 <2.02 <3.77 <1.29 <1.28 <10 <1.29 <1.26

This can be hard to evaluate because assessing the opportunity
loss resulting specifically from the breach can be difficult.
It has been argued that the impact of a breach would be
reflected in the stock price of the organization. While some
earlier studies suggested that there is in fact a significant
impact on stock price, a more recent study has questioned this
impact. This could be due to the perception that data breaches
are common [25]. The relative impact on the stock price
depends on the relation between the total data breach cost and
the company’s annual revenue. If the breach cost is low, the
breach itself will have little impact on stock prices.
2) Security costs Regardless of Data Breach
All organizations take measures to reduce the possibility
of data breaches. These depend on the size of the organization
and perceived security risks.
These costs include recurring costs of the security
measures and security upgrades that may be needed.
Upgrading means protecting the organization against the
damage or loss of information by bridging existing security
gaps. Such security upgrades reduce the likelihood of a data
breach and hence the cost of cyber insurance at the same time.
Generally, it is hard to find information on the costs of
security upgrades since the upgrades occur internally and
organizations do not publish the details. Therefore, creating a
preliminary economics model to estimate the security upgrade
cost for an organization remains an open problem. Some
information on upgrade costs can be found in articles that are
occasionally published. For instance, LinkedIn spent between
$2–3 million in 2012 to prevent password theft [26].
Figure 4. Overall risk evaluation model (cost and liklihood).

For relatively small organization departments, these costs
may be difficult to quantify, as each staff member spends time,
which may be difficult to measure, participating in activities
such as installing security patches, configuring systems and
applications to achieve better security, and managing system
behavior in response to a security breach.
Equation (16) shows how to compute the elements that
comprise security upgrade costs.
𝑪𝒐𝒔𝒕 𝒓𝒆𝒈𝒂𝒓𝒅𝒍𝒆𝒔𝒔 𝒐𝒇 𝒅𝒂𝒕𝒂 𝒃𝒓𝒆𝒂𝒄𝒉 =
Security Maintance Cost + Security Upgrade Cost (16)
3) Data Breach Probability
The likelihood of data breach for an organization can
depend on factors that may be termed internal (the
vulnerabilities (if any) that could lead to a breach and whether
they are still available and this means that there is insufficient
security), external (attacker motivation and capabilities), or
Bayesian (past breaches may imply weaker security unless
security is significantly upgraded because of a breach). The
probability of data breach is a function of the internal and
external factors (equation 17), thus:
𝑷𝒓𝒐𝒃𝒂𝒃𝒊𝒍𝒊𝒕𝒚 𝒐𝒇 𝒅𝒂𝒕𝒂 𝒃𝒓𝒆𝒂𝒄𝒉= f(preparedness, attackers′ motivation) (17)
The systematic development of a function requires
research, although the Ponemon Institute has a simple model.
It should be noted that some of the factors considered by
the Ponemon Institute to impact the cost can be considered as
factors impacting the probability, such as some of factors
included in the probability of data security breaches rows in
Table II. Careful examination of these facts is needed to
ensure that they are included in the right category.
While Fig. 4 represents the overall structure of the model,
computational approaches for the individual components of
the model need to be developed. This will require both
additional data and development of the analytical approaches.
VI. APPLICABILITY OF EXISTING MODELS
As seen above, there exit two major computational models
with their own data sources: Ponemon, which created
calculators with sponsorships from Symantac (2010),
Megapath (2013), and IBM (2014), and NetDiligence, which
created the Hub International calculator (2012) and
contributed to the Verizon report. There have been no critical
studies of the two approaches. This study presents a
preliminary comparison using detailed data from two recent
widely discussed breaches: 2013 Target breach and 2014
Home Depot breach (Tables VII and VIII). We also examine
the recent claims made by Jay Jacobs of Verizon, who
collaborated with NetDiligence.
The difference between the two models is readily
illustrated using the average cost/record implicit in the two
approaches. Table IX gives the cost per record according to
the 2015 Ponemon study, which comes out to be about $217.
Table X gives the cost per record as computed by our analysis
for Hub International/NetDiligence, which is remarkably
different: $12.57 for credit cards and $8.58 for personal
information. The 2015 Verizon Data Beach Investigations
Report (DBIR) finds the average cost per record to be $0.58
[27] by applying the Ponemon formula (all breach costs
divided by compromised records: $400 million/ 700 million
records= $0,58). The two to three orders of magnitude
difference raises several questions.
Both organizations use significantly large and diverse
data sets. Ponemon collected data from more than 1600
companies in several countries. NetDiligence data from he
2015 Verizon (DBIR) [27] uses data from 191 cyber insurance
payouts.
TABLE VII: TARGET DATA BREACH ACTUAL REPORTED COSTS
Years Gross
Expenses
Insurance
receivable
Net Expenses
(before tax
deductions)
Net Expenses
(after tax
deductions)
2013 $61m $44m $17m $11m
2014 $191m $46m $145 m $94m
2015 N/A N/A $39 $28
Total $252m $90m $201m $133m
Raw cost per card= $6.30 (40 million cards affected)
TABLE VIII: HOME DEPOT DATA BREACH ACTUAL REPORTED COSTS
Years Gross
Expenses
Insurance
receivable
Net
Expenses
(before tax
deductions)
Net Expenses
(after tax
deductions)
Q3, 2014
$43m $15m $28m N/A
Q4,
2014 $20m $15m $5m N/A
Total $63m $30m $33m N/A
Raw cost per card= $1.13 (56 million cards affected)
TABLE IX: AVERAGE COST PER RECORD ACCORDING TO PONEMON
STUDY: 2015 COST OF DATA BREACH IN UNITED STATES
Partial costs Avg. cost
per breach
Avg. cost
per record
Detection & escalation (includes
investigation and crisis management) $610,000 $21.73
Notification (includes notification and
determination of regulatory) $560,000 $19.95
Ex-post response (includes regulatory and
lawsuit) $1,640,000 $58.43
Lost business (includes reputation loss) $3,720,000 $132.53
Total costs $6,530,000 $217
Average number of records= 28070
TABLE X: AVERAGE COST PER RECORD FOR TWO RECORD TYPES IN
HUB INTERNATIONAL CALCULATOR BY OUR ANALYSIS
Partial costs Avg. cost per
record for CC
Avg. cost per record
for PHI&SSN
Incident investigation $1.15 $1.64
Crisis management $3.52 $4.57
Sanctions $0.81 $0.81
Lawsuit $7.09 $1.56
Total costs $12.57 $8.58

We can compare the cost/record with the now well-known
numbers for the Target and the Home Depot breaches, which
come out to $6.30 and $1.13 per record, respectively (Tables
VII, VIII). The sources for these numbers are well
documented. Target Brands Inc. had a major incident of data
breach on December 2013 involving 40 million credit and
debit card records [28]. The total estimation of the data breach
was about $252 million, as shown in Table VII, which uses
Target’s financial statements [29, 30]. These numbers are
closer to the NetDiligence numbers. The results are similar to
the Hub International calculation (Table IX) if we exclude the
expected lawsuit cost ($12.57 – $7.09 = $5.48) since a lawsuit
has not yet occurred. The cost per record in this breach is not
at all close to Ponemon’s cost per record.
The other notable example is that of the Home Depot data
breach in 2014, which involved 56 million customer payment
cards [28]. The available information about the cost of this
breach is given in Table VIII [31, 32]. We found that the cost
per card was $63m/56m = $1.13. This cost is much lower than
what would be estimated using the Ponemon calculators, and
it is in fact closer to the Hub International estimate.
There are two apparent sources of discrepancy.
1. What the cost includes: Ponemon costs include intangible
costs, such as reputation loss and its impact on business
loss. NetDiligence does not include these costs. In
addition, NetDiligence uses insurance claims as a
measure of the costs. It has been argued that the insurance
claims represent only the costs covered by insurance
purchased [33]. Still, the insurance coverage should be of
the same order of magnitude as the actual cost. The
reputation loss cost can be hard to measure. Recent
attempts to measure it using stock price as a metric
appears to suggest that it may be minimal in many cases,
and the effect may be masked by more significant causes
in the stock price movement.
2. The sizes of the breaches: The major contributor to the
cost per record differences is probably the fact that overall
cost is not likely to be proportional to the number of
records involved. The average number of records used in
the 2015 Ponemon study was 28,070 and not in excess of
100,000 records in general, while the NetDiligence data
involves breaches with a much higher number of records,
with the average breach involving 3,166,600 records
[34]. There are two reasons: some data breach costs are
relatively fixed and are independent of the number of
records. Thus, the cost per record would be lower with a
larger number of records. Even when the cost does go up
with the number of records, economics of scale enters the
picture. An organization with a large number of records
breaches should be able to handle them more cost
effectively and should be able to negotiate better rates
from organizations providing recovery services. The
2015 Verizon report points out that for 100 lost records,
the average cost per record was $254 since the expected
breach cost is $25,445, but for the loss of 100 million
records, the cost was only $0.09/record since $9 million
is the expected breach cost [27]. Thus, cost per record is
a misleading metric.
Our analysis of the Hub International calculator, which
uses the data breach cost data from NetDiligence, assumes a
linear trend. On the other hand, the calculators that depend on
the Ponemon data, where the number of breaches do not
exceed 100,000 records, are not linear [35].
We thus propose to develop a model that is non-linear
relative to the number of records.
VII. CHALLENGES AND LIMITATIONS
Often the companies that have encountered data breaches
do not publish details on the real numbers of damage costs,
although some numbers do emerge in reports. The Ponemon
Institute and NetDiligence collect proprietary data and publish
an annual summary. Therefore, our analysis has focused on
the reports they have published as well as news reports. The
data breach cost estimates—and what those estimates
include—vary from one source to another. We have tried to
resolve and possibly explain the apparent differences. We
propose to develop computational components of our model
to ensure that it makes realistic assumptions backed by data
from multiple sources.
The data breach cost calculators represent a major first step
towards systematic estimation of breach costs. However, they
are mainly intended for online estimation for specific cases
only and may be intended to promote the security-related
services offered. In some cases, we need to obtain the
computational results by filling the calculator inputs at various
steps, and the calculator then sends the results back by email.
The methodology used for computations is not disclosed.
Most of the calculators provide the cost per breach only for
specifically chosen values for a factor. The values returned are
often not broken into cost components for example, the Hub
International calculator only generates the cost per breach.
Furthermore, some of the calculators do not use any
underlying data for costs of security breaches, such as
CyberTab, where users need to enter the cost of data breaches
themselves to calculate the cost. Thus, some of the calculators
provide little insight that would allow the construction of an
accurate model for data breach costs.
VIII. CONCLUSION AND FUTURE WORKS
The potential cost of information loss to businesses and
society is increasing yearly. Therefore, there is a need for an
economic model to calculate the costs related to data breach
incidents with strong predictive capabilities.
This paper examines the current state of existing
approaches, which often disagree in terms of methodologies
and results. There is a need to reconcile all the available
approaches and build on them. This would allow us to create
a more complete single approach that could reliably assess the
various data breach cost components.
We plan to build an open quantitative model of data breach
costs and probability that can be explained and calibrated

using existing data as well as newer data as it becomes
available. The concept of economy of scale will be
incorporated in the model in addition to identification of the
fixed and variable costs. The model will be validated using
actual data. Such a model will allow more accurate estimation
of the economic risks, allowing both software vendors and
users to optimally invest in security.
The computation of probability, which is provided by
some calculators, needs to be explored in detail. Preliminary
examination suggests that current approaches yield a
significant correlation between costs and probabilities, which
is hard to justify.
ACKNOWLEDGMENT
This work was partly supported by a scholarship from
King Abdul Aziz University in Saudi Arabia. The authors
would like to thank the system administrator, Wayne Trzyna,
in the Computer Science Department at Colorado State
University for providing information about the variability in
security upgrade costs.
REFERENCES
[1] Sherstobitoff, Ryan. "Anatomy of a data breach." Information Security Journal: A Global Perspective 17.5-6 (2008): 247-252.
[2] Ponemon Institute. “Is Your Company Ready for a Big Data Breach?”. The Second Annual Study on Data Breach Preparedness. 2014. [Online]. Available: http://www.experian.com/assets/data-breach/brochures/2014-ponemon-2nd-annual-preparedness.pdf.
[3] ITRC Breach Report 2015. [Online]. Available: http://www.idtheftcenter.org/images/breach/ITRCBreachReport2015.pdf.
[4] Ponemon Institute. “2015 Cost of Data Breach Study: Global Analysis”. Sponsored by IBM. 2015. [Online]. Available: http://www-01.ibm.com/common/ssi/cgi-bin/ssialias?infotype=SA&subtype=WH&htmlfid=SEW03053WWEN.
[5] Ponemon Institute. “2013 Cost of Data Breach Study: United States”. Sponsored by Symantec. 2013. [Online]. Available: https://www4.symantec.com/mktginfo/whitepaper/053013_GL_NA_WP_Ponemon-2013-Cost-of-a-Data-Breach-Report_daiNA_cta72382.pdf
[6] Layton, Robert, and Paul A. Watters. "A methodology for estimating the tangible cost of data breaches." Journal of Information Security and Applications 19.6 (2014): 321-330.
[7] A Chronology of Data Breaches, Privacy Rights Clearinghouse. [Online]. Available: http://www.privacyrights.org/data-breach.
[8] Open Security Foundation’s formerly Attrition.org. [Online]. Available: http://datalossdb.org.
[9] VERIS. VERIS Community Database (VCDB). [Online]. Available: http://veriscommunity.net/vcdb.html.
[10] The Web Hacking Incident Database (WHID ). [Online]. Available: http://projects.webappsec.org/w/page/13246927/FrontPage.
[11] Hub International’s data breach cost calculator. [Online]. Available: http://www.hubinternational.com/data-breach-cost-calculator/.
[12] Symantec and Ponemon Institute Data Breach Calculator. [Online]. Available: https://databreachcalculator.com/GetStarted.aspx.
[13] MegaPath Data Breach Risk Calculator. [Online]. Available: http://www.megapath.com/security/ponemon-breach-calculator/.
[14] IDT911’s Data Breach Response Expense Calculator. [Online]. Available: http://idt911.com/expensecalc/start.aspx.
[15] CyberTab - Cyber crime & cyber attack calculator. [Online]. Available: https://cybertab.boozallen.com.
[16] IBM Data Breach Risk Calculator. [Online]. Available: http://www.ibmcostofdatabreach.com.
[17] “Hub International Launches Portal to Help Protect Business Against Cyber Losses” NetDiligence. [Online]. Available: http://www.netdiligence.com/PartnerPR071812.php.
[18] NetDiligence. “NetDiligence: Cyber Liability & Data Breach Insurance Claims 2011”. 2011. [Online]. Available: http://netdiligence.com/files/CyberLiability-0711sh.pdf.
[19] Ponemon Institute. “2011 Cost of Data Breach Study: United States”. Sponsored by Symantec. 2012. Available online on: http://www.ponemon.org/local/upload/file/2011_US_CODB_FINAL_5.pdf.
[20] MegaPath Launches Data Breach Risk Calculator. [Online]. Available: https://www.megapath.com/about/press-releases/megapath-launches-data-breach-risk-calculator/.
[21] IDT911’s History. [Online]. Available: http://idt911.com/company/history.
[22] “CyberTab: Free Tool Estimates Damages from Attacks” Tripwire. 2014. [Online]. Available: http://www.tripwire.com/state-of-security/latest-security-news/cybertab-free-tool-estimates-damages-attacks/.
[23] Watters, Paul A. Cyber Security: Concepts and Cases. CreateSpace Independent Publishing Platform, 2012.
[24] Ponemon Institute. “2015 Cost of Data Breach Study: United States”. Sponsored by IBM. 2015. [Online]. Available: http://www-01.ibm.com/common/ssi/cgi-bin/ssialias?infotype=SA&subtype=WH&htmlfid=SEW03055USEN.
[25] “3 reasons why cyberattacks don’t hurt stock prices”. Market Watch. 2015. [Online]. Available: http://www.marketwatch.com/story/3-reasons-why-cyberattacks-dont-hurt-stock-prices-2015-04-03.
[26] “LinkedIn: Breach Cost Up to $1M, Says $2-3 Million in Security Upgrades Coming”. Security Week. 2012. [Online]. Available: http://www.securityweek.com/linkedin-breach-cost-1m-says-2-3-million-security-upgrades-coming.
[27] Team, Verizon RISK. "2015 Data Breach Investigations Report." 2015. [Online]. Available: http://www.verizonenterprise.com/DBIR/2015/.
[28] N.E. Weiss and R.S. Miller, "The Target and Other Financial Data Breaches : Frequently Asked Questions," Congressional Rese ch Service, 2015. [Online]. Available: https://fas.org/sgp/crs/misc/R43496.pdf.
[29] Target Reports Fourth Quarter and Full-Year 2014 Earnings. [Online]. Available: http://investors.target.com/phoenix.zhtml?c=65828&p=irol-newsArticle&ID=2019880.
[30] Target Reports Fourth Quarter and Full-Year 2015 Earnings. [Online]. Available: http://investors.target.com/phoenix.zhtml?c=65828&p=irol-newsArticle&ID=2142619.
[31] “Data breaches may cost less than the security to prevent them”. TechRepublic. 2015. [Online]. Available: http://www.techrepublic.com/article/data-breaches-may-cost-less-than-the-security-to-prevent-them/.
[32] “How Much Did The Target, Home Depot Breaches Really Cost”. PYMNTS. 2015. [Online]. Available: http://www.pymnts.com/news/2015/target-home-depot-reveal-full-breach-costs/.
[33] “Why Ponemon Institute’s Cost of Data Breach Methodology Is Sound and Endures”. Ponemon Institue. 2015. [Online]. Avaliable: https://www.ponemon.org/news-2/65.
[34] NetDiligence. “2015 Cyber Claims Study”. 2015. [Online]. Available: http://netdiligence.com/downloads/NetDiligence_2015_Cyber_Claims_Study_093015.pdf.
[35] Jacobs, Jay. "Analyzing ponemon cost of data breach." Data Driven Security 11 (2014). [Online]. Available: http://datadrivensecurity.info/blog/posts/2014/Dec/ponemon/.