A computerized solution for epigraphic surveys of Egyptian ...
12
A computerized solution for epigraphic surveys of Egyptian temples E ´ lise Meyer a, * , Claude Parisel b , Pierre Grussenmeyer a , Jean Revez b , Temy Tidafi b a Photogrammetry and Geomatics Group MAP-PAGE UMR 694, National Institute of Applied Sciences of Strasbourg (INSA), 24 Boulevard de la Victoire, 67084 Strasbourg, France b Computer Aided Design Research Group GRCAO, University of Montreal, School of Architecture, C.P. 6128 succursale Centre-ville, Montreal (QC), H3C 3J7, Canada Received 26 July 2005; received in revised form 21 February 2006; accepted 27 February 2006 Abstract Defined as ‘‘an auxiliary science to History that studies the inscriptions on enduring substances’’, epigraphy calls for very varied methods and disciplines. These all imply a preliminary operation: the survey and copying of the decoration engraved or painted on walls, columns, etc. This stage is essential in understanding and reconstituting ancient monuments, because cartouche friezes and ritual scenes give information on the date of a given temple or on the nature of the activities that took place in it. Nowadays, epigraphic surveys are still for the most part done in a traditional handmade fashion, while computer-aided epigraphic surveying is only used for simple tasks, such as drawing the contour of hiero- glyphic signs on scanned photographs. The epigraphy of monuments includes scenes and texts. In both cases, the hieroglyphic signs engraved are made up of complex segments and curves, which must be accurately surveyed and recorded. Each hieroglyphic sign has not only a unique geo- metrical shape, but also a morphology proper to a given alphabet and a precise sense. What has been mostly done up to now deals essentially with the graphic form of signs and relegates their interpretation to an ulterior analysis. On the contrary, the method proposed here gathers data on the meaning and the geometrical shape of each sign. This will finally lead to statistical studies on the hieroglyphs’ form, to automatic translations of the texts, and to the search for missing elements, based on geometrical as well as textual criteria. Our approach is not only adapted to the treatment of plane surfaces, but for the development of conical surfaces as well, so as to be able to survey the inscriptions of columns. The purpose of this paper is to present the computer tools that we have developed to draw and to record the shape and the meaning of the hiero- glyphic inscriptions of walls and columns of temples, using the Egyptian temple of Amun-Ra in Karnak as our case study. Ó 2006 Elsevier Ltd. All rights reserved. Keywords: Photogrammetry; Archaeology; Cultural heritage; Surveying; Acquisition; Modelling 1. Introduction Carrying out epigraphic surveys is a very important task in archaeology, particularly in Egyptology because all the monu- ments contain numerous texts and scenes engraved on their architectural elements. It is a matter of urgency to do such surveys, because the inscriptions are deteriorating at great speed and there is a real risk of losing some important scenes completely. The main problem at the present time is that the traditional methods carried out to survey the inscriptions are very time- consuming. For example the most common of these methods consists in making facsimiles of the wall to be surveyed, with photographs as background or simply with transparent sheets placed against the surface of the wall (Fig. 1). This method involves numerous checks during the drawing process and is therefore rather tedious, because it requires the collab- oration between different drawers. An other inconvenience of the methods currently used is the fact that the produced results are only visual representations, and not exploitable models. The description is also in the * Corresponding author. Tel./fax: þ33 3 88 14 47 33. E-mail addresses: [email protected] (E ´ . Meyer), parisel@ intermonde.net (C. Parisel), [email protected] (P. Grussenmeyer), [email protected] (J. Revez), temy.tidafi@umontreal. ca (T. Tidafi). 0305-4403/$ - see front matter Ó 2006 Elsevier Ltd. All rights reserved. doi:10.1016/j.jas.2006.02.016 Journal of Archaeological Science 33 (2006) 1605e1616 http://www.elsevier.com/locate/jas
Transcript of A computerized solution for epigraphic surveys of Egyptian ...

Journal of Archaeological Science 33 (2006) 1605e1616http://www.elsevier.com/locate/jas
A computerized solution for epigraphic surveys of Egyptian temples
Elise Meyer a,*, Claude Parisel b, Pierre Grussenmeyer a, Jean Revez b, Temy Tidafi b
a Photogrammetry and Geomatics Group MAP-PAGE UMR 694, National Institute of Applied Sciences of Strasbourg (INSA),
24 Boulevard de la Victoire, 67084 Strasbourg, Franceb Computer Aided Design Research Group GRCAO, University of Montreal, School of Architecture, C.P. 6128 succursale Centre-ville,
Montreal (QC), H3C 3J7, Canada
Received 26 July 2005; received in revised form 21 February 2006; accepted 27 February 2006
Abstract
Defined as ‘‘an auxiliary science to History that studies the inscriptions on enduring substances’’, epigraphy calls for very varied methods anddisciplines. These all imply a preliminary operation: the survey and copying of the decoration engraved or painted on walls, columns, etc. Thisstage is essential in understanding and reconstituting ancient monuments, because cartouche friezes and ritual scenes give information on thedate of a given temple or on the nature of the activities that took place in it. Nowadays, epigraphic surveys are still for the most part done ina traditional handmade fashion, while computer-aided epigraphic surveying is only used for simple tasks, such as drawing the contour of hiero-glyphic signs on scanned photographs. The epigraphy of monuments includes scenes and texts. In both cases, the hieroglyphic signs engraved aremade up of complex segments and curves, which must be accurately surveyed and recorded. Each hieroglyphic sign has not only a unique geo-metrical shape, but also a morphology proper to a given alphabet and a precise sense. What has been mostly done up to now deals essentiallywith the graphic form of signs and relegates their interpretation to an ulterior analysis. On the contrary, the method proposed here gathers data onthe meaning and the geometrical shape of each sign. This will finally lead to statistical studies on the hieroglyphs’ form, to automatic translationsof the texts, and to the search for missing elements, based on geometrical as well as textual criteria. Our approach is not only adapted to thetreatment of plane surfaces, but for the development of conical surfaces as well, so as to be able to survey the inscriptions of columns. Thepurpose of this paper is to present the computer tools that we have developed to draw and to record the shape and the meaning of the hiero-glyphic inscriptions of walls and columns of temples, using the Egyptian temple of Amun-Ra in Karnak as our case study.� 2006 Elsevier Ltd. All rights reserved.
Keywords: Photogrammetry; Archaeology; Cultural heritage; Surveying; Acquisition; Modelling
1. Introduction
Carrying out epigraphic surveys is a very important task inarchaeology, particularly in Egyptology because all the monu-ments contain numerous texts and scenes engraved on theirarchitectural elements. It is a matter of urgency to do suchsurveys, because the inscriptions are deteriorating at great
* Corresponding author. Tel./fax: þ33 3 88 14 47 33.
E-mail addresses: [email protected] (E. Meyer), parisel@
intermonde.net (C. Parisel), [email protected] (P.
Grussenmeyer), [email protected] (J. Revez), temy.tidafi@umontreal.
ca (T. Tidafi).
0305-4403/$ - see front matter � 2006 Elsevier Ltd. All rights reserved.
doi:10.1016/j.jas.2006.02.016
speed and there is a real risk of losing some important scenescompletely.
The main problem at the present time is that the traditionalmethods carried out to survey the inscriptions are very time-consuming. For example the most common of these methodsconsists in making facsimiles of the wall to be surveyed,with photographs as background or simply with transparentsheets placed against the surface of the wall (Fig. 1). Thismethod involves numerous checks during the drawing processand is therefore rather tedious, because it requires the collab-oration between different drawers.
An other inconvenience of the methods currently used is thefact that the produced results are only visual representations,and not exploitable models. The description is also in the

1606 E. Meyer et al. / Journal of Archaeological Science 33 (2006) 1605e1616
form of lines and curves: it is not an object that could be usedlater for various studies.
Unfortunately the computerized methods proposed to ar-chaeologists for surveying epigraphy have rarely been adaptedto their needs, at least up to now: they don’t reproduce the re-lief of the signs accurately, they often don’t take into accountthe poor state of conservation of the inscriptions. Thus, mostarchaeologists and epigraphists rely on the traditional methodsof surveying, because they think that the complicated inter-preting process required for an accurate epigraphic survey ofa monument can’t be made by means of a computer.
1.1. Proposition
Our idea is then to propose an original computerizedmethod, which tries to get rid of the problems inherent to tra-ditional epigraphic survey approaches, while considering theneeds of the epigraphists and offering them the possibility ofcontrolling various operations during the computerized surveyprocess. Particular emphasis has been put on the fact that thedecoration of a monument is indissociable from its architec-tural support. The drawings must be recorded with all the in-formation necessary to understand their real meaning (i.e. thearchitectural and archaeological context). The recording for-mat has been normalized so as to be exploitable for researchpurposes (statistics, restoration of structures, etc.).
Our method is based on photogrammetric procedures, be-cause of their numerous advantages for archaeological tasks:
- Photogrammetry is by definition a non-destructive process(there is no contact with the object to survey) that will not
Fig. 1. Epigraphic survey on transparent sheet (from [Parisel C., Strategie infor-
matique: programme releve, GRCAO’s internal research paper 17 p (2002)]).
generate further damage on the architectural features to besurveyed.
- Fieldwork becomes easier and faster, since photographiccampaigns and surveys are kept to a minimum, generallyonly to check a few control points.
- The exploitation of data is made entirely with computertools in the office, and not on site: one can therefore doaway with the drawbacks of working in the field (heat,tourism,.) and obtain more durable and exploitable nu-merical files of the surveyed objects, iconography,epigraphy..
- An analysis can be done at any time later on (for example,if the object is destroyed and should be rebuilt).
- The survey of inscriptions engraved on curved (columns)and not accessible (ceiling) surfaces is made possible.
- Experience has shown that for features to be recorded con-ventionally during an excavation, several people will inter-vene. This will result in heterogeneous drawings. If,however, photogrammetry is applied during the whole ex-cavation, the documentation will be standardized.
As proof of this, one only has to look at some applicationfields of photogrammetry in archaeology: prospecting andlandscape archaeology, excavation (examples given by Platzerand Waldhausl [7,11]), recording of standing remains, caves,mining and cave paintings and recording of finds (examplesin Ref. [1]).
Our goal is to take advantage of the various possibilitiesgiven by the use of photogrammetry while making the pro-gram as user-friendly as possible, since it is intended for ar-chaeologists who are not necessarily well-acquainted withcomputers. Our epigraphic survey method is exploitable ina graphical software, in this case AutoCAD�, because it iswidespread in archaeology. We have up to now aimed at devel-oping two main types of tools (written in the programminglanguage AutoLISP): one for drawing and recording the en-gravings on a wall, and the other for the treatment of conicalsurfaces in order to copy inscriptions on columns as well, us-ing the same tools as those developed for the survey of planesurfaces.
This project has been initiated by the Computer AidedDesign Research Group GRCAO, University of Montreal, incollaboration with the Photogrammetry and Geomatics GroupMAP-PAGE, INSA Strasbourg, at least for the photogrammet-ric part. It has been carried out within a larger project called‘‘Computer modelling as a means of reflection in archaeology:a new approach to epigraphic and architectural survey appliedto the Karnak Temple’’. The GRCAO has been able to rely onthe technical support of both the French CNRS permanentmission in Karnak and the Karnak Hypostyle Hall Project(KHHP) of the University of Memphis.
1.2. Structuring
The first part of this paper deals with the approach chosenfor drawing and recording of hieroglyphic signs on plane sur-faces. Three aspects have to be considered: the Bezier curves

1607E. Meyer et al. / Journal of Archaeological Science 33 (2006) 1605e1616
and their drawbacks, the strategy used to draw the engravingsand the bonding of stones, and the recording and insertionmode of the signs after a first layout.
The second part concerns the adaptation of the method car-ried out for the epigraphic survey of plane surfaces to conicaland cylindrical elements. This requires two steps: the three-dimensional reconstitution of a column and the developmentof its surface for the two-dimensional surveying of the epigraphy.
2. Drawing and recording of the inscriptionson plane surfaces
The hieroglyphic signs are drawn by means of Beziercurves. Control polygons are grouped and recorded, so as tobe able to draw the signs automatically several times over,at different places and scales, and for other exploitations.
2.1. Bezier curves and drawbacks
We have tested several types of bi-dimensional curves torepresent the epigraphy of a plane element in a way that staysas faithful as possible to the original drawing. One of the mostimportant criteria has been the simplicity of construction andof modification of the curves by the user:
- real-time display of the curves’ movements with thecursor;
- possibility of inserting at will an inflexion point betweentwo summits;
- possibility of providing a tangency or a dependency be-tween two consecutive summits;
- possibility of inserting new curves and segments ifnecessary;
- possibility of changing a segment into a curve or inversely;- possibility of introducing a constraint between two curves
or of relaxing it;- possibility of recording results in the most compact way as
possible.
Considering these requirements, we have chosen the Beziercurves because they fulfilled most of these objectives.
The procedure is as follows: a Bezier curve is constructedon the basis of two points (A and B) and of an additional point(C) that allows to trace the tangent to the curve going throughthe points (A) and (B). The construction method is based ona recurrence principle: from the segments binding the points(A, C, B)dcalled control polygon of the curvedwe chooseany ratio between 0 and 1, which is applied on the length of[AC] to obtain the point (X1). The same ratio is applied on[CB] to obtain the point (X2). Next, we repeat the same oper-ation on [X1X2] to obtain the first point of the curve (pm1),and so on to obtain all the points of the curve (Fig. 2).
Then it is enough to change the ratio n/nb, for n varyingfrom 1 to nb (where nb is the number of iterations chosen),to obtain a curve of nbþ 1 points.
This type of curve suits our needs well (as we will see in thenext section), but it has an important disadvantage if we wish
to draw it in perspective and to visualize it in front view (forthe publication of the drawings, for instance).
In fact, the curve obtained by the straightening of a signdrawn from a shot taken sideways differs from a curve ofthe same sign drawn with the support of a picture taken per-pendicularly to a wall [8]. This is illustrated in Fig. 3.
Thus, to do a rigorous survey of hieroglyphic signs, wehave had to develop procedures for the orthorectification ofthe original photographs. That is to say that we create new pic-tures from the initial shots, as if they were all taken perpendic-ularly to the architectural elements to be surveyed (Fig. 4).
Therefore we can draw the hieroglyphic inscriptions bymeans of Bezier curves on the orthorectified photographs, soas to obtain an accurate drawing ‘‘in front view’’ of the signs(whereas it would have been wrong if we had traced the signson the original photographs and if we had put them back ina front view afterwards).
2.2. Drawing of the inscriptions and of thebonding of stones
The hieroglyphic signs are then drawn as groups of curves.The construction of a curve is interactive:
- first we click on the two extreme points (A and B) of thecontrol polygon,
- then the third point (C) is inserted with the cursor’s shift-ing (real-time control of the curve’s movements), in orderfor the curve to match the sign on the photo as closely aspossible.
Two options for the drawing of the next curve are possible:
- to create a curve or a segment (i.e. the points A, B and Care aligned),
Fig. 2. Drawing of a Bezier curve (from [Parisel C., Strategie informatique:
programme releve, GRCAO’s internal research paper 17 p (2002)]).

1608 E. Meyer et al. / Journal of Archaeological Science 33 (2006) 1605e1616
Fig. 3. Illustration of a problem of the Bezier curves.
Fig. 4. Orthorectification of a photograph of the pyramidion of an obelisk (from [Parisel C., Rapport de travail sur la construction des orthophotos de surface a
partir de photos en format BMP, GRCAO’s internal research paper 17 p (2004)]).

1609E. Meyer et al. / Journal of Archaeological Science 33 (2006) 1605e1616
- to create it tangentially to the first curve or to the next thatwill be drawn.
When the drawing of a sign is completed, the differentcurves are automatically joined so as to make a single curve,and the same is made with the control polygons. The globalcurve can still be modified: the cursor is moved from pointto point on the global control polygon, and the joints are bro-ken when a curve to adjust is chosen.
Then more choices are available once again:
- to create a tangency or to relax it (with the previous or thenext curve),
- to transform the curve into a segment or inversely,- to divide the curve into two curves individually modifiable
(for a more accurate drawing of the part of the sign).
This process ends with the re-joining of the curves and ofthe control polygons, so as to obtain two individual entitiesnecessary for the future recording of the drawing.
The survey of the bonding of stones consists simply in thedrawing of several segments, to represent the stones and thestate of conservation of the wall. The segments of each stoneare then joined for the recording too.
This is illustrated in Fig. 5 and [9].
2.3. Recording and insertion mode of the signsafter a first layout
When a complete hieroglyphic sign has been drawn, it isrecorded for future exploitations in a database of the signs sur-veyed on the wall (at the end, everything must have been re-corded). This recording process comprises several phases.
Noteworthy is the fact that only the control polygon of thecurve will be recorded. This is particularly handy since it does
not take much computer memory (few points are to be re-corded), and because the curve can easily be redrawn fromits control polygon (then it is not necessary to record the curveitself with its numerous points).
Consequently, the first step is the identification of the con-trol polygons of a sign (the same sign can be made up of sev-eral curves with their control polygons, as the bird in Fig. 5).We distinguish between the control polygons that determinea group of Bezier curvesdwe call them CTLdfrom the sim-ple polygonsdwe call them POLdthat consist of a set of seg-ments (these are very seldom). The control polygons can beclosed and fit into each other. The biggest that form the exte-rior contour is numbered 1, and in order of successive inclu-sion, the numbers 2, 3 and so on.
Finally, we specify if the considered part of the sign isin sunken relief (indicated by �), in raised relief (indicatedby þ), or at the same level (indicated by 0) (Fig. 6).
These characteristics will be later used for a symbolic‘‘pseudo-3D’’ representation of the hieroglyphic sign, whichconsists in the layout of ‘‘shadow lines’’ to simulate the sun-shade on an engraving (the direction of the sun can be chosenby the user). This function makes it possible to visualize in-stantly whether a relief is sunken or raised (Fig. 7).
The second step of the recording process is the grouping ofthe control polygons that make up the sign. We make a singlegeometrical entity with the different parts of the sign and thengive some information about the meaning of the hieroglyph:name of the phonogram or of the ideogram, grammaticalmeaning, phonetic value, etc. The group has then a properidentity with a designation, a meaning, a geometrical descrip-tion and all the characteristics that the user think can be usefulto add.
Two choices are given to the user afterwards: he/she can re-cord the hieroglyphic sign as a ‘‘standard sign’’ or record itsimply with its original position on the picture (to implement
Fig. 5. Global view of a partial epigraphic survey of the 7th Pylon of the Karnak Temple (on the left). Detail of the drawing of hieroglyphic signs and of stone
deterioration (on the right).

1610 E. Meyer et al. / Journal of Archaeological Science 33 (2006) 1605e1616
the database of the signs surveyed on the wall). In both cases,the information about the group representing the sign is re-corded in a text file. We have chosen this type of recordingso as to be able to transfer it later on various software (trans-portable format).
The ‘‘standard signs’’ are intended to save time during theepigraphic survey process. In fact, a hieroglyph can be foundseveral times on the same wall, with just a few morphologicaldifferences (Fig. 8). So the insertion of modifiable ‘‘standardsigns’’ will make it redundant to draw the same sign severaltimes over: when a hieroglyph comes up that has alreadybeen recorded as a ‘‘standard sign’’, the user only needs to in-sert the corresponding ‘‘standard sign’’ at the right place andmake the necessary adjustments.
The insertion is done through the creation of a rectanglethat frames the sign (by identifying the extreme pointsdtop,bottom, left, rightdof the biggest control polygon). This rect-angle is recorded in the text file at the same time than the othercharacteristics of the sign. In general, the ‘‘standard sign’’ isrecorded for a reading from left to right, but the hieroglyphictexts can be written in several directions. So, at the moment ofthe insertion, the user can choose the direction (left to right orright to left) in which he wants to insert the sign. The result ofthe recording process is then a text file that can be of two typesdepending on whether the drawing is recorded as a ‘‘standardsign’’ or as a simple occurrence with its position on the pho-tograph (Figs. 9 and 10).
Afterwards, the appropriate ‘‘standard sign’’ is searched inthe ‘‘standard signs’’ database, in order to insert the sign at
Fig. 6. Identification of the control polygons of a sign (at the bottom: dialog
box created in AutoCAD� for the characterisation of the polygons).
a particular place and at a desired scale on the photograph.By simply clicking on the extreme points of the sign todraw to define the edges of the insertion rectangle, it appearsalong with the ‘‘standard sign’’ at its appropriate spot insidethis rectangle. Small modifications can then be added. The in-sertion of a ‘‘standard sign’’ is illustrated in Fig. 11.
Since the face of a wall can be badly ruined, the damagedparts of a sign can also be recorded. This in turn can be usefulfor the search of missing elements (blocks) of a wall for exam-ple (or for its reconstruction). The process is explained inFig. 12.
So the missing block will be sought after, through architec-tural (type of stone), geometrical (shape of block) and textualcriteria. If parts of a hieroglyph are still visible on the edge ofa stone, we can compare them with the different records thatwe have at our disposal, and this can eventually lead us tomatching several fragments belonging to a same block(Fig. 13).
In conclusion, this part of the paper has presented ourmethod of computerized epigraphic survey used for drawingand recording the hieroglyphic signs of planar architecturalelements. This method is user-friendly for archaeologists andepigraphists alike, thanks to the very detailed menus createdin the AutoCAD� software. Numerous choices are constantlyavailable during the surveying process, and every operation
Fig. 7. Sunken relief hieroglyphic sign with shadow lines simulating the
sunshade.

1611E. Meyer et al. / Journal of Archaeological Science 33 (2006) 1605e1616
Fig. 8. Two variants of the same sign that differ in morphology (from [Parisel C., Strategie informatique: programme releve, GRCAO’s internal research paper 17 p
(2002)]).
can be undone if necessary. Each surveyed sign is recorded ina database, in the form of a text file, which can later be usedfor other research purposes: studies on the shapes of hiero-glyphs, automatic translation of the texts, search for missingelements, etc.
This method has been carried out for the survey of planesurfaces. We will now turn to a process for the development
of conical surfaces, in order to survey the inscriptions of col-umns as well.
3. Epigraphic survey of conical surfaces
The epigraphic survey of temple columns is essential too,because columns often bear cartouche friezes and ritual
Fig. 9. Record file of a ‘‘standard sign’’ made of two control polygons and the corresponding drawing.

1612 E. Meyer et al. / Journal of Archaeological Science 33 (2006) 1605e1616
Fig. 10. Record file of a ‘‘standard sign’’ made of two control polygons and the corresponding drawing.
episodes that give information on the date of the temple or onthe nature of the activities that took place in its hypostylehall. This part of the article will set out our method carriedout to survey a scene engraved on non-plane surfaces. Theapproach is once again based on photogrammetric techniquesand with the ultimate goal of using the tools presentedabove for the drawing and the recording of inscriptions onplane surfaces. To begin with, the column must be modelledfrom its photographs (the shots are the only initial data needed,as was the case with plain walls). After that, the obtained‘‘virtual cone’’ must be developed in the form of a plane sur-face so as to be able to survey it with the same tools as before.
Fig. 11. Example of the insertion of a ‘‘standard sign’’.
3.1. Three-dimensional reconstitution of a column
The only data required to create a 3D model of a column’spart are eight photographs covering its entire surface andsome control information (i.e. points) to be located on thesephotographs. The photos must have a relatively high overlapbetween themselves. A minimum of six homologous pointsbetween two consecutive overlapping photographs is required,and three more common points between three overlapping pho-tographs. This task has likewise been done in the graphical soft-ware AutoCAD�. The photographs with the points can be seenin Fig. 14. For a better visualization, we have drawn polylinesthat connect the different homologous points between the shots.
From these initial data, the planar coordinates of the pointson the photographs are integrated into photogrammetric for-mulae to obtain their 3D coordinates [3,4]. We have also de-veloped computer tools for an automatic computing of the3D coordinates of the column’s points.
Thanks to these 3D points, we are able to draw a vectorialmodel of the column, which will represent the theoretical col-umn’s surface.
Since the theoretical surface of Egyptian columns is a cone(with a very acute angle at the summit), we have drawn a 3Dpolyline to obtain the vectorial view of the column, based onthe points describing the cone geometrically. The parametersof the cone have been calculated by a mathematical algorithm,which carries out the surface matching of a cone [10].
These parameters are:
- the director vector of the cone’s axis,- one axis point,- the summit angle,- the distance between the axis point chosen and a generatrix
of the cone.

1613E. Meyer et al. / Journal of Archaeological Science 33 (2006) 1605e1616
A solution is found through an iterative modification of thecone’s parameters. The calculation ends when the average dis-tance between the cone’s points and the calculated surfacestops decreasing.
t is then worth determining the cone that fits the columnbest, indeed the column might have suffered a slight subsi-dence or inclination in time and its axis may not be necessarilyvertical.
The drawing in Fig. 15 represents the calculated 3D points andthe 3D polyline describing the best cone based on these points.
For better 3D visualization, we have also drawn on thislayout one of the polylines joining the homologous pointsbetween two snapshots.
Fig. 12. Layout and recording according to the stone degradations.
This model of the column is a ‘‘virtual model’’ (indepen-dent of any coordinates system), which can be scaled downto proportion by measuring a length on the real column, or re-placed in the 3D space while measuring just three points in thefield.
Thanks to this vectorial representation of the column, weare now able to develop the obtained 3D polyline on a plane,so as to survey the hieroglyphic signs on a two-dimensionalsurface.
3.2. Development of the column surface for thetwo-dimensional surveying of the epigraphy
As mentioned above, the cone that best approximates thepoints, can be at an angle. So, the first step of the developmentis to make the previously obtained cone vertical, for the sim-plicity and the accuracy of the development’s calculation.
A change of reference has been carried out so as to movethe summit of the original cone to the zero point (of theAutoCAD� drawing) and to put the axis in a perfect verticalposition.
The transition from one coordinates system to the other ispossible through three non-coplanar homologous points ineach system. We choose these three points at random amongthe seven points of the previous 3D polyline.
Knowing that the summit must be translated into the point(0, 0, 0), the coordinates of the two other required points areeasy to deduct. Afterwards, all the cone’s points can be trans-ferred from one system to the other and be placed exactly‘‘on’’ the theoretical surface of the new vertical cone by meansof an orthogonal projection.
We have thus been able to develop the vertical cone: thepoints of the 3D polyline have been put on a same plane.The points of the vertical cone (previously projected on thetheoretical surface) have also been located on the develop-ment. This is illustrated in Fig. 16.
To be able to draw the hieroglyphic inscriptions, it is nownecessary to orthorectify the original photographs of the col-umn and to insert these pictures in the development (the prin-ciple and the aim are the same as those carried out to obtainFig. 4).
For the pictures to be developed, these must be transformedinto orthophotographs [2]. The epigraphy will thus be sur-veyed on this ‘‘front view’’ of the column.
The orthorectification process is divided up into twophases:
- the first consists in drawing, on the original shot, the edgesof the column’s shaft (generatrix), and in obtaining theirequivalent on the development, so as to obtain the limitsof the orthophotograph to be produced,
- the second carries out the transfer of the colour values ofthe pixels from the original photograph to thedevelopment.
We have thus created a new picture by assembling thesepixels inside the previously drawn limits.

1614 E. Meyer et al. / Journal of Archaeological Science 33 (2006) 1605e1616
Fig. 13. Restitution according to the position of the intersections between the bonding of stones and the Bezier curves (from Ref. [6]).
The result is shown in Fig. 17 for one of the shots.After orthorectifying all the shots, a single photomontage is
made, on which the hieroglyphic inscriptions are drawn.The montage of the orthophotographs is not as easy at it
may at first appear, because the exact positions and the scaleof the different pictures must be strictly respected. Moreover,there are differences in light exposure from one original shotto the other (see Fig. 14), which requires image processing,in order to obtain a homogeneous picture of the entire surfaceof the column’s shaft (see below).
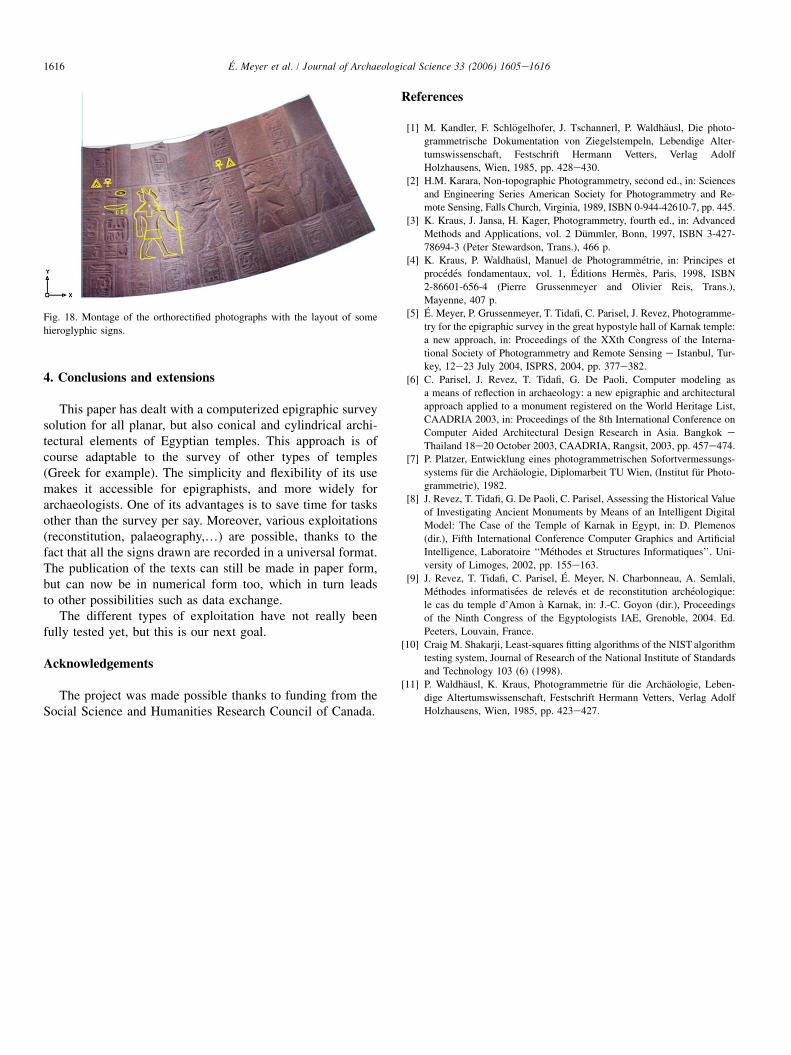
With these requirements in mind, once the photomontage isdone, we obtain a ‘‘photograph’’ of the developed surface ofthe column’s shaft. This picture represents a plane surface,on which the hieroglyphs can be drawn (Fig. 18).
We have made the drawings of the hieroglyphic signs onthis picture by using the same tools and procedures as thosedescribed in Section 1 of this paper: the signs are traced, re-corded, inserted, etc. exactly in the same way as the inscrip-tions of a wall. As the column’s surface is now ‘‘planar’’,the ‘‘standard signs’’ can be inserted directly on the picture.The adaptation of the pre-recorded signs may require a small
rotation to fit them exactly with the inscriptions of the column,but this task is quite simple to do.
In this respect, the quality of light exposure during photo-graphic campaigns determines to a large extent the successof a computerized epigraphic survey. Sunbeams should hitthe walls or columns sideways, in order to emphasize shadyareas. Ideally, it is best for pictures to be taken in mid-morningand in mid-afternoon, when the sun lights up the wall fromtwo distinct angles. Depending on the hour of the day, eitherthe vertical lines or the horizontal lines of the epigraphic signsstand out. The one and the same inscription can thus be readunder different light (see Section 2.3 and Fig. 7), which en-ables epigraphers to choose from a range of various picturesof a wall in order to obtain what they deem to be the most ac-curate reading of any given text.
If a segment of a wall were to remain in the shade for a longperiod of time (say, during wintertime, when the sunrayswould not be able to reach some hidden architectural features),it would be of course necessary to go on the field during theseason when the above-mentioned segment is eventually lit.One can overcome such nuisance by using at all times a set
Fig. 14. Photos of a column in the British Museum (red granite column with palm capital, 19th Dynasty, about 1250 BC, from Heracleopolis), with the homologous
points chosen and the polylines joining these points (from Ref. [5]).

1615E. Meyer et al. / Journal of Archaeological Science 33 (2006) 1605e1616
of mirrors, and placing them in strategic places, in such a waythat they would reflect the light on the wall from different an-gles. Taking shots at night, with the help of strong projectors,or obviously to take them with a good flash, are other possiblesolutions.
However, if choosing the right time or season to take pic-tures is a key ingredient for a reliable survey, using these pho-tographs as the basis for the creation of a digital 3D model canbe done at any time, which leaves the user free from the tem-poral constraints mentioned above. Moreover, the technology
Fig. 15. Theoretical cone drawn from the calculated 3D points.
of image processing software is advancing at a very fastpace, a fact that makes it increasingly easier with time to im-prove the quality of digital shots. Nothing is really definitive atthe moment of the photographic campaign (at a lighting level)and image enhancements are always possible, what adds to thesimplicity of use of our method. On the other hand, the geo-metric arrangement of the shots has a great importance onthe field and cannot be changed later. It is then significant towatch over to take a minimum of three photographs of eachplane archaeological element (for the conical elements, theprocedure is explained in Section 3.1): one shot taken fromthe left, one in front of the wall and one from the right, witha relatively high overlap between themselves.Fig. 16. Development of the cone.
Fig. 17. Orthorectification process of one photo of the column (inserted afterwards in the developed cone).
1616 E. Meyer et al. / Journal of Archaeological Science 33 (2006) 1605e1616
4. Conclusions and extensions
This paper has dealt with a computerized epigraphic surveysolution for all planar, but also conical and cylindrical archi-tectural elements of Egyptian temples. This approach is ofcourse adaptable to the survey of other types of temples(Greek for example). The simplicity and flexibility of its usemakes it accessible for epigraphists, and more widely forarchaeologists. One of its advantages is to save time for tasksother than the survey per say. Moreover, various exploitations(reconstitution, palaeography,.) are possible, thanks to thefact that all the signs drawn are recorded in a universal format.The publication of the texts can still be made in paper form,but can now be in numerical form too, which in turn leadsto other possibilities such as data exchange.
The different types of exploitation have not really beenfully tested yet, but this is our next goal.
Acknowledgements
The project was made possible thanks to funding from theSocial Science and Humanities Research Council of Canada.
Fig. 18. Montage of the orthorectified photographs with the layout of some
hieroglyphic signs.
References
[1] M. Kandler, F. Schlogelhofer, J. Tschannerl, P. Waldhausl, Die photo-
grammetrische Dokumentation von Ziegelstempeln, Lebendige Alter-
tumswissenschaft, Festschrift Hermann Vetters, Verlag Adolf
Holzhausens, Wien, 1985, pp. 428e430.
[2] H.M. Karara, Non-topographic Photogrammetry, second ed., in: Sciences
and Engineering Series American Society for Photogrammetry and Re-
mote Sensing, Falls Church, Virginia, 1989, ISBN 0-944-42610-7, pp. 445.
[3] K. Kraus, J. Jansa, H. Kager, Photogrammetry, fourth ed., in: Advanced
Methods and Applications, vol. 2 Dummler, Bonn, 1997, ISBN 3-427-
78694-3 (Peter Stewardson, Trans.), 466 p.
[4] K. Kraus, P. Waldhausl, Manuel de Photogrammetrie, in: Principes et
procedes fondamentaux, vol. 1, Editions Hermes, Paris, 1998, ISBN
2-86601-656-4 (Pierre Grussenmeyer and Olivier Reis, Trans.),
Mayenne, 407 p.
[5] E. Meyer, P. Grussenmeyer, T. Tidafi, C. Parisel, J. Revez, Photogramme-
try for the epigraphic survey in the great hypostyle hall of Karnak temple:
a new approach, in: Proceedings of the XXth Congress of the Interna-
tional Society of Photogrammetry and Remote Sensing e Istanbul, Tur-
key, 12e23 July 2004, ISPRS, 2004, pp. 377e382.
[6] C. Parisel, J. Revez, T. Tidafi, G. De Paoli, Computer modeling as
a means of reflection in archaeology: a new epigraphic and architectural
approach applied to a monument registered on the World Heritage List,
CAADRIA 2003, in: Proceedings of the 8th International Conference on
Computer Aided Architectural Design Research in Asia. Bangkok e
Thailand 18e20 October 2003, CAADRIA, Rangsit, 2003, pp. 457e474.
[7] P. Platzer, Entwicklung eines photogrammetrischen Sofortvermessungs-
systems fur die Archaologie, Diplomarbeit TU Wien, (Institut fur Photo-
grammetrie), 1982.
[8] J. Revez, T. Tidafi, G. De Paoli, C. Parisel, Assessing the Historical Value
of Investigating Ancient Monuments by Means of an Intelligent Digital
Model: The Case of the Temple of Karnak in Egypt, in: D. Plemenos
(dir.), Fifth International Conference Computer Graphics and Artificial
Intelligence, Laboratoire ‘‘Methodes et Structures Informatiques’’. Uni-
versity of Limoges, 2002, pp. 155e163.
[9] J. Revez, T. Tidafi, C. Parisel, E. Meyer, N. Charbonneau, A. Semlali,
Methodes informatisees de releves et de reconstitution archeologique:
le cas du temple d’Amon a Karnak, in: J.-C. Goyon (dir.), Proceedings
of the Ninth Congress of the Egyptologists IAE, Grenoble, 2004. Ed.
Peeters, Louvain, France.
[10] Craig M. Shakarji, Least-squares fitting algorithms of the NIST algorithm
testing system, Journal of Research of the National Institute of Standards
and Technology 103 (6) (1998).
[11] P. Waldhausl, K. Kraus, Photogrammetrie fur die Archaologie, Leben-
dige Altertumswissenschaft, Festschrift Hermann Vetters, Verlag Adolf
Holzhausens, Wien, 1985, pp. 423e427.