
A Computationally Efficient Simulation-Based...
15
This article was downloaded by: [18.58.5.39] On: 10 August 2015, At: 09:09 Publisher: Institute for Operations Research and the Management Sciences (INFORMS) INFORMS is located in Maryland, USA Transportation Science Publication details, including instructions for authors and subscription information: http://pubsonline.informs.org A Computationally Efficient Simulation-Based Optimization Algorithm for Large-Scale Urban Transportation Problems Carolina Osorio, Linsen Chong To cite this article: Carolina Osorio, Linsen Chong (2015) A Computationally Efficient Simulation-Based Optimization Algorithm for Large-Scale Urban Transportation Problems. Transportation Science 49(3):623-636. http://dx.doi.org/10.1287/trsc.2014.0550 Full terms and conditions of use: http://pubsonline.informs.org/page/terms-and-conditions This article may be used only for the purposes of research, teaching, and/or private study. Commercial use or systematic downloading (by robots or other automatic processes) is prohibited without explicit Publisher approval, unless otherwise noted. For more information, contact [email protected]. The Publisher does not warrant or guarantee the article’s accuracy, completeness, merchantability, fitness for a particular purpose, or non-infringement. Descriptions of, or references to, products or publications, or inclusion of an advertisement in this article, neither constitutes nor implies a guarantee, endorsement, or support of claims made of that product, publication, or service. Copyright © 2015, INFORMS Please scroll down for article—it is on subsequent pages INFORMS is the largest professional society in the world for professionals in the fields of operations research, management science, and analytics. For more information on INFORMS, its publications, membership, or meetings visit http://www.informs.org
Transcript of A Computationally Efficient Simulation-Based...

This article was downloaded by: [18.58.5.39] On: 10 August 2015, At: 09:09Publisher: Institute for Operations Research and the Management Sciences (INFORMS)INFORMS is located in Maryland, USA
Transportation Science
Publication details, including instructions for authors and subscription information:http://pubsonline.informs.org
A Computationally Efficient Simulation-BasedOptimization Algorithm for Large-Scale UrbanTransportation ProblemsCarolina Osorio, Linsen Chong
To cite this article:Carolina Osorio, Linsen Chong (2015) A Computationally Efficient Simulation-Based Optimization Algorithm for Large-ScaleUrban Transportation Problems. Transportation Science 49(3):623-636. http://dx.doi.org/10.1287/trsc.2014.0550
Full terms and conditions of use: http://pubsonline.informs.org/page/terms-and-conditions
This article may be used only for the purposes of research, teaching, and/or private study. Commercial useor systematic downloading (by robots or other automatic processes) is prohibited without explicit Publisherapproval, unless otherwise noted. For more information, contact [email protected].
The Publisher does not warrant or guarantee the article’s accuracy, completeness, merchantability, fitnessfor a particular purpose, or non-infringement. Descriptions of, or references to, products or publications, orinclusion of an advertisement in this article, neither constitutes nor implies a guarantee, endorsement, orsupport of claims made of that product, publication, or service.
Copyright © 2015, INFORMS
Please scroll down for article—it is on subsequent pages
INFORMS is the largest professional society in the world for professionals in the fields of operations research, managementscience, and analytics.For more information on INFORMS, its publications, membership, or meetings visit http://www.informs.org

Vol. 49, No. 3, August 2015, pp. 623–636ISSN 0041-1655 (print) � ISSN 1526-5447 (online) http://dx.doi.org/10.1287/trsc.2014.0550
© 2015 INFORMS
A Computationally Efficient Simulation-BasedOptimization Algorithm for Large-Scale Urban
Transportation Problems
Carolina Osorio, Linsen ChongCivil and Environmental Engineering Department, Massachusetts Institute of Technology,
Cambridge, Massachusetts 02139 {[email protected], [email protected]}
This paper proposes a computationally efficient simulation-based optimization (SO) algorithm suitable toaddress large-scale generally constrained urban transportation problems. The algorithm is based on a novel
metamodel formulation. We embed the metamodel within a derivative-free trust region algorithm and evaluate theperformance of this SO approach considering tight computational budgets. We address a network-wide trafficsignal control problem using a calibrated microscopic simulation model of evening peak period traffic of the fullcity of Lausanne, Switzerland, which consists of more than 600 links and 200 intersections. We control 99 signalphases of 17 intersections distributed throughout the entire network. This SO problem is a high-dimensionalnonlinear constrained problem. It is considered large-scale and complex in the fields of derivative-free optimization,traffic signal optimization, and simulation-based optimization. We compare the performance of the proposedmetamodel method to that of a traditional metamodel method and that of a widely used commercial signal controlsoftware. The proposed method systematically and efficiently identifies signal plans with improved averagecity-wide travel times.
Keywords : simulation-based optimization; metamodel; large-scale urban transportation problemsHistory : Received: November 2012; revisions received: September 2013, January 2014; accepted: April 2014.
Published online in Articles in Advance February 13, 2015.
1. IntroductionThe massive amount and variety of mobility data thatcan now be collected through, for instance, ubiqui-tous mobile devices, is enhancing our fundamentalunderstanding of individual mobility. For instance, itimproves our understanding of the intricate behaviorof travelers—e.g., how they make activity and therebytravel decisions and how these decisions are motivatedby an underlying objective to enhance their well-being.
State-of-the-art microscopic traffic simulation modelsembed such disaggregate models of traveler behavior(e.g., departure time choice, multimodal route choice,and access and response to en route traffic information)and account for behavior heterogeneity. They representindividual vehicles and can therefore be coupled withvehicle-specific simulators (e.g., propulsion simula-tors) to yield detailed estimates of the performanceof vehicles (e.g., energy consumption or emissionsestimates) in networks with complex topologies andcomplex traffic dynamics. Additionally, microscopicsimulators provide a detailed representation of theunderlying supply (e.g., variable message signs andpublic transport priorities).
Microscopic traffic simulators describe in detail theinteractions between (i) vehicle performance, (ii) trav-eler behavior, and (iii) the underlying transportation
infrastructure, and they yield an elaborate descriptionof traffic dynamics in urban networks. They are there-fore suitable tools to address transportation problemsthat should account for a detailed representation ofthese three components.
Microscopic simulators are popular tools used inpractice to evaluate the performance of a set of pre-determined transportation strategies. Cities such asToronto, New York, Boston, Stockholm, and Hong Konghave used these tools to inform their planning andoperations decisions (Traffic Technology International2012a, b; Papayannoulis et al. 2011; Toledo et al. 2003;Hasan 1999).
For a given strategy, these simulators can provideaccurate and detailed performance estimates. Theiruse is mostly limited to what-if analysis (also calledscenario-based analysis) or sensitivity analysis. That is,they are used to evaluate the performance of a set ofpredetermined transportation alternatives (e.g., trafficmanagement or network design alternatives), such asin Bullock et al. (2004); Ben-Akiva et al. (2003); Hasan,Jha, and Ben-Akiva (2002); Stallard and Owen (1998);Gartner and Hou (1992) and Rathi and Lieberman(1989). See further references in Ben-Akiva et al. (2003).
The numerous models of disaggregate traveler behav-ior, vehicle-performance, and supply components lead
623
Dow
nloa
ded
from
info
rms.
org
by [
18.5
8.5.
39]
on 1
0 A
ugus
t 201
5, a
t 09:
09 .
For
pers
onal
use
onl
y, a
ll ri
ghts
res
erve
d.

Osorio and Chong: Large-Scale Simulation-Based Transportation Optimization624 Transportation Science 49(3), pp. 623–636, © 2015 INFORMS
to detailed performance estimates yet also to modelsthat are expensive to develop and calibrate and com-putationally expensive to evaluate. Thus, an accurateestimation of performance is computationally costly toobtain. Additionally, these simulators derive stochasticnonlinear, and typically nonconvex, performance mea-sures with no closed-form available. For these reasons,the use of these simulators to address optimizationproblems is a challenge.
Currently, the use of these simulation tools is mostlylimited to what-if analysis. With the ubiquity of accessto real-time traffic information, and the increasingnumber of prevailing and interacting traffic controlstrategies, traffic dynamics of congested networks arebecoming more intricate. Thus, determining a priori aset of alternatives with good local and network-wideperformance is no longer feasible. Thus, there is a needto embed these detailed simulators within optimizationframeworks to systematically identify alternativeswith improved local and network-wide performance.Additionally, given the high cost of developing large-scale simulation tools, transportation projects wouldbenefit from computationally efficient methods thatallow the use of simulators to go beyond a what-ifanalysis.
This paper proposes a simulation-based optimization(SO) method that allows large-scale urban transporta-tion problems to be addressed with detailed micro-scopic traffic simulators. We focus on problems wherethe objective function is derived from the simulatorand, thus, no closed-form analytical expression is avail-able. The problems have general (e.g., nonconvex)constraints. Closed-form analytical and differentiableexpressions are available for all constraints (i.e., nosimulation-based constraints).
These urban transportation problems can be formu-lated as
minx∈ì
f 4x1 z3p5≡ E6F 4x1 z3p571 (1)
where the purpose is to minimize the expected valueof a given stochastic performance measure F , x denotesthe deterministic continuous decision vector, z denotesother endogenous variables, and p denotes the deter-ministic exogenous parameters. For instance, in thispaper we use the proposed SO approach to solve atraffic signal control problem, where F denotes triptravel time; x represents the green times of the signalphases; z accounts, for instance, for signalized linkcapacities and route choice decisions; and p accounts,for instance, for the network topology, the total trafficdemand, and fixed lane attributes (e.g., length, grade,and maximum speed). The feasible space ì consists ofa set of general, typically nonconvex, deterministic,analytical, and differentiable constraints.
This paper proposes a technique that can efficientlyaddress generally constrained large-scale simulation-based urban transportation problems. The performance
of the technique is evaluated by considering a network-wide traffic signal control problem. This problem isconsidered large-scale and complex for derivative-freealgorithms, signal control algorithms, and simulation-based optimization algorithms.
Additionally, the paper focuses on SO techniqueswith good short-term performance, i.e., computationallyefficient methods that can identify alternatives withimproved performance within a tight computationalbudget. The computational budget can be definedas a limited number of simulation runs or a limitedsimulation run time. Such techniques respond to theneeds of transportation practitioners by allowing themto address problems in a practical manner.
We present a review of past work in this fieldin §2. In §3 of this paper, we present the methodology.We then present the traffic signal control problem,which is used to evaluate the scalability and short-termperformance of this approach (§4). Empirical resultsare detailed in §5, followed by conclusions (§6).
2. Literature ReviewFew SO methods that embed microscopic simulatorshave been developed (Li et al. (2010); Stevanovic et al.(2008); Branke, Goldate, and Prothmann (2007); Yun andPark (2006); Hale (2005); Joshi, Rathi, and Tew (1995)).The most common approach is the use of heuristic algo-rithms and, in particular, the use of genetic algorithms(see Yun and Park (2006) for a review). These methodsembed microscopic simulators within general-purposeoptimization algorithms. They treat the simulator asa black box, using no a priori structural informationabout the underlying transportation problem (e.g., net-work structure). They therefore require a large numberof simulated observations to identify transportationstrategies (i.e., trial points) with improved performance.
This paper proposes an SO technique with goodshort-term performance suitable for microscopic trafficsimulators to be used to address complex high-dimensional problems. To derive computationallyefficient methods that embed inefficient simulators,information from other more efficient (i.e., tractable)models that provide analytical structural informationto the algorithm should be used throughout the opti-mization process.
In general, methods to address SO problems can beclassified as direct-search methods, stochastic gradientmethods, and metamodel methods. For reviews ofSO methods, see Hachicha et al. (2010); Barton andMeckesheimer (2006); Fu, Glover, and April (2005). Thispaper focuses on metamodel methods. For a descriptionof why metamodel techniques are a suitable approachto address complex simulation-based transportationproblems, see Osorio and Bierlaire (2013).
Dow
nloa
ded
from
info
rms.
org
by [
18.5
8.5.
39]
on 1
0 A
ugus
t 201
5, a
t 09:
09 .
For
pers
onal
use
onl
y, a
ll ri
ghts
res
erve
d.
Osorio and Chong: Large-Scale Simulation-Based Transportation OptimizationTransportation Science 49(3), pp. 623–636, © 2015 INFORMS 625
Metamodel methods build an analytical approxima-tion of the simulation-based components of the opti-mization problem (e.g., objective function, constraints).In this paper, the objective function is simulation-based.Thus, the metamodel provides an analytical approx-imation of the objective function. By resorting to ametamodel approach, the stochastic response of the sim-ulation is replaced by an analytical response function(the metamodel) such that deterministic optimizationtechniques can be used. Metamodel techniques usean indirect-gradient approach—i.e., they compute thegradient of the metamodel, which is a deterministicfunction. Thus, traditional deterministic gradient-basedoptimization algorithms for generally constrained prob-lems can be used.
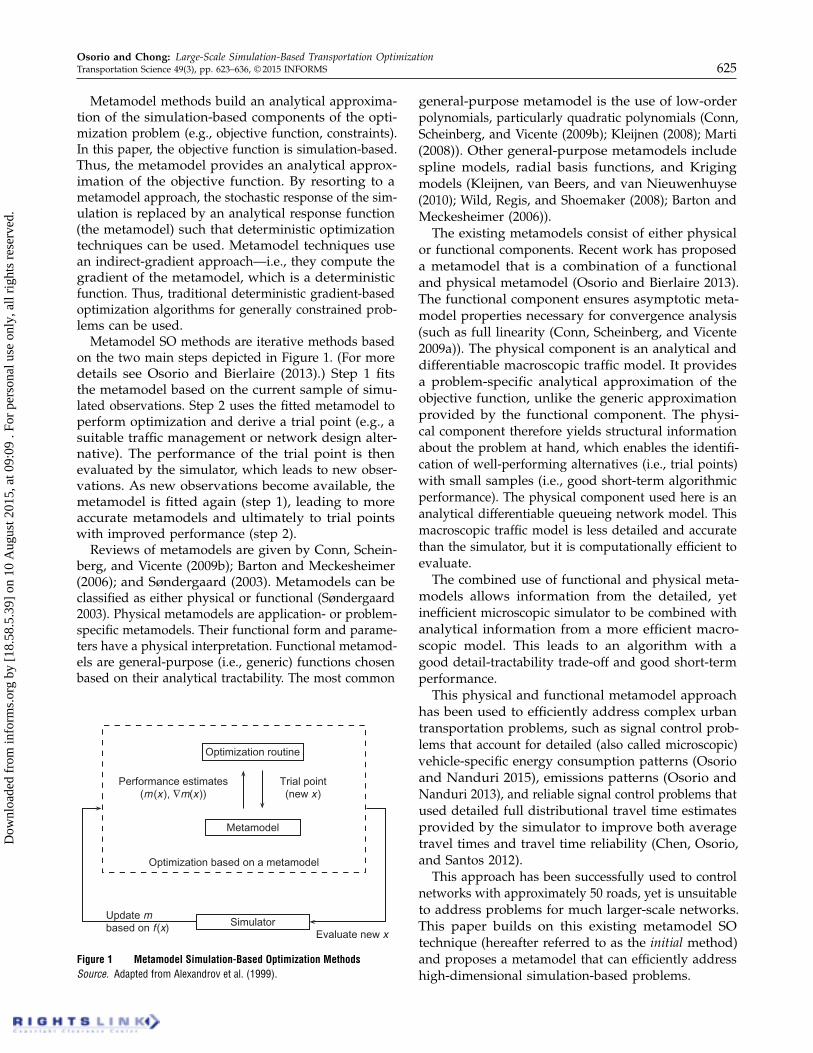
Metamodel SO methods are iterative methods basedon the two main steps depicted in Figure 1. (For moredetails see Osorio and Bierlaire (2013).) Step 1 fitsthe metamodel based on the current sample of simu-lated observations. Step 2 uses the fitted metamodel toperform optimization and derive a trial point (e.g., asuitable traffic management or network design alter-native). The performance of the trial point is thenevaluated by the simulator, which leads to new obser-vations. As new observations become available, themetamodel is fitted again (step 1), leading to moreaccurate metamodels and ultimately to trial pointswith improved performance (step 2).
Reviews of metamodels are given by Conn, Schein-berg, and Vicente (2009b); Barton and Meckesheimer(2006); and Søndergaard (2003). Metamodels can beclassified as either physical or functional (Søndergaard2003). Physical metamodels are application- or problem-specific metamodels. Their functional form and parame-ters have a physical interpretation. Functional metamod-els are general-purpose (i.e., generic) functions chosenbased on their analytical tractability. The most common
m x ∇m x x
mf x
x
Figure 1 Metamodel Simulation-Based Optimization MethodsSource. Adapted from Alexandrov et al. (1999).
general-purpose metamodel is the use of low-orderpolynomials, particularly quadratic polynomials (Conn,Scheinberg, and Vicente (2009b); Kleijnen (2008); Marti(2008)). Other general-purpose metamodels includespline models, radial basis functions, and Krigingmodels (Kleijnen, van Beers, and van Nieuwenhuyse(2010); Wild, Regis, and Shoemaker (2008); Barton andMeckesheimer (2006)).
The existing metamodels consist of either physicalor functional components. Recent work has proposeda metamodel that is a combination of a functionaland physical metamodel (Osorio and Bierlaire 2013).The functional component ensures asymptotic meta-model properties necessary for convergence analysis(such as full linearity (Conn, Scheinberg, and Vicente2009a)). The physical component is an analytical anddifferentiable macroscopic traffic model. It providesa problem-specific analytical approximation of theobjective function, unlike the generic approximationprovided by the functional component. The physi-cal component therefore yields structural informationabout the problem at hand, which enables the identifi-cation of well-performing alternatives (i.e., trial points)with small samples (i.e., good short-term algorithmicperformance). The physical component used here is ananalytical differentiable queueing network model. Thismacroscopic traffic model is less detailed and accuratethan the simulator, but it is computationally efficient toevaluate.
The combined use of functional and physical meta-models allows information from the detailed, yetinefficient microscopic simulator to be combined withanalytical information from a more efficient macro-scopic model. This leads to an algorithm with agood detail-tractability trade-off and good short-termperformance.
This physical and functional metamodel approachhas been used to efficiently address complex urbantransportation problems, such as signal control prob-lems that account for detailed (also called microscopic)vehicle-specific energy consumption patterns (Osorioand Nanduri 2015), emissions patterns (Osorio andNanduri 2013), and reliable signal control problems thatused detailed full distributional travel time estimatesprovided by the simulator to improve both averagetravel times and travel time reliability (Chen, Osorio,and Santos 2012).
This approach has been successfully used to controlnetworks with approximately 50 roads, yet is unsuitableto address problems for much larger-scale networks.This paper builds on this existing metamodel SOtechnique (hereafter referred to as the initial method)and proposes a metamodel that can efficiently addresshigh-dimensional simulation-based problems.
Dow
nloa
ded
from
info
rms.
org
by [
18.5
8.5.
39]
on 1
0 A
ugus
t 201
5, a
t 09:
09 .
For
pers
onal
use
onl
y, a
ll ri
ghts
res
erve
d.
Osorio and Chong: Large-Scale Simulation-Based Transportation Optimization626 Transportation Science 49(3), pp. 623–636, © 2015 INFORMS
3. Methodology3.1. Metamodel Functional FormRecall the general form of the urban transportationproblems that we address (Equation (1)). Since there isno closed-form available for the objective function, f ,we use a metamodel to approximate it. The functionalform of the metamodel used in this paper is thatproposed by Osorio and Bierlaire (2013). It combines aphysical and functional component. Its functional formis given by
m4x1y3�1�1q5= �T 4x1y3 q5+�4x3�51 (2)
where � (the functional component) is a quadratic poly-nomial in x with diagonal second-derivative matrix, T(the physical component) represents the approximationof the objective function proposed by the analyticalmacroscopic traffic model, y are endogenous macro-scopic model variables (e.g., queue length distributions),q are exogenous macroscopic parameters (e.g., totaldemand), and � and � are parameters of the metamodel.The metamodel m can be interpreted as a macroscopicapproximation of the objective function provided by T ,which is corrected parametrically by both a scalingfactor � and a separable error term �4x3�5. For detailsregarding the choice of this functional form, we referthe reader to Osorio and Bierlaire (2013).
In this paper, we use the same functional com-ponent as in Osorio and Bierlaire (2013) (i.e., thequadratic polynomial �). We propose a novel scal-able physical component. In §3.2 we recall the for-mulation of the physical component of the initialmetamodel and describe its limitations. We thenpresent the new formulation of the physical componentin §3.3.
3.2. Initial Queueing Network ModelThe physical component of the initial metamodel is anurban traffic model based on queueing network theory.It combines ideas from existing traffic models, variousnational urban transportation norms, and queueingmodels. The detailed formulation of the model is givenin Osorio and Bierlaire (2009b) (which is based on themore general queueing network model of Osorio andBierlaire 2009a). We outline here the main ideas of itsformulation.
Each lane of an urban road network is modeled asa queue (and in some cases as a set of queues). Toaccount for the limited physical space that a queueof vehicles may occupy, we resort to finite capacityqueueing theory, where there is a finite upper boundon the length of each queue. Each lane is modeledas a finite capacity M/M/1/k queue. The networkmodel analytically approximates the queue interactionsamong adjacent lanes. Congestion and spillbacks aremodeled by what is known in queueing theory as
blocking. This occurs when a queue is full and thusblocks arrivals from upstream queues at their cur-rent location. This blocking process is described byendogenous variables such as blocking probabilitiesand unblocking rates. The model consists of a set ofnonlinear equations that capture these between-queueinteractions.
In the following notation, the index i refers to agiven queue:
�i external arrival rate,�i total arrival rate,�i service rate,�i unblocking rate,
�effi effective service rate (accounts for both service
and eventual blocking),�i traffic intensity,P
fi probability of being blocked at queue i,ki upper bound of the queue length,Ni total number of vehicles in queue i,P4Ni = ki5 probability of queue i being full, also
known as the blocking or spillback probability,pij transition probability from queue i to queue j ,
and¤i set of downstream queues of queue i.
The queueing network model is formulated asfollows:
�i = �i +
∑
j pji�j41 − P4Nj = kj55
1 − P4Ni = ki51 (3a)
1�i
=∑
j∈¤i
�j41 − P4Nj = kj55
�i41 − P4Ni = ki55�effj
1 (3b)
1�eff
i
=1�i
+ Pfi
1�i
1 (3c)
P4Ni = ki5=1 −�i
1 −�ki+1i
�kii 1 (3d)
Pfi =
∑
j
pijP4Nj = kj51 (3e)
�i =�i
�effi
0 (3f)
Equation (3a) is a flow conservation equation thatrelates flow transmission between upstream and down-stream queues. The factor 41−P4Ni = ki55 represents theprobability that queue i is not full (i.e., the queue canreceive flow from its upstream queues). If the queueis full, it cannot receive flow from upstream queues,which may lead to spillbacks. Equation (3b) definesthe rate at which spillbacks at queue i dissipate, �i.Equation (3c) defines the rate at which queue i dissi-pates accounting for both spillback and nonspillbackstates, �eff
i . It is defined as a function of the service rateof the queue, �i. The latter is determined by combiningideas from national transportation norms and is a
Dow
nloa
ded
from
info
rms.
org
by [
18.5
8.5.
39]
on 1
0 A
ugus
t 201
5, a
t 09:
09 .
For
pers
onal
use
onl
y, a
ll ri
ghts
res
erve
d.

Osorio and Chong: Large-Scale Simulation-Based Transportation OptimizationTransportation Science 49(3), pp. 623–636, © 2015 INFORMS 627
function, for instance, of the free flow capacity of theunderlying lane. Equation (3d) defines the probabilitythat a queue is full—i.e., the spillback probability ofthe underlying lane. This expression is derived fromfinite capacity queueing theory (Bocharov et al. 2004).Equation (3e) defines the probability of a vehicle beingblocked while in queue i—i.e., the probability that avehicle at the underlying lane is affected by spillbackfrom a downstream lane. Equation (3f) defines thetraffic intensity of a queue; it is also derived fromtraditional finite capacity queueing formulae.
In this model, the exogenous parameters of a givenqueue are �i, �i, pij , and ki. All other parameters areendogenous. When used to solve a signal control prob-lem, the flow capacity of the signalized lanes becomeendogenous, which makes the corresponding servicerates, �i, endogenous. In that case, the exogenousparameters are �i1 pij , and ki. This is a stationary modelwith exogenous traffic assignment (the turning proba-bilities pij are exogenous). As described in §6, analyticaltractable formulations that describe both traffic dynam-ics and endogenous assignment are being developedas part of ongoing work.
As described in §2, this model has been used to solvesignal control problems for medium-scale networks.However, it is not sufficiently tractable to addresslarge-scale network problems. For instance, in thecase of the Lausanne city network (with more than600 links and 200 intersections), the time needed by astandard nonlinear optimization algorithm to solve thetrust-region (TR) subproblem (detailed in §4.2) exceeds20 minutes. Since this TR subproblem is solved at everyiteration of the SO algorithm, it is critical to solve itefficiently.
In this paper, we propose a more tractable andscalable physical component of the metamodel. It isan approximation of this initial queueing networkmodel. It consists of a simple system of one lin-ear and two nonlinear equations. In particular, as isdetailed in §5.2, the TR subproblem is now solvedon average within less than two minutes. This signifi-cantly enhances the computational efficiency of the SOalgorithm and allows us to efficiently address morecomplex high-dimensional constrained transportationproblems.
3.3. Highly Tractable Queueing Network ModelWe introduce the following two variables:
�effi effective arrival rate3
�effi effective traffic intensity0
These two new variables are defined by
�effi = �i41 − P4Ni = ki551 (4)
�effi =
�effi
�effi
0 (5)
The highly tractable queueing network model isgiven by
�effi = �i41 − P4Ni = ki55+
∑
j
pji�effj (6a)
�effi =
�effi
�i
+
(
∑
j∈¤i
pijP4Nj = kj5
)(
∑
j∈¤i
�effj
)
(6b)
P4Ni = ki5=1 −�eff
i
1 − 4�effi 5ki+1
4�effi 5ki 0 (6c)
Equation (6a) is obtained directly by inserting Equa-tion (4) into Equation (3a). Equation (6b) is obtained asfollows. Multiply Equation (3b) and (3c), respectively,by �eff
i to obtain
�effi
�i
=∑
j∈¤i
�effj
�effj
1 (7)
�effi =
�effi
�i
+ Pfi
�effi
�i
0 (8)
Insert Equation (7) into (8) to obtain
�effi =
�effi
�i
+ Pfi
(
∑
j∈¤i
�effj
)
0 (9)
Insert the expression of P fi given by Equation (3e), and
Equation (6b) results.Equation (6c) is an approximation of Equation (3d)
that is obtained by replacing the traffic intensity �with the effective traffic intensity �eff. That is, we usethe expression of the blocking probability of a finitecapacity queue, yet approximate the traffic intensitywith the effective traffic intensity.
Equation (5) defines �eff and shows that it mayunderestimate �. For queues with light traffic, we have�eff ≈ �, and the two models will yield similar networkperformance estimates. For congested links, the scalableapproximation may underestimate link congestion.
The proposed model consists of three endogenousvariables per queue (�eff
i 1�effi 1P4Ni = ki5). When using
this model to address signal control problems, �i alsobecomes endogenous. This model is defined by onelinear and two nonlinear equations. This formulationresults in increased computational efficiency, enablingus to address a full city-scale microscopic simulation-based optimization problem.
3.4. Example of Functional Form of TAs described in §2, one of the advantages of usinga physical component in the metamodel is to haveproblem-specific approximations of the objective func-tion. In this section, we give an example of the func-tional form of the analytical approximation of theobjective function provided by the queueing model,T 4x1y3 q5. In §4, we address a signal control problem,
Dow
nloa
ded
from
info
rms.
org
by [
18.5
8.5.
39]
on 1
0 A
ugus
t 201
5, a
t 09:
09 .
For
pers
onal
use
onl
y, a
ll ri
ghts
res
erve
d.

Osorio and Chong: Large-Scale Simulation-Based Transportation Optimization628 Transportation Science 49(3), pp. 623–636, © 2015 INFORMS
where the objective is to minimize the expected triptravel time. The queueing approximation of this expec-tation is obtained by applying Little’s law (Little (2011);Little (1961)) to the entire network. It is given by:
∑
i E6Ni7∑
i �i41 − P4Ni = ki551 (10)
where E6Ni7 represents the expected number of vehiclesin lane i, �i is the rate of vehicles entering the networkvia lane i (i.e., the external arrival rate), and P4Ni = ki5is the probability that lane i is full (i.e., spillback orblocking probability). The numerator of Equation (10)represents the expected number of vehicles in thenetwork, whereas the denominator represents theeffective arrival rate to the network. Their ratio yieldsthe expected time in the network.
The expected number of vehicles on lane i, E6Ni7, isgiven by
E6Ni7= �i
(
11 −�i
−4ki + 15�ki
i
1 −�ki+1i
)
0 (11)
This expression is derived in Appendix A. In the scal-able model proposed in this paper, �i is approximatedby �eff
i in Equation (11).
3.5. SO AlgorithmThe SO algorithm used in this paper is that of Osorioand Bierlaire (2013). It is given in Appendix B and isbased on the derivative-free trust-region (TR) algorithmproposed by Conn, Scheinberg, and Vicente (2009a).For an introduction to TR methods, we refer the readerto Conn, Gould, and Toint (2000). They summarize themain steps of a TR method in the basic trust region algo-rithm. The derivative-free method proposed by Conn,Scheinberg, and Vicente (2009a) builds on the basic TRalgorithm by adding two additional steps: a modelimprovement step and a criticality step. This algorithmallows for arbitrary metamodels to be used, and unliketraditional TR algorithms, it makes no assumptionson how these metamodels are fitted (interpolation orregression). It is therefore particularly appealing for thesimulation-based context where derivatives are costlyto estimate and where metamodels fitted via regressionare more suitable than their interpolated versions.
At a given iteration k of the SO algorithm, it solves aTR subproblem and approximates the objective functionby the current metamodel mk (defined in Equation (2)).The metamodel parameters (�k and �k) are fitted viaregression based on the simulated observations col-lected so far. For a detailed description of the algorithm,see Osorio and Bierlaire (2013).
4. Traffic Signal Control ProblemThis methodology is suitable to address a variety ofsimulation-based urban transportation optimization
problems. In this section, we evaluate the perfor-mance of the methodology by considering a large-scalenetwork-wide traffic signal control problem.
4.1. Problem FormulationA detailed review of traffic signal control formulationsis given in Appendix A of Osorio (2010). In this paper,we consider a fixed-time strategy. Fixed-time (alsocalled time of day or pre-timed) strategies are predeter-mined based on historical traffic patterns. They yieldone traffic signal setting for the considered time ofday. The traffic signal optimization problem is solvedoffline.
In this paper, the signal plans of several intersectionsare determined jointly. For a given intersection and agiven time interval (e.g., evening peak period), a fixed-time signal plan is a cyclic (i.e., periodic) plan that isrepeated throughout the time interval. The duration ofthe cycle is the time required to complete one sequenceof signals. The cycle times of the intersections controlledin the Lausanne network (used in the case study ofthis paper) are 80, 90, or 100 seconds.
A phase is defined as a set of traffic streams that aremutually compatible and that receive identical control.The cycle of a signal plan is divided into a sequence ofperiods called stages. Each stage consists of a set ofmutually compatible phases that all have green timessimultaneously. The stage sequence is defined so as toseparate conflicting traffic movements at intersections.The cycle may also contain all-red periods, where allstreams have red indications, as well as stages withfixed durations (e.g., for safety reasons). The sum ofthe all-red periods and the fixed periods is called thefixed cycle time.
Cycle times, green splits, and offsets are the threemain signal timing control variables. The green splitcorresponds to the ratio of green times (i.e., total dura-tion of a phase) to cycle time. Offsets are defined as thedifference in time between the start of cycles for a pairof intersections. Offset settings are especially importantin coordinating the signals of adjacent intersections(e.g., to create green waves along arterials or corridors).
In this paper cycle times, offsets, and all-red dura-tions are kept constant. The stage structure is alsogiven—i.e., the set of lanes associated with each stageas well as the sequence of stages are both known. Thisis known as a stage-based approach. The decisionvariables consist of the endogenous green splits of thedifferent intersections.
To formulate this problem, we introduce the follow-ing notation:
ci cycle time of intersection i,di fixed cycle time of intersection i,el ratio of fixed green time to cycle time of
signalized lane l,s saturation flow rate [veh/h],
Dow
nloa
ded
from
info
rms.
org
by [
18.5
8.5.
39]
on 1
0 A
ugus
t 201
5, a
t 09:
09 .
For
pers
onal
use
onl
y, a
ll ri
ghts
res
erve
d.

Osorio and Chong: Large-Scale Simulation-Based Transportation OptimizationTransportation Science 49(3), pp. 623–636, © 2015 INFORMS 629
x4j5 green split of phase j ,xL vector of minimal green splits,© set of intersection indices,L set of indices of the signalized lanes,
°I 4i5 set of endogenous phase indices ofintersection i, and
°L4l5 set of endogenous phase indices of lane l.
The problem is traditionally formulated as follows:
minx
f 4x3p5≡ E6F 4x3p57 (12)
subject to∑
j∈°I 4i5
x4j5=ci − dici
1 ∀ i ∈ ©1 (13)
x ≥ xL0 (14)
The decision vector x consists of the green splits for eachphase. The objective is to minimize the expected triptravel time (Equation (12)). The linear constraints (13)link the green times of the phases with the available(i.e., nonfixed) cycle time for each intersection. Equa-tion (14) ensures lower bounds for the green splits.These bounds are determined based on the prevailingtransportation norms.
4.2. Trust-Region SubproblemThis section presents the trust-region (TR) subproblemthat is solved at each iteration of the SO algorithm. It isa variation of the signal control problem defined in §4.1.At a given iteration k, the SO algorithm considersa metamodel mk4x1y3�k1�k1 q5, an iterate xk (pointconsidered to have best performance so far), and aTR radius ãk. The TR subproblem is formulated asfollows:
minx1y
mk = �kT 4x1y3 q5+�4x3�k5 (15)
subject to∑
j∈°I 4i5
x4j5=ci − dici
∀ i ∈ ©1 (16)
h4x1y3 q5= 01 (17)
�l −∑
j∈°L4l5
x4j5s = els1 ∀ l ∈L1 (18)
�x− xk�2 ≤ãk1 (19)
y ≥ 01 (20)
x ≥ xL0 (21)
The TR subproblem approximates the objective func-tion by the metamodel at iteration k, mk. It contains theconstraints of the signal control problem and includesthree additional constraints. Equations (16) and (21)are the signal control constraints; they correspondto Equations (13) and (14). The function h of Equa-tion (17) represents the queueing network model (Equa-tions (6a)–(6c)). Equation (18) relates the green splits
of a phase to the flow capacity of the underlying lanes(i.e., the service rate of the queues). Constraint (19) isthe trust region constraint. The endogenous variables ofthe queueing model are subject to positivity constraints(Equation (20)). Thus, the TR subproblem consists of anonlinear objective function subject to nonlinear andlinear equalities, a nonlinear inequality, and boundconstraints.
Implementation notes. This problem is solved withthe Matlab routine for constrained nonlinear problems,fmincon, and its sequential quadratic programmingmethod (Coleman and Li 1994, 1996). We set the toler-ance for relative change in the objective function to10−3 and the tolerance for the maximum constraintviolation to 10−2. For further details on the TR subprob-lem formulation and its implementation, see Osorioand Bierlaire (2013).
We implement the lower bound constraints of Equa-tion (21) as nonlinear equations by introducing a newvariable g and implementing Equation (21) as
x = xL + g20 (22)
We do not enforce the positivity of all endogenousvariables (Equation (20)) but check a posteriori that allendogenous variables are positive. In our numerousexperiments, we have not encountered a case witha negative value. We insert Equation (18) into Equa-tion (6b) and implement the two constraints as a singleconstraint.
For a problem with n endogenous phases, l lanes,and b signalized intersections, where each lane ismodeled by a single queue (i.e., we have l queues),there are 3l+n endogenous variables, which consist of3 endogenous queueing variables per lane, and thegreen splits for each phase. There are l linear equations,2l+b nonlinear equations, and one nonlinear inequality(TR constraint).
5. Empirical Analysis5.1. Lausanne City NetworkWe evaluate the scalability and short-term algorithmicperformance of this framework by solving a large-scalesignal control problem. We solve a problem for theentire Swiss city of Lausanne. The map is displayedin Figure 2; the considered area is delimited in white.
We use a microscopic traffic simulation model of theLausanne city center developed by Dumont and Bert(2006). It is implemented with the Aimsun simulator(TSS 2008) and is calibrated for evening peak perioddemand. Details regarding this Lausanne network aregiven in Osorio and Bierlaire (2009b). In this paper, theconsidered demand scenario consists of the first hourof peak period traffic, 17 h–18 h.
The road network consists of 603 links and 231 inter-sections. The signals of 17 intersections are controlled in
Dow
nloa
ded
from
info
rms.
org
by [
18.5
8.5.
39]
on 1
0 A
ugus
t 201
5, a
t 09:
09 .
For
pers
onal
use
onl
y, a
ll ri
ghts
res
erve
d.
Osorio and Chong: Large-Scale Simulation-Based Transportation Optimization630 Transportation Science 49(3), pp. 623–636, © 2015 INFORMS
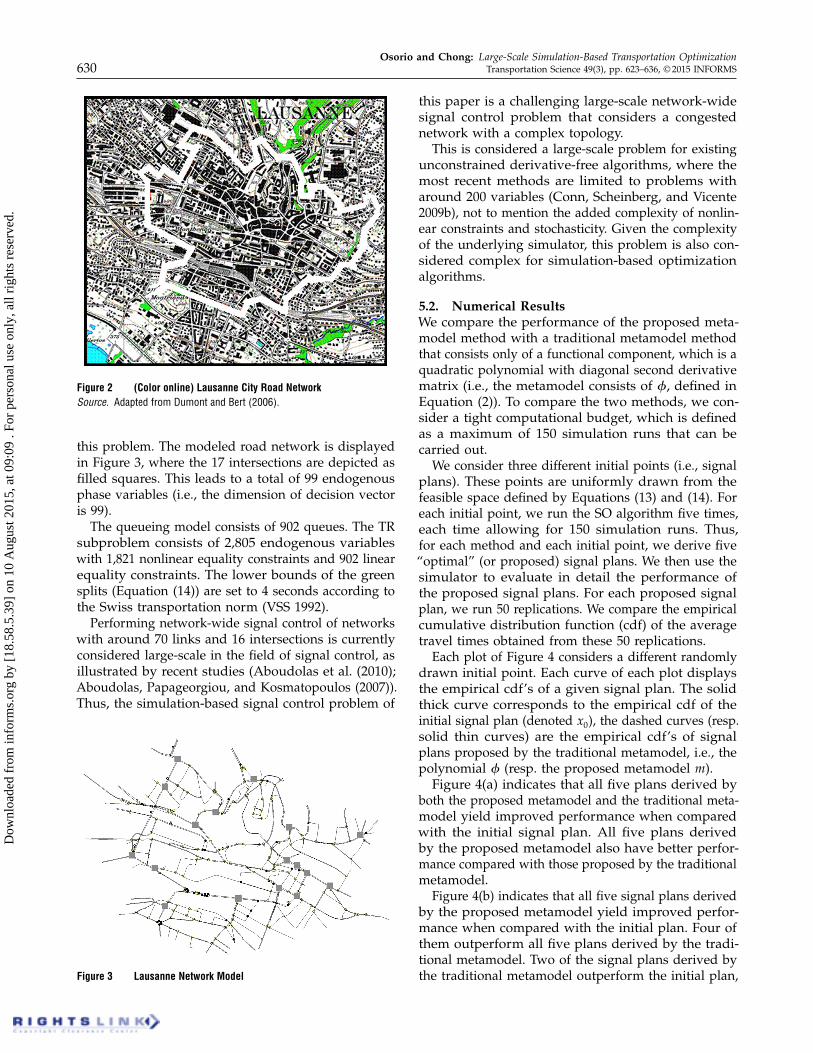
Figure 2 (Color online) Lausanne City Road NetworkSource. Adapted from Dumont and Bert (2006).
this problem. The modeled road network is displayedin Figure 3, where the 17 intersections are depicted asfilled squares. This leads to a total of 99 endogenousphase variables (i.e., the dimension of decision vectoris 99).
The queueing model consists of 902 queues. The TRsubproblem consists of 2,805 endogenous variableswith 1,821 nonlinear equality constraints and 902 linearequality constraints. The lower bounds of the greensplits (Equation (14)) are set to 4 seconds according tothe Swiss transportation norm (VSS 1992).
Performing network-wide signal control of networkswith around 70 links and 16 intersections is currentlyconsidered large-scale in the field of signal control, asillustrated by recent studies (Aboudolas et al. (2010);Aboudolas, Papageorgiou, and Kosmatopoulos (2007)).Thus, the simulation-based signal control problem of
Figure 3 Lausanne Network Model
this paper is a challenging large-scale network-widesignal control problem that considers a congestednetwork with a complex topology.
This is considered a large-scale problem for existingunconstrained derivative-free algorithms, where themost recent methods are limited to problems witharound 200 variables (Conn, Scheinberg, and Vicente2009b), not to mention the added complexity of nonlin-ear constraints and stochasticity. Given the complexityof the underlying simulator, this problem is also con-sidered complex for simulation-based optimizationalgorithms.
5.2. Numerical ResultsWe compare the performance of the proposed meta-model method with a traditional metamodel methodthat consists only of a functional component, which is aquadratic polynomial with diagonal second derivativematrix (i.e., the metamodel consists of �, defined inEquation (2)). To compare the two methods, we con-sider a tight computational budget, which is definedas a maximum of 150 simulation runs that can becarried out.
We consider three different initial points (i.e., signalplans). These points are uniformly drawn from thefeasible space defined by Equations (13) and (14). Foreach initial point, we run the SO algorithm five times,each time allowing for 150 simulation runs. Thus,for each method and each initial point, we derive five“optimal” (or proposed) signal plans. We then use thesimulator to evaluate in detail the performance ofthe proposed signal plans. For each proposed signalplan, we run 50 replications. We compare the empiricalcumulative distribution function (cdf) of the averagetravel times obtained from these 50 replications.
Each plot of Figure 4 considers a different randomlydrawn initial point. Each curve of each plot displaysthe empirical cdf’s of a given signal plan. The solidthick curve corresponds to the empirical cdf of theinitial signal plan (denoted x0), the dashed curves (resp.solid thin curves) are the empirical cdf’s of signalplans proposed by the traditional metamodel, i.e., thepolynomial � (resp. the proposed metamodel m).
Figure 4(a) indicates that all five plans derived byboth the proposed metamodel and the traditional meta-model yield improved performance when comparedwith the initial signal plan. All five plans derivedby the proposed metamodel also have better perfor-mance compared with those proposed by the traditionalmetamodel.
Figure 4(b) indicates that all five signal plans derivedby the proposed metamodel yield improved perfor-mance when compared with the initial plan. Four ofthem outperform all five plans derived by the tradi-tional metamodel. Two of the signal plans derived bythe traditional metamodel outperform the initial plan,
Dow
nloa
ded
from
info
rms.
org
by [
18.5
8.5.
39]
on 1
0 A
ugus
t 201
5, a
t 09:
09 .
For
pers
onal
use
onl
y, a
ll ri
ghts
res
erve
d.

Osorio and Chong: Large-Scale Simulation-Based Transportation OptimizationTransportation Science 49(3), pp. 623–636, © 2015 INFORMS 631
mφx
x
x
x
Fx
Fx
Fx
Figure 4 Empirical cdf’s of the Average Travel Times Considering InitialRandom Signal Plans and Allowing for 150 Simulation Runs
and the other three have performance similar to theinitial plan.
In Figure 4(c), all five plans derived by the proposedmetamodel yield improvement compared with theinitial plan, and three of them outperform all fivesignal plans proposed by the traditional metamodel.
Two of the signal plans proposed by the traditionalmetamodel have worse performance than the initialsignal plan, one has similar performance, and two haveimproved performance.
For all three initial points, the proposed methodsystematically derives signal plans with improvedperformance when compared with the initial plan and,most often, when compared with the plans obtainedfrom the traditional metamodel. Additionally, the plansderived by the proposed method have good and verysimilar performance across all SO runs and all initialpoints, whereas the performance of the plans proposedby the traditional metamodel varies depending on boththe initial point and the SO run. This illustrates therobustness of the proposed method to both the initialpoints and the stochastics of the simulator.
We evaluate the performance of the proposedapproach for larger sample sizes. We run the SO algo-rithm once and allow for a total of 1,500 simulation runs.We choose two random initial signal plans. We evalu-ate the performance of the signal plans proposed atsample sizes 50, 150, 200, 400, 600, 800, 1,000, and 1,500.We evaluate their performance just as before—i.e., fora given proposed plan we run 50 replications of thesimulator and plot the empirical cdf (over these 50replications) of the average travel times.
Figure 5(a) displays the corresponding cdf’s of theinitial signal plan used in Figure 4(a). The proposedapproach identifies a signal plan with excellent perfor-mance already at sample size 50 (cdf labeled m 50).The signal plan identified as of sample size 150 remainsthe best up to sample size 1,500. It has slightly improvedperformance, and in particular reduced variability,compared with that of sample size 50.
The performance of the signal plans proposed bythe traditional metamodel (dashed curves) improves asthe sample size increases. The traditional metamodelrequires a much larger sample size to identify signalplans with good performance.
We carry out a paired t-test to evaluate whether thedifference in performance of the signal plans proposedby each method at sample size 1,500 is statisticallysignificant. We assume that the observed average traveltimes arise from a normal distribution with commonbut unknown variance. The null hypothesis assumesthat the expected travel time is the same for bothmethods, whereas the alternative hypothesis assumesthat they differ. The confidence level is 0.05, and thereare 49 degrees of freedom. The sample average andsample standard deviation of our proposed signal plan(resp. that proposed by the polynomial metamodel)are 5.73 minutes and 0.51 minutes (resp. 5.95 minutesand 0.47 minutes). The critical value of the test is 1.96.The difference is statistically significant (t-statistic of−2038, p-value of 0.02).
Dow
nloa
ded
from
info
rms.
org
by [
18.5
8.5.
39]
on 1
0 A
ugus
t 201
5, a
t 09:
09 .
For
pers
onal
use
onl
y, a
ll ri
ghts
res
erve
d.

Osorio and Chong: Large-Scale Simulation-Based Transportation Optimization632 Transportation Science 49(3), pp. 623–636, © 2015 INFORMS
4 5 6 7 8 9 10 11
x: Average travel time in the network [min]
m 50m 150–1,500� 50� 150� 200� 400� 600� 800–1,000� 1,500x0
4 5 6 7 8 9 10 110
0.1
0.2
0.3
0.4
0.5
0.6
0.7
0.8
0.9
1.0
x: Average travel time in the network [min]
Em
piric
al c
df F
(x)
0
0.1
0.2
0.3
0.4
0.5
0.6
0.7
0.8
0.9
1.0(a)
(b)
Em
piric
al c
df F
(x)
m 50m 150–1,500� 50� 150� 200� 400� 600–1,500x0
Figure 5 (Color online) Empirical cdf’s of the Average Travel TimesConsidering Initial Random Signal Plans and Allowing for1,500 Simulation Runs
Thus, at sample size 1,500 the proposed method stilloutperforms its traditional counterpart. That is, thesignal plan identified by the proposed method as ofsample size 150 outperforms that identified by thetraditional method at sample size 1,500.
0 to 4040.1 to 8080.1 to inf
0 to 4040.1 to 8080 to inf
Figure 6 (Color online) Average Link Travel Times Using the Initial Signal Plan (Left Map) and the Signal Plan Proposed by the SO Approach (Right Map)Note. The averages (in seconds) are taken over 50 simulation replications.
Figure 5(b) displays the results considering the ini-tial plan used in Figure 4(b). Similarly, the proposedapproach identifies a signal plan with an excellentperformance even at sample size 50. The signal planwith the best performance derived by the proposedmetamodel is obtained at sample size 150 and remainsthe same until sample size 1,500. It has a similar per-formance to that of sample size 50.
For sample sizes smaller than 400, the traditionalmetamodel yields signal plans with worse performancethan the initial plan. Their performance significantlyimproves with increasing sample size until size 400.The performance of the derived signal plans withsamples larger than 400 are similar. The signal plansproposed by the traditional metamodel method forsample sizes 600 to 1,500 are the same.
We carry out the same paired t-test as before toevaluate whether the difference in performance of thesignal plans proposed by each method at sample size1,500 is statistically significant. The sample average andsample standard deviation of our proposed signal plan(resp. that proposed by the polynomial metamodel)are 6.25 minutes and 0.73 minutes (resp. 6.16 minutesand 0.50 minutes). The difference is not statisticallysignificant (t-statistic of 0.72, p-value of 0.48).
Figure 6 displays two instances of the Lausanne citymap. The links are colored based on average link traveltimes (averaged over the 50 replications). The left (resp.right) map considers the average link travel timesfor the initial (resp. proposed) signal plan. Here theproposed plan is that obtained with the initial planand sample size of 150 of Figure 5(a). Green links haveaverage travel times below 40 seconds, yellow linkshave travel times between 40 and 80 seconds, while redlinks have travel times greater than 80 seconds. Thisfigure shows how the proposed plan yields city-widetravel time improvements.
Dow
nloa
ded
from
info
rms.
org
by [
18.5
8.5.
39]
on 1
0 A
ugus
t 201
5, a
t 09:
09 .
For
pers
onal
use
onl
y, a
ll ri
ghts
res
erve
d.

Osorio and Chong: Large-Scale Simulation-Based Transportation OptimizationTransportation Science 49(3), pp. 623–636, © 2015 INFORMS 633
0 2 4 6 8 10 12 140
0.1
0.2
0.3
0.4
0.5
0.6
0.7
0.8
0.9
1.0
x : run time [min]
Em
piric
al c
df F
(x)
FminconAimsun
Figure 7 Simulation and Trust Region Subproblem Run Times
At each iteration of the SO algorithm, the two mostcomputationally expensive tasks are the evaluation ofthe simulator as well as the solution of the trust-region(TR) subproblem (i.e., call of the fmincon routine).We consider the first initial plan (used in Figures 4(a)and 5(a)) and account for all five runs. Figure 7 displaysthe cdf of the simulation runs and the TR subproblemruns. On average one simulation run takes 1.3 minutes,and it takes 1.9 minutes to solve the TR subproblem.The experiments were run on a standard laptop (witha 2.7 GHz processor and 4 GB of RAM). Thus, themetamodel can be used to efficiently solve the TRsubproblem at each iteration of the SO algorithm.Additionally, the structural information that it pro-vides through the queueing network model allows theSO algorithm to identify signal plans with excellentperformance under tight computational budgets.
5.3. Synchro ComparisonIn this section we compare the performance of the sig-nal plans derived by our approach with those derivedby the mainstream, commercial, and widely used traf-fic signal control software Synchro (Trafficware 2011,Synchro 8). Synchro is a traffic signal control optimiza-tion software based on a macroscopic, deterministic,and local traffic model. It is widely used across theUnited States (NYCDOT (2012); Riniker, Eisenach, andHannan (2009); Abdel-Rahim and Dixon (2007); ATAC(2003)). For details on the split optimization techniquewithin Synchro, we refer the reader to Chapter 14 ofTrafficware (2011).
The Synchro version used does not allow for anyfixed (i.e., exogenous) phase durations. Hence, wesolve a signal control problem without fixed phases.For each intersection we take as cycle time its available(i.e., nonfixed) cycle time, ci − di. The problem formula-tion is given by Equations (12)–(14) and by replacingthe right-hand side of Equation (13) by 4ci −di5/4ci −di5,
which equals 1. Synchro and our proposed SO methodaddress the same problem. The corresponding TRsubproblem is given by Equations (15)–(21) and byreplacing the right-hand side of (16) by 1 and theright-hand side of (18) with zero.
The Lausanne network is coded in Synchro. Allsignal plan information needed for Synchro (e.g., phasestructure) is obtained from the existing Lausanne signalplan. The minimum splits are set to 4 seconds as in §5.1.Lane saturation flows (denoted s in §4.1) are set to1,800 vehicles per hour, following Swiss transportationnorms. Synchro also needs, as inputs, estimates ofprevailing movement flows. This was also neededwhen calibrating the analytical queueing model (e.g.,to obtain turning probabilities). Hence, we use thesame estimates as those provided to the queueingmodel. These are obtained from the simulator usingthe existing Lausanne signal plan.
To initialize the proposed SO approach, we considerthe same three random initial signal plans as usedin Figure 4. For each initial plan, we run the SOalgorithm once, each time allowing for 150 simulationruns. To evaluate the performance of a plan, we usethe simulator and proceed as described in §5.2.
Figure 8 presents the corresponding cdf curves.The three solid thin curves correspond to theplans derived by our proposed metamodel approach(denoted m). The dashed curves correspond to the threerandom initial signal plans (denoted x0). The solidthick curve corresponds to the Synchro plan. All threeplans derived by the purposed metamodel approachyield improved performance when compared withall three initial plans. All three plans derived by theSO approach also outperform the plan proposed bySynchro. The Synchro plan has performance similar totwo of the three randomly drawn signal plans.
4 5 6 7 8 9 10 110
0.1
0.2
0.3
0.4
0.5
0.6
0.7
0.8
0.9
1.0
x : Average travel time in the network [min]
Em
piric
al c
df F
(x)
mSynchrox0
Figure 8 Emprical cdf’s of the Average Travel Times of the Signal PlansProposed by the SO Approach and by Synchro
Dow
nloa
ded
from
info
rms.
org
by [
18.5
8.5.
39]
on 1
0 A
ugus
t 201
5, a
t 09:
09 .
For
pers
onal
use
onl
y, a
ll ri
ghts
res
erve
d.
Osorio and Chong: Large-Scale Simulation-Based Transportation Optimization634 Transportation Science 49(3), pp. 623–636, © 2015 INFORMS
6. ConclusionsThis paper proposes a metamodel for large-scalesimulation-based urban transportation optimizationproblems. It is a computationally efficient techniquethat identifies trial points (e.g., signal plans) withimproved performance under tight computational bud-gets. This metamodel SO technique is based on theuse of a highly tractable metamodel that combines ageneral-purpose component (a quadratic polynomial)with a physical component (a highly tractable analyticalqueueing network model).
We evaluate the performance of this approach byaddressing a large-scale network-wide signal controlproblem for the Swiss city of Lausanne. This problemconsiders a congested network (evening peak perioddemand) with an intricate topology. We compare theperformance of the proposed metamodel with thatof a traditional metamodel. The proposed methodidentifies signal plans that improve the distribution ofaverage travel times compared with both the initialsignal plans and, most often, the signal plans derivedby the traditional method. This network-wide signalcontrol problem is considered high-dimensional forSO algorithms, derivative-free algorithms, and signalcontrol algorithms. We also compare the performanceof the proposed approach with that of a widely usedsignal control software, Synchro. All proposed signalplans outperform the plan derived by Synchro.
In this paper, random uniformly drawn signalplans are used as initial points for the SO algorithm.The results illustrate the robustness of the proposedmetamodel method to initial points. This allows prac-titioners to use the method to address a variety ofsignal control problems without requiring any fieldknowledge to initialize the method.
As part of ongoing research, we are investigating theuse of the proposed method to address a variety ofgenerally constrained simulation-based transportationproblems, including microscopic model calibration,multimodal traffic management, and multimodal net-work design problems. We are also developing SOalgorithms with improved short-term performance byusing information from analytical probabilistic trafficmodels, such as the queueing network model usedin this paper, to inform both sampling strategies andstatistical tests.
We are also investigating novel analytical trafficmodel formulations with increased accuracy. The modelused in this manuscript is a stationary model. We arecurrently working on a time-dependent formulationbased on the use of transient finite capacity queueingtheory. Ongoing work is also developing a formula-tion with endogenous analytical traffic assignment.The main challenge in this analytical work is to derive adifferentiable and highly tractable formulation suitablefor large-scale simulation-based optimization.
AcknowledgmentsThe authors thank Emmanuel Bert and André-Gilles Dumont(Traffic Facilities Laboratory (LAVOC), Ecole PolytechniqueFédérale de Lausanne (EPFL)) for providing the Lausannesimulation model. This research was partially supported bythe Center for Complex Engineering Systems at the KingAbdulaziz City for Science and Technology (KACST) and theMassachusetts Institute of Technology (MIT).
Appendix A. Derivation of E6N 7In this section we omit the index i that refers to a givenqueue. E6N 7 is defined as
E6N 7=k∑
n=0
nP4N = n50 (A1)
The stationary probabilities for each queue, P4N = n5, aregiven in Bocharov et al. (2004) by
P4N = n5=1 −�
1 −�k+1�n0 (A2)
Inserting Equation (A2) into (A1) and then rearranging theterms yields
E6N 7 =
k∑
n=0
n1 −�
1 −�k+1�n1 (A3)
=
k∑
n=1
n1 −�
1 −�k+1�n1 (A4)
=1 −�
1 −�k+1
k∑
n=1
n�n1 (A5)
=1 −�
1 −�k+1�
k∑
n=1
n�n−10 (A6)
We then derive an expression for the last summation asfollows. For a geometric series, such that � 6= 1, we have
k∑
n=0
�n=
�k+1 − 1�− 1
0 (A7)
We differentiate this formula with respect to � and obtain
k∑
n=1
n�n−1=
1 −�k+1
41 −�52−
4k+ 15�k
1 −�0 (A8)
Inserting the expression of Equation (A8) into Equation (A6),and rearranging the terms gives
E6N 7 =1 −�
1 −�k+1�
(
1 −�k+1
41 −�52−
4k+ 15�k
1 −�
)
(A9)
= �
(
11 −�
−4k+ 15�k
1 −�k+1
)
0 (A10)
Appendix B. SO AlgorithmThis SO algorithm is formulated in detail in Osorio andBierlaire (2013) and is based on the derivative-free trust-region (TR) algorithm of Conn, Scheinberg, and Vicente(2009a). The parameters of the algorithm are set according tothe values in Osorio and Bierlaire (2013).
0. Initialization. Define for a given iteration k2 mk4x1y3�k1�k1 q5 as the metamodel (denoted hereafter as mk4x5), xk
Dow
nloa
ded
from
info
rms.
org
by [
18.5
8.5.
39]
on 1
0 A
ugus
t 201
5, a
t 09:
09 .
For
pers
onal
use
onl
y, a
ll ri
ghts
res
erve
d.

Osorio and Chong: Large-Scale Simulation-Based Transportation OptimizationTransportation Science 49(3), pp. 623–636, © 2015 INFORMS 635
as the iterate, ãk as the TR radius, �k = 4�k1�k5 as the vectorof parameters of mk, nk as the total number of simulationruns carried out up until and including iteration k, uk asthe number of successive trial points rejected, and �k asthe measure of stationarity (norm of the derivative of theLagrangian function of the TR subproblem with regard tothe endogenous variables) evaluated at xk.
The constants �1, �, �inc, �c , � , d, u, and ãmax are given suchthat 0 <�1 < 1, 0 < � < 1 < �inc, �c > 0, 0 < � < 1, 0 < d < ãmax,and u ∈�∗. Set the total number of simulation runs permitted(across all points) nmax; this determines the computationalbudget. Set the number of simulation replications per point r(here we use r = 1).
Set k= 0, n0 = 1, and u0 = 0. Determine x0 and ã0 (ã0 ∈
401ãmax7).Given the initial point x0, compute fA4x05 (analytical ap-
proximation of Equation (12)) and f 4x05 (simulated estimateof Equation (12)), fit an initial model m0 (i.e., compute �0).
1. Criticality step. If �k ≤ �c, then switch to conservativemode.
2. Step calculation. Compute a step sk that reduces themodel mk and such that xk + sk (the trial point) is in the TR(i.e., approximately solve the TR subproblem).
3. Acceptance of the trial point. Compute f 4xk + sk5 and
�k =f 4xk5− f 4xk + sk5
mk4xk5−mk4xk + sk50
—If �k ≥ �1, then accept the trial point: xk+1 = xk + sk,uk = 0.
—Otherwise, reject the trial point: xk+1 = xk, uk = uk + 1.Include the new observation in the set of sampled points
(nk = nk + r), and fit the new model mk+1.4. Model improvement. Compute �k+1 = ��k+1 − �k�/��k�. If
�k+1 < � , then improve the model by simulating the perfor-mance of a new point x, which is uniformly drawn fromthe feasible space. Evaluate fA and f at x. Include thisnew observation in the set of sampled points (nk = nk + r).Update mk+1.
5. TR radius update.
ãk+1 =
min8�incãk1ãmax9 if �k >�1
max8�ãk1 d9 if �k ≤ �1 and uk ≥ u
ãk otherwise0
If �k ≤ �1 and uk ≥ u, then set uk = 0.If ãk+1 ≤ d, then switch to conservative mode.
Set nk+1 = nk, uk+1 = uk, and k = k+ 1.If nk <nmax, then go to Step 1. Otherwise, stop.
ReferencesAbdel-Rahim A, Dixon M (2007) Guidelines for designing and
implementing traffic control systems for small- and medium-sized cities in Idaho. Technical Report N06-18, Idaho Departmentof Transportation, Boise, ID.
Aboudolas K, Papageorgiou M, Kosmatopoulos E (2007) Control andoptimization methods for traffic signal control in large-scalecongested urban road networks. Amer. Control Conf. 3132–3138.
Aboudolas K, Papageorgiou M, Kouvelas A, Kosmatopoulos E (2010)A rolling-horizon quadratic-programming approach to the signalcontrol problem in large-scale congested urban road networks.Transportation Res. Part C 18(5):680–694.
Alexandrov NM, Lewis RM, Gumbert CR, Green LL, Newman PA(1999) Optimization with variable-fidelity models applied towing design. Technical Report CR-1999-209826, NASA LangleyResearch Center, Hampton, VA.
ATAC (2003) Signal coordination strategies final report. Technicalreport, Advanced Traffic Analysis Center, Upper Great PlainsTransportation Institute, North Dakota State University, Fargo.
Barton RR, Meckesheimer M (2006) Metamodel-based simulationoptimization. Henderson SG, Nelson BL, eds. Handbooks inOperations Research and Management Science: Simulation, Vol. 13(Elsevier, Amsterdam), 535–574.
Ben-Akiva M, Cuneo D, Hasan M, Jha M, Yang Q (2003) Evaluationof freeway control using a microscopic simulation laboratory.Transportation Res. Part C 11(1):29–50.
Bocharov PP, D’Apice C, Pechinkin AV, Salerno S (2004) Queue-ing Theory, Modern Probability and Statistics (Brill AcademicPublishers, Zeist, Netherlands), 96–98.
Branke J, Goldate P, Prothmann H (2007) Actuated traffic signal opti-mization using evolutionary algorithms. Proc. 6th Eur. Congressand Exhibition on Intelligent Transport Systems and Services, Aalborg,Denmark, June 18–20.
Bullock D, Johnson B, Wells RB, Kyte M, Li Z (2004) Hardware-in-the-loop simulation. Transportation Res. Part C 12(1):73–89.
Chen X, Osorio C, Santos BF (2012) A simulation-based approachto reliable signal control. Proc. Internat. Sympos. TransportationNetwork Reliability (INSTR).
Coleman TF, Li Y (1994) On the convergence of reflective Newtonmethods for large-scale nonlinear minimization subject to bounds.Math. Programming 67(2):189–224.
Coleman TF, Li Y (1996) An interior, trust region approach fornonlinear minimization subject to bounds. SIAM J. Optim.6(2):418–445.
Conn AR, Gould NIM, Toint PL (2000) Trust-Region Methods, MPS/SIAM Series on Optimization (SIAM and MPS, Philadelphia).
Conn AR, Scheinberg K, Vicente LN (2009a) Global convergenceof general derivative-free trust-region algorithms to first- andsecond-order critical points. SIAM J. Optim. 20(1):387–415.
Conn AR, Scheinberg K, Vicente LN (2009b) Introduction to Derivative-Free Optimization, MPS/SIAM Series on Optimization (SIAMand MPS, Philadelphia).
Dumont AG, Bert E (2006) Simulation de l’agglomération LausannoiseSIMLO. Technical report, Laboratoire des voies de circulation,ENAC, Ecole Polytechnique Fédérale de Lausanne, Lausanne,Switzerland.
Fu MC, Glover FW, April J (2005) Simulation optimization: A review,new developments, and applications. Kuhl ME, Steiger NM,Armstrong FB, Joines JA, eds. Proc. 2005 Winter Simulation Conf.(IEEE, Piscataway, NJ), 83–95.
Gartner NH, Hou DL (1992) Comparative evaluation of alternativetraffic control strategies. Transportation Res. Record 1360:66–73.
Hachicha W, Ammeri A, Masmoudi F, Chachoub H (2010) A com-prehensive literature classification of simulation optimisationmethods. Proc. Internat. Conf. Multiple Objective Programming andGoal Programming MOPGP10, Sousse, Tunisia, May 24–25.
Hale D (2005) Traffic network study tool TRANSYT-7F. Technicalreport, McTrans Center, University of Florida, Gainesville.
Hasan M (1999) Evaluation of ramp control algorithms using amicroscopic traffic simulation laboratory, MITSIM. Master’sthesis, Massachusetts Institute of Technology, Cambridge.
Hasan M, Jha M, Ben-Akiva M (2002) Evaluation of ramp controlalgorithms using microscopic traffic simulation. TransportationRes. Part C 10(3):229–256.
Joshi S, Rathi A, Tew J (1995) An improved response surface method-ology algorithm with an application to traffic signal optimizationfor urban networks. Alexopoulos C, Kang K, Lilegdon WR,Goldsman D, eds. Proc. 1995 Winter Simulation Conf. (IEEE,Piscataway, NJ), 1104–1109.
Kleijnen JPC (2008) Response surface methodology for constrainedsimulation optimization: An overview. Simulation ModellingPractice and Theory 16(1):50–64.
Dow
nloa
ded
from
info
rms.
org
by [
18.5
8.5.
39]
on 1
0 A
ugus
t 201
5, a
t 09:
09 .
For
pers
onal
use
onl
y, a
ll ri
ghts
res
erve
d.

Osorio and Chong: Large-Scale Simulation-Based Transportation Optimization636 Transportation Science 49(3), pp. 623–636, © 2015 INFORMS
Kleijnen JPC, van Beers W, van Nieuwenhuyse I (2010) Constrainedoptimization in expensive simulation: Novel approach. Eur. J.Oper. Res. 202(1):164–174.
Li P, Abbas M, Pasupathy R, Head L (2010) Simulation-basedoptimization of maximum green setting under retrospectiveapproximation framework. Transportation Res. Record 2192:1–10.
Little JDC (1961) A proof for the queueing formula: L= �W . Oper.Res. 9(3):383–387.
Little JDC (2011) Little’s law as viewed on its 50th anniversary. Oper.Res. 59(3):536–549.
Marti K (2008) Stochastic Optimization Methods (Springer, Berlin).NYCDOT (2012) Downtown Flushing, mobility and safety improve-
ment project. Technical report, New York City Department ofTransportation, New York.
Osorio C (2010) Mitigating network congestion: Analytical models,optimization methods and their applications. Ph.D. thesis, EcolePolytechnique Fédérale de Lausanne, Lausanne, Switzerland.
Osorio C, Bierlaire M (2009a) An analytic finite capacity queueingnetwork model capturing the propagation of congestion andblocking. Eur. J. Oper. Res. 196(3):996–1007.
Osorio C, Bierlaire M (2009b) A surrogate model for traffic opti-mization of congested networks: An analytic queueing networkapproach. Technical Report 090825, Transport and MobilityLaboratory, ENAC, Ecole Polytechnique Fédérale de Lausanne,Lausaane, Switzerland. http://web.mit.edu/osorioc/www/papers/osorBier09TechRepQgTraf.pdf.
Osorio C, Bierlaire M (2013) A simulation-based optimizationframework for urban transportation problems. Oper. Res. 61(6):1333–1345.
Osorio C, Nanduri K (2013) Emissions mitigation: Coupling micro-scopic emissions and urban traffic models for signal control.Technical Report 19082013, Massachusetts Institute of Technol-ogy, Cambridge. http://web.mit.edu/osorioc/www/papers/osoNanEmissionsSO.pdf.
Osorio C, Nanduri K (2015) Energy-efficient urban traffic manage-ment: A microscopic simulation-based approach. TransportationSci. 49(3):637–651.
Papayannoulis V, Marsico M, Maguire T, Strasser J, Scalici S (2011)An integrated travel demand, mesoscopic and microscopicmodeling platform to assess traffic operations for Manhattan,
New York. Proc. Transportation Res. Board (TRB) Conf. (TRB,Washington, DC).
Rathi AK, Lieberman EB (1989) Effectiveness of traffic restraint for acongested urban network: A simulation study. Transportation Res.Record 1232:95–102.
Riniker K, Eisenach P, Hannan T (2009) City of Winchester, VAtraffic signal upgrade project. Technical report, Institute ofTransportation Engineers, Washington, DC.
Søndergaard J (2003) Optimization using surrogate models—By thespace mapping technique. Ph.D. thesis, Technical University ofDenmark, Lyngby, Denmark.
Stallard C, Owen L (1998) Evaluating adaptive signal control usingCORSIM. Medeiros D, Watson E, Carson J, Manivannan M,eds. Proc. 1998 Winter Simulation Conf. (IEEE, Piscataway, NJ),1147–1153.
Stevanovic J, Stevanovic A, Martin PT, Bauer T (2008) Stochasticoptimization of traffic control and transit priority settings inVISSIM. Transportation Res. Part C 16(3):332–349.
Toledo T, Koutsopoulos HN, Davol A, Ben-Akiva ME, Wilco B,Andreasson I, Johansson T, Lundin C (2003) Calibration andvalidation of microscopic traffic simulation tools: Stockholmcase study. Transportation Res. Record 1831:65–75.
Traffic Technology International (2012a) Admirable solution. Traf-fic Technology International (February/March). http://viewer.zmags.com/publication/e8a8bd2e#/e8a8bd2e/1.
Traffic Technology International (2012b) In the frame. Traffic Tech-nology International (April/May). http://viewer.zmags.com/publication/e1a5fab8#/e1a5fab8/1.
Trafficware (2011) Synchro Studio 8 User Guide. Trafficware, SugarLand, TX.
TSS (2008) AIMSUN NG and AIMSUN Micro Version 5.1. TransportSimulation Systems, Barcelona, Spain.
VSS (1992) Norme Suisse SN 640837 Installations de feux de cir-culation; temps transitoires et temps minimaux. Union desprofessionnels suisses de la route, VSS, Zurich.
Wild SM, Regis RG, Shoemaker CA (2008) ORBIT: Optimizationby radial basis function interpolation in trust-regions. SIAM J.Scientific Comput. 30:3197–3219.
Yun I, Park B (2006) Application of stochastic optimization method foran urban corridor. Proc. Winter Simulation Conf. (IEEE, Piscataway,NJ), 1493–1499.
Dow
nloa
ded
from
info
rms.
org
by [
18.5
8.5.
39]
on 1
0 A
ugus
t 201
5, a
t 09:
09 .
For
pers
onal
use
onl
y, a
ll ri
ghts
res
erve
d.