A Computational Analysis of Thermochemical Studies...
16
45 TH Aerospace Sciences Meeting and Exhibit AIAA 2007 – 0121 A Computational Analysis of Thermochemical Studies in the LENS Facilities Matthew MacLean * Michael Holden † Timothy Wadhams * CUBRC, Aerothermal/Aero-optics Evaluation Center, Buffalo, NY, 14225 Ronald Parker * Stratonics, Conesus, NY 14435 A review has been presented detailing the comparisons between numerical prediction and experimental data collected in the LENS facilities for a program focusing on thermochemical modeling of the flow in the reflected shock tunnel facility at high enthalpy. Comparisons have been provided for several studies made in the LENS-I facility including fundamental laser diode measurements of freestream nitric oxide concentration, temperature, and velocity; measurements on a two-dimensional cylinder; and measurements of laminar shock-wave/boundary layer interaction on a double cone geometry. The freestream velocity of the facility is found to be predicted to an accuracy of 2.5% or better for well-tailored conditions at all enthalpy levels, but the static temperature is significantly over-predicted for high enthalpy flows. Despite this, good agreement is obtained with all measurements for a two-dimensional cylinder. For the double cone model, the effect of vibration-dissociation coupling with the T-T V and CVDV models has been investigated. The choice of coupling model has impact for the lower enthalpy case, but in the high enthalpy case, it is unclear whether the discrepancy with the measurements is attributable to the coupling in the interaction region or the understanding of the freestream conditions. I. Introduction xperiments have been performed in the LENS facility during the past year to better assess the capability of both numerical prediction tools and a premier ground test facility to replicate the conditions of flight at very high enthalpies where thermochemical (“real-gas”) behavior is a dominating effect on the aerothermal and aerodynamic performance of the vehicle. The study is part of a larger work encompassing many of the most difficult problems in hypersonic vehicle design, including real-gas chemistry effects, thermochemical non-equilibrium, laminar shock- wave/boundary layer interaction, boundary layer transition, turbulent shock-wave/boundary layer interaction, and catalytic heating effects on the cold-wall ground test models. The objective of this part of the program has been principally to (1) validate and understand the operation of the facility at high enthalpy conditions of 10MJ/kg and higher, and (2) to generate a database of reliable measurements with which to assess the current computational modeling capabilities in each of these areas. CUBRC uses an integrated approach where the facility experiments and the numerical predictions are tied together to understand the acquired data and validate both facility and codes simultaneously. E In this publication, the focus will be primarily on the computational (CFD) predictions that we are making with this dataset on several vehicle configurations to study the influence of the thermochemical modeling (“real-gas” effects) and the ability of our best numerical tools to predict them. The overview of the experimental program is being published concurrently by Holden et al 1 , so the focus here is on the connectivity of the CFD tools to that experimental data. The major studies conducted in the phases of this program were: (1) interrogation of the freestream state of the facility at high enthalpy via non-intrusive tunable laser diode (TDLAS) techniques to obtain temperature, concentration, and flow velocity information, (2) fundamental measurements of shock shape and surface heating on simple cylinder and hemisphere geometries, (3) measurements of the attached and separated * Senior Research Scientist, AIAA Member. †AAEC Program Manager, AIAA Fellow. American Institute of Aeronautics and Astronautics 1
Transcript of A Computational Analysis of Thermochemical Studies...

45TH Aerospace Sciences Meeting and Exhibit AIAA 2007 – 0121
A Computational Analysis of Thermochemical Studies in the LENS Facilities
Matthew MacLean*
Michael Holden†
Timothy Wadhams*
CUBRC, Aerothermal/Aero-optics Evaluation Center, Buffalo, NY, 14225
Ronald Parker*
Stratonics, Conesus, NY 14435
A review has been presented detailing the comparisons between numerical prediction and experimental data collected in the LENS facilities for a program focusing on thermochemical modeling of the flow in the reflected shock tunnel facility at high enthalpy. Comparisons have been provided for several studies made in the LENS-I facility including fundamental laser diode measurements of freestream nitric oxide concentration, temperature, and velocity; measurements on a two-dimensional cylinder; and measurements of laminar shock-wave/boundary layer interaction on a double cone geometry. The freestream velocity of the facility is found to be predicted to an accuracy of 2.5% or better for well-tailored conditions at all enthalpy levels, but the static temperature is significantly over-predicted for high enthalpy flows. Despite this, good agreement is obtained with all measurements for a two-dimensional cylinder. For the double cone model, the effect of vibration-dissociation coupling with the T-TV and CVDV models has been investigated. The choice of coupling model has impact for the lower enthalpy case, but in the high enthalpy case, it is unclear whether the discrepancy with the measurements is attributable to the coupling in the interaction region or the understanding of the freestream conditions.
I. Introduction xperiments have been performed in the LENS facility during the past year to better assess the capability of both numerical prediction tools and a premier ground test facility to replicate the conditions of flight at very high
enthalpies where thermochemical (“real-gas”) behavior is a dominating effect on the aerothermal and aerodynamic performance of the vehicle. The study is part of a larger work encompassing many of the most difficult problems in hypersonic vehicle design, including real-gas chemistry effects, thermochemical non-equilibrium, laminar shock-wave/boundary layer interaction, boundary layer transition, turbulent shock-wave/boundary layer interaction, and catalytic heating effects on the cold-wall ground test models. The objective of this part of the program has been principally to (1) validate and understand the operation of the facility at high enthalpy conditions of 10MJ/kg and higher, and (2) to generate a database of reliable measurements with which to assess the current computational modeling capabilities in each of these areas. CUBRC uses an integrated approach where the facility experiments and the numerical predictions are tied together to understand the acquired data and validate both facility and codes simultaneously.
E
In this publication, the focus will be primarily on the computational (CFD) predictions that we are making with this dataset on several vehicle configurations to study the influence of the thermochemical modeling (“real-gas” effects) and the ability of our best numerical tools to predict them. The overview of the experimental program is being published concurrently by Holden et al1, so the focus here is on the connectivity of the CFD tools to that experimental data. The major studies conducted in the phases of this program were: (1) interrogation of the freestream state of the facility at high enthalpy via non-intrusive tunable laser diode (TDLAS) techniques to obtain temperature, concentration, and flow velocity information, (2) fundamental measurements of shock shape and surface heating on simple cylinder and hemisphere geometries, (3) measurements of the attached and separated * Senior Research Scientist, AIAA Member. †AAEC Program Manager, AIAA Fellow.
American Institute of Aeronautics and Astronautics
1

45TH Aerospace Sciences Meeting and Exhibit AIAA 2007 – 0121
regions for a laminar/shock-interaction flowfield over a 25/55O double-cone geometry, (4) measurements of transition, control surface effectiveness, and shock-interaction on the wings and body flap of the NASA Space Transport System (STS) vehicle, and (5) measurements of real-gas effects on forebody and wake transition stability for an Apollo-style capsule. A summary of these experiments is given in Fig 1. Both the experimental and computational program are large in scale, so we will focus on some of the most important results and focus on the central themes that tie these measurements together in terms of the capability of the numerical schemes employed to predict the features of the flowfield.
(a) 2D Cylinder Model
(b) 25/55O Double Cone
(c) Shuttle STS Vehicle Model
(d) Measurement Apparatus
for Nitric Oxide Interrogation in Freestream Flow
(e) Computed Effects of Real-Gas Behavior on
Laminar/Turbulent Stability
(f) Measured and Computed Real-Gas Effects on Capsule
Stability Figure 1. Summary of Experiments Performed in the LENS Facility to Study Thermochemical (real-gas) Effects on the Performance of Relevant Hypersonic Vehicles.
II. Experimental Facility Background Currently, CUBRC operates the 48” reflected shock tunnel, the LENS-I and LENS-II reflected shock tunnels2,
and the LENS-X expansion tunnel3. The reflected shock tunnel uses incident and reflected shocks to cleanly heat and pressurize a stagnant test gas to high enthalpy levels. This test gas may then be expanded through a converging-diverging nozzle in a manner similar to a blowdown facility to produce a hypervelocity test flow. Expansion tunnels like LENS-X also operate as short duration facilities, but an expansion tunnel produces a high enthalpy flow without the need to first stagnate the test gas. In an expansion tunnel, the high enthalpy test gas is generated in two stages. In the first stage, the test gas in the driven tube is compressed and heated by a shock, but the moving flow behind the incident shock is not stagnated by a reflected shock as in a reflected shock tunnel. Secondly, additional energy is added
Figure 2. Velocity-Altitude Simulation Capabilities of LENS Shock Tunnel Facilities
American Institute of Aeronautics and Astronautics
2

45TH Aerospace Sciences Meeting and Exhibit AIAA 2007 – 0121
to this moving gas by an unsteady expansion in the acceleration segment of the tunnel to produce a low static temperature, high velocity test gas at a quiescent thermodynamic state like that of a flight condition. The freestream flow, which can be expanded to any test Mach number, is free of frozen, dissociated chemical contamination that can plague reflected shock facilities at enthalpies exceeding 10 MJ/kg. CUBRC employs both reflected shock and expansion tunnels to provide a wide range of supersonic, hypersonic, and hypervelocity test capabilities, which are summarized in Fig 2. A schematic of the three main LENS facilities with basic length scales is given in Fig 3.
The LENS reflected shock-tunnel facilities were developed primarily to study the full-scale, hypervelocity flow physics of interceptors and air-breathing engine configurations. The scale and flow duplication capabilities of LENS are such that these vehicles can be studied at their full scale, inclusive of effects such as transition to turbulence, turbulent mixing from cross-flow jets and thrusters, duplicated flow chemistry and other effects that are difficult or impossible to simulate at cold-flow or sub-scale conditions. Besides aerothermal measurements, extensive studies in this facility have been made using non-intrusive aero-optic and aero-acoustic diagnostics, including recent work with tunable laser-diode diagnostics4,5.
(a) LENS-I Facility
(b) LENS-II Facility
(c) LENS-X Facility Figure 3. Drawings of CUBRC LENS Hypervelocity Shock TunnelFacilities with Nominal Dimensions [all values shown in inches].
III. Supporting Numerical Tools
A. Overview All ground test studies in the LENS facilities are extensively calibrated and validated with numerical tools. The
primary CFD tool used in these efforts is the DPLR code provided by NASA Ames Research Center. DPLR is a multi-block, structured, finite-volume code that solves the reacting Navier-Stokes equations including finite rate chemistry and finite rate vibrational or rotational non-equilibrium effects. This code is based on the data-parallel line relaxation method6 and implements a modified (low dissipation) Steger-Warming flux splitting approach7 for the convection terms and central differencing for the diffusion terms. Finite rate vibrational relaxation is modeled via a harmonic oscillator vibrational degree of freedom8 using the Landau-Teller model9. Vibrational energy relaxation rates are computed by default from the semi-empirical expression due to Millikan and White10, but rates from the work of Camac11 and Park, et al12 are substituted for specific collisions where specific experimental data exists. The time constant for the relaxation rate is limited using a high temperature limiting cross-section method13. Laminar transport properties are appropriately modeled in DPLR for high temperature flow14,15 using the binary collision-integral based mixing rules from Gupta, et al16. Diffusion coefficients are modeled using the self-consistent effective binary diffusion (SCEBD) method17. Turbulence models available in the DPLR code currently include the Baldwin-Lomax 0-equation model18, the Spalart-Allmaras model 1-equation model19, and the Shear Stress Transport (SST) 2-equation model20 each with corrections for compressibility effects21,22.
B. Vibration-Dissociation Coupling Vibration-dissociation coupling in a vibrational non-equilibrium environment is traditionally modeled in the
DPLR code using the popular T-Tv approach of Park23, which couples chemical and thermal non-equilibrium by evaluating the forward rates of dissociation reactions at an effective temperature defined by a weighted average of the translation/rotation temperature and the vibrational temperature (we use the original exponent of 0.5 on both temperatures). For this model, the forward rate for a dissociation reaction therefore looks like:
aTamaF eTCTK /)( βη −= (1)
American Institute of Aeronautics and Astronautics
3
45TH Aerospace Sciences Meeting and Exhibit AIAA 2007 – 0121
This empirical model has been found to work reasonably well for many flows. An excellent review of this and several other models of vibration-dissociation coupling modeling is given by Olejniczak and Candler24.
An alternate family of coupling approaches stems from the coupled vibration-dissociation-vibration (CVDV) model of Marrone and Treanor25. The approach of Marrone and Treanor models the relaxation of a harmonic oscillator cut-off at the dissociation energy of the vibrator by assuming that the thermodynamic relaxation occurs through a series of Boltzmann distributions where the probability of dissociation is weighted with a user-specified temperature U (taken by Marrone and Treanor as one-third the characteristic temperature of the dissociation reaction). An infinitely large value of U implies that dissociation is non-preferential in that a molecule is equally likely to dissociate from any vibrational quantum state, while reducing the value of U increases the preference to dissociate from higher energy states. For the cut-off harmonic oscillator (CHO), a closed-form expression for the series summation of the Boltzmann distribution for the vibrational energy (per unit mass) is computed as follows:
( )11 // −
−−
=VVV TT
VVV e
Re
RTe βθβθ
(2)
Here, β is D/k or the characteristic temperature of the dissociation reaction. The forward rate constant of the dissociation reaction is modified from the equilibrium Arrhenius expression by a factor defined in the following:
[ Tm
V
FEQFVVF eTC
UQTQTQTQTKUTTUTTK /
)()()()()(*),,(),,( βη −⎥⎦
⎤⎢⎣
⎡−
=Φ= ] (3)
where Q(x) is the vibrational partition function for the CHO, defined as:
x
x
VeexQ /
/
11)( θ
β
−
−
−−
= (4)
The quantity TF is the average temperature at which energy is removed by dissociation of the molecules, which is:
UTTT VF
1111−−≡ (5)
The most interesting feature of the CVDV approach is discussed thoroughly by Knab, et al26. This feature is the fact that a physically consistent approach to vibration-dissociation coupling requires that the assumed change to the rate of dissociation from its thermal equilibrium state implies something about the rate at which vibrational energy is created and removed by dissociation and recombination. Thus, models like CVDV are true vibration-dissociation-vibration models, where the chemical relaxation is coupled to the vibrational relaxation and vice versa. This is not true of the T-TV model, which is empirical in nature. In the case of CVDV, the average energy removed by dissociation is
)( FVDV Tee = (6)
and the average energy reclaimed by recombination is: )( Uee V
RV −= (7)
Note that in the CVDV model, the chemical acceleration only occurs for dissociation reactions. Several generalizations exist to this methodology that extend the baseline model to include effects like exchange reactions, such as the CVCV26,27 and CVDEV28,29 models. As a beginning effort, we have considered only the CVDV baseline model of Marrone and Treanor, but incorporation of such additional features can easily be made.
C. Surface Catalysis Surface catalysis is also a central issue in the study of real-gas effects in ground test environments. We have
already shown the effects of catalysis on the measured heat transfer in a shock tunnel environment for a CO2 test gas30, where catalytic heating can be as large in magnitude as the convective heating. In air, the effects are not as dramatic, but it can still be significant. To model the effects of catalytic heating numerically, two extremes exist. The non-catalytic wall boundary condition provides the lowest level of surface heating. The super-catalytic boundary condition provides the highest possible level of heating because the mixture is returned to its lowest possible chemical energy state at the wall, meaning that the maximum amount of chemical energy has been returned to the other energy modes. The super-catalytic boundary is non-physical in that it does not identify a specific mechanism by which the recombination occurs, but assumes that it has occurred by some unidentified process without consideration of rate mechanics. In the case of short-duration facilities like LENS, the surface temperature of the model never rises appreciably above room temperature, so the super-catalytic condition corresponds to a fully-accommodated chemical state in both CO2 and air.
American Institute of Aeronautics and Astronautics
4
45TH Aerospace Sciences Meeting and Exhibit AIAA 2007 – 0121
The DPLR code provides several models of finite-rate surface reactions for a variety of thermal protection and ground test materials, but the levels of catalysis predicted using these models generally under-predict the level of catalysis observed in the experimental measurements. Several careful experimental studies by Myerson31 and Hartunian and Thompson32,33 among others have demonstrated this effect in shock tunnel environments on metal surfaces. Currently, a satisfactory model of the detailed rate processes causing the observed catalysis effects on surface heat transfer is unknown.
D. Simulation of Nozzle Flowfield Additionally, a specialized code has been developed by Candler34 to compute the nozzle flowfield for a high-
pressure, high-enthalpy ground test facility. This code shares much of its heritage with the NASA Ames DPLR code (described in A above) as it employs the same flux splitting and time integration treatments. The nozzle code has been streamlined by hardwiring parts of the algorithm to solve for a single-block, axisymmetric nozzle with fixed boundary conditions. These modifications lead to a substantial decrease in required solution time and allow us to compute the nozzle flowfield in the same length of time that it requires to set-up and make a run in the LENS facilities (about 2 hours). The nozzle code employs the Spalart-Allmaras19 one-equation turbulence model with the Catris and Aupoix compressibility correction22. This turbulence formulation has been shown to adequately predict the displacement of the turbulent boundary layer in the throat region of the nozzle and subsequent boundary layer distortion caused by the rapid reduction in local Reynolds number in the diverging section of the nozzle. We have demonstrated this agreement through comparisons with measured Pitot pressure profiles in the freestream in several previous publications35.
IV. Results of Comparisons with Freestream Facility Diagnostics Studies The most fundamental aspect of this program is in the diagnostic interrogation of the shock tunnel facility itself.
This has been accomplished through a program integrating non-intrusive diagnostics into the operation of the facility. The main diagnostic is the interrogation of ground state nitric oxide. The laser employed in these studies is an Alpes Lasers, Inc. distributed feedback quantum cascade laser probing a fundamental rovibrational transition of the nitric oxide molecule at 5.448 microns. We obtain several simultaneous pieces of information using these techniques – flow establishment and steady state flow time in the facility, concentration of ground state nitric oxide (based on the integral of the doublet absorption feature), molecular translational temperature (based on a comparison of the high-resolution data to the well-known Voigt line shape for the best-fit temperature), rotational temperature (based on the absorption ratio for multiple lines of isotopomers of NO), and flow velocity (based on the Doppler wavelength shift for a dual beam measurement). The experimental arrangement for these measurements and the detailed results are described by Parker, et al4,5
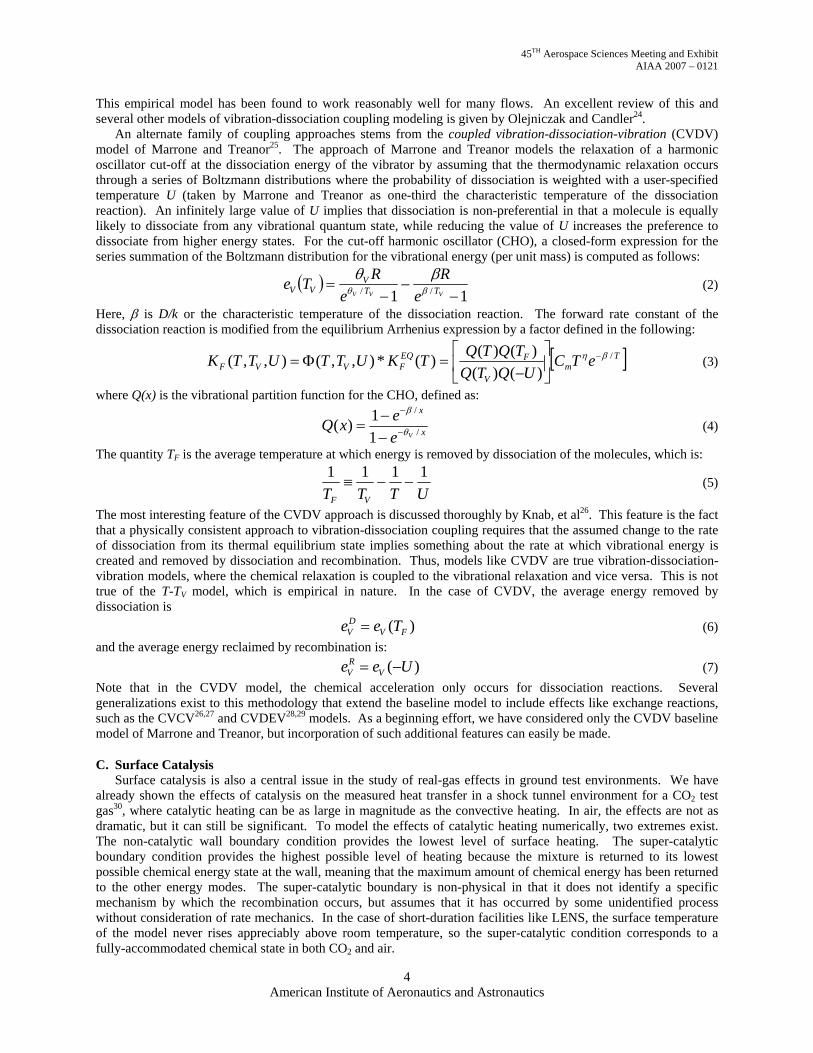
For two typical runs at facility total enthalpies of nominally 5MJ/kg and 10MJ/kg, the results of the non-intrusive measurements were compared to computations performed using Candler’s nozzle code with the chemical and thermodynamic models described in §III. For the 5MJ/kg case, the comparison with the measured Pitot pressure profile across the test section is shown in Fig 4 for two models of vibrational relaxation. First, the vibrational relaxation was modeled with only the semi-empirical formula of Millikan and White10. These rates have been used successfully to model the expansion of pure nitrogen with vibrational non-equilibrium for low enthalpy code validation exercises. Pure nitrogen is a relatively slow relaxer of vibrational energy, so a significant percentage of vibrational energy remains in the freestream flow. With the additional collision partners afforded in reacting air, however, the rates predicted by Millikan-White have been observed to be slower than those observed in experiment. The augmented rates summarized by Park, et al12 are substituted in the second computational result, which predictsfreestream plane. From the measured Pitot profile, the augmwith the shape and structure of the profile. The inflection in
American Institute of Aerona
5
Figure 4. Comparison of Measured Pitot Pressureof Facility Freestream with Computation usingMillikan-White10 and Alternate12 Rate Methods
a condition very close to vibrational equilibrium at theented rates are observed to have a better agreement the center of the flow seen with the Millikan-White
utics and Astronautics
45TH Aerospace Sciences Meeting and Exhibit AIAA 2007 – 0121
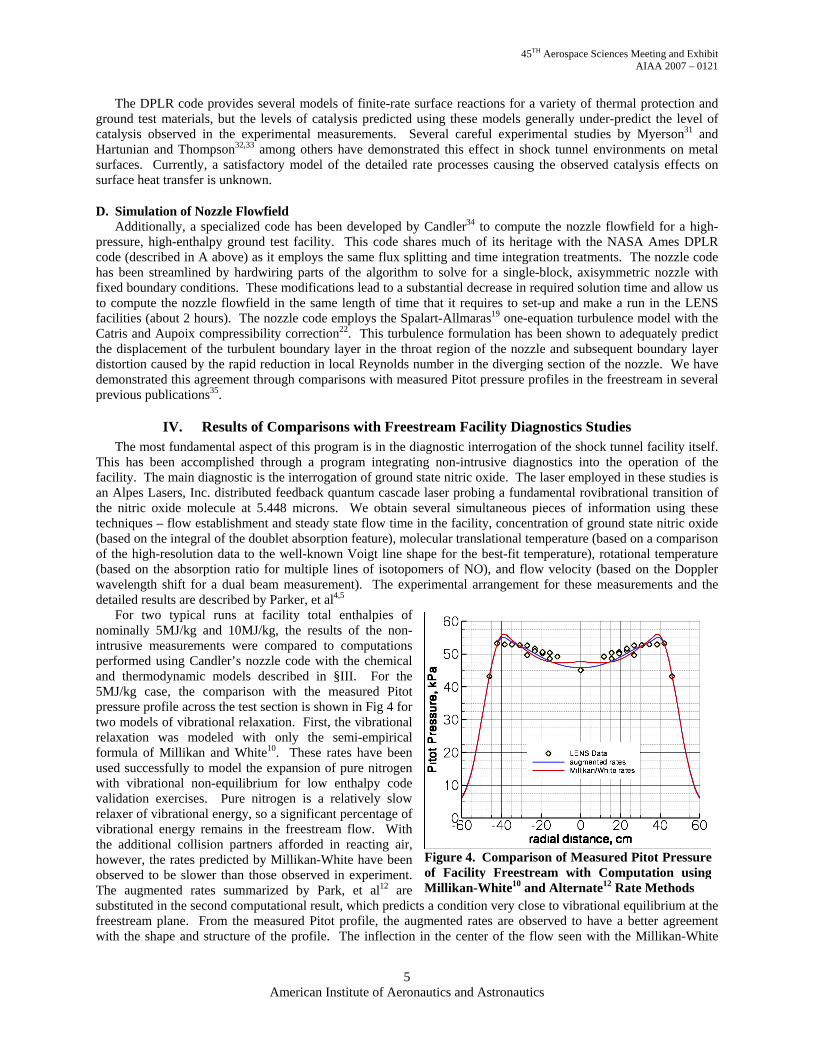
rates is not observed in the data. Thus, we can say that in an averaged sense, the augmented rates produce a better prediction of the freestream of the LENS facility than using Millikan-White alone. The comparisons with the measured Pitot profiles for both the 5MJ/kg and 10MJ/kg cases are shown in Fig 5 using the augmented rates, indicating that the augmented rates are adequate for both instances.
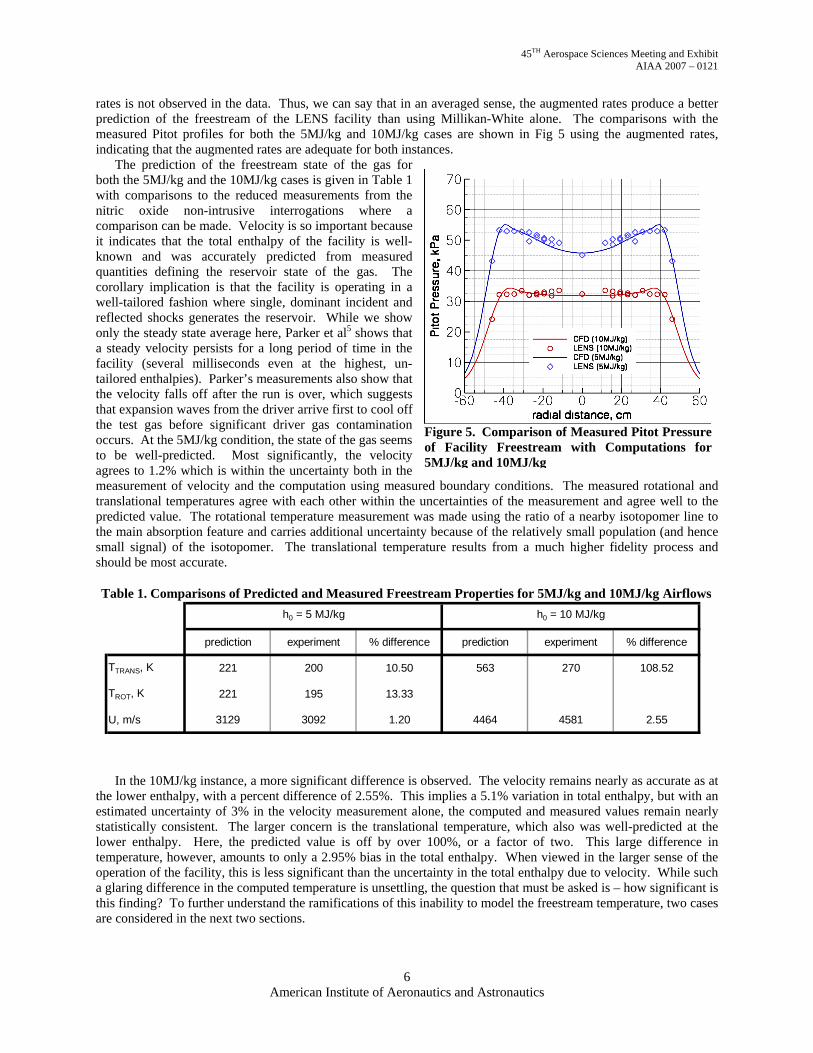
The prediction of the freestream state of the gas for both the 5MJ/kg and the 10MJ/kg cases is given in Table 1 with comparisons to the reduced measurements from the nitric oxide non-intrusive interrogations where a comparison can be made. Velocity is so important because it indicates that the total enthalpy of the facility is well-known and was accurately predicted from measured quantities defining the reservoir state of the gas. The corollary implication is that the facility is operating in a well-tailored fashion where single, dominant incident and reflected shocks generates the reservoir. While we show only the steady state average here, Parker et al5 shows that a steady velocity persists for a long period of time in the facility (several milliseconds even at the highest, un-tailored enthalpies). Parker’s measurements also show that the velocity falls off after the run is over, which suggests that expansion waves from the driver arrive first to cool off the test gas before significant driver gas contamination occurs. At the 5MJ/kg condition, the state of the gas seems to be well-predicted. Most significantly, the velocity agrees to 1.2% which is within the uncertainty both in the measurement of velocity and the computation using measuretranslational temperatures agree with each other within the upredicted value. The rotational temperature measurement wathe main absorption feature and carries additional uncertaintysmall signal) of the isotopomer. The translational temperashould be most accurate.
In the 10MJ/kg instance, a more significant difference is othe lower enthalpy, with a percent difference of 2.55%. This estimated uncertainty of 3% in the velocity measurement alostatistically consistent. The larger concern is the translationlower enthalpy. Here, the predicted value is off by over temperature, however, amounts to only a 2.95% bias in the tooperation of the facility, this is less significant than the uncerta glaring difference in the computed temperature is unsettlingthis finding? To further understand the ramifications of this inare considered in the next two sections.
Table 1. Comparisons of Predicted and Measured Freestr
prediction experiment % difference
TTRANS, K 221 200 10.50
TROT, K 221 195 13.33
U, m/s 3129 3092 1.20
h0 = 5 MJ/kg
American Institute of Aerona
6
Figure 5. Comparison of Measured Pitot Pressureof Facility Freestream with Computations for5MJ/kg and 10MJ/kg
d boundary conditions. The measured rotational and ncertainties of the measurement and agree well to the s made using the ratio of a nearby isotopomer line to because of the relatively small population (and hence ture results from a much higher fidelity process and
bserved. The velocity remains nearly as accurate as at implies a 5.1% variation in total enthalpy, but with an ne, the computed and measured values remain nearly al temperature, which also was well-predicted at the 100%, or a factor of two. This large difference in tal enthalpy. When viewed in the larger sense of the
ainty in the total enthalpy due to velocity. While such , the question that must be asked is – how significant is ability to model the freestream temperature, two cases
eam Properties for 5MJ/kg and 10MJ/kg Airflows
prediction experiment % difference
563 270 108.52
4464 4581 2.55
h0 = 10 MJ/kg
utics and Astronautics

45TH Aerospace Sciences Meeting and Exhibit AIAA 2007 – 0121
V. Results of 2D Cylinder Computations for Facility and Code Validation The first model geometry considered in this study of computational capabilities to predict the effects of
thermochemical non-equilibrium focuses on a 2D cylinder. The cylinder model is shown is Fig 1(a). The two dimensional flow provides better boundary conditions and more straightforward visualization than for axisymmetric bodies and serves as a useful test case for both facility and code validation. The flowfield over a similar 2D cylinder has been studied by Sebastian, et al36. Our 2D cylinder has a 4.45cm (1.750”) radius and is 38.10cm (15.000”) in span, which is similar in size to theirs. The model contains adjacent rows of pressure gages, thin-film heat transfer gages, and Medtherm coaxial thermocouple gages located at angular increments near the span-wise centerline of the model. Two test conditions are considered at the nominal enthalpy levels covered in the previous section. Freestream conditions were computed as in the previous section and are listed in Table 2. The flow is reasonably uniform and parallel over a body of this size in the facility, so only the average conditions have been shown or used to compute the flowfield. The computational grid is 256 x 192 cells and is adapted to place nearly all the points in the shock layer and maintain a cell Reynolds number close to 1.0 using DPLR’s built-in grid adaptation capabilities. This grid contains more points than is required to accurately compute the flow, but the problem converges quickly enough that extra cells do not waste much time. The flow over the model has been computed using a two-dimensional representation by neglecting end effects, which are not relevant in the center.
For Case A, at a total enthalpy of 4.99 MJ/kg, the results from the previous section showed that both the velocity and temperatures for this enthalpy are well-characterized by the current simulation methodology. Thus, all the energy is accounted for in the freestream. In Fig 6, the comparison of the surface pressure over the model shows excellent agreement with the predicted distribution, which is consistent with the results for the Pitot pressure comparisons shown in Fig 5 for this type of flow. Of more interest is the heat transfer comparison, which is shown in Fig 7. Here, the two extreme models for surface heat transfer have been computed with DPLR. For this flowfield, the non-catalytic wall underpredicts the measured heat transfer by 20 W/cm2 while the super-catalytic model which enforces complete recombination at the wall predicts the measured level accurately. These measured were made simultaneously with two types of instrumentation – thin-film gages which are a platinum resistance thermometer on a pyrex substrate and a chromel/constantan thermocouple from Medtherm. Particularly at the
Table 2. Summary of Freestream Conditions used for 2D Cylinder Cases h0, MJ/kg U, m/s T, K TV, K ρN2, kg/m3 ρO2, kg/m3 ρNO, kg/m3 ρN, kg/m3 ρO, kg/m3
case A 4.99 3,028 220 456 3.99E-3 1.11E-3 3.30E-4 0.00E+0 1.90E-6
case B 11.04 4,464 656 715 2.80E-3 7.23E-4 2.06E-4 0.00E+0 5.89E-5
Figure 6. Comparison of Measured SurfacePressure with Computed Pressure for 2D CylinderCase A (5MJ/kg)
Figure 7. Comparison of Measured Surface Heat Transfer with Computed Level for 2D Cylinder Case A (5MJ/kg)
American Institute of Aeronautics and Astronautics
7
45TH Aerospace Sciences Meeting and Exhibit AIAA 2007 – 0121
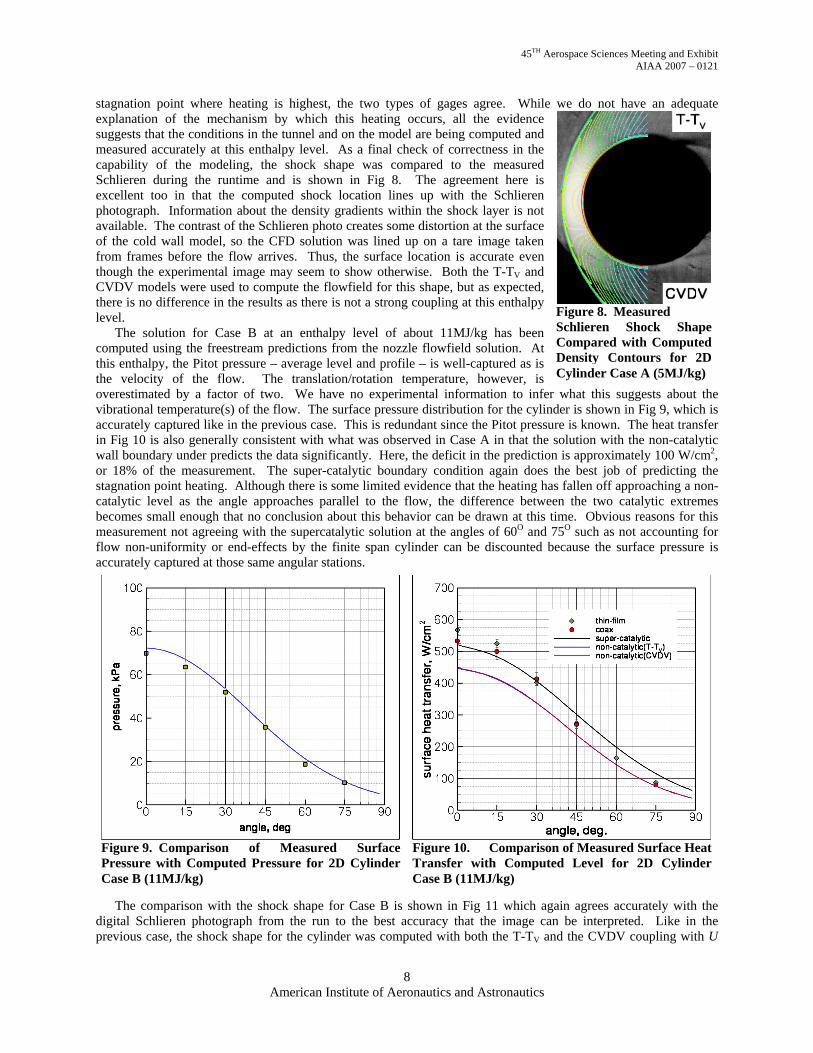
stagnation point where heating is highest, the two types of gages agree. While we do not have an adequate explanation of the mechanism by which this heating occurs, all the evidence suggests that the conditions in the tunnel and on the model are being computed and measured accurately at this enthalpy level. As a final check of correctness in the capability of the modeling, the shock shape was compared to the measured Schlieren during the runtime and is shown in Fig 8. The agreement here is excellent too in that the computed shock location lines up with the Schlieren photograph. Information about the density gradients within the shock layer is not available. The contrast of the Schlieren photo creates some distortion at the surface of the cold wall model, so the CFD solution was lined up on a tare image taken from frames before the flow arrives. Thus, the surface location is accurate even though the experimental image may seem to show otherwise. Both the T-TV and CVDV models were used to compute the flowfield for this shape, but as expected, there is no difference in the results as there is not a strong coupling at this enthalpy level.
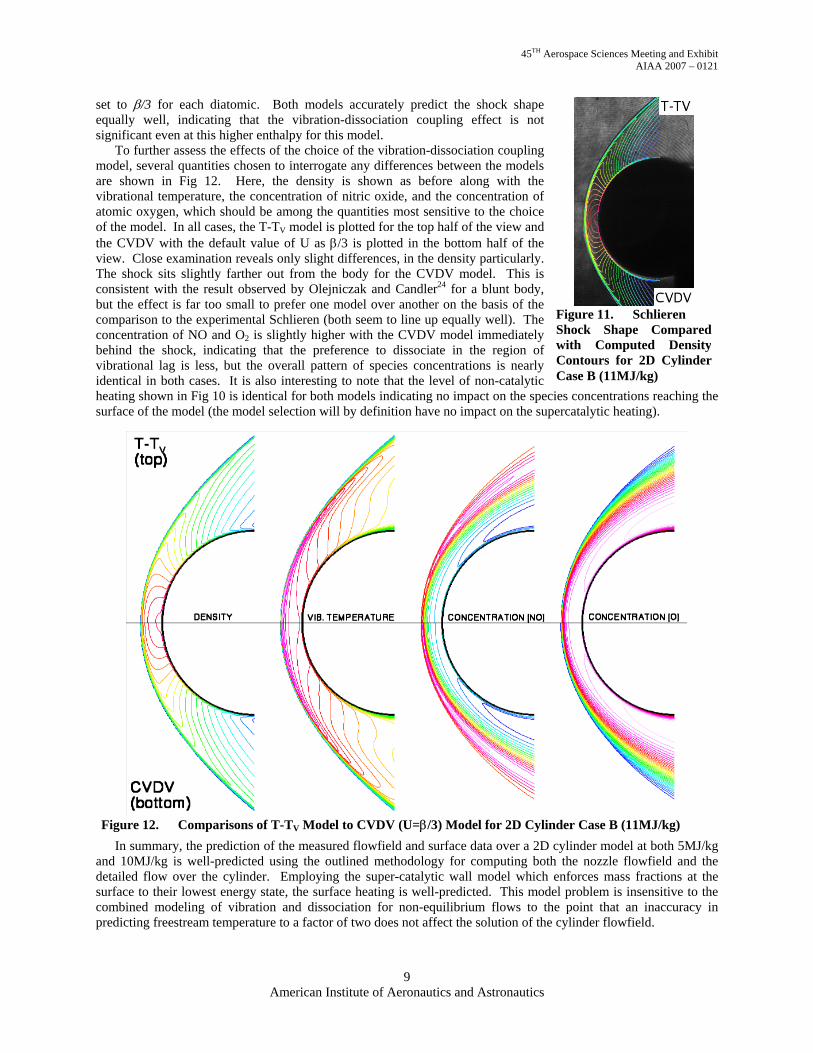
The solution for Case B at an enthalpy level of about 11MJ/kg has been computed using the freestream predictions from the nozzle flowfield solution. At this enthalpy, the Pitot pressure – average level and profile – is well-captured as is the velocity of the flow. The translation/rotation temperature, however, is overestimated by a factor of two. We have no experimental information to infer what this suggests about the vibrational temperature(s) of the flow. The surface pressure distribution for the cylinder is shown in Fig 9, which is accurately captured like in the previous case. This is redundant since the Pitot pressure is known. The heat transfer in Fig 10 is also generally consistent with what was observed in Case A in that the solution with the non-catalytic wall boundary under predicts the data significantly. Here, the deficit in the prediction is approximately 100 W/cm2, or 18% of the measurement. The super-catalytic boundary condition again does the best job of predicting the stagnation point heating. Although there is some limited evidence that the heating has fallen off approaching a non-catalytic level as the angle approaches parallel to the flow, the difference between the two catalytic extremes becomes small enough that no conclusion about this behavior can be drawn at this time. Obvious reasons for this measurement not agreeing with the supercatalytic solution at the angles of 60O and 75O such as not accounting for flow non-uniformity or end-effects by the finite span cylinder can be discounted because the surface pressure is accurately captured at those same angular stations.
The comparison with the shock shape for Case B is shown in Fig 11 which again agrees accurately with the digital Schlieren photograph from the run to the best accuracy that the image can be interpreted. Like in the previous case, the shock shape for the cylinder was computed with both the T-TV and the CVDV coupling with U
Figure 8. Measured Schlieren Shock Shape Compared with Computed Density Contours for 2D Cylinder Case A (5MJ/kg)
Figure 9. Comparison of Measured SurfacePressure with Computed Pressure for 2D CylinderCase B (11MJ/kg)
Figure 10. Comparison of Measured Surface Heat Transfer with Computed Level for 2D Cylinder Case B (11MJ/kg)
American Institute of Aeronautics and Astronautics
8
45TH Aerospace Sciences Meeting and Exhibit AIAA 2007 – 0121
set to β/3 for each diatomic. Both models accurately predict the shock shape equally well, indicating that the vibration-dissociation coupling effect is not significant even at this higher enthalpy for this model.
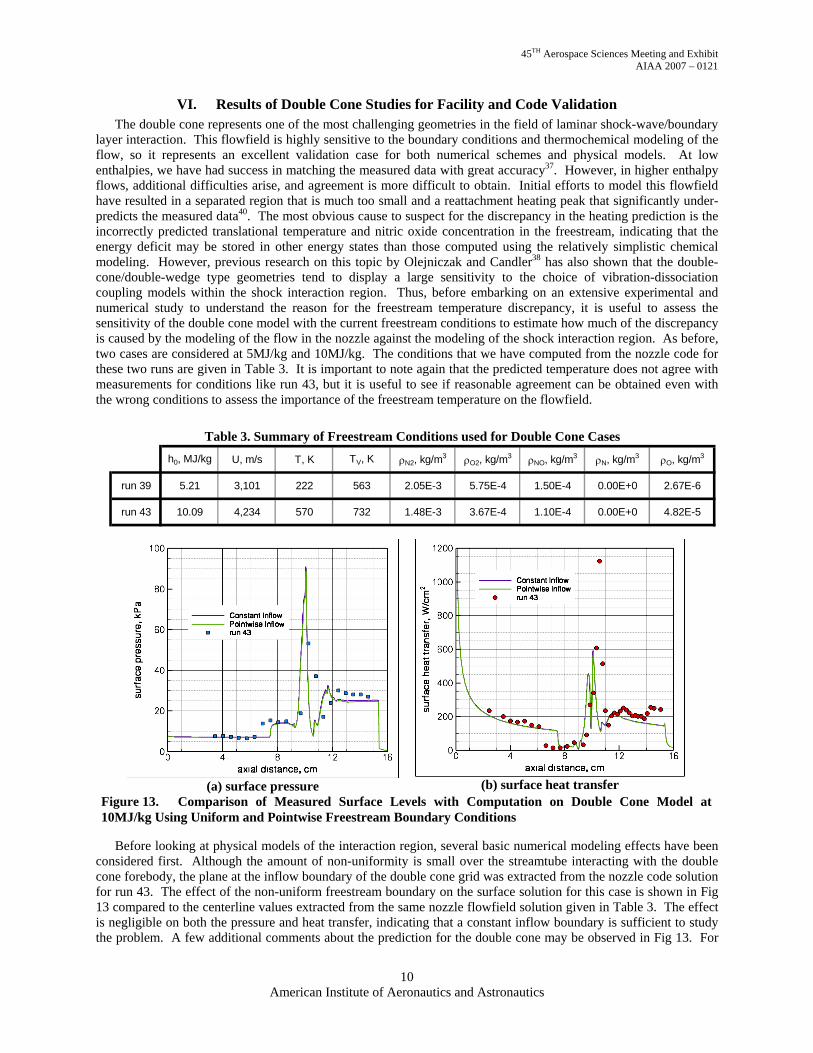
To further assess the effects of the choice of the vibration-dissociation coupling model, several quantities chosen to interrogate any differences between the models are shown in Fig 12. Here, the density is shown as before along with the vibrational temperature, the concentration of nitric oxide, and the concentration of atomic oxygen, which should be among the quantities most sensitive to the choice of the model. In all cases, the T-TV model is plotted for the top half of the view and the CVDV with the default value of U as β/3 is plotted in the bottom half of the view. Close examination reveals only slight differences, in the density particularly. The shock sits slightly farther out from the body for the CVDV model. This is consistent with the result observed by Olejniczak and Candler24 for a blunt body, but the effect is far too small to prefer one model over another on the basis of the comparison to the experimental Schlieren (both seem to line up equally well). The concentration of NO and O2 is slightly higher with the CVDV model immediately behind the shock, indicating that the preference to dissociate in the region of vibrational lag is less, but the overall pattern of species concentrations is nearly identical in both cases. It is also interesting to note that the level of non-catalytic heating shown in Fig 10 is identical for both models indicating no impact on the species concentrations reaching the surface of the model (the model selection will by definition have no impact on the supercatalytic heating).
In summary, the prediction of the measured flowfield and surface data over a 2D cylinder model at both 5MJ/kg and 10MJ/kg is well-predicted using the outlined methodology for computing both the nozzle flowfield and the detailed flow over the cylinder. Employing the super-catalytic wall model which enforces mass fractions at the surface to their lowest energy state, the surface heating is well-predicted. This model problem is insensitive to the combined modeling of vibration and dissociation for non-equilibrium flows to the point that an inaccuracy in predicting freestream temperature to a factor of two does not affect the solution of the cylinder flowfield.
Figure 11. Schlieren Shock Shape Compared with Computed Density Contours for 2D Cylinder Case B (11MJ/kg)
Figure 12. Comparisons of T-TV Model to CVDV (U=β/3) Model for 2D Cylinder Case B (11MJ/kg)
American Institute of Aeronautics and Astronautics
9
45TH Aerospace Sciences Meeting and Exhibit AIAA 2007 – 0121
VI. Results of Double Cone Studies for Facility and Code Validation The double cone represents one of the most challenging geometries in the field of laminar shock-wave/boundary
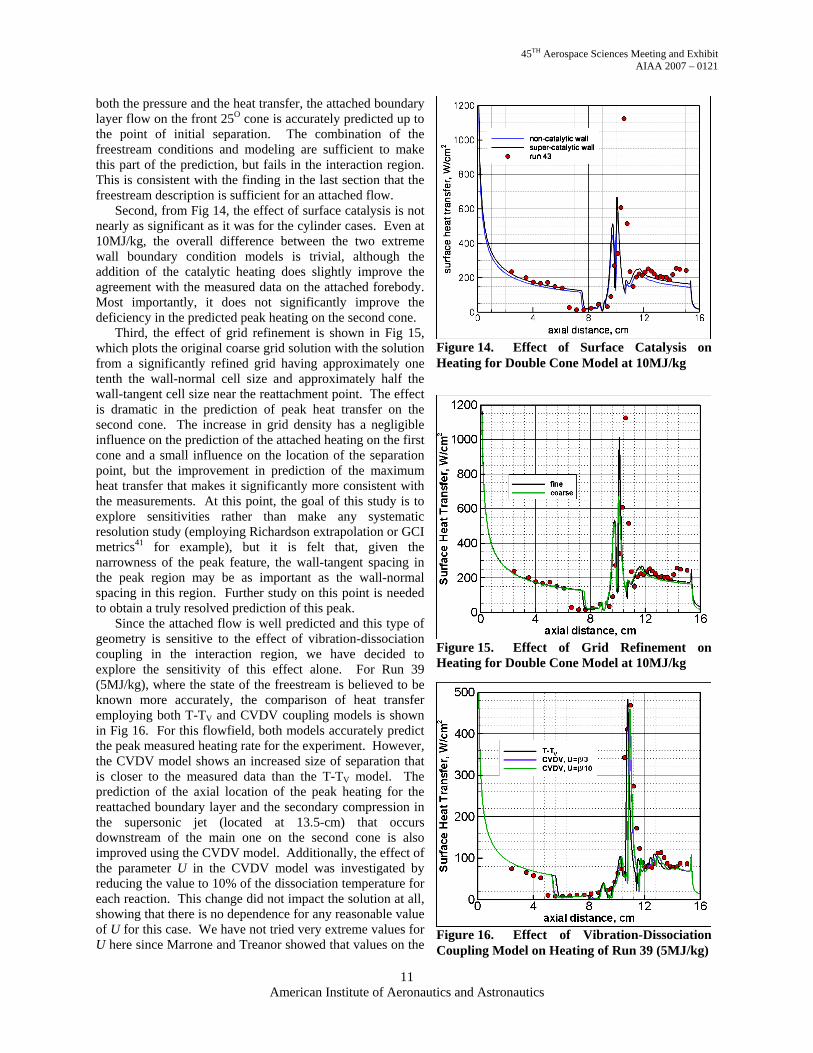
layer interaction. This flowfield is highly sensitive to the boundary conditions and thermochemical modeling of the flow, so it represents an excellent validation case for both numerical schemes and physical models. At low enthalpies, we have had success in matching the measured data with great accuracy37. However, in higher enthalpy flows, additional difficulties arise, and agreement is more difficult to obtain. Initial efforts to model this flowfield have resulted in a separated region that is much too small and a reattachment heating peak that significantly under-predicts the measured data40. The most obvious cause to suspect for the discrepancy in the heating prediction is the incorrectly predicted translational temperature and nitric oxide concentration in the freestream, indicating that the energy deficit may be stored in other energy states than those computed using the relatively simplistic chemical modeling. However, previous research on this topic by Olejniczak and Candler38 has also shown that the double-cone/double-wedge type geometries tend to display a large sensitivity to the choice of vibration-dissociation coupling models within the shock interaction region. Thus, before embarking on an extensive experimental and numerical study to understand the reason for the freestream temperature discrepancy, it is useful to assess the sensitivity of the double cone model with the current freestream conditions to estimate how much of the discrepancy is caused by the modeling of the flow in the nozzle against the modeling of the shock interaction region. As before, two cases are considered at 5MJ/kg and 10MJ/kg. The conditions that we have computed from the nozzle code for these two runs are given in Table 3. It is important to note again that the predicted temperature does not agree with measurements for conditions like run 43, but it is useful to see if reasonable agreement can be obtained even with the wrong conditions to assess the importance of the freestream temperature on the flowfield.
Before looking at physical models of the interaction region, several basic numerical modeling effects have been considered first. Although the amount of non-uniformity is small over the streamtube interacting with the double cone forebody, the plane at the inflow boundary of the double cone grid was extracted from the nozzle code solution for run 43. The effect of the non-uniform freestream boundary on the surface solution for this case is shown in Fig 13 compared to the centerline values extracted from the same nozzle flowfield solution given in Table 3. The effect is negligible on both the pressure and heat transfer, indicating that a constant inflow boundary is sufficient to study the problem. A few additional comments about the prediction for the double cone may be observed in Fig 13. For
(a) surface pressure
(b) surface heat transfer
Figure 13. Comparison of Measured Surface Levels with Computation on Double Cone Model at 10MJ/kg Using Uniform and Pointwise Freestream Boundary Conditions
Table 3. Summary of Freestream Conditions used for Double Cone Cases h0, MJ/kg U, m/s T, K TV, K ρN2, kg/m3 ρO2, kg/m3 ρNO, kg/m3 ρN, kg/m3 ρO, kg/m3
run 39 5.21 3,101 222 563 2.05E-3 5.75E-4 1.50E-4 0.00E+0 2.67E-6
run 43 10.09 4,234 570 732 1.48E-3 3.67E-4 1.10E-4 0.00E+0 4.82E-5
American Institute of Aeronautics and Astronautics
10
45TH Aerospace Sciences Meeting and Exhibit AIAA 2007 – 0121
both the pressure and the heat transfer, the attached boundary layer flow on the front 25O cone is accurately predicted up to the point of initial separation. The combination of the freestream conditions and modeling are sufficient to make this part of the prediction, but fails in the interaction region. This is consistent with the finding in the last section that the freestream description is sufficient for an attached flow.
Second, from Fig 14, the effect of surface catalysis is not nearly as significant as it was for the cylinder cases. Even at 10MJ/kg, the overall difference between the two extreme wall boundary condition models is trivial, although the addition of the catalytic heating does slightly improve the agreement with the measured data on the attached forebody. Most importantly, it does not significantly improve the deficiency in the predicted peak heating on the second cone.
Third, the effect of grid refinement is shown in Fig 15, which plots the original coarse grid solution with the solution from a significantly refined grid having approximately one tenth the wall-normal cell size and approximately half the wall-tangent cell size near the reattachment point. The effect is dramatic in the prediction of peak heat transfer on the second cone. The increase in grid density has a negligible influence on the prediction of the attached heating on the first cone and a small influence on the location of the separation point, but the improvement in prediction of the maximum heat transfer that makes it significantly more consistent with the measurements. At this point, the goal of this study is to explore sensitivities rather than make any systematic resolution study (employing Richardson extrapolation or GCI metrics41 for example), but it is felt that, given the narrowness of the peak feature, the wall-tangent spacing in the peak region may be as important as the wall-normal spacing in this region. Further study on this point is needed to obtain a truly resolved prediction of this peak.
Since the attached flow is well predicted and this type of geometry is sensitive to the effect of vibration-dissociation coupling in the interaction region, we have decided to explore the sensitivity of this effect alone. For Run 39 (5MJ/kg), where the state of the freestream is believed to be known more accurately, the comparison of heat transfer employing both T-TV and CVDV coupling models is shown in Fig 16. For this flowfield, both models accurately predict the peak measured heating rate for the experiment. However, the CVDV model shows an increased size of separation that is closer to the measured data than the T-TV model. The prediction of the axial location of the peak heating for the reattached boundary layer and the secondary compression in the supersonic jet (located at 13.5-cm) that occurs downstream of the main one on the second cone is also improved using the CVDV model. Additionally, the effect of the parameter U in the CVDV model was investigated by reducing the value to 10% of the dissociation temperature for each reaction. This change did not impact the solution at all, showing that there is no dependence for any reasonable value of U for this case. We have not tried very extreme values for U here since Marrone and Treanor showed that values on the
Figure 14. Effect of Surface Catalysis on Heating for Double Cone Model at 10MJ/kg
Figure 15. Effect of Grid Refinement on Heating for Double Cone Model at 10MJ/kg
American Institute of Aeronautics and Astronautics
11
Figure 16. Effect of Vibration-Dissociation Coupling Model on Heating of Run 39 (5MJ/kg)

45TH Aerospace Sciences Meeting and Exhibit AIAA 2007 – 0121
order of magnitude of the dissociation temperature best fit the behavior of the gas.
The reason for the change in separated region when employing the CVDV model is explored further in Fig 17, which plots the flowfield contour patterns of vibrational temperature minus translational temperature, molecular oxygen mole fraction, and nitric oxide mole fraction. In each vertical panel, the T-TV model result is plotted on top and the CVDV result (U=β/3) is plotted on the bottom. The scales are identical between the two physical models (the scale is shown only once), and the view is centered on the separated region of the first cone and the corner where the most significant differences are observed. The first panel plotting the difference between vibrational and translational temperatures is an unusual quantity. This value is qualitatively proportional to the driving potential in the V-T source term, but the significance is with regard to the effective ratio of the forward dissociation rate for the non-equilibrium environment to the equilibrium value. In cases where the vibrational temperature is lower than the translational temperature, as it is in much of this region, the CVDV model will predict a forward dissociation rate that is lower than the T-TV model for the same temperatures. The lagging vibrational temperature behind the separation shock results in less tendency to dissociate or more tendency to recombine for the CVDV model. This is exactly the result demonstrated by Druguet, et al42 who were able to show that lowering the forward kinetic rate relative to the backward kinetic rate (by intentionally altering the equilibrium constant for the reaction) increases the separation region size exactly like this. In her words, the increased preference to recombine results in a more energetic separated region that grows in size.
The second and third panels show changes in both molecular oxygen and nitric oxide levels in this region, indicating that both dissociation reactions are playing a role in the separation length. It is important to remember that the exchange reactions have not been augmented for the non-equilibrium environment in this analysis so far, and the predicted concentrations of nitric oxide will be heavily dependent on the Zeldovich reactions.
The same comparisons were repeated for the high enthalpy case run, 43. At 10MJ/kg, the comparison between the T-TV and CVDV models shows that the difference is less pronounced than shown by the lower enthalpy case demonstrated in Fig 18. For this condition, the CVDV model applied to the three dissociation reactions does not significantly enhance the separation region size. The flowfield in the corner of the flowfield is not shown as it looks generally similar to that already shown in run 39. In the same manner as shown for run 39, the vibrational temperature lags the translational temperature behind the separation shock, tending to promote recombination more for the CVDV model than for the T-TV model, but here the temperatures are high enough that oxygen recombination participates less in the process than it did for run 39. Thus, at this enthalpy, it may be even more important to
Figure 17. Comparison of Separated Region Flowfields Predicted by T-TV (top) and CVDV (bottom) Models for Run 39 (5MJ/kg)
American Institute of Aeronautics and Astronautics
12

45TH Aerospace Sciences Meeting and Exhibit AIAA 2007 – 0121
understand the implications of augmentation of the exchange reactions for a thermally non-equilibrium environment. For this case, there is a very small effect of the choice of U when it was varied between values of β/3 and β/10, but neither choice of U makes the CVDV model perform significantly different than the T-TV baseline.
Finally, the summary of the predictions for surface pressure and surface heat transfer are given in Figs 19 and 20 for runs 39 and 43 respectively. Shown in each case are two solutions – the solution that best matches the data combining the lessons learned for grid resolution, numerics, and vibration-dissociation coupling, and the original, poor solution as a reference. While these improvements in the modeling have significantly improved the overall capture of the measured trends, some inconsistencies remain. For run 39, the peak heating rate is well-predicted, but the length of separated region on the forebody remains somewhat shorter than measured. We believe, however, that the freestream conditions are relatively well-known for this case, so the deficiency lies largely in the modeling of the thermochemical coupling of the physical model. The CVDV model
Figure 18. Effect of Vibration-Dissociation Coupling Model on Run 43 (10MJ/kg)
(a) surface pressure
(b) surface heat transfer
Figure 20. Summary of Prediction of Surface Data from Run 43 (10MJ/kg)
(a) surface pressure
(b) surface heat transfer
Figure 19. Summary of Prediction of Surface Data from Run 39 (5MJ/kg)
American Institute of Aeronautics and Astronautics
13

45TH Aerospace Sciences Meeting and Exhibit AIAA 2007 – 0121
applied to this case has shown that at least some benefit may be realized by employing a physically consistent model and we hope that additional improvements in this modeling may further improve the agreement with the data. More importantly, precisely because the freestream state is better known, run 39 serves as a useful test case for understanding the higher enthalpy run 43 deficiencies. In other words, run 39 can be used to screen physical and numerical modeling candidates until a successful match can be found that accurately represents the solution to the data in a physically meaningful way. Then, this set of models can be applied to run 43, and if a deficiency in the solution accuracy exists, it may be better argued that it is attributable to the state of the freestream that is not completely understood. This process has been started here and is ongoing as better physical models are incorporated into the DPLR code.
VII. Discussion and Conclusions The experimental studies of high enthalpy flows including the effects of thermochemical non-equilibrium on
important aspects in hypersonic vehicle design that has been performed in the LENS facilities in the past year is large in scope. The volume of data collected on a variety of vehicle shapes is enough to keep any good computationalist working for many years (indeed perhaps a lifetime) to thoroughly investigate and understand all of the results. In this work, we have selected a subset of the results that concentrates most directly on the basic operation of the facility itself and demonstrates the most fundamental aspects of the physics of high enthalpy problems. This analysis included the comparisons of measurements to the predictions for freestream velocity and temperatures of nitric oxide, the predictions of the flowfield over a blunt, two-dimensional cylinder, and the predictions of the laminar, shock-interaction flowfield over the double cone geometry. Although this analysis is ongoing, several things have been learned.
The analysis of the freestream properties made by measuring nitric oxide absorption have shown that the facility is operating at the target total enthalpy levels for conditions at 5 and 10 MJ/kg. In hypersonic facilities, the dominant part of the total enthalpy of the flow is kinetic energy, and the velocity has been shown to be predicted to within 2.5% or better for well-tailored flows. While a sample of runs has been shown here, these measurements have been made for multiple runs, which all show the same level of accuracy. Further, the analysis of the time history of the velocity measurements have shown that the flow maintains a steady velocity for a duration of time as long as or exceeding the published available test times in the facility before the arrival of expansion waves at the reservoir endwall. The freestream static temperature is also well characterized at the 5MJ/kg enthalpy level, but at 10MJ/kg the measurements indicate a temperature that is approximately half of the predicted level. For this condition, measured values of 270K versus predicted values of 570K are typical. This indicates that energy is stored by some other mechanism in the freestream that is yet unknown. However, the percentage of unaccounted energy in the prediction is only 3% of the total enthalpy. The importance of this inconsistency in the modeling is unknown.
The flowfield and surface measurements over a two-dimensional cylinder have been analyzed for typical conditions at 5 and 10 MJ/kg total enthalpy levels. Inclusive of the partial chemically-frozen state of the freestream for both of these conditions, the shock shape, surface pressure, and surface heating are accurately predicted at both the lower and higher enthalpies. Since the inaccuracy in the predicted static temperature of the freestream at 10 MJ/kg implies only a small uncertainty in the total enthalpy, the effect on the agreement of the solution of the model flowfield is minimal. In this sense, the cylinder cases are useful as a first-order metric of understanding of the thermochemical modeling of the hypervelocity flowfield. The significant remaining question in testing the cylinder and other blunt bodies in high enthalpy ground test facilities is the issue of catalytic heating augmentation, where the super-catalytic wall boundary condition that enforces complete recombination to O2/N2 at the surface best represents the measured data.
The effect of vibration-dissociation coupling has been examined at enthalpies of 5 and 10 MJ/kg to assess its importance in a non-equilibrium flowfield over the double cone geometry, where agreement with the data has been generally unsuccessful. Using the physically-consistent CVDV model of Marrone and Treanor has improved the overall quality of the predictions some, but more effort is needed. At 5MJ/kg, the best solutions predict the flowfield reasonably well overall and capture the peak heating, but the separated region is still predicted to be slightly too small on the 25O cone. At 10MJ/kg, the CVDV model has less of a benefit over the T-TV model. The separated region is predicted to be too small as in the previous case and the peak heating is still under-predicted (though we plan to continue evaluating the effect of grid resolution as one possible cause of the latter). The effects seen by Olejniczak and Candler on the double-wedge geometry of the CVDV model are not as large for our double-cone geometry. One possible cause for this may be the axisymmetric versus the 2D geometry, or it may be the particular conditions of the cases. However, the results obtained here are encouraging enough that a properly
American Institute of Aeronautics and Astronautics
14

45TH Aerospace Sciences Meeting and Exhibit AIAA 2007 – 0121
designed, physically consistent approach to vibration-dissociation coupling may provide additional benefits to this difficult problem.
Acknowledgements This work was sponsored under grants #M5146247101/FA9550-04-1-0341 and #FA49620-03-1-0237. The
views and conclusions contained herein are those of the authors and should not be interpreted as necessarily representing the official policies or endorsements, either expressed or implied, of the AFOSR or the U.S. Government.
References 1Holden, M.; Wadhams, T.; MacLean, M.; and Parker, R. “Experimental Studies in LENS I and X to Evaluate Real Gas
Effects on Hypervelocity Vehicle Performance”. AIAA Paper 2007–0204. 45TH Aerospace Sciences Meeting & Exhibit. Reno, NV: 8-11 January 2007.
2Holden, M.S. and Parker, R.P. “LENS Hypervelocity Tunnels and Application to Vehicle Testing at Duplicated Flight Conditions,” Chp 4 of Advanced Hypersonic Test Facilities. Lu, F.K. and Marren, D.E. Eds. AIAA Progress in Astronautics and Aeronautics Series: Vol 198. Chapter 4. Reston, VA: American Institute of Aeronautics and Astronautics, 2002.
3Holden, M.S.; Wadhams, T.P.; and Candler, G.V. “Experimental Studies in the LENS Shock Tunnel and Expansion Tunnel to Examine Real-Gas Effects in Hypervelocity Flows”. AIAA Paper 2004–0916. January 2004.
4Parker, R.; Wakeman, T.; Holden, M.; and MacLean, M. “Measuring NO Freestream Concentration Using Quantum Cascade Lasers at CUBRC”. AIAA Paper 2006–0926. 44TH Aerospace Sciences Meeting & Exhibit. Reno, NV: 9-12 January 2006.
5Parker, R.; Wakeman, T; MacLean. M.; and Holden, M. “Measuring Nitric Oxide Freestream Velocity Using Quantum Cascade Lasers at CUBRC”. AIAA Paper 2007–1329. 45TH Aerospace Sciences Meeting & Exhibit. Reno, NV: 8-11 January 2007.
6Wright, M.J.; Bose, D.; and Candler, G.V. “A Data Parallel Line Relaxation Method for the Navier-Stokes Equations”. AIAA Journal Vol 36, no 9. Pgs 1603 – 1609. Sept 1998.
7MacCormack, R.W. and Candler, G.V. “The Solution of the Navier-Stokes Equations Using Gauss-Seidel Line Relaxation”. Computers and Fluids. Vol 17, No 1. Pgs 135 – 150. 1989.
8Candler, G.V. “Chemistry of External Flows”. Aerothermochemistry for Hypersonic Technology: Von Karman Institute for Fluid Dynamics Lecture Series. VKI LS 1995-04.
9Landau, L. and Teller, E. “Theory of Sound Dispersion”. Physikalische Zeitschrift der Sowjetunion. Vol 10, no 34. 1936. 10Millikan, R. and White, D. “Systematics of Vibrational Relaxation”. Journal of Chemical Physics. Vol 39, no 12. Pgs 3209
– 3213. 1963. 11Camac, M. “CO2 Relaxation Processes in Shock Waves”. Fundamental Phenomena in Hypersonic Flow. J.G. Hall Ed.
Cornell University Press. Pgs 195 – 215, 1964. 12Park, C.; Howe, J.T.; Jaffe, R.J.; and Candler, G.V. “Review of Chemical-Kinetic Problems of Future NASA Missions II:
Mars Entries”. Journal of Thermophysics and Heat Transfer. Vol 8, no 1. Pgs 9 – 23. 1994. 13Park, C. “Problem of Rate Chemistry in the Flight Regimes of Aeroassisted Orbital Transfer Vehicles,” Thermal Design of
Aeroassisted Orbital Transfer Vehicles, ed. H.F. Nelson. Progress in Aeronautics and Astronautics, Vol 96. Pgs 511 – 537. 1985. 14Palmer, G.E. and Wright, M.J. “A Comparison of Methods to Compute High Temperature Gas Viscosity”. Journal of
Thermophysics and Heat Transfer. Vol 17, no 2. Pgs 232 – 239. 2003. 15Palmer, G.E. and Wright, M.J. “A Comparison of Methods to Compute High Temperature Gas Thermal Conductivity”.
AIAA Paper 2003-3913. Jun 2003. 16Gupta, R.; Yos, J.; Thompson, R.; and Lee, K. “A Review of Reaction Rates and Thermodynamic and Transport Properties
for an 11-Species Air Model for Chemical and Thermal Nonequilibrium Calculations to 30000 K”. NASA RP-1232. August 1990.
17Ramshaw, J.D. “Self-consistent Effective Binary Diffusion in Multicomponent Gas Mixtures”. Journal of Non-Equilibrium Thermodynamics. Vol 15, no 3. Pgs 295 – 300. 1990.
18Baldwin, B.S. and Lomax, H. “Thin Layer Approximation and Algebraic Model for Separated Turbulent Flows”. AIAA Paper 78-0257. Huntsville, AL: 1978.
19Spalart, P.R. and Allmaras S.R. “A One-Equation Turbulence Model for Aerodynamic Flows”. AIAA Paper 92–0439. 30TH Aerospace Sciences Meeting & Exhibit. Reno, NV: 6-9 Jan, 1992.
20Menter, F.R. “Two-Equation Eddy-Viscosity Turbulence Models for Engineering Applications”. AIAA Journal Vol 32, no 8. Pgs 1598 – 1605. August 1994.
21Brown, James. “Turbulence Model Validation for Hypersonic Flow”. AIAA Paper 2002–3308. 8TH Thermophysics and Heat Transfer Conference. St. Paul, MN: 24 – 26 June 2002.
22Catris S. and Aupoix B. “Improved Turbulence Models for Compressible Boundary Layers.” AIAA Paper 98–2696. 2ND Theoretical Fluid Mechanics Meeting: Albuquerque, NM, June 1998.
23Park, Chul. “Assessment of Two-temperature Kinetic Model for Ionizing Air”. AIAA Paper 87–1574. AIAA 22ND Thermophysics Conference. Honolulu, HI: 8-10 June 1987.
American Institute of Aeronautics and Astronautics
15
45TH Aerospace Sciences Meeting and Exhibit AIAA 2007 – 0121
24Olejniczak, J. and Candler, G. “Vibrational Energy Conservation with Vibration-Dissociation Coupling: General Theory
and Numerical Studies”. Physics of Fluids. Vol 7, no 7. Pgs 1764 – 1774. July 1995. 25Marrone, P.V. and Treanor, C.E. “Chemical Relaxation with Preferential Dissociation from Excited Vibrational Levels”.
The Physics of Fluids, Vol 6, no 9. Pgs 1215 – 1221. September 1963. 26Knab, O.; Frühauf, H.-H.; and Jonas, S. “Multiple Temperature Descriptions of Reaction Rate Constants with Regard to
Consistent Chemical-Vibrational Coupling”. AIAA Paper 92–2947. July 1992. 27Knab, O.; Frühauf, H.-H.; and Messerschmid, E. “Theory and Validation of the Physically Consistent Coupled Vibration-
Chemistry-Vibration Model”. Journal of Thermophysics and Heat Transfer, Vol 9, no 2. Pgs 219 – 226. April – June 1995. 28Zeitoun, D.; Schall, E.; Burtschell, Y.; and Druguet, M.-C.”Vibration-Dissociation Coupling in Nonequilibrium Hypersonic
Viscous Flows”. AIAA Journal Vol 33, no 1. Pgs 79 – 85. January 1995. 29Séror, S.; Druguet, M.-C.; Schall, E.; and Zeitoun, D. “Coupled Vibration-Dissociation-Exchange Reactions Model for
Hypersonic Airflow Computations”. AIAA Journal Vol 36, no 4. Pgs 532 – 538. April 1998. 30MacLean, M. and Holden, M. “Catalytic effects on Heat transfer Measurements for Aerothermal Studies with CO2”. AIAA
Paper 2005–0182. 44RD Aerospace Sciences Meeting & Exhibit. Reno, NV: 9-12 January 2006. 31Myerson, A.L. Interim Report on Transient Heat Transfer Measurements of Catalytic Recombination in a Step-function
Flow of Atomic Oxygen. Cornell Aeronautical Lab (CAL) Report AF-1412-A-2. August 1962. 32Hartunian, R.A. and Thompson, W.P. Glow Discharge Shock Tube for Studying Surface Catalysis, Gas Phase, and
Chemiluminescent Reactions. Aerospace Corp Report TDR-469(9240-01)-4. May 1965. 33Thompson, W.P. and Hartunian, R.A. “A Note of Caution on the Use of Catalytic Probes”. AIAA Journal Vol 4, no 5. Pgs
957 – 959. May 1966. 34Candler, Graham V. “Hypersonic Nozzle Analysis Using an Excluded Volume Equation of State”. AIAA Paper 2005–
5202. 38TH AIAA Thermophysics Conference, Toronto, CA: 6 – 9 June 2005. 35MacLean, M.; Candler, G.; and Holden, M. “Numerical Evaluation of Flow Conditions in the LENS Reflected Shock-
Tunnel Facilities”. AIAA Paper 2005–0903. 43RD Aerospace Sciences Meeting & Exhibit. Reno, NV: 10-14 January 2005. 36Sebastian, K.; Schramm, J.M.; and Hannemann, K. “High Enthalpy Cylinder Flow in HEG: A Basis for CFD Validation”.
AIAA Paper 2003–4252. 33RD AIAA Fluid Dynamics Conference, Orlando, FL: 23 – 26 June 2003. 37Nompelis, I.; Candler, G.; and Holden, M. “Effect of Vibrational Nonequilibrium on Hypersonic Double-Cone
Experiments”. AIAA Journal Vol 41, no 11. Pgs 2162 – 2169. November 2003. 38Olejniczak, J. and Candler, G. “Study of Experiments Sensitive to Vibration-Dissociation Coupling Models”. Proceedings
of the 20TH International Symposium on Shock Waves, Vol I. Sturtevant, B.; Shepard, J.; and Hornung, H. Eds. Singapore: World Scientific Publishing Co, 1996.
39Nompelis, I.; Candler, G.; MacLean, M.; and Holden, M. “Investigation of Hypersonic Double- Cone Flow Experiments at High Enthalpy in the LENS Facility”. AIAA Paper 2007–0203. 45TH Aerospace Sciences Meeting & Exhibit. Reno, NV: 8-11 January 2007.
40Nompelis, I., Candler, G. V., Holden, M. S. and Wadhams, T. P., “Computational Investigation of Hypersonic Viscous/Inviscid Interactions in High Enthalpy Flows”. AIAA Paper 2003-3642, June 2003.
41Roache, Patrick J. Verification and Validation in Computational Science and Engineering. ISBN 0-913478-08-3. Albuquerque, NM: Hermosa Publishers, 1998.
42Druguet, M.-C.; Candler, G.; Nompelis, I. “Comparison of Physical Models in Computations of High-Enthalpy Double-Cone Flows”. AIAA Paper 2006-3419. 9TH Joint Thermophysics/Heat Transfer Conference. San Francisco, Ca: 5 – 8 June 2006.
American Institute of Aeronautics and Astronautics
16