A comprehensive laboratory study on the immersion freezing … · 2016-01-11 · A comprehensive...
30
Atmos. Chem. Phys., 15, 2489–2518, 2015 www.atmos-chem-phys.net/15/2489/2015/ doi:10.5194/acp-15-2489-2015 © Author(s) 2015. CC Attribution 3.0 License. A comprehensive laboratory study on the immersion freezing behavior of illite NX particles: a comparison of 17 ice nucleation measurement techniques N. Hiranuma 1 , S. Augustin-Bauditz 2 , H. Bingemer 3 , C. Budke 4 , J. Curtius 3 , A. Danielczok 3 , K. Diehl 5 , K. Dreischmeier 4 , M. Ebert 6 , F. Frank 3 , N. Hoffmann 1 , K. Kandler 6 , A. Kiselev 1 , T. Koop 4 , T. Leisner 1 , O. Möhler 1 , B. Nillius 3,* , A. Peckhaus 1 , D. Rose 3 , S. Weinbruch 6 , H. Wex 2 , Y. Boose 7 , P. J. DeMott 8 , J. D. Hader 9 , T. C. J. Hill 8 , Z. A. Kanji 7 , G. Kulkarni 10 , E. J. T. Levin 8 , C. S. McCluskey 8 , M. Murakami 11 , B. J. Murray 12 , D. Niedermeier 2,** , M. D. Petters 9 , D. O’Sullivan 12 , A. Saito 11 , G. P. Schill 13 , T. Tajiri 11 , M. A. Tolbert 13 , A. Welti 7 , T. F. Whale 12 , T. P. Wright 9 , and K. Yamashita 11,*** 1 Institute for Meteorology and Climate Research – Atmospheric Aerosol Research, Karlsruhe Institute of Technology, Karlsruhe, Germany 2 Leibniz Institute for Tropospheric Research, Leipzig, Germany 3 Institute for Atmospheric and Environmental Science, Goethe University of Frankfurt, Frankfurt, Germany 4 Faculty of Chemistry, Bielefeld University, Bielefeld, Germany 5 Institute for Atmospheric Physics, University of Mainz, Mainz, Germany 6 Institute of Applied Geosciences, Technical University Darmstadt, Darmstadt, Germany 7 Institute for Atmosphere and Climate Science, ETH, Zurich, Switzerland 8 Department of Atmospheric Science, Colorado State University, Fort Collins, CO, USA 9 Department of Marine Earth and Atmospheric Sciences, North Carolina State University, Raleigh, NC, USA 10 Atmospheric Science and Global Change Division, Pacific Northwest National Laboratory, Richland, WA, USA 11 Meteorological Research Institute (MRI), Tsukuba, Japan 12 Institute for Climate and Atmospheric Science, School of Earth and Environment, University of Leeds, Leeds, UK 13 Cooperative Institute for Research in Environmental Sciences and Department of Chemistry and Biochemistry, University of Colorado, Boulder, CO, USA * now at: Max-Planck-Institut für Chemie, Mainz, Germany ** now at: Department of Physics, Michigan Technological University, Houghton, MI, USA *** now at: Snow and Ice Research Center, Nagaoka, Japan Correspondence to: N. Hiranuma ([email protected]) Received: 19 August 2014 – Published in Atmos. Chem. Phys. Discuss.: 28 August 2014 Revised: 24 December 2014 – Accepted: 27 January 2015 – Published: 6 March 2015 Abstract. Immersion freezing is the most relevant hetero- geneous ice nucleation mechanism through which ice crys- tals are formed in mixed-phase clouds. In recent years, an in- creasing number of laboratory experiments utilizing a variety of instruments have examined immersion freezing activity of atmospherically relevant ice-nucleating particles. However, an intercomparison of these laboratory results is a difficult task because investigators have used different ice nucleation (IN) measurement methods to produce these results. A re- maining challenge is to explore the sensitivity and accuracy of these techniques and to understand how the IN results are potentially influenced or biased by experimental parameters associated with these techniques. Within the framework of INUIT (Ice Nuclei Research Unit), we distributed an illite-rich sample (illite NX) as a representative surrogate for atmospheric mineral dust parti- cles to investigators to perform immersion freezing experi- ments using different IN measurement methods and to obtain Published by Copernicus Publications on behalf of the European Geosciences Union.
Transcript of A comprehensive laboratory study on the immersion freezing … · 2016-01-11 · A comprehensive...

Atmos. Chem. Phys., 15, 2489–2518, 2015
www.atmos-chem-phys.net/15/2489/2015/
doi:10.5194/acp-15-2489-2015
© Author(s) 2015. CC Attribution 3.0 License.
A comprehensive laboratory study on the immersion freezing
behavior of illite NX particles: a comparison of 17 ice nucleation
measurement techniques
N. Hiranuma1, S. Augustin-Bauditz2, H. Bingemer3, C. Budke4, J. Curtius3, A. Danielczok3, K. Diehl5,
K. Dreischmeier4, M. Ebert6, F. Frank3, N. Hoffmann1, K. Kandler6, A. Kiselev1, T. Koop4, T. Leisner1, O. Möhler1,
B. Nillius3,*, A. Peckhaus1, D. Rose3, S. Weinbruch6, H. Wex2, Y. Boose7, P. J. DeMott8, J. D. Hader9, T. C. J. Hill8,
Z. A. Kanji7, G. Kulkarni10, E. J. T. Levin8, C. S. McCluskey8, M. Murakami11, B. J. Murray12, D. Niedermeier2,**,
M. D. Petters9, D. O’Sullivan12, A. Saito11, G. P. Schill13, T. Tajiri11, M. A. Tolbert13, A. Welti7, T. F. Whale12,
T. P. Wright9, and K. Yamashita11,***
1Institute for Meteorology and Climate Research – Atmospheric Aerosol Research,
Karlsruhe Institute of Technology, Karlsruhe, Germany2Leibniz Institute for Tropospheric Research, Leipzig, Germany3Institute for Atmospheric and Environmental Science, Goethe University of Frankfurt, Frankfurt, Germany4Faculty of Chemistry, Bielefeld University, Bielefeld, Germany5Institute for Atmospheric Physics, University of Mainz, Mainz, Germany6Institute of Applied Geosciences, Technical University Darmstadt, Darmstadt, Germany7Institute for Atmosphere and Climate Science, ETH, Zurich, Switzerland8Department of Atmospheric Science, Colorado State University, Fort Collins, CO, USA9Department of Marine Earth and Atmospheric Sciences, North Carolina State University, Raleigh, NC, USA10Atmospheric Science and Global Change Division, Pacific Northwest National Laboratory, Richland, WA, USA11Meteorological Research Institute (MRI), Tsukuba, Japan12Institute for Climate and Atmospheric Science, School of Earth and Environment, University of Leeds, Leeds, UK13Cooperative Institute for Research in Environmental Sciences and Department of Chemistry and Biochemistry,
University of Colorado, Boulder, CO, USA*now at: Max-Planck-Institut für Chemie, Mainz, Germany**now at: Department of Physics, Michigan Technological University, Houghton, MI, USA***now at: Snow and Ice Research Center, Nagaoka, Japan
Correspondence to: N. Hiranuma ([email protected])
Received: 19 August 2014 – Published in Atmos. Chem. Phys. Discuss.: 28 August 2014
Revised: 24 December 2014 – Accepted: 27 January 2015 – Published: 6 March 2015
Abstract. Immersion freezing is the most relevant hetero-
geneous ice nucleation mechanism through which ice crys-
tals are formed in mixed-phase clouds. In recent years, an in-
creasing number of laboratory experiments utilizing a variety
of instruments have examined immersion freezing activity of
atmospherically relevant ice-nucleating particles. However,
an intercomparison of these laboratory results is a difficult
task because investigators have used different ice nucleation
(IN) measurement methods to produce these results. A re-
maining challenge is to explore the sensitivity and accuracy
of these techniques and to understand how the IN results are
potentially influenced or biased by experimental parameters
associated with these techniques.
Within the framework of INUIT (Ice Nuclei Research
Unit), we distributed an illite-rich sample (illite NX) as a
representative surrogate for atmospheric mineral dust parti-
cles to investigators to perform immersion freezing experi-
ments using different IN measurement methods and to obtain
Published by Copernicus Publications on behalf of the European Geosciences Union.

2490 N. Hiranuma et al.: A comparison of 17 IN measurement techniques
IN data as a function of particle concentration, temperature
(T ), cooling rate and nucleation time. A total of 17 measure-
ment methods were involved in the data intercomparison. Ex-
periments with seven instruments started with the test sam-
ple pre-suspended in water before cooling, while 10 other
instruments employed water vapor condensation onto dry-
dispersed particles followed by immersion freezing. The re-
sulting comprehensive immersion freezing data set was eval-
uated using the ice nucleation active surface-site density, ns,
to develop a representative ns(T ) spectrum that spans a wide
temperature range (−37 ◦C < T <−11 ◦C) and covers 9 or-
ders of magnitude in ns.
In general, the 17 immersion freezing measurement tech-
niques deviate, within a range of about 8 ◦C in terms of tem-
perature, by 3 orders of magnitude with respect to ns. In ad-
dition, we show evidence that the immersion freezing effi-
ciency expressed in ns of illite NX particles is relatively in-
dependent of droplet size, particle mass in suspension, par-
ticle size and cooling rate during freezing. A strong tem-
perature dependence and weak time and size dependence of
the immersion freezing efficiency of illite-rich clay mineral
particles enabled the ns parameterization solely as a func-
tion of temperature. We also characterized the ns(T ) spec-
tra and identified a section with a steep slope between −20
and −27 ◦C, where a large fraction of active sites of our test
dust may trigger immersion freezing. This slope was fol-
lowed by a region with a gentler slope at temperatures below
−27 ◦C. While the agreement between different instruments
was reasonable below∼−27 ◦C, there seemed to be a differ-
ent trend in the temperature-dependent ice nucleation activ-
ity from the suspension and dry-dispersed particle measure-
ments for this mineral dust, in particular at higher tempera-
tures. For instance, the ice nucleation activity expressed in
ns was smaller for the average of the wet suspended samples
and higher for the average of the dry-dispersed aerosol sam-
ples between about−27 and−18 ◦C. Only instruments mak-
ing measurements with wet suspended samples were able to
measure ice nucleation above −18 ◦C. A possible explana-
tion for the deviation between −27 and −18 ◦C is discussed.
Multiple exponential distribution fits in both linear and log
space for both specific surface area-based ns(T ) and geomet-
ric surface area-based ns(T ) are provided. These new fits,
constrained by using identical reference samples, will help
to compare IN measurement methods that are not included
in the present study and IN data from future IN instruments.
1 Introduction
1.1 Background
Primary ice formation by atmospheric ice-nucleating parti-
cles (INPs) markedly influences the formation and life cycle
of mixed-phase clouds and very often also initiates precipita-
tion formation. Therefore, ice-containing clouds play a sig-
nificant role in the energy balance of the climate system and
the hydrological cycle on Earth (Chapter 7 of IPCC 2013;
Boucher et al., 2013). Currently, quantitative predictions for
the impact of these clouds on the Earth’s radiative budget
and thereby the climate are highly uncertain. This uncertainty
arises primarily from a lack of fundamental understanding
of ice microphysical processes, the representation of these
processes in cloud models and knowledge of the abundance
of INPs (Hoose and Möhler, 2012; Murray et al., 2012).
In particular, yearly emission rates of soil dust are 1000 to
4000 teragrams, accounting for a major proportion of both
the dust component and the total particle loading in the atmo-
sphere (Boucher et al., 2013). The resulting radiative forcing
directly exerted by mineral dust is estimated to range from
−0.3 to +0.1 W m−2. Therefore, dust slightly contributes to
the direct cooling effect of aerosols. However, our under-
standing of the influence of the dust burden upon overall cli-
mate forcing, including its secondary effect on cloud albedo,
remains highly uncertain, in part due to the absence of ac-
curate INP representations in atmospheric models. Thus, the
effective radiative forcing effect of airborne dust on current
climate predictions remains unresolved.
A small subset of all particles acts as INPs across a range
of subzero temperatures, triggering ice formation in clouds
via the process of heterogeneous ice nucleation. Previous
laboratory experiments have taken diverse approaches in
an attempt to mimic ice nucleation and freezing processes.
These heterogeneous ice formation processes include deposi-
tion nucleation, immersion freezing, condensation freezing,
and contact freezing (Vali, 1985), inside-out contact freezing
(i.e., freezing of an immersed INP in contact with the droplet
surface from the inside; Durant and Shaw, 2005; Fornea et
al., 2009) and surface condensation freezing (i.e., freezing of
supercooled water or residual aqueous solution trapped on
particle surfaces, e.g., by the inverse Kelvin effect; Christen-
son, 2013; Hiranuma et al., 2014a; Marcolli, 2014; Welti et
al., 2014; Wex et al., 2014). Without INPs, pure cloud wa-
ter droplets or solution within particles can be supercooled
to below −37 ◦C before freezing (Koop et al., 2000; Murray
et al., 2010; Rosenfeld and Woodley, 2000).
Among the various modes of atmospheric ice nucleation,
immersion freezing is one of the most important mechanisms
for primary ice formation, accounting for 85 % of ice for-
mation in clouds that contain supercooled droplets (Hoose
et al., 2010). Furthermore, many of the previous experi-
mental studies have investigated heterogeneous ice nucle-
ation at conditions where water is supercooled before freez-
ing (e.g., Murray et al., 2012). However, the relative im-
portance of the particles’ physicochemical properties (i.e.,
size, composition, solubility, hygroscopicity, cloud conden-
sation nuclei (CCN) activity, ice nucleation (IN) active sites,
surface charge and/or crystallographic structure) for immer-
sion freezing is not yet well known (e.g., Hiranuma et al.,
2013, 2014b; Murray et al., 2012). Hence, more in-depth
Atmos. Chem. Phys., 15, 2489–2518, 2015 www.atmos-chem-phys.net/15/2489/2015/
N. Hiranuma et al.: A comparison of 17 IN measurement techniques 2491
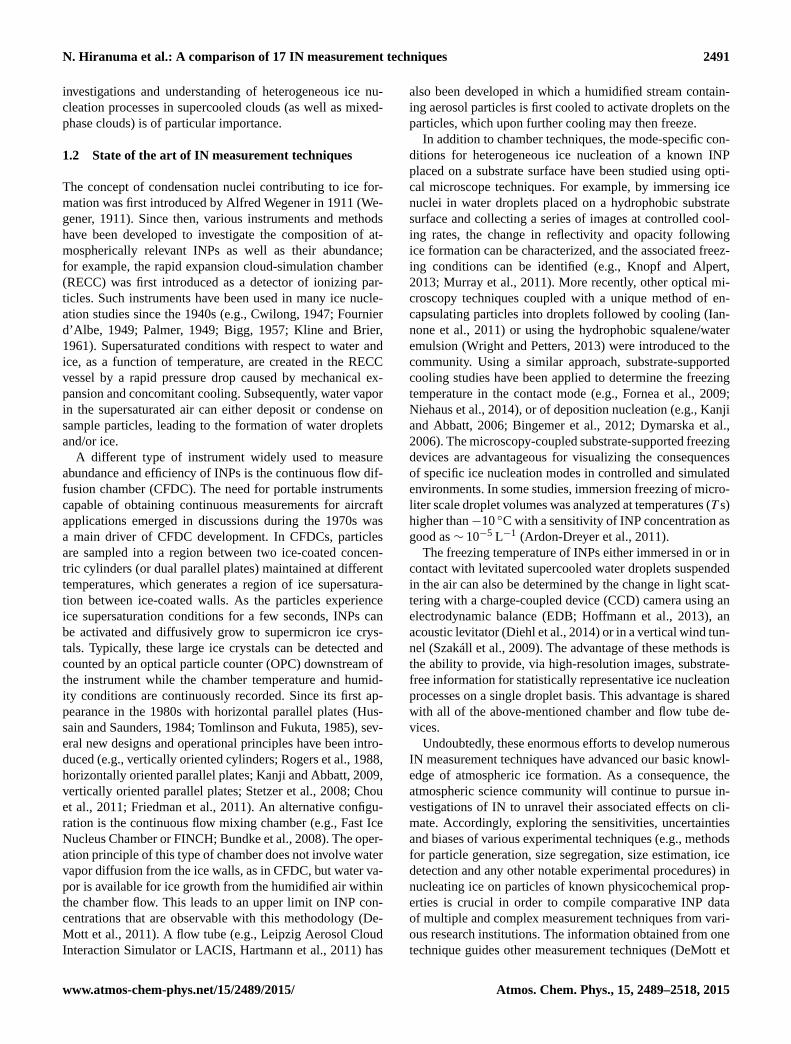
investigations and understanding of heterogeneous ice nu-
cleation processes in supercooled clouds (as well as mixed-
phase clouds) is of particular importance.
1.2 State of the art of IN measurement techniques
The concept of condensation nuclei contributing to ice for-
mation was first introduced by Alfred Wegener in 1911 (We-
gener, 1911). Since then, various instruments and methods
have been developed to investigate the composition of at-
mospherically relevant INPs as well as their abundance;
for example, the rapid expansion cloud-simulation chamber
(RECC) was first introduced as a detector of ionizing par-
ticles. Such instruments have been used in many ice nucle-
ation studies since the 1940s (e.g., Cwilong, 1947; Fournier
d’Albe, 1949; Palmer, 1949; Bigg, 1957; Kline and Brier,
1961). Supersaturated conditions with respect to water and
ice, as a function of temperature, are created in the RECC
vessel by a rapid pressure drop caused by mechanical ex-
pansion and concomitant cooling. Subsequently, water vapor
in the supersaturated air can either deposit or condense on
sample particles, leading to the formation of water droplets
and/or ice.
A different type of instrument widely used to measure
abundance and efficiency of INPs is the continuous flow dif-
fusion chamber (CFDC). The need for portable instruments
capable of obtaining continuous measurements for aircraft
applications emerged in discussions during the 1970s was
a main driver of CFDC development. In CFDCs, particles
are sampled into a region between two ice-coated concen-
tric cylinders (or dual parallel plates) maintained at different
temperatures, which generates a region of ice supersatura-
tion between ice-coated walls. As the particles experience
ice supersaturation conditions for a few seconds, INPs can
be activated and diffusively grow to supermicron ice crys-
tals. Typically, these large ice crystals can be detected and
counted by an optical particle counter (OPC) downstream of
the instrument while the chamber temperature and humid-
ity conditions are continuously recorded. Since its first ap-
pearance in the 1980s with horizontal parallel plates (Hus-
sain and Saunders, 1984; Tomlinson and Fukuta, 1985), sev-
eral new designs and operational principles have been intro-
duced (e.g., vertically oriented cylinders; Rogers et al., 1988,
horizontally oriented parallel plates; Kanji and Abbatt, 2009,
vertically oriented parallel plates; Stetzer et al., 2008; Chou
et al., 2011; Friedman et al., 2011). An alternative configu-
ration is the continuous flow mixing chamber (e.g., Fast Ice
Nucleus Chamber or FINCH; Bundke et al., 2008). The oper-
ation principle of this type of chamber does not involve water
vapor diffusion from the ice walls, as in CFDC, but water va-
por is available for ice growth from the humidified air within
the chamber flow. This leads to an upper limit on INP con-
centrations that are observable with this methodology (De-
Mott et al., 2011). A flow tube (e.g., Leipzig Aerosol Cloud
Interaction Simulator or LACIS, Hartmann et al., 2011) has
also been developed in which a humidified stream contain-
ing aerosol particles is first cooled to activate droplets on the
particles, which upon further cooling may then freeze.
In addition to chamber techniques, the mode-specific con-
ditions for heterogeneous ice nucleation of a known INP
placed on a substrate surface have been studied using opti-
cal microscope techniques. For example, by immersing ice
nuclei in water droplets placed on a hydrophobic substrate
surface and collecting a series of images at controlled cool-
ing rates, the change in reflectivity and opacity following
ice formation can be characterized, and the associated freez-
ing conditions can be identified (e.g., Knopf and Alpert,
2013; Murray et al., 2011). More recently, other optical mi-
croscopy techniques coupled with a unique method of en-
capsulating particles into droplets followed by cooling (Ian-
none et al., 2011) or using the hydrophobic squalene/water
emulsion (Wright and Petters, 2013) were introduced to the
community. Using a similar approach, substrate-supported
cooling studies have been applied to determine the freezing
temperature in the contact mode (e.g., Fornea et al., 2009;
Niehaus et al., 2014), or of deposition nucleation (e.g., Kanji
and Abbatt, 2006; Bingemer et al., 2012; Dymarska et al.,
2006). The microscopy-coupled substrate-supported freezing
devices are advantageous for visualizing the consequences
of specific ice nucleation modes in controlled and simulated
environments. In some studies, immersion freezing of micro-
liter scale droplet volumes was analyzed at temperatures (T s)
higher than−10 ◦C with a sensitivity of INP concentration as
good as ∼ 10−5 L−1 (Ardon-Dreyer et al., 2011).
The freezing temperature of INPs either immersed in or in
contact with levitated supercooled water droplets suspended
in the air can also be determined by the change in light scat-
tering with a charge-coupled device (CCD) camera using an
electrodynamic balance (EDB; Hoffmann et al., 2013), an
acoustic levitator (Diehl et al., 2014) or in a vertical wind tun-
nel (Szakáll et al., 2009). The advantage of these methods is
the ability to provide, via high-resolution images, substrate-
free information for statistically representative ice nucleation
processes on a single droplet basis. This advantage is shared
with all of the above-mentioned chamber and flow tube de-
vices.
Undoubtedly, these enormous efforts to develop numerous
IN measurement techniques have advanced our basic knowl-
edge of atmospheric ice formation. As a consequence, the
atmospheric science community will continue to pursue in-
vestigations of IN to unravel their associated effects on cli-
mate. Accordingly, exploring the sensitivities, uncertainties
and biases of various experimental techniques (e.g., methods
for particle generation, size segregation, size estimation, ice
detection and any other notable experimental procedures) in
nucleating ice on particles of known physicochemical prop-
erties is crucial in order to compile comparative INP data
of multiple and complex measurement techniques from vari-
ous research institutions. The information obtained from one
technique guides other measurement techniques (DeMott et
www.atmos-chem-phys.net/15/2489/2015/ Atmos. Chem. Phys., 15, 2489–2518, 2015

2492 N. Hiranuma et al.: A comparison of 17 IN measurement techniques
al., 2011; Riechers et al., 2013). A better understanding of
the sensitivity of multiple techniques and the role of associ-
ated experimental parameters upon INP measurements will
also help in transferring the laboratory-based measurements
of INPs of various atmospheric constituents to their reliable
parameterizations in models of atmospheric processes.
Since the 1960s, four international workshops have been
organized to compare the performance of IN measuring in-
struments that were emerging or available at the time (De-
Mott et al., 2011). In particular, effort was made during the
fourth international ice nucleation workshop in 2007 (ICIS-
2007) to assemble a total of nine laboratory and field IN in-
struments at the AIDA (Aerosol Interaction and Dynamics
in the Atmosphere) facility and compare them using identi-
cal test dust samples (e.g., Arizona Test Dust, or ATD, and
Saharan dust) over similar thermodynamic conditions. State-
of-the-art knowledge was obtained from each workshop ac-
tivity, and such measurement understanding was further in-
corporated to develop the next generation of IN instruments.
1.3 Objectives
The major aim of this study, and concurrent studies within
the framework of the INUIT (Ice Nuclei Research Unit)
project, is to investigate the immersion freezing behavior of
reference particles (e.g., Snomax for bacterial IN processes
and potassium-rich feldspar, K-feldspar, for mineral dust IN
processes). In this work, we distributed illite NX samples
from the same batch [with the exceptions of the samples
used for Leeds-NIPI, ZINC and IMCA-ZINC (acronyms are
defined in the Supplement Sect. S4); Broadley et al., 2012;
Welti et al., 2009] among the INUIT project and associated
partners. With a total of 17 different IN measuring instru-
ments, we intercompared IN data from each instrument in
order to obtain a comprehensive data set for evaluating im-
mersion freezing properties of illite NX particles. The data
set captures the functional dependence of various experimen-
tal parameter variables, such as particle concentration, parti-
cle size, droplet size, temperature, cooling rate and nucle-
ation time, on the immersion freezing properties of illite NX
particles. Further, some instruments used test samples sus-
pended in water prior to experiments, while others used dry-
dispersed particles. The basic experimental methods and pa-
rameterization approaches used to interpret the overall results
and perform the intercomparison are discussed.
Results of freezing efficiencies at specific temperatures are
presented using the ice nucleation active surface-site den-
sity (ns) parameterization (e.g., Connolly et al., 2009; Nie-
mand et al., 2012; Hoose and Möhler, 2012) developed on
the basis of suggestions by DeMott et al. (1995). For in-
stance, Niemand et al. (2012) showed that the singular pa-
rameterization approach of immersion freezing (i.e., freezing
along water saturation conditions while cooling) of various
desert dust particles derived from AIDA experiments con-
verge upon one representative fit as a function of tempera-
ture, which is valid across a temperature range from −12 to
−36 ◦C. The time-independent ns parameterization has also
been used in describing INP activation by several different
constituents of clay minerals, e.g., microcline and kaolin-
ite, using the cold stage droplet freezing technique (Atkin-
son et al., 2013; Murray et al., 2010, 2011). Hence, compar-
ison of IN efficiencies can be readily performed for multiple
types of instruments using ns parameterizations. Moreover,
such time-independent and surface-area-scaled ns formula-
tions can be further adapted to comprehensively assess ice
nucleation in a wide range of atmospherically relevant tem-
peratures and relative humidities with respect to ice (RHice),
as was recently presented in Hiranuma et al. (2014a). The ns
parameterization for both immersion freezing and deposition
nucleation can be directly implemented in cloud, weather and
climate models to calculate the temperature-dependent abun-
dance of INPs as a function of the aerosol surface area con-
centration.
2 Methods
2.1 Illite NX characterization
In this study, we have chosen illite NX (Arginotec, NX
Nanopowder) as a surrogate for natural desert dusts. This
choice of an illite-rich material is based on a comparison of
its mineralogical composition to that of desert dusts, which
are also rich in illite but are also mixed with a range of
other minerals (Broadley et al., 2012). The present work
gives an overview of laboratory experiments for immersion
freezing of particles of illite NX, used as a surrogate for at-
mospheric desert dust particles. Illite NX bulk powder was
previously characterized for its physicochemical properties,
such as mineralogy and specific surface area (SSA or θ for
brevity). It was observed that illite NX samples contained
more than 74 weight percent (wt %) illite (Broadley et al.,
2012; Friedrich et al., 2008) along with other components
[kaolinite, quartz, calcite and feldspars (most likely ortho-
clase/sanidine), see Sect. 3.1 for more detail] which is simi-
lar to the X-ray diffraction (XRD) data specified by the man-
ufacturer. These test particles typically have aggregates of
many nanometer-sized grains, yielding an order of magni-
tude greater SSA (104.2 m2 g−1; Broadley et al., 2012). The
aspherical and elongated nature of illite NX particles (aspect
ratio up to ∼ 4.8; Veghte and Freedman, 2014) emphasizes
the importance of considering its irregular shape. The manu-
facturer reports the particle density, after mechanical granu-
lation, as 2.65 g cm−3.
To determine the purity of our sample, and to compare this
with previous observations, the dust mineralogy of a bulk
illite NX sample was characterized using XRD (Waseda et
al., 2011) prior to distribution. In addition, complementary
energy dispersive X-ray (EDX) spectroscopy analysis was
performed to characterize the elemental composition of in-
Atmos. Chem. Phys., 15, 2489–2518, 2015 www.atmos-chem-phys.net/15/2489/2015/

N. Hiranuma et al.: A comparison of 17 IN measurement techniques 2493
dividual particles. The illite NX particles were sampled di-
rectly from the AIDA chamber using a 47 mm Nuclepore®
filter (Whatman, 0.2 µm pore-size, filter Cat. No. 111106)
and used in the EDX analysis.
The N2-adsorption-based SSA (or BET surface, Brunauer
et al., 1938) of the illite NX sample was also measured. BET
is a gas adsorption technique where the quantity of various
gases required to form a monolayer over the entire available
surface of dry particles, including internal surfaces, is mea-
sured (Gregg and Sing, 1982; Bickmore et al., 2002). From
the knowledge of the size of a molecule on the surface, it
is possible to determine the total surface area (Stotal). In this
work, BET surface areas were determined using two differ-
ent gas adsorbates: N2 and H2O (resulting in θN2and θH2O),
with the latter being the surface area exposed to water. BET
measurements with H2O were limited to 28 % relative hu-
midity with respect to water (RHw) to correctly account for
a monolayer of H2O (Quantachrome Instruments, 2013).
The effect of particle processing, such as removal of hy-
drophilic ions by water, in a water suspension was examined
by ion chromatography (IC). The influence of dust wash-
ing and discharge of soluble materials on IN propensity has
been previously proposed (Welti et al., 2014). More specif-
ically, the authors postulated two different scenarios at dif-
ferent temperatures based on their observations. At tempera-
tures below∼−38 ◦C, the washed dust component may have
enhanced water condensation below water saturation, and a
formed liquid layer presumably may have stabilized the sub-
critical ice embryo entrapped inside the liquid. The authors
proposed this capillary condensation process as a part of con-
densation freezing or homogeneous nucleation based on the
previous observation (Christenson, 2013) and the theoretical
framework (Marcolli, 2014). Above ∼−38 ◦C, on the other
hand, heterogeneous nucleation might have been suppressed
because the liquid layer derived from the deliquescence of
soluble impurities from individual particles may have dimin-
ished accessibility of water vapor to active sites (e.g., local-
ized surface features such as cracks and edges), originally
proposed by Koehler et al. (2010), preventing the ice embryo
formation. In this study, suspended samples were prepared
by stirring illite NX powders (0.1 g in 10 mL of 18.2 M� cm
nanopure water) over 3 weeks. IC (Dionex DX-500 IC Sys-
tem equipped with Dionex CD20 Conductivity Detector) was
used to determine the concentrations of washed out cations
(K+, Ca2+ and Mg2+) as a function of time. A weak solu-
tion of sulfuric acid [5 mL H2SO4 (96 wt %) diluted in 2 L
of Nanopure water] was used as the eluent. The measure-
ments were conducted in three series: every 5 to 10 s (sec-
onds) within the first 2 min (minutes) (ultra-short time se-
ries, USTS), then every 10 min within the first hour after
immersion (short time series, STS) followed by a long time
series (LTS) with cation concentration measurements con-
ducted every 2 days thereafter for a 3-week period.
2.2 Particle size distribution
Size distributions and the Stotal (in m2 cm−3) of both sus-
pended and dry-dispersed illite NX particles were charac-
terized using four size measurement techniques (i.e., aerosol
size spectrometers and light scattering instruments). In par-
ticular, the dynamic light scattering (DLS) size of suspended
illite NX particles (0.05 to 1 mg bulk illite NX sample in
1 mL of double-distilled water) was determined using the
StabiSizer® (Microtrac Europe GmbH, PMX 200CS) over
the range of 0.0008 to 6.5 µm hydrodynamic diameter. A
more detailed description of this instrument and its applica-
tion for studying the size of particles in suspension are ad-
dressed in Hiranuma et al. (2014b), and only a brief discus-
sion is given here. The DLS measurements were carried out
with negligible contribution of multiple scattering due to the
utilized 180◦ backscattering mode. The hydrodynamic diam-
eter, which was comparable to the volume equivalent diam-
eter, is determined using a refractive index of 1.55 to 1.58
for illite and of 1.333 for water, and a viscosity of water of
1.002 and 0.797 mPa s at 20 and 30 ◦C, respectively. From
this metric, the surface area was calculated assuming spheri-
cal particles.
Size distributions of dry polydisperse illite NX parti-
cles were measured at AIDA controlled expansion cloud-
simulation chamber (CECC) and Meteorological Research
Institute (MRI) dynamic CECC (DCECC) prior to the expan-
sion experiments. For AIDA-CECC, de-agglomerated illite
NX particles from a rotating brush disperser (PALAS, RGB
1000) were passed through a series of inertial cyclone im-
pactor stages (D50 ∼ 1 and 5 µm) and introduced to the 84 m3
volume AIDA vessel. Subsequently, a scanning mobility par-
ticle sizer (SMPS, TSI Inc., Model 3081 differential mobil-
ity analyzer, DMA, and Model 3010 condensation particle
counter, CPC) and an aerodynamic particle sizer (APS, TSI
Inc., Model 3321) were used to measure particle size distri-
butions over the range of 0.01 to 15.4 µm volume equivalent
diameter. The assumption of particle sphericity, a dynamic
shape factor (DSF or χ in equations) of 1.49± 0.12 (aver-
age of 10 measurements± standard deviation) and a particle
density of 2.65 g cm−3 were used to obtain the geometric-
based (volume equivalent) diameter from an APS (Hiranuma
et al., 2014b). At MRI-DCECC, a combination of an SMPS
(TSI Inc., Model 3936) and a welas® optical particle counter
(welas-OPC, PALAS, Sensor series 2500) was used to ac-
quire a size distribution for the size range of 0.01 to 47.2 µm
volume equivalent diameter directly from the 1.4 m3 volume
vessel. The same disperser type was used at both chambers
for particle generation, and the upstream cyclone impactors
(D50 ∼ 1 and 2.5 µm) were similarly deployed to filter out
any larger particles and safeguard against injecting these par-
ticles into the vessel. We note that a linear correction factor
of ∼ 2 was applied to convert the optical diameter measured
by the welas-OPC to the APS-inferred volume equivalent di-
www.atmos-chem-phys.net/15/2489/2015/ Atmos. Chem. Phys., 15, 2489–2518, 2015
2494 N. Hiranuma et al.: A comparison of 17 IN measurement techniques
ameter in several studies (Wagner et al., 2011; Hiranuma et
al., 2014a).
The particle number size distribution of dry particles in the
0.3–10 µm diameter range was also measured by a TSI 3330
optical particle sizer (OPS, TSI Inc.; TSI-OPS hereafter).
For particle generation, the illite NX sample was dispersed
using a magnetic stirrer in a 100 mL glass vessel that was
purged with 200 mL min−1 of dry particle-free compressed
laboratory air, and then diluted further in two stages by ap-
proximately 1 : 100 with dry air. Subsequently, the backward
scattering intensity of scattered light from a particle illumi-
nated by a laser (λ= 660 nm) was measured. The instrument
estimated the particle size distribution, assuming spherical
particles, using Mie theory. As a result, the reported size is
a volume equivalent spherical diameter. Additionally, these
dry-dispersed particles were used for the immersion mode
experiments of FRIDGE as described in the supplementary
methods.
2.3 Ice nucleation measurements
The ice nucleation measurement techniques contributing to
this collaborative effort are listed in Table 1. Descriptions
of each measurement technique and their acronyms are
available in Sect. S4. Briefly, four CFDC-type instruments,
one continuous flow mixing chamber, two cloud simula-
tion chambers, one diffusion cell, two levitators, one vertical
wind tunnel, one laminar flow tube and five cold stage-type
systems were employed in the intercomparison. As seen in
Table 1, measurement techniques with the first seven instru-
ments (i.e., ID 1 to 7) and the immersion mode measure-
ments of FRIDGE (ID 12) examined droplets produced from
bulk illite NX samples in suspension, while the rest used dry-
dispersed illite NX powder, sometimes followed by size se-
lection with a DMA. Methods working with suspensions and
those using dry particles employed different ways to deter-
mine the particle surface area, and the influence of these dif-
ferences on the determination of ns was investigated. For in-
stance, CSU-IS was used to investigate the freezing activity
of both bulk suspension and size-segregated particles in sus-
pension. Two cloud expansion chambers, AIDA-CECC and
MRI-DCECC, examined both polydisperse and size-selected
dry illite NX particles. LACIS and IMCA-ZINC measured
immersion freezing of droplets, where each droplet con-
tained a single particle, and examined differently sized dry
particles. The role of IN modes upon the estimation of ns
was also examined across various temperature ranges. The
EDB-based method was used to measure the contact and im-
mersion mode efficiencies of size segregated dry illite NX
particles around −30 ◦C. Immersion freezing results from
IMCA-ZINC were compared to previously reported ZINC
data (Welti et al., 2009) at temperatures below −31 ◦C and
to PINC data for temperatures below −26 ◦C. In the present
study, we derived ZINC’s ns values from the results reported
in Welti et al. (2009). Specifically, ice formation above 105 %
RHw up to the water drop survival line was used to calculate
ns based on given illite NX particle sizes. We note that the
latent heat of condensation has minimal impact on droplet
temperature, such that RHw > 105 % maintains a water su-
persaturating condition for droplet freezing.
FRIDGE investigated ice nucleation of both dry-
dispersed particles on a substrate at fixed temperatures
(−25 ◦C < T <−18 ◦C) with increasing humidity (“default”
deposition mode nucleation) as well as immersed parti-
cles. In the case of immersion freezing experiments with
suspended samples, the cell temperature was lowered by
1 ◦C min−1.
The range of mass concentrations of the bulk illite NX
sample in suspension varied from 3.1× 10⁻⁶ wt % (CSU-
IS) to 2.6 wt % (M-WT). For dry-dispersed particle mea-
surements, particle concentrations varied from ∼ 10 cm−3
(AIDA) up to ∼ 9000 cm−3 (MRI-DCECC). Experiments
with M-AL, M-WT, EDB, and IMCA-ZINC were performed
on a single drop basis. The shortest residence time of roughly
1.6 s was used for the laminar flow tube, LACIS, and the
slowest cooling rate of 0.3 ◦C min−1 (time-average cooling
rate over an expansion, which translates to the equivalent up-
draft rate of ∼ 0.5 m s−1) was used in AIDA-CECC. Alto-
gether, immersion freezing was examined across the temper-
ature range from∼−10 to∼−38 ◦C, and over a varied range
of cooling rates, nucleation times and particle concentrations
(summarized in publically accessible data base available at
http://imk-aaf-s1.imk-aaf.kit.edu/inuit/).
2.4 Ice nucleation parameterization
We now describe a method to parameterize surface area-
scaled immersion freezing activities using the size equivalent
ice nucleation active surface-site density based on geomet-
ric size (ns,geo ; Connolly et al., 2009; Niemand et al., 2012;
Hoose and Möhler, 2012). In short, this surface-site density
approach approximates ice crystal formation observed in an
experiment as a function of temperature, thus not accounting
for time dependence. Accordingly, ns,geo can be expressed by
ns,geo (T )=−ln
(1−
Nice(T )
Ntotal
)(1
Sve
), (1)
in whichNice is the number concentration of formed ice crys-
tals (cm−3), Ntotal is the total number concentration of par-
ticles prior to any freezing event (cm−3), and Sve is the vol-
ume equivalent surface area of an individual particle (m2).
As demonstrated in Niemand et al. (2012), if the activated
ice fraction is small (< 0.1), the Taylor series approximation
can be applied to Eq. (1). Assuming a uniform distribution of
ns,geo over a given Stotal and a size independency of ns,geo , we
can approximate ns,geo as
ns,geo (T )≈Nice(T )
NtotalSve
=Nice(T )
Stotal
. (2)
Atmos. Chem. Phys., 15, 2489–2518, 2015 www.atmos-chem-phys.net/15/2489/2015/

N. Hiranuma et al.: A comparison of 17 IN measurement techniques 2495
Table 1. Summary of INUIT measurement techniques and instruments. All acronyms are available in Sect. S4. Note “poly” and “mono”
denote polydisperse and quasi-monodisperse size-selected particle distributions, respectively.
ID Instrument Description Portable ? Reference Investigable T range Ice detected T range for this study
1 BINARY∗ Cold stage-supported droplet assay No Budke and Koop (2015) −25 ◦C < T <∼ 0 ◦C −24 ◦C < T <−15 ◦C
2 CSU-IS Immersion mode ice spectrometer Yes Hill et al. (2014) −30 ◦C < T <∼ 0 ◦C poly: −25 ◦C < T <−11 ◦C
mono: −26 ◦C < T <−20 ◦C
3 Leeds-NIPI Nucleation by immersed particles No O’Sullivan et al. (2014) −36 ◦C < T <∼ 0 ◦C −21 ◦C < T <−11 ◦C
instrument
4 M-AL∗ Acoustic droplet levitator No Diehl et al. (2014) −30 ◦C < T <∼ 0 ◦C −25 ◦C < T <−15 ◦C
5 M-WT∗ Vertical wind tunnel No Szakáll et al. (2009); −30 ◦C < T <∼ 0 ◦C −21 ◦C < T <−19 ◦C
Diehl et al. (2011)
6 NC State-CS Cold stage-supported droplet assay No Wright and Petters (2013) −40 ◦C < T <∼ 0 ◦C −34 ◦C < T <−14 ◦C
7 CU-RMCS Cold stage-supported droplet assay No Schill and Tolbert (2013) −40 ◦C < T <−20 ◦C −32 ◦C < T <−23 ◦C
8 AIDA∗ CECC No Möhler et al. (2003) −100 ◦C < T <−5 ◦C poly: -35 ◦C < T <−27 ◦C
Hiranuma et al. (2014a, b) mono: −34 ◦C < T <−28 ◦C
9 CSU-CFDC Cylindrical plates CFDC Yes Tobo et al. (2013) −34 ◦C < T <−9 ◦C −29 ◦C < T <−22 ◦C
10 EDB∗ Electrodynamic balance levitator No Hoffmann et al. (2013) −40 ◦C < T <−1 ◦C imm.a: −31 ◦C < T <−28 ◦C
contactb: −34 ◦C < T <−27 ◦C
11 FINCH∗ Continuous flow mixing chamber Yes Bundke et al. (2008) −60 ◦C < T <−2 ◦C −27 ◦C < T <−22 ◦C
12 FRIDGE∗ Substrate-supported diffusion and Yes Bingemer et al. (2012) −25 ◦C < T <−8 ◦C defaultc: −25 ◦C < T <−18 ◦C
condensation/immersion cell
imm.d: −25 ◦C < T <−18 ◦C
13 LACIS∗ Laminar flow tube No Hartmann et al. (2011); −40 ◦C < T <−5 ◦C −37 ◦C < T <−31 ◦C
Wex et al. (2014)
14 MRI-DCECC Dynamic CECC No Tajiri et al. (2013) −100 ◦C < T <∼ 0 ◦C poly: −26 ◦C < T <−21 ◦C
mono: −29 ◦C < T <−21 ◦C
15 PINC Parallel plates CFDC Yes Chou et al. (2011); −40 ◦C < T <−9 ◦C −35 ◦C < T <−26 ◦C
Kanji et al. (2013)
16 PNNL-CIC Parallel plates CFDC Yes Friedman et al. (2011) −55 ◦C < T <−15 ◦C −35 ◦C < T <−27 ◦C
17 IMCA-ZINC Parallel plates CFDC No Lüönd et al. (2010) −65 ◦C < T <−5 ◦C imm.e: −36 ◦C < T <−31 ◦C
Stetzer et al. (2008); ZINCf: −33 ◦C < T <−32 ◦C
Welti et al. (2009)
∗ Instruments of INUIT project partners, a immersion freezing, b contact freezing, c default deposition nucleation, d immersion freezing with suspended particles, e immersion freezing with IMCA, f ZINC alone.
In addition, the IN efficiency can be related to the BET-SSA
to estimate BET-inferred ice nucleation surface-site density,
ns,BET . A description of the procedures used to estimate both
ns metrics is given in Hiranuma et al. (2014b). The advantage
of using ns,geo is its applicability to both measurements and
modeling activities due to the assumption of particle spheric-
ity. Conversely, ns,geo cannot be directly obtained through
suspension experiments because the size distribution of a
suspended sample for each experiment is not available; there-
fore, Stotal is determined from BET and the sample mass sus-
pended in water.
In order to convert ns,geo values of all dry-dispersed parti-
cle measurements into ns,BET , the geometric size-based ice-
nucleating mass, nm,geo (g−1), is first calculated from the
IN active surface using either the surface-to-mass conver-
sion factor (in m2 g−1) of 6/Dveρ (size-selected case) or
Stotal/Mtotal (polydisperse case) by
nm,geo (T )=Nice(T )
NtotalMve
=6
Dveρns,geo (T )
≈
(Stotal
Mtotal
)ns,geo (T ), (3)
where Mve is the mass of a spherical particle of volume-
equivalent diameter (g), Dve is the volume equivalent mid-
point diameter of particles (m), ρ is the particle den-
sity of illite NX (2.65× 10⁶ g m−3), and Mtotal is the to-
tal particle mass concentration (g cm−3). We note that the
DLS size distribution-derived Stotal/Mtotal (i.e., DLS-SSA)
is 6.54 m2 g−1 and use for the measurements with suspended
particles. We also note that the conversion factor ranges from
11.3 to 2.26 m2 g−1 for size-selected particle diameters from
200 to 1000 nm, respectively, where these sizes denote the
range of particle diameters used in the size-selected cases
in the present study. Therefore, ice-nucleating mass can be
scaled to the BET-SSA (θ , 124.4 m2 g−1) to derive ns,BET as
ns,BET (T )=nm,geo(T )
θ≈nm,sus(T )
θ=
α
Mveθ, (4)
in which nm,sus is the IN active mass for suspension measure-
ments, α represents the ice activated fraction (=Nice/Ntotal),
which is the direct measurement of suspension experiments
and some of the dry-dispersed particle methods. With an as-
sumption of a uniform BET-SSA, the resulting ns,BET may be
representative of measurements with suspended samples be-
cause minimal corrections (only α and θ) are involved when
compared to that with dry-dispersed particles. Owing to in-
ternal surface area and surface roughness, BET-SSA may be
greater than DLS-SSA (O’Sullivan et al., 2014).
Alternatively, we can also convert ice-nucleating mass de-
rived from suspension measurements, nm,sus , to ns,geo us-
ing DLS-SSA to provide a reasonable comparison to dry-
dispersed particle measurements. However, this process re-
www.atmos-chem-phys.net/15/2489/2015/ Atmos. Chem. Phys., 15, 2489–2518, 2015
2496 N. Hiranuma et al.: A comparison of 17 IN measurement techniques
quires one more step than when using ns,BET (with an ad-
ditional assumption of constant size distribution for all sus-
pensions) and two more steps than when using nm. For our
intercomparison study, we used both ns,BET and ns,geo . Be-
cause fewer conversion factors are involved, ns,BET may be
best suited for suspension measurements, and ns,geo may be
best suited for dry-dispersed particle measurements (Eq. 3 to
4 or vice versa).
The usage of DLS-SSA for the calculation of Stotal/Mtotal
of suspension measurements appears to be reasonable, as this
leads to ns,geo for suspension measurements nearly equiva-
lent to ns,geo for dry-dispersed particles. When Stotal/Mtotal
is derived based on TSI-OPS measurements, a value of
0.49 m2 g−1 is obtained, which is smaller by a factor of about
13 compared to DLS-SSA. This difference may be mainly
due to the fact that dry-dispersed particles are typically prone
to agglomeration (discussed below, i.e., Sect. 3.1) compared
to the measurements with suspended particles. The presence
of fewer agglomerates in suspended particles is shown in
Fig. 1 of Hiranuma et al. (2014b). Since the size distribu-
tion of a suspended sample for each experiment was not mea-
sured, DLS-SSA was used for the data evaluation for suspen-
sion measurements throughout this study.
3 Results
3.1 Illite NX characterization
XRD results from the present and previous studies (Friedrich
et al., 2008; Broadley et al., 2012) of the major minerals in
bulk samples of illite NX are presented in Table 2. The results
show that the bulk illite NX powder is composed of various
minerals: illite, kaolinite, quartz, calcite and feldspar, but the
relative mass of these minerals for this study differs from
previous studies. For example, our measurement shows that
the illite NX sample is composed of∼ 69 wt % illite mineral,
whereas others report a larger amount of illite from 74 to
86 wt %. Similarly, we observed a somewhat different con-
tent of other minerals compared to previous studies as listed
in Table 2 (see also the Supplement Fig. S1). We note that
the fractional values in compositional fingerprints may devi-
ate even within the same batch, as all three XRD measure-
ments deviated from the manufacturer’s data (Table 2). Fur-
thermore, our XRD result indicates that the illite NX sample
contains a smaller quartz fraction (3 %) than illite IMt1 from
the Clay Minerals Society (10 to 15 % quartz according to
the official XRF data and 20 % based on our own measure-
ments).
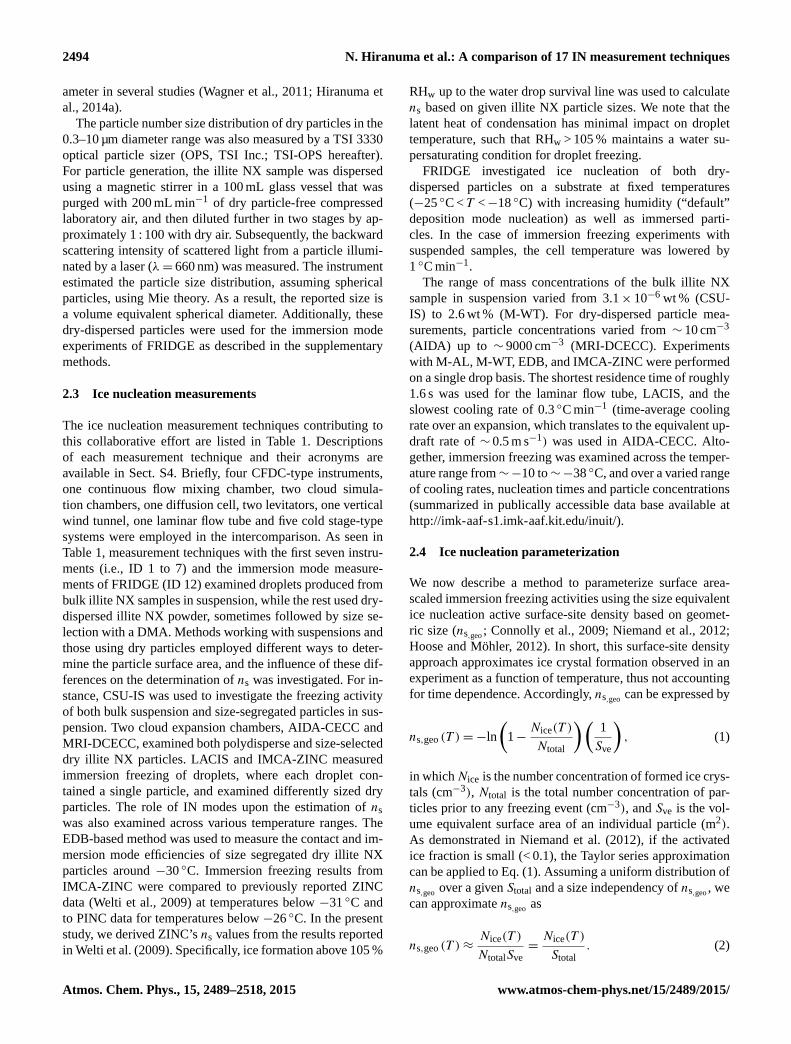
To complement bulk XRD analysis, the abundances of 13
elements (Pt, K, C, Ca, O, Fe, Mg, Al, Si, P, S, Pb and Ti),
which are commonly identified in illite-rich samples, were
measured by EDX spectroscopy on a single particle basis.
Four representative EDX spectra are presented in Fig. 1. The
presence of Fe and Mg is typical and characteristic for il-
Figure 1. EDX spectra of representative illite NX particles. (a) Typ-
ical illite, (b) calcite-rich mineral, (c) titanium-oxide-rich mineral,
and (d) lead-rich mineral. Scanning electron microscopy images of
characterized particles are shown in subpanels. A schematic repre-
sentation of the illite’s crystal structure (silicon in yellow, aluminum
in black, oxygen in red and potassium in purple) is also shown.
lite NX particles. The observed large amounts of Si and Al
are due to the presence of layered aluminosilicate structures
(i.e., layer of SiO2 and Al2O3). The observed dominant plat-
inum (Pt) signals in all spectra originate from the sputter
coating conducted prior to EDX analyses. Figure 1a shows
the typical illite spectrum, which is similar to the one previ-
ously published in Welton (1984). Illite-rich minerals, which
included impurities of calcite, TiO2 and Pb-P, were located
by the brightness difference in the backscattered electron de-
tector micrograph images. The results are shown in Fig. 1b,
Atmos. Chem. Phys., 15, 2489–2518, 2015 www.atmos-chem-phys.net/15/2489/2015/

N. Hiranuma et al.: A comparison of 17 IN measurement techniques 2497
Table 2. X-ray diffraction analyses of the bulk composition of illite
NX powder.
Weight Percentage (wt %)
Mineral This Manufacturer Broadley Friedrich
study Data et al. (2012) et al. (2008)∗
Illite 69 86 74 76
Kaolinite 10 10 7 5
Quartz 3 4 7 < 1
Calcite/Carbonate 3 N/A 2 2
Feldspar 14 N/A 10 4
(Orthoclase/Sanidine)
∗ Friedrich et al. (2008) noted 11 wt % additional impurities, including phlogopite (7.8 wt %), anhydrite
(1.4 wt %), plagioclase (1.1 wt %), and apatite (0.7 wt %).
c and d (inclusion of calcite, TiO2 and Pb-P, respectively).
However, the EDX technique is not automated to detect these
impurities present within the illite NX particles because of
their very small weight fraction. Therefore, the possible ef-
fect of these observed impurities in illite NX upon the ice nu-
cleation activity cannot be evaluated on the basis of its bulk
analysis of the chemical composition. Nonetheless, detection
of non-illite mineral components may reflect the complexi-
ties of natural dust particles, which typically contain multi-
ple sites with differing nucleation abilities. Thus, illite-rich
clay minerals can be used as reference material to mimic the
ice nucleation activity of physically and chemically complex
natural dusts (Murray et al., 2012).
The measured BET-SSA are 124.4 and 123.7 m2 g−1 with
N2 and H2O vapor, respectively, as the adsorbing gas on illite
NX particle surfaces. The similar BET surface areas for both
N2 and H2O vapor gas adsorption suggest that the forma-
tion of a few monolayers of H2O does not alter the surface
morphology or the mineralogical phase of illite NX parti-
cles. For comparison, our measurements of θN2for illite NX
particles agreed with previously reported data within 20 %
(104.2 m2 g−1; Broadley et al., 2012). Since illite NX parti-
cles have significant internal surface area, BET-derived sur-
face areas can be expected to be larger than those derived
from the laser diffraction technique. Supporting this notion,
an SEM (scanning electron microscopy) image of an illite
NX particle from Broadley et al. (2012) shows how micron-
sized particles are made up of many nanometer-sized grains.
Normalized surface area distributions to the total surface
area concentration measured by four different techniques are
shown in Fig. 2. According to the manufacturer, 95 % (by
mass) of the dry and mechanically de-agglomerated illite NX
particles have a diameter smaller than 650 nm (i.e., D95).
This mass-based particle size is substantially smaller than
that of another type of Arginotec illite (Arginotec, SE-illite,
D95 = 5 µm). Interestingly, all mass size distributions mea-
sured in this study (not shown here) indicate a substantial
mass fraction above 650 nm which is, in all cases, larger
than 5 % (18, 24, 77 and 99.9 % for DLS, AIDA, MRI-
DCECC and TSI-OPS for the FRIDGE immersion exper-
iments, respectively), indicating the presence of agglomer-
Figure 2. Surface area distributions of (a) suspended and (b–
d) dry illite NX particles. Hydrodynamic size-based surface area
distributions are measured in suspension using DLS. The aver-
age (± standard error) of five measurements with different con-
centrations of suspended illite NX powder (0.05, 0.1, 0.25, 0.5
and 1 mg mL−1) is presented in (a). Volume equivalent diameter-
based dry-dispersed particle surface area distributions measured in
the AIDA chamber (mean of 10 measurements± standard error)
and MRI-DCECC (two individual measurements) are shown in (b)
and (c), respectively. Panel (d) shows optical diameter-based parti-
cle surface area distributions measured by a TSI-OPS used for the
FRIDGE immersion mode experiments. Dotted lines represent log-
normal fittings, and corresponding mode diameters are (a) 0.32 µm,
(b) 0.36 µm, (c) 0.62 µm and (d) 4.75 µm. The width-parameters of
log-normal fittings are (a) 0.55, (b) 0.65, (c) 0.95 and (d) 1.10.
ates in the aerosol and suspension phases prepared for the IN
experiments. The surface area distribution of the DLS hy-
drodynamic diameter-based measurement (Fig. 2a) agreed
well with in situ measurements from the AIDA chamber
(Fig. 2b), suggesting the size distributions of dry illite NX
www.atmos-chem-phys.net/15/2489/2015/ Atmos. Chem. Phys., 15, 2489–2518, 2015

2498 N. Hiranuma et al.: A comparison of 17 IN measurement techniques
particles during AIDA experiments were similar to those
of suspension measurements. This observation is consistent
with results presented in Hiranuma et al. (2014b). Briefly,
the authors found agreement between the DLS-based hydro-
dynamic diameter and the AIDA-derived volume equivalent
diameter of hematite particles. As opposed to the AIDA ob-
servation, the wider distributions and the shift in the mode di-
ameters in the MRI-DCECC measurements towards a larger
size (0.62 µm, Fig. 2c) when compared to Fig. 2a and b may
indicate a higher degree of particle agglomeration as a result
of different degrees of pulverization during the particle gen-
eration processes or particle coagulation at the high aerosol
number concentration used for these measurements. A more
pronounced agglomeration effect was observed by the TSI-
OPS measurements (Fig. 2d), such that a surface area dis-
tribution of supermicron-sized particles was obtained. Thus,
different types of dry particle dispersion methods can con-
tribute to varying degrees of agglomeration and the observed
differences in surface area distributions. Though all size seg-
regating instruments used in the present study are well cal-
ibrated, we cannot rule out the effect of measurement tech-
niques themselves on the observed differences in particle size
distribution. In Sect. 4.4 we discuss whether agglomeration
has an effect on the IN activity.
The cation release by illite NX in the aqueous suspension
was measured with IC as a function of time. The suspension
was kept mechanically agitated for 3 weeks. The following
cations were identified in the samples: K+, Ca2+ and Mg2+.
As seen in Fig. 3, IC data clearly demonstrates that roughly
all cations were released into the aqueous environment by
illite NX almost instantaneously. The concentration of the
cations increased rapidly and reached equilibrium within the
first 2 min after immersion of sample into water. Of all the
cations measured, only Ca2+ exhibited a slow concentration
raise on the longer time scales.
3.2 Immersion freezing measurements and
intercomparisons
All ice nucleation spectra with ns,BET(T ) and ns,geo(T ) are
shown in Figs. 4 and 5, respectively. A similar figure with
nm(T ) is also shown in Fig. S2. Furthermore, we compare
the ns data from 17 instruments to 4 literature results. Specifi-
cally, IN spectra reference curves of previously reported illite
NX particles (Broadley et al., 2012, hereafter B12), micro-
cline particles (Atkinson et al., 2013, hereafter A13), ATD
and desert dusts (Niemand et al., 2012, hereafter N12) are
also expressed as both ns,BET(T ) and ns,geo(T ). The conver-
sion between ns,geo(T ) and ns,BET(T ) was performed accord-
ing to (Eqs. 3 and 4). The ns(T ) (m−2 as a function of ◦C)
fits from the reference literature are
Figure 3. Evolution of the cation concentration in aqueous suspen-
sion of 0.1 g illite in 10 mL deionized water with time. The scaling
of the time-axis is different for three different subsections of the
time series (USTS, STS and LTS).
nA13s,BET = 104
× exp(−1.038(T + 273.150)+ 275.260), (5)
nB12s,BET = 104
× exp
[(6.530× 10⁴
)+
((−8.215× 10²
)× (T + 273.150)
)+
(3.447× (T + 273.150)2
)+
((−4.822× 10⁻³
)× (T + 273.150)3
)], (6)
nN12(ATD)s,geo = exp(−0.380T + 13.918), (7)
nN12(Dust)s,geo = exp(−0.517T + 8.934) . (8)
For microcline (K-feldspar), the ns,geo to ns,BET conversion
was performed using a laser diffraction-based surface-to-
mass conversion factor of 0.89 m2 g−1 and an N2 BET-SSA
of 3.2 m2 g−1 (Atkinson et al., 2013). For ATD and nat-
ural dust, we used a surface-to-mass conversion factor of
3.6 m2 g−1, assuming a monodisperse particle size at the
log-normal fit mode diameter of 0.64 µm (Niemand et al.,
2012) and the measured N2 BET-SSA of 34.4 m2 g−1 (this
study). We note that the ATD parameterization is valid only
for−26.7 ◦C < T <−17.7 ◦C. In addition, we also present 14,
0.14 and 0.0014 % scaled A13 nscurves to see if K-feldspar
(microcline) can be used as a scaling factor to determine the
ns(T ) of illite NX.
We do not attempt to completely discuss the immersion
freezing activity of illite NX particles measured by each mea-
surement technique. Instead, brief remarks regarding each
Atmos. Chem. Phys., 15, 2489–2518, 2015 www.atmos-chem-phys.net/15/2489/2015/

N. Hiranuma et al.: A comparison of 17 IN measurement techniques 2499
Figure 4. Intercomparison of 17 instruments using ns,BET . Black or red cross markers are interpolated ns(T ) used for T -binned averaging.
Note that M-AL and M-WT results are presented in (d). In (k), FRIDGE results of default (solid square) and imm.mode (open diamond)
measurements are presented. Both ZINC (solid square) and IMCA-ZINC (open diamond) data are shown in (p). Reference immersion
freezing ns(T ) spectra for illite NX (B12; Broadley et al., 2012), K-feldspar (A13; Atkinson et al., 2013), ATD and desert dusts (Dust) (N12;
Niemand et al., 2012) are also shown (See Sect. 3.2).
method are summarized below. The detailed discussion of
the methods intercomparison follows in Sect. 3.3.
3.2.1 BINARY
This recently developed microliter droplet assay technique
demonstrated its capability of measuring immersion freezing
of clay minerals in the temperature range of −15 to −24 ◦C.
Similar to most of the other suspension-based techniques, BI-
NARY identified a steep ns(T ) increase, which started just
below −20 ◦C. The BINARY ns(T ) spectrum was derived
by compiling measurements with varied illite NX mass con-
centrations over 2 orders of magnitude (0.1 to 10 mg mL−1,
see the supplementary methods). Immersion freezing effi-
ciency of illite NX particles collapsed into a single ns(T )
spectrum, i.e., IN efficiency does not depend on suspended
particle mass for the concentration range studied here. This
observation is a check for consistency and it implies that ice
nucleation is indeed triggered by suspended illite NX parti-
cles, and neither by impurities contained in the water used
for dilution nor at the glass surface supporting the droplets.
If IN efficiency did depend on suspended particle mass, dif-
ferent ns(T ) spectra would result from the various illite NX
concentrations, which are shifted by the respective dilution
factor.
3.2.2 CSU-IS
This new immersion freezing device was used to investi-
gate the freezing activity of both bulk suspension and size-
segregated particles in suspension. A new approach was em-
ployed for size-selected measurements, wherein 500 nm mo-
bility diameter size-selected particles were collected on a Nu-
clepore filter and then rinsed from it for the immersion freez-
www.atmos-chem-phys.net/15/2489/2015/ Atmos. Chem. Phys., 15, 2489–2518, 2015

2500 N. Hiranuma et al.: A comparison of 17 IN measurement techniques
Figure 5. Geometric size-based ice nucleation active surface-site density, ns,geo , of 17 measurement techniques. Black or red cross markers
are interpolated ns(T ) used for T -binned averaging. Note that M-AL and M-WT results are presented in (d). In (k), FRIDGE results of
default (solid square) and imm.mode (open diamond) are presented. Both ZINC (solid square) and IMCA-ZINC (open diamond) data are
shown in (p). Reference immersion freezing ns(T ) spectra are provided as in Fig. 4.
ing measurements. The results suggest size independence of
ns within the experimental uncertainties (a combination of
binomial sampling error and the uncertainty of conversion
of aerodynamic particle diameter to mass) for the range of
examined size (500 nm vs. bulk) and mass concentrations
of bulk illite NX powder in suspensions from 3.1× 10⁻⁶ to
0.5 wt %, for non-size-segregated particles, and 2.2× 10⁻⁵
to 4.4× 10⁻⁴ wt % for size-segregated particles.
3.2.3 Leeds-NIPI
This suite of cold stage instruments has the capacity
to operate using droplets with volumes in the microliter
to picoliter range. This enables high resolution immer-
sion freezing analysis for a wide range of temperatures
from higher (−22 ◦C < T <−11 ◦C) to lower temperatures
(−37 ◦C < T <−26 ◦C). The highest freezing temperatures
are attained with the largest droplets, which contain the
largest surface area of illite NX. Combined with the previ-
ous parameterization reported in Broadley et al. (2012), the
Leeds-NIPI data follows the overall ns(T ) spectrum defined
by the bulk of the instruments. This suggests that immersion
freezing efficiency, inferred by ns(T ), of illite NX particles
is dependent on neither droplet volume nor mass of illite
NX particles in suspension (i.e., wt % 0.1 or 1 %); instead
the freezing efficiency only depends on the surface area per
droplet. Together with CSU-IS, these two instruments pro-
vided data points for temperature as high as ∼−11 ◦C, esti-
mating a similar lower-limit of ns,BET values of ∼ 10 m−2.
3.2.4 M-AL and M-WT
Both methods examine individual drops that are freely sus-
pended without any contact with walls or substrates. In M-
WT drops are floated at their terminal velocities in a lam-
inar air stream, in which conditions of ventilation and heat
Atmos. Chem. Phys., 15, 2489–2518, 2015 www.atmos-chem-phys.net/15/2489/2015/

N. Hiranuma et al.: A comparison of 17 IN measurement techniques 2501
transfer are similar to those of droplets falling through the
atmosphere. Both M-AL and M-WT techniques analyzed the
freezing efficiency of drops containing polydisperse illite NX
particles in the temperature range between −14 and −26 ◦C.
The ns values agree reasonably well with substrate-supported
suspension experiments (with the exception of FRIDGE ex-
periments), implying that the surface making contact with
the substrate has a negligible effect on immersion freezing
for our experimental conditions.
3.2.5 NC State-CS
Extensive experimental conditions were realized by NC
State-CS (Wright and Petters, 2013; Hader et al., 2014).
Unique aspects of this instrument are the sampling of drops
within a squalene oil matrix that allows for experiments
using cooling rates as slow as 0.01 K min−1 and an auto-
mated freeze detection algorithm that allows for the rapid
processing of more than 1000 possible drops per experiment
to improve sample statistics. Drops containing ∼ 0.0001 to
1.0 wt % of the illite NX test sample were studied at a cooling
rate of 1 K min−1 to find the immersion freezing ability. A to-
tal of nine immersion mode freezing experiments, spanning a
range of drop volumes from ∼ 400 picoliter to 150 nanoliter,
were performed. Using this instrument a wide range of tem-
peratures was investigated (−34 ◦C < T <−14 ◦C) yielding
ns(T ) values ranging from 102 to 1010 m−2. The data from
the nine individual runs collapsed into a single ns(T ) spec-
trum suggesting that the mass loading of dust in the drop did
not affect the measurements for the wt % values investigated.
At the high T end (T >−20 ◦C), the data are in reasonable
quantitative agreement with the CSU-IS measurements. At
the low T end (T <−20 ◦C), the data are in agreement with
the B12 reference spectrum.
3.2.6 CU-RMCS
The University of Colorado (CU)-RMCS examined the
freezing abilities of droplets containing 1.0 wt % illite NX.
CU-RMCS detected the warmest immersion freezing of illite
NX particles at about −23 ◦C under the experimental condi-
tions used in the present work (see the Supplement for fur-
ther details). Results for −32 ◦C < T <−23 ◦C are from six
different experiments using four different droplet size bins:
10–20, 20–60, 60–120, and 120–200 µm (lateral diameter).
These droplet sizes correspond to a variation in droplet vol-
ume from ∼ 0.3 picoliter to 2.5 nanoliter.
3.2.7 AIDA
The AIDA cloud simulation chamber generates atmospher-
ically relevant droplet sizes (several µm in diameter, vary-
ing with cooling rates), and therefore closely simulates
mixed-phase cloud conditions. Ice-nucleating efficiencies of
both polydisperse and quasi-monodisperse illite NX particles
were investigated in this study. ns of DMA size-selected il-
lite NX particles (200, 300 and 500 nm mobility diameter)
agreed well with that of the polydisperse population for im-
mersion freezing experiments, within previously reported un-
certainties (T ± 0.3 ◦C and ns± 35 %; Steinke et al., 2011).
Thus, a negligible size dependency of ns for “submicron”
dry illite NX particles for temperatures below −27 ◦C was
found. Previously, Hiranuma et al. (2014a) demonstrated the
size independence of the ns value using two different sizes
of submicron hematite particles (200 and 1000 nm volume
equivalent diameter) based on AIDA deposition mode nucle-
ation experiments. Such a similarity might remain true for
the immersion mode freezing of mineral dust particles that
are smaller than 1 µm diameter.
3.2.8 CSU-CFDC
This CFDC provided data for condensation/immersion freez-
ing at around −21.2, −25.1 and −29.7 ◦C (a total of eight
data points with two, two and four points at around each
temperature, respectively), which extends to a warmer region
than the AIDA measurements. As demonstrated in DeMott
et al. (2015), higher RHw values were required for full ex-
pression of immersion freezing in CSU-CFDC. The use of
105 % RHw in the CFDC has been shown to underestimate
INP activity for natural dusts by up to a factor of 3, but is a
necessary compromise. Comparably, the CSU-CFDC results
agreed well with the AIDA measurements within a factor
of 3 in ns,geo estimation (AIDA ns > CSU-CFDC ns; DeMott
et al., 2015). All the CFDC measurements were conducted
with 500 nm mobility diameter size-selected particles, as dis-
cussed in the supplementary methods.
3.2.9 EDB
With EDB, both the contact and immersion mode freezing
efficiencies of illite NX particles were investigated. The con-
tact nucleation mode ns were clearly higher than the immer-
sion mode ns (by more than 1 order of magnitude in terms
of ns,geo , Fig. 5i). This was in part due to the fact that immer-
sion freezing experiments were conducted only when illite
NX particles were not frozen via contact nucleation but re-
mained immersed in a supercooled droplet in the EDB cell
(see the Supplement).
3.2.10 FINCH
The immersion freezing results from FINCH showed the
highest ns values in the −22 to −27 ◦C temperature range
out of all of the other instrument results. All the FINCH
measurements were conducted with 500 nm mobility diam-
eter size-selected particles. Two possible reasons for high
ns values when compared to the other measurements are:
(1) an overestimation of nsdue to excess Nice and/or un-
derestimated Stotal or (2) a large temperature-uncertainty. It
is noteworthy that the total INP concentration was kept be-
low 140 L−1 in order to avoid saturation limitation due to
www.atmos-chem-phys.net/15/2489/2015/ Atmos. Chem. Phys., 15, 2489–2518, 2015

2502 N. Hiranuma et al.: A comparison of 17 IN measurement techniques
a high number of growing ice crystals (DeMott et al., 2011).
A constant total concentration of particles continuously pass-
ing through the chamber was maintained at 1.07± 0.17 cm−3
(average± standard deviation).
3.2.11 FRIDGE
FRIDGE data, which cover both measurements of dry and
immersed particles with the same instrument but with differ-
ent sample processing, lie within the upper edge of the bulk
of other ns data points. There are a few important implica-
tions from the FRIDGE results. First, on average, the mea-
surements with dry particles in the “default” setting showed
more than an order of magnitude higher ns in comparison to
the immersed particles in FRIDGE experiments (both ns,BET
and ns,geo , Figs. 4 and 5) at −25 ◦C < T <−18 ◦C. For in-
stance, FRIDGE experiments in the pure immersion mode
showed much lower ns than that with the default setting
(i.e., combined deposition and immersion mode), but agreed
with other immersion data sets. Second, a sudden increase in
ns(T ) was found for the measurements with immersed par-
ticles at ∼−20 ◦C, suggesting a dominant activation around
−20 ◦C. This transition is a unique behavior only found with
the FRIDGE’s IN detecting sensitivity. A temperature shift
(i.e., shifting the data ∼ 7 ◦C lower) results in FRIDGE data
overlapping with the bulk of other data and may offset dis-
crepancies. However, other mechanistic interpretations (e.g.,
contribution of agglomeration) are also plausible causes of
this discrepancy. More detailed discussions of the role of ag-
glomerates upon ns and sample processing are available in
Sects. 4.4 and 4.5.
3.2.12 LACIS
With the shortest instrument residence time (∼ 1.6 s), LACIS
measured immersion mode freezing of illite NX particles
for three different mobility diameters (300, 500 and 700 nm)
from −31 ◦C down to the homogeneous freezing tempera-
ture. Similar to AIDA results, a size independence of ns of
submicron illite NX particles was observed within defined
experimental uncertainties (see the supplementary methods).
Further, without any data corrections, the results of LACIS
reasonably agreed with AIDA measurements. Furthermore,
though there is no overlapping temperature range for LACIS
and CSU-CFDC in the present study, consistency between
data from LACIS and CSU-CFDC for other clay minerals
(i.e., different kaolinite samples) has been described previ-
ously (Wex et al., 2014). The results from both instruments
agreed well with each other from a data evaluation based on
ns, and this agreement was even improved when the differ-
ent residence times in LACIS and the CSU-CFDC were ac-
counted for (i.e., when nucleation rate coefficients were com-
pared). Furthermore, a size independence of the immersion
mode freezing was seen for Fluka-kaolinite particles with
mobility diameters of 300 and 700 nm in Wex et al. (2014),
and for illite NX particles when comparing particles with
mobility diameters of 500 nm to bulk material (Augustin-
Bauditz et al., 2014).
3.2.13 MRI-DCECC
Comparison between polydisperse and size-selected (300 nm
mobility diameter) measurements in this cloud simulation
chamber demonstrated the size independency of ns for
submicron illite NX particles for slightly higher tempera-
tures (up to −21 ◦C) than AIDA results. Interestingly, MRI-
DCECC data exhibited at least an order of magnitude higher
ns values than most other suspension measurements. We
note that only negligible freezing events were detected above
−21 ◦C even with a ∼ 9000 cm−3 number concentration of
polydisperse illite NX particles in part due to the detection
limit of the welas® optical counter of Nice = 0.1 cm−3.
3.2.14 PINC
PINC provided data for immersion freezing at around−25.4,
−30.2 and −34.6 ◦C (a total of nine data points with one,
four and four points at around each temperature, respec-
tively). The estimated nsvalues are in agreement with other
measurements for the test range of −35 ◦C < T <−25 ◦C af-
ter applying a residence time correction of about a factor of
3. The data are for ice nucleation onto 500 and 1000 nm mo-
bility diameter illite NX particles; therefore, an OPC thresh-
old size of 2 µm for ice detection is used. The impactor used
for sampling particles into PINC was characterized for size-
resolved particle losses and was found to have a cutoff (D50)
of 725 nm mobility diameter. As such, when determining
ns,geo the particles losses (25 to 60 %, see the Supplement for
more details) were taken into account for calculating acti-
vated fractions. We note that ns,geo increased after correcting
the data for particle losses, resulting in agreement between
the data from PINC and data from LACIS, AIDA and UC-
RMCS in the temperature range from −25 to −35 ◦C.
3.2.15 PNNL-CIC
The IN efficiency of illite NX particles in the immersion
mode in the temperature range of −35 ◦C < T <−27 ◦C was
observed to increase at lower temperatures. Estimated ns val-
ues were somewhat higher in this temperature range when
compared to those from most of the other measurements.
Data were obtained at conditions where PNNL-CIC was op-
erated at 105 % RHw at three different temperatures. Dust
particles greater than ∼ 1 µm (50 % cut size) were removed
before they were size-selected and transported to the PNNL-
CIC. The OPC detection threshold was set ≥ 3 µm; see the
Supplement for more details.
Atmos. Chem. Phys., 15, 2489–2518, 2015 www.atmos-chem-phys.net/15/2489/2015/

N. Hiranuma et al.: A comparison of 17 IN measurement techniques 2503
3.2.16 IMCA-ZINC
Coupled with IMCA, ZINC showed reasonable agreement
with AIDA and PNNL-CIC. This reproducibility verified the
performance of the IMCA-ZINC combination, which was
not tested during ICIS-2007 (DeMott et al., 2011), perhaps
due to the similarity in the experimental conditions (i.e., par-
ticle generation) to the other two methods. We also note that
the residence time in ZINC is about a factor of 3 longer than
that in PINC. The IMCA-ZINC measurements in comparison
to the measurements with ZINC alone (i.e., a combination of
deposition nucleation, contact freezing, condensation freez-
ing, surface condensation freezing and immersion freezing)
is discussed in Sect. 4.5 in more detail.
Overall, as described above (Sects. 3.2.1 to 3.2.6), sus-
pension experiments with cold stage devices and levita-
tion techniques provide IN measurements under more con-
trolled (with respect to droplet size, concentration and mass
of particles) conditions and a wider temperature range (up
to −11 ◦C) than comparable dry-dispersed particle experi-
ments. The resulting nsvalues from these suspension exper-
iments are also independent of the total number of droplets
and suspended dust particle mass.
The estimated nsvalues of dry test particles below
−25.5 ◦C are in reasonable agreement with a previous study
(Broadley et al., 2012) at temperatures below −25 ◦C. Fur-
thermore, the strong temperature dependence and size inde-
pendence of ns may suggest a uniform distribution of freez-
ing sites over the total surface of illite NX particles in the im-
mersion mode in this temperature range. Specifically, AIDA
and MRI-DCECC have shown size-independent ns values for
submicron dry-dispersed particles. Overall, compared to sus-
pension measurements, dry-dispersed particle measurements
showed higher ns values. For example, FINCH is the only in-
strument which showed higher ns values than the parameter-
ization by Niemand et al. (2012) for ATD. Likewise, AIDA
results indicated slightly higher ns values than CSU-CFDC’s
results. The lower ns of CSU-CFDC may be a consequence
of underestimation of Nice, possibly due to its constrained
RHw (at 105 %) and/or the disturbance of aerosol lamina be-
tween two plates in a CFDC (DeMott et al., 2015).
3.3 Intercomparisons based on the slope parameter of
ns(T ) spectra
A compilation of 17 ns spectra from 17 instruments in a tem-
perature range between −10.1 and −37.5 ◦C is presented in
Fig. 6. For both the geometric area-based and the BET area-
based ns, the differences among measurements can be more
than 1 order of magnitude at any given temperature. Diver-
sity is especially pronounced for several orders of magnitude
in ns at −27 ◦C≤ T ≤ −18 ◦C, where the results from sus-
pension measurements and a majority of dry measurements
coexist (see the investigated T range for each technique in
Table 1). Another notable feature of this specific tempera-
ture range in Fig. 6 is the coincidence of the steepest slope
in the spectrum (i.e., the absolute value of 1log(ns)/1T
or |1log(ns)/1T | in log (m−2) ◦C−1, hereafter denoted as
1log(ns)/1T ) when compared to other temperature ranges.
For instance, ns increases sharply at temperatures colder than
−18 ◦C to be nearly parallel to the A13 parameterization
down to −27 ◦C, where it starts leveling off and is eventu-
ally overlapping with the N12 parameterization at the low
temperature segment.
Correspondingly, the overall trend of the spectrum is
traced by the measurements from NC State-CS alone
(Fig. 4e). Moreover, the slopes of the spectrum for three
sub-segments (−34 ◦C < T <−27 ◦C, −27 ◦C < T <−20 ◦C,
and −20 ◦C < T <−14 ◦C) can be calculated from interpo-
lated data and compared to N12 and A13 parameterizations.
As expected, the steepest slope in the spectrum (= 0.66) of
the NC State-CS data was found in the−27 ◦C < T <−20 ◦C
range, which was similar to that of the A13 parameteriza-
tion (0.45 for T >−25 ◦C). However, smaller slope values
are found for the other two segments (0.18 for T <−27 ◦C
and 0.29 for T >−20 ◦C), which are comparable to the
temperature-independent N12 slopes (0.17 for ATD and 0.22
for Dust) and the B12 slope (0.25 for −35 ◦C < T <−27 ◦C),
suggesting that a dominant fraction of INP contained in
our test dust becomes ice active in immersion freez-
ing at −27 ◦C < T <−20 ◦C. In addition, FRIDGE immer-
sion mode measurements also show a sharp decrease in
1log(ns)/1T (from 0.59 to 0.25, Figs. 4k and 5k) for the
measurements with immersed particles at ∼−20 ◦C. Simi-
lar observations are made by most of the other suspension
measurement techniques. In short, most suspension meth-
ods capture the steepest segment of the ns(T ) spectral slopes
(1log(ns)/1T ) at −27 ◦C < T <−20 ◦C, where the slope is
nearly parallel to the A13 parameterization. One exception
is CU-RMCS (Fig. 4f). The highest possible freezing tem-
perature investigated by this experimental system was about
−23 ◦C with ∼ 2.5 nanoliter droplets containing 1.0 wt % il-
lite NX (see the supplementary methods). Hence, CU-RMCS
did not capture the transition in 1log(ns,BET)/1T at around
−20 ◦C, but the steep slope of the spectrum (= 0.36) vali-
dated the high density of IN active sites below −23 ◦C. The
error in temperature for this technique is always ±0.5 ◦C,
based on freezing experiments without any foreign sub-
stances in supercooled drops (i.e., homogeneous freezing ex-
periments).
Similarly, dry-dispersed particle measurements also ex-
hibit scattered data for their measured temperature ranges.
Both agreements and equally important disagreements were
observed. First, the agreements are summarized. AIDA data
show that the values of 1log(ns,geo)/1T (= 0.22, Fig. 5g)
are identical for both polydisperse and size-selected mea-
surements, perhaps suggesting a uniform distribution of ac-
tive sites over the available Stotal of illite NX in this study.
Similarly, IMCA-ZINC’s 1log(ns,geo)/1T (= 0.24, Fig. 5p)
derived from 200, 400 and 800 nm mobility diameters is vir-
www.atmos-chem-phys.net/15/2489/2015/ Atmos. Chem. Phys., 15, 2489–2518, 2015

2504 N. Hiranuma et al.: A comparison of 17 IN measurement techniques
Figure 6. Immersion freezing ns(T ) spectra of illite NX particles from 17 instruments calculated as a function of the BET (a) and geometric
(b) surface areas. Reference immersion freezing ns(T ) spectra are provided as in Figs. 4 and 5. Dry-dispersed particle (red markers) and
suspension (blue markers) results for ns,BET and ns,geo are shown in (c) and (d), respectively, to highlight the difference between dry particle
and suspension subsets.
tually identical to the slope estimated from AIDA measure-
ments. PINC estimated 1log(ns,geo)/1T (= 0.26, Fig. 5n)
values are in reasonable agreement with AIDA and IMCA-
ZINC and N12 parameterizations at temperatures below
−25 ◦C. From the CSU-CFDC results, 1log(ns,geo)/1T de-
rived from interpolated data is 0.40 (Fig. 5h). Considering the
AIDA and CSU-CFDC data, the ns(T ) spectrum depicts sim-
ilar trends (i.e., ns or temperature deviation around −27 ◦C)
compared to those seen in the NC State-CS results (Fig. 5e)
and is also parallel to the A13 curve (slope = 0.45) down
to temperatures around −27 ◦C and is parallel to the N12
Dust curve (slope= 0.22) for the lower temperature segment.
LACIS measurements show that 1log(ns,geo)/1T (= 0.19,
Fig. 5l) is also in agreement with that from AIDA, verifying
Atmos. Chem. Phys., 15, 2489–2518, 2015 www.atmos-chem-phys.net/15/2489/2015/

N. Hiranuma et al.: A comparison of 17 IN measurement techniques 2505
a deteriorated freezing ability of illite NX particles in the in-
vestigated temperature range. EDB was used to examine both
the contact and immersion freezing modes. Nonetheless, the
slopes of the spectra for both modes (0.11 for immersion
mode freezing and 0.16 for contact mode freezing, Fig. 5i)
are similar to the N12 ATD curve (slope= 0.17). From the
fact that the value of 1log(ns,geo)/1T of FINCH (= 0.27,
Fig. 5j) above −27 ◦C is similar to that of the N12 dust pa-
rameterization (whereas this relationship would be expected
below −27 ◦C), we suspect that a temperature uncertainty
may be the main cause of the observed deviation of its data
from others. Lastly, at −35 ◦C < T <−27 ◦C, PNNL-CIC’s
1log(ns,geo)/1T (= 0.19, Fig. 5o) agreed well with that of
the N12 dust parameterization in the same temperature range.
Next, the disagreements between dry-dispersed particle
and suspension measurements are discussed. Specifically, the
MRI-DCECC results show lower values of 1log(ns,geo)/1T
(= 0.29) up to −21 ◦C as compared to the suspension
measurements. Additionally, in the temperature range from
−29 ◦C < T <−21 ◦C, the MRI-DCECC data show higher
values of ns than those observed in suspension measure-
ments. This relatively constant 1log(ns)/1T value along
with higher nsvalues through the range contrasts with the ob-
served sharp transition in 1log(ns)/1T in suspension mea-
surements. We note that MRI-DCECC experiments may have
been carried out in the presence of a high degree of agglom-
eration (Fig. 2c and d). Hence, particle processing (i.e., dry-
ing and suspension) may not be the only factor causing this
difference and other contributions cannot be ruled out (see
Sect. 4).
To conclude, the results from suspension and dry mea-
surements suggest evidence that the ns of illite NX particles
derived from immersion freezing is independent of or only
weakly dependent on droplet size, mass percent of illite NX
sample in suspension and droplets, particle size of the tested
illite NX and cooling rate during freezing in the range of
conditions probed; see the Supplement for more detailed in-
formation regarding experimental conditions for each instru-
ment. Overall, the sample processing (i.e., dry vs. suspension
sample) may have an effect on the immersion freezing effi-
ciency of illite clays. A more detailed discussion will follow
in Sect. 4 below.
4 Discussion
For detailed comparison of methodologies, the immer-
sion freezing properties of illite NX particles in a wide
range of temperatures is further discussed by comparing
ns(T ) spectra from all 17 instruments (Sect. 4.1). Specifi-
cally, we present T -binned average data (i.e., 1 ◦C bins for
−37 ◦C < T <−11 ◦C). A moving average (where original
data points are finer than 1 ◦C) or a Piecewise Cubic Her-
mite Interpolating Polynomial function (where original data
points are coarser than 1 ◦C) was used for data interpolation.
All data from the 17 instruments, as shown in Figs. 4 and 5,
were interpolated.
We also discuss potential reasons for the diversity ob-
served from intercomparisons of dry and suspension mea-
surement techniques. Both systematic errors (Sect. 4.2) and
mechanistic uncertainties (Sects. 4.3 to 4.6) are qualitatively
evaluated to understand the measurement uncertainties of
such techniques. Some factors may introduce diversity in ns,
whereas others may shift activation temperatures horizon-
tally to match the ns values from other instruments, perhaps
biasing the overall accuracy and precision of instruments.
Here we address the relative importance of those factors with
respect to their effect on the estimation of ns.
4.1 Dry vs. suspension ns(T ) data
The multiple exponential distribution fits (also known as
the Gumbel cumulative distribution function) for T -binned-
ns(T ) data are shown in Fig. 7. The fits for T -binned max-
ima and minima ns from 17 measurement techniques are pre-
sented as pink shaded areas. All fits presented in this fig-
ure are derived using parameters shown in Table 3. As can
be inferred from the table, a higher correlation coefficient
(r) was found when intercomparing the suspension measure-
ments as compared with intercomparing the dry-dispersed
methods, suggesting reasonable agreement and consistency
for the results from immersion freezing studies with suspen-
sions. Interestingly, a higher r for ns,geo than ns,BET was found
for dry-dispersed particle measurements as compared to the
suspension measurements. The use of more conversion fac-
tors to estimate ns,BET (i.e., from Eqs. 3 and 4) may introduce
uncertainties and discrepancies between these measurement
techniques. It is also noteworthy that the T -binned ensem-
ble maximum and minimum values are largely influenced by
dry-dispersed particle and suspension results, respectively,
implying the previously discussed discrepancy between these
two techniques.
It is observed that the largest deviation between the max-
ima and minima in the horizontal and vertical axes, cor-
responding to HorMax−Min and VerMax−Min, respectively,
shown in Fig. 7, is similar for both ns,BET (Fig. 7a) and ns,geo
(Fig. 7b). Nevertheless, ns,BET is representative of measure-
ments with suspended samples because fewer corrections
and assumptions are involved for its estimation when com-
pared to that with dry-dispersed particles. Hence, ns,BET may
be a good proxy for comparing IN efficiencies of dust par-
ticles from various instruments. We also report the abso-
lute values of 1log(ns)/1T for four T -segregated segments
based on T -binned Lin. Avg. (multiple exponential distribu-
tion fit to the T -binned average data in the linear space), T -
binned Max. (fit to the T -binned maxima in the linear space)
and T -binned Min. (fit to the T -binned minima in the linear
space) in Fig. 7 (i.e., T1 to T4). The slopes are comparable
to the slope of the A13 parameterization in the T1 to T3 seg-
ments (−11 to −27 ◦C), while the slope in the T4 segment is
www.atmos-chem-phys.net/15/2489/2015/ Atmos. Chem. Phys., 15, 2489–2518, 2015

2506 N. Hiranuma et al.: A comparison of 17 IN measurement techniques
Table 3. List of the Gumbel cumulative distribution fit parameters to the ns,BET and ns,geo for T -binned ensemble data set fitted in the
linear space [All (lin)], ensemble data set fitted in the log space [All (log)], ensemble maximum values (Allmax), ensemble minimum values
(Allmin), suspension subset fitted in the linear space [Sus (lin)], suspension subset fitted in the log space [Sus (log)], dry-dispersed particle
subset fitted in the linear space [Dry (lin)] and dry-dispersed particle subset fitted in the log space [Dry (log)]. Note that Allmax and Allmin
are fitted in the linear space. The correlation coefficient, r , for each fit is also shown. T is in ◦C.
Fitted data set Fitted T range Fit parameters [ns,BET(T )=
exp(a · exp(−exp(b · (T + c)))+d)]
a b c d r
All (lin)∗ −37 ◦C < T <−11 ◦C 23.82 0.16 17.49 1.39 0.60
All (log)∗ −37 ◦C < T <−11 ◦C 22.00 0.16 20.07 3.00 0.80
Allmax∗
−37 ◦C < T <−11 ◦C 24.72 0.15 17.27 1.56 0.63
Allmin∗
−37 ◦C < T <−11 ◦C 21.86 0.16 22.73 2.70 0.94
Sus (lin) −34 ◦C < T <−11 ◦C 24.38 0.14 19.61 1.89 0.99
Sus (log) −34 ◦C < T <−11 ◦C 24.28 0.14 21.19 2.70 0.99
Dry (lin)∗ −37 ◦C < T <−18 ◦C 27.35 0.07 16.48 3.19 0.59
Dry (log)∗ −37 ◦C < T <−18 ◦C 26.22 0.07 16.27 3.31 0.72
Fitted data set Fitted T range Fit Parameters [ns,geo(T )=
exp(a· exp(−exp(b · (T + c)))+d)]
a b c d r
All (lin)∗ −37 ◦C < T <−11 ◦C 25.75 0.13 17.17 3.34 0.73
All (log)∗ −37 ◦C < T <−11 ◦C 22.93 0.16 20.31 5.72 0.80
Allmax∗
−37 ◦C < T <−11 ◦C 25.72 0.15 16.39 3.52 0.75
Allmin∗
−37 ◦C < T <−11 ◦C 22.16 0.16 22.13 5.64 0.98
Sus (lin) −34 ◦C < T <−11 ◦C 22.72 0.16 19.52 5.50 1.00
Sus (log) −34 ◦C < T <−11 ◦C 22.64 0.16 20.93 5.92 0.98
Dry (lin)∗ −37 ◦C < T <−18 ◦C 29.38 0.05 16.49 7.19 0.64
Dry (log)∗ −37 ◦C < T <−18 ◦C 27.92 0.05 13.25 6.32 0.83
∗ To derive the fits that are representative for immersion mode freezing, we excluded EDB (contact) and
ZINC data.
similar to those of the N12 parameterizations. These results
are consistent with the results described in Sect. 3.3. Further,
VerMax−Min for roughly 3 orders of magnitude with respect to
ns is observed in a temperature region around ∼−20 ◦C for
both ns,BET(T ) and ns,geo(T ) spectra. Such high nsvariability
was expected due to the contribution from MRI-DCECC,
FINCH and FRIDGE measurements, which may have in-
fluenced the overall fit in that temperature range. Likewise,
our HorMax−Min shows that the 17 measurements are in rea-
sonable agreement within 7.8 ◦C (−36.8, −33.0, −29.0 ◦C
(min, log fit, max)) at ns,BET of 5.2× 10⁹ m−2 and 7.5 ◦C
(−36.7, −32.8, −29.2 ◦C (min, log fit, max)) at ns,geo of
1.5× 10¹¹ m−2.
T -binned ns,BET(T ) and ns,geo(T ) spectra are presented in
Fig. 8a and b, respectively. In this figure, panels i, ii and
iii show T -binned data averaged in the linear space of all
17 instruments, all suspension type measurements, and all
measurements that involved dry particles, respectively, while
panel iv shows a comparison between suspension and dry-
particle measurements. We note that the data from “EDB
(contact)” and “ZINC” (Welti et al., 2009) were not used for
generating T -binned data since our focus was on immersion
mode freezing. We also note that the ns results from nine IN
measurement techniques provide ns data at−23 and−24 ◦C,
where we find an abrupt increase in1log(ns)/1T and ns de-
viations. Investigated T ranges for each instrument are listed
in Table 1.
As described in Sect. 3.2, suspension measurements pos-
sess sensitivity at high temperatures (up to −11 ◦C), indi-
cating that their ability to control the concentration or di-
lution of suspension over a wide range is of great advan-
tage in detecting rare INPs. Moreover, suspension experi-
ments with small picoliter or nanoliter droplets allow mea-
surements right down to the homogeneous freezing limit
(∼−37 ◦C; Koop et al., 2000). In turn, suspension meth-
ods with microliter droplets may run into “background prob-
lems” at temperatures below about −20 to −25 ◦C for sam-
ples that do not contain many IN active at these temperatures,
because then impurities contained in the water may trigger
freezing. Conversely, dry aerosol methods lack sensitivity
for detecting rare IN at high temperatures because of their
low sample volume. These dry particle measurements are in
general good for low temperature measurements, where the
number of particles nucleating ice increases and instruments
Atmos. Chem. Phys., 15, 2489–2518, 2015 www.atmos-chem-phys.net/15/2489/2015/
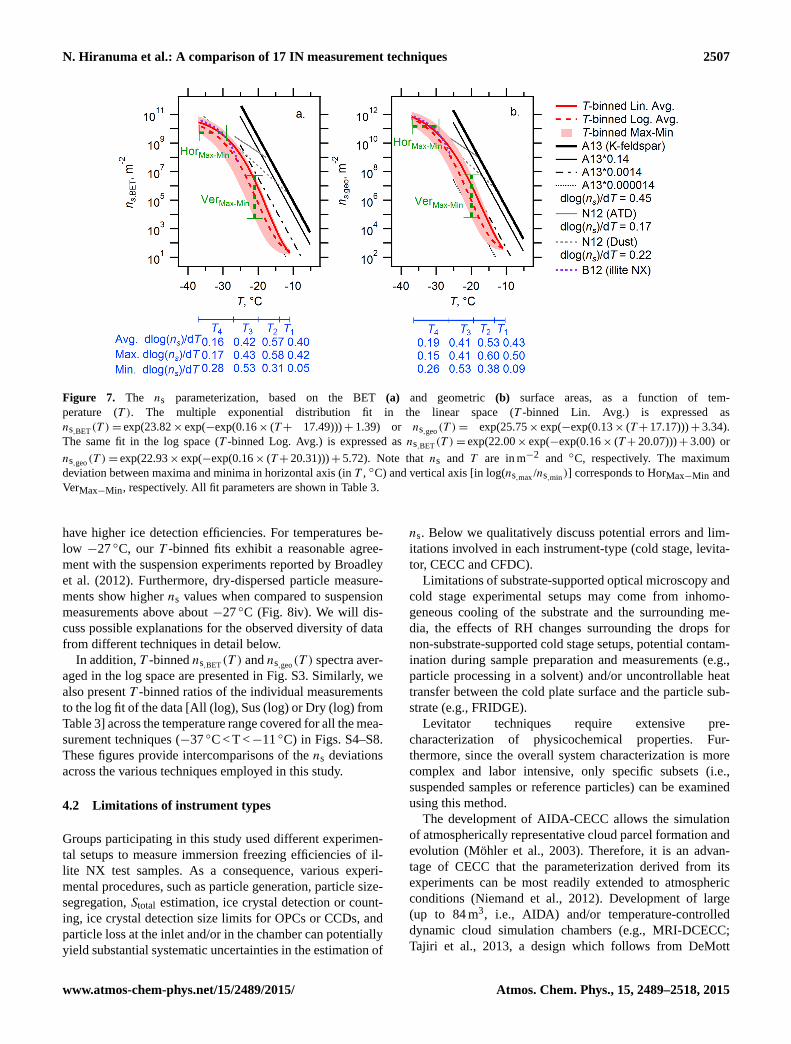
N. Hiranuma et al.: A comparison of 17 IN measurement techniques 2507
Figure 7. The ns parameterization, based on the BET (a) and geometric (b) surface areas, as a function of tem-
perature (T ). The multiple exponential distribution fit in the linear space (T -binned Lin. Avg.) is expressed as
ns,BET(T )= exp(23.82× exp(−exp(0.16× (T+ 17.49)))+ 1.39) or ns,geo(T )= exp(25.75× exp(−exp(0.13× (T+ 17.17)))+ 3.34).
The same fit in the log space (T -binned Log. Avg.) is expressed as ns,BET(T )= exp(22.00× exp(−exp(0.16× (T+ 20.07)))+ 3.00) or
ns,geo(T )= exp(22.93× exp(−exp(0.16× (T+ 20.31)))+ 5.72). Note that ns and T are in m−2 and ◦C, respectively. The maximum
deviation between maxima and minima in horizontal axis (in T , ◦C) and vertical axis [in log(ns,max /ns,min)] corresponds to HorMax−Min and
VerMax−Min, respectively. All fit parameters are shown in Table 3.
have higher ice detection efficiencies. For temperatures be-
low −27 ◦C, our T -binned fits exhibit a reasonable agree-
ment with the suspension experiments reported by Broadley
et al. (2012). Furthermore, dry-dispersed particle measure-
ments show higher ns values when compared to suspension
measurements above about −27 ◦C (Fig. 8iv). We will dis-
cuss possible explanations for the observed diversity of data
from different techniques in detail below.
In addition, T -binned ns,BET(T ) and ns,geo(T ) spectra aver-
aged in the log space are presented in Fig. S3. Similarly, we
also present T -binned ratios of the individual measurements
to the log fit of the data [All (log), Sus (log) or Dry (log) from
Table 3] across the temperature range covered for all the mea-
surement techniques (−37 ◦C < T <−11 ◦C) in Figs. S4–S8.
These figures provide intercomparisons of the ns deviations
across the various techniques employed in this study.
4.2 Limitations of instrument types
Groups participating in this study used different experimen-
tal setups to measure immersion freezing efficiencies of il-
lite NX test samples. As a consequence, various experi-
mental procedures, such as particle generation, particle size-
segregation, Stotal estimation, ice crystal detection or count-
ing, ice crystal detection size limits for OPCs or CCDs, and
particle loss at the inlet and/or in the chamber can potentially
yield substantial systematic uncertainties in the estimation of
ns. Below we qualitatively discuss potential errors and lim-
itations involved in each instrument-type (cold stage, levita-
tor, CECC and CFDC).
Limitations of substrate-supported optical microscopy and
cold stage experimental setups may come from inhomo-
geneous cooling of the substrate and the surrounding me-
dia, the effects of RH changes surrounding the drops for
non-substrate-supported cold stage setups, potential contam-
ination during sample preparation and measurements (e.g.,
particle processing in a solvent) and/or uncontrollable heat
transfer between the cold plate surface and the particle sub-
strate (e.g., FRIDGE).
Levitator techniques require extensive pre-
characterization of physicochemical properties. Fur-
thermore, since the overall system characterization is more
complex and labor intensive, only specific subsets (i.e.,
suspended samples or reference particles) can be examined
using this method.
The development of AIDA-CECC allows the simulation
of atmospherically representative cloud parcel formation and
evolution (Möhler et al., 2003). Therefore, it is an advan-
tage of CECC that the parameterization derived from its
experiments can be most readily extended to atmospheric
conditions (Niemand et al., 2012). Development of large
(up to 84 m3, i.e., AIDA) and/or temperature-controlled
dynamic cloud simulation chambers (e.g., MRI-DCECC;
Tajiri et al., 2013, a design which follows from DeMott
www.atmos-chem-phys.net/15/2489/2015/ Atmos. Chem. Phys., 15, 2489–2518, 2015

2508 N. Hiranuma et al.: A comparison of 17 IN measurement techniques
Figure 8. T -binned ns,geo (a) and ns,BET (b). T -binned data (i.e., average in the linear space with 1 ◦C bins for−37 ◦C < T <−11 ◦C) of ns(T )
spectra are presented for (i) All interpolated data set (All), (ii) suspension measurements (Sus), (iii) dry-dispersed particle measurements
(Dry), and (iv) comparison between Sus and Dry. Red sticks represent maxima (positive direction) and minima (negative direction) and black
sticks represent ±standard error. Literature results (B12, A13, and N12) are also shown.
and Rogers, 1990) enabled the exploration of heteroge-
neous ice nucleation properties of typical particulate sam-
ples in a wide range of particle concentrations, temperatures
(−100 ◦C < T < 0 ◦C), cooling rates and nucleation times.
However, the utilization of such an instrument to correctly
measure the totality of INPs with a reasonable detection sen-
sitivity (< 0.1 L−1), both in the lab and field settings, has not
yet been realized due to CECC’s limitations. These limita-
tions include ice losses by settling (e.g., DeMott and Rogers,
1990) over the relatively long expansion periods in the con-
fined vessel and internal turbulence during the expansion
leading to heterogeneously supersaturated water vapor and
temperature fields. These artifacts can bias IN measurements.
CFDCs are the most widely used technique to measure
INPs in the atmosphere, but their inability to quantify INPs
at high temperatures is an issue that exists due to the physi-
cal principals of operation, the limited sample volume (typi-
cally 1 to 2 L min−1) and background frost formation in the
Atmos. Chem. Phys., 15, 2489–2518, 2015 www.atmos-chem-phys.net/15/2489/2015/

N. Hiranuma et al.: A comparison of 17 IN measurement techniques 2509
chamber over periods of operation. Based on the operational
equations in Rogers (1988), the warmest operating tempera-
ture of a CFDC is approximately −6.5 ◦C, controlled by the
fact that the warmest wall cannot exceed 0 ◦C. Low sample
volumes necessitate integration over longer sample periods
and result in a general lower detection limit of 0.2 L−1 of
sampled air, absent any particle pre-concentration (Prenni et
al., 2009). According to Tobo et al. (2013), the highest tem-
perature that can be achieved in a CFDC is −9 ◦C. Above
this threshold, temperature and ice saturation conditions can-
not be maintained in the chamber. Rogers et al. (2001) and
other papers since have identified measurement issues due to
frost emanating from the walls of the chamber when the dew
point temperature of the sample air is not effectively con-
trolled, although this appears to be an operational issue that
can be mitigated if monitored properly, and will be most ob-
trusive for atmospheric sampling scenarios.
4.3 Stochastic nature of freezing and time dependence
The longstanding discussion of the stochastic theory (i.e.,
the freezing process is time-dependent) vs. the determinis-
tic approximation (i.e., freezing occurs at specific tempera-
ture and humidity conditions) of heterogeneous freezing has
introduced another complication towards complete under-
standing of heterogeneous ice nucleation in the atmosphere
(Vali, 2014). Many studies have attempted to characterize ice
nucleation based on the classical nucleation theory (CNT),
which incorporates a nucleation rate (Murray et al., 2012;
Kashchiev, 2000; Mullin, 2001). In this treatment, the ice
nucleation process is always of a stochastic nature (i.e., time-
dependent; Bigg, 1953; Vali, 1994, 2014). According to the
nucleation rate approach, the heterogeneous ice nucleation
rate is strongly sensitive to INP size and the kinetic activa-
tion energy of the ice embryo on the nucleating site/surface
at a specific temperature (Khvorostyanov and Curry, 2000;
Fletcher, 1962). A few variants of the CNT-based approaches
have been developed over the past few decades. These ap-
proaches assume uniform surface characteristics and only
one ice nucleation probability (i.e., a single contact angle),
nominally categorized as the single component nucleation
rate approach (e.g., Bigg, 1953). Several recent studies have
applied a probability density function (PDF) of contact an-
gles and active sites over the INP surface in CNT, or in
other words described a distribution of nucleation efficien-
cies, bridging the gap between the stochastic theory and the
deterministic treatment (Marcolli et al., 2007; Lüönd et al.,
2010; Kulkarni et al., 2012; Niedemeier et al., 2011; Wright
and Petters., 2013; Broadley et al., 2012).
The deterministic or time-independent singular approxi-
mation has been developed as an alternative option to quanti-
tatively understand atmospheric ice nucleation. The concept
was first developed by Levine (1950), while the term “active
sites” per surface area was introduced by Fletcher (1969).
More recently, Connolly et al. (2009) introduced the ns den-
sity parameterization (see Sect. 2.4). This specific approach
neglects the time dependence of freezing, and assumes that
a characteristic condition (e.g., temperature) must be met to
nucleate ice. The semi-deterministic forms of the singular ap-
proach have a cooling rate dependence incorporated (Vali,
2008; Herbert et al., 2014). Predicting ice nucleation from
a singular perspective does not require a vast knowledge of
particle-specific parameters (e.g., surface composition, struc-
tures, surface tension and solubility) that are particular to
each ice nucleus and, therefore, enables ice nucleation pa-
rameterization to be relatively simple and efficient compared
to the CNT-based approaches (Murray et al., 2011).
The assumption that the time dependence of the freezing
of droplets is of secondary importance when compared to
temperature dependence is supported by a recent modeling
sensitivity study that shows that common INPs are substan-
tially more sensitive to temperature than to time (Ervens and
Feingold, 2013). Furthermore, while Broadley et al. (2012)
shows that freezing by illite NX is time-dependent through
isothermal experiments, the shift in freezing temperature on
changing cooling rates by an order of magnitude is less than
0.6 ◦C, which is within the experimental uncertainty. A simi-
lar observation of weak time dependence of immersion freez-
ing for various types of suspended samples, inferred by com-
paring the results with varied cooling rates from 0.01 to
1 ◦C min−1, is reported by Wright et al. (2013).
In the context of dry-dispersed measurements, the sensi-
tivity of the ice nucleation to a possible time dependence,
and the respective influence on ns, was examined to further
discern its importance and uncertainty. Specifically, a contact
angle distribution was fitted to the LACIS measurements and
was used, together with the soccer ball model (SBM; Nie-
dermeier et al., 2011, 2014), to simulate frozen fractions for
different residence times varying over 4 orders of magnitude
(i.e., 1, 10, 100 and 1000 s residence time). These frozen frac-
tions were then used to calculate ns, shown as lines in Fig. 9.
More specifically, frozen fractions for 500 nm diameter il-
lite NX particles were calculated based on SBM to obtain
ns(T ) spectra. To accomplish this, a contact angle distribu-
tion was used which was derived based on LACIS data for
the illite NX particles as shown in this work, resulting in val-
ues of 1.90 rad for the mean and 0.27 rad for the width of the
contact angle distribution. Frozen fractions were obtained for
ice nucleation residence times of 1, 10, 100 and 1000 s. An
increase in the residence time by a factor of 10 resulted in
a shift of approximately 1 ◦C towards higher freezing tem-
peratures. This is similar to the results found in a previous
study by Welti et al. (2012) for measurements of kaolinite-
rich clay minerals. Indeed, ns,geo data obtained from AIDA
agree within the measurement uncertainty with LACIS data
without accounting for time dependence. These results sug-
gest that time dependence of immersion freezing for illite
NX particles can be neglected as a factor in the comparisons
shown in Figs. 4, 5 and 6. They also imply that the immer-
sion freezing nature of illite NX is only slightly dependent on
www.atmos-chem-phys.net/15/2489/2015/ Atmos. Chem. Phys., 15, 2489–2518, 2015

2510 N. Hiranuma et al.: A comparison of 17 IN measurement techniques
Figure 9. Soccer ball model analysis for time dependency of im-
mersion freezing of illite NX particles. Comparison to LACIS mea-
surements in ns,geo space is also shown. Error bars represent ex-
perimental uncertainties (T ± 0.3 ◦C and ns± 28 %). The subpanel
shows a section of T (−31 to −38 ◦C) and ns,geo (1.2× 10¹⁰ to
5.1× 10¹¹ m−2) space without error bars. A shift in the residence
time from 1s to 10 s shifts ns (as well as nm, not shown) towards
higher temperatures by about 1 ◦C.
cooling rate across a wider range of temperatures (as com-
pared to a −26 to −37 ◦C range as shown in Broadley et al.,
2012), regardless of the sample preparation process.
4.4 Potential effect of agglomerates
As seen in the particle surface area distributions (Fig. 2)
and agglomerated-fractions based on a relative comparison
to D95, aggregates are rather persistent and dominant for
most of the dry-dispersed particle measurements. Since dry
aggregates can have large “supermicron” sizes, they may
have different IN propensities and efficiencies (Wheeler et
al., 2014) as compared to the smaller sizes investigated in
the present study (i.e., up to 1000 nm from PINC). Further,
the degree of agglomeration may conceivably affect the sur-
face area exposed to liquid water when suspended in super-
cooled droplets. Hence, an overall quantification of the effect
of agglomerates is difficult. Moreover, the degree of agglom-
eration seems to vary from experiment to experiment, intro-
ducing diversity on the estimation of Stotal of particles and
ns for dry-dispersed particle measurements. For instance, a
combination of several methods for particle dispersion and
subsequent particle size selection was employed for particle
generation from illite NX samples. Further, most of the dry
dispersion techniques used upstream impactors to filter out
large agglomerated particles and avoid counting these large
particles as INPs. The different types of dispersion meth-
ods, impactors and size segregating instruments used in the
present work are listed in the Supplement Table S1. These
different aerosol generation processes may have caused dif-
ferent degrees of agglomeration. This may in part explain
why ns measurements obtained using dry dispersion tech-
niques deviated from those using suspension measurements.
Further quantification of the influences of different meth-
ods for particle dispersion, size-segregation and particle im-
paction/filtration on the estimation of Stotal and ns is an im-
portant topic for future works.
In contrast, in suspension experiments, illite NX samples
were directly suspended in water. Despite no pre-treatments
(e.g., pre-impaction or size segregation), suspended parti-
cles appeared adequately de-agglomerated (Fig. 2a). Though
the number of immersed particles can vary from droplet to
droplet and the random placement of particles in the drop
may have an effect on the ns values, the ns spectra from
suspension measurements are in reasonable agreement with
slight deviations even over a wide range of wt % of illite
NX samples (Figs. 6, 8, S4–S8). Thus, the influence of the
random placement of particles in the drop and agglomera-
tion on the ns estimation for suspension measurements seems
small. To support this, Wright and Petters (2013) and Hader
et al. (2014) simulated the role of a statistical distribution
in drops. The authors demonstrated that the random compo-
nent due to drop placement seemed to be small relative to
the statistical variation due to nucleation probability. Hence,
assuming the degree of agglomeration or flocculation is sim-
ilar in all suspension samples, the degree of agglomeration
and the random placement of particles in the drop may lead
to less pronounced deviations in ns when compared to dry-
dispersed measurements.
4.5 Nucleation mode dependence
While all suspension methods only measured immersion
mode freezing of the illite NX particles, a contribution of
other nucleation or freezing modes cannot be ruled out for
dry-dispersed particle measurements. Hence, we now discuss
inferences in the present experiments regarding the mode de-
pendency of the ice nucleation ability of illite NX particles.
Figure 10a and b show the comparison of ns derived from the
two different operation types of FRIDGE measurements. For
instance, ‘default mode’ considers deposition mode nucle-
ation and immersion mode freezing of dry particles in which
RHw is scanned upwards and ‘imm.mode’ counts immer-
sion freezing of suspended particles in which the particles
are first washed into droplets and then placed on the sub-
strate. With these two different operational modes, FRIDGE
investigated the ice nucleation ability of both dry and droplet
suspended particles deposited on a substrate (see the supple-
mentary methods). FRIDGE scans RHice and RHw (low to
high) at a constant temperature. During such scans an abrupt
increase in an activated ice fraction near water saturation
as well as the highest Nice is typically observed. We con-
sider ice crystals formed at the highest RHw (near 100 %
RHw) as a measure of immersion Nice from dry-dispersed
Atmos. Chem. Phys., 15, 2489–2518, 2015 www.atmos-chem-phys.net/15/2489/2015/
N. Hiranuma et al.: A comparison of 17 IN measurement techniques 2511
particle measurements in this study. Some default runs of
FRIDGE show much higher ns,BET values compared to the
immersion mode runs. This difference may be a consequence
of the different IN efficiencies of nucleation modes (deposi-
tion+ immersion vs. immersion alone) in the examined tem-
perature range (−25 ◦C < T <−18 ◦C), the different sample
preparation processes (dry or suspended sample), effects of
agglomeration or a combination of the three. We note that a
major difference between the two measurement setups is the
pressure within the instrument. For instance, default condi-
tions involve processing at a few hPa of water vapor while
the immersion measurements are conducted at atmospheric
pressure. In addition, corrective post-analysis of droplet/ice
separation was taken into account in this study, so that errors
from counting large droplets as ice crystals were successfully
removed. Interestingly, our comparison suggests that ns val-
ues derived from the FRIDGE default mode seem similar to
those from MRI-DCECC, in which experiments were carried
out with a high degree of particle agglomeration (Fig. 2c).
Some other variations on applied methods suggest nucle-
ation mode effects on the IN efficiency of illite NX parti-
cles at lower temperatures (Fig. 10c and d). For instance,
the comparison between ZINC and IMCA-ZINC show about
an order of magnitude diversity in ns,BET beyond experimen-
tal uncertainties at −33 ◦C, suggesting a mode-dependent
IN efficiency of clay minerals at this temperature. This ob-
servation is consistent with a statement that the immersion
freezing parameterization from CNT may not reliably predict
the activated fraction observed at RHw > 100 % as observed
from condensation freezing (Welti et al., 2014). However,
this is in contrast to observations indicated by PNNL-CIC
below −25 ◦C and to results presented in Wex et al. (2014),
where ns,geo obtained from kaolinite measurements made
with LACIS and the CSU-CFDC (at 104 % > RHw > 106 %
for the latter) agreed well. When a freezing point depres-
sion is taken into account, even data obtained with the CSU-
CFDC for water-vapor-sub-saturated conditions is in agree-
ment with data obtained from both LACIS and CSU-CFDC
at water-vapor super-saturated conditions. Concerning data
presented here, PNNL-CIC and IMCA-ZINC measure con-
densation/immersion and purely immersion mode freezing
efficiency of particles, respectively, and are in reasonable
agreement within experimental uncertainties (Fig. 10c and
d). Thus, the observed inconsistencies between methods
should be subject to further methodological improvements
to provide accurate data as a basis for model parameteriza-
tion. Similar heterogeneous ice nucleation mode-dependent
observations were made by our EDB experiments. We ob-
served that ns values derived from contact freezing experi-
ments were higher than those derived from immersion exper-
iments (Fig. 10c and d). As described in the supplementary
methods, immersion mode experiments were performed for
the droplets, which were not activated via contact freezing.
4.6 Effect of mineralogical properties: which
component of illite NX nucleates ice?
Atkinson et al. (2013) suggested that the mass fraction of
K-feldspar in a sample can be used as a scaling factor to es-
timate the ns values of other K-feldspar containing dust and
soil samples. O’Sullivan et al. (2014) showed that this scal-
ing rule could be used as an approximate predictor for the ns
of soil samples once the biological ice-nucleating particles
were deactivated. However, inspection of Fig. 6 reveals that
the line based on 14 % feldspar (assuming all microcline) sig-
nificantly over predicts the ns values for illite NX. There are
a number of reasons why this might be.
The K-feldspar sample used by Atkinson et al. (2013) was
the British Chemical Standard Chemical Reference Mate-
rial (BCS-CRM) number 376/1 and X-ray diffraction anal-
ysis shows that the crystal structure is consistent with that of
microcline. Microcline is one possible form of a K-feldspar
and, as discussed above, other feldspars are sanidine and or-
thoclase, which have distinct crystal structures. The ice nu-
cleation abilities of sanidine and orthoclase are not yet pub-
lished, but given that they have different crystal structures,
they may have different nucleating abilities. Unfortunately,
the X-ray diffraction analysis of illite NX is unable to iden-
tify the K-feldspar(s) present in illite NX, although the min-
eralogical analysis conducted as part of this study concluded
that there was no detectable microcline in illite NX. Hence,
one explanation for the K-feldspar scaling rule not working
for illite NX is that there is only a trace of the strongly ice ac-
tive microcline present in illite NX. For suspension measure-
ments, only the 0.0014 % microcline parameterization repro-
duces the slope and magnitude of the illite NX data in Fig. 6,
but this quantity of microcline is well below the detection
limit of the X-ray diffraction technique. Perhaps, in the case
of illite NX, it may not be the feldspar which triggers nu-
cleation, but instead it could be another mineral present in
this sample. For example, Atkinson et al. (2013) found that
a quartz sample nucleated ice more efficiently than the clay
minerals, but less efficiently than the feldspar samples they
used. At about −28 ◦C, they reported an ns of ∼ 1010 m−2.
The X-ray analysis in this study revealed the presence of 3 %
quartz, hence we would predict an ns of 3× 10⁸ m−2, which
is consistent with the illite NX data. Finally, an alternative
explanation is that the surfaces of K-feldspars are chemically
altered in illite NX. The surfaces of feldspars are known to
transform to an amorphous silicate which can then recrys-
tallize as a clay if exposed to an acidic environment. Wex
et al. (2014) suggested that it was the acid processing of K-
feldspar which deactivated Fluka-kaolinite. It is feasible that
the surfaces of feldspar grains in illite NX have at some point
become deactivated. More quantitative investigations of the
acid processing of both reference and atmospherically rel-
evant materials, and of acid processing’s influence on their
respective immersion mode ice nucleation efficiencies, are
needed.
www.atmos-chem-phys.net/15/2489/2015/ Atmos. Chem. Phys., 15, 2489–2518, 2015

2512 N. Hiranuma et al.: A comparison of 17 IN measurement techniques
Figure 10. Examination of mode dependency of heterogeneous ice nucleation of illite NX particles. A comparison of FRIDGE (default) and
FRIDGE (imm.mode) in ns,BET and ns,geo are shown in (a) and (b), respectively. (c) and (d) show a comparison between EDB (contact),
EDB (imm.), ZINC, IMCA-ZINC, and PNNL-CIC data in ns,BET and ns,geo , respectively.
Recently, re-partitioning of soluble components of both
swelling and non-swelling clay minerals and their effect on
cloud condensation nucleation activity was reported (Sulli-
van et al., 2010; Kumar et al., 2011; Garimella et al., 2014).
To address a potential importance of this effect on the ice-
nucleating activity of illite NX in the wet dispersion exper-
iments, we have measured the concentration of cations re-
leased by the illite NX sample placed into deionized water as
a function of time, as described in Sect. 3.1 (i.e., Fig. 3).
It is instructive to compare the quantity of cations released
by illite NX into an aqueous environment with the value of
the cation exchange capacity (CEC) for illite, which is known
to be 25 to 40 cmol kg−1(Meunier and Velde, 2004). CEC
is defined as the amount of cations retained by all the neg-
ative charges in 100 g of clay immersed in water at pH 7
(e.g., see Meunier, 2005). Per this definition, CEC describes
the total quantity of exchangeable cations, including inter-
layer cations which are in fact not accessible for substitu-
tion in non-swelling clays. The molar fraction of external
cations, located on the basal planes of the crystals and on
the crystal edges is roughly evaluated for illites as 20 % of
the total CEC, yielding 5 to 8 cmol kg−1 (Wilson, 2013). Re-
markably, the total amount of all cations (K+, Mg2+ and
Ca2+) released within the first hour by illite NX, if recalcu-
lated with account for cation valence and for the actual mass
of illite in the aqueous suspension (0.1 g), gives the num-
ber 7.5 cmol kg−1, which corresponds nicely with the up-
per bound of the external CEC (8 cmol kg−1). Furthermore,
Grim (1953) has shown that the CEC of illite increases with
decreasing size of the clay particle size, with the upper bound
(∼ 40 cmol kg−1) being characteristic for illite with a parti-
cle size below 100 nm. This is again consistent with the very
small size of particles in illite NX.
These findings have two potential implications for the
measurements of illite NX ice-nucleating efficiency obtained
with different instruments. First, in the methods where dry il-
lite NX particles are activated to droplets prior to cooling, the
concentration of cations released into the water surrounding
the particles is still far from the equilibrium and is a func-
tion of the residence time (e.g., ∼ 2–3 s for LACIS, ∼ 4 s for
Atmos. Chem. Phys., 15, 2489–2518, 2015 www.atmos-chem-phys.net/15/2489/2015/

N. Hiranuma et al.: A comparison of 17 IN measurement techniques 2513
PINC, ∼ 12 s for PNNL-CIC, and over the range of several
tens of seconds to a few minutes for AIDA depending on ini-
tial chamber T and RH). At the same time, the amount of ex-
ternal cations retained on the surface of illite particles deter-
mines the charge properties, such as charge distribution land-
scape and zero charge point. A potential importance of the
surface charge of hematite particles for their IN activity was
suggested recently in Hiranuma et al. (2014b). These consid-
erations, however speculative, might shed some light on the
observed scattering of experimentally measured values of ns.
Second, for the freezing measurements where the illite-rich
sample was suspended in water prior to cooling, all acces-
sible external cations were already released into the aque-
ous environment. In these cases the concentration of cations
in the droplets is a function of mass concentration of illite
in suspension. To access high freezing temperatures, high
concentrations of illite are needed in the droplet assay tech-
niques, resulting in the possibility that not all cations are re-
leased into solution due to the inhibition of the ion exchange
process. Again, this would change the surface charge distri-
bution and potentially affect the ice-nucleating efficiency of
illite particles. If wet particle generation (dispersion of aque-
ous suspension by means of a pressurized air atomizer) is
used, the redistribution of cations between suspended parti-
cles may be an issue, as suggested by Garimella et al. (2014)
for the case of CCN experiments. Further studies of samples
without modification or ageing after dry dispersion or wet
suspension are needed to get a better idea of the method in-
tercomparison.
5 Conclusions
The framework of the present work is designed to advance
the existing state of knowledge regarding IN measurement
techniques. After ICIS-2007, there has been an increase in
new instrument development, especially off-line, substrate-
supported cold stage techniques, and modifications of exist-
ing online techniques. Concepts to formulate area-scaled IN
efficiency with ns parameters have also since been introduced
to the community. These improvements are comprehensively
evaluated in this work.
The partners of the INUIT group and external partners
have for the first time identified and shared a reference min-
eral dust sample (illite NX) in order to obtain a comprehen-
sive data set for evaluating immersion freezing properties of
atmospherically relevant particles across a wide range of par-
ticle concentrations, temperatures, cooling rates and nucle-
ation times. Illite NX samples were extensively character-
ized for their physicochemical properties before they were
distributed to INUIT partners and collaborators. Both bulk
and single particle elemental composition analyses were con-
ducted by XRD and EDX analyses, respectively.
A total of 17 IN measurement techniques were intercom-
pared based on their immersion freezing measurements. Our
intercomparison exercise provided unique results that would
not have been achieved by individual investigators in isola-
tion. Both consistencies and discrepancies among the instru-
ments have been identified. Our results suggest that the im-
mersion freezing efficiency (i.e., ns) of illite-rich clay min-
erals is relatively independent of droplet size, mass percent
of illite NX sample in droplets for the methods examining
suspensions, physical size of illite NX particles for the meth-
ods examining dry-dispersed particles and cooling rate dur-
ing freezing within typical experimental uncertainties, veri-
fying the premise of the ns concept (i.e., size independency
for submicron illite NX particles, strong temperature depen-
dency and weak time dependency of immersion freezing for
illite-rich clay mineral particles).
Furthermore, comparisons of the suspension subsets
against the dry-dispersed particle techniques were per-
formed. Dry samples alone showed higher ns values com-
pared to the pre-suspended samples above −27 ◦C. A possi-
ble explanation for this deviation (i.e., ns from dry-dispersed
methods > ns from suspension methods) may be the surface
modification of the illite NX particles (e.g., due to ion disso-
lution effects in the aqueous suspension).
Comparisons of the absolute values of1log(ns)/1T as an
ice activation parameter suggest that the predominant freez-
ing sites of illite NX particles exist in a temperature range
between −20 and −27 ◦C for suspension experiments. In
comparison to previous measurements, our synergetic work,
which covers a wide temperature range, shows a similar re-
sult to the Broadley parameterization (B12), and our overall
fit for the low temperature region below −27 ◦C also agrees
with the Niemand parameterization (N12).
Overall accuracy and precision of the IN measurement
techniques was examined by evaluating T -binned (i.e., 1 ◦C
bins) ns(T ) data derived from all 17 instruments for the
temperature range from −11 to −37 ◦C. Our analysis re-
vealed that discrepancies among measurements were within
about 8 ◦C in terms of temperature and up to 3 orders of
magnitude with respect to ns. This diversity is much larger
than the individual uncertainties of each instrument, suggest-
ing that all instruments may be reasonably precise but it is
still difficult to find overall accuracy of current IN measure-
ment techniques, at least while using illite NX as the stan-
dard and allowing partners to investigate it independently.
In addition, two different ns metrics, ns,geo and ns,BET , were
compared, and we found that ns,BET is a better proxy for
suspension-based IN measurements, while ns,geo is better for
dry-dispersed particle measurements.
Other than the intercomparison aspects described above,
several important implications were inferred from our study
and enhanced our basic knowledge of immersion freezing.
First, the existence of only a comparably small contribu-
tion of time dependence to the intercomparison was rec-
onciled by the SBM simulation. Specifically, a change of
the residence time, from 1 to 10 s, shifts ns values towards
higher temperatures by only about 1 ◦C. Second, several
www.atmos-chem-phys.net/15/2489/2015/ Atmos. Chem. Phys., 15, 2489–2518, 2015

2514 N. Hiranuma et al.: A comparison of 17 IN measurement techniques
nucleation modes and their contribution to nucleation ef-
ficiency were also evaluated. A comparison among EDB,
ZINC and IMCA-ZINC below −25 ◦C implied some mode
dependencies. Likewise, a mode dependency was also pro-
nounced based on FRIDGE results at temperatures above
−25 ◦C. Third, immersion freezing experiments were per-
formed with both polydisperse and size-selected illite NX
particles for the AIDA-CECC, MRI-DCECC and CSU-IS
measurements, and size independence of ns for immersion
freezing of submicron illite NX particles (DMA size-selected
200, 300 and 500 nm diameter) was also demonstrated. Fi-
nally, our observations show that temperature is the major
variable influencing the immersion freezing of illite NX par-
ticles, as the ns values in general increase while temperature
decreases. In addition, our results of ns and absolute values
of 1log(ns)/1T distributions across a wide range of tem-
peratures imply that clay minerals may contain various freez-
ing activation energies, and the immersion freezing nature of
clay minerals (e.g., illite NX) in a wide range of tempera-
tures cannot be fitted by simple exponential functions but are
governed by a hybrid of multi-exponential functions (a com-
bination of scaled A13 and N12 parameterizations).
Though we shared identical test samples with each other, it
is still difficult to compare ns results because sample prepa-
ration techniques and measurement methods (e.g., particle
dispersion and size distribution characterization) differ from
group to group, which can result in different degrees of ag-
glomeration or different nucleation modes. Therefore, a con-
tinued investigation to obtain further insights into consisten-
cies or diversity of IN measurement techniques from an ex-
perimental perspective is important to explore freezing con-
ditions for specific compositions and more atmospherically
relevant particles (e.g., soil dusts and long range transported
weathered dusts). In parallel, an empirically constrained
model including parameterizations of immersion freezing
that correctly and efficiently represent particle-specific ex-
perimental data is also in high demand for overall predic-
tions of current and future climate. We demonstrated that
the ns formulation offers a simplified expression for quan-
titatively parameterizing immersion freezing. Further devel-
opments of more simplified (efficient but accurate) descrip-
tions, constrained by more accurate IN counting techniques,
of governing atmospheric IN processes are needed.
The Supplement related to this article is available online
at doi:10.5194/acp-15-2489-2015-supplement.
Author contributions. J. Curtius and O. Möhler proposed the
framework of this collaborative multi-institutional laboratory work.
The overall manuscript, coordinated and led by N. Hiranuma, was
a collaborative effort of the partners of the INUIT group and ex-
ternal partners. C. Budke and T. Koop designed and conducted the
BINARY experiments, analyzed the data, and contributed the BI-
NARY text. T. C. J. Hill carried out the CSU-IS measurements, an-
alyzed the data, and contributed to the CSU-IS text. B. J. Murray,
D. O’Sullivan and T. F. Whale performed the Leeds-NIPI experi-
ments, analyzed the data, and contributed to the Leeds-NIPI text.
K. Diehl performed the experiments and data analysis of M-AL and
W-WT, and K. Diehl also contributed to their method summary text.
J. D. Hader performed the NC State-CS experiments and analyzed
the data, T. P. Wright contributed the analysis software, M. D. Pet-
ters designed the experiments, and J. D. Hader and M. D. Petters
contributed to the NC State-CS text. G. P. Schill and M. A. Tol-
bert conducted the CU-RMCS experiments, analyzed the data, and
contributed to the CU-RMCS text. N. Hiranuma and O. Möhler
conceived the AIDA experiments, analyzed and discussed the re-
sults and contributed to the AIDA text. P. J. DeMott, E. J. T. Levin
and C. S. McCluskey performed CSU-CFDC experiments, analyzed
the data, and contributed to the CSU-CFDC text. N. Hoffmann and
A. Kiselev carried out the EDB measurements with input on ex-
perimental techniques from T. Leisner and SEM measurements and
contributed to the associated data analysis and text. Björn Nillius
and Fabian Frank performed the FINCH experiments and analyzed
the data, and D. Rose contributed to the FINCH uncertainty anal-
ysis and method summary text. A. Danielczok and H. Bingemer
conducted the FRIDGE experiments, analyzed the data, and con-
tributed to the FRIDGE text. S. Augustin-Bauditz did the LACIS
experiments, D. Niedermeier derived contact angle distributions
with SBM, and H. Wex performed SBM calculations and con-
tributed to the LACIS text. M. Murakami, K. Yamashita, T. Tajiri
and A. Saito designed and performed the MRI-DCECC experiments
with assistance and contributions from N. Hiranuma and O. Möh-
ler, K. Yamashita and N. Hiranuma analyzed the MRI-DCECC
data, and K. Yamashita contributed to the method summary text.
Z. A. Kanji conducted the PINC experiments, Y. Boose analyzed
the data, Y. Boose and Z. A. Kanji interpreted and discussed the
PINC data, and contributed to the PINC text. G. Kulkarni carried out
the PNNL-CIC measurements, analyzed the data, and contributed
to the PNNL-CIC text. A. Welti performed the IMCA-ZINC ex-
periments, analyzed the data, and A. Welti and Z. A. Kanji con-
tributed to the supplementary text. XRD measurements and analysis
of illite NX were conducted by M. Ebert, K. Kandler and S. Wein-
bruch, and M. Ebert contributed the XRD text. IC measurements
and analysis were carried out by A. Peckhaus and A. Kiselev, and
A. Kiselev contributed to the IC text. DLS measurements and anal-
ysis were performed by K. Dreischmeier, and K. Dreischmeier also
contributed to the DLS text. N. Hiranuma interpreted and analyzed
the compiled data and wrote the paper. A. Kiselev and B. J. Mur-
ray co-wrote Sect. 4.6 with N. Hiranuma. All authors discussed the
results and contributed to the final version of the manuscript.
Acknowledgements. Part of this work is funded by Deutsche
Forschungsgemeinschaft (DFG) under contracts BU 1432/4-1, DI
1539/1-1, KO2944/2-1, MO668/4-1 and WE 4722/1-1 within Re-
search Unit FOR 1525 (INUIT). The authors acknowledge par-
tial financial support by Deutsche Forschungsgemeinschaft and
Open Access Publishing Fund of Karlsruhe Institute of Technology.
The authors gratefully acknowledge skillful and continuous support
from their technical teams. G. Kulkarni acknowledges support from
the Department of Energy (DOE) Atmospheric System Research
Atmos. Chem. Phys., 15, 2489–2518, 2015 www.atmos-chem-phys.net/15/2489/2015/

N. Hiranuma et al.: A comparison of 17 IN measurement techniques 2515
Program and thanks J. Fast for useful discussion. Battelle Memo-
rial Institute operates the Pacific Northwest National Laboratory
for DOE under contract DE-AC05-76RLO 1830. Z. A. Kanji ac-
knowledges funding from Swiss National Funds. P. J. DeMott and
T. Hill were funded by NSF grant award number AGS-1358495.
M. A. Tolbert and G. P. Schill were funded by NSF Grant AGS
1048536. The MRI-DCECC work was partly funded by JSPS
KAKENHI Grant Numbers 23244095. T. P. Wright, J. D. Hader,
and M. D. Petters were funded by NSF Grant AGS 1010851.
B. J. Murray, D. O’Sullivan and T. F. Whale acknowledge the Natu-
ral Environment Research Council (NE/K004417/1; NE/I020059/1;
NE/I013466/1; NE/I019057/1) and The European Research Coun-
cil (240449 – ICE) for funding. D. Niedermeier acknowledges fi-
nancial support from the Alexander von Humboldt-foundation, Ger-
many.
T. C. J. Hill would like to thank E. Levin and C. McCluskey
for generation of size-selected particles. K. Diehl would like to
thank S. K. Mitra for technical support on M-AL and M-WT and
fruitful discussions. A. Kiselev and A. Peckhaus acknowledge
O. Dombrowski for her support in IC measurements. N. Hiranuma
thanks C. Anquetil-Deck for useful discussion. N. Hiranuma and
G. Kulkarni thank T. Kisely and R. Ahmad for the N2 BET and
H2O BET measurements, respectively. M. Ebert acknowledges
R. Petschik for the additional high precision XRD measurements.
N. Hiranuma and O. Möhler gratefully acknowledge technical
support from M. Koyro and F. Schwartz for setting up the database
for storing and updating the INUIT laboratory results. N. Hiranuma
also thanks the AIDA technical team, including R. Buschbacher,
T. Chudy, O. Dombrowski, E. Kranz, G. Scheurig and S. Vogt,
for their professional support for the chamber maintenance and
operation.
The article processing charges for this open-access
publication have been covered by a Research
Centre of the Helmholtz Association.
Edited by: D. J. Cziczo
References
Ardon-Dryer, K., Levin, Z., and Lawson, R. P.: Characteristics of
immersion freezing nuclei at the South Pole station in Antarctica,
Atmos. Chem. Phys., 11, 4015–4024, doi:10.5194/acp-11-4015-
2011, 2011.
Atkinson, J. D., Murray, B. J., Woodhouse, M. T., Carslaw, K.,
Whale, T. F., Baustian, K., Dobbie, S., O’Sullivan, D., and
Malkin, T. L.: The importance of feldspar for ice nucleation
by mineral dust in mixed-phase clouds, Nature, 498, 355–358,
doi:10.1038/nature12278, 2013.
Augustin-Bauditz, S., Wex, H., Kanter, S., Ebert, M., Stolz, F.,
Prager, A., Niedermeier, D., and Stratmann, F.: The immersion
mode ice nucleation behavior of mineral dusts: A comparison of
different pure and surface modifed dusts, Geophys. Res. Lett.,
41, 7375–7382, doi:10.1002/2014GL061317, 2014.
Bickmore, B. R., Nagy, K. L., Sandlin, P., and Crater, T. S.: Quan-
tifying surface areas of clays by atomic force microscopy, Am.
Mineral., 87, 780–783, 2002.
Bigg, E. K.: The supercooling of water, Proc. Phys. Soc. B, 66, 688–
694, doi:10.1088/0370-1301/66/8/309, 1953.
Bigg, E. K.: A new technique for counting ice-forming nu-
clei in aerosols. Tellus, 9: 394–400, doi:10.1111/j.2153-
3490.1957.tb01895.x, 1957.
Bingemer, H., Klein, H., Ebert, M., Haunold, W., Bundke, U., Her-
rmann, T., Kandler, K., Müller-Ebert, D., Weinbruch, S., Judt,
A., Wéber, A., Nillius, B., Ardon-Dryer, K., Levin, Z., and Cur-
tius, J.: Atmospheric ice nuclei in the Eyjafjallajökull volcanic
ash plume, Atmos. Chem. Phys., 12, 857–867, doi:10.5194/acp-
12-857-2012, 2012.
Boucher, O., Randall, D., Artaxo, P., Bretherton, C., Feingold, G.,
Forster, P., Kerminen, V.-M., Kondo, Y., Liao, H., Lohmann, U.,
Rasch, P., Satheesh, S. K., Sherwood, S., Stevens, B., and Zhang,
X. Y.: Clouds and Aerosols, in: Climate Change 2013: The Phys-
ical Science Basis. Contribution of Working Group I to the Fifth
Assessment Report of the Intergovernmental Panel on Climate
Change, edited by: Stocker, T. F., Qin, D., Plattner, G.-K., Tig-
nor, M., Allen, S. K., Boschung, J., Nauels, A., Xia, Y., Bex,
V., and Midgley, P. M., Cambridge University Press, Cambridge,
United Kingdom and New York, NY, USA, 571–657, 2013.
Broadley, S. L., Murray, B. J., Herbert, R. J., Atkinson, J. D., Dob-
bie, S., Malkin, T. L., Condliffe, E., and Neve, L.: Immersion
mode heterogeneous ice nucleation by an illite rich powder rep-
resentative of atmospheric mineral dust, Atmos. Chem. Phys., 12,
287–307, doi:10.5194/acp-12-287-2012, 2012.
Brunauer, S., Emmett, P. H., and Teller, E.: Adsorption of gases
in multimolecular layers, J. Am. Chem. Soc., 60, 309–319,
doi:10.1021/ja01269a023, 1938.
Budke, C. and Koop, T.: BINARY: an optical freezing array for as-
sessing temperature and time dependence of heterogeneous ice
nucleation, Atmos. Meas. Tech., 8, 689–703, doi:10.5194/amt-8-
689-2015, 2015.
Bundke, U., Nillius, B., Jaenicke, R., Wetter, T., Klein, H., and
Bingemer, H.: The fast ice nucleus chamber FINCH, Atmos.
Res., 90, 180–186, doi:10.1016/j.atmosres.2008.02.008, 2008.
Chou, C., Stetzer, O., Weingartner, E., Jurányi, Z., Kanji, Z. A., and
Lohmann, U.: Ice nuclei properties within a Saharan dust event
at the Jungfraujoch in the Swiss Alps, Atmos. Chem. Phys., 11,
4725–4738, doi:10.5194/acp-11-4725-2011, 2011.
Christenson, H.: Two-step crystal nucleation via capil-
lary condensation, Cryst. Eng. Comm., 15, 2030–2039,
doi:10.1039/C3CE26887J, 2013.
Connolly, P. J., Möhler, O., Field, P. R., Saathoff, H., Burgess,
R., Choularton, T., and Gallagher, M.: Studies of heterogeneous
freezing by three different desert dust samples, Atmos. Chem.
Phys., 9, 2805–2824, doi:10.5194/acp-9-2805-2009, 2009.
Cwilong, B. M.: Sublimation centers in a Wilson chamber, Proc.
Roy. Soc. A, 190, 137–143, doi:10.1098/rspa.1947.0066, 1947.
DeMott, P. J. and Rogers, D. C.: Freezing nucleation rates of dilute
solution droplets measured between−30◦ and−40 ◦C in labora-
tory simulations of natural clouds. J. Atmos. Sci., 47, 1056–1064,
doi:10.1175/1520-0469(1990)047<1056:FNRODS>2.0.CO;2,
1990.
DeMott, P. J.: Quantitative descriptions of ice formation mecha-
nisms of silver iodide-type aerosols, Atmos. Res., 38, 63–99,
doi:10.1016/0169-8095(94)00088-U, 1995.
DeMott, P. J., Möhler, O., Stetzer, O., Vali, G., Levin, Z., Pet-
ters, M. D., Murakami, M., Leisner, T., Bundke, U., Klein,
www.atmos-chem-phys.net/15/2489/2015/ Atmos. Chem. Phys., 15, 2489–2518, 2015

2516 N. Hiranuma et al.: A comparison of 17 IN measurement techniques
H., Kanji, Z. A., Cotton, R., Jones, H., Benz, S., Brinkmann,
M., Rzesanke, D., Saathoff, H., Nicolet, M., Saito, A., Nil-
lius, B., Bingemer, H., Abbatt, J., Ardon, K., Ganor, E., Geor-
gakopoulos, D. G., and Saunders, C.: Resurgence in ice nuclei
measurement research, B. Am. Meteorol. Soc., 92, 1623–1635,
doi:10.1175/2011BAMS3119.1, 2011.
DeMott, P. J., Prenni, A. J., McMeeking, G. R., Sullivan, R. C.,
Petters, M. D., Tobo, Y., Niemand, M., Möhler, O., Snider, J.
R., Wang, Z., and Kreidenweis, S. M.: Integrating laboratory and
field data to quantify the immersion freezing ice nucleation activ-
ity of mineral dust particles, Atmos. Chem. Phys., 15, 393–409,
doi:10.5194/acp-15-393-2015, 2015.
Diehl, K., Mitra, S. K., Szakáll, M., Blohn, N. v., Borrmann, S.,
and Pruppacher, H. R.: Chapter 2. Wind Tunnels: Aerodynam-
ics, Models, and Experiments, in: The Mainz Vertical Wind Tun-
nel Facility: A Review of 25 Years of Laboratory Experiments
on Cloud Physics and Chemistry, edited by: Pereira, J. D., Nova
Science Publishers, Inc., Hauppauge, NY, USA, 2011.
Diehl, K., Debertshäuser, M., Eppers, O., Schmithüsen, H., Mi-
tra, S. K., and Borrmann, S.: Particle surface area depen-
dence of mineral dust in immersion freezing mode: investiga-
tions with freely suspended drops in an acoustic levitator and
a vertical wind tunnel, Atmos. Chem. Phys., 14, 12343–12355,
doi:10.5194/acp-14-12343-2014, 2014.
Durant, A. J. and Shaw, R. A.: Evaporation freezing by con-
tact nucleation inside-out, Geophys. Res. Lett., 32, L20814,
doi:10.1029/2005GL024175, 2005.
Dymarska, M., Murray, B. J., Sun, L. M., Eastwood, M. L., Knopf,
D. A., and Bertram, A. K.: Deposition ice nucleation on soot
at temperatures relevant for the lower troposphere, J. Geophys.
Res., 111, D04204, doi:10.1029/2005JD006627, 2006.
Ervens, B. and Feingold, G.: Sensitivities of immersion freez-
ing: Reconciling classical nucleation theory and deter-
ministic expressions, Geophys. Res. Lett., 40, 3320–3324,
doi:10.1002/grl.50580, 2013.
Fletcher, N. H.: Physics of Rain Clouds, Cambridge Univ. Press,
New York, NY, USA, 386 pp., 1962.
Fletcher, N. H.: Active sites and ice crystal nucleation,
J. Atmos. Sci., 26, 1266–1271, doi:10.1175/1520-
0469(1969)026<1266:ASAICN>2.0.CO;2, 1969.
Fornea, A. P., Brooks, S. D., Dooley, J. B., and Saha, A.
Heterogeneous freezing of ice on atmospheric aerosols con-
taining ash, soot, and soil, J. Geophys. Res., 114, D13201,
doi:10.1029/2009JD011958, 2009.
Fournier D’albe, E. M.: Some experiments on the condensation of
water vapour at temperatures below 0◦ C, Q. J. Roy. Meteorol.
Soc., 75, 1–16, doi:10.1002/qj.49707532302, 1949.
Friedman, B., Kulkarni, G., Beránek, J., Zelenyuk, A., Thornton, J.
A., and Cziczo, D. J.: Ice nucleation and droplet formation by
bare and coated soot particles, J. Geophys. Res., 116, D17203,
doi:10.1029/2011JD015999, 2011.
Friedrich, F., Steudel, A., and Weidler, P. G.: Change of the re-
fractive index of illite particles by reduction of the Fe con-
tent of the octahedral sheet, Clays Clay Miner., 56, 505–510,
doi:10.1346/CCMN.2008.0560503, 2008.
Garimella, S., Huang, Y.-W., Seewald, J. S., and Cziczo, D. J.:
Cloud condensation nucleus activity comparison of dry- and wet-
generated mineral dust aerosol: the significance of soluble mate-
rial, Atmos. Chem. Phys., 14, 6003–6019, doi:10.5194/acp-14-
6003-2014, 2014.
Gregg, S. L. and Sing, K. S. W.: Adsorption, Surface Area and
Porosity, Academic Press, London, UK, 303 pp., 1982.
Grim, R. E.: Clay mineralogy, McGraw-Hill, New York, USA,
384 pp., 1953.
Hader, J. D., Wright, T. P., and Petters, M. D.: Contribution of pollen
to atmospheric ice nuclei concentrations, Atmos. Chem. Phys.,
14, 5433–5449, doi:10.5194/acp-14-5433-2014, 2014.
Hartmann, S., Niedermeier, D., Voigtländer, J., Clauss, T., Shaw,
R. A., Wex, H., Kiselev, A., and Stratmann, F.: Homogeneous
and heterogeneous ice nucleation at LACIS: operating princi-
ple and theoretical studies, Atmos. Chem. Phys., 11, 1753–1767,
doi:10.5194/acp-11-1753-2011, 2011.
Herbert, R. J., Murray, B. J., Whale, T. F., Dobbie, S. J., and Atkin-
son, J. D.: Representing time-dependent freezing behaviour in
immersion mode ice nucleation, Atmos. Chem. Phys., 14, 8501–
8520, doi:10.5194/acp-14-8501-2014, 2014.
Hill, T. C. J., Moffett, B. F., DeMott, P. J., Georgakopoulos,
D. G., Stump, W. L., and Franc, G. D.: Measurement of Ice
Nucleation-Active Bacteria on Plants and in Precipitation by
Quantitative PCR, Appl. Environ. Microbiol., 80, 1256–1267,
doi:10.1128/AEM.02967-13, 2014.
Hiranuma, N., Brooks, S. D., Moffet, R., Glen, A., Laskin, A.,
Gilles, M. K., Liu, P., MacDonald, M. A., Strapp, W., and Mc-
Farquhar, G. M.: Chemical characterization of individual parti-
cles and residuals of cloud droplets and ice crystals collected on
board research aircraft in the ISDAC 2008 study, J. Geophys.
Res., 118, 6564–6579, doi:10.1002/jgrd.50484, 2013.
Hiranuma, N., Paukert, M., Steinke, I., Zhang, K., Kulkarni, G.,
Hoose, C., Schnaiter, M., Saathoff, H., and Möhler, O.: A com-
prehensive parameterization of heterogeneous ice nucleation of
dust surrogate: laboratory study with hematite particles and its
application to atmospheric models, Atmos. Chem. Phys., 14,
13145–13158, doi:10.5194/acp-14-13145-2014, 2014a.
Hiranuma, N., Hoffmann, N., Kiselev, A., Dreyer, A., Zhang, K.,
Kulkarni, G., Koop, T., and Möhler, O.: Influence of surface
morphology on the immersion mode ice nucleation efficiency
of hematite particles, Atmos. Chem. Phys., 14, 2315–2324,
doi:10.5194/acp-14-2315-2014, 2014b.
Hoffmann, N., Kiselev, A., Rzesanke, D., Duft, D., and Leis-
ner, T.: Experimental quantification of contact freezing in an
electrodynamic balance, Atmos. Meas. Tech., 6, 2373–2382,
doi:10.5194/amt-6-2373-2013, 2013.
Hoose, C., Kristjansson, J. E., Chen, J.-P., and Hazra, A.: A
classical-theory-based parameterization of heterogeneous ice
nucleation by mineral dust, soot, and biological particles
in a global climate model, J. Atmos. Sci., 67, 2483–2503,
doi:10.1175/2010JAS3425.1, 2010.
Hoose, C. and Möhler, O.: Heterogeneous ice nucleation on atmo-
spheric aerosols: a review of results from laboratory experiments,
Atmos. Chem. Phys., 12, 9817–9854, doi:10.5194/acp-12-9817-
2012, 2012.
Hussain, K. and Saunders, C. P. R.: Ice nucleus measurement with a
continuous flow chamber. Q. J. Roy. Meteorol. Soc., 110, 75–84,
doi:10.1002/qj.49711046307, 1984.
Iannone, R., Chernoff, D. I., Pringle, A., Martin, S. T., and Bertram,
A. K.: The ice nucleation ability of one of the most abundant
Atmos. Chem. Phys., 15, 2489–2518, 2015 www.atmos-chem-phys.net/15/2489/2015/

N. Hiranuma et al.: A comparison of 17 IN measurement techniques 2517
types of fungal spores found in the atmosphere, Atmos. Chem.
Phys., 11, 1191–1201, doi:10.5194/acp-11-1191-2011, 2011.
Kanji, Z. A. and Abbatt, J. P. D.: Laboratory studies of ice
formation via deposition mode nucleation onto mineral dust
and n-hexane soot samples, J. Geophys. Res., 111, D16204,
doi:10.1029/2005JD006766, 2006.
Kanji, Z. A. and Abbatt, J. P. D.: The University of Toronto Con-
tinuous Flow Diffusion Chamber (UT-CFDC): A simple design
for ice nucleation studies, Aerosol Sci. Technol., 43, 730–738.
doi:10.1080/02786820902889861, 2009.
Kanji, Z. A., Welti, A., Chou, C., Stetzer, O., and Lohmann, U.:
Laboratory studies of immersion and deposition mode ice nucle-
ation of ozone aged mineral dust particles, Atmos. Chem. Phys.,
13, 9097–9118, doi:10.5194/acp-13-9097-2013, 2013.
Kashchiev, D.: Nucleation: Basic Theory with Applications,
Butterworth-Heinemann, Oxford, UK, 544 pp., 2000.
Khvorostyanov, V. I. and Curry, J. A.: A new theory of
heterogeneous nucleation for application in cloud and
climate models, Geophys. Res. Lett., 27, 4081–4084,
doi:10.1029/1999GL011211, 2000.
Kline, D. B. and Brier, G. W.: Some experiments on the measure-
ment of natural ice nuclei, Mon. Weather Rev., 89, 263–272,
doi:10.1175/1520-0493(1961)089<0263:SEOTMO>2.0.CO;2,
1961.
Knopf, D. A. and Alpert, P. A.: A water activity based model
of heterogeneous ice nucleation kinetics for freezing of water
and aqueous solution droplets, Faraday Discuss., 165, 513–534,
doi:10.1039/C3FD00035D, 2013.
Koehler, K. A., Kreidenweis, S. M., DeMott, P. J., Petters, M.
D., Prenni, A. J., and Möhler, O.: Laboratory investigations
of the impact of mineral dust aerosol on cold cloud forma-
tion, Atmos. Chem. Phys., 10, 11955–11968, doi:10.5194/acp-
10-11955-2010, 2010.
Koop, T., Luo, B., Tsias, A., and Peter, T.: Water activity as the de-
terminant for homogeneous ice nucleation in aqueous solutions,
Nature, 406, 611–614, doi:10.1038/35020537, 2000.
Kulkarni, G., Fan, J., Comstock, J. M., Liu, X., and Ovchinnikov,
M.: Laboratory measurements and model sensitivity studies of
dust deposition ice nucleation, Atmos. Chem. Phys., 12, 7295–
7308, doi:10.5194/acp-12-7295-2012, 2012.
Kumar, P., Sokolik, I. N., and Nenes, A.: Cloud condensation nuclei
activity and droplet activation kinetics of wet processed regional
dust samples and minerals, Atmos. Chem. Phys., 11, 8661–8676,
doi:10.5194/acp-11-8661-2011, 2011.
Levine, J.: Statistical Explanation of Spontaneous Freezing of Water
Droplets, NACA Tech. Notes, no. 2234, 1950.
Lüönd, F., Stetzer, O., Welti, A., and Lohmann, U.: Experimental
study on the ice nucleation ability of size-selected kaolinite par-
ticles in the immersion mode, J. Geophys. Res., 115, D14201,
doi:10.1029/2009JD012959, 2010.
Marcolli, C., Gedamke, S., Peter, T., and Zobrist, B.: Efficiency of
immersion mode ice nucleation on surrogates of mineral dust,
Atmos. Chem. Phys., 7, 5081–5091, doi:10.5194/acp-7-5081-
2007, 2007.
Marcolli, C.: Deposition nucleation viewed as homogeneous or im-
mersion freezing in pores and cavities, Atmos. Chem. Phys., 14,
2071–2104, doi:10.5194/acp-14-2071-2014, 2014.
Meunier, A.: Clays, Springer, 472 pp., Berlin, Heidelberg, Germany,
2005.
Meunier, A. and Velde, B. D.: Illite: Origins, Evolution and Meta-
morphism, Springer, 286 pp., Berlin, Heidelberg, Germany,
2004.
Möhler, O., Stetzer, O., Schaefers, S., Linke, C., Schnaiter, M.,
Tiede, R., Saathoff, H., Krämer, M., Mangold, A., Budz, P., Zink,
P., Schreiner, J., Mauersberger, K., Haag, W., Kärcher, B., and
Schurath, U.: Experimental investigation of homogeneous freez-
ing of sulphuric acid particles in the aerosol chamber AIDA,
Atmos. Chem. Phys., 3, 211–223, doi:10.5194/acp-3-211-2003,
2003.
Mullin, J. W.: Crystallization, Elsevier Butterworth-Heinemann,
Oxford, UK, Forth edn., 600 pp, 2001.
Murray, B. J., Broadley, S. L., Wilson, T. W., Bull, S. J., Wills, R.
H., Christenson, H. K., and Murray, E. J.: Kinetics of the homo-
geneous freezing of water, Phys. Chem. Chem. Phys., 12, 10380–
10387, doi:10.1039/c003297b, 2010.
Murray, B. J., Broadley, S. L., Wilson, T. W., Atkinson, J. D.,
and Wills, R. H.: Heterogeneous freezing of water droplets con-
taining kaolinite particles, Atmos. Chem. Phys., 11, 4191–4207,
doi:10.5194/acp-11-4191-2011, 2011.
Murray, B. J., O’Sullivan, D., Atkinson, J. D., and Webb, M. E.: Ice
nucleation by particles immersed in supercooled cloud droplets,
Chem. Soc. Rev., 41, 6519–6554, doi:10.1039/c2cs35200a,
2012.
Niedermeier, D., Shaw, R. A., Hartmann, S., Wex, H., Clauss, T.,
Voigtländer, J., and Stratmann, F.: Heterogeneous ice nucleation:
exploring the transition from stochastic to singular freezing be-
havior, Atmos. Chem. Phys., 11, 8767–8775, doi:10.5194/acp-
11-8767-2011, 2011.
Niedermeier, D., Ervens, B., Clauss, T., Voigtländer, J., Wex,
H., Hartmann, S., and Stratmann, F.: A computationally effi-
cient description of heterogeneous freezing: A simplified ver-
sion of the soccer ball model, Geophys. Res. Lett., 41, 736–741,
doi:10.1002/2013GL058684, 2014.
Niehaus, J, Bunker, K. W., China, S., Kostinski, A., Mazzoleni,
C., and Cantrell, W.: A technique to measure ice nuclei in
the contact mode, J. Atmos. Oceanic Technol., 31, 913–922,
doi:10.1175/JTECH-D-13-00156.1, 2014.
Niemand, M., Möhler, O., Vogel, B., Vogel, H., Hoose, C., Con-
nolly, P., Klein, H., Bingemer, H., DeMott, P., and Skrotzki,
J.: A particle-surface-area-based parameterization of immersion
freezing on desert dust particles, J. Atmos. Sci., 69, 3077–3092,
doi:10.1175/Jas-D-11-0249.1, 2012.
O’Sullivan, D., Murray, B. J., Malkin, T. L., Whale, T. F., Umo,
N. S., Atkinson, J. D., Price, H. C., Baustian, K. J., Browse, J.,
and Webb, M. E.: Ice nucleation by fertile soil dusts: relative
importance of mineral and biogenic components, Atmos. Chem.
Phys., 14, 1853–1867, doi:10.5194/acp-14-1853-2014, 2014.
Palmer, H. P.: Natural ice-particle nuclei, Q. J. Roy. Meteorol. Soc.,
75, 17–22, doi:10.1002/qj.49707532303, 1949.
Prenni, A. J., DeMott, P. J., Rogers, D. C., Kreidenweis, S. M.,
McFarquhar, G. M., Zhang, G., and Poellot, M. R.: Ice nu-
clei characteristics from M-PACE and their relation to ice for-
mation in clouds, Tellus, 61B, 436–448, doi:10.1111/j.1600-
0889.2009.00415.x, 2009.
Quantachrome Instruments: autosorb iQ/ASiQwin Operating Man-
ual, Sect. J. Theory and Discussion, 359–360, 2013.
Riechers, B., Wittbracht, F., Hütten, A., and Koop, T.: The homo-
geneous ice nucleation rate of water droplets produced in a mi-
www.atmos-chem-phys.net/15/2489/2015/ Atmos. Chem. Phys., 15, 2489–2518, 2015

2518 N. Hiranuma et al.: A comparison of 17 IN measurement techniques
crofluidic device and the role of temperature uncertainty, Phys.
Chem. Chem. Phys., 15, 5873–5887, doi:10.1039/c3cp42437e,
2013.
Rogers, D. C.: Development of a continuous flow thermal gradient
diffusion chamber for ice nucleation studies, Atmos. Res., 22,
149–181, doi:10.1016/0169-8095(88)90005-1, 1988.
Rogers, D. C., DeMott, P. J., Kreidenweis, S. M., and Chen, Y.:
A continuous-flow diffusion chamber for airborne measure-
ments of ice nuclei, J. Atmos. Oceanic Technol., 18, 725–741,
doi:10.1175/1520-0426(2001)018<0725:ACFDCF>2.0.CO;2,
2001.
Rosenfeld, D. and Woodley, W. L.: Deep convective clouds with
sustained supercooled liquid water down to −37.5 ◦C, Nature,
405, 440–442, doi:10.1038/35013030, 2000.
Schill, G. P. and Tolbert, M. A.: Heterogeneous ice nucleation
on phase-separated organic-sulfate particles: effect of liquid
vs. glassy coatings, Atmos. Chem. Phys., 13, 4681–4695,
doi:10.5194/acp-13-4681-2013, 2013.
Steinke, I., Möhler, O., Kiselev, A., Niemand, M., Saathoff, H.,
Schnaiter, M., Skrotzki, J., Hoose, C., and Leisner, T.: Ice nu-
cleation properties of fine ash particles from the Eyjafjallajökull
eruption in April 2010, Atmos. Chem. Phys., 11, 12945–12958,
doi:10.5194/acp-11-12945-2011, 2011.
Stetzer, O., Baschek, B., Luond, F., and Lohmann, U.: The Zurich
Ice Nucleation Chamber (ZINC) – A new instrument to investi-
gate atmospheric ice formation, Aerosol Sci. Technol., 42, 64–
74, doi:10.1080/02786820701787944, 2008.
Sullivan, R. C., Moore, M. J. K., Petters, M. D., Kreidenweis, S.
M., Qafoku, O., Laskin, A., Roberts, G. C., and Prather, K. A.:
Impact of particle generation method on the apparent hygroscop-
icity of insoluble mineral particles, Aerosol Sci. Tech., 44, 830–
846, doi:10.1080/02786826.2010.497514, 2010.
Szakáll, M., Diehl, K., Mitra, S. K., and Borrmann, S.: A wind tun-
nel study on the shape, oscillation, and internal circulation of
large raindrops with sizes between 2.5 and 7.5 mm, J. Atmos.
Sci., 66, 755–765, doi:10.1175/2008JAS2777.1, 2009.
Tajiri, T., Yamashita, K., Murakami, M., Orikasa, N., Saito, A.,
Kusunoki, K., and Lilie, L.: A novel adiabatic-expansion-type
cloud simulation chamber. J. Meteor. Soc. Japan, 91, 687–704,
doi:10.2151/jmsj.2013-509, 2013.
Tobo, Y., Prenni, A. J., DeMott, P. J., Huffman, J. A., McCluskey,
C. S. , Tian,G., Pöhlker,C., Pöschl, U., and Kreidenweis, S. M.:
Biological aerosol particles as a key determinant of ice nuclei
populations in a forest ecosystem, J. Geophys. Res.-Atmos., 118,
10100–10110, doi:10.1002/jgrd.50801, 2013.
Tomlinson, E. M. and Fukuta, N.: A new horizontal gra-
dient, continuous flow, ice thermal diffusion chamber. J.
Atmos. Oceanic Technol., 2, 448–467, doi:10.1175/1520-
0426(1985)002<0448:ANHGCF>2.0.CO;2., 1985.
Vali, G.: Nucleation terminology, J. Aerosol Sci., 16, 575–576,
doi:10.1016/0021-8502(85)90009-6, 1985.
Vali, G.: Freezing rate due to heterogeneous nucleation,
J. Atmos. Sci., 51, 1843–1856, doi:10.1175/1520-
0469(1994)051<1843:FRDTHN>2.0.CO;2, 1994.
Vali, G.: Repeatability and randomness in heterogeneous
freezing nucleation, Atmos. Chem. Phys., 8, 5017–5031,
doi:10.5194/acp-8-5017-2008, 2008.
Vali, G.: Interpretation of freezing nucleation experiments: singu-
lar and stochastic; sites and surfaces, Atmos. Chem. Phys., 14,
5271–5294, doi:10.5194/acp-14-5271-2014, 2014.
Veghte, D. P. and Freedman, M. A.: Facile method for de-
termining the aspect ratios of mineral dust aerosol by
electron microscopy, Aerosol Sci. Technol., 48, 715–724,
doi:10.1080/02786826.2014.920484, 2014.
Wagner, R., Möhler, O., Saathoff, H., Schnaiter, M., and Leisner, T.:
New cloud chamber experiments on the heterogeneous ice nucle-
ation ability of oxalic acid in the immersion mode, Atmos. Chem.
Phys., 11, 2083–2110, doi:10.5194/acp-11-2083-2011, 2011.
Waseda, Y., Matsubara, E., and Shinoda, K.: X-Ray Diffraction
Crystallography: Introduction, Examples and Solved Problems,
Springer, 310 pp., Berlin, Heidelberg, Germany, 2011.
Wegener, A.: Thermodynamik der Atmosphäre, J. A. Barth Verlag,
331 pp., Leipzig, Germany, 1911.
Welti, A., Lüönd, F., Stetzer, O., and Lohmann, U.: Influence of
particle size on the ice nucleating ability of mineral dusts, At-
mos. Chem. Phys., 9, 6705–6715, doi:10.5194/acp-9-6705-2009,
2009.
Welti, A., Lüönd, F., Kanji, Z. A., Stetzer, O., and Lohmann, U.:
Time dependence of immersion freezing: an experimental study
on size selected kaolinite particles, Atmos. Chem. Phys., 12,
9893–9907, doi:10.5194/acp-12-9893-2012, 2012.
Welti, A., Kanji, Z. A., Lüönd, F., Stetzer, O., and Lohmann, U.:
Exploring the mechanisms of ice nucleation on kaolinite: from
deposition nucleation to condensation freezing, J. Atmos. Sci.,
71, 16–36, doi:10.1175/JAS-D-12-0252.1, 2014.
Welton, J. E.: SEM Petrology Atlas, The American Association of
Petroleum Geologists, Tulsa, OK, USA, 240 pp., 1984.
Wex, H., DeMott, P. J., Tobo, Y., Hartmann, S., Rösch, M., Clauss,
T., Tomsche, L., Niedermeier, D., and Stratmann, F.: Kaolinite
particles as ice nuclei: learning from the use of different kaolinite
samples and different coatings, Atmos. Chem. Phys., 14, 5529–
5546, doi:10.5194/acp-14-5529-2014, 2014.
Wheeler, M. J., Mason, R. H., Steunenberg, K., Wagstaff, M., Chou,
C. and Bertram, A. K.: Immersion freezing of supermicron min-
eral dust particles: freezing results, testing different schemes for
describing ice nucleation, and ice nucleation active site densities,
J. Phys. Chem. A, Article ASAP, doi:10.1021/jp507875q, 2014.
Wilson, M. J.: Sheet Silicates: Clay Minerals, in: Rock-Forming
Minerals, Volume 3C, edited by: Deer, W. A., Howie, R. A.,
and Zussman, J., The Geological Society, 736 pp., London, UK,
2013.
Wright, T. P. and Petters, M. D.: The role of time in heterogeneous
freezing nucleation, J. Geophys. Res. Atmos., 118, 3731–3743,
doi:10.1002/jgrd.50365, 2013.
Wright, T. P., Petters, M. D., Hader, J. D., Morton, T., and Holder,
A. L.: Minimal cooling rate dependence of ice nuclei activ-
ity in the immersion mode, J. Geophys. Res.-Atmos., 118, 1–9,
doi:10.1002/jgrd.50810, 2013.
Atmos. Chem. Phys., 15, 2489–2518, 2015 www.atmos-chem-phys.net/15/2489/2015/