A Comprehensive EST Linkage Map for Tiger Salamander and ...
41
1 A Comprehensive EST Linkage Map for Tiger Salamander and Mexican Axolotl: Enabling Gene Mapping and Comparative Genomics in Ambystoma Smith, J.J. * , Kump, K. K. * , Walker, J. A. * , Parichy, D. M. dagger , and Voss, S.R. * * Department of Biology, University of Kentucky, Lexington, KY 40506 dagger Section of Integrative Biology, Section of Molecular, Cell and Developmental Biology, Institute for Cellular and Molecular Biology, University of Texas at Austin, Austin, TX 78705 Genetics: Published Articles Ahead of Print, published on August 3, 2005 as 10.1534/genetics.105.046433
Transcript of A Comprehensive EST Linkage Map for Tiger Salamander and ...

1
A Comprehensive EST Linkage Map for Tiger Salamander and Mexican Axolotl:
Enabling Gene Mapping and Comparative Genomics in Ambystoma
Smith, J.J.*, Kump, K. K. *, Walker, J. A. *, Parichy, D. M. dagger, and Voss, S.R. *
* Department of Biology, University of Kentucky, Lexington, KY 40506
dagger Section of Integrative Biology, Section of Molecular, Cell and Developmental
Biology, Institute for Cellular and Molecular Biology, University of Texas at
Austin, Austin, TX 78705
Genetics: Published Articles Ahead of Print, published on August 3, 2005 as 10.1534/genetics.105.046433

2
Running Head: Ambystoma linkage map
Keyords: axolotl, expressed sequence tag, QTL,
Correspondence to: Jeramiah J. Smith, Department of Biology, University of Kentucky,
Lexington, KY 40506; Email: [email protected], Tel: 859-257-9888, Fax: 859-257-1717

3
ABSTRACT
Expressed sequence tag (EST) markers were developed for Ambystoma tigrinum tigrinum
(Eastern tiger salamander) and A. mexicanum (Mexican axolotl) to generate the first
comprehensive linkage map for these model amphibians. We identified 14 large linkage
groups (125.5 cM to 836.7 cM) that presumably correspond to the 14 haploid
chromosomes in the Ambystoma genome. The extent of genome coverage for these
linkage groups is apparently high because the total map size (5251 cM) falls within the
range of theoretical estimates and is consistent with independent empirical estimates.
Unlike most vertebrate species, linkage map size in Ambystoma is not strongly correlated
with chromosome arm number. Presumably, the large physical genome size (~30 Gb) is a
major determinant of map size in Ambystoma. To demonstrate the utility of this resource,
we mapped the position of two historically significant A. mexicanum mutants, white and
melanoid, and also met, a quantitative trait locus (QTL) that contributes to variation in
metamorphic timing. This new collection of EST based PCR markers will better enable
the Ambystoma system by facilitating development of new molecular probes, and the
linkage map will allow comparative studies of this important vertebrate group.

4
INTRODUCTION
The tiger salamander (Ambystoma tigrinum) species complex consists of several closely
related and phenotypically diverse taxa that range from central Mexico to southern
Canada (Shaffer and McKnight, 1996). The complex as a whole is an important,
naturalistic model system because taxa are characterized by extensive interspecific and
intraspecific variation for a number of ecologically important traits including: expression
of metamorphic versus non-metamorphic (paedomorphic) life histories (Gould, 1977;
Shaffer and Voss, 1996), timing of metamorphosis (Rose and Armentrout, 1976; Voss
and Smith, 2005), cannibal versus normal larval morphologies (Powers, 1907; Hoffman
and Pfennig, 1999), infectious disease (Collins et al, 2004), variation in adult coloration
and pigment patterning (Reese 1969; Parichy, 1996; Parichy, 1998), and variation in
general morphology (Shaffer, 1984; Irschick and Shaffer, 1997). In addition, these
salamanders are important laboratory models for olfaction (Marchand et al, 2004; Park et
al, 2004), vision (Chichilinski and Reike, 2005; Thoreson et al, 2004), cardiogenesis
(Denz et al, 2004; Zhang et al, 2004), embryogenesis (Bachvarova, 2004; Ericsson et al,
2004), and post-embryonic development (Parichy, 1998; Voss and Smith, 2005),
including organ and tissue regeneration (Christensen et al, 2002; Schnapp and Tanaka,
2005). Both natural and laboratory based research areas are in need of a comprehensive
genome map that can be used to identify the position and effect of loci that contribute to
phenotypic variation, and that can be used to compare features of the salamander genome
to other vertebrates. Moreover, molecular markers that are used to develop linkage maps
provide the material to generate nucleotide probes and sequences that can be used in a

5
variety of ways, including in situ hybridization, population genetics, systematics,
molecular evolution, and functional genomics.
Several lines of evidence suggest that meiotic or recombinational map size is
large in tiger salamanders. The earliest mapping studies in A. mexicanum employed tetrad
analysis and gynogenic salamanders to estimate genetic distance between a few
phenotypic markers and their centromeres (e.g. 3 in Lindsley et al, 1955; 7 in Armstrong,
1984). Most of these phenotypes were mapped to positions distant from centromeres
(unlinked); this suggests a large recombinational map size for Ambystoma relative to
other vertebrates where the majority of loci typically show linkage with the centromere
(Brown et al, 1998; Steen, 1999; Groenen et al, 2000; Kong et al, 2002; Kelly et al,
2000). Using a more direct method, Callan (1966) reported chiasmata counts from A.
mexicanum oocytes nuclei ranging from 101 to 126, averaging 113 chiasmata per
nucleus. Assuming that one crossover is equivalent to a 50 cM map distance (Sturtevant,
1913), this chiasmata frequency converts to an estimated map distance of 5,650 cM,
which is approximately 4.2x larger than the mouse genome and 1.6x larger than the
human genome (Table 1). Finally, Voss et al (2001) estimated map size from a linkage
analysis in which 347 molecular genotypes were obtained for offspring from backcrosses
between A. mexicanum and A. mexicanum/A. t. tigrinum hybrids. That analysis yielded
one of the largest partial genetic linkage maps ever constructed (~3400 cM) and an
overall map size estimate of 7291 cM, based on the method of Hulbert et al (1988). Thus,
all studies to date suggest that recombinational map size is relatively larger in Ambystoma
than it is in other vertebrates. Although recombinational map size in Ambystoma may
simply be a consequence of large physical genome size (Table 1), the contribution of

6
additional factors that are known to strongly influence map length in other vertebrates (e.
g. chromosome number and morphology) have not been considered.
Recently completed expressed sequence tag (EST) sequencing projects for two
tiger salamander species, A. mexicanum (Haberman et al, 2004; Putta et al 2004) and A.
tigrinum tigrinum (Putta et al, 2004), allowed us to rapidly develop a sufficient number of
EST based markers to generate a comprehensive genetic map for Ambystoma, and the
first such map for any amphibian. Below we describe this new resource and show its
utility in two areas: (1) mapping phenotypic mutants and (2) investigating the relative
effects of genome size and chromosome number on recombination-based estimates of
genome size. We also note the importance of these EST based PCR markers as a general
resource for tiger salamander research.

7
MATERIALS AND METHODS
Study Species
Ambystoma tigrinum tigrinum: The Eastern tiger salamander is the archetype of the tiger
salamander species complex. This relatively large salamander species breeds in ponds
and temporary pools in the eastern and southern parts of the United States; the individual
that was used in this study was purchased from Charles D. Sullivan Co. Inc., which
collects and distributes amphibians from breeding ponds in the vicinity of Nashville, TN.
These salamanders undergo a typical amphibian life cycle, wherein they hatch from the
egg in an aquatic-larval form and eventually undergo a metamorphosis through which
they achieve a terrestrial adult form.
Ambystoma mexicanum: The Mexican axolotl is native to a single lake in central
Mexico (Lake Xochimilco, Mexico D.F., Mexico). It is commonly used in biological
research and strains have been maintained in laboratory culture for nearly a century and a
half (Dumeril, 1870; see also review by Smith, 1989). The most notable feature of this
salamander is that it exhibits a phenotype, known as paedomorphosis, wherein it forgoes
metamorphic changes typical of most ambystomatid salamanders and retains a largely
larval morphology throughout adult life. Several developmental mutants have been
described for A. mexicanum (Malacinski, 1989) and are readily available
(www.ambystoma.org). We estimated the genomic position of two recessive pigment
mutants: white (Häcker, 1907) and melanoid (Humphrey and Bagnara, 1967). In
comparison to wildtype, white is characterized by a general lack of epidermal pigment
cells, which is caused by failure of pigment cell precursors to migrate or survive in
epidermal tissues (reviewed by Parichy et al, 1999). In comparison to wildtype, melanoid

8
is characterized by a lack of iridophores in the skin and iris, relatively fewer
xanthophores and greater numbers of melanophores (Humphrey and Bagnara, 1967).
Molecular markers: A total of 1095 molecular markers were genotyped using a
previously described AxTg mapping family that was generated by backcrossing A.
mexicanum/A. t. tigrinum F1 hybrids to a single A. mexicanum (Voss, 1995). In a
previous study using AxTg, Voss et al (2001) reported linkage analyses of 323
“anonymous” molecular markers (315 AFLPs and 8 RAPDs) and 24 markers for nuclear
protein coding sequences. Here we report an additional 202 AFLP markers (scored for 44
backcross offspring) and 546 EST based markers (scored for 91 backcross offspring).
Marker fragments were amplified using standard PCR conditions (150 ng DNA, 50 ng
each primer, 1.2 mM MgCl2, 0.3 U Taq polymerase, 1x PCR buffer, 200 mM each of
dATP, dCTP, dGTP, dTTP; thermal cycling at 94° C for 4 minutes; 33 cycles of 94° C
for 45 s, 60° C for 45seconds, 72° C for 30 s; and 72° C for 7 minutes). Polymorphisms
were diagnosed by: primer extension (Perkin Elmer, AcycloPrime -FP chemistry and
Wallac, Victor3 plate reader) (e.g. Chen et al, 1999; Hsu et al, 2001; Gardiner and Jack,
2002), thermal gradient capillary gel electrophoresis (SpectruMedix, Reveal), allele-
specific amplification, PCR fragment size polymorphism, and restriction digestion.
Primer sequences, diagnostic polymorphisms, polymorphism detection assays, numbers
of individuals genotyped, and NCBI GI numbers for source sequences for all 570 protein-
coding loci are summarized in Supplementary Table 1. The design of AFLP markers,
EST based markers, and primer extension probes is described in detail below.

9
Generation of AFLP and RAPD markers: The methods used to generate AFLPs and
RAPDs were reported previously (Voss and Shaffer, 1997; Voss et al, 2001). An
additional 202 AFLPs were generated for this study using the same methods and
backcross progeny. Primer sequences for all AFLPs are provided in Supplementary Table
2.
EST based marker design: The majority of EST based markers were designed to target
3´ unconserved regions of assembled EST sequences that were derived from A.
mexicanum and A. t. tigrinum (Putta et al, 2004). These sequences were identified by first
aligning (BLASTx) assembled sequences to a custom database of Human protein
sequences (Ref Seq Release 3, NCBI). The 3´ most 70 base pairs of aligning sequence
and all remaining non-aligning 3´ sequence were targeted for primer design. These
regions presumably correspond to sequence encoding carboxy-terminal regions and 3´
untranslated regions. Primers were designed within these regions using Primer3 software
(www.mit.wi.edu/Primer3.html). When presumably orthologous sequences (>90%
identity) were available for both A. mexicanum and A. t. tigrinum, marker design was
additionally constrained to flank at least one polymorphism between the two sequences.
Primer extension probe design: Primer extension probes were designed to target
polymorphisms that were observed between presumptively orthologous EST sequences
or between EST sequences and sequenced marker fragments that were amplified from A.
mexicanum and A. t. tigrinum. Design of primer extension probes was constrained such
that probes were complementary to sequence immediately 3´ of targeted SNP positions.

10
The software package Array Designer 2.1 (PREMEIR Biosoft International) was used to
identify probes with Tm 60 ± 8° C and high ∆g for primer hairpin and primer dimer
formation.
Construction of the Linkage Map: A linkage map was constructed for the tiger
salamander using genotypes for 570 protein-coding markers (EST and gene based) and
525 AFLP markers. Linkage analyses were performed using Mapmaker/EXP 3.0b and
linkage groups were visualized using MapManagerQXTb19 (Meer et al, 2004) and
MapChart 2.1 (Voorrips, 2002). This linkage map was constructed by first identifying
sets of markers that formed linear linkage groups supported by log of odds (LOD) of 5.0
or greater, and then recursively adding markers to these initial groups at lower LOD
thresholds (4.0, 3.5, and 3.0). At each step linkage groups were visually inspected to
verify the linear arrangement among markers. At each LOD threshold, the addition of
new markers to an existing linkage group or merger of two existing linkage groups was
constrained such that addition or merger did not disrupt arrangements that were
previously set at a higher LOD threshold. A few markers could not be assigned to precise
positions within a linkage group, but could be assigned to a single linkage group at LOD
> 4.0 (Supplementary Table 2). Linkage distances among markers in the final map were
estimated using Kosambi (1944) mapping function in MapManagerQXTb19 (Meer et al,
2004).
QTL analysis: Interval analysis was used to identify the positions of two mutant
phenotypes that segregated within the AxTg mapping family: white, which is specified by

11
the recessive locus d; and melanoid, which is specified by the recessive locus m. Interval
analysis was also used to identify the position of a major effect QTL that contributes to
segregation of metamorphosis versus paedomorphosis and developmental timing.
Segregation patterns of white, melanoid, and metamorphic phenotypes within the AxTg
family have been previously described (Voss, 1995). Likelihood ratio statistics (LRS) for
association of phenotypic variation with genotypic inheritance were estimated using the
interval mapping (e.g. Haley and Knott, 1992; Martinez and Curnow, 1992; Zeng, 1993;
Zeng, 1994) function of MapManagerQTXb19 (Meer et al, 2004). Significance
thresholds for interval mapping were obtained through 10,000 permutations of trait
values among backcross progeny. Confidence intervals for QTL positions were estimated
by the method of Darvasi and Soller (1997).
RESULTS
Segregation of Molecular Markers: The segregation of alternate genotypes for a
majority of the molecular markers was consistent with the Mendelian expectation of 1:1.
Only 7% of protein-coding markers had genotypic ratios exceeding the 95% tail of the χ2
distribution (Figure 1a). On average, ratios of anonymous markers were more deviant
than protein-coding markers with 17% of markers exceeding the 95% tail of the χ2
distribution (Figure 1b). Plotting χ2 values for both marker classes against genomic
position showed that the few markers with significantly deviant ratios were not strongly
clustered at any position within the genome (Figure 1c).

12
Linkage Analysis: Linkage analysis revealed 14 large linkage groups that ranged in size
from 125.5 cM to 836.7 cM and consisted of between 14 and 123 markers (Figure 2,
Table 2). A total of 790 markers were assigned to these 14 linkage groups, with 486
protein-coding loci and 169 anonymous loci placed at precise positions. The total linkage
distance spanned by these markers was 5251.3 cM and the average inter-marker distance
was 7.96 cM.
Thirty-six smaller linkage groups were identified that ranged in size from 0 to 79
cM and consisted of between 2 and 10 markers. Thirteen of these linkage groups
contained at least one EST or protein coding marker and spanned a total of 479.7 cM, 23
additional linkage groups that consisted of only AFLP markers spanned a total of 630.5
cM. One hundred and sixty-five markers (134 AFLP and 31 protein coding) did not show
linkage to any other marker and were not assigned to any of the linkage groups.
QTL Analyses
White: Interval analysis identified two LRS peaks for white on LG1 (D1, LRS 37.2, 95%
CI = 17 cM; D2, LRS 12.4, 95% CI = 44 cM) (Figure 3). Although this suggests the
possibility that white may depend upon more than a single locus, the lesser LRS peak is
only suggestive of a significant QTL and an equally supportive LRS is expected to be
observed once at random within the genome. In the mapping cross, color phenotypes
segregated as F2 type markers because F1 hybrids and the recurrent A. mexicanum
carried a single recessive allele (d) at white (Dtig/dmex and Dmex/dmex genotypes
respectively). In contrast, molecular genotypes segregated as backcross type markers. As
a result, only the A. t. tigrinum marker alleles were fully informative for association

13
testing; that is, we expected that at the position of white, all individuals inheriting A. t.
tigrinum molecular marker alleles would exhibit wildtype coloration, but never white
coloration. Segregation ratios for two protein-coding markers (E16A12 and E23C5) near
the maximum LRS peak on LG1 are consistent with this expectation (Table 3). In
contrast, incomplete association was observed for makers from the region with the
suggestive LRS. These results indicate that d is most likely located within the 14.2 cM
region that includes markers E16A12 and E23C5.
Melanoid: Interval analysis revealed a single region of LG14 that was strongly associated
with segregation of the melanoid mutant phenotype (M1, LRS 17.5, 95% CI = 32 cM)
(Figure 3). As was the case with white, the founding and recurrent A. mexicanum parents
that were used to generate the AxTg family were heterozygous for the melanoid mutant
(Mmex/mmex). The expressed sequence marker E17A7 is closest to the maximum inflection
point of the LRS profile for melanoid. Genotypic ratios for this locus are consistent with
tight linkage to melanoid, given the same expectations described above for segregation of
molecular makers and the white phenotype (Table 4).
Metamorphosis vs. Paedomorphosis: Interval analysis revealed a single region of LG3
that was strongly associated with segregation of metamorphosis versus paedomorphosis
in the AxTg family (LRS 101.7, 95% CI = 9 cM) (Figure 4). The marker ctg325 lies
closest to the maximum inflection point of the LRS profile. This QTL is located near the
middle of LG3 and corresponds to the previously described met QTL (Voss and Shaffer,
1997, Voss and Smith, 2005). A region of LG4 also showed a suggestive association with

14
segregation of metamorphosis versus paedomorphosis, although it is much weaker
relative to met.
BLAST Alignments to the Human RefSeq Database: Our BLASTx analysis of 570
EST/gene based markers yielded alignments with multiple human protein-coding genes.
In total, 390 presumptive protein-coding markers had best BLASTx alignments with 350
non-redundant human RefSeq proteins. Best BLASTx matches and corresponding
bitscore and E-vales are provided in Supplementary Table 3. Analyses of conserved
synteny and segmental homology between Ambystoma and other vertebrate species will
be presented elsewhere.
DISCUSSION
We have generated the first comprehensive linkage map for Ambystoma by mapping over
1000 anonymous markers and EST loci in an interspecific mapping panel. Fourteen large
(>125 – 836 cM) and 35 small (0 – 75 cM) linkage groups were identified. Because the
number of large linkage groups equaled the haploid chromosome number in A. t. tigrinum
and A. mexicanum (Paramenter, 1919; Fankhauser and Humphrey, 1942), and because
these linkage groups yielded a map size estimate that agrees with a theoretical and
empirical (see below) estimate of total map size, we propose this set as a framework for
the 14 chromosomes in the tiger salamander genome. It is unlikely that the collection of
smaller linkage groups represent any additional chromosomes within the Ambystoma
genome because the haploid chromosome number is indisputably 14 and
microchromosomes are not known in this group.
15
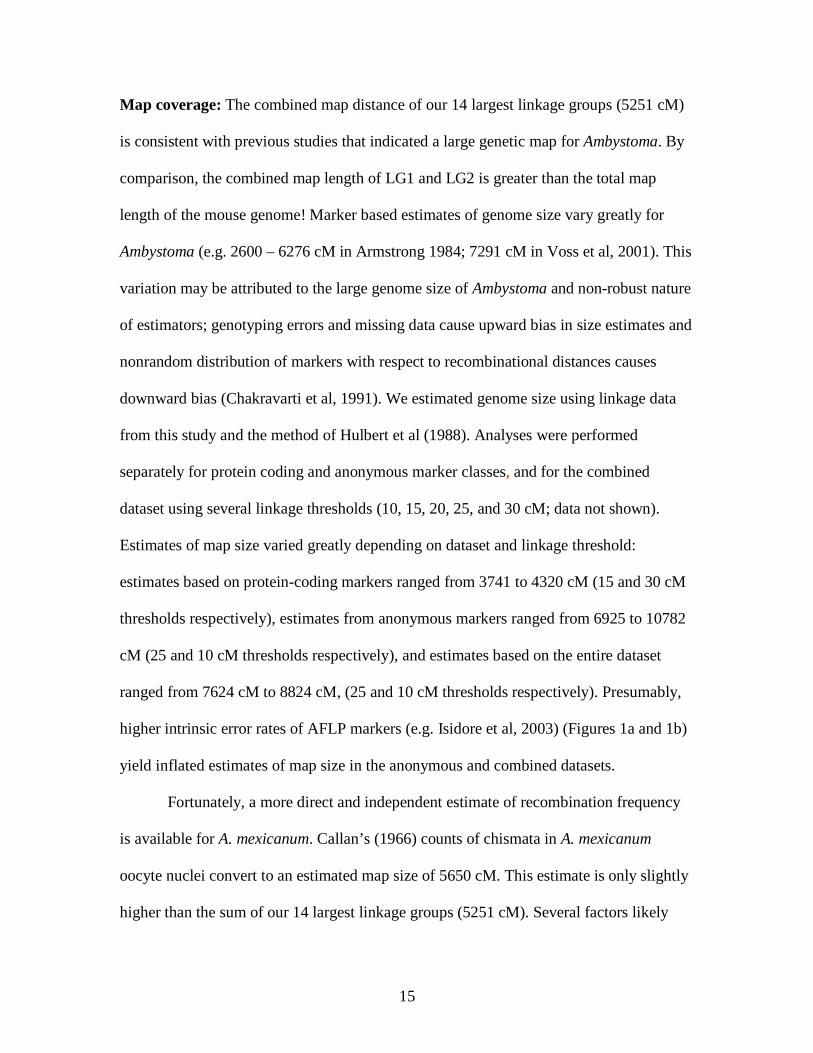
Map coverage: The combined map distance of our 14 largest linkage groups (5251 cM)
is consistent with previous studies that indicated a large genetic map for Ambystoma. By
comparison, the combined map length of LG1 and LG2 is greater than the total map
length of the mouse genome! Marker based estimates of genome size vary greatly for
Ambystoma (e.g. 2600 – 6276 cM in Armstrong 1984; 7291 cM in Voss et al, 2001). This
variation may be attributed to the large genome size of Ambystoma and non-robust nature
of estimators; genotyping errors and missing data cause upward bias in size estimates and
nonrandom distribution of markers with respect to recombinational distances causes
downward bias (Chakravarti et al, 1991). We estimated genome size using linkage data
from this study and the method of Hulbert et al (1988). Analyses were performed
separately for protein coding and anonymous marker classes, and for the combined
dataset using several linkage thresholds (10, 15, 20, 25, and 30 cM; data not shown).
Estimates of map size varied greatly depending on dataset and linkage threshold:
estimates based on protein-coding markers ranged from 3741 to 4320 cM (15 and 30 cM
thresholds respectively), estimates from anonymous markers ranged from 6925 to 10782
cM (25 and 10 cM thresholds respectively), and estimates based on the entire dataset
ranged from 7624 cM to 8824 cM, (25 and 10 cM thresholds respectively). Presumably,
higher intrinsic error rates of AFLP markers (e.g. Isidore et al, 2003) (Figures 1a and 1b)
yield inflated estimates of map size in the anonymous and combined datasets.
Fortunately, a more direct and independent estimate of recombination frequency
is available for A. mexicanum. Callan’s (1966) counts of chismata in A. mexicanum
oocyte nuclei convert to an estimated map size of 5650 cM. This estimate is only slightly
higher than the sum of our 14 largest linkage groups (5251 cM). Several factors likely

16
contribute to the relatively small difference between these two estimates including:
incomplete coverage of the linkage map (especially near the telomeres), the degree to
which the Kosambi (1944) mapping function models recombination in Ambystoma,
variation in average recombination rate between the male F1s used in this study and the
female A. mexicanum used by Callan (1966), and possibly small-scale differences in gene
order between A. t. tigrinum and A. mexicanum (Sybengia, 1992; True et al, 1996). Close
agreement between the Callan (1966) derived estimate and our recombination-based
estimates of genome size suggest that the 14 large linkage groups that we identified frame
the majority of the Ambystoma genome.
Some of the smaller linkage groups may represent distal portions of chromosomes
that are represented by larger linkage groups. Recombination rates are known to increase
toward the ends of chromosomal arms in a wide array of organisms including mammals
(e.g. Jensen-Semen et al, 2004), chicken (ICGSC, 2005), and grasses (King et al, 2002;
Anderson et al, 2004). In agreement with this pattern, Callan (1966) reported a higher
than average recombination rate between the nucleolar organizing region (NOR) and
adjacent telomere in A. mexicanum. Alternately, some of these linkage groups may
consist completely or partly of markers with genotyping error rates that prevent
assignment to larger linkage groups at the LOD 4.0 threshold. Presumably as more loci
are mapped, linkage groups that represent distal regions will be integrated into the
framework map and spurious linkage groups will be excluded from the map.
Size of the tiger salamander genetic map: The salamander genome is one of the largest
genomes and our linkage map is the largest yet reported for any vertebrate. The tiger

17
salamander genome is estimated to be 10x – 25x larger than other sequenced vertebrate
genomes, yet the genetic map is only 1.5x – 5x larger (Table 1). Thus, in terms of
genome size, the salamander linkage map appears at first glance to be approximately 5x
smaller than expected. However, because physical and linkage distances do not scale
linearly among organisms, variables in addition to physical size must be considered.
Chromosome number contributes directly to the size of the genetic map because at least
one chiasma must be formed per bivalent in order to ensure normal segregation of
chromatids during meiosis in most species (Egel, 1995; Roeder, 1997; Moore and Orr-
Weaver, 1998), although achiasmate meiosis has evolved in several plant and
invertebrate species (reviewed by John, 1990). Therefore, the minimum map size of any
eukaryotic genome is 50 cM times the haploid number of chromosomes. Furthermore,
there is a strong correlation between chromosome arm number and genetic map size
among mammals, suggesting that formation of at least one chiasma per chromosomal arm
may be necessary in mammals (Durtilleaux, 1986; Pardo-Manuel de Villena and
Sapienza, 2001). Map sizes for human, mouse, rat, chicken, and zebrafish are much
closer to their theoretical obligatory minima, based upon chromosome arm number, than
is the Ambystoma map (Table 1). Analyses that include multiple vertebrate taxa,
especially those with large and intermediate genetic map lengths, are needed to fully
elucidate the effect of chromosome arm number and other variables on genetic map size.
However, it is apparent from the comparisons made here that linkage map size in
Ambystoma is influenced by factors in addition to chromosome arm number, the most
likely actor being the large physical genome size of Ambystoma.

18
Refining the positional estimate of white and tentative assignment of LG1 to the
chromosome harboring the NOR: The white phenotype has been a subject of several
linkage analyses. Early tetrad mapping studies located d to the distal region of an
unknown chromosome (Lindsley et al, 1955; Armstrong, 1984) and several studies have
observed an association between segregation of white and segregation of NOR variants
(reviewed by Sinclair et al, 1978). The NOR is located subterminally on one of the four
largest chromosomes (Paramenter, 1919; Dearing, 1934; Haschuka and Brunst, 1965;
Callan, 1966; Cuny and Malacinski, 1985). In our study we identified a single region of
the genome that was significantly associated with white. The maximum inflection point
of the LRS profile for association with white is located 95 cM from the end of the largest
linkage group (LG1). Callan’s (1966) chiasmata counts place the NOR at ~44 cM from
the end of a chromosomal arm. Localization of white to the distal portion of a large
linkage group is consistent with previous studies that indicated linkage between white and
the NOR. We therefore conclude that LG1 likely represents the NOR containing
chromosome, with marker E20A12 located near the distal portion of the arm harboring
the NOR.
Identification of the genomic interval containing melanoid: We have identified a
single region within the smallest of our 14 linkage groups that shows strong association
with segregation of the melanoid phenotype. Armstrong’s (1983) tetrad analyses yielded
an estimated distance of 59.1 cM between melanoid and its centromere. Assuming that
LG14 corresponds to one of the smaller chromosomes, the maximum inflection point of
the LRS profile for melanoid is consistent with the earlier gene-centromere mapping

19
study. The size of LG14 relative to the rest of the genetic map appears to support the
assignment of LG14 to the smallest chromosome. Precise chromosomal measurements
have been made for A. tigrinum (Paramenter, 1919) and A. mexicanum (Callan, 1966);
the proportion of the genome occupied by the smallest chromosome was estimated to be
2.65% for A. tigrinum and 2.4% for A. mexicanum. Our LG14 represents 2.4% of the
current genetic map (LG1-14). Although we do not expect a linear relationship between
genetic and physical distance, our results are consistent with melanoid being located on
one of the smaller tiger salamander chromosomes.
The genetic basis of metamorphic failure in lab A. mexicanum: It has been known for
some time that expression of paedomorphosis in laboratory A. mexicanum is largely
determined by a single genetic factor (Tompkins, 1978; Voss, 1995). A previous QTL
analysis of the AxTg mapping panel using 234 AFLP markers identified a major effect
QTL (met) that is associated with expression of paedomorphosis versus metamorphosis
(Voss and Shaffer, 1997); met was later shown to affect metamorphic timing in crosses
using wild-caught A. mexicanum (Voss and Smith, 2005). Our QTL analysis using all of
the newly mapped markers did not identify statistically significant factors in addition to
met, however a second region of the genome yielded a statistically suggestive result. The
relatively small number of individuals in the AxTg panel does not provide sufficient
power to identify small effect QTL. This second genomic region will be tested using the
much larger WILD2 mapping panel (Voss and Smith, 2005) in future work.

20
EST markers and Ambystoma research: The collection of EST makers that comprise
our linkage map are significant new resources for Ambystoma research. Because these
markers correspond to polymorphic expressed sequences with known linkage
relationships, they are especially informative as probes for developmental, populational,
systematic, molecular, comparative, and functional studies (Putta et al, 2004). Using the
PCR primer information provided in Supplementary Table 1, it will now be possible to
develop probes for many protein coding genes for A. mexicanum and A. t. tigrinum, as
well as other ambystomatid species (Riley et al., 2003; Fitzpatrick and Shaffer, 2004;
Putta et al., 2004). Primer sequences for protein-coding markers, their corresponding
assembled and curated EST sequences, and BLAST alignments can also be obtained at
the Salamander Genome Project Website ([email protected]).
ACKNOWLEDGEMENTS
The work was supported by grants to SRV from the U.S. National Science Foundation
(IOB-0242833) and the National Center for Research Resources (5R24RR016344) at the
National Institutes of Health. This publication also utilized computing resources and
facilities provided by the University of Kentucky subcontract on National Institutes of
Health Grant 2P20RR016481-04 from the National Center for Research Resources.
21
LITERATURE CITED
Anderson, L. K., N. Salameh, H. W. Bass, L. C. Harper, W. Z. Cande, et al, 2004 Integrating
genetic linkage maps with pachytene chromosome structure in maize. Genetics 166:
1923-1933.
Armstrong, J.B., 1984 Genetic Mapping in the Mexican axolotl, Ambystoma mexicanum.
Canadian Journal of Genetics and Cytology 26: 1-6.
Bachvarova R. F., T. Masi, M. Drum, N. Parker, K. Mason, et al, 2004 Gene expression in the
Axolotl germ line: Axdazl, Axvh, Axoct-4, and Axkit. Developmental Dynamics 231: 871-
880.
Brown D. M., T. C. Matise, G. Kioke, J. S. Simon, E. S. Winer, et al, 1998 An integrated linkage
map of the laboratory rat. Mammalian Genome 9: 521-530.
Callan, H. G., 1966 Chromosomes and nucleoli of the axolotl, Ambystoma mexicanum. Journal
of Cell Science 1: 85-108.
Chakravarti, A., L. K. Lasher, and J. E. Reefer, 1991 A maximum-likelihood method for
estimating genome length using genetic-linkage data, Genetics 128: 175-182.
Chen, X., L. Levine, and P-Y. Kwok, 1999 Fluorescence polarization in homogenous nucleic
acid analysis. Genome Research 9: 492-498.
Chichilnisky, E. J., and F. Rieke, 2005 Detection sensitivity and temporal resolution of visual
signals near absolute threshold in the salamander retina. Journal of Neuroscience 25:
310-330.
Christensen, R. N., M. Weinstein, and R. A. Tassava 2002 Expression of fibroblast growth
factors 4, 8, and 10 in limbs, flanks, and blastemas of Ambystoma. Developmental
Dynamics 223: 193-203.

22
Collins, J. P., J. L. Brunner, J. K. Jancovich, and D. M. Schock, 2004 A model host-pathogen
system for studying infectious disease dynamics in amphibians: Tiger salamanders
(Ambystoma tigrinum) and Ambystoma tigrinum virus. Herpetological Journal 14 195-
200.
Cuny, R., and G. M. Malacinski, 1985 Banding differences between tiger salamander and axolotl
chromosomes. Canadian Journal of Genetics and Cytology 27: 510-514.
Dearing, W. H., 1934 The maternal continuity and individuality of the somatic chromosomes of
Ambystoma tigrinum, with special reference to the nucleolus as a chromosomal
component. Journal of Morphology 56: 157-179.
Denz, C. R., A. Narshi, R. W. Zajdel, D. K. Dube, 2004 Expression of a novel cardiac-specific
tropomyosin isoform in humans. Biochemical and Biophysical Research
Communications 320: 1291-1297.
Dumeril, A. H. A., 1870 Quatrième notice sur la menagerie des reptiles du Muséum d’Historie
Naturelle. Noveau Archives du Muséum d’Historie Naturelle, Paris: 5: 47-60.
Durtilleaux, B.,1986 Le role des chromosomes dans l’evoluiton: une nouvelle interpretation.
Annals of Genetics 29: 69-75.
Egel, E. R., 1995 The synaptonemal complex and the distribution of meiotic recombination
events. Trends in Genetics 11: 206-208
Ericsson, R., R. Cerny, P. Falck, and L. Olsson, 2004 Role of cranial neural crest cells in visceral
arch muscle positioning and morphogenesis in the Mexican axolotl, Ambystoma
mexicanum. Developmental Dynamics 231: 237-247.
Fankhauser, G., and R. R. Humphrey, 1942 Induction of triploidy and haploidy in axolotl eggs
by cold treatment. Biological Bulletin 83: 367-374.

23
Fitzpatrick, B. M., and H. B. Shaffer, 2004 Environment-dependent admixture dynamics in a
tiger salamander hybrid zone. Evolution 58: 1282-1293.
Gardiner, A. F. and W. E. Jack, 2002 Acyclic and dideoxy terminator preferences denote
divergent sugar by archaeon detection. BioTechniques 31: 560-570.
Gornung, E., I. Gabrielli, S. Cataudella, L. Sola, 1997 CMA(3)-banding pattern and fluorescence
in situ hybridization with 18s rRNA genes in zebrafish chromosomes. Chromosome
Research 5: 40-46.
Gould, S. J., 1977 Ontogeny and Phylogeny. Belkap Press, Cambridge.
Groenen, M. A. M., H. H. Cheng, N. Bumstead, B. F. Benkel, W. E. Briles, et al 2000, A
consensus linkage map of the chicken genome. Genome Research 10: 137-147.
Haberman, E. T., A-G. Bebin, S. Herklotz, M. Volkmer, K. Eckelt, et al, 2004 An Ambystoma
mexicanum EST sequencing project: Analysis of 17,352 expressed sequence tags from
embryonic and regenerating blastema cDNA libraries. Genome Biology 5: R67.
Häcker, V.,1907 Uber mendelschen vererbung bei axolotln. Zoologischer Anzeiger 31: 99-102.
Haley, C. S. and S. A. Knott, 1992 A simple regression method for mapping quantitative trait
loci in line crosses using flanking markers. Heredity 69: 315-324
Haschuka, T. S. and V. V. Brunst, 1965 Sexual dimorphism in the nuclear autosome of the
axolotl (Sirenodon mexicanum). Hereditas 52: 345-356.
Hinegardner, R., 1968 Evolution of cellular DNA content in teleost fishes. American Naturalist
102: 517-520.
Hoffman, E. A., and D. W. Phennig, 1999 Proximate causes of cannibalistic polyphenism in
larval tiger salamanders. Ecology 80: 1076-1080.
Hsu, T. M., X. Chen, S. Duan, R. D. Miller, and P-Y. Kwok, 2001 Universal SNP genotyping
24
assay with fluorescence polarization detection. Nucleic Acids Research 30: 605-613.
Hulbert, S., T. W. Ilott, E. J. Legg, S. E. Linclon, E. S. Lander, et al, 1988 Genetic analysis f the
fungus, Bremia lactucae, using restriction fragment length polymorphisms. Genetics 120:
947-958.
Humphrey, R. R., and J. T. Bagnara,1967 A color variant in the Mexican axolotl. Journal of
Heredity 58: 251-256.
International Chicken Genome Sequencing Consortium (ICGSC), 2005 Sequence and
comparative analysis of the chicken genome provide unique perspectives on vertebrate
evolution. Nature 432: 695-716.
International Human Genome Sequencing Consortium (IHGSC), 2001 initial sequencing and
analysis of the human genome. Nature 409: 860-921.
Irschick, D. J., and H. B. Shaffer, 1997. The polytypic species revisited: morphological
differentiation among tiger salamanders (Ambystoma tigrinum) (Amphibia: Caudata).
Herpetologica 53:30-49.
Isidore, E., H. van Os, S. Andrzejewski, J. Bakker, I. Barrena, et al. 2003 Toward a marker dense
linkage map of the potato genome: lesions from linkage group I. Genetics 165: 2107-
2116.
Jensen-Semen, M. I., T. S. Furley, B. A. Payseur, Y. Lu, K. M. Roskin, et al, 2004 Comparative
recombination rates in the rat, mouse, and human genomes. Genome Research 14: 528-
538.
John, B., 1990 Meiosis. Cambridge University Pres, Cambridge.
Kelly, P. D., F. Chu, I. G. Woods, P. Ngo-hazelett, T. Cardozo, et al, 2000 Genetic linkage
mapping of zebrafish genes and ESTs. Genome Research 10: 558-567.

25
King, J., L. A. Roberts, M. J. Kearsey, H. M. Thomas, R. N. Jones, et al, 2002 A demonstration
of a 1:1 correspondence between chiasmata frequency and recombination using a Lolium
perenne/Festuca pratensis substitution. Genetics 161: 307-314.
Kong, A., D. F. Gubdjartsson, J. Sainz, G. M. Jonsdottir, S. A. Gudjonsson, et al, 2002 A high
resolution recombination map of the human genome. Nature Genetics. 31: 241-247.
Kosambi, D.D., 1944. The estimation of map distances from recombination values. Annals of
Eugenics 12:172-75.
Lander, E. and L. Kruglyak, 1995 Genetic dissection of complex traits: guidelines for
interpreting and reporting linkage results. Nature Genetics 11: 241-247.
Licht, L. E., L. A. Lowcock, 1991 Genome size and metabolic-rate in salamanders. Comparative
Biochemistry and Physiology B-Biochemistry & Molecular Biology 100: 83-92
Lindsley, D. L., G. Fankhauser, and R. R. Humphrey, 1955 Mapping centromeres in the axolotl.
Genetics 41: 58-64.
Malacinski, G. M., 1989 Developmental genetics pp. 102-109 in Developmental Biology of the
Axolotl, edited by J.B. Armstrong and G.M. Malacinski. Oxford University Press, New
York.
Marchand, J. E., X. H. Yang, D. Chikaraishi, J. Krieger, H. Breer, et al, 2004 Olfactory receptor
gene expression in tiger salamander olfactory epithelium. Journal of Comparative
Neurology 747: 453-467.
Martinez, O. and R. N. Curnow, 1992.Estimating the locations and the sizes of the effects of
quantitative trait loci using flanking markers. Theoretical and Applied Genetics 85: 480-
488.
Matsabana, J. S., D. W. Burt, C. M. O’Brien, A. Vignal, V. Fillon, et al, 2004 Molecular

26
cytogenetic definition of the chicken genome: the first complete avian karyotype.
Genetics 166: 1367-1373.
Meer, J. M., R. H. Cudmore Jr., and K. F. Manly, 2004 MapManager QTX,
http://ww.mapmanager.org/mmQTX.html.
Mouse Genome Sequencing Consortium (MGSC), 2002 Initial sequencing and comparative
analysis of the mouse genome. Nature, 420: 520-562.
Moore, D. P., and T. L. Orr-Weaver, 1998 Chromosome segregation during meiosis: building an
unambivalent bivalent. Topics in Developmental Biology 37: 263-299.
Paramenter, C. L., 1919 Chromosome number and pairs in somatic mitoses of Ambystoma
tigrinum. Journal of Morphology 33: 169-249.
Pardo-Manuel De Villena, F., and C. Sapienza, 2001 Recombination is proportional to the
number of chromosome arms in mammals. Mammalian Genome, 12: 318-322.
Parichy, D. M., 1996 Pigment patterns of larval salamanders (Ambystomatidae, Salamandridae):
The role of the lateral line sensory system and the evolution of pattern-forming
mechanisms. Developmental Biology 175: 265-282.
Parichy, D. M., 1998 Experimental analysis of character coupling across a complex life cycle:
Pigment pattern metamorphosis in the tiger salamander, Ambystoma tigrinum tigrinum.
Journal of Morphology 237: 53-67.
Parichy, D. M., M. Stigson, and S. R. Voss 1999 Genetic analysis of steel and the PG-
M/versican-encoding gene AxPG as candidates for the white (d) pigment mutant in the
salamander Ambystoma mexicanum. Development Genes and Evolution 209: 349-356.

27
Park, D., J. M. McGuire, A. L. Majchrzak, J. M. Ziobro, and H. L. Eisthen, 2004 Discrimination
of conspecific sex and reproductive condition using chemical cues in axolotls
(Ambystoma mexicanum) Journal of Comparative Physiology A 190: 145-427.
Powers, J. H., 1907 Morphological variation and its causes in Ambystoma tigrinum. Student
University of Nebraska 7: 197-274.
Putta, S., J. J. Smith, J. Walker, M. Rondet, D. W. Weisrock, et al., 2004 From biomedicine to
natural history research: EST resources for ambystomatid salamanders. BMC Genomics
5: 54.
Rat Genome Secuencing Project Consortium (RGSPC) 2004 Genome sequence of the Brown
Norway Rat yields insights into mammalian evolution. Nature 428: 493-521.
Reese, R. W., 1969 The taxonomy and ecology of the tiger salamander Ambystoma tigrinum of
Colorado. Unpublished Ph.D. Dissertation, 121pp.
Reese, R. W., 1972 Taxonomy and Distribution of the tiger salamanders in Colorado.
Transactions of the Kansas Academy of Sciences 75: 128-140.
Riley, S. P. D., H. B. Shaffer, S. R. Voss, and B. M. Fitzpatrick, 2003 Hybridization between a
rare, native tiger salamander (Ambystoma californiense) and its introduced congener.
Ecological Applications 13: 1263-1275.
Roeder, G. S., 1997 Meiotic chromosomes: it takes two to tango. Genes and Development 11:
2600-2621.
Rose, F. L., and D. Armentrout, 1975 Adaptive strategies of Ambystoma tigrinum Green
inhabiting the Llano Estacado of West Texas. Journal of Animal Ecology, 45: 713-739.

28
Schnapp, E., and E. M. Tanaka, 2005 Quantitative evaluation of morpholino-mediated protein
knockdown of GFP, MSX1, and PAX7 during tail regeneration in Ambystoma
mexicanum. Developmental Dynamics 232: 162-170.
Shaffer, H. B., And M. L. Mcknight, 1996 The polytypic species revisited: genetic differentiation
and molecular phylogenetics of the tiger salamander species Ambystoma tigrinum
(Amphibia: Caudata) species complex. Evolution 50: 417-433.
Shaffer, H. B., and S. R. Voss, 1996 What insights into the developmental traits of urodeles does
the study of interspecific hybrids provide? International Journal of Developmental
Biology 40: 885-893.
Shaffer, H. B., 1984 Evolution in a paedomorphic lineage. II. allometry and form in the Mexican
ambystomatid salamanders. Evolution 38: 1207-1218.
Sinclair, J. H., C. R. Carrol, and G. M. Malacinski, 1978 Composition and behavior of the
nucleolar organizer of the nucleolar variant of axolotls; review and comparison to other
systems. American Zoologist 18: 225-236.
Smith, H. M., 1989 Discovery of the axolotl and its early history in biological research, pp. 1-12
in Developmental Biology of the Axolotl, edited by J.B. Armstrong and G.M. Malacinski.
Oxford University Press, New York.
Steen, R. G., A. E. Kitweck-Black, C. Glenn, J. Gullings-Handley, W. Van Etten, et al, 1999 A
high density integrated genetic linkage and radiation hybrid map of the laboratory rat.
Genome Research 9: AP1-8.
Sturtevant, A. H., 1913 The linear arrangement of six sex-linked factors in Drosophila, as shown
by their mode of association. Journal of Experimental Zoology 14: 43-59.
Sybengia, J., 1992 Cytogenetics in plant breeding. Monographs on theporetical and Applied

29
Genetics 17. Springer-Verlag, Berlin.
Thoreson, W. B., K. Rabl, E. Townes-Anderson, R. Heilelberger, 2004 A highly Ca2+-sensitive
pool of vesicles contributes to linearity at the rod photoreceptor ribbon synapse. Neuron
42: 595-605.
Tompkins, R., 1978 Genetic control of axolotl metamorphosis. American Zoologist 18: 313-319.
True, J. R., B. S. Weir and C. C. Laurie, 1996 A genome-wide survey of hybrid incompatibility
factors by the introgression of marked segments of Drosophila mauritiana chromosomes
into Drosophila simulans. Genetics 142: 819-837.
Voorips, R. E., 2002 MapChart. http://www.plant.wageningenur.nl/products/mapping/MapChart
Voss, S. R., 1995 Genetic basis of paedomorphosis in the axolotl Ambystoma mexicanum: a test
of the single gene hypothesis. Journal of Heredity 86: 441-447.
Voss, S. R., and H. B. Shaffer, 1997 Adaptive evolution via a major gene effect: Paedomorphosis
in the Mexican axolotl. Proceedings of the National Academy of Sciences USA 94:
14185-14189.
Voss, S. R., and J. J. Smith, 2005 Evolution of salamander life cycles: A major effect QTL
contributes to discreet and continuous variation for metamorphic timing. Genetics 170:
275-281.
Voss, S. R., J. J. Smith, D. M. Gardiner, and D. M. Parichy, 2001 Conserved vertebrate
chromosomal segments in the large salamander genome. Genetics 158: 735-746.
Zeng, Z.-B., 1993 Theoretical basis for separation of multiple linked gene effects in mapping
quantitative trait loci. Proceedings of the National Academy of Sciences USA 90: 10972-
10976.
Zeng, Z.-B., 1994 Precision mapping of quantitative trait loci. Genetics 136: 1457-1468.

30
Zhang, C., F. Meng, X. P. Huang, R. Zajdel, and S. L. Lemanski, et al, 2004 Down regulation of
N1 gene expression inhibits the initial heart beating and heart development in
axolotls. Tissue and Cell 36: 71-81.

31
TABLE 1
organism genome Nb chromosomal map size obligatory map proportion cM/arm
size (Gbp)a armsb (cM)c (N * 50cM) obligatoryd
Mouse 2.7 20 20 1361 1000 0.73 (0.73) 68.1
Rat 2.6 21 33 1749 1050 0.60 (0.94) 53.0
Human 3.0 23 46 3615 1150 0.32 (0.64) 78.6
Chicken 1.2 38 44 3800 1900 0.50 (0.58) 86.4
Zebrafish 1.8 25 50 3011 1250 0.42 (0.83) 60.2
Ambystoma(map)e 30.0 14 28 5152 700 0.14 (0.27) 184.0
Ambystoma(χ)f 30.0 14 28 5650 700 0.12 (0.25) 201.8
a – References: (mouse - MGSC, 2002; rat - RGSPC, 2004; human - IHGSC, 2000; chicken - ICGSC, 2005; zebrafish – Kelly et al,
2000; Ambystoma - Licht and Lowcock, 1991).
b – N = The haploid number of chromosomes. Smaller chicken microchromosomes (10-38 – Masabana et al, 2004) are tabulated as
one-armed chromosomes. References: (mouse - MGSC, 2002; rat - RGSPC, 2004; human - IHGSC, 2000; chicken - ICGSC, 2005;
zebrafish – Gornung et al, 2000; Ambystoma – Callan, 1966).
32
c – References: (mouse – Steen et al, 1999; rat – Brown et al, 1998; human – Kong et al, 2002; chicken – Groenen et al, 2000;
zebrafish – Kelly et al, 2000).
d – Numbers in parentheses represent the obligatory proportion of the map assuming one obligate chiasma per arm.
e – Map size estimated as the sum of LG1 – 14.
f – Map size estimated as 50 cM times the average number of chiasmata (Callan, 1966).

33
TABLE 2
LG EST Anonymous All cM % Map Intermarker
Baseda Markersa Markers Distanceb
1 73 (70) 50 (37) 123 (107) 836.7 15.9 7.8
2 56 (51) 47 (24) 130 (75) 767.6 14.6 10.2
3 80 (78) 34 (21) 114 (99) 671.3 12.8 6.8
4 55 (54) 21 (14) 76 (68) 538.9 10.3 7.9
5 32 (30) 18 (9) 50 (39) 323.1 6.2 8.3
6 34 (34) 15 (5) 49 (39) 308.6 5.9 7.9
7 27 (25) 24 (17) 51 (42) 294.9 5.6 7.0
8 34 (34) 17 (8) 51 (42) 290.1 5.5 6.9
9 32 (31) 9 (5) 41 (36) 244.4 4.7 6.8
10 21 (21) 13 (3) 34 (24) 241.0 4.6 10.0
11 39 (38) 10 (6) 49 (44) 234.4 4.5 5.3
12 9 (9) 12 (7) 21 (16) 211.4 4.0 13.2
13 7 (7) 12 (8) 19 (15) 163.3 3.1 10.9
14 9 (9) 5 (5) 14 (14) 125.5 2.4 9.0
TOTAL 508 (491) 287 (169) 795 (660) 5251.3 100.0 8.0
% mapped 87.4 54.7 71.9
a – The number of markers that were placed at precise positions within the map are
provided in parentheses.
b – numbers provided are the average intermarker distance.

34
TABLE 3
Phenotype
QTL Genotype White +
W1 E16A12Am/ E16A12Am 18 20
W1 E16A12Am/ E16A12Att 0 46
W1 E23C5Am/ E23C5Am 18 18
W1 E23C5Am/ E23C5Att 0 43
W2 A32.20Am/ A32.20Am 16 31
W2 A32.20Am/ A32.20Att 2 38

35
TABLE 4
Phenotype
QTL Genotype Melanoid +
M1 E24E9Am/ E24E9Am 10 30
M1 E24E9Am/ E24E9Att 6 41
M1 E17A7Am/ E17A7Am 14 23
M1 E17A7Am/ E17A7Att 2 44

36
FIGURE LEGENDS
FIGURE 1 – Panel A: Plot of the distribution of χ2 statistic for 1:1 segregation of marker
genotypes versus standard χ2 distributions for gene and EST based markers. Panel B: Plot
of the distribution of χ2 statistic for 1:1 segregation of marker genotypes versus standard
χ2 distributions for anonymous markers (AFLPs and RAPDs). Panel C: Plot of χ2
statistics for 1:1 segregation of marker genotypes versus map position.
FIGURE 2 – The tiger salamander linkage map (LG1-14).
FIGURE 3 – Likelihood ratio statistic (LRS) plot for association between segregation of
pigment phenotypes and marker genotypes in LG1 and LG14. Horizontal lines represent
LRS thresholds for suggestive (37th percentile), significant (95th percentile), and highly
significant (99.9th percentile) associations (Lander and Krugiak, 1995) estimated using
MapMaker QTXb19.
FIGURE 4 – Likelihood ratio statistic (LRS) plot for association between segregation of
metamorphosis versus paedomorphosis and marker genotypes in LG3 and LG4.
Horizontal lines represent LRS thresholds for suggestive (37th percentile), significant
(95th percentile), and highly significant (99.9th percentile) associations (Lander and
Krugiak, 1995) estimated using MapMaker QTXb19.