A Comprehensive Assessment of the Agricultural Extension ... · PDF fileComparison of Tenure...
139
For comments, suggestions or further inquiries please contact: Philippine Institute for Development Studies Surian sa mga Pag-aaral Pangkaunlaran ng Pilipinas The PIDS Discussion Paper Series constitutes studies that are preliminary and subject to further revisions. They are be- ing circulated in a limited number of cop- ies only for purposes of soliciting com- ments and suggestions for further refine- ments. The studies under the Series are unedited and unreviewed. The views and opinions expressed are those of the author(s) and do not neces- sarily reflect those of the Institute. Not for quotation without permission from the author(s) and the Institute. The Research Information Staff, Philippine Institute for Development Studies 5th Floor, NEDA sa Makati Building, 106 Amorsolo Street, Legaspi Village, Makati City, Philippines Tel Nos: (63-2) 8942584 and 8935705; Fax No: (63-2) 8939589; E-mail: [email protected] Or visit our website at http://www.pids.gov.ph April 2007 Efren B. Saz DISCUSSION PAPER SERIES NO. 2007-02 A Comprehensive Assessment of the Agricultural Extension System in the Philippines: Case Study of LGU Extension in Ubay, Bohol
Transcript of A Comprehensive Assessment of the Agricultural Extension ... · PDF fileComparison of Tenure...

For comments, suggestions or further inquiries please contact:
Philippine Institute for Development StudiesSurian sa mga Pag-aaral Pangkaunlaran ng Pilipinas
The PIDS Discussion Paper Seriesconstitutes studies that are preliminary andsubject to further revisions. They are be-ing circulated in a limited number of cop-ies only for purposes of soliciting com-ments and suggestions for further refine-ments. The studies under the Series areunedited and unreviewed.
The views and opinions expressedare those of the author(s) and do not neces-sarily reflect those of the Institute.
Not for quotation without permissionfrom the author(s) and the Institute.
The Research Information Staff, Philippine Institute for Development Studies5th Floor, NEDA sa Makati Building, 106 Amorsolo Street, Legaspi Village, Makati City, PhilippinesTel Nos: (63-2) 8942584 and 8935705; Fax No: (63-2) 8939589; E-mail: [email protected]
Or visit our website at http://www.pids.gov.ph
April 2007
Efren B. Saz
DISCUSSION PAPER SERIES NO. 2007-02
A Comprehensive Assessmentof the Agricultural Extension System
in the Philippines:Case Study of LGU Extension in Ubay, Bohol

A COMPREHENSIVE ASSESSMENT OF THE AGRICULTURAL EXTENSION SYSTEM IN THE PHILIPPINES:
CASE STUDY OF LGU EXTENSION IN UBAY, BOHOL
EFREN B. SAZ
Institute Of Strategic Research And Development Studies Leyte State University
2005
TABLE OF CONTENTS
CONTENTS PAGE
CHAPTER 1 INTRODUCTION
Rationale 1 Objectives 1 Methodology 2
CHAPTER 2 THE SETTING: UBAY, BOHOL
Brief History and Location of the Municipality 4 Demographics: Population Size and Growth 6 Population History 6 Household Size 7 Urban and Rual Household population 7 Age and Sex Structure 7 Literacy Rate 8 Labor Force 8 Migration 9 Social and Economic Indicators 9 Family Income and Expenditures 9 Sources of Income 11 Household Income and Expenditure in Irrigated Areas of Ubay 11
Housing and Amenities 12
Other Socioeconomic Indicators 12 Commerce and Trade 12 Transportation and Communication 14
Energy and Water 15 Education, Mass Media, Health and Recreation 16 Public Order and Safety 16 Physical and Agronomic Conditions 16 Land Area 17 Topography and Slope 17 Soil Classification 17 Land Capability Classification 19 Weather and Climatic Conditions 20 Rainfall and Typhoons 20
2

CHAPTER 3 THE STRUCTURE OF AGRICULTURE
The Agricultural Population 21 Rural and Farm Population of Bohol 21 Characteristics of Rice Farming Households in Four Irrigated Barangays 22 Number of Agricultural Workers 22 Farmers/ and Fisherfolk Organizations 23 The Farms 24 Total Farm Area, Average Farm Area and Number of Farms 24 Farm Size and Tenure in Ubay 25 Number of Farms by Tenure 25 Comparison of Tenure among Philippines Bohol and Ubay 25 Production and Productivity 27 The Rice Subsector 28
Production and Productivity 28 Technology Adoption and Flow 28 Marketing 31 Productivity and Profitability Impacts 32 Factors Perceived to Affect Yields and Profits 33
The Mango Subsector 34 Scope of the Mango Industry in Ubay 34 Production System 35 The Division of Labor in the Mango Industry 37 Technology Flow 38 Production Costs 39 Marketing 40 Production Constraints 41 Other Subsectors 43 Coconut 43 Rootcrops 44 Corn 44 Legumes 45 Vegetables 45 Poultry and Livestock Subsector 45 Livestock and Poultry Farms and Inventory of Livestock and Poultry 45 Fishery Subsector 47 Marine and Aquaculture Fisheries 47 Fishermen’s Organizations 48 Factors Affecting Sectoral Performance 49 Irrigation 49
3

Prices of Inputs and Access to Capital 50 Technology 50 Land Tenure 51 Markets and Prices 52 Government Support 53 Prospects for the Agriculture Sector 54 Present and Projected Agriculture Production 54 Demand-Supply Balance 55 Projected Demand-Supply Balance 55 Prospects for Rice 56 Prospects for Mango 57 Prospects for Fisheries 57
CHAPTER 4 SUPPORT SERVICES
Government Agencies Providing Support Services to Ubay Farmers 59 Central Visayas Integrated Agricultural Research Center 59 Bohol Experiment Station 59 Soil and Water Research and Demonstration Station 60 Ubay Brackish Water Fish Farm 60 Ubay Stock Farm 60 National Irrigation Administration 60 Philippine Carabao Center 61 Philippine Coconut Authority 61 Services Provided by Support Agencies and Organizations 61 Research Services 61
Seed Production 61 Technical Support Services 62 Animal Dispersal 62 Post Harvest Services 63 Credit Services 63 Irrigation 64
4

CHAPTER 5 THE MUNICIPAL EXTENSION SERVICES AND
KNOWLEDGE MANAGEMENT
The Role of LGUs under the Local Government Code 66 The Role of LGU’s Under the Agriculture and Fisheries Modernization Act 68 The Municipal Agriculture Office Personnel 68 The Municipal Agriculture Office Organization Structure 70 Staff Morale 72 Program Planning 72 Program and Personnel Monitoring and Evaluation 73 Programs and Projects 73 Services Provided by the Municipal Agriculture Office 74 Farm Advisory Services 74 Material Input Assistance 74 Institutional Development 74 Facilitative Services 75 Pest, Disease and Force Majeure Surveillance 75 Conflict Resolution 76 Dynamics in the Provision of Agricultural Extension Services 76 Coordination and Complementation among Related Agencies 77 Office Calls 77 Farm Visits 78 Community Organizing 78 Trainings 80 Field Days and Agricultural Fairs 82 Logistics and other operational Supports 82 Facilities and Equipment 82 Transportation and Staff Mobility 82 Linkages 83 Financing 83 Budget of Agriculture 83 Allocation by Item of Expenditure 86 Assessment of Agricultural Services 87 Accuracy 87 Adequacy 87 Timeliness 88 Relevance 88 Equity 89 Knowledge Management in the Local Extension Service 89 What is Knowledge Management 90
5

The Knowledge Management Cycle 91 Knowledge Capture/Creation 91 Best Practice 94 Knowledge Assets 96 Knowledge Sharing and Dissemination 96 Knowledge Sharing the Traditional Way 96 Communities of Practice 98 Communities of Practice in Mango 100 Knowledge Application 102 Organizational Culture 103
CHAPTER 6
CONCLUSIONS AND RECOMMENDATIONS Implications for Knowledge Management in a Localized, Low- resource
Extension Delivery System Conclusions 105 Recommendations: Shifting to a Knowledge Management
Paradigm in Extension 106 References 110 Appendices 113
6

List of Tables
Table No. Page 1 Population growth in Ubay, 1903-2000 6 2 No. of households by age group of HH head and household size, 2000 7 3 Population by sex and age group, 2000 8 4 Population 5 yrs. old and over by sex, residence at present and 5 years ago, 2000 9 5 Poverty Incidence, Philippines, Region 7 and Bohol, 1997 & 2000 10 6 Food thresholds for Philippines, Region 7 and Bohol, 1997& 2000 10 7 Selected housing characteristics, Ubay and Bohol province, 2000 13 8 Selected houshold amenities, Ubay and Bohol province, 2000 13 9 Soil Classification, 2002 19 10 Annual average rainfall, 1997-2001 20 11 Total, rural and farm populations of Bohol, 1971-2000 22 12 Number of agricultural workers, 2000 23 13 An indicative number of associations and members, 2002 23 14 Total farm area and no of farms, Bohol and Ubay, 1903-1991 24 15 Number of farms by tenure, Bohol 1948-1991 25 16 Percent of farms under full ownership and full tenancy, Phil. and Bohol, 1960-1991 25 17 Farm area by tenure, Bohol, 1971-1980 26 18 Number of farms by size, Ubay, 1980-1991 26 19 Number and area of farms by tenure, Ubay, 1980-1991 26 20 Area devoted to crop production, 2000 27 21 Production costs as reported by some Ubay mango planters, 2003 40 22 Major constraints to production ranked by selected planters, 2003 42 23 Area, production and value of production of various crops, Ubay, 2000 45 24 Livestock and poultry farms in Ubay, 2000 46 25 Inventory of livestock and poultry, Ubay, 1998-2000 46 26 Type, area, location, production and value of fishery products, 2000 47 27 Fishermen’s Associations in Ubay, 2000 49 28 Barangays in Ubay covered by the Bayongan Dam Project 50 29 Land acquisition and distribution as of April 2002 51 30 Present and projected agricultural production, 2000-2012 54 31 Existing resource supply and demand in the municipality, 2000 55 32 Projected resource supply and demand in the municipality, 2007-12 56 33 Demonstration projects at Ubay Agripark 63 34 Agricultural facilities and other related services in Ubay, 2000 65 35 Extension and support services through the Value Chain in rice 79
7

36 Extension and support services through the Value Chain in mango 81 37 Agencies and organizations linked with the OMA. 85 38 Municipal budget and budget and AIP for Agriculture, 1993 – 2004 86 39 Additional municipal appropriations for agriculture, 1993-2004 86 40 Municipal appropriation for agriculture for 2004 87
8

List of Appendix Tables App. Table 1. Current and Projected Population, 2000-2012. App. Table 2. Urban and rural population by barangay, 2000. App. Table 3. Literacy of the household population 10 Years old and over by age group and sex, 1990 App. Table 4. Population 7 years old and over by highest educational attainment, age group and sex, 1990. Appendix Table 4. Population 15 years old and over by sex and employment status, 1990. App. Table 5. Average family income and expenditures for Bohol Families, 1985-1997. App. Table 6. Sources of income for Bohol families, 1985-1997. App. Table 7. Land area by barangay, 2002. App. Table 8. Land Capability Classification, 2002. App. Table 9. Area, number and location of CARPable areas, 2000. App. Table 10. Status of agrarian reform program implementation.
App. Table 11. Programs and projects.
9

List of Figures
Fig. 1. Map of Region 7 and Bohol showing the location of Ubay 5
Fig. 2. Average family Income and expenditure of Bohol families, 1985-97. 10 Fig. 3. Sources of Income of Bohol families from 1985-97. 11
Fig. 4. Road network, Ubay 15
Fig. 5. Topographic map of Ubay 18
Fig. 6. Slope distribution of Ubay. 18
Fig. 7. Soil map of Ubay 19
Fig. 8. Technology flow for rice. 31
Fig. 9. Marketing flow for rice in Ubay 33
Fig. 10. Mango production areas in Bohol. 37
Fig. 11. Mango Production areas in Ubay. 37
Fig. 12. Technology flow for mango 40
Fig. 13. Marketing flow for mango. 42
Fig. 14. Structure of the Municipal Agriculture Service. 71
Fig. 15. The Knowledge Management Cycle 92
Fig. 16. Sources of knowledge (rice) of the local extension service staff 93
Fig. 17. The evolution of best practice. 94
Fig. 18. The existing knowledge sharing process. 97
Fig. 19. A knowledge sharing scheme using local knowledge assets (Best practice farmers) through CoPs facilitated by the OMA. 100 Fig. 20. An idealized role of the OMA in a CoP for mango. 101
10

Abstract
Using intensive interviews and observations and secondary data the study looked at a local government agricultural extension service. It situated the context by describing the agroclimatic, social and economic conditions of the area including its problems, potentials and prospects. It also took a closer look at two promising industries in the locality—rice and mango production. The study further took a closer look at the local government agriculture extension service in terms of the nature of services offered viz a vis the needs of the clientele specially of the two industries in focus. An assessment of the service’s resources, competencies, adequacy, timeliness and quality was also done. Lastly, the study looked at knowledge management using a framework suggested by Dalkir and provided suggestions as to how a poorly equipped agriculture extension service provider such as the Ubay LGU may introduce the concept of knowledge management to make the service more effective and responsive to the peculiarities of the area and people.
Ubay is a growing agricultural and commercial area in the northeastern side of Bohol province. It had the largest area devoted to rice and mango production in the entire province. Various programs in agriculture had been implemented in the area and various agencies of government were located in the municipality. Land holding was generally small with a few exceptionally large farms. A greater part of the rice production areas was rainfed although a current irrigation expansion project would quadruple the present coverage thus promising a substantial increase in rice production all other factors being present. Mango also provided a substantial source of income for many but the industry’s prospects seemed mixed due to the vulnerability of the industry to various threats such as pests and diseases including the vagaries of the market and the very high demand for production inputs.
The local extension service was inadequate to provide the multifarious demands of its clients. The number of regular staff had declined although replacements had been recruited. The usefulness of the replacement staff, however had been restricted in the sense that they were not fully given field tasks as a result of their employment status. Extension activities consisted of farm advisory services, farmers’ classes and training, farm organizing, farm demonstrations, pest and disease monitoring and facilitating services. Activities generally dominated programs and a long list of activities for the year indicated a holistic approach with almost unclear priorities. Staff tasking and the organizational structure was patterned after the national program priorities in cereals, livestock, fisheries and high value crops. Staff compensation and incentives were relatively better than other LGUs although opportunities for promotion and career advancement were nil. Staff morale and group cohesion was generally high despite the heavy work load but they felt they needed more support in terms of mobility and competency enhancement such as technical training and information materials.
Knowledge management was unsystematic. Knowledge creation was hardly done since the service was not designed for this activity. Occasionally, however, staff were involved in research type activities such as varietal testing and technology demonstration (technodemo). Knowledge capture relied mostly on opportunistic activities such as presented by attendance to occasional training or conference or availability of reading material or personal encounter with experts/researchers. These knowledge, however,

were not stored in a systematic manner where retrieval would be easy. Electronic means of storage was not resorted to even with the presence of a computer. It was observed that the level of knowledge of the staff on specific subjects were not similar indicating that some were more knowledgeable than others. This was due to the specialization of tasks and particular staff had to concentrate on certain specialized knowledge. Varying ages, education and training and extension experience generally accounted for the differences in knowledge level.
Knowledge sharing was often done among staff but most of this was done informally. The recommended sharing mechanism such as echo seminars were not resorted to as a matter of procedure. Knowledge application was done both in the staff’s own farms and among farmer clients. Owing to the many inadequacies of the service, differences in production environments and farmers’ resource capacities farm practices varied considerably resulting to wide variations in yields.
It was recommended that the local extension service adopt a knowledge management approach. Knowledge capture must be made systematic and an organizational repository that is accessible to all staff must be put up manually and electronically where applicable. Staff should be allowed time and resources to tap the internet for new knowledge. These, in turn, must be complemented by a systematic search for local best practice for applicability and appropriateness. The staff should also establish and mediate communities of practice using the various communication gadgets and strategies available in the area. Key words: Ubay, Rice Industry, Mango Industry, Municipal Agriculture Office, Knowledge Management, Local Agriculture Extension Service

CHAPTER 1 INTRODUCTION
Rationale
Agricultural Extension was one of the services devolved by the national
government to the local government units (LGUs) more than ten years ago. One
of the main rationales for the devolution was that LGUs were supposed to be
better managers of extension services due to their familiarity with the local
conditions of agriculture; hence, they could tailor their services well to their local
needs. Periodic assessments of the devolution process pointed to recurrent
problems such as the mixed attitude of LGUs towards devolution, the inability of
the local governments to manage extension services, as they ought to and the
disproportionately low budgetary allocations devoted to agriculture services.1
These problems notwithstanding do not necessarily indicate that extension is less
effective after devolution than before.
The effectiveness of extension services be it devolved or centralized
greatly depends on its management. In addition, the staff who are supposed to
carry out this important function must be competent in both content and
methodology of communicating to and teaching adults: farmers, fisherfolk,
processors, etc. Furthermore, extension staff, to be effective must have the
necessary facilities and equipment in order that the teaching/communication
process will achieve its desired end—agricultural modernization.
Objectives The general objective of the study was to describe and analyze the
structure, conduct and performance of the Philippine agricultural extension
system, particularly the local government extension services in order to provide
1 See various reports of the Rapid Appraisal of Decentralization prepared by the Local Development Assistance Program from 1992-1997. For an analysis of the allocations for agriculture and natural resources, see Cristina David, et. al.,
11

bases for design of policy and institutional reforms needed to strengthen
research, development and extension.
Specifically, the study sought to: 1. Analyze the structure of the agriculture sector and its performance after
the devolution in a municipality;
2. Document the community agriculture knowledge system;
3. Analyze the dynamics in the provision of agricultural extension services in
the study site;
4. Assess the performance of agricultural extension services;
5. Draw lessons and policy recommendations
Methodology: The study was focused on the municipality of Ubay, Bohol. The selection
of Ubay, Bohol was based on a set of criteria decided upon by the project team,
which included the following:
Clear evidence that the agriculture industry has changed over time
brought about by an innovation or a new technology
A municipality where “evidence of agriculture growth” was clear
Growth in the major crops/agricultural commodities and the role of
technology
Data gathering was done using key informant interviews, group interviews,
opportunity interviews, secondary data and participant observation. Various
sources were consulted including documents from various projects and agencies
present in Ubay including reports of previous studies conducted in the area by
various researchers. Maps and other geophysical data were taken mostly from
the municipal Comprehensive Land Use Plan (CLUP). Census data including
population and housing, agriculture, family income and expenditures (FIES) for
various years were extensively used. Key informants included the Municipal
Mayor, Treasurer, Municipal Agrarian Reform Office Personnel, Municipal
Philippine Agriculture and Natural Resources Allocation: Issues and Directions for Reform. Discussion Paper No. 99-30 PIDS. 1998.
12

Agriculture Officer and Agricultural Technologists, farmer leaders, personnel of
other agencies stationed in Ubay such as the National Irrigation Administration
(NIA), Bohol Experiment Station (BES), Central Visayas Integrated Agricultural
Research Center (CENVIARC), Non-government Organizations (NGOs),
farmers and barangay officials.
13

Chapter 2 THE SETTING: UBAY, BOHOL
In order to have some understanding of the conditions in the Philippine
setting under which agricultural extension operates, it is useful to look at a
specific case using a municipal local government. Under the present political
structure, certain government services that used to be provided by the national
government had been devolved to the local government units, agricultural
extension being one of them.2 A careful examination of the social, economic,
political and biophysical conditions would certainly help to enlighten any analysis
of the operations of agricultural extension. This important background will also
enable the observer to see if the providers and consumers have utilized their
knowledge of the conditions in making choices in terms of what and how to
provide and the consumers on what and how to utilize knowledge that is provided
and those that were not provided but accessible though other means.
The choice of Ubay as a case in point must also be explained briefly.
There were criteria used to pinpoint areas for study as mentioned above.
Furthermore, it was observed that Ubay had a significant agricultural
transformation resulting to increased productivity and the diversification of
agriculture to various major crops and enterprises. Over the years, Ubay had
demonstrated significant improvements in its agriculture and there seems to be a
quickening of the pace of rural development due to various developments in
infrastructure, mainly irrigation, roads and ports that apparently increased the
volume of trade and commerce and the existence of many agencies and their
programs in its jurisdiction.
Brief History and Location of the Municipality
Ubay is a port town in the northeastern coast of Bohol. It is an old
settlement that was formerly under the jurisdiction of the Municipality of Talibon.
It was elevated on September 1, 1847 as a civil town by the Spanish friars. On
14

January 15, 1876, the Municipality of Ubay was established as a separate parish
from the cabecera of Talibon. It is now the biggest municipality in the province
in terms of land area and population, second to Tagbilaran City, the capital of the
province.
Source: CLUP
Fig. 1. Map of Region 7 and Bohol showing the location of Ubay.
Ubay is also becoming the granary and trade hub in the northeastern part
the province. It boasts of a large area devoted to rice and a growing mango
enterprise. It is also a major fishing area. Small and commercial fishery
enterprises abound in the coastal settlements. The business sector had also
2 The provisions in the local government code of 1991 specify the roles of the municipal governmental units in agricultural services. A detailed list is found in the appendix.
15

picked up with the improved infrastructure and the growing traffic in goods and
passengers from Cebu and Leyte. It is also the home of major research stations
of the Department of Agriculture. Major infrastructures were put up in the area
such as the two small and large irrigation systems and the power installations
that cross the sea via undersea cables from Leyte.
Demographics: Population Size and Growth
Population History. The population of the Municipality of Ubay during the
first censal year in 1903 was 7,355. It grew to 21,213 in 1939 growing at a rate
of 4.6 percent. The population continued to grow but decreased from 34,090 in
1960 to 32,717 in 1970 due to the creation of the island Municipality of Pitogo,
now Carlos P. Garcia, a former barangay of Ubay. After 1970 the population
constantly grew and from 1995 to 2000 its growth rate was relatively high at 3.35
percent, higher by 1.13 percent than the provincial growth rate at 2.22 percent.
Ubay’s population was 5.26 percent of the total population of the province of
Bohol; 1.05 percent of the total population of Central Visayas (Region 7); and
0.08 percent of the total population of the Philippines (Table 1). By 2012, the
population is expected to reach 88,819. Other projections are shown in Appendix
Table 1.
Table 1. Population growth in Ubay, 1903-2000. Year Population Increase or Ave. Growth
Rate (%) Decrease 1903 7,355 - -1918 8,255 900 0.771939 21,213 12,958 4.601948 29,961 8,748 3.911960 34,090 4,129 1.081970 32,717 (1,373) -0.411975 34,195 1,478 0.891980 38,289 4,094 2.291990 48,902 10,613 2.481995 50,745 1,843 0.742000 59,827 9,082 3.35
Source: Ubay CLUP & NCSO
16

Household Size. The households in Ubay were generally similar in size to
the rest of the population of the country with an average size of 5.19. The
households, which were headed by younger household heads of ages below 20,
had the smallest average size of 2.85 while those headed by household heads
40-49 years old had the biggest average size of 6.36. This age group also
comprised the biggest number of households. Among household sizes,
households of eight or more members comprised the highest percentage for all
age groups (Table 2).
Table 2. No. of households by age group of HH head and household size, 2000. HH size Age Total
Group
HH 1 2 3 4 5 6 7 8 Ave
All 11,512
413 1138 1552 1855 1820 1541 1238 1955 5.19
<20 41 3 13 19 2 2 1 1 - 2.85 20-29 1472 2 164 360 432 273 141 47 33 4.07 30-39 2913 36 118 282 461 609 544 404 459 5.54 40-49 2672 41 106 201 290 387 421 400 826 6.36 50-59 2001 64 171 263 323 287 244 228 421 5.46 60-69 1413 99 273 246 225 171 137 108 154 4.35 70-79 773 112 222 145 97 65 38 41 53 3.49 80< 227 36 71 36 25 26 15 9 9 3.32
Urban and Rural Household Population. There were 13,060 persons or
21.86 percent of the total population who lived in eight barangays considered
urban while 46,691 persons or 78.14 percent of the total household population
resided in the rural area. The most heavily populated barangay was Barangay
Poblacion (town proper) with 3,418 persons followed by Barangay San Pascual
with 3,015 persons while the least populated areas were Barangay Los Angeles
with 213 persons followed by Barangay Camali-an with 454 persons (App. Table
2).
Age and Sex Structure. The sex distribution of the population in 2000
revealed that there were slightly more males than females. Table 3 shows that
17

there were 45.15 percent children and youth, ages (0-14 years); 50.29 percent
were in the working age group (15-64 years); and 49.71 percent dependent
population with ages below 5 years and above 64 years old. More than half
(58.21%) of the population was below 25 years old (Table 3).
Table 3. Population by sex and age group, 2000. Age Group Both Sexes Male Female
All ages 59,827 30,432 29,395 Under 1 1,879 941 938
1-4 6,561 3,306 3,255 5-9 8,331 4,351 3,980
10 - 14 8,023 4,079 3,944 15 - 19 6,236 3,312 2,924 20 -24 4,777 2,439 2,338 25 - 29 3,811 1,953 1,858 30 - 34 3,756 1,863 1,893 35 - 39 3,234 1,663 1,571 40 - 44 2,959 1,523 1,436 45 - 49 2,355 1,198 1,157 50 - 54 1,959 972 987 55 - 59 1,759 855 904 60 -64 1,349 656 693 65 - 69 1,081 511 571 70 -74 820 384 436 75 - 79 494 238 256
80 and over 443 188 255 0-17 28,760 14,782 13,978
18 & above 31,067 15,650 15,417 Source: NCSO
Literacy Rate. Of the total population of Ubay in 1990, 91.02 percent
were literate while 8.98 percent were illiterate. There were more literates in the
urban areas compared to the rural areas. This was probably due to the proximity
of the urban population to educational facilities. The most commonly completed
level was the elementary, specifically from Grades 1-4 only (App. Tables 3 & 4).
Labor Force. Labor force or the economically active population refers to
the population 15 years old and over who are either employed or unemployed.
The economically active population of Ubay in 1990 was 55.89 percent while
those not in the labor force was 44.11 percent. Of the economically active labor
18

force, 80.86 percent were employed and 19.14 percent were unemployed
(App.Table 5).
Migration. Out of the household population 5 years old and over in 2000,
94.8 percent lived in Ubay implying a very low out migration trend (Table 4).
Table 4. Population 5 yrs. old and over by sex, residence at present and 5 years ago, 2000.
Place of Residence Sex Other Other Same Other Pop. 5
Yrs. Old & Above
% Prov. Mun. % % Count Mun. Un-
% ry Same known % Prov.
Both sexes
51,312 48,654 94.8 525 1.02 1,405 2.74 14 0.02 714 1.4
Male 26,130 24,762 48.3 271 0.53 758 1.48 10 0.02 329 0.64 Fem 25,182 23,892 46.6 254 0.49 647 1.26 4 0.01 385 0.75
Source: NCSO
Social and Economic Indicators Family Income and Expenditures. Data for average income and
expenditures of families in Bohol show that both rose over the years but a
dramatic increase was noticed between the years 1994 and 1997, which shows a
probably much better general economic condition during the said period.
However, figures for both income and expenditure for the years mentioned were
still too low (Fig. 2 and App. Table 5). The national and regional average income
for 1994 was P83,161.00 and P57,579.00 pesos, respectively while that of Bohol
for the same period was P38,187.00 . Notice that the 1997 average income of
P56,940.00 for Bohol was still lower than the 1994 figures for the Philippines and
Region 7. These data only confirmed that Bohol was one of the poorest
provinces in the whole country with 47.3 percent of its families and 53.6 percent
of its population living in poverty in 2000. The 2000 picture for Bohol was worse
than in 1997 and worse than the whole of Region 7 and the country in general
(Table 5).
19

Average Family Income and Expenditure for Bohol Families, 1985-
1997
010,00020,00030,00040,00050,00060,000
85 88 91 94 97
AverageIncome (PhP)
AverageExpenditure(PhP)
Source: FIES, NSO Fig. 2. Average family Income and expenditure of Bohol families, 1985-97.
Table 5. Poverty incidence, Philippines, Region 7 and Bohol, 1997 & 2000. Annual Per Cap
Poverty Threshold (P) Incidence of Families (%)
Incidence of population (%)
1997 2000 Inc/ 1997 2000 Inc/ 1997 2000 Inc/ Dec Dec Dec
9,843 11,605 17.9 28.1 28.4 0.3 33.0 34.0 1.0 Phil. 7,885 9,791 24.2 29.8 32.3 2.4 34.7 37.4 2.8 Reg. 7 6,993 9,125 30.5 37.3 47.3 9.9 43.1 53.6 10.5 Bohol
Source: NSO
Bohol had one of the lowest food thresholds in the country in 2000. The
Philippines needed P39,145.00 pesos per family of 5 per year for food or an
average of P107.31 per family per day or P21.46 per person per day while Bohol
needed only P17.34 pesos per person per day. Yet its rate of change between
1997 and 2000 was higher than the country and region at 19.1 percent.
Comparative food thresholds are shown in Table 6. 3Table 6. Food thresholds for Philippines, Region 7 and Bohol, 1997 & 2000.
1997 2000 % Change 6,801 7,829 15.1 Philippines
3 Food Threshold is defined as the minimum cost of food required to satisfy nutritional requirements for physical activities.
20

5,771 6,760 17.1 Region 7 5,314 6,329 19.1 Bohol
Source: NSO
Sources of Income. Agriculture as a source of income had been
declining in Bohol from 50 percent of families to 37 percent from 1985 to 1997.
Wages and salaries had shown a steady increase over the same period from 25
percent to 34 percent. This may also indicate a gradual shift from farming to
nonfarming occupations yet non-agricultural and other sources had remained
more or less steady. This corroborates the findings in a cluster of irrigated
barangays discussed below, that sources other than farming had provided
incomes to families in Bohol (Fig. 3 and App. Table 6).
Number of Families by Source of Income, Bohol, 1985-97
010,00020,00030,00040,00050,00060,00070,00080,00090,000
85 88 91 94 97
Wages and Salaries
Agricultural
Non-agricultural
Other Sources ofIncome
Source: FIES, NSO
Fig. 3. Sources of Income of Bohol families from 1985-97.
4 Household Income and Expenditure in Irrigated Areas of Ubay It is
useful to look at some data, albeit limited that would give us some picture of the
households in the area. A survey of 23 households in the Capayas Irrigation
Project (CIP) area consisting of four barangays indicated that the mean total
21

household income in 1997 was P28,894.00 pesos, which was only about half of
the province’s for the same period. This figure more than doubled during the year
2000 to P58,031.00. On-farm income accounted for more than 90 percent of the
total for 1997. In the year 2000, on-farm income accounted for only about 50
percent. A dramatic increase was noticed in non-farm income, which rose by
around 20 times. On-farm income increased by only about 15 percent during the
same period. This gives us some indication that while income from farming
increased, other sources even provided a greater share of the income of the CIP
families. It might be said then, that other factors in the economy may have had a
greater impact on the CIP households than agriculture.
The mean total household expenditure for 2000 was P36,335 and farm
expenditure was P21,931 making a mean total family expenditure of P58,266.00
pesos which was slightly higher than the total household income of P58,031.00
pesos. The shortage was very little. Surprisingly, the 1997 calculation for
household expenditure was much higher than the 2000 figure by about 25
percent. One explanation here is that there might have been errors in
measurement since the data called for a longer time lapse for recall. Of the on-
farm income in 2000, rice accounted for 70 percent and upland crops and
livestock shared an almost equal percentage of 13 percent each.5 This brings the
percentage of income from rice farming even lower than off-farm and non-farm
sources.
Housing and Amenities. Data show that almost all households lived in a
single house in both in Ubay and the whole province although the percentage for
Ubay was higher than the province’s. However, the proportion of houses with
galvanized iron (GI) roofing was much lower in Ubay than in the whole province
with nearly ¾ in the latter while only half (52.5%) in the former. The proportion of
houses that needed no repairs was comparable for Ubay (50.9%) and the
4 Taken from E. Saz, Social Impact Assessment of the BIAPP Activities in the CIP Sub-site, Ubay, Bohol. 2001. 5 Breakdown by source are as follows: rice-70.11%, Vegetables-3,47%,Upland crops-13.14% and livestock-13.27%. See Income and Expenditure Survey for CIP households.
22

province although more in the latter (57.7%) needed no repair. House ownership
rate was the same for the town and the province (Table 7).
Table 7. Selected housing characteristics, Ubay and Bohol province, 2000.
Single house
% to With % to Needs no repair
% to Owned % to total GI roof total total total
205,547 96.4 154,169 72.3 123,042 57.7 173,884 81.5 Bohol 11,311 98.25 6,044 52.5 5,860 50.9 9,360 81.3 Ubay
Total households: Bohol=213,215; Ubay=11,512 Source: NSO
Selected amenities found in households are shown in Table 8. The radio
was the most common amenity relatively distributed in almost similar proportions
in the town and province. A higher proportion of households of the whole
province than Ubay had TV and telephones. The proportion of those who had
motor vehicles was almost the same for Ubay and the province.
Table 8. Selected household amenities, Ubay and Bohol province, 2000.
Radio % to TV % to Phone % to Motor vehicle
% to total total total total
159,336 74.7 7,995 37.5 9,918 4.65 21,854 10.25 Bohol 8,820 76.6 3,016 26.2 136 1.22 1,064 9.24 Ubay
Total households: Bohol=213,215; Ubay=11,512 Source: NSO
Other Socioeconomic Indicators
Commerce and Trade. Ubay had a number of business establishments
mostly small-scale commercial trading firms engaged in retail and wholesale. A
new public market building was completed recently. The regular market day was
Monday and local traders from neighboring towns came to sell their merchandise
consisting mostly of agricultural products and small consumer items like used
clothes, household utensils and other products. Ubay also provided a market for
the neighboring island municipality of Carlos P. Garcia. Local trade with Leyte
23
and Cebu were facilitated by regular daily or twice-daily boat trips to and from
Maasin City Southern Leyte, and Bato, Leyte and Cebu City. Passenger and
cargo traffic to these destinations had also noticeably increased over the years
indicating an also increasing volume of trade between these points.
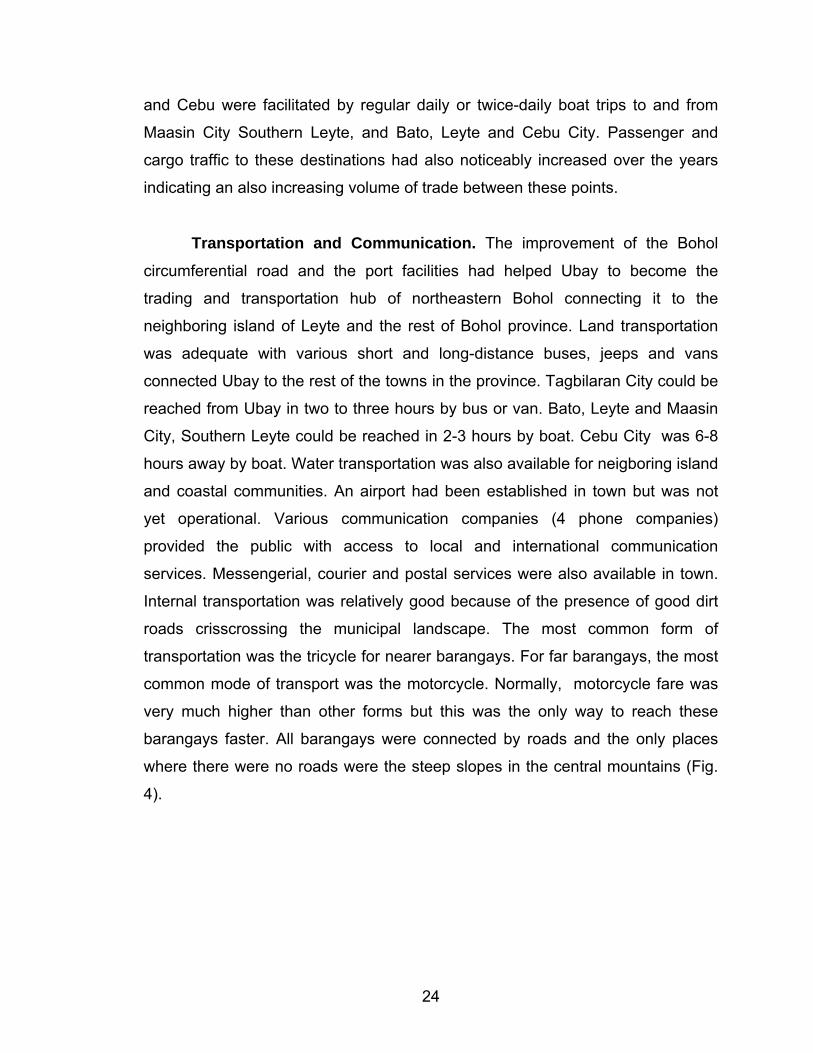
Transportation and Communication. The improvement of the Bohol
circumferential road and the port facilities had helped Ubay to become the
trading and transportation hub of northeastern Bohol connecting it to the
neighboring island of Leyte and the rest of Bohol province. Land transportation
was adequate with various short and long-distance buses, jeeps and vans
connected Ubay to the rest of the towns in the province. Tagbilaran City could be
reached from Ubay in two to three hours by bus or van. Bato, Leyte and Maasin
City, Southern Leyte could be reached in 2-3 hours by boat. Cebu City was 6-8
hours away by boat. Water transportation was also available for neigboring island
and coastal communities. An airport had been established in town but was not
yet operational. Various communication companies (4 phone companies)
provided the public with access to local and international communication
services. Messengerial, courier and postal services were also available in town.
Internal transportation was relatively good because of the presence of good dirt
roads crisscrossing the municipal landscape. The most common form of
transportation was the tricycle for nearer barangays. For far barangays, the most
common mode of transport was the motorcycle. Normally, motorcycle fare was
very much higher than other forms but this was the only way to reach these
barangays faster. All barangays were connected by roads and the only places
where there were no roads were the steep slopes in the central mountains (Fig.
4).
24
Source: Ubay CLUP
Fig. 4. Road network, Ubay
Energy and Water. Bohol was linked to the major source of geothermal
power in Leyte through the underwater connection between Maasin, Southern
Leyte and Ubay. Presently, only three of the 44 barangays had no electricity, yet
only 34.97 percent of the total households in the municipality had electricity
compared to the province, which was 58.3 percent energized in 2000 .
The town proper and seven other barangays was served by the Ubay
Water and Sanitation Cooperative. The cooperative planned to expand their
service to eight other barangays in the near future. Due to consumer demand
and the limited size of the supply, water service became difficult during dry
months. Bohol province reported that 23.71 percent of its households had their
own faucets from a community system while Ubay reported only 8.97 percent.
For the province, 21.68 percent of households had access to shared faucets
while Ubay only had 8.86 percent. In Ubay, slightly more than half (51.83%) of
the households had access to dug wells.
25

Education, Mass Media, Health and Recreation. Ubay had a college
offering two and four-year courses, six public and private high schools and at
least one public elementary school in each barangay. Local newspapers were
available daily in the poblacion. A local radio AM station, DYZD, was also based
in town. Various other radio and TV stations were accessible. The town had one
cockpit and numerous basketball and tennis courts for recreational purposes.
Several lodging houses provided accommodations for visitors from out of town.
For health services, the town had two public health units staffed by doctors,
nurses, midwives, dentists, medical technologists and sanitary inspectors. A
small government hospital was established to provide outpatient services to local
residents. A private 15-bed hospital also provided services for emergencies. A
pediatric and OB-Gyne clinic complimented the health services available in town.
Barangay Health Workers (BHW) from each barangay provided direct health care
assistance to barangay residents.
Public Order and Safety. The local police force was composed of 37
policemen. Police-population ratio was computed at 1:1,616, lower than the
standard ratio of 1:1,000. The police was augmented by 492 Barangay Tanod
volunteers. It was reported that crime rate in Ubay was relatively low. The local
Fire Department was staffed by eight fire fighters with two fire trucks. Incidence
of fires was reportedly low in the municipality.
Physical and Agronomic Conditions
The data presented below show that in terms of the biophysical conditions
of Ubay, crops of various types could be successfully grown. The general
topography was rolling plain and roughly 90 percent of the area had slopes that
were suitable for agriculture (below 18 percent ) and therefore, amenable to all
types of cultivation. The soil conditions, generally sandy loam, were also suitable
for various crops except in certain areas, which were generally sandy and high in
salinity, namely those closer to the coast. Nevertheless, these were a small
26

percentage of the total agricultural area. Flooding, drainage, and erosion were
not significant problems.6
Land Area. Ubay has a total area of 29,945.78 hectares. Other sources
report different figures such as 33,506.38 hectares according to the municipal
assessor’s office; 27,200 according to the NCSO citing the Land Management
Bureau and completed cadastral survey as sources; and 24,409 hectares
according to the Provincial Environment and Natural Resources (PENRO).
The land area of the Municipality of Ubay is 7.27 percent of the total land
area of Bohol, the biggest in the province’s municipalities; 2 percent of the total
land area in Region VII; and 0.10 percent of the Philippines’ land area. Land
areas by barangay are found in Appendix Table 7.
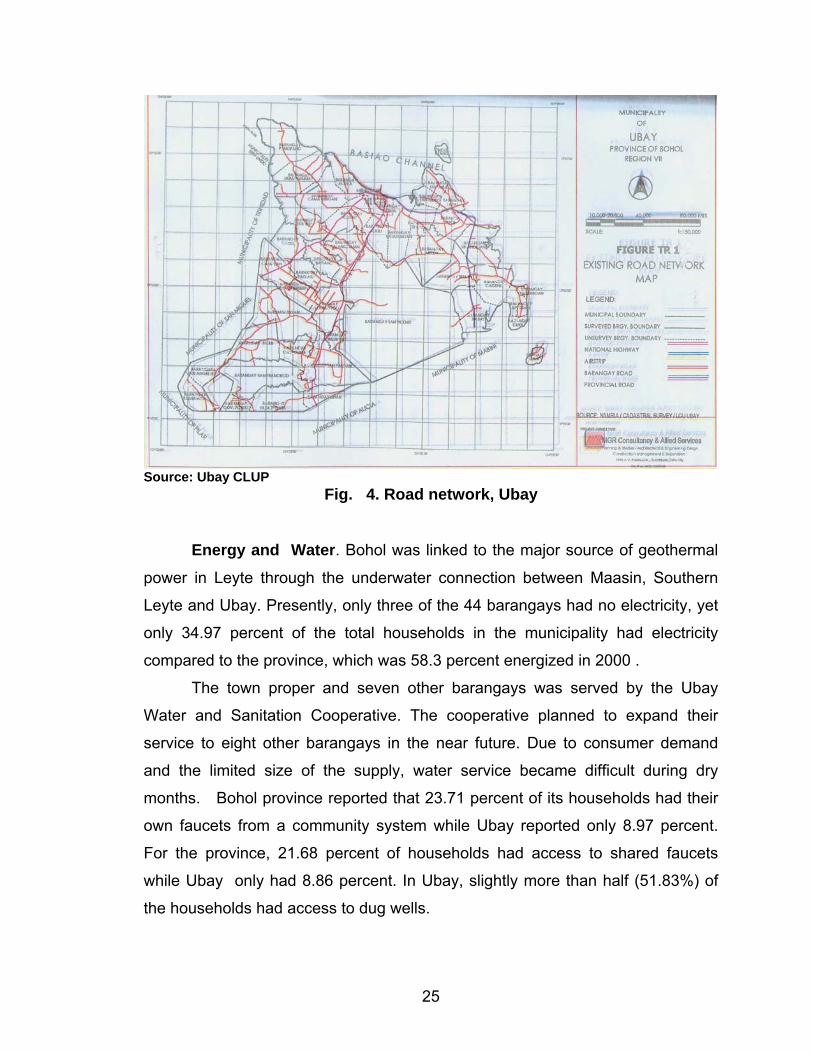
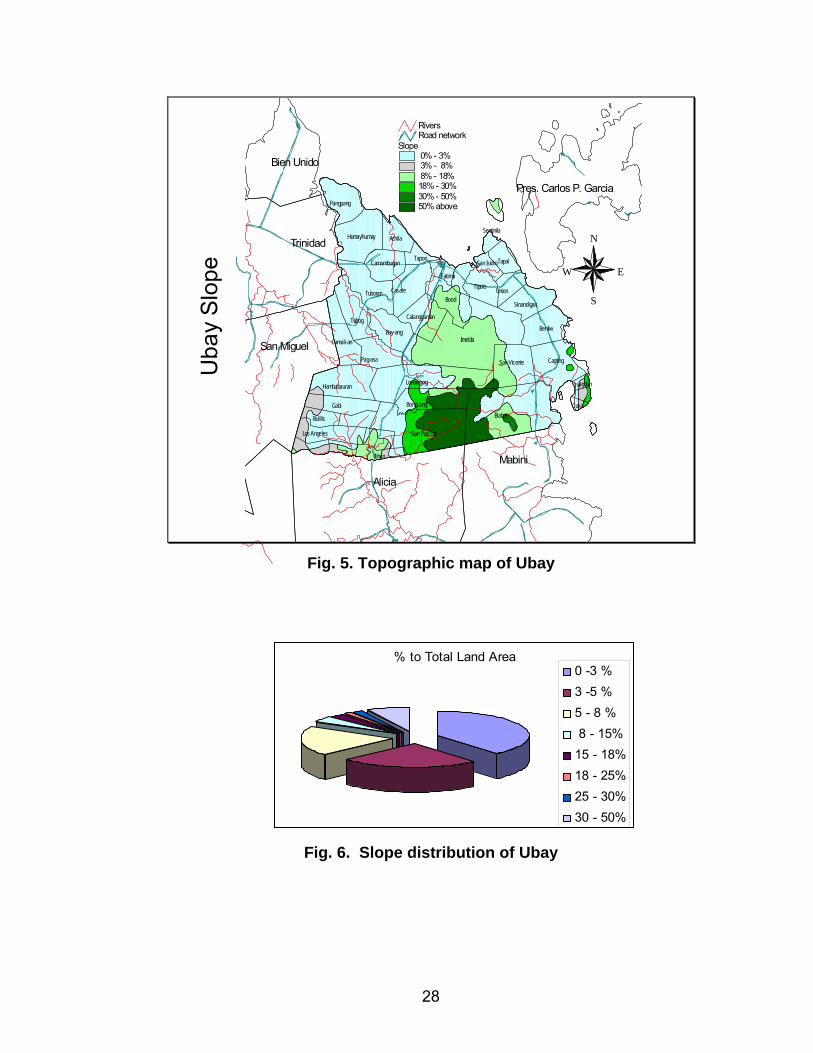
Topography and Slope. Ubay’s topography was predominantly
moderately rolling with occasional highly rugged and mountainous areas. The
highest elevation was 428 meters above MLLW level and the lowest elevation
was 5 meters MLLW level. Dominant slope was 0-3 percent found in the
northern, eastern and western portion occupying 38.79% of the total land area.
Slopes of 18-25 percent and 25-30 percent (very strongly to steeply sloping)
were prevalent in the central portion. Slopes of 30-50 percent and above can be
found in the southern portion (Figs. 5 & 6).
Soil Classification. Ubay has six known types of soil. The most
dominant, Ubay sandy loam (17,041.39 hectares or 59.90%) and Ubay clay
(10,884.86 hectares or 36.34%) cover almost the entire area. Other soil types are
listed in Table 9. The locations of each soil type are illustrated in Fig. 7.
6 See CLUP. 66.5% had no flooding hazard and 60.49% was not susceptible to erosion.
27
Alicia
Trinidad
Mabini
San Miguel
Bien Unido
Pres. Carlos P. Garcia
Imelda
Biabas
Lomangog
San Pascual
Cagting
Bood
Gabi
TubogBenliw
CasateTuboran
Bongbong
Tipolo
Bay-ang
Humayhumay Achila
San Vicente
Hambabauran
Pag-asa
Pangpang
Camali-an
Union
Tapal
Sinandigan
Bulilis
Calanggaman
Los Angeles
Camambugan
Ilihan
TaponSan Isidro
Fatima
Sentinila
Cuya
Juagdan
Slope 0% - 3% 3% - 8% 8% - 18%18% - 30%30% - 50%50% above
Road networkRivers
N
EW
S
Uba
yS
lope
Fig. 5. Topographic map of Ubay
% to Total Land Area0 -3 %3 -5 %5 - 8 % 8 - 15%15 - 18%18 - 25%25 - 30%30 - 50%
Fig. 6. Slope distribution of Ubay
28

Table 9. Soil classification, 2002 Soil Type Area % to Total
1. Ubay Sandy Loam 17,041.39 56.90 2. Ubay Clay 10,884.86 36.34 3. Faraon Clay 886.53 2.96 4. Rough Stone Land 470.22 1.57 5. Hydrosol 494.18 1.65 6. Beach Sand 173.71 0.58
Total 29,950.88 100.00
Alicia
Trinidad
Mabini
San Miguel
Bien Unido
Pres. Carlos P. Garcia
Imelda
Biabas
Lomangog
San Pascual
Cagting
Bood
Gabi
TubogBenliw
CasateTuboran
Bongbong
Tipolo
Bay-ang
Humayhumay Achila
San Vicente
Hambabauran
Pag-asa
Pangpang
Camali-an
Union
Tapal
Sinandigan
Bulilis
Calanggaman
Los Angeles
Camambugan
Ilihan
TaponSan Isidro
Fatima
Sentinila
Cuya
Juagdan
Soil TypesHydrosolUbay clayUbay sandy loam
Road networkRivers
N
EW
S
Uba
yS
oil T
ypes
Fig 7. Soil map of Ubay
Land Capability Classification. In general, most of Ubay had Class A
land. This type of land was characterized as having “slight soil limitations and
loamy profile. It can be cultivated safely requiring only simple but good farm
management practices. It has level to nearly level slope, with no to slight soil
erosion and no to slight flooding hazard and well drained”7. It is located along
coastal plains of Barangays Pangpang, Humay-humay, Tuburan, Camambugan,
7 See CLUP.
29

Achila, Tapon, Poblacion, Fatima, Tubog, Sentinila, Chico, Benliw, Cagting,
Guintaboan, Juagdan, Cuya, and Tintinan and dominant in coastal barangays of
Benliw, Sinandigan, Casate, Bay-ang, Pag-asa, and Camalian. Also present in
some areas in Barangays Union, Tipolo, Calanggaman, Bood, Katarungan,
Imelda, Benliw, Biabas, and San Vicente. Most of these areas were suitable to
both rice and corn cultivation (App. Table 8).
Weather and Climatic Conditions
Rainfall and Typhoons. The average rainfall distribution throughout the
year recorded from the PAGASA station in Mactan, Cebu, for the years 1997-
2001 is shown in the table below. Table 10 shows that more rain occurred from
the months between June and December with November and December as the
wettest and a drier spell in August. Bohol was generally bypassed by strong
typhoons as it is out of the typhoon path but occasionally Ubay was hit by
typhoons. The latest recorded were Nitang (August-September 1984) and
Ruping (November 1990).
Table 10. Annual average rainfall, 1997-2001. Month Average Rainfall
(mm) Average Number
of Rainy Days January 109.2 12.0 February 115.1 11.0 March 66.9 9.0 April 71.2 8.0 May 129.5 12.0 June 163.2 16.0 July 188.3 16.0 August 126.1 15.0 September 187.5 13.0 October 184.1 18.0 November 204.2 16.0 December 192.6 16.0
Source: CLUP citing PAGASA data.
30

CHAPTER 3
THE STRUCTURE OF AGRICULTURE
Bohol island is generally of karst formation. Most of the coastal areas were
not suitable for agricultural production but the interior and noartheastern portions
provided ideal areas for intensive agriculture because of the presence of suitable
soils and water. Extensive areas planted to rice can be seen along the central
plains stretching towards the northeastern coast. The higher elevations were
generally covered with secondary forests or permanent crops such as coconuts
but these were not very extensive. Corn and rootcrops were generally planted in
areas where there was no irrigation.
It was claimed that despite the limitations to the agronomic condition of the
island, it produced 66.5 percent of the rice in the region and 74 percent of the
rootcrops, 44 percent of the livestock and 54 percent of the fish.8 Despite these,
however, poverty incidence in the island, owing probably to the limitations of the
land was high. Unemployment was reported to fluctuate between 5.4 to 8.6
percent from 2000 to 20039. It may be inferred that since the province is
generally rural, most of the poverty, therefore exists in the rural, hence,
agricultural areas.
The Agriculture Population
Rural and Farm Population of Bohol. The rural population of Bohol had
been consistently high, 4 in every 5, over the years from 1960 to 2000 although
the number had been consistently decreasing. The actual farm population as
recorded in the agriculture censuses of 1970 and 1980 were much lower than the
rural population. This means that many who lived in rural areas did not live in
farms or were not engaged in farming. In general one can conclude that Bohol
was and still is a predominantly rural and agricultural province (Table 11.)
8Bohol Sunday Post quoting unnamed sources. 9 The figures for 2000 was 7%, 2001, 5.4%, 2002, 8.6% and 2003, 7.4. (FIES)
31

Table 11. Total, rural and farm populations of Bohol, 1971-2000. Year Total pop Rural Pop % to Total Farm Pop % to Total 1960 592,194 1970 683,297 586,643 85.86 386,383 56.54 1980 806,013 683,099 84.75 547,210 67.89 1990 947,098 707,481 74.7 2000 1,139,130 Source: NCSO
Characteristics of Rice Farming Households in Four Irrigated
Barangays. In the Capayas Irrigation System (CIP) area comprising of four
barangays, the average household head was 47 years old and the average
household was around six members. They were divided almost equally by tenure
between owners and tenants despite the fact that this area was already
subjected to land reform. Nearly 60 percent of the household heads finished or
attended only primary school. More than two thirds had attended seminars on
crop production and related topics such as cooperatives and irrigation
management between 1991 and 1996. The average household had an annual
income of P61,023.00 pesos with slightly over half of it earned from nonfarm
sources. Therefore, these farmers did not have farming as their main source of
income. Nearly two-thirds (62%) cultivated an area of one hectare or less; more
than half cultivated an area of only half a hectare or less. With very few
cultivating ten hectares or more, the average landholding was .94 ha. per
household.
Number of Agricultural Workers. An estimate of the number of farmers,
fisherfolks and related workers in the area show that they were present in all
barangays comprising of 12,223 farmers and 1,654 fishermen. The figures for
1997 show some interesting difference from the 2002 data. The number of
farmers increased from 10,050 to 12,223 while the number of fishermen
decreased from 2,225 to 1,654. This means that fisheries could have declined
resulting also to the shift in occupation by some fishermen. The data also shows
32

that if each farmer represented at least a family, then nearly all the households
were farming households (Table 18).
Farmers and Fisherfolk Organizations. There were quite a number of
farmers’ and fisherfolk associations present in Ubay. The strengths of these
associations, however, need to be seen in terms of concrete programs and
projects that helped members in their occupations. It can be surmised, that most
of these organizations were weak. Even the Irrigators’ Associations, which were
supposed to help maintain their facilities and collect fees, were unfortunately
problematic. Another case in point was the rebel returnees group, which was
based supposedly in Tuburan. A 50-hectare lot was allocated to them by the
government under the National Reconciliation and Development Program
(NRDP). It is pathetic to see the resettlement area abandoned and the
beneficiaries scattered in various places around Bohol. The organization had
experienced serious problems and a new set of officers was elected despite the
objections of the existing leader. A litany of the problems of the association as
put forth by the new leadership more or summarized all the problems of the rest
of farmers and fisherfolk associations in the locality. The numbers did not include
those organized by other agencies and NGOs (Table 19).
Table 12. Number of agricultural workers, 2000. Occupation Location Total
Farmers Crop Farmers 44 Barangays 11,632 Livestock Farmers 44 Barangays 125 Poultry Farmers 44 Barangays 1,340 Fishermen Municipal Fishermen 20 Coastal Barangays 625 Aqua Farm Cultivators 19 Coastal Barangays 102
44 Barangays 525 Other Farm workers Total 14,349
Source: MAO, Ubay Table 13. An indicative number of associations and members, 2002.
33

Organization Number of Number of Organizations Members
Farmers’ Association 18 707 Rural Improvement Club (RIC) 10 278 Fishermen’s Association 19 969
The Farms
Total Farm Area, Average Farm Area and Number of Farms. In the
Philippines, the number of farms rose from 4.6 million in 1991 to 4.8 million in
2002 but the farm area decreased from 9.97 million hectares in 1991 to 9.67
million in 2002. The average farm area subsequently decreased from 2.16 in
1991 to 2.01 in 2002. In Bohol it can also be seen that the area farmed rose
gradually through the years as well as the number of farms yet the average farm
size had decreased. Between 1948 and 1991 the average farm size had been
more than halved from 2.51 to 1.25 hectares This figure was only more or less
one half of the national average in 1991 and 2002 which were 2.2 and 2.02
hectares, respectively. This means that the average Boholano farmer cultivated
only one half the farms size of the average Filipino farmer. On the average, the
Ubay farmer had a slightly bigger farm (2.02 and 1.83 ha) than the Boholano
farmer (1.58 and 1.25) for the 1981 and 1991 periods (Table 12).
Table 14. Total farm area and no of farms, Bohol and Ubay, 1903-1991.
Total Land Farmed
No. of Farms Ave. Area (ha) Year
Bohol Ubay Bohol Ubay Bohol Ubay 1903 58,098 36,869 1.58 1918* 131,874 88,293 1.49 1939** 175,747.62 63,388 1.49 1948** 163,030.50 65,013 2.51 1971 142,070.3 61,107 2.32 1981 159,270 9,514 100,462 4,706 1.58 2.02 1991 166,826 12,322 133,841 6,732 1.25 1.83 *Farms had at least an area of 200 sqm; **Farms had at least an area of 1,000 sqm. Source: Census of Agriculture
34

Farm Size and Tenure in Ubay. Land ownership in Ubay was generally
distributed among its farming population. In the 2000 census, 2,819 (28%) of the
10,050 households, reported to have owned agricultural land. Among these
landowners, 668 (6.65% of total household population and 23.7% of total land
owners) reported to have owned land through agrarian reform. There were
exceptionally large land holdings but most of the rice farms were small and those
large enough were subjected to land reform. An estimate of the average land
holding for the whole municipality was pegged at .75 hectare. The average
landholding in the irrigated cluster of four barangays of Casate, Kalanggaman,
Tuburan and Bood was .9 hectare with a high incidence of tenancy. Records
from the Department of Agrarian Reform however showed that a big number of
tenants had benefited in terms of tenure improvement through the land transfer
and leasehold schemes.
Number of Farms by Tenure. It can also been seen that while the
number of farms in Bohol under full ownership, part ownership and tenancy
generally increased from 1971 to 1981, their number had decreased from 1981
to 1991 (Table 13). This phenomenon is, however, difficult to explain.
Table 15. Number of farms by tenure, Bohol 1948-1991.
Year All Full Owner Part Owner Share Tenant 1948* 65,013** 45,166 9,104 7,788 1971 61,107 35,741 16,026 18,192 1981 100,462 69,668 27,984 34,260 1991 133,841 42,781 22,386 14,346 *Farms were limited to at least 1,000 sqm.; **Includes other categories of tenants totalling 3,654. Source: Census of Agriculture
Comparison of Farm Tenure among Philippines, Bohol and Ubay. A
comparison of the farm tenure situation of Bohol to the national shows that the
fully owned farms were more or less similar in percentage but the fully tenanted
farms while generally lower for Bohol from 1960 to 1981 but increased in 1991
contrary to the much lower percentage nationally. Some farmers had already
35

shifted to fix rent by 1981 indicating that they had benefited from the agrarian
reform program by this time. The area under full ownership increased despite a
decline in the number of farms under full ownership. The area under tenancy also
increased with the slight increase in the number of farms under tenancy (Tables
14 & 15). These phenomena could mean increasing land consolidation and
increasing tenancy despite agrarian reform.
Table 16. Percent of farms under full ownership and full tenancy, Phil. and Bohol, 1960-1991.
Year Fully owned Fully tenanted Phil. Bohol Phil. Bohol 1960 53.2 53.2 37.1 18.9 1971 62.9 57.7 26.5 13.4 1981 66.8 65.5 25.5 10.6 1991 48.7 45.5 5.3 11.9 Source: Census of Agriculture
Table 17 . Farm area by tenure, Bohol, 1971-1980 Year All Full
owner Part owner
Share tenant
Fixed Free rent
Others rent
1971 142,070.3 82,033.1 33,702.3 18,221.7 1,162.6 1981 159,270 96,125 29,610 28,731 2,664 1,902 238 Source: Census of Agriculture
In Ubay, the number of farms in all size categories increased from 1981 to
1991 but the largest increase was seen among farms of less than half a hectare,
tripling from nearly 6 percent in 1981 to 17 percent in 1991. The biggest
percentage of farms was those between 1-1.99 ha at 31.49 percent in 1991. And
relatively fewer farms were larger than 7 ha. Yet a good percentage was less
than half a hectare. (Table 16). It can be noticed also that the largest area was
under full ownership but in 1991 the area under share tenancy increased.
Furthermore, agrarian reform had transformed some farmers into owners and
fixed renters by 1980 and 1991. The data suggests that the sharp rise in small
farms may be due to fragmentation as larger farms were parceled into smaller
36

farms due to sale or subdivision among heirs or beneficiaries. Yet, the increase
in the number of large farms may also show a trend in land consolidation as
mentioned above. A confounding revelation is the rise in the number and size of
farms under full ownership and share tenancy at the same time. One is further
confounded by the decline in the number and area under fixed rent (Table 17).
Table 18. Number of farms by size, Ubay, 1980-1991. Year All Less
.5 .5-.99 1-
1.99 2-2.99
3-4.99
5-6.99
7-9.99
10-24.99
25+
No 4,706 275 1,077 1,546 797 702 194 22 88 5 1980 % 5.84 22.88 32.85 16.93 14.92 4.12 .46 1.87 .01 No 6.732 1,134 1,293 2,120 908 890 247 71 60 9 1991 % 16.84 19.21 31.49 13.49 13.22 3.67 .10 .89 .01
Source: Census of Agriculture
Table 19. Number and area of farms by tenure, Ubay, 1980-1991.
All Full owner
Heir OLT Others Share Fixed Free Year tenant rent rent
no 4,706 2,432 939 221 34 1,534 94 163 1980 area 9,514 4,952 2,174 405 410 2,154 183 221 no 6,732 1,728 843 51 1,561 40 395 1991 area 12,322 3,154 1,350 76 3,059 56 328
Source: Census of Agriculture
Production and Productivity
Crop Production. Ubay had an agriculture based economy on which
approximately 75 percent of the total population depended for a living. The
municipality had 20 coastal barangay including island barangays and 24 upland
barangays suited for crop production. In the past decade, Ubay farmers planted
only one crop but lately many farmers adopted the diversified farming practices
replacing the purely single cropping system.
The various crops include the following: rice (irrigated, non-irrigated),
corn, coconut, mango, banana, cassava, vegetables, ornamental crops,
legumes, pineapple. African oil palm had just been introduced to the area within
the last few years. As per record from the MAO, the municipality had a total of
12,961.10 hectares of agricultural land utilized for crop production accounting for
43.28 percent of the total land area (Table 20).
37

Table 20. Area devoted to crop production, 2000. Crop Area (Has.) % to total
Agricultural Land
% to total Mun. Land Area
Rice 6,249.00 48.21% 20.86% Irrigated 1,160.00 8.95% 3.87% Non-Irrigated 5,089.00 39.26% 16.99%
500.00 3.86% 1.67% Corn 26.10 0.20% 0.001 Vegetables 1,403.00 10.82% 4.68% Rootcrops 1,984.00 15.31% 6.62% Industrial Crops
Mango 504.00 3.89% 1.68% Coconut 1,480.00 11.42% 4.94%
240.00 1.85% 0.80% Legumes 2,559.00 19.74% 8.54% Other Crops
Total 12,961.10 100.00% 43.27% Source: MAO
The Rice Subsector
Production and Productivity. Rice production yield is computed based
on two croppings per year with an average yield of 4.00 metric tons per hectare
for irrigated and 2.5 metric tons per hectare for non-irrigated areas. The total
annual yield for irrigated rice was 9,280 metric tons for non-irrigated areas with a
combined annual yield of 34,725 metric tons. The irrigated area had a total
production value of P37.12 million pesos and P101.78 million pesos with a
combined total of P138.90 million pesos. Lately, hybrid rice was introduced to the
area and yields of as high as 9 - 12 tons were reported by a few farmers.
Technology adoption and flow. Rice technology in Ubay dates back to
the early days of rice cultivation. Certain areas of the locality had been able to
plant two seasons per year despite the absence of irrigation because of the
availability of water during most of the year. With the nature of the rolling
topography, areas at the base of the gently rolling slopes stored water longer.
These were locally called “lansub” areas while those areas above were called
“sinaka”. The lansub areas were planted to two seasons of rice while the “sinaka”
38

were only planted during the wet season, which began in June. Most of the rice
areas in Ubay were rainfed and were only planted once a year.
The major source of rice production technology was the Department of
Agriculture through its various package programs usually involving new seeds,
fertilizers, chemicals, and incentives for farmers. Many farmers, however, had
only experienced direct contact with extension workers lately owing to the fact
that most government rice production programs were targeted only for irrigated
areas. At present, most farmers had already been exposed to the new
technologies in rice production but the level of adoption of these technologies
was difficult to assess. If indications are correct, the latest season (DS2005)
involving the planting of hybrid rice, only 16 farmers participated. This is not to
say that most farmers did not adopt high-yielding varieties (HYVs) and other
technologies. This can only mean that farmers did not adhere completely to the
set of recommendations for various reasons, most important of which, was cost.
In fact, local extension agents believed that farmers only adopted government
production programs because of the incentives provided. Otherwise, they
partially adopted technology packages based on their capacity to pay for these
technologies, their level of understanding of the technologies and their potential
effects on yield. So that today, the sources of technology were many and most of
these technologies were no longer new to most farmers. If one makes a cursory
examination of the varieties planted by farmers, he would discover many,
indicating that the farmers had obtained this technology from many sources also.
For seeds, farmers bought from an organized group of seed growers province-
wide, the Bohol Farmers Marketing Cooperative (BOFAMCO) several members
of whom were from Ubay. Not many farmers in the locality, however, relied on
the BOFAMCO and the seed growers themselves were experiencing problems of
payment from the government. Either farmers sourced their seeds from their
neighbors or they got their seeds from their previous crop. Except for hybrid rice,
which cannot be sourced from the previous crop, a farmer availed of seeds from
many sources. As far as fertilizer and chemical technologies were concerned, the
farmers learned from the extension staff and also asked the merchants who sold
39

these inputs. Much to the disappointment of the extension staff, farmers who had
been trained on Integrated Pest Management (IPM) still used chemicals
extensively.
A summary of the flow of technology for rice is shown in Figure 8. This
figure shows that rice technology mainly flowed from government sources,
specifically the Dept. of Agriculture. The DA through its arm in Bohol, the
Agricultural Promotion Center (APC) based in Tagbilaran City usually promoted
new varieties along with their technology packages. Each new variety introduced
was coursed through the Provincial Agriculture Office (OPA) and to the municipal
offices. The DA had a local arm in Ubay, the Bohol Experiment Station (BES)
that produced certified seeds for local consumption. Seed growers also provided
technical information to buyers. Input dealers did the same. The Municipal
Agriculture Office was the main contact of the farmers for technology. Farmers
generally sought information from other farmers. In the case of alternative
technologies such as low-input and organic agriculture technology, a Non-
government organization, the Southeast Asian Regional Initiatives on Community
Empowerment (SEARICE) was recent source in cooperation with the Provincial
Agriculture Office and the Central Visayas State College of Agriculture, Forestry
and Technology (CVSCAFT).
Under the BIAPP, rice production technology was provided mainly by the
BIAPP staff who were DA staff. In addition, Japanese scientists provided
backstopping to the DA staff. Local staff were detailed to the program but only
two were closely involved. The program lasted until 2001. Under the program,
rice technology was combined with a search for a number of rice-based cropping
systems in recognition of the limitations of the irrigation system and the
peculiarities of the soils in the area. While there were promising leads such as
the introduction of watermelons and vegetables, these were not sustained after
the program expired. The present program of the local staff included non-rice
crops but these were targeted for traditionally non-rice growing areas.
40

DA (RFU/APC,
BES)
OMA
Farmers
OPA
Input dealers, Seed
growers,
Farmers
Farmers
NGO
Fig. 8. Technology flow for rice
Marketing. Rice trade in the province as well as in Ubay was dominated
by one major trading firm—Altura’s Group of Companies. There were a few local
buyers but they were only agents of Altura’s. The company bought from all over
Bohol and marketed clean rice all over the province as well as Cebu. It owned
several supermarkets in Tagbilaran City and in Talibon. It also supplied to local
retailers.10 The NFA had put up a warehouse in Ubay but farmers still preferred
not to sell to it because they said it had many requirements and they could not be
paid immediately. It should also be pointed out that for many farmers, there was
not much to sell to outsiders because their production was barely enough for
their own consumption and to pay their debts. Most farmers obtained production
and other loans from nonformal sources, which charged high interest.
10 The company is into production of feeds, contract growing of corn for its feedmill, poultry, piggery, fishpond, copra trading, supermarkets and department stores. It owns several supermarkets in Tagbilaran city and in other towns. It also supplies the many retail stores throughout the province.
41

Farmers
Middlemen
(Ubay)
Wholesaler/
Retailer
Fig. 9. Marketing flow for rice in Ubay
Productivity and Profitability Impacts. Benchmark data in the area
revealed that the average yield was 2.8 mt/ha (70 bags at 40kg/bag). The
monitoring data revealed a consistent rise in average yields reaching to 4.6
mt/ha, (115 bags) higher than the targeted 4.0 mt/ha (100 bags) by 2001.11 The
data suggest that average yields could go higher than 4 mt/ha as shown by some
farmers who had already achieved much higher yields as early as 1996. At that
time, some farmers serviced by the main canal already obtained yields of 5 to 7
mt/ha (125-175 bags) using the recommended varieties Ala, Pagsanjan, and the
traditional variety Red 15.12 On the other hand, it was also found that some
farmers still got yields of as low as .8 mt or 20 bags per hectare.
In terms of profits, little data can be gleaned. A look at the production
expense, however, will give us an idea of whether profits were realized or not. In
11 For comparison, the average for Bohol province in 1994 was 4.5 mt/ha in irrigated areas. Including rainfed areas, the average was 3.94 mt/ha. Ubay had an average of 3.45. See 1990-94 Technical Reports.
)
NFA(Ubay
Retailers
Consumers
42

1996, production costs ranged from P13,139.04 pesos for owner operators to
P19,443.04 pesos for tenants per hectare. The difference was accounted for by
the landowner’s share incurred by tenants. It is clear then, that tenure was a very
significant factor to profitability as land rent expense accounted for roughly one
third of the total farm expenses. In the 2000 Income and Expenditure Survey,
(23 families) it was found that the mean on-farm income was P29,942 and mean
farm expense was P21,931.5. The mean net farm income was P8,010.50 or
36.52 percent of their investments. This might be considered impressive but if the
average income per month from farming was computed, it was only a measly
P2,002.62 a month for a family of seven.13 This income definitely could not
provide even the minimum basic food, clothing, shelter, education and health
needs of an even smaller family.
Factors Perceived to Affect Yields and Profits. The major factor to
yield increase was irrigation. It was claimed that before irrigation was made
available, the farmers could still plant twice a year but the water was not
predictable they could not plan their tasks well. With irrigation, they could plant
on schedule thus, not wasting their seedlings and could apply inputs correctly at
the right time.
Farmers also revealed that high yielding varieties were one of the most
important factors in yield increase. They could cite specific varieties that
performed well. For example, all informants cited Ala or RC 18 as one with the
best record in terms of yield and eating quality. The farmers were planting other
varieties including the hybrids and other NSIC varieties
Another factor cited were other technologies including fertilizers. However,
unlike seeds of new varieties which had become easier to access because of the
subsidies, fertilizers were not easily accessed because of their high cost.
Farmers claimed that with little or no capital, they could not meet the
recommended rates and at times could not secure fertilizers on time.
12 Benchmark Survey Report. p. 26. This may be further examined because these are really very high numbers.
43
Another major factor was control of pests and diseases. The damage
caused by rats, stem borers and diseases was considerable ranging from 30 to
100 percent. Asked as to why they were not able to stop the damage on time,
farmers had a variety of explanations such as the occurrence has been
widespread it was difficult to control, the method of control was ineffective, they
did not know what to do, etc. In some cases, the extension staff were not aware
of the susceptibility of new varieties to certain diseases that they failed to warn
the farmers. In one case, a farmer had two successive crop failures using NSIC
211 because of disease. Another farmer claimed that he had yet to taste success
with the hybrid seeds also because of disease.
As to profitability, farmers readily cited the price of rice and inputs as
major factors. They claimed that prices of fertilizers and chemicals and rates of
labor kept rising but the price of rice remained low. Even the NFA price of P11
per kilo could not be taken advantage of by the farmers because of other
problems related to the NFA buying system that prevented the farmers from
selling to the NFA. Most farmers who sold part of their crop brought them to local
buyers other than the NFA. And if the buyer advanced money to the seller,
additional price discounts further lowered the net proceeds.
The Mango Subsector
Scope of the Mango Industry in Ubay. Like the national situation,
mango production in Ubay was generally small hold except for a very few large
plantations. Almost all barangays in the municipality had occasional mango trees
or clusters of mango trees planted. There were relatively large plantations like
the Lucky Agriventures farms, which reported 7,000 trees. Several farmers had a
few hundred trees. The total estimated number of growers was 41014 (App.
Table 9). In general, mango production in Ubay was measured in number of
13 Income and Expenditure Survey. 14The records of the MAO were based on those who signified membership in the Mango Growers’ Association. It was reported that several growers did not bother to join because they
44

trees planted rather than area planted. Per record of the MAO, there were
reportedly 18,200 bearing and 7,000 non-bearing trees. As of year 2002, the
total land area planted to mango was 504 hectares with an estimated average
yield per tree of .50 - 1.2 metric tons15. Based on the survey taken by the Bureau
of Agricultural Statistics in 2002, the biggest mango-growing municipality in Bohol
was Ubay and the biggest barangay growing mango in Ubay was San Pascual16
(See Figures 10 & 11). The total estimated production of mango in Ubay for
2000 was 1,260 mt with an estimated value of P25,200,000.00 pesos.
Production System. Mango seemed unique in its production system
because many planters relied on contractors for production. Contractors, in turn,
if they were not financially independent relied on financiers who were either bulk
buyers or plain financiers to defray the costs for labor and chemicals. These
financiers got a certain percentage of the gross. Some contractors were also
buyers. In the end, the planters were reduced to receiving only a smaller
percentage, usually 25-33 percent of the net income leaving most of the income
to the contractors and financiers.
Production was generally expensive and it involved several groups of
workers. A contractor would have a few or many people working with him
depending on the size of his operation. Most of the work of his group involved
spraying. From flower inducement to pest control and fertilizer application, a
season could necessitate from eight to twelve sprayings. In addition, the bagging
and harvesting would be done by a separate set of workers. As the fruits were
approaching harvest, a planter or contractor may hire guards to protect the trees
from thieves. As the fruits were harvested, laborers would also be hired to
could not see any advantage from joining. Therefore, the total reported was less than the actual number of growers. 15The records for mango could not be reconciled depending on the source. Given the problems of the industry, it is probably the lower estimate that is more accurate. 16Records from the local agriculture office showed that the biggest number of trees were planted in Barangay Gabi.
45

Fig. 10. Mango production areas in Bohol
Fig. 11. Mango production areas in Ubay
46

remove the baggings and haul the fruits, and finally, the escojedor or sorter was
hired to segregate the fruits based on the accepted classification standards. The
arrangements took many configurations and sharing percentages had evolved as
the costs had escalated. If the owner acted as guard of his own trees, he was
paid separately for the job.
The Division of Labor in the Mango Industry. A local informant
described the mango industry not as a complicated but a “convoluted” system.
He said there were just too many players who were not supposed to be there. A
brief characterization of each player would be in order:
Planter – one who owned the tree or plantation. He/she got one third of
the net income.
Contractor – one who contracted the production of fruits. He/she took
charge of the operations from flower inducement, fertilizer application, pest
control to harvesting. He/she got one third of the net income.
Financier – one who provided the financial requirement of the planter or
contractor. He/she got one third of the net income.
Hired workers – those either working for the contractor on a daily wage or
contract basis. They include sprayers, baggers, guards, harvesters, haulers, etc.
The rates varied according to task. For example, sprayers were paid P150.00
pesos per day, baggers were paid P150.00 pesos per 1,000 fruits bagged,
harvesters were paid P200.00 pesos per day. Guards used to get 10 percent of
the net but were now hired on a daily basis.
Buyer – one who bought the produce either as wholesaler, exporter or
middleman.
Canvasser – one who worked for the planter or contractor to canvass for
potential buyers.
Escojedor or sorter – one who works for either the planter, contractor or
buyer to classify fresh fruits according to an accepted classification system.
47

Retailer – vendors who sold directly to consumers. Some of them were
bought directly from contractors or planters. Others sold on commission from
planters.
Technology Flow. Most of the production technology resided with the
contractor. Many planters generally knew the production process but were
ignorant of its many details. It appears that many contractors in Ubay were not
native to the area. Many of them came from Cebu and were experienced mango
growers themselves. They alleged that mango trees planted near coastal areas
produced better fruits. Many of these contractors did not share technologies
because of the stiff competition involved. It was the unexpressed desire of each
of them to outdo each other in order to corner the market and keep the price
high. Some contractors reportedly shared information with other farmers but
others were very secretive even to the owners and financiers to the extent that
labels were removed from bottles of chemicals to keep them ignorant of the exact
kind used. One contractor expressly reported that he never shared technologies
with others because it is his trade secret. Contractors relied mostly on their
experience. In addition, private company representatives provided them and
planters with a host of products which they tried for efficacy every now and then.
In the end, many of them used a mix of products considering not only efficacy but
also cost and the capacity of the financier to finance the operation. A large
operation necessitated a four-wheel vehicle for hauling the supplies and
equipment to the site. Since water was a very important requirement, the vehicle
was even more important if the site was far from the water source. Spraying was
mostly done using power sprayers.
In Ubay, some planters obtained technological information from a
government employee who was not formally assigned to work with the mango
industry but had had experience and training on mango production having been
assigned to work on the commodity formerly. She was also a planter. Many
planters shared information among themselves. They also got information from
salesmen from different companies. Since the local extension service did not
48

have any expertise on mango, they were not tapped as a source of technology
although they provided seedlings on loan to planters under the Plant-Now-Pay-
Later (PNPL) scheme. The many industry players, planters, contractors,
financiers, shared information as shown in the diagram below:
Planter
Private
Salesmen
Financier (planter buyer,
contractor)
Planter (contractor, financier)
Contractor (buyer,
financier)
Gov’t. Source
Fig. 12. Technology flow for mango
Production Costs. Shown below is a sample of the cost of production by
some growers in Ubay as of 2003. The cost ranged from P637.00 to P6,184.21
pesos per tree and from P.12 to P4.12 pesos per fruit. The details of the cost
breakdown revealed that most of the cost was for the chemicals for pest control.
Further examination also revealed that some labor costs were not reflected by
three planters thereby lowering their costs and causing the wide variations in the
total cost estimates. Nevertheless, it can be seen that the cost of production was
generally high especially for those with many trees although on a per tree basis
the cost was within the reach of small growers (Table 21).
49

Table 21. Production costs as reported by some Ubay mango planters, 2003. Prod.
Plan No of fruits/ ter trees tree Cost
% % Input Labor Total 500 5000 253,000.00 79.43 65,500.00 20.57 D B 318,500.00
50 1000 51,169.50 96.50 1,855.00 3.50 G E 53,024.50406 5000 732,147.92 87.21 107,397 12.79 J S 839544.92104 5000 158,336.00 78.96 42,186.20 21.04 E L 200522.20750 2500 1,286,100.00 98.00 26,250.00 2.00 L P 1,312,350.00
1,800 1500 9,385,012.00 84.31 1,746,560.00 15.69 L A 11,131,572.00227 4000 567,387.57 99.56 2,528.78 0.44 D P 569,916.35115 1800 75,844..80 61.41 47,660.00 38.59 T S 123,504.80
Source: CENVIARC
Table 21. Continued …
Prod. Plan No of Fruits/ ter trees tree Cost
Cost/fruit Total Cost/tree 500 5000 0.1274D B 318,500.00 637.00
50 1000 1.06049G E 53,024.50 1,060.49 406 5000 0.413569J S 839544.92 2,067.84 104 5000 0.38562E L 200522.20 1,928.09 750 2500 0.69992L P 1,312,350.00 1,749.80
1,800 1500 4.122804L A 11,131,572.00 6,184.21 227 4000 0.627661D P 569,916.35 2,510.64 115 1800 0.596642T S 123,504.80 1,073.95
Marketing. Mango in Ubay was generally marketed to Cebu as many
wholesalers, processors and exporters were based there. Some financiers were
also buyers. Some were planters, contractors and buyers all in one. Planters and
contractors sometimes shared fruits and not cash and sold to different buyers.
Some small planters sold directly to consumers. Large producers usually hired
canvassers who scouted buyers from within and outside. The bulk buyers also
sold to exporters, retailers and processors. Informants reported that there was
practically no problem with markets for mango insofar as the ability of the market
to absorb the produce was concerned. The major problem in marketing was
price, which usually went very low to P10 pesos per kilogram during the peak
season. Planters and contractors claimed that at this price, they already lost their
profits. One informant even considered P22 pesos per kilo a bad price and P28
pesos a good one. In some cases, prices could go as high as P38 pesos per kilo.
50

The three major categories of fruits in the market were Export, Good, LO
and rejects. The export quality were those that had the correct size, maturity and
appearance. Good were those that were not accepted for export because of the
relatively smaller size while the LO were those below Good which were still sold
as fresh or for processing. The rejects were those not suitable for the market
because they were either damaged or infested with pest or disease or whose
appearance was not suitable for sale. The classification, however, was another
source of mistrust among industry players because it was very arbitrary. The
escojedor made the decision where a fruit belonged. Planters, contractors and
buyers had their own escojedors and it was expected that the escojedor
protected the interest of his employers.
Canvasser
Exporter
Retailer
Processor
Planter
Contractor
CONS UME RS
Buyer
Fig. 13. Marketing flow for mango
Production Constraints. Several constraints were reported by planters,
contractors and financiers. It could be seen that the single most important
constraint was pests and diseases. Several planters were asked to rank these
constraints and it is obvious from the result that pests and diseases were the
51

predominant constraints. Others included the weather, and, associated with
pests and diseases, the high cost of chemicals (Table 22).
An informant was concerned with what he termed the “convoluted” nature
of the mango industry. He said there were just too many players that in the end,
the planter really lost in the end. And the percentage share of the planters were
generally expected to go down to 25 percent as contractors and financiers
demanded higher returns for their investments. In many cases, however, the
absence of written contracts may have created a constraint in itself because
when the crop failed, only the contractor and the financier lost real money and
with the uncertainly of success, either through production failure or marketing
losses financiers may not fully spend to maximize yields. Under this system of
no contracts, all players except the hired workers and the input dealers lost when
the crop failed.
Table 22. Major constraints to production ranked by selected planters, 2003.
Constraints (Ranked) No of trees Planter 1 2 3 4 5 No data Dry weather Piti piti Bao bao Worm C R
High cost of Pesticide
Bad weather 500 Price D B
500 Piti piti Twig borer Fungus Fertility Drought G E 50 Piti piti Bao bao Fertility B S
6 Heavy rain Piti piti J S 406 Dry weather Wind Pest E L 104 Fruit drops Hopper Rain Drought L P
High cost of 750 Drought Rain pesticides Wind Buti/Lapinig L A
High cost of Pesticide 1,800 Pest L S
350 Piti piti Bao bao Fruit fly D P 227 Piti piti Bao bao Worm T S
Bad weather 115 Piti piti Lapinig Bao bao VA
Source: CENVIARC
An informant was concerned with other issues affecting plantation
agriculture. One was agrarian reform. He claimed that agrarian reform would
discourage others to invest in mango production on a larger scale for fear that
their farms would be covered by the reform. He was further concerned by the
52

reported Bureau of Internal Revenue (BIR) interest in their income statements.
Other industry players lamented the seeming the lack of local and national
government support to the industry. A marketing problem was reportedly the
cartelization of the mango market. It was claimed that buyers had a cartel and
planters and contractors were at their mercy. One significant local planter
reported that if he did not inherit the plantation, he would not go into mango
production and his projections for the entire mango industry was not rosy.
Because of the problems cited above and the inconsistency of the production
season. There were years when they experienced no production at all and there
were also those when only a part of the plantation produced.
A suggested role for the government was in research, regulation and
information dissemination. It was suggested that the government promote,
support and regulate the production of good quality planting materials, regulate
the standards for marketing and sponsor fora where planters and other industry
players could exchange ideas and discuss issues affecting the industry. It was
even suggested that organic technologies be introduced to the industry.
Other Subsectors
Coconut. Coconut was the second major agricultural crop of Ubay. A
total of 1,480 hectares or 11.42 percent of the total agricultural land were planted
to coconuts. Coconut products in Ubay were usually sold in the form of copra,
which provided cash income to coconut farmers. Other coconut products were in
the form of lumber and tuba (toddy) that can be easily disposed at the local
market. The municipal government of Ubay in cooperation with the provincial
government of Bohol was establishing a coconut decorticating plant in barangay
Katarungan. Budgetary limitations had delayed the completion of the plant. The
coconut subsector was estimated to contribute P14,208,000.00 pesos to the local
economy as of 2000 (Table 23).
53

Rootcrops. Rootcrops ranked as the third major crop of the municipality
in terms of land area, occupying 1,403 hectares or 10.82 percent. Rootcrops
such as cassava, sweet potato, taro and yam were commonly grown in the
upland barangays and were principally consumed at home as food for humans
and feed for animals. The average yield per hectare was estimated at 8.0 metric
tons per hectare with a total annual production of 11,224 metric tons. A total
estimated value of about P45 million pesos was generated from rootcrops in
2000 (Table 23). Cassava was the most common followed by sweet potato.
Cassava occupied an estimated 720 hectares (2004) and 400 hectares were
covered by contract growing schemes with Philstarch Corp., a cassava-flour
manufacturing firm based in Carmen, Bohol. The company had its own
technology package embedded in its contracting program. The company also
provided incentives to communities involved in its contracting program. The
barangay with the biggest area was given a two-room school building while the
municipality was given a set of computer and printer.
Cassava outside of the contracting scheme was sold in the local market
as fresh or grated and dried for feed. The majority of the produce, generally was
used as food at home.
Corn. Among the major crops of the municipality, corn was one of the
most important and dominant commodities. This was primarily because corn
was one of the staple foods next to rice. White corn was the most commonly
produced and used mainly as food. Yellow corn, which roughly constituted 20
percent of the total area was under a contracting scheme of Altura’s, which
operated a feed mill based in Ubay. The area planted to corn was 500 hectares
as of year 2000 under the corn production cluster program of the Department of
Agriculture. Corn productivity was at 1.7 metric tons per hectare, which was
reportedly higher than the national average of 1.35 metric tons per hectare. The
value of corn produced as of 2000 was estimated at P8.5 million pesos (Table
23).
54

Legumes. Legume crops occupied an area of approximately 240 hectares
with an estimated annual yield of 720 metric tons and an estimated production
value of P5.7 million (Table 23).
Vegetables. Vegetable crops commonly grown in the municipality
included eggplant, ampalaya, squash, okra and tomato. Approximately, 26
hectares were devoted to vegetable production in 2000 with a total production
value of P783,000.00 pesos (Table 23).
Table 23. Area, production and value of production of various crops, Ubay, 2000. Production Crop Area % to total
Ag. Land (hectare) Total (kg) Value (P) 6,249.00 48.21 34,725,000 138,900,000.00Rice
Irrigated 1,160.00 8.95 9,280,000 37,120,000.00 Non-Irrig. 5,089.00 39.26 25,445,000 101,780,000.00
500.00 3.86 1,700,000 8,500,000.00Corn 26.10 0.20 78,300 783,000.00Vegetables 1,403.00 10.82 11,224,000 44,896,000.00Rootcrops
Industrial Crops 1,984.00 15.31 3,036,000 39,408,000.00 Mango 504.00 3.89 1,260,000 25,200,000.00 Coconut 1,480.00 11.42 1,776,000 14,208,000.00
240.00 720.00 5,700,000.00Legumes 2,558.90 19.74 7,676,700.00 53,736,900Other Crops
TOTAL 12,961.00 100.00 59,160,000.00 291,983,900Source: MAO, Ubay
The Poultry and Livestock Subsector
Livestock and Poultry Farms and Inventory of Livestock and
Poultry. There were five (5) livestock and poultry farms operating in the
municipality located in Barangay Fatima, Gabi, Calanggaman and Tuburan
covering a total land area of 104 hectares and employing 45 people (Table 24).
The total population of livestock and poultry was relatively large with swine
as the most common livestock and a good number of carabaos and cattle were
also reported (Table 25). The number of large livestock in the area may be
explained by the sizable area for pasture. Land resource inventory indicated that
55

the municipality had a total land area of 14,603.80 hectares of open
grassland/pasture land, which was equivalent to 49 percent of the total land area.
About 3,635 hectares or 25 percent of total grassland/pasture land were
intensively utilized as pastureland. These pasture lands were located in
Barangays Tubog, 20 hectares, Katarungan, 15 hectares and San Vicente 3,600
hectares. The rest of the areas, of approximately 10,968.80 hectares, were
occasionally used for livestock grazing.
The livestock farmers were assisted by the Barangay Livestock Aides
(BALA), composed of volunteers who were trained by the Provincial Veterinary
Office (OPV). The BALAs were also tasked to monitor the livestock dispersed to
the farmers by the national and local governments. 17Table 24. Livestock and poultry farms in Ubay, 2000.
Name of Farm Location Area (has.) No of Employees Cecilia’s Farm Fatima 1.00 2 Hector Yu Calanggaman 1.00 3 Lucky Agriventure Gabi 100.00 40 Orjalera Farm Tuburan 1.00 0 Perkins Ong Calanggaman 1.00 0
Total 104.00
Table 25. Inventory of livestock and poultry, Ubay, 1998-2000. Number Type
1998 1999 2000 5,100 5,256 5,365 Cattle 7,940 8,200 8,586 Carabao 25,300 25,900 26,150 Swine 2,700 3,100 3,752 Goats 35,200 49,200 30,376 Poultry 4,200 2,650 3,176 Others
Total 80,440 94,306 77,405
UBAY SMALL RUMINANT RAISERS ASSOCIATION (USRRA) • Organised by PCC - Ubay in coordination with the Office of the Provincial Agriculture and
Office of the Municipal Agriculturist. • Ubay was the first municipality in Bohol to organize such organization last May 20, 2004 • The members were to be updated with the new technologies in livestock production by
the PCC personnel.
17 This is another example of the lack of proper data in the local extension service. The more important information about livestock operations should have been number of heads, not area.
56

The Fishery SubSector Marine and Aquaculture Fisheries. Ubay was a significant fishing town
with 19 of its 44 barangays located along the coast. The total number of
fishermen had declined probably due to decreasing catch. Various fishing gears
had been used by fishermen to catch fish. For the year 2000, estimated fish
production of 456.25 metric tons in municipal fishing grounds was reported. The
average fish catch was estimated at 2.5 kg per day for non motorized and 6 kg
per day for motorized fishermen. The average for all fishermen was 1.75 kg per
day. The predominant species of fish caught in the coastal waters of Ubay were
Anchovies, Emperor Beams, Flying Fish, Fusiliers, Banana Fish, Needle Fish,
Goatfish, Groupers, Halfbeaks, Jacks, Cavallas, Crevalles, Mojarras, Mullets,
Rabbitfish, Sardines, Scads, Slipmouths, Ponyfish, Snapper, Sea Perches,
Squirrelfish, Soldier fish, Surgeonfish, Unicorn fish, Threadfin breams, Tuna
Mackerels and Wrasses. Aquaculture included brackish water fishponds, fish
cages, and fish pens utilizing an estimated area of 1,618 hectares. A total of
1,405 ha. were devoted to milkfish (bangus) production by 82 fishpond operators.
Production from aquaculture in year 2000 was estimated at 1,294 metric tons.
In 2000, the total estimated value of fisheries products was more or less P70
million pesos (Table 26).
Table 26. Type, area, location, production and value of fishery products, 2000.
Source Location Area Total Annual Value (P) (ha) Catch (kg.)
Municipal Fishing
20 Coastal & Island Bgy. 20,297 456,250 18,250,000
Fishpond 19 Coastal Bgy. 1,618 1,294,160 51,766,400 Fish Cages Juagdan - - -
1,750,410 70,016,400 TOTAL Source: MAO
The fishery subsector was suffering in terms of declining catch, hence, low
incomes for fisherfolks because it was beset with problems as articulated in a
participatory workshop as follows: illegal fishing, illegal extraction of sand,
pollution and improper waste disposal, extraction of corals, illegal cutting of
57

mangroves (estimated total mangrove area: 79 ha), illegal fishpond construction,
and weak enforcement of laws.18 Nevertheless, several initiatives had been
started in Ubay such as mangrove reforestation and a renewed law enforcement
program. The latter was evidenced by the relatively large appropriation of about
three million pesos for coastal protection. In addition, the local government had
activated a Coastal Enforcement and Protection Unit (CEPU). This unit had
been manned with additional staff and equipped with modern gadgets such as a
fast boat, Geographic Positioning System (GPS). A permanent staff detached
from the agriculture office had been assigned and new staff (casual) had been
hired. A compliment of police personnel joined the frequent patrols, which had
been done by the staff. A reactivated Coastal Law Enforcement Council (CLEC)
comprised of five municipalities under the leadership of the Mayor of Ubay,
provided additional impetus for the coastal protection programs. Unfortunately,
fishery resource management programs had yet to be implemented to provide
increased incomes for the fishermen. On the part of aquaculture, the industry in
Ubay was largely private sector-led.
Fishermen’s Organizations. There were 20 Fishermen’s Associations in
Ubay whose members depended on fishing, fish vending and other fishery
related activities as source of livelihood. Many of these associations, however,
had no tangible projects which could help increase the productivity nor provide
alternative livelihood for their members (Table 27). The Fishermen’s Associations
were still under the supervision of the Municipal Agriculture Office even as the
coastal protection program was administered by the CEPU.
Table 27. Fishermen’s Associations in Ubay, 2000. 18Extracted from CRM Planning Workshop Planning Documents, 2004. Source: MAO, Ubay.
58

Name of Organization No. of Members Achila Fishermen’s Association 42 Biabas Fishermen’s Association 30 Cagting Fishermen’s Association 29 Camambugan Fishermen’s Association 24 Cuya Fishermen’s Association 40 Fatima Fishermen’s Association 142 Guintaboan Fishermen’s Association 59 Humay-humay Fishermen’s Association 70 Juagdan Fishermen’s Association 47 Katarungan Fishermen’s Assoc. 22 Pangpang Fishermen’s Assoc. 71 San Isidro Fishermen’s Assoc. 45 Sentinela Fishermen’s Assoc. 28 Sinandigan Fishermen’s Assoc. 61 Tapal Fishermen’s Association 25 Tapon Fishermen’s Association 41 Tintinan Fishermen’s Association 35 Tipolo Fishermen’s Association 31 Union Fishermen’s Association 38 Poblacion Fishermen’s Assoc. 39
Factors Affecting Sectoral Performance
Many factors affected the performance of each subsector. In the rice
subsector the following factors were significant determinants:
Irrigation. The rice subsector had been the most dominant in Ubay
agriculture. Yet more than 80 percent of the areas planted to rice was not
irrigated which means that the number one limiting factor was irrigation.
Irrigation in Ubay will be increased tremendously with the completion of the
Bayongan Dam which will irrigate an additional 3,353 hectares expanding to 17
barangays of the town (Table 28) nearly quadrupling the present irrigated area.
Since the irrigation system will also entail expanded road networks, the overall
physical infrastructure in Ubay will improve further, thus contributing to the
increased productivity of the rice farmers. Within the existing irrigated areas,
59

however, the many problems faced by the NIA in the maintenance of the physical
facilities and the weakness of the irrigators associations will undermine the
efficiency and viability of the systems in the long run.
Table 28. Barangays in Ubay covered by the Bayongan Dam Project.
Barangay Area to be Irrigated
Barangay Area to be Irrigated
Bay-ang 102 Hambabauran 208 Bood 89 Humayhumay 35 Bulilis 490 Lomangog 187 Calanggaman 324 Pag-asa 169 California 276 Poblacion 60 Camalian 229 San Pascual 69 Camambugan 80 Tubog 180 Casate 284 Tuburan 213 Gabi 358 Sub total 3,353
Source: NIA
Prices of Inputs and Access to Capital. The expansion of irrigation will
still be limited by technology not only in terms of the lack of technology itself but
by the lack of resources to acquire these. The high cost of new seeds,
particularly hybrid seeds, fertilizers and pesticides had hampered production
even in irrigated areas. The number of farmers planting hybrid rice, for example
had steadily declined since its initial year reaching its lowest so far. Only 16
farmers planted hybrid rice for dry season (DS) 2005. It should be mentioned that
there were not many sources of cheap capital in the locality.
Technology. Many rice farmers in Ubay already practiced “modern”
technology. They planted new varieties, used fertilizers, pesticides, and other
new cultural management practices. They learned these from other farmers as
well as from extension agents through individual consultations and seminars. Yet
many farmers still did not practice precision in their use of technology. Many
material technologies were used only partially such as fertilizers. One important
technology that seemed to elude Ubay farmers was one searched for by the
BIAPP—a rice-based system that can deal with the inadequacies of water during
60
the dry season. This inadequacy was compounded by the soil structure in some
areas where sand was a substantial soil component such as those near the
coastal areas.
Most Ubay mango planters were dependent on contractors and private
companies for technology. Therefore, these technologies had been limited to a
few individuals and if the individual planters did not have access to these, the
mango industry as a whole will suffer since productivity of the industry will
depend only on a few who had monopolized knowledge. In addition,
technological solutions to problems such as pests must be done at the precise
moment or else the whole crop may fail. Even the most confident contractor
could not guarantee success because according to him, everything depends on
factors beyond his control such as the occurrence of a sudden rain or extended
drought. Such seemingly minor technical details as in the removal of ants from
the skin of the fruit or a day’s delay in the application of pesticide could do minor
or extensive damage to the product. A contractor expressed pity on those
planters who he said knew nothing about mangoes except only count or eat the
fruits.
Land Tenure. Removing land rents from the expenses of the farmers,
incomes could significantly increase. Tenure will also affect farmer’s attitude
towards permanent farm investments. There is still much scope for agriran
reform in Ubay. The municipality had approximately 4,292 hectares of land
available for reform. These represented 33% of the total agricultural land. These
lands were primarily planted with rice, corn, coconut, banana, fruit trees, root
crops, legumes and vegetables. These areas were found in 34 barangays with
total beneficiaries of 2,317 (Table 29 and App. Tables 10 &11). There were
Agrarian Reform Communities (ARCs) in the municipality including the
barangays of San Francisco and Bulilis (from 1998 to 2004, Phase IV); and
Benliw, Cagting, Imelda and Sinandigan starting in August 2004.
61

It had been alleged that agrarian reform will eventually discourage
investors from investing in plantation agriculture. Local mango planters were
weary about the prospects of their farms being covered by reform.
Table 29. Land acquisition and distribution as of April 2002.
Item Scope Deduct Working Scope
ACCOMPLISHMENT BALANCE -ible
Dec. 31, 01
April 2002
Year to Date
Net
OLT 117.918 0.7898 117.13 84.4535 3.0817 87.54 0.5934 VOS 43.4678 43.468 38.1861 38.19 5.2617 CA 85.00 85.00 0 85.00
VOS 13.6873 13.687 13.6873 13.6873 CA 115.223 35.771 79.451 0
VOS 15.2582 15.256 15.256 15.26 CA 207.846 59.066 148.77 19.9792 2.173 22.15 126.63
BLT/ 22.789 16.566 16.57 6.2232 DPS
PAL<5 207.846 0 VOS 22.7692 0 GFI 110.606 86.335 24.251 14.0967 14.1 10.154
TOTAL 939.622 181.98 549.8 202.225 3.0817 2.173 207.5 313.31 Source: MARO, Ubay There were issues that needed to be resolved in order that agrarian
reform could proceed smoothly in Ubay. These include:19 1. the lack of approved
Cadastral survey in almost all of the barangays, hence, properties were still
untitled; 2. some farmer beneficiaries refused to be installed due to loyalty to the
landowner; and, 3. delay in the implementation of CARP due to the pending
petitions of landowners. Other issues include the relocation of Barangay Los
Angeles which was to be flooded by the Bayongan Dam; the resolution of the
struggle of the militant farmers’ organization Hugpong sa mga Mag-uumang Bol-
anon (HUMABOL) for the Ubay Stock Farm to be distributed to farmers; and the
surrender as collateral of the Original Certificates of Title of farmer beneficiaries
to Palm Inc., the oil palm investor.
Markets and Prices. Market for mango had been less problematic
except for the low prices during the peak of the harvest. Marketing had been
almost controlled by the contractors because this had become part of most
62

contracts. Since many of these contractors had contacts with buyers, financiers
and retailers, the problem of disposing of their products had been relatively
easier. Their problem with export buyers was that prices for seemingly right-sized
fruits had been allegedly manipulated to appear as if they were lower class
quality, thus, lowering the price further. They alleged that even substandard sized
fruits could be sold to processors. Their most sought after target was production
during the second semester. They felt that if they could only harvest from
September to December, they cold make a large profit because the price of
mangoes at this time increased to 100 percent or more than prices during the
peak season in the summer months. However, their problem was rain as the
rainy season began in June and continued until December. With constant rain,
they were afraid all their labor and inputs would go to waste. Even during the dry
season, crops could fail. One minor financier reported she lost nearly
P100,000.00 pesos in one season and did not attempt to venture into financing
again.
Government Support. Informants reported that there was very little that
the government had done for the industry, at least in Ubay. Except for the
occasional meeting among planters, no other forms of assistance had been
rendered by the government to them. The local extension service had no
expertise in mango production and even requested planters and contractors
occasionally to share their technologies to others during meetings. One informant
confided that if there was any tangible intervention that the government might do
for the mango industry, it was technology in the control of a certain disease
locally called “butig butig” (black spots) on fruits. Another suggested that the
government should assist them in the prices of produce but admitted that nothing
could be done by the government on this aspect because it is governed by
market forces.
19 As reported by the local Dept of Land Reform Office.
63

Prospects for the Agriculture Sector
Present and Projected Agricultural Production. In the early years of
the Estrada administration, agriculture offices made projections in relation to their
food security plan. With year 2000 as the base, projections were made up to
year 2012. In Ubay, crop production was projected to increase annually by three
Table 30. Present and projected agricultural production, 2000-2012.
Production in metric tons (mt) Product 2000 2001 2002 2003 2004 2005
Rice 34,725 35,767 36,840 37,945 39,084 40,256 Rice (Irrigated) 9,280.00 9,558.40 9,845.15 10,140.51 10,444.72 10,758.06 Non-Irrigated 25,445.00 26,208.00 26,994.60 27,804.44 28,638.57 29,497.73 Corn 1,700 1,751.00 1,803.00 1,857.64 1,913.36 1,970.77 Vegetables 78 80.34 82.75 85.23 87.79 90.42 Rootcrops 11,224.00 11,560.72 11,907.54 12,264.77 12,632.71 13,011.69 Industrial Crops
3,206 3,302.18 3,401.25 3,503.28 3,608.38 3,716.63
Mango 1,430 1,472.90 1,517.09 1,562.60 1,609.48 1,657.76 Coconut 1,776 1,829.28 1,884.16 1,940.68 1,998.90 2,058.87 Legumes 720 741.60 763.85 786.76 810.37 834.68 Other Crops 7,472 7,696.16 7,927.04 8,164.86 8,409.80 8,662.10
Source: MAO, Ubay
Table 30. …continued. Production in metric tons (mt)
Product 2006 2007 2008 2009 2010 2011 2012 Rice 42,707 43,989 45,308 46,667 48,068 49,510 50,995 Rice Irrigated
11413.23 11775.6
3 12108.3
0 12471.54 12845.69 13231.06 13627.99
Non-Irrigated
31294.14 32232.9
6 33199.9
5 34195.95 35221.83 36278.49 37366.84
Corn 2090.79 2153.51 2218.11 2284.66 2353.20 2423.79 2496.51 Vegetables
95.93 98.81 101.77 104.83 107.97 111.21 114.55
Rootcrops
13804.10 14218.2
3 14644.7
7 15084.12 15536.64 16002.74 16482.82
Industrial Crops
3942.98 4061.26 4183.10 4308.60 4437.85 4570.99 4708.12
Mango 1758.72 1811.48 1865.83 1921.80 1979.45 2038.84 2100.00 Coconut 2184.26 2249.78 2317.28 2386.80 2458.40 2532.15 2608.12 Legumes
885.51 912.07 939.44 967.62 996.65 1026.55 1057.34
Other Crops
9189.62 9465.31 9749.27 10041.74 10343.00 10653.29 10972.88
64

Source: MAO, Ubay percent, livestock, and poultry by 5 percent since it was perceived to be the most
dynamic due to technological advances. The fishery sector was projected to
increase by 1.3 percent due to rehabilitation measures to be initiated and
established addressing the problems cited above (Table 30). It appears, though,
that the projection for rice did not take into account the tremendous increase in
the irrigated area after the Bayongan dam will have been operational.
Demand-Supply Balance. In the year 2000, rice and corn production was
deemed sufficient with a sufficiency level of 491 percent while fish, meat and
poultry had a sufficiency level of 181 percent. Starchy roots and tubers had a
sufficiency level of 313 percent. Vegetables and fruits were insufficient supplying
only 34 and 85 percent respectively of the total requirement of the municipality
(Table 31).
Table 31. Existing resource supply and demand in the municipality, 2000.
Year 2000 Food Item Remarks Standard Per
Capita Require
ment
Existing Existing Balance Supply Demand
(kg) (kg)
Rice/Corn Production
124 36,425,000 7,418,548 29,006,452 surplus
Fish, Meat and Poultry
54 5,862,532 3,230,658 2,631,874 surplus
Starchy roots and tubers
60 11,224,000 3,589,620 7,634,380 surplus
Vegetables 39 798,300 2,333,253 (1,534,953) deficit Fruits 28 1,430,000 1,675,156 (245,156) deficit
Source: MAO, Ubay
Projected Demand-Supply Balance. By the year 2007 and 2012, the
demand-supply parameters will assume a similar trend. Deficits will still be
experienced in vegetables and fruits. Technological advances in rice and corn
and the doubling of the irrigated area may boost the production of rice to higher
than 3 percent after the completion of the Bayongan dam (Table 32).
65

Table 32. Projected resource supply and demand in the municipality, 2007-12.
YEAR FOOD SPCR ITEM 2007 2012
Projected Supply (kg.)
Projected- Demand
(Deficit)/ Projected Supply
Projected Demand-
(Deficit)/ Surplus Surplus
(kg.) (kg.) (kg.) Rice/ 124 44,798,156 9,341,664 35,456492 51,933,340 11,013,556 40,919,78
4 Corn Fish, Meat, Poultry
54 7,702,214 4,068,144 3,634,070 9,428,650 4,796,226 4,632,424
Starchy roots & tubers
60 13,804,104 4,520,160 9,283,944 16,002,740 5,329,140 10,673,600
Vegetables
39 981,808 2,938,104 (1,956,296) 1,138,185 3,463,941 (2,325,756)
Fruits 28 1,758,720 2,109,408 (350,688) 2,038,838 2,486,932 (448,094) SPCR - Standard Per Capita Requirement Source: MAO, Ubay
The projections cited above perhaps assumed that present trends in
technology and business will prevail over the period from 2000 to 2012. There
were recent developments, which may affect the direction for particular crops.
Prospects for Rice. The prospects for the rice subsector in Ubay are
mixed. On the positive side, the irrigated areas will more than double after the
completion of the Bayongan dam. The introduction of hybrid rice and the
adoption of promising technologies such as System of Rice Intensification (SRI)
could lead to higher productivity. The biggest obstacles will be the lack of capital
for many farmers. Irrigation will still suffer from the many social problems
associated with water allocation, collection of users’ fees and system
maintenance. Nevertheless, the local extension service, NGOs and the farmers
themselves were continuously searching for alternative measures such as low-
input and organic technologies to maintain productivity. Overall, production and
productivity will increase but prospects for optimizing yields will still be minimal
because of the limitations mentioned above.
66

Prospects for Mango. As reported, there had been continuing planting of
mangoes in Ubay as well as in other areas of the province. However, the
productivity of the mango industry will depend on precision technologies and a
favorable market environment. Production will increase over the years but the
productivity of the industry will remain problematic. Increases in labor and input
costs will continue to hinder production even as prices remain steady and
competition will increase as other areas also increase their outputs. One major
consideration for mango producers is the risk of pesticides and chemicals used
extensively in the industry. It was reported that in some cases, producers would
spray as many as eight to twelve times in one season using various chemical
cocktails. On top of this, It had been observed that improper and inadequate
safeguards were practiced. For example, spraying was done with minimal
protection of the workers who bathed in the sprays they applied owing to the size
of the trees. Many trees and plantations were also close to settlements such that
the populations of these settlements were exposed to the chemicals during
spraying. This was the main reason the MAO, who also owned a few trees, was
reluctant to have her trees sprayed.
Planters and contractors were hoping for the expansion of the export
market and the establishment of more processing plants that could assure a
steady market and fair price for their products. One informant assessed that
there was still a huge market for mangoes and that it can absorb all present and
future produce.
Prospects for Fisheries. The trend in fisheries productivity will probably
continue to decline as a result of the problems discussed earlier. The municipal
government along with other municipal governments in the second district had
activated its coastal enforcement activities and these were expected to result in
the reduction if not elimination of illegal fishing. The measures adopted included
intensified sea patrols, arrests and filing of cases of violators, intensified reporting
by local residents using mobile phones and other means, market denial for
illegally caught fish and coordination with other local governments and agencies
67

based in Leyte. The local government of Ubay alone invested in additional
persons and equipment to strengthen its coastal enforcement activities.
Unfortunately, the activities to increase production in terms of new production
technology dissemination for mariculture, fish capture and aquaculture were nil.
68

CHAPTER 4
SUPPORT SERVICES
Government Agencies Providing Support Services to Ubay Farmers
Ubay was uniquely endowed with a large number of agencies in
agricultural research and extension that complemented the work of the small
Municipal Agriculture Office. These agencies include the following
1. Central Visayas Integrated Agricultural Research Center
(CENVIARC). CENVIARC operated several agricultural facilities in Ubay. Its
ultimate goal was to develop sustainable agriculture thereby improving the quality
of life of farmers and fisher folks. Its plans and programs included the following:
• Technology development;
• Production, distribution and marketing of quality seeds and planting
materials as well as improved genetic materials of quality animals and
fishery breeding stocks;
• Integration and dissemination of information on agricultural activities;
• Conduct of specialist training courses;
• Provision of laboratory services and technical assistance;
• Collaboration with national research centers and coordination of the
following Research Outreach Stations (ROS) in the region under it:
a. Bohol Experiment Station (BES). BES was an experimental station
located in barangay Gabi, Ubay. It had a complex comprising of offices,
conference hall, staff housing, storage facilities, dormitory, canteen, motor pool
and other buildings. Its production and experimental area of 100 hectares were
divided into the following components:
• Research area - 10 hectares
• Seed production area - 40 hectares
• Plantation crops - 45 hectares
• Building and road networks - 5 hectares
69

b. Soil and Water Research and Demonstration Station (SWARDS).
Located at Calanggaman, Ubay, and 6 km. from the BES, it had a total land area
of 114 hectares. Of the total land area, 10 hectares were devoted to rice seed
production, 2 hectares for water impounding, and 1 hectare for fresh water fish
nursery. The rest of the area was devoted to the development of contour
hedgerows and pasture for livestock.
c. Ubay Brackish Water Fish Farm (UBFF). This facility was located
at the town proper of Ubay. It had a total land area of 18 hectares with 8
hectares devoted to demonstration fishponds for bangus, blue crabs, grouper,
prawn, siganid and sea catfish. Ten hectares were intended for aqua-silvipasture
research and production.
d. Ubay Stock Farm. The Ubay Stock Farm had a mandate to conduct
applied research in the field of animal breeding, physiology, nutrition, health
management and livestock integration strategies in the hilly lands in order to
evolve better livestock production systems and extend them to LGUs, NGOs and
farmers. They were also supposed to produce genetically superior breeding
animals and forage and pasture species in support to the livestock industry. It
had a total land area of 3,600 hectares, the largest in the country.
2. National Irrigation Administration (NIA). The NIA maintained the
Capayas Irrigation System or the Bohol Irrigation Project I (BHIP 1) serving a
total area of 1,160 in the five Barangays of Casate, Calanggaman, Bay-ang,
Tuburan and Bood.
The Bayongan Irrigation System or BHIP 2 was added and funded by the
Japan Bank for International Cooperation (JBIC) having an approved loan of
P4.6 billion pesos. It was expected to supply irrigation water to an area of
approximately 4,140 hectares in 17 barangays of Ubay, and the towns of San
Miguel and Trinidad benefiting some 10,000 farmers.
70

3. Philippine Carabao Center (PCC). The PCC facilities were located
within the USF grounds. Its principal function was to improve the carabao
industry through upgrading of native stocks and milk production and processing.
It provided advisory and breeding services to clients within and outside Ubay.
4. Philippine Coconut Authority (PCA). The Regional PCA Nursery
produced coconut seedlings for distribution to farmers. With the recent favorable
trend in the prices of copra, it was noted that the demand for coconut seedlings
increased as farmers took a renewed interest in planting coconuts. An estimated
60 hectares were devoted to seedling production in Ubay alone.
Services Provided by Support Agencies and Organizations
Table 34 shows a list of public and private agricultural service providers
based in or serving Ubay and the kinds of services they provided. Most of these
were agencies under or affiliated with the Department of Agriculture. Their
services included:
Research. The various agencies under the DA such as BES and
SWARDS conducted research on crops such as rice and rootcrops; the USF on
the production of superior animal stocks through breeding and the UBFF was
engaged in testing new technologies in aquaculture, mariculture and other fishery
technologies.
Seed Production. The BES and SWARDS produced registered and
certified rice seeds for distribution within and outside Ubay. Fifty hectares were
devoted to seed production by the two stations. The PCA nursery also produced
coconut seedlings. There were also a total of seven 7 private seed growers in
Ubay.
71

Technical Support Services. Staff from the various agencies conducted
trainings or acted as resource persons in farmer trainings held either at the BES
PCC, and USF facilities. Other technical support services were provided through
the ecodemo farms within the Ubay Agripark (Table 33).
Animal Dispersal. The USF and PCC dispersed animals to a limited
number of farmers. Farmer recipients were required to undergo training,
organized and monitored. In addition, these agencies also provided breeding and
deworming services to clients in Ubay and other municipalities. An NGO, Heifer
International, at one time dispersed a few animals to the beneficiaries of the
NRDP program in Tuburan and had promised to give more.
Ubay Agri-Park FITS Center operates three main features:
The Ubay Agripark The Agripark was a joint project of the various agencies and the local government of Ubay. It is a facility purposely located within the reservation of the Ubay Stock farm, PCC and the Capayas Irrigation system. The park has facilities including a rodeo arena, a horse race tract, a swine breeding station, flower and ornamental garden, fish pond, training/meeting facilities, agrifair display area, miniforest and other facilities designed to combine and showcase in one place various technologies generated by the various agencies. It was also home to the FITS program under PCARRD_DOST. In order to attract more patrons to the park, the local government had launched an annual Agrifair where local products were displayed and various contests such as horse races and rodeo were held. A floating restaurant on the lake was recently added. The restaurant had been a subject of controversy lately as farmers accused the authorities of withholding the release of irrigation waster from the dam just to allow enough water on the lake for the restaurant to float on.
• Information Center providing
information in print, video and electronic communication;
• Technology and Market Center, showcasing techno demonstration projects, business modules, farmers trading and market matching; and
• Agri-Educational and Tourism Center Facilities Total Land Area: 100 has. Mini-Library Audio/video equipment Computer with internet access Farmers’ techno demo projects Nurseries Farmers’ trading center Salakot w/ dairy bar and souvenir shop Rodeo arena Horse race track Horses for rent Mini-forest and zoo Fishing area Restrooms
72
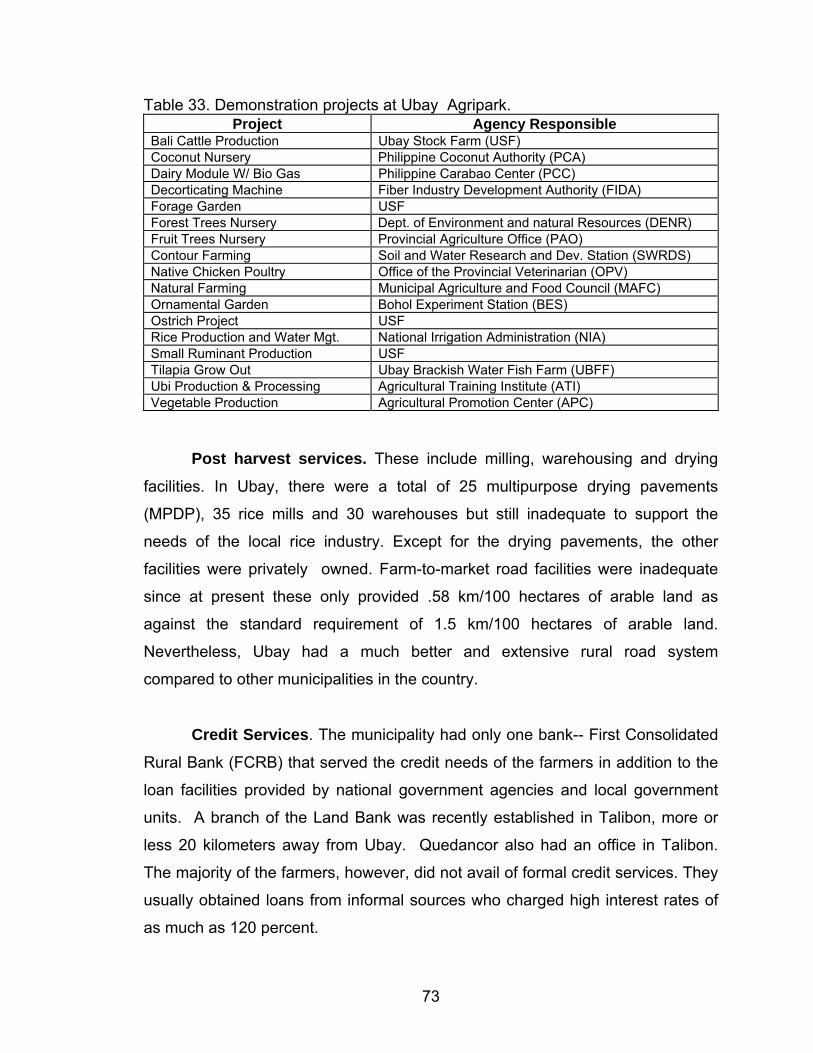
Table 33. Demonstration projects at Ubay Agripark. Project Agency Responsible
Bali Cattle Production Ubay Stock Farm (USF) Coconut Nursery Philippine Coconut Authority (PCA) Dairy Module W/ Bio Gas Philippine Carabao Center (PCC) Decorticating Machine Fiber Industry Development Authority (FIDA) Forage Garden USF Forest Trees Nursery Dept. of Environment and natural Resources (DENR) Fruit Trees Nursery Provincial Agriculture Office (PAO) Contour Farming Soil and Water Research and Dev. Station (SWRDS) Native Chicken Poultry Office of the Provincial Veterinarian (OPV) Natural Farming Municipal Agriculture and Food Council (MAFC) Ornamental Garden Bohol Experiment Station (BES) Ostrich Project USF Rice Production and Water Mgt. National Irrigation Administration (NIA) Small Ruminant Production USF Tilapia Grow Out Ubay Brackish Water Fish Farm (UBFF) Ubi Production & Processing Agricultural Training Institute (ATI) Vegetable Production Agricultural Promotion Center (APC)
Post harvest services. These include milling, warehousing and drying
facilities. In Ubay, there were a total of 25 multipurpose drying pavements
(MPDP), 35 rice mills and 30 warehouses but still inadequate to support the
needs of the local rice industry. Except for the drying pavements, the other
facilities were privately owned. Farm-to-market road facilities were inadequate
since at present these only provided .58 km/100 hectares of arable land as
against the standard requirement of 1.5 km/100 hectares of arable land.
Nevertheless, Ubay had a much better and extensive rural road system
compared to other municipalities in the country.
Credit Services. The municipality had only one bank-- First Consolidated
Rural Bank (FCRB) that served the credit needs of the farmers in addition to the
loan facilities provided by national government agencies and local government
units. A branch of the Land Bank was recently established in Talibon, more or
less 20 kilometers away from Ubay. Quedancor also had an office in Talibon.
The majority of the farmers, however, did not avail of formal credit services. They
usually obtained loans from informal sources who charged high interest rates of
as much as 120 percent.
73

Irrigation. The Capayas and Malingin irrigation systems provided
irrigation to 1,160 hectares in 5 barangays. The NIA also organized Irrigators’
Associations (IAs)in their service areas. In addition, small farm reservoirs (SFR)
had been constructed in individual farms through the help of the DA. A total of
150 SFRs were reported, allegedly, the biggest in the province and region.
The Capayas Irrigation System Location: Calanggaman, Bay-ang, Bood, Casate, Tuburan Service Area: 750 ha., 540 hectares actually serviced
Average Farm Area: 0.80 ha. Total Farm Lots: 1,397 lots
System Facilities 1) Dam: Zoned-earthfill; 20.5 m high; 1.16km long
Reservoir ity: Maximum Capac 42mcm Dead Capacity: 0.7mcm Effective Capacity 3.5mcm
Spillway Ungated overflow weir Ogee type Watershed .
Service1) F= 300 kilos per ha./annum for 2 seasons
) 15%- if theyl get 90-100% irrigation service fees
• ,500 ISF for 35 km L/R lateral canals association; 61 -75% -
• if the IA pays earlier or before due date, theyl get 10% rebate 3) Type I - cleaning the canals is the main function of IA; more collection of fees but will
Catchment area: 14.6 sq.kmA n -o 9.9 mcmve. An ual run ff:
Main canal 2.9 km. Lateral Canals 19.4 km.
ng Main Canal: 2.9 km. Service roads AloAlong lateral canals: 11.5 km.
s Provided: Irrigation Service Fees (ISF) - standard IS
175 kilos dry season 125 kilo wet season
Types of contract: 1) Type III - 50-50% sharing of collection (NIA is responsible for the operation & the
Irrigator’s Association for the maintenance) 2 Type II - Irrigators Association is responsible for the maintenance of canals (lateral)
and collection of ISF; they getpayment of PhP1
- range 60% and below of ISF collection, no share for irrigatorsIA gets 5%; 76 - 90%, 10%; 91 - 100%, 15%
pay the standard fees
Many problems plagued the irrigation system. These include: limited
irrigation water supply; poor canal maintenance; deteriorated irrigation facilities;-
lack of funds for IAs and NIA; illegal turn-outs; cropping calendar not properly
followed; water delivery and schedule not properly followed; poor and low ISF
74

collection; poor leadership, poor participation of members and; and, poor
implementation of IA policies.20
A summary of agencies public and private and their services in Ubay is
listed below (Table 34).
Table 34. Agricultural facilities and other related services in Ubay. Agency/Facility Services Provided Philippine Carabao Center (PCC), Lomangog
Technical advisory services, Breeding services, Gene pooling, upgrading of native breed
Ubay Stock Farm, Lomangog Technical advisory services, Livestock Dispersal Program
Bohol Experimental Station (BES), Gabi, Ubay
Research, production and distribution of quality seeds, ornamental plants, fruit trees, crops
National Food Authority Grains buying and storage NIA (Capayas Irrigation System) Irrigation services Ubay Brackish Water Fish Farm Research and development in mari/aquaculture Soil and Water Research and Demostration Station
Research and development; seed production
Philippine Coconut Authority Production and processing technologies, Seed nut production
Office of the Provincial Agriculturist
Funding, technical assistance and coordination on various programs; Low-input rice production technology
DA-RFU Funding, technical assistance and coordination on national banner programs
DA Agricultural Promotion Center (APC)
Technical assistance and coordination on national banner programs
DA-Agricultural Training Institute (ATI)
Trainings
DENR Forest tree nursery at AgriPark Low-input rice production technology, sustainable Agriculture Technology
Central Visayas State College of Agriculture, Forestry and technology (CVSCAFT) SEARice, Low-input rice production technology First Consolidated Bank, Ubay Credit services Fishery Improved for Sustainable Harvest (FISH)
Coastal resource management program
Project Seahorse Coastal resource management program Heifer International Livestock dispersal Counterpart International Financial assistance Atlas Fertilizer Corporation Fertilizer technodemo Alturas’ Corn production financing and marketing Philstarch Corporation Cassava production technology; contract growing
20 The problems in the CIP had not changed over the years. These problems were noted early but nothing seems to have worked to solve these. See various reports of BIAPP.
75

CHAPTER 5
THE MUNICIPAL EXTENSION SERVICES AND KNOWLEDGE MANAGEMENT
The Role of Municipalities under the Local Government Code (RA 7160) It will be useful to look at the legal context under which local agriculture
offices operate. Under the Local Government Code (LGC) of 1991 or RA 7160,
agriculture services was devolved to the provincial, city and municipal
governments. Municipalities, according to the LGC, are to provide “Agriculture
and fishery extension and on-site research” through:21
a. Dispersal of livestock and poultry, fingerlings, and other seeding
materials for agriculture;
b. Establishment and maintenance of seed farms for rice, corn, and
vegetables, medicinal plant gardens, seedling nurseries for fruit trees,
coconuts and other trees or crops, and demonstration farms;
c. Enforcement of standards of quality control of copra and improvement
and development of local distribution channels, preferable though
cooperatives;
d. Maintenance and operation of interbarangay irrigation systems;
e. Implementation of soil and water resource utilization and conservation
projects; and
f. Enforcement of fishery laws in municipal waters, including conservation
of mangroves.
It must be noted that in the above functions, there was a mixture of
extension, support services and regulation. Furthermore, certain functions were
better left to the private sector such as the establishment and maintenance of
seed farms, nurseries, etc. or better capable agencies such as those of
regulating the quality of copra. Besides the coconut industry was served by a
national agency—the Philippine Coconut Authority (PCA) and LGUs did not
normally include coconuts under their extension service.
21 Art. 25, IRR, RA 7160.
76

Under this mandate, however, LGUs took liberties to do everything they
wanted. Yet most of them only carried through what the DA did before
devolution. Most often, LGUS did not have their own programs but implemented
mostly the national banner commodity programs funded and administered by the
national government through the DA. These programs, which took various names
under various administrations, carried with them funding for implementation and
subsidies. In addition, incentives for devolved staff were also provided, hence,
there was a tendency to just ride on to these programs. The net result was that
many LGU staff acted like they were still under the national government in terms
of programs.
1Functions of the Municipal Agriculture Officer/Agriculturist in the DA structurea. Should establish and maintain a municipal office with the following information/resource
materials: 1. municipal map
The Municipal Agriculturist in the Local Structure: 2. manpower development In the functional structure of the municipality, the Municipal Agriculturist was mandated thus: The MA “shall take charge of the office of Agricultural Services and shall perform such functions as prescribed in the code”
3. project locator board 4. organizational chart 5. municipal profile 6. project status report 7. logbook 8. municipal nursery, and 9. training needs assessment of municipal personnel including himself.
b. Should conduct consultative review and fine-tuning of AT work plans and on this basis prepares his/her supervisory work plan.
c. Should prepare municipal integrated agricultural development plan for presentation and eventual incorporation to the overall municipal and provincial development plans.
d. Should conduct monitoring, supervisory visits and evaluation o : 1. monthly monitoring of project status 2. mid and year-end program review and 3. semestral performance audit of municipal personnel.
e. Should organize and conduct annual agri-food fair in the municipality in coordination with the Municipal Agriculture and Fishery Council. Should aspire to nominate contestants to the DA Search for Agriculture Achievers.
f. Should establish and maintain consultative linkage with government and non-government organizations for technical assistance and to facilitate resolution of problems/issues.
g. Supervise the promotion of agricultural cooperatives development through information dissemination.
h. Should keep abreast with recent developments regarding agriculture and related fields through readings, subscriptions of magazines, journals, etc., membership in organizations and attendance to seminars, trainings workshops and symposia that will lead to his/her professional/cultural growth.
i. Should prepare and submit promptly required monthly accomplishment reports.
77

The Role of LGUs under the Agriculture and Fisheries Modernization Act
In 1997, a new law—The Agriculture and Fisheries Modernization Act or
AFMA (RA 8435) reiterated the role of LGUs: “LGUs shall be responsible for
delivering direct agriculture and fisheries extension services.”22 The law further
specified the activities that would rightfully fall under extension such as training
services, farm or business advisory services, demonstration services, information
and communication support through trimedia.23 Under this law, it would have
been easier for LGUs to perform their functions because the functions were very
specific. Nevertheless, LGUs were generally unable to shift because national
programs continued to be implemented under pre-AFMA schemes and very little
local programs were funded by the LGUs themselves. Seemingly, it was better
for LGUs to adopt a much broader approach to extension services by putting
anything they did in agriculture as agricultural extension service.
The Municipal Agriculture Office Personnel
As of May 2004, Ubay
had a total of 121 plantilla
(permanent and required)
positions, 119 of which had been
filled. Of the 121 positions, 28
were considered officials and 93
were employees. Sixty percent
of these were graduates of
college and 62 percent were
between the ages of 31 to 50. In
the official plantilla, the Municipal
Agriculture Office had one
position for Municipal Agriculture
Vision of OMA: The emergence of Ubay as an agri-aqua production center for Bohol with self-sustaining, modernized, well-organized and empowered farmers and fisherfolk performing sound and profitable agribusiness enterprises
Mission:
1. To provide quality services and technologies that will support the efforts of farming and fishing communities to attain sustainable productivity and increase their real income;.
2. To increase farm productivity and produce quality products by practicing the modern agriculture and fishery technologies without sacrificing our environment;
3. To capacitate farmer and fisherfolk organizations by providing trainings and coordinate with concerned agencies in project implementation.
22 Sec. 90, RA 8435. 23 Sec. 87, RA 8435.
78

24Officer (MAO) and six Agricultural Technologists (ATs). The regular positions of
MAO and AT were filled from those devolved and the replacements of those who
retired. There were nine other staff who were hired as “casuals” or temporary
mostly to augment the technical services and partly to provide clerical and
general support services. Of the nine, five were hired as agricultural
technologists, three as laborers and one as clerk. One of the regular ATs was
reassigned to the CEPU. The hiring of temporary technical staff (AT) showed that
the present regular technical staff strength was inadequate because of the size of
the municipality. Among the crops section staff, the average number of
barangays covered by one AT was 11 and the livestock AT covered all of the 44
barangays. The Fishery Aide who was a provincial employee covered all the 19
coastal barangays. Based on the estimated number of farmers in Ubay, each
crop AT served more or less 1,200 farmers. The MAO did not give any barangay
assignments to the casual ATs because they were paid on a daily basis and did
not receive any allowances. However, they were mobilized for barangay work
whenever they were needed. This number also showed that the local
government was very interested in improving the service delivery in agriculture.
The MAO had already 25 years experience rising from the position of AT
after the former MAO retired receiving a current salary of PhP15,129.00. Two
ATs were already 27 years in service and receiving a current salary of
PhP10,048.00 and the other two ATs were receiving a monthly salary of
PhP8,444.00 each. Casual staff received a daily wage of P125.00 pesos with no
other compensation. The staff were divided almost nearly equally between male
and female.
In terms of educational attainment, the MAO had 24 units in her Master in
Science degree and has AEO eligibility. One Agricultural Technician (AT) had a
Bachelor of Science degree and had AO eligibility, another AT had career service
eligibility, while the two other ATs finished BS courses. All of the professional
technical staff completed four-year agriculture or related courses. Most were
24 The most recent recruit, a veterinarian fresh from the university and just got his license recently died vacating another position in the organization and paralyzing its livestock extension services.
79

trained on various occasions, except the most recently recruited, on various
subjects especially rice. Not one can be considered an expert on any other crop
except the livestock staff.
The Municipal Agriculture Office Organizational Structure
The structure of the organization was very simple mainly because of its
small size. It was relatively flat allowing for easier supervision, coordination and
communication. The office was not considered a separate department within the
municipal government structure but was under the direct control of the office of
the local chief executive. Most of the time, however, the general administration of
the office was placed under the Municipal Agriculture Officer (MAO). The MAO
was an inherited position from the national government. The municipal
government may elevate her position into a department head level by making her
Municipal Agriculturist and co-equal with other mandated department head
positions in the local government plantilla. The MAO, while fully under the
jurisdiction of the local mayor not only received instructions from the local
government of the municipality but may also receive instructions from the
provincial government and the national government by virtue of the limited
administrative control of provincial governors over the municipal government. In
the exigencies of the national priority programs in agriculture, the MAOs also
received instructions from the Department of Agriculture through its Regional
Field Office (RFU). In exchange, they were provided various forms of assistance
and incentives.
The local structure was still generally reflective of the previous one when
they were still in the national government (Fig. 15). Staff assignments were
classified into major commodities such as Crops, specifically grains and high
value crops (HVC), livestock, and fisheries.25 All technical professional staff
except for two were assigned to crops, mainly rice and one, among the crops
25 The fishery component and staff had been lately separated from the agriculture office to merge with the local environment and natural resources office. Hence, all programs in this area had been effectively removed from the MAO.
80

technologist was assigned to high value crops. In addition, all of the field
extension staff were assigned to oversee the overall agriculture situation in
specific barangays where they were assigned except for the livestock and HVCC
personnel who covered the whole municipality. Therefore, a particular staff may
be assigned to grains but concentrated only in a specified barangay or cluster of
barangays.
Municipal Agriculture
Officer
Agricultural Technologist (Grains) (4)
Agricultural Technologist
(HVCC) (1)
Agricultural Technologist
(Livestock) (1)
Adm. staff (Laborer, utility aide, Casual
ATs) (9)
Fig. 14. Structure of the Municipal Agriculture Service.
Staff Morale
The local extension service suffered formerly from a lack of leadership and
support from the former local government leaders. With the new MAO, the staff
had regained some dynamism and the local Chief Executive had shown support
for agriculture both, morally and financially. One recent recruit had been made
regular and job-order laborers who were assigned to the office occasionally.
Hiring the latter was a waste of money because these workers had no substantial
tasks and did not contribute significantly to efficiency. In fact, the MAO did not
exactly know which workers were assigned to her office except for some who
were doing tasks directly under her supervision. In general, the staff had high
81

morale owing to the relatively better pay and logistical support, dynamic and
humanistic leadership of the MAO plus the support of the local chief executive.
Morale was somehow very much influenced by the logistical support
provided to the OMA by the local government. The staff enjoyed better salaries
compared to similar positions in other municipalities because Ubay had a higher
income class. They were also given other mandated allowances and enjoyed a
reasonable gasoline allowance. The MAO retained her Representation and
Travel Allowance (RATA) despite the fact that in many municipalities,
replacement MAOs were no longer given such.
Program Planning
The problem of the local extension service seemed to be that there was
very little analysis done by the staff to see where they could be most effective
considering their logistical limitations and the potentials of the locality. For
example, there being a substantial and growing mango industry in the
municipality, the LGU could have taken the leadership to provide support to local
growers in terms of a tangible program to support the industry. As of now, the
industry was left to itself. There was also no effort to gain expertise on the part of
the staff on mango production so that they could truly provide leadership in this
subsector.
Another problem was pinpointing what service should be provided by the
LGU and which should be left to other providers. Should the LGU propagate and
sell seedlings? Should it maintain a breeding service? An incubator service?
Alternatively, was it better off continuing with its present framework of providing
whatever services were needed by the clientele?
The only semblance of a plan was the yearly target set by the staff as to
how many hectares shall be covered by the national banner programs and what
other activities shall be implemented on minor commodities for the year. So the
plan was a simple yet long list of activities under each commodity (refer to App.
Table 12). Some of the staff were involved in a participatory planning for the
82

fishery subsector, but they never carried the process through to the total
agricultural development plan for the municipality.
National vs Local One source of bewilderment from observers was how the local agriculture staff and the national agriculture agency differed in their perceptions of programs. While the national agency looked at programs in terms of targets based on their own ideas that were relatively high, the local staff usually set more realistic targets, which were relatively lower. This difference of perceptions occurred every time the national staff called for conferences. Eventually the local staff allowed the regional personnel to use their figures regardless of whether these were achievable or not. For example, the national agency staff, assuming that Ubay has a large rice area would set targets for planting hybrid rice at 500 hectares. The local staff, knowing that this was not achievable would indicate a much, lower areas at 60 hectares. The national staff would even go to the extent of threatening the local staffof sanctions like reporting to them to the local chief executive for lack of cooperation. In the end, the actual number of planters and area would even be much lower than 60.
Program and Personnel Monitoring and Evaluation
The MAO went to the field frequently to monitor her staff and programs.
She also went to the field especially whenever her presence was needed such as
during community functions, organizational activities, meetings, etc. National
commodity programs were monitored by provincial and national agencies and the
required forms were submitted. Monitoring was very informal but she had
reinstated the semestral evaluation of her staff. She refused to sign the Daily
Time Record (DTR) of the province-paid Fishery Aide for delicadeza. Her
leadership style had fostered cooperation among the staff.
Programs and Projects
The programs, projects and activities are listed in Appendix Table 12. This
long list contained a wide range of agricultural commodities indicating the
diversity of production activities that farmers were engaged in but the principal
activities, as indicated by the staff assignments were confined to rice production.
Other commodities with some emphasis included corn, mango, and livestock.
The fisheries program was limited to the assistance to fisherfolk organizations. A
new initiative to activate inland fisheries was started. It consisted mainly of
83

stocking small farm reservoirs, dams and other inland water bodies with tilapia
fingerlings.
Services Provided by the Municipal Agriculture Office
Local and national agricultural service agencies had been providing
services to the farmers in various ways. The services provided by the major
provider – the LGU can be gleaned by the list of programs and projects in App.
Table 12. These programs and services can be grouped into the following
categories:
Farm Advisory Services. The major component of the local extension
service was the provision of technical advice to farmers in terms of transmitting
technical information through informal contacts, meetings, seminars and
trainings, office calls and farm visits. These activities took most of their time
ranging from 70 – 80 percent.
Material Input Assistance. The local government had been extending not
only technical advisory services but also material inputs such as seeds,
seedlings, animals and other inputs through various programs such as plant-
now-pay-later scheme for mango, animal dispersal, fingerling dispersal, seeds for
field trials, etc. In addition, subsidized seeds, fertilizers and chemicals had been
provided especially to rice farmers, corn farmers and others through the various
national commodity programs by both provincial and national governments. Local
animal dispersal programs had been long running and to date (Aug. 2004) had
distributed 32 carabaos, 79 cattle, 410 swine, 5 goats, and 473 chickens.
Institutional Development. The field extension staff had organized
farmers, fisherfolk, women and other sectors for the purpose of minimizing the
need to contact each individual farmer considering the scope and number of
farmers being served by a few field extension staff. Consequently, these
organizations were envisioned to implement projects that would help generate
84

income for the members whenever applicable. The organizations also served as
conduits of assistance to individual members. Unfortunately, however, most of
these organizations were weak partly from the lack of enough time and skill on
the part of the staff on organizational development. The absence of any real
economic benefits from these organizations was blamed as the major source of
their weakness. At present, the number of organizations included: 18 Farmers’
Associations with 707 members, 10 Rural Improvement Clubs with 278 members
and 19 Fishermen’s Associations with 969 members. The staff considered
organizations as indispensable in their activities because without these, they
claimed, they could only reach a very limited number of clients.
Facilitative Services. A good part of the work in the field consisted of
facilitating farmers’ and collaborators’ needs and activities. These include
facilitating the acquisition of material inputs such as seeds of rice, corn and
vegetables, equipment such as mechanical threshers, shallow tube wells (STW),
solar dryers, small farm reservoirs (SFR), animal stock, fingerlings, vaccines and
other medicines. These materials had been acquired as either loans or outright
grants from various agencies such as DA, BFAR, OPA and OPV. The local office
also facilitated activities such as mobilizing farmers for meetings, information
gathering, trainings, etc. of partner agencies such as the OPA, DA-RFU, NGOs
and other agencies and private companies.
Pest, Disease and Force Majeure Surveillance. Field extension
workers were required to monitor the occurrence of pests and diseases in order
that quick action could be made in case of outbreaks. They were required to
make reports to higher offices as the need arose. In addition, staff were also
required to make assessment reports on damage from El Niňo whenever it
occurred.
Data, Anyone?
85
During the last drought, the MAO reported the damage to the provincial authorities as did the other MAOs from other municipalities. Using her own figures as a basis, she estimated the damage at 90 million pesos. This allegedly took the attention of the Governor in the sense that he could not believe the figures. As a result, the provincial government conducted an actual damage survey which necessitated stopping all other activities for days. The purpose of the survey was to get the real extent of the damage but it seemed that it was also done not to make the local officials look bad.

Conflict Resolution. Sometimes the staff were involved in settling
problems involving clients such as the disposal of dispersed animals, irrigation
water allocation problems, and other conflicts in the field. They were also
involved in organizational problems. These tasks were, however, very minor and
occurrence of conflicts that needed their attention was rare.
Dynamics in the Provision of Agricultural Extension Services
The extension service in Ubay was very much patterned after the national
program structure under four major banner programs such as cereals/grains,
livestock, high value crops and fisheries. This was reflected in the structure of the
organization where staff were assigned according to these commodity groupings.
Only one staff was assigned for each the three commodities such as livestock,
high value crops and fisheries and the rest of the staff were assigned to grains,
mainly rice. Therefore, there was a lopsided emphasis on rice among all the
commodities. Service was extended on a regular albeit highly unstructured manner.
Clients either were visited or came to the office for assistance. Nevertheless.
Most rice farmers were seemingly knowledgeable of the technologies in rice such
that most assistance sought were in the form of availing the incentives offered by
the national government. It must be pointed out that the number of farmers
adopting the hybrid rice technology in Ubay had been minimal and decreasing
over the seasons. In 2005, however, the local government used its calamity fund
of about P500,000.00 pesos as a result of the El Niño occurrence to subsidize
rice production using hybrid varieties. The number of adoptors of hybrid rice
necessarily rose yet the amount for subsidies was not fully used because many
86

farmers had already planted other varieties. They were mostly growing the inbred
lines.
Trainings were conducted occasionally involving local staff and
occasionally staff from the provincial agriculture office. The rice farmers in Ubay,
notably in the irrigated areas were beneficiaries of a special program jointly
implemented by the national government, the Japan International Cooperation
agency and the local government through the Bohol Integrated Agricultural
Promotion Program (BIAPP). So most of the technologies learned by the farmers
in the irrigated areas were those promoted under the program. Under this
program, field trials on new rice varieties and other rice-based cropping systems
were conducted and closely monitored and institutional capability building for the
irrigators’ associations was also implemented. Most often, new seeds were
introduced through technical briefings which were done in two hours.
The strategies employed by the staff to serve their clients include:
Coordination and Complementation among Related Agencies. Under
the purely local service which was fully implemented after the phase out of
BIAPP in 2001, the services to the rice areas were continued but at a much
reduced intensity due to lack of resources. Nevertheless, the OMA coordinated
with other agencies on particular activities and farmers were provided certain
services either as individual agencies or in cooperation with the OMA. A
summary of the coordination and complementation of services can be illustrated
by Tables 35 and 36, showing the various services along the value chain in rice
and mango.
Office Calls. Many farmers came to the office to consult with the staff on
just about every thing pertaining to agriculture. Some came to inquire about
seeds, others to consult about livestock. In general, prior appointments were
nearly impossible to make because of the lack of communication facilities
although a few clients were reported to contact the staff via cell phone. In many
cases, a caller came to the office anytime hoping to see the staff concerned. In
87

any case, there was always staff in the office who took note of the object of the
visit and referred it to the relevant staff when he/she arrived.
Farm Visits. Farm visits took up most of the time of the field extension
staff. They estimated that about 80 percent of their time was devoted to these
activities. These visits were mostly to provide technical advise, monitor crops,
pest and disease surveillance, and deal with specific farm problems brought to
their attention by the farmers. These visits, however, were not structured in such
a manner as to determine specific routes on certain days so that it would be easy
to monitor staff movement within his/her service area. In other words, the visits
were based on perceived and reported needs for services. Since all barangays
were readily accessible by all forms of transportation, field staff had no problem
reaching them except that many of these barangays could only be reached by
motorcycles private or for hire. In many cases, transportation cost was
comparatively high because the paucity of passengers made the service very
expensive such that a 4 km trip from Mabuhay to Gabi, for example, cost thirty
pesos (P30) compared to the fare for the jeep or bus from town to Lomangog,
which cost only 6 pesos for the 8-kilometer distance. If one had a motorcycle of
his own, reaching the barangays would be no problem. For monitoring, the staff
had forms to fill out which included data on yield estimates, areas planted and
problems met. It was noted that the forms kept on changing such that the
consistency of data suffered.
Community Organizing. Field extension staff saw the indispensability of
organizations. They claimed that they could not reach all farmers and other
clientele on an individual visit. They usually used the organizations as channels
for delivering information, holding meetings and briefings and as a venue for
discussing other concerns. The organizations were mostly designed not to
accomplish certain tasks or projects but as a forum for various concerns of the
88

Table 35. Extension and support services through the value chain in rice. Service Providers
Private Companies/Organizations
LGU DA & Allied Agencies (Mun. Agriculture
Office)
(OPA. OPV,DARFU,
APC, BES, SWARDS, NIA,
NFA)
(Quedancor, First Consolidated Bank of Bohol, Inc., private
dealers, Altura’s, BOFAMCO, Seed companies, other seed
growers, Private buyers, haulers, warehousers, millers)
Process
Facilitative services Supply of inputs based on GMA
program targets: Seeds, fertilizers)
Provide capital through loans. (Quedancor, First Consolidated
Bank of Bohol, Inc.
Accessing capital/inputs
Irrigation services (NIA)
Custom plowing: Carabao/tractor
Land preparation
Information services on sources of seeds; Facilitative services
on seed procurement/
accessing new varieties; technical
briefing on new varieties
Supply of seeds Supply of seeds Seed procurement (BES, SWRDS) (Seed growers, BOFAMCO,
Seed companies)
Technology dissemination on
seedbed preparation
Technology dissemination
(through the MAO)
Technology dissemination Seedbed preparation (Seed growers, companies)
Technology dissemination on
weed control (Mechanical,
chemical)
Technology dissemination
(through the MAO)
Technology dissemination Weed control (Private weed control chemical
dealers, mechanical weeder manufacturers, dealers)
Technology dissemination on
fertilization
Technology dissemination
(through the MAO)
Technology dissemination Fertilization (Private fertilizer dealers)
(inorganic, organic, Balanced
Fertilization) Technology
dissemination on pest & disease mgt.
Technology dissemination
(through the MAO)
Technology dissemination Pest & disease control
(Private dealers: insecticide, fungicide, molluscicide)
(inorganic, organic, IPM)
Technology dissemination on water mgt. (SRI)
Technology dissemination
(through the MAO) NIA: Water scheduling
Water mgt.
Harvesting and threshing services
Harvesting
(Private dealers of threshers, contractors: Use of mechanical
threshers)
89

Hauling Transport services: Private transportation: trucks, jeeps,
tricycles, etc. Warehousing services: NFA
Warehousing services: Private (Altura’s)
Warehousing
Information dissemination on
prices?
Buying services: NFA
Buying services: Private (Altura’s)
Buying
Milling services: Private (Altura’s, other millers)
Milling
farmers. Not one among the staff, however, was not trained in community
organizing.
Trainings. Trainings were conducted occasionally depending on the
availability of funds and resource persons. In other times, meetings were used to
introduce new technologies. Attendance in these trainings, however, also
depended on the schedule and interest of the farmers. It seemed that the
immediate need of the farmers at present was not new technologies on rice per
se but support services such as credit and marketing especially the former. In the
mango industry, the most common need was the technology for control of
disease especially the “butig-butig” (black spots on the fruits causing decay)
which, even experienced contractors had found no solution yet. In the fishery
sector, the declining catch was the most important problem and no solution had
been devised so far. Yet destructive fishing continued despite the existence of
the CLEC or Coastal Law Enforcement Council. Ubay had a long and erratic
coastline making law enforcement difficult especially with the limited manpower
and other resources.
The number of trainings declined through the years and for rice, trainings
consisted only of a more or less 2- hour technical briefings. Trainings on
livelihood projects were also done in collaboration with the Municipal Social
Welfare and Development Office (MSWDO).
Table 36. Extension and support services through the value chain in mango.
90

Service Provider LGU DA & Allied
Agencies Private
companies/Organizations Process (Mun. Agriculture Office) (DARFU, APC,
BES) (Financiers, contractors, private dealers, seedling
growers/suppliers, Private buyers, haulers, warhousers)
Information dissemination on seedling sources,
supply of seedlings
Information dissemination on seedling sources
Information dissemination on seedling sources, supply of
seedlings
Seedling procurement
Technology dissemination on
site selection, planting distance,
Technology dissemination on
site selection, planting distance,
Technology dissemination on site selection, planting
distance, etc.
Planting
Technology dissemination on
fertilization weeding, etc.
Technology dissemination on
fertilization weeding, etc.
Technology dissemination on fertilization weeding, etc.
Farm maintenance
Technology dissemination on
flower inducement
Technology dissemination on
flower inducement
Technology dissemination on flower inducement; supply of
inputs (flower inducers)
Flower inducement
Technology dissemination on
pest/disease control
Technology dissemination on
pest/disease control
Technology dissemination on pest/disease control; supply
of inputs
Pest/disease control
Technology dissemination on fertilizer, vitamin
application,
Technology dissemination on fertilizer, vitamin
application,
Technology dissemination on fertilizer, vitamin application,
Fertilization
Supply of newspaper, bag preparation, bagging services
Bagging
Guarding services Guarding Technology
dissemination on proper harvesting
techniques
Technology dissemination on proper harvesting
techniques
Technology dissemination on proper harvesting techniques
Harvesting
Technology dissemination on
post harvest treatment of fruits
Technology dissemination on
post harvest treatment of fruits;
provide water treatment machine
Technology dissemination on post harvest treatment of
fruits
Treatment
Information dissemination on
classes and prices
Classifying (Escoje) services Classifying
Hauling services Hauling Warehousing services Warehousing Buying Buying Technology dissemination on
processing, processing Processing
Information dissemination on
prices
Information dissemination on prices
Marketing
91

Field Days and Agricultural Fairs. The local government in cooperation
with the many agencies present in Ubay had launched an Agripark, a kind of
integrated showcase facility located inside the Ubay Stock Farm compound
(See Table 34). The facility was used also as a venue for agricultural fairs which
included rodeo competitions and horse racing at least once a year. During the
town fiesta, which happened every last Saturday and Sunday of January, the
local government tasked the OMA to organize an Agriculture Fair in the town
plaza. In these fairs, farmers’ associations were asked to exhibit farm products.
Horticultural groups were also invited to exhibit their products. These exhibits
normally started days before the actual fiesta in order to allow exhibitors more
time to sell and display their products. In certain cases, the BES also conducted
field days but they generally invited farmers and agriculture staff throughout the
province and not just from Ubay.
Logistics and Other Operational Supports Facilities and Equipment. The OMA had modest offices and few
equipment. Their office building was an old separate structure with office space,
kitchen, lavatory and a bedroom. It had office tables, chairs and cabinets. It had
one computer and telephone. It had no official vehicle. The OMA, also had a
breeding station at the Agripark, a nursery at the back of its office where they
grew mango seedlings and asexually propagated them for sale. It also had an
incubator. Technical materials were posted on the walls but there was little of
technical resource library or something like a data bank. Old publications and
reports were also available on display.
Transportation and Staff Mobility. The field extension staff, at least
those who had motorcycles were given fuel allowance of at least eight liters of
gasoline per week26 allowing them to move around the field more easily. It must
26 The amount had since been reduced to 5 liters. This is another example of how a local government tries to provide support to its field personnel. Strictly speaking, government funds for gasoline or government purchased gasoline cannot be used to fuel private vehicles. Many
92

be pointed out that most of the filed staff gravitated around the rice areas only.
The fishery staff along the coastal areas only. The livestock technologist served
the whole town, but field visits were also contingent on calls for assistance. In
addition, the MAO, thinking about the limitations in terms of compensation and
lack of other allowances for the temporary staff (casual) decided not to assign
them to the field unless they were part of teams that went to the barangays for
specific purposes. Therefore, these staff were generally based in the office.
There were no official vehicles assigned to the OMA. Those without vehicles took
public transportation.
Linkages
The LGU cannot stand alone in dealing with the multifarious problems of
the agriculture sector. It had to establish working relationships with various
providers of services from other government agencies and private organizations
(Non-government organizations (NGOs) and businesses. Table 37 shows some
of the partner agencies and NGOs that the OMA had established cooperation
over the years. These linkages were in the form of resource sharing, information,
joint activities, training, monitoring and report sharing. Very close linkages were
maintained with the DA family, the provincial offices of Agriculturist and
Veterinarian and all other agencies that were based in Ubay through the Ubay
Agripark where most of these agencies maintained ecological farming
demonstration (ecodemo) sites.
Financing
Budget for Agriculture. Based on figures obtained from the records of
the LGU, it can be seen that appropriations for agriculture had been steady for
Table 37. Agencies and organizations linked with the OMA. Agency/ Project /Activity Role of partner Role of LGU Freq. of agencies and LGUs had used this prohibition to deny gasoline support allowance to their extension staff. Ubay had been very creative in this regard by devising ways to allow the field staff to avail of gasoline for their private vehicles. This allowance had boosted the field staff’s mobility.
93

Organization cooperation DA/RFU Training of staff; Provision of funds
National banner programs
Provision of funds/resources
Local transportation;
Frequent
Identification of beneficiaries Monitoring and report submission
DA/ATI Training of staff Provision of resources Identification of trainees
Sometimes
DA/APC Various activities
Resource provision Coordination Sometimes
DA/CENVIARC
Various activities
Resource provision Coordination Frequent
DA/BES Various activities
Resource provision Coordination Frequent
DA/USF Agripark Maintain ecodemo Coordination Frequent DA/PCC Agripark Maintain ecodemo Coordination Frequent OPA National Banner
programs Coordination Coordination,
reporting Frequent
Provision of resources Training of staff Transportation
and travel OPV Animal health
program Provision of vaccines Information
dissemination; vaccination
Every six mos.
Philrice Rice technodemo
Inputs and technology provision
Provision of counterpart funds
Stopped
PCIC Crop insurance Insurance coverage, Information campaign
Information campaign, identification of beneficiaries, monitoring
As the need arises
BFAR Agripark, CRMP Maintain ecodemo Coordination Frequent NIA Agripark,
irrigation Maintain ecodemo/ irrigation systems
Coordination Frequent
DAR Crop production Provide resources for training
Coordination Frequent
DENR Agripark Maintain ecodemo Coordination Sometimes CRMP
PNP/coast Coastal res. mgt Conduct patrols guard Conduct training of
Bantay Dagat
Join patrols Coordinate with Bantay Dagat
Frequent
BOFAMCO Seed production/distribution
Produce seeds Coordination Frequent
SeaRice Organic Rice production
Training of farmers Undergo training; identify participants
Rare
FISH CRMP Technical assistance; funding; capability building; community mobilization
Coordination in implementation
Rare
Fertilizer/Chemical companies
Information dissemination
Conduct training, distribute IEC materials
Coordinate
94

the last 12 years after devolution. Slight fluctuations between 3.13 to 4.69
percent could be noted. This low percentage was similar to other LGUs. Real
project budgets were indicated in the annual investment plan (AIP) but even the
AIP allocations were inconsistent. There were years when the allocation was less
than 2 percent of the total AIP and there was a year when it reached 10 percent.
In the 12-year period there were no AIP allocations for agriculture for five years.
The AIP is 20 percent of the IRA devoted for development projects and allocation
Table 38. Municipal budget and budget and AIP for Agriculture, 1993 – 2004.
20% AIP AIP for % to total AIP
Year Total Municipal Budget
Budget for Agriculture
% of total
budget Agriculture
1993 14,233,207.48 518,111.56 3.64 2,206,261.40 176,280.00 7.991994 16,448,088.30 597,352.54 3.63 2,921,825.00 301,825.00 10.331995 19,891,099.76 673,052.64 3.38 2,895,672.00 50,000.00 1.7271996 20,059,549.29 941,093.16 4.69 3,577,230.60 150,000.00 4.1931997 22,188,528.22 831,103.00 3.75 3,542,520.00 0 01998 26,851,527.00 1,046,515.00 3.90 4,560,981.60 0 01999 30,301,214.00 1,363,208.40 4.50 4,738,941.20 0 02000 37,806,462.80 1,184,559.20 3.13 6,091,574.40 195,000.00 3.2012001 47,027,165.70 1,656,563.60 3.52 7,089,112.94 0 02002 45,114,194.26 1,721,414.80 3.82 7,333,234.78 100,000.00 1.3642003 52,473,913.41 2,090,806.80 3.98 381,532.00 381,532.00 1002004 54,000,000.00 2,082,201.60 3.86 9,800,000.00 0 0 Table 39. Additional municipal appropriations for agriculture, 1993-2004.
Supplemental Appropriation Total appropriation Year AIP for Agriculture for Agriculture for Agriculture 1993 176,280.00 0 176,280.001994 301,825.00 0 301,825.001995 50,000.00 30,000.00 80,000.001996 150,000.00 83,380.00 233,380.001997 0 0 0.001998 0 0 0.001999 0 0 0.002000 195,000.00 400,000.00 595,000.002001 0 300,000.00 300,000.002002 100,000.00 0 100,000.002003 381,532.00 23,468.00 405,000.002004 0 0 0
95
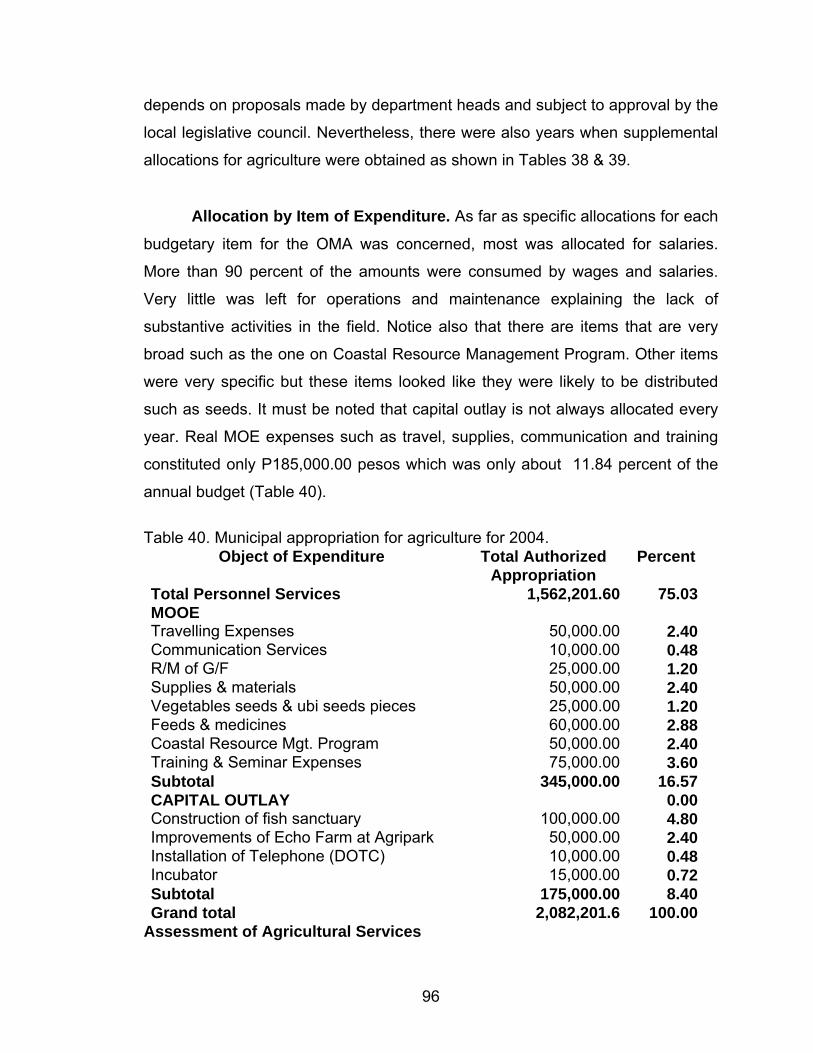
depends on proposals made by department heads and subject to approval by the
local legislative council. Nevertheless, there were also years when supplemental
allocations for agriculture were obtained as shown in Tables 38 & 39.
Allocation by Item of Expenditure. As far as specific allocations for each
budgetary item for the OMA was concerned, most was allocated for salaries.
More than 90 percent of the amounts were consumed by wages and salaries.
Very little was left for operations and maintenance explaining the lack of
substantive activities in the field. Notice also that there are items that are very
broad such as the one on Coastal Resource Management Program. Other items
were very specific but these items looked like they were likely to be distributed
such as seeds. It must be noted that capital outlay is not always allocated every
year. Real MOE expenses such as travel, supplies, communication and training
constituted only P185,000.00 pesos which was only about 11.84 percent of the
annual budget (Table 40).
Table 40. Municipal appropriation for agriculture for 2004.
Object of Expenditure Total Authorized Percent Appropriation
Total Personnel Services 1,562,201.60 75.03 MOOE
Travelling Expenses 50,000.00 2.40Communication Services 10,000.00 0.48R/M of G/F 25,000.00 1.20Supplies & materials 50,000.00 2.40Vegetables seeds & ubi seeds pieces 25,000.00 1.20Feeds & medicines 60,000.00 2.88Coastal Resource Mgt. Program 50,000.00 2.40Training & Seminar Expenses 75,000.00 3.60Subtotal 345,000.00 16.57
CAPITAL OUTLAY 0.00Construction of fish sanctuary 100,000.00 4.80Improvements of Echo Farm at Agripark 50,000.00 2.40Installation of Telephone (DOTC) 10,000.00 0.48Incubator 15,000.00 0.72Subtotal 175,000.00 8.40Grand total 2,082,201.6 100.00
Assessment of Agricultural Services
96

Various providers offered a wide array of services to local farmers.
However, a major question is the intensity and adequacy as well as timeliness of
these services. The national agencies found in Ubay, understandably provided
minimal direct service to local farmers. Some of these agencies were not
essentially extension service providers per se but extension was only a part of
their overall functions and they also served clients outside of Ubay.
These agencies did not have adequate staff to perform extension
services, hence, any extension service were limited to occasional rather than
sustained regular activities. The private companies, however, were very active in
selling their technologies to the farmers so that one local extension staff
expressed his dismay over their competition. He complained that they would
eventually lose to these salesmen because they did intensive selling so that even
their campaign on integrated pest management and pesticide safety became
futile against the onslaught of aggressive advertising.
Quality of services may be gauged according to five major criteria namely
accuracy, adequacy, timeliness, relevance and equity.
Accuracy. The accuracy of the services provided by public and private
providers could only be said to be partial. The major question here is whether the
extension service, especially the local extension service had pinpointed the kind
of service it can provide effectively and efficiently. In general, farmers took the
advice of extension staff and generally found them accurate. In some instances,
however, these advices had been less accurate. The accuracy of advice,
however, would depend on the accuracy of data available and information
obtained by the field extension staff. Reports of crop failures indicated that the
advice might not have been accurate.
Adequacy. The services were obviously inadequate to meet the needs of
the clients. In Ubay, ATs claimed that each of them covered, on the average 11
barangays. The livestock and HVCC people covered all 44 barangays. The
97

fishery stafff served all coastal barangays (21). Due to the large number of
clients, it was impossible to serve all the clientele. Furthermore, services were
limited as to type. In many cases, technical advisory services, training services
and facilitating services were provided by the extension staff. Many farmers felt
that advisory services were not enough because they felt that material help was
also important. In this regard, material assistance was even more inadequate.
Subsidized seeds, fertilizers and pesticides were grossly inadequate to meet the
needs of the rice farmers. Irrigation water was inadequate. Technical advisory
services in other commodities were more wanting such as those in mango where
there was no local staff expertise. For other commodities such as rootcrops and
other minor crops, the staff acknowledged that their services were very limited.
Service provision was definitely limited by the number of service
personnel available. All in all, the limited budget for agriculture, limited number of
staff, limited facilities and other resources of the local extension service
contributed to the inadequacy of the extension services.
Timeliness. The timeliness of local extension services was conditioned by
the need of the farmer, the availability of the technology or personnel needed,
and availability of transportation and communication facilities. In general,
extension services were provided regularly by the field staff and most of the
farmers’ needs were given attention immediately. Appointments were kept and
unscheduled office calls were attended to with the utmost dispatch. In some
cases, because of bureaucratic limitations, material assistance came late. If the
need was urgent, it was the policy of the office to mobilize all available personnel
to complete a task.
Relevance. Most of the services provided to local farmers were deemed
relevant but there seemed to be a lopsided focus on rice. This is understandable
considering that the main cop in the area was rice. Even in rice, the most
important problems reported were capital and irrigation water especially in
98
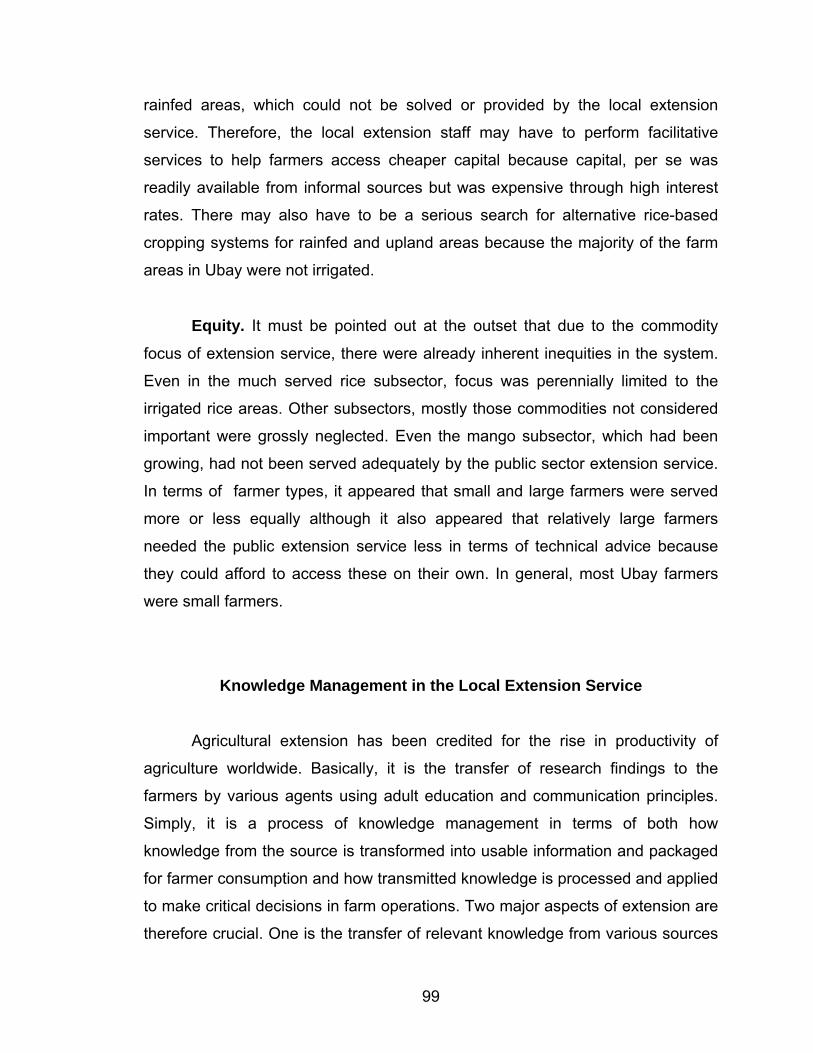
rainfed areas, which could not be solved or provided by the local extension
service. Therefore, the local extension staff may have to perform facilitative
services to help farmers access cheaper capital because capital, per se was
readily available from informal sources but was expensive through high interest
rates. There may also have to be a serious search for alternative rice-based
cropping systems for rainfed and upland areas because the majority of the farm
areas in Ubay were not irrigated.
Equity. It must be pointed out at the outset that due to the commodity
focus of extension service, there were already inherent inequities in the system.
Even in the much served rice subsector, focus was perennially limited to the
irrigated rice areas. Other subsectors, mostly those commodities not considered
important were grossly neglected. Even the mango subsector, which had been
growing, had not been served adequately by the public sector extension service.
In terms of farmer types, it appeared that small and large farmers were served
more or less equally although it also appeared that relatively large farmers
needed the public extension service less in terms of technical advice because
they could afford to access these on their own. In general, most Ubay farmers
were small farmers.
Knowledge Management in the Local Extension Service
Agricultural extension has been credited for the rise in productivity of
agriculture worldwide. Basically, it is the transfer of research findings to the
farmers by various agents using adult education and communication principles.
Simply, it is a process of knowledge management in terms of both how
knowledge from the source is transformed into usable information and packaged
for farmer consumption and how transmitted knowledge is processed and applied
to make critical decisions in farm operations. Two major aspects of extension are
therefore crucial. One is the transfer of relevant knowledge from various sources
99

to the end-users (farmers, fisherfolks) and the other is the development of
capacity by users to use this knowledge.
For extension, a good analytical framework to use is the Knowledge
Management Framework since extension is basically a knowledge transmission
system. The framework allows an analysis of how knowledge can be managed in
order to maximize the impacts of extension. It allows an analysis of how
knowledge assets are used by the system and how best practices can be
maximized. The most intriguing question, however, is how explicit knowledge
becomes tacit knowledge and how tacit knowledge is captured and transmitted.
Being able to answer these questions means that the extension service should
transform itself in order for this to happen.
The knowledge management framework is a useful perspective in looking
at the operations of extension in the field in order to see how the processes of
knowledge transfer and use result to higher productivity and income of the
farmers, the ultimate goal of extension. The framework tries to look at various
aspects of knowledge management specifically people, culture, strategies and
processes and technologies.
What is knowledge Management?
“Knowledge management or KM is the deliberate and systematic
coordination of an organization’s people, technology, processes and
organizational structure in order to add value through reuse and innovation. This
coordination is achieved through creating, sharing and applying knowledge as
well as through feeding the valuable lessons learned and best practices into
corporate memory in order to foster continued organizational learning”27 it is also
how “…Information is turned into actionable knowledge and made available
effortlessly in a usable form to the people who can apply it”28 “enabling efficient
and effective decision making in their everyday business.”29
27 Dalkir, Kimiz, Knowledge Management in Theory and Practice, Boston: Elsivier, Inc.. p. 3. 28 Ibid, Citing Information Week, Sept. 1, 2003. 29 Ibid, Citing Steve Ward, Northrop Grumman, http://www.destinationkm.com/articles/default,asp?ArticleID=949.
100

Applied to extension, KM means the extension service as an organization
must look for information, turn this into actionable knowledge and make these
available to farmers to enable them to make decisions in their daily work. It must
tailor its organization, coordinate its people, streamline its processes and use
available technologies to achieve adoption, reuse, add value and innovation
among its clients.
The Knowledge Management Cycle Using Dalkir’s’ summary of the KM cycle, there are three major steps in
the KM cycle: knowledge capture and/or creation, knowledge sharing and
dissemination and knowledge acquisition and application (Fig. 16). There are two
types of knowledge. Explicit knowledge and tacit knowledge. The former is
knowledge that has been codified and can be readily obtained from various
sources such as books, articles, electronic forms or by attending seminars or
listening to lectures. Tacit knowledge is more valuable knowledge. It cannot be
easily represented, hence, is difficult to codify. From this, we can look at how the
local extension service and the farmers capture, disseminate and utilize
knowledge.
Knowledge Capture/Creation 30 This is either capturing existing knowledge or creating new knowledge.
This is the transfer and transformation of valuable expertise from a knowledge
source to a knowledge repository. This involves reducing a vast volume of
content from diverse domains into a precise, easily usable set of facts and rules.
Explicit knowledge is already there and the need is to abstract or summarize
these. Tacit knowledge is difficult to codify, hence, needs to be analyzed and
organized before it can be described and represented.31
30 Ibid. p. 78. 31 Ibid. p. 82.
101

Knowledge sharing and
dissemination
Knowledge capture and/or
creation
Knowledge acquisition and
application
32Fig. 15. The Knowledge Management cycle
Individuals and organizations will have to capture knowledge.
Organizational memory includes the experience of its members combined with
tangible data stores in the organization.33 It must therefore be a part of the
organizational culture, program and processes to capture knowledge so it
becomes part of the organizational knowledge base.
The municipal extension service was very dependent on knowledge
shared by government sources through the Department of Agriculture. Years
ago, knowledge was captured mainly through trainings that were conducted for
the field extension staff. In addition, printed materials were also handed out to
them. Other sources could be tapped but depended on the initiative of individual
field extension worker. While individual staff may have stored this knowledge in
his own head, or sometimes in his personal notes or files of printed materials,
there seemed to be no organizational policy and process to store these in a
database electronic or otherwise to make them available to every member of the
organization. Individual staff took notes on certain matters but it appeared that
32 From Dalkir, p.
102

even explicit knowledge was not recorded in a systematic manner that was easy
to retrieve and use by others. In mango, for example, it appeared that there was
no attempt to capture explicit or tacit knowledge officially.
The local extension service staff had very limited resources to capture
knowledge although they had many sources (See Fig. 17). First, the number of
trainings conducted in order to upgrade their technological knowledge had been
nil and sporadic at best. In terms of explicit knowledge in print and other media,
the sources and opportunities were also few. Moreover, they did not access
knowledge from internet sources. At best, those who had been practitioners
relied on their tacit knowledge, especially on rice production so that combined
with explicit knowledge gained from other sources, they shared these to their
clients.
Local Extension
Service
NGO (Searice)
Seed growers
Farmers
Others (Researchers, OPA
staff)
Input Dealers
DA (APC,BES)
Fig. 16. Sources of knowledge (rice) of the local extension service staff
Best Practice. How best practices evolve among different farmers may
have taken several turns and at different paces but the steps may be generalized
into four major categories. First, it starts with a good idea. A farmer through his
33 Ibid.
103

own initiative or learning from others conceives and idea which he may deem
good. This idea is yet untested and must be studied. Then he uses it successfully
in his farm. The same idea is used by other farmers. Experts recognize this idea
as the best in the locality. This idea becomes available for reuse. Finally, this
local best practice may be recognized by outside experts to be the best in the
dustry. The following diagram is instructive:34
Fig. 17. The evolution of best practice
in
Good Idea
A good source of explicit and tacit knowledge, especially for resource-poor
organizations such as the local extension service were good or best practioner
local farmers. These best practitioners are knowledge sources or assets. In
Ubay, certain rice farmers reportedly obtained yields of as high as 9 or 12 tons, a
rare accomplishment since most farmers yielded only more or less 3 tons per
hectare. Among mango planters and contractors, some could be considered
veteran practioners and were willing to share their knowledge. The extension
service must be quick to capture the knowledge of these best practice farmers
because of their direct relevance to the other farmers in the area for the reason
that their practices were tested under local conditions. Therefore, these practices
were proof that under similar conditions, other farmers could obtain similar yields.
Now one strategy is to capture explicit knowledge through interviews and field
visits to their farms. Tacit knowledge may be captured through more intensive
34 Adapted from Dalkir, citing another source, Ibid. p.130.
Unproven; need to be
studied; used successfully in one or few
projects / farms
Good Local Best Practice
Method
improves performance; used by other
groups / farmers
Practice
Industry
Recognized by experts; shown to be
best approach;
available for reuse
Best Practice
Recognized by outside experts;
acknowledged as state-of-
the-art by in the locality industry
104

observations and interviews. This knowledge, along with those obtained from
other sources must be recorded and transformed into readily usable procedures
and stored in a knowledge repository, at most either in a document stored as a
hard copy or in the single office computer. As of this writing, there has not been
an attempt to capture knowledge in a systematic manner even from local
sources. There had been attempts to capture knowledge from outside sources
but in a sporadic unorganized manner but there was no evidence that these were
se improve
verall farm performance. The task of the extension service is to record these
xperiences and put these into a repository where others may share.
codified, stored and made available to the members of the organization. There
had been no policy, process or technology to allow such to happen.
The most likely criterion for identifying best practice would be productivity.
Farmers reporting highest yields in the area could be identified easily. But if the
criteria involve sustainable practices, then yield does not suffice. In Ubay, where
agronomic conditions may be limited and farm sizes relatively small, the criteria
may involve diversification, conservation practices, productivity and profitability. It
might be mentioned hat even in lowland areas, rice may not be the most
profitable crop. So the local extension service, collaborating with local farmers,
knowing what is worth promoting may formulate its own set of criteria for best
practices, have these tried or verified by other farmers to prove if the
o
e
105

Knowledge Assets Jun. Jun is a young farmer whose formal training was In fishery. He was married to a pastor and they run the small local church in a village in Ubay where they are based. Jun was introduced to farming when he administered a relatively large estate for an absentee landowner . he claimed it took him three consecutive years, mostly failures but instructive to master rice production. He has then engaged in commercial rice production and rice seed production. He said that by now he knows the intricate processes in the production of hybrid seeds. Jun shares willingly his knowledge about rice production and says that he provides all information to buyers of his seeds and anybody who asks for his assistance. He has ventured into diversified farming planting vegetables around his extensive farm. Jun Combines his farming with his church duties and blends well with other farmers in and around his place of residence. Jun being educated and naturally curious does not rely on existing knowledge but tries to learn new things from his own farm at every opportunity. He continues to experiment in new things. He is a knowledge asset that should be tapped by the local extension service. Lando (Labitad). Lando is planter contractor. An unassuming man ,relatively young an a native of Cebu. He said he crew up in a mango farm in a mango growing family. Lando drifted to Bohol rather in a roundabout way. During the height of the insurgency he found himself caught up in the tumult that crept into their once peaceful existence. Becoming a fugitive, he finally availed of the NRDP and was one of the beneficiaries resettled in Tuburan through the Bayanihan settlement project. Lando knew and loved no other crop except mango. Having been born under hundred year old mango trees he talked and breathed mango. His grandparents, parents and siblings were into the mango industry in Guadalupe Cebu. Lando knows everything about mangoes but is too modest to claim that no matter how good one is about anything, there are factors beyond his control that may result to crop failure. He claims Ubay is a very good site for mangoes especially in those areas near the sea. It was his observation that mangoes grow well near the sea. He has mastered the production process, the inputs needed and some “secrets” to outsmart the pests and his competitors. He knows small things like how to produce those tiny bamboo skewers that they use to lock the wrappings of the individual fruits to protect them from pests. He knows the existence of an insect—an ant-like insect he call “pila” that preys on other insects that attack the fruits. He has proposed some way to keep them by keeping a stock of grated coconut and sugar so that they would not go away or secured from damage when spraying. He insists that for those who are allergic to mangoes, one should not eat the part near the base of the fruit. He is open to his patrons and also openly shares his knowledge to other farmers. He had been elected as a new officer in the revitalized organization of bayanihan (NRDP) farmers. His wife and grown up children help him in his business. He is a very modest man living in a modest house. A man of agreeable temperament and communal spirit, Lando is an knowledge asset.
Knowledge Sharing and Dissemination
Knowledge Sharing the Traditional Way. In Ubay, knowledge sharing
was unsystematic and opportunistic. Sources varied according to access. Each
user accessed whatever he/she needed from sources within his/her reach (Fig.
18). It will be no surprise to know that certain members of the organization had
more knowledge about a specific subject than others even if they were supposed
106

to work on the same commodity. Basically, their knowledge base was
inadequate, hence, the knowledge that they shared to their clients was also
inadequate. Participants in the exchanges, since these were unorganized, did not
have full and consistent contact and since no discernible outputs of the
exchanges were recorded, the exchanges were ineffective. Take rice technology.
It appeared that not all members of the organization had the same level of
knowledge about certain varieties of rice because some aspects of the
technology were not captured at all. For example, a variety was introduced but
they failed to know that such a variety was susceptible to a certain disease thus
causing farmer adoptors to be unprepared for the occurrence of such and it did
occur leading to crop failures of as many as two times in succession.
The lack of records of knowledge captured and shared probably explains
distortions on nomenclatures, procedures and processes. A specific example is
how varieties within a locality take on different names as exchanges are made
without recording their exact names.
OMA
Farmer
Input Dealer
DA/OPA/BES
NGO
Others (SUC)
Fig. 18. The existing knowledge sharing process
107

A difficulty in sharing and disseminating knowledge was the lack of a
system of codifying and storing them. Moreover, there was no clear policy and
process of sharing even when there was a genuine interest and opportunity to
share. Even the echo seminars, which were used as a mechanism to share
knowledge gained in seminars among the staff were never done. In addition, the
staff was sometimes confused as to what to share. For example, they obtained
mostly chemical farming technologies from government sources but they also
obtained sustainable farming technologies from both government and non-
government sources. They were worried that farmers would be confused too.
Taking off from the best practice strategy, best practices captured must be
shared in a systematic manner through farmers’ meetings, trainings, field days
and testimonies. Furthermore, best practice farmers may be transformed into
Farmer-Scientists under the TechnoGabay Program which was present in Ubay.
The office should make it a policy and must set up processes including a reward
system to motivate these farmers to share their knowledge.
Communities of Practice (CoPs). A strategy to build communities of best
practice among farmers and other industry players with the local extension
service playing an active role in these CoPs (Fig. 19) may be in order. There
were already discernible CoPs that existed where they exchanged knowledge
mostly verbally, face-to-face among extension workers, farmers, private service
providers and other government sources. It must be noted though, that there
seemed to be no systematic recording of the knowledge exchanged and the most
that could be said is that these were noted mostly mentally. Nor was there an
attempt to record best practices even when practitioners of such were known.
Years ago, government extension workers were trained to use farmers to teach
other farmers and these was premised on the idea of farmer leaders who
demonstrated best practices. This never took hold as a methodology in the local
extension service and even in the case of Ubay which had a TechnoGabay
program which included among the package a Farmer Scientist component
108

designed to identify, train and maintain a corps of volunteers who were willing to
share their knowledge to other farmers.
Real CoPs are characterized by three common characteristics: 1.
members have a common goal which binds them together; 2. mutual
engagement, which explains why a member wants to join and perform certain
roles for the community; and 3. a shared repertoire or workspace where
members can share through discussions and interactions that leave tangible
archives which is the social capital of the community.35 Members of the
community are expected to help one another and the community is expected to
be self-regulating. The extension service being the sponsor of such a community
shall act as the CoP facilitator who shall be the chief organizer of events,
clarifying communications and make sure that everyone participates. It could also
serve as knowledge integrator coordinating with other CoPs and makes sure that
duplications are avoided and facilitates requests for help. The Practice leader
could be one of the best practice farmers who will serve as coach to other
members, provide thought leadership and validate innovations and best
practices. All members are expected to promote the CoP, generate enthusiasm
and demonstrate its value.36 The CoP may have more complicated structures but
the above may suffice for simpler and resource poor organizations.
This strategy would fit nicely to the transmission of tacit knowledge which
these best practice farmers are likely to demonstrate. These farmers are some of
the knowledge assets in the locality and the added feature is that they had
adapted their knowledge to the local conditions. A good way this tacit knowledge
can be transmitted is through demonstration since this is rarely recorded in any
form by the practitioners themselves or by their peers but may be learned by
observation. Moreover, learning tacit knowledge is a social process which
requires group interaction.37
35 Dalkir, pp. 123-124. 36 Ibid, pp. 126-127. 37 Ibid. p. 80.
109

OMA (Facilitator, integrator)
Farmer (Practice Leader)
NGO (Member)
Input dealer
(Member)
Others (Member)
Researcher (Member)
DA (Member)
Farmer (Member)
Farmer (Member)
Farmer (Member)
Farmer (Member)
Farmer (Member)
Fig. 19. A knowledge sharing scheme using local knowledge assets (Best practice farmers) through CoPs facilitated by the OMA
In Ubay, the variations in conditions for growing rice were many--“lansub,”
“sinaka,” sandy, saline to name a few. These variations call for separate cultural
management practices and it is the job of the extension service to provide
guidance to local farmers by making them aware of best practices on cultural
management already suited to the conditions of their area if they were not
already aware of these through a CoP.
Communities of Practice in Mango. In the “convoluted” mango industry
the local extension service not having any respectable expertise in mango may
choose to participate in a CoP functioning as a facilitator and integrator. This was
110

already done to some extent by the office but in a very limited unsystematic way.
It can enhance its role by consciously capturing knowledge and storing it in a
repository and sharing it through a CoP. It is worth mentioning that some local
players in the industry use the internet as a source of information and there are
umerous local knowledge assets that can enhance the value of such a CoP.
Fig. 20. An idealized role of the OMA in a CoP for mango
. now dge sharing performance 39
n
Researcher Planter Contractor
OMA (facilitator /integrator)
Private Ext. worker
Financier
Others (Industry)
Buyer Input dealer
The benefits of sharing knowledge through a CoP are that it connects best
practitioners, practices are standardized and mistakes are avoided to name a
few.38The implications of knowledge sharing are as follows: 1. that management
should provide a climate and culture of networking; 2. travel must be supported
and time should be provided for sharing; and 3 k le
should be included in the performance review.
38 Dalkir, pp. 137-138. 39 Dalkir, p. 139.
111

Kn edge Application The test of the usefulness of a knowledge management system is
knowledge application. This is not simply having users use knowledge but on the
part of the extension service as facilitator and integrator, it is important that it is
able to understand which knowledge is useful to which group of clients and how
best to make it available to them. Furthermore, the more crucial task, as any
extension worker may have already known is making the user decide to use it
because it proves to be an improvement of his usual practice. In highly
technology-mediated KM systems, several tools had been recommended to
facilitate decision-making. For a poorly equipped KM system such as one
administered by the local extension service, a basic requirement, at least, is that
knowledge is codified and stored in a repository which can readily be accessed
by members of the organization or network. The most likely that the local
extension service could do is reduce these mostly explicit knowledge into simple
manuals that farmers can understand easily. Tacit knowledge that may reside
among best practice farmers could be shared through various strategies such as
on-site trainings, field days and informal interactions with them. It had been
asserted that even in highly technology-mediated systems, the value of person-
to-person interaction is very high considering that tacit knowledge is difficult to
put into record. It is necessary, therefo
owl
re, that these farmers be identified,
d
supported, recognized and documented.
Recognizing that tacit knowledge is the more important kind, the extension
service must be reminded that it involves more than the cognitive. In fact,
ordinary farmers had observed that high performers stand out for their personal
characteristics, attitudes and values, specifically, industry and the lack of vices.
In a group interview of local farmers about the major issues affecting agriculture,
it was concluded that while there were extraneous factors that affected farming,
so much still depended on the farmer himself and basically his attitude an
industry. It is useful, then to learn Bloom’s taxonomy of learning objectives.40
Farmers may only be at the lower level of learning such as awareness and
112

comprehension but fail to analyze, synthesize and evaluate. This could have
been a result of the highly top-down approach to extension where knowledge
was handed down to farmers and all they had to do was follow without question.
The bigger task of extension is to make farmers able to understand, analyze and
evaluate to make their own decisions. Of course, decisions will have to be made
depending on how much value the farmer attaches to a particular object. He
must be able to prioritize these values, synthesize these to form a unique value
system that controls his behavior.41 This value system then becomes pervasive,
consistent, predictable and characteristic of the individual42 such as the best
ctitioners.
rgan
pra
.
O izational Culture
Knowledge Management thrives under an organizational culture that
encourages and nurtures the search for new knowledge, stores these
systematically and shares these so that these could be used in an effort to
achieve efficiency. Dalkir classified organizational cultures into four types: 1.
communal culture—task-driven but gives a sense of belongingness to its
members. It has inspirational leaders. The disadvantage is that these leaders
exert too much influence and other members rarely voice out their opinions; b.
networked culture—members are close and are treated as family. They are
willing to help each other and share information. The disadvantage is that people
are too close they are reluctant to point out poor performance; c. mercenary
culture—goal oriented and members are expected to meet goals quickly. The
major disadvantage is that poor performers may be treated inhumanely; 4.
fragmented culture – the sense of belonging is weak. There is lack of
cooperation.43 In the case of the Ubay Municipal Agriculture Office, the
organization could be described as having a networked culture. Members were
40 Cited in Dalkir, pp. 153-157. 41 Ibid. p. 155. 42 Ibid. 43 Ibid. pp. 181-182.
113

close to each other, treated as family and there was willingness to help and
share.
There were major flaws in the organizational culture of the local extension
service in that while there was an openness and willingness to gain new
knowledge, there were basic knowledge deficiencies such as the lack of shared
knowledge on the vision and mission of the organization, a common knowledge
on local conditions (situational analysis), the lack of knowledge and skills on how
to gather, store and analyze data and how to incorporate these data into a plan,
and how should planning proceed so that the major stakeholders are able to
input into this plan. There seemed to be little appreciation of the importance and
potential to extension of knowledge assets and nurturing communities of practice
even as they already existed in some form. There was a basic lack of encoded
knowledge on production technologies for various crops. Sadly, the technical
support components—computers, storage and retrieval systems, and expertise
to put these into a digital format was also absent. Putting records into electronic
files even in the presence of a computer and staff who could have inputted these
as not a standard practice. No wonder, data also varied without explanation
ecause there was no system to gather, verify and store.
w
b
114

CHAPTER 6
CONCLUSIONS AND RECOMMENDATIONS Implications for Knowledge Management in a Localized, Low- resource
Extension Delivery System
Conclusions
Ubay had great potentials for agricultural productivity because of the
amenability of its soil and topography to agricultural production and the presence
of various programs implemented in the locality especially the expansion of
irrigation systems and the improvement of other infrastructure. However, the
small farm sizes and high seasonality of production made income from farming
inadequate for many farmers and there was a seeming lack of opportunities to
earn additional income from off-farm sources due to the absence of non-
agricultural enterprises and the seeming excess labor supply. Its farmers were
generally small farmers cultivating mostly upland farms. The population was
generally poor putting Ubay in the poorer half among a ranking of towns in Bohol.
The town had a small agricultural extension organization despite its
relatively large size. While there was high moral support to the OMA by the local
elected authorities, the resource limitations of the local government necessitated
that meager budgets were allocated to all services especially agricultural
extension. It becomes more important, then, that the meager resources be put to
good use so that farm productivity and incomes can be achieved by the farmers.
Some of the salient problems in the provision of extension services are as
follows:
1. Absence of a well-thought out plan for agricultural development of the
town. Such a plan should be shared by all stakeholders especially the staff of the
extension service organization.
2. The lack of a system of technology sourcing, archiving and sharing so
that clients who were mostly of lower education could comprehend and use them
for decision-making.
3. The inadequacy of support services especially low-cost credit to allow
small farmers to capitalize their farm enterprises, marketing assistance so that
115

farmers get better returns on their produce and location-specific technologies
adapted to rainfed farming systems to allow farmers the best use of their land.
4. Due to the small organization and high population to be served, the
inadequacy of extension services and the lack of effective strategies and facilities
to promote knowledge capture, sharing and application hampered the
widespread adoption of productivity-enhancing technologies.
Recommendations: Shifting to a Knowledge Management Paradigm in Extension
Agricultural extension is a knowledge-based activity and farmers and
extension workers must be seen as knowledge workers who must depend on
knowledge for their productivity. Presently agricultural extension workers and
farmers still seemed to believe that knowledge resided only in the extension
service and it was its job to transmit these to farmers. Considering the many
demands on the extension workers and the small size of the extension service
organization, it might be useful to shift to a more effective strategy using the
Knowledge Management Framework. This shift entails the following:
1. Preparing the organization for KM and creating a culture for KM. This
means that the organization and its members as well as the farmers shall be
made aware of organizational change. This also entails a shift in the concept of
the agricultural extension system which treats farmers as external to the
organization because they are viewed as clients. The farmers are internal to the
system which means they are part of the whole KM cycle creating and capturing
knowledge, sharing and applying these. Everybody in the system then is
considered a knowledge worker whose business it is to capture, organize and
summarize this knowledge to make daily decisions. A training of the staff and
farmers on KM is necessary. It is important, as suggested by Dalkir, that cultural
change is needed to set norms that promote a culture of KM. Citing Gruber and
Duxbury, he enumerated the characteristics of a favourable environment as
follows: a. a reward structure that recognizes knowledge sharing with peers; b.
openness, no hidden agendas; c. communication and coordination between
116

44groups; d. trust; and, e. top management support. This means that the
organization should provide incentives not only for knowledge sharing but
knowledge capture as well. Communication and coordination with all possible
collaborators should be systematic and frequent and initiatives should be
supported by the LGU.
2. Adopting KM as a framework for extension. The staff must accept the
new framework as a viable strategy. This can be done by formulating a policy
adopting the strategy through a resolution by the local legislative body to give
legal mandate to the shift.
3. Training the staff on skills on knowledge capture, encoding, sharing,
organizing communities of practice and knowledge application. This could include
basic data gathering, record keeping, data analysis, computer literacy, use of
internet, etc.
4. Establishing a knowledge repository in the agriculture office. Since
limited electronic facilities are available, this repository can be simplified into
anecdotal accounts of technologies, practices, reports and other documents in
written and electronic form. The staff should reduce the vast array of materials
into simplified set of procedures that farmers could understand easily. There
must be an archive of the knowledge created or captured. This necessitates that
all staff must produce a record of the knowledge that they have created or
captured and contribute these to the repository. For example, there should be a
list of farmers who yielded 10 tons of rice or higher. A documentation of their
farms and cultural management practices should be made. This could be done
through interviews with these farmers. In other cases, observations from field
trips, field trials and conversations with information sources must be recorded.
For example, there should be required written records of the observations made
by staff who visited a balut maker in order to learn about the process of balut
making, marketing strategies and problems. The organization spent money on
staff specifically to learn this and it would be important that this learning is
codified, encoded and shared among the staff and more importantly, with
44 Ibid. p. 187.
117

farmers. Additionally, informal trials had been made on the Masipag varieties of
rice. To date, no written record of experiences had been made on observations
such as on which varieties did better and under what conditions in Ubay; how
these varieties performed in other locations; and, how farmers who yielded
higher obtained those yields. The basic characteristics of the varieties as
observed had not even been recorded on paper.
5. The knowledge deemed useful for specific groups of farmers then shall
be shared to other farmers for trial adoption, corroboration and wider application
through various means such as farm visits, farmers’ meetings, trainings,
technodemo, print media and other channels. The network of adoptors shall then
comprise a CoP that shall be facilitated by the OMA. The OMA should put into
practice the Magsasaka-Siyentista (MS) concept under the TechnoGabay
program which was present in Ubay. These farmers should be identified and
trained if there were none yet. Best practitioners shall be the major candidates
for MS.
6. Since the CoP will be limited in its use of electronic technology, a
person-to-person approach shall be adopted. Nevertheless, the role of the
internet should not be discounted as OMA may leverage resources to get internet
facilities and some farmers may have the same opportunity in their private
capacity. In addition, the pervasiveness of the cellphone may provide additional
advantage. The CoPs, which shall take the main route for sharing and
verification, in order to be sustained must have regular procedures and rules. In
what form should exchanges be, how frequent, where should these be made in
lieu of an electronic space, how should participation be sustained, what are the
rules for joining, etc. The OMA should be able to facilitate the CoP which need
not be put up quickly. Methodologies for sharing and evaluating including the use
of some assessment tools such as the gross margin profit tool, etc, should also
be adapted as the need arises.45
45 The Continuous Improvement and Innovation (CI&I) approach is replete with tools as it works through CoP type groups.
118

7. Providing for KM: personnel, equipment, budget. The staffing of the
extension office must be rationalized to suit to the demands of the service. Staff
will now have to take specialization on major commodities to be able to facilitate
the CoPs. Positions may not have to be renamed but they may have to be
trained also as subject matter specialists who are able to gather knowledge and
reduce this knowledge into usable form by the farmers.
8. The field visits of the staff should be more systematic and organized
serving as a regular facilitating and integrating task among CoPs on different
crops. The gasoline allowance should be maintained or increased to make field
visits more frequent and regular.
9. Additional or new computers should be obtained and at least one
should have internet connection to allow the staff to search for more knowledge
and reach more knowledge sources. Necessarily, all staff must be trained to use
the internet and search and send communication at least through e-mail. Or the
staff may be allowed expenses and time for internet use. Consequently, the
budget for travel, telephone service, internet, meetings and facilitation of the
CoPs will have to be provided.
10. The national government through the DA should adopt a grant system
for LGUs willing to shift to KM on an experimental basis for training, equipment
and information support. The grant should be based on a proposal specifying the
needs and capacities of proponent LGUs.
11. The national government through the BAR, ATI and State Colleges
and Universities (SCUs) should provide assistance in linking LGUs to information
databases and training them in archiving and assisting them in information
packaging. Information packages then should be integrated into the (Farmers’
Information and Technology Services (FITS) center.
119

References
Bohol Experimental Station. Undated. Profile: Bohol Experimental Station (Pamphlet). Bohol Integrated Agricultural Promotion Program (BIAPP). 1998. Baseline Survey. ___________________ . 1998 -2000. Rice Crop Cut Yield Surveys. ___________________ . 2001. Training and Information Activities (1997-2001). Bureau of Fisheries and Aquatic Resources. Undated.Ubay Brackish Water fish Farm. (Pamphlet). Central Visayas Integrated Agricultural Research Center. (CENVIARC). Undated. Untitled Documents on Mango Production in Bohol. Dalkir, Kimiz. 2005. Knowledge Management in Theory and Practice, Boston: Elsivier, Inc. David, Cristina et. al. 1998.. Philippine Agriculture and Natural Resources Allocation: Issues and Directions for Reform. Philippine Institute of Development Studies: Discussion Paper No. 99-30. Department of Agriculture. Undated. Ubay Stock Farm: Station Profile (Pamphlet). Kakuta, Ieko. 1999. Problems of Capayas Irrigation Project with the Viewpoint of Social Aspects. __________ . 2000 & 2001. Finding of the Survey on Capayas Irrigation Project Irrigators Associations. Kroma, Margaret M. 2004. Farmers’ Knowledge Networks: Facilitating Learning and Innovation for a Multi-functional Agriculture. Local Development Assistance Program. 1992-97. Rapid Appraisal of Decentralization. prepared by the from 1992-1997. Municipal Agriculture Office. 1997-2004. Municipal Agriculture Profiles. ______________________ . 2003. Work Program. ______________________ . 2004. Ubay Coastal Resource Management Plan.
120

______________________ . 2004. Municipal Livestock Dispersal Inventory. ______________________ . 2005. Consolidated Data During the Second Cropping Season (2004-05). ______________________ . Undated. Annual Development Plan. ______________________. Undated. Convergence Plan for Agricultural Development of Ubay. Municipal Land Reform Office. Undated. Municipal Agrarian Reform Development Plan for Ubay, Bohol. _______________________ . Undated. Municipal Profile of Ubay. _______________________ .Undated. Accomplishment Reports Municipality of Ubay. 2002. Comprehensive Land Use Plan. ________________ . Undated. Various Financial and Budget Documents with Corresponding Municipal Ordinances. ________________ . 2004. Manning Profile and Municipal Staffing Pattern. National Irrigation Administration. Undated. Bohol Irrigation Project Stage II, (Pamphlet). __________________________ . Undated. The Capayas Irrigation System. National Statistics Office. 1961-1991. Census of Agriculture ___________________ . 2000. Census of Population and Housing. ___________________ . 1987-1997. Family Income and Expenditure Survey. Philippine Carabao Center. Undated. The Philippine Carabao Center at Ubay Stock Farm (Pamphlet). Republic of the Philippines. 1991. Local Government Code (RA 7160). _____________________. 1997. Agriculture and Fisheries Modernization Act. (RA 8435).
121

Sarris, Alexander. 2001. The Role of Agriculture in Economic Development and Poverty Reduction: An Empirical and Conceptual Foundation. The World Bank: Rural Development Strategy Background Paper No. 2. Saz, Efren B. 2001. Social Impact Assessment of the Bohol Integrated Agricultural Promotion Project (BIAPP) Activities in the Capayas Irrigation Project (CIP) Sub-Site, Ubay, Bohol, Philippines. Yasumasa, Koga. 2001. Report by a Short-Term Expert.
122

Appendix Tables Appendix Table 1. Current and projected population, Ubay, 2000-2012.
Year Projected Population 2000 59,827 2001 61,830 2002 63,900 2003 66,039 2004 68,250 2005 70,534 2006 72,896 2007 75,336 2008 77,858 2009 80,465 2010 83,158 2011 85,942 2012 88,819
Source: NCSO Appendix Table 2. Urban and rural population by barangay, 2000.
Barangay Population % to Population
Household Population
% to Total Household Pop.
Number of Household
13,116 21.92 13,060 21.86 2,446 A. Urban Barangays
Urban Center 1 1. Bood 2, 087 3.49 2,075 3.47 395 2. Fatima 2, 813 4.70 2,801 4.69 541 3. Poblacion 3, 418 5.71 3, 386 5.67 636
Urban Center 2 5. Cuya 468 0.78 468 0.78 83 6. Guintabuan 536 0.90 536 0.90 100 7. Juagdan 1,083 1.81 1,083 1.81 214 8. Tintinan 756 1.26 756 1.27 118
46,711 78.08 46,691 78.14 9,066 B. Rural Barangays 1. Achila 1,102 1.84 1,102 1.84 221 2. Bay-ang 1,536 2.57 1,536 2.57 270 3. Benliw 814 1.36 814 1.36 155 4. Biabas 2,142 3.58 2,139 3.58 470 5. Bongbong 728 1.22 728 1.22 139 6. Buenavista 648 1.08 648 1.08 124 7. Bulilis 1,391 2.33 1,391 2.33 251 8. Cagting 1,866 3.12 1,866 3.12 342 9. Calangaman 1,284 2.15 1,284 2.15 257 10. California 814 1.36 814 1.36 139 11. Camali-an 454 0.76 454 0.76 99 12. Camambugan 2,038 3.41 2,038 3.41 382 13. Casate 1,976 3.30 1,976 3.31 368
123

124
14. Gabi 1,186 1.98 1,186 1.98 231 15. Gov. Boyles 944 1.58 944 1.58 190 16. Hambabaoran 854 1.43 854 1.43 158 17. Humayhumay 1,674 2.80 1,674 2.80 300 18. Ilihan 735 1.23 735 1.23 138 19. Imelda 1,850 3.09 1,844 3.09 348 20. Katarungan 1,089 1.82 1,089 1.82 231 21. Lomangog 1,641 2.74 1,641 2.75 341 22. Los Angeles 213 0.36 213 0.36 42 23. Pag-asa 921 1.54 921 1.54 171 24. Pangpang 962 1.61 962 1.61 186 25. San Francisco 1,780 2.98 1,780 2.98 339 26. San Isidro 581 0.97 581 0.97 119 27. San Pascual 3,015 5.04 3,004 5.03 604 28. San Vicente 987 1.65 987 1.65 211 29. Sentinila 836 1.40 836 1.40 168 30. Sinandigan 1,883 3.15 1,883 3.15 340 31. Tapal 1,136 1.90 1,136 1.90 255 32. Tipolo 2,124 3.55 2,124 3.55 419 33. Tubog 844 1.41 844 1.41 153 34. Tuburan 1,104 1.85 1,104 1.85 203 35. Union 2,042 3.41 2,042 3.42 430 36. Villa Teresita 1,517 2.54 1,517 2.54 272 TOTAL 58,827 100 59,751 100 11.512 Province of Bohol 1,137,268 5.26% REGION VII 5,701,064 1.05% Philippines 79,498,735 0.08%
Appendix Table 3. Literacy of the household population 10 Years old and over by age group and sex, 1990
Total Urban Rural Age
group, Sex
Total Literate Illiterate Total Literate Illiterate Total Literate Illiterate
Both sexes
34,249 31,173 3,076 5,594 5,349 245 28,655 25,824 2,831
10-14 6,896 6,981 655 1,047 1000 47 5,849 5,241 608 15-19 5,240 4,981 259 828 808 20 4,412 4,173 239 20-24 4,071 3,897 174 729 720 9 3,342 3,177 165 25-29 3,242 3,097 145 575 558 17 2,667 2,539 128 30-34 2,874 2,720 154 486 472 14 2,388 2,248 140 35-39 2,378 2,221 157 395 380 15 1,983 1,841 142 40-44 1,974 1,829 145 319 313 6 1,655 1,516 139 45-49 1,871 1,691 180 285 273 12 1,586 1,418 168 50-54 1,482 1,516 166 228 218 10 1,254 1,098 156 55-59 1,277 1,053 224 202 183 19 1,075 870 205 60-64 1,051 829 222 171 151 20 880 678 202 65-69 760 559 201 133 114 19 627 445 182 70-74 565 387 178 90 75 15 475 312 163 75-79 315 192 123 61 49 12 254 143 111
80-over 253 160 93 45 35 10 208 125 83 Source: CLUP

125
Appendix Table 4. Population 7 years old and over by highest educational attainment, age group and sex, 1990.
AGE GROUP Highest Educational Attainment
Household
Pop’n 7 Years Over
Below 20 20-24
25-29
30-34
35-39
40-44
>45
Total 38,547 16,434 4,071 3,242 2,874 2,378 1,974 7,574 No grade completed
1,685 502 33 54 44 50 59 943
Pre-school 1,100 1,060 6 3 2 2 1 26 Elementary 25,806 11,767 2,006 1,737 1,809 1,602 1,438 5,447
1st-4th grade 14,881 7,886 821 687 758 743 706 3,280 5th-7th grade 10,925 3,881 1,185 1,050 1,051 859 732 2,167
High School 6,953 2,702 1,267 895 609 461 308 711 Undergrad 4,632 2,185 714 465 339 268 200 461
Graduate 2,321 517 553 430 270 193 108 250 Post Sec 260 30 77 51 37 24 10 31
Undergrad 72 14 25 15 6 5 3 4 Graduate 188 16 52 36 31 19 7 27
College graduate 1,420 243 430 251 183 109 58 146 Degree holder 1,018 15 215 224 155 106 83 220 Not stated 305 115 37 27 35 24 17 50
Source: CLUP
Appendix Table 4. Population 15 years old and over by sex and employment status, 1990.
In the Labor Force (Economically Active)
Sex Household Population
Employed % Unemployed
%
Not in the labor force
%
Male 13,699 8,831 32.57 1,521 1.84 3,347 12.34 15-19 2,636 686 2.53 500 1.49 1,450 5.35 20-24 2,199 1,161 4.28 405 0.67 633 2.33 25-29 1,488 1,032 3.81 183 0.22 273 1.01 30-34 1,418 1,184 4.37 60 0.53 174 0.64 35-39 1,220 933 3.44 144 0.21 143 0.53 40-44 1,047 890 3.28 58 0.15 99 0.37 45-49 903 713 2.63 40 0.21 150 0.55 50-54 746 630 2.32 56 0.11 60 0.22 55-59 607 470 1.73 29 0.07 108 0.40 60-64 457 394 1.45 18 0.03 45 0.17 65-69 415 823 3.04 9 0.04 83 0.31 70-74 340 276 1.02 10 0.03 54 0.20 75-79 101 74 0.27 9 - 18 0.07
80 - over 122 65 0.24 - 5.09 57 0.21 Female 13,415 3,423 12.62 1,380 0.93 8,612 31.76 10-14 2,365 528 1.95 252 0.96 1,585 5.85 15-19 2,117 681 2.51 259 0.56 1,117 4.34 20-24 1,509 325 1.20 153 0.41 1,031 3.80 25-29 1,445 348 1.28 110 0.63 987 3.64 30-34 1,169 279 1.03 170 0.23 720 2.66
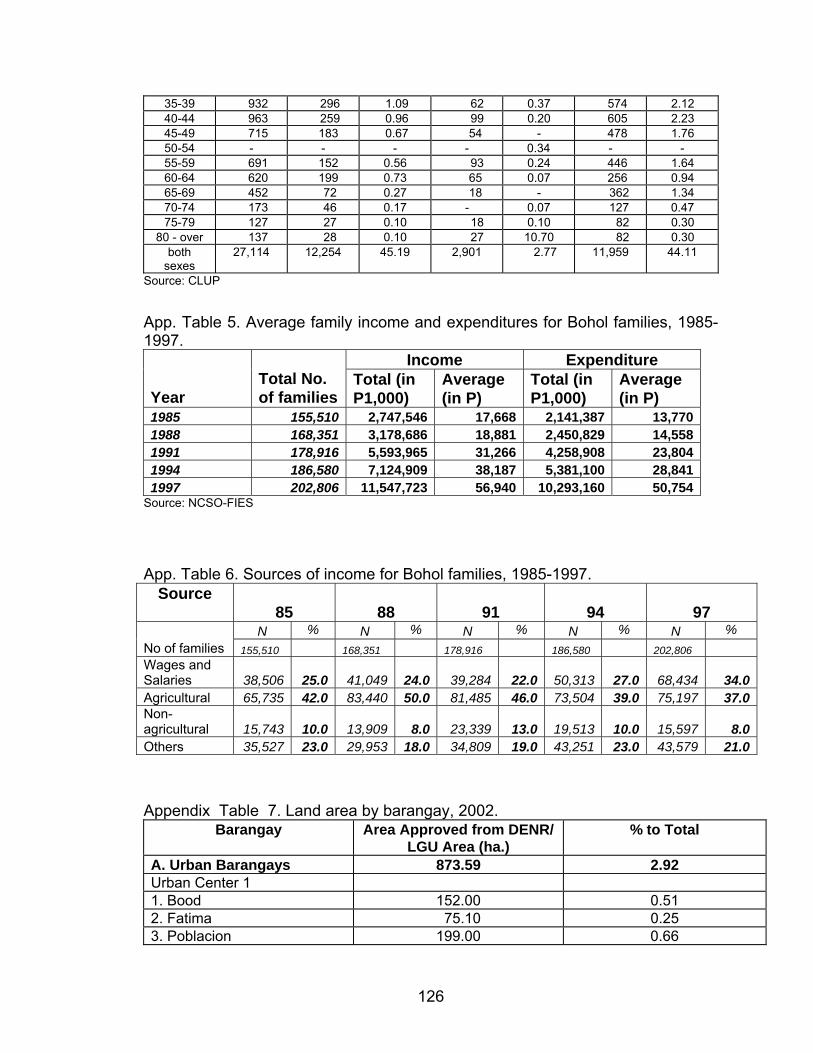
35-39 932 296 1.09 62 0.37 574 2.12 40-44 963 259 0.96 99 0.20 605 2.23 45-49 715 183 0.67 54 - 478 1.76 50-54 - - - - 0.34 - - 55-59 691 152 0.56 93 0.24 446 1.64 60-64 620 199 0.73 65 0.07 256 0.94 65-69 452 72 0.27 18 - 362 1.34 70-74 173 46 0.17 - 0.07 127 0.47 75-79 127 27 0.10 18 0.10 82 0.30
80 - over 137 28 0.10 27 10.70 82 0.30 both
sexes 27,114 12,254 45.19 2,901 2.77 11,959 44.11
Source: CLUP
App. Table 5. Average family income and expenditures for Bohol families, 1985-1997.
Income Expenditure Total No. of families
Total (in P1,000)
Average (in P)
Total (in P1,000)
Average (in P) Year
2,747,546 17,668 2,141,387 13,7701985 155,5103,178,686 18,881 2,450,829 14,5581988 168,3515,593,965 31,266 4,258,908 23,8041991 178,9167,124,909 38,187 5,381,100 28,8411994 186,580
11,547,723 56,940 10,293,160 50,7541997 202,806Source: NCSO-FIES App. Table 6. Sources of income for Bohol families, 1985-1997.
Source 85 88 91 94 97
% % % % % N N N N N No of families 155,510 168,351 178,916 186,580 202,806
Wages and Salaries 38,506 41,049 39,284 50,313 68,43425.0 24.0 22.0 27.0 34.0Agricultural 65,735 83,440 81,485 73,504 75,19742.0 50.0 46.0 39.0 37.0Non-agricultural 15,743 13,909 23,339 19,513 15,59710.0 8.0 13.0 10.0 8.0Others 35,527 29,953 34,809 43,251 43,57923.0 18.0 19.0 23.0 21.0
Appendix Table 7. Land area by barangay, 2002. Barangay Area Approved from DENR/ % to Total
LGU Area (ha.) A. Urban Barangays 873.59 2.92 Urban Center 1 1. Bood 152.00 0.51 2. Fatima 75.10 0.25 3. Poblacion 199.00 0.66
126

4. Tapon 153.10 0.51 Urban Center 2 5. Cuya 65.60 0.22 6. Guintabuan 66.00 0.22 7. Juagdan 131.00 0.44 8. Tintinan 31.79 0.11 B. Rural Barangays 29,077.29 97.08 1. Achila 384.00 1.28 2. Bay-ang 632.00 2.11 3. Benliw 588.885 1.97 4. Biabas 2,200.00 7.35 5. Bongbong 161.2939 0.54 6. Buenavista 651.54 2.18 7. Bulilis 739.7901 2.47 8. Cagting 1,044.00 3.49 9. Calangaman 617.9729 2.06 10. California 319.3622 1.07 11. Camali-an 532.24 1.78 12. Camambugan 547.00 1.83 13. Casate 460.00 1.54 14. Gabi 1,646.00 5.50 15. Governor Boyles 824.40 2.75 16. Hambabaoran 521.8956 1.74 17. Humayhumay 815.43 2.72 18. Ilihan 1,683.00 5.62 19. Imelda 657.16 2.19 20. Katarungan 408.56 1.36 21. Lomangog 642.1028 2.14 22. Los Angeles 274.4039 0.92 23. Pag-asa 377.9794 1.26 24. Pangpang 450.00 1.50 25. San Francisco 1107.133 3.70 26. San Isidro 262.00 0.87 27. San Pascual 972.6977 3.25 28. San Vicente 4965.8237 16.58 29. Sentinila 271.00 0.90 30. Sinandigan 607.278 2.03 31. Tapal 289.50 0.97 32. Tipolo 655.00 2.19 33. Tubog 444.4174 1.48 34. Tuboran 547.7415 1.83 35. Union 514.00 1.72 36. Villa Teresita 1,261.68 4.21 TOTAL 29,950.88 100.00 Province of Bohol 411,730.00 7.27 Region VII 1,495,140.00 2.00 Philippines 30,000,000.00 0.10
source: NCSO/DENR/BL/Cadastral Survey/LGU
127

App. 8. Table Land Capability Classification, 2002 Land Capability Classifications
Land Capability Characteristics
Soil Characteristics
Flood Hazard Condition
Slope/ Erosion Potential Condition
Land Area Coverage
In Has. % “A” Very good land,
can be cultivated safely, requiring only simple but good farm management practices.
No to slight soil limitations; loamy profile
No to slight flooding ; well drained
Level to nearly level; no to slight erosion
14,117.77
47.14%
“Cce” Moderately good land; must be cultivated with caution; requires careful and intensive conservation practices
Moderate soil condition limitation
No to slight flooding hazard
Moderately slope, severely eroded
4,844.33 16.17%
“Cw” -do- Moderate soil limitation; fine soil permeability
Moderate flooding hazard
Level to nearly level; no to slight erosion
2,476.04 8.27%
“Dw” Fairly good land; must be cultivated w/ extra caution ; requires careful management & complex conservation practices for safe cultivation; more suitable for pasture
Very poor permeability
Severe flooding
Level to nearly level
4,365.36 14.58%
“Ds” - do- Serious soil conditions limitation
No to slight flooding hazard
Gently to moderately sloping; slightly eroded
790.35 2.64%
“LLw” Level to nearly level too stony or very wet for cultivation; limited to pasture or forest with careful management
Very wet Severe to very wet
Level to nearly level; no slight erosion
221.06 0.74%
“N” Steep land; very severely eroded; shallow for cultivation; limited to pasture or forest
Soil too shallow for cultivation
No flooding
Very steep; severely eroded
226.61 0.76%
128

w/ careful management
“X” Level land; wet most of the time & cannot be economically drained; suited for fishpond or recreation
Wet most of the time
Very severely flooding hazard
Level; no slight eroded
1,103.24 3.68%
“Y” Very hilly & mountainous, barren & rugged, should be reserved for recreation & wildlife or for reforestation
Rugged and mountainous
No flooding
Very hilly, very severely eroded
1,806.12 6.03%
Total 29,950.88
100.00
Table 24. Area planted to mango, Bohol, 2003.
Municipality Area (ha) % ALBURQUERQUE 18.14 0.51 ALICIA 64.54 1.81 ANDA 8.33 0.23 ANTEQUERA 11.97 0.34 BACLAYON 37.64 1.05 BALILIHAN 235.24 6.59 BATUAN 37.53 1.05 BIEN UNIDO 70.2 1.97 BILAR 35.77 1.00 BUENAVISTA 202.57 5.68 CALAPE 92.4 2.59 CANDIJAY 66.55 1.87 CARMEN 96.17 2.70 CATIGBIAN 56.84 1.59 CLARIN 129.43 3.63 CORELLA 59.2 1.66 DAGOHOY 37.39 1.05 DANAO 150.78 4.23 DAUIS 123.91 3.47 DIMIAO 69.98 1.96 DUERO 83.28 2.33 GARCIA HERNANDEZ 27.32 0.77 GETAFE 78.35 2.20 GUINDULMAN 82.23 2.30 INABANGA 69.73 1.95 JAGNA 40.05 1.12 LILA 8.56 0.24
129

LOAY 12.35 0.35 LOBOC 25.53 0.72 LOON 19.14 0.54 MABINI 44.94 1.26 MARIBOJOC 41.41 1.16 PANGLAO 81.56 2.29 PILAR 182.34 5.11 PRES. GARCIA 57.56 1.61 SAGBAYAN 56.09 1.57 SAN ISIDRO 5.54 0.16 SAN MIGUEL 260.49 7.30 SEVILLA 19.53 0.55 SIERRA BULLONES 87.41 2.45 SIKATUNA 1.09 0.03 TAGBILARAN 20.32 0.57 TALIBON 101.1 2.83 TRINIDAD 122.46 3.43 TUBIGON 69.1 1.94 UBAY 297.75 8.35 VALENCIA 68.1 1.91 Total 3,567.91 100.00
130

131
App. Table 10. Area, number and location of CARPable areas, 2000 No. of LO No. of FBs Area in Hectares TOTAL Barangay OLT CA VOS GFI GOL/
NRDP
Achila 4 62 11 126 137 Bay-ang 5 74 39 39 Benliw 4 141 4 37 228 269 Biabas 5 30 15 10 25 Bongbong 1 6 5 5 Bood 11 59 56 29 85 Buenavista 3 31 31 31 Bulilis 3 352 439 198 17 654 Cagting 2 203 43 139 191 373 Calanggaman 8 32 8 37 4 49 Camali-an 9 74 7 15 56 78 Camambugan 12 57 6 126 132 Casate 13 35 23 45 1 69 Gabi 15 85 45 117 1 163 Gov. Boyles 7 43 23 12 13 48 Hambabauran 3 18 14 26 40 Humayhumay 5 31 7 11 38 7 63 Ilihan 5 18 8 7 15 Imelda 1 178 516 516 Katarungan 3 18 4 20 24 Lomangog 3 35 21 9 15 45 Pangpang 5 103 68 14 14 96 Pag-asa 3 6 2 19 21 San Francisco 2 313 1 673 674 San Isidro 1 1 1 1 San Vicente 1 3 8 8 Sentinela 1 3 6 6 Sinandigan 4 126 10 69 42 226 347 Tapal 3 12 1 18 19 Tipolo 3 10 4 7 1 12 Tubog 7 51 49 46 95 Tuburan 10 75 25 31 45 101 Union 4 8 5 14 19 Villa Teresita 5 24 16 17 33 Total 171 2317 992 1137 1155 36 972 4292 *Distributed & for Acquisition, LO-land owner, FBs-Farmer Beneficiaries, OLT-Operation Land Transfer CA - Compulsory Acquisition, VOS - Voluntary Offer to Sell, GFI - Gov’t. Financing Institution App. Table 11. Status of Agrarian reform program implementation
PHASE I PHASE II OLT
PD 27 VOS VLT GOL GFI SUB
TOTAL AWARD PRI.
AGRI. LANDS
>50
SUB TOTAL
PRIVAT24-50
Scope 937 1,139 80 1000 124 50 56 282 338 229LESS: DEDUCTIBLES
24 17 8 30 92 3 - 95 95 70
TOTAL WORKING 913 1,122 72 970 32 47 56 187 243 159

132
SCOPE LESS: ACCOMPLISHMENT February 2004
848
1,093
56
960
14
47
23
0
23
58
GROSS BALANCE
65
29
16
10
18
0
33
187
220
101
LESS: PROBLEMATIC
65
15
16
10
18
19
184
203
101
NETWORKING BALANCE
0
14
0
0
0
14
3
17
0
WHEREABOUTS OF THE BALANCE
A. MARO Level 1. w-out documentation
2. on-going documentation
14
14
B. PARO Level 1. Receipts from DARMO for review
3
3
2. Receipts from LBP for completion of doc.
3. Survey A. For survey
B. On-going 1. by admin. 2. contracted
SCOPE PHASE I PHASE II
DLT PD 27
VOS VLT GOL GFI SUB TOTAL
AWARD PRI. AGRI.
LANDS >50
SUB TOTAL
PRIVAT24-50
4. Preparation of EP/CLDA
C. LMS 1. Verification/ Approval of Survey
D. LBP 1. On-going
valuation A. Main
14
B. LVO 2. W/ approved
Memo of valuation A. LVO
B. Main E. ROD Registration of EP/CLOA
Source: Municipal Agrarian Reform Office,Municipality of Ubay

App. Table 12. programs and Projects,
PROGRAM/PROJECT/ACTIVITIES TARGET Food Security Programs: Promotion of Improved Crop Production Technologies A. Ginintuang Masaganang Ani-Rice
a. Irrigated Rice 1,161 has. 5,030 has. b. Rain-fed areas
1. Conduct information drive on certified seed subsidy and assist farmers to avail the program
1000 has. 1000 farmers
2. Conduct rice production refresher course and technical briefing 38 farmers 3. Render technical assistance 800 farmers 4. Campaign farmers to plant hybrid rice and to avail hybrid rice seeds subsidy
300 farmers 250 has.
5. Crop insurance information to farmers 150 farmers 6. Preparation of Project Proposal B. GMA Corn
a. Hybrid yellow corn pf Cooperators
400 has. roduction 350 farmers No. o
b. OPV 120 farmers 75 has.
1. Conduct orientation and technical briefing and information drive on seed 15 bgys exchange program 2. Established demo-farms 2 demo-farms 3. Assist farmers to avail financial assistance 50 farmers 4. Facilitate marketing opportunities to corn growers 250 farmers 5. Render technical assistance 250 farmers 6. Solicit insurance for corn growers 75 farmers C. Ginintuang Masaganang Ani - HVCC Mango Production 1. Established updated data on mango 1 Prof. 2. Strengthening of Ubay Mango Growers Organization 1 organization 3. Facilitate monthly meeting 12 meetings 4. Facilitate seminar on mango production 1 seminar 5. Render technical assistance 160 farmers
Ornamentals and cutflower production 1. Render technical assistance 60 cooperators 2. Strengthening of Organization 1 organization 3. Established communal sites for display of ornamentals 1 site 4. Established demo-farms 2 demo-farms
Ubi Production 1. Identification of Cooperators 25 farmers 2. Strengthening of Ubi Growers Association 1 org 3. Refresher course on ubi production 1 course 4. Render technical assistance 25 cooperators 5. Facilitate farmers group to avail financial assistance 25 farmers 6. Established demo-farm 1 demo-farm
133

Banana Production 1. Information dissemination and campaign for backyard or under coconut
ana s
planting of different variety of ban 40 bgy2. Strengthening of organization 1 org 3. Render technical assistance 300 farmers 1,
Vegetables Gardening 1. Promotion of organically grown vegetables seeds thru FA, RIC, IA and 42 barangays cooperatives 2. Render technical assistance 1,600 farmers 3. Distribution of vegetable seeds thru FA, RIC, IA and cooperatives 2 orgs 3
Backyard Fruit Trees Planting 1. Information dissemination and encourage homemakers, farmers and d 32 assisteyouth to plant fruit trees organizations 2. Render technical assistance ,500 farmers 1
Root Crop Production Cassava 1. Information dissemination and campaign for cassava production 450 hectares2. Render technical assistance 500 farmers 3. Facilitate marketing opportunities of the crop 20 farmers 1 Sweet Potato 1. Identification of cooperators 150 farmers 2. Number of hectares assisted 120 hectares 3. Established demo-farms 5 demo-farms 4. Render technical assistance 150 farmers
Legume Production A. Mongo
1. Identification of cooperators 50 farmers 2. Technical Assistance 50 farmers 3. Number of hectares planted 0 hectares 2
B. Peanut 1. Identification of cooperators 50 farmers 2. Number of hectares planted 5.0 hectares 3. Render technical assistance 0 farmers 2
Backyard Fruit Trees Planting a) Information dissemination and encourage farmers and homemakers and d 32 assisteyouth to plant fruit trees organizations b) Render technical assistance ,500 farmers 1
Industrial Crops - Romblon Production a) Campaign for romblon planting 32 org b) Render technical assistance ,200 coop’rs 1
Cacao a) Information dissemination and to encourage farmers to plant cacao 32 org
134

b) Render technical assistance 50 farmers Promotion and Dissemination of Improved Technology on Animal Production, Health Care and Management A. Conduct trainings and seminars on health management of poultry and livestock
gs
00 farmers
10 trainin10 bgys 6
B. onducted on:
ture 3. Animal Health
dog-
,200 farmers
1,200
Information campaign c1. Rabies
owners 2. Forage and pas 60 farmers 1
C. on disease prevention
,000 raisers
Conduct vaccination2,500 heads 1. Hemsep - Cattle 2,500 raisers
2. Carabao 2,500 heads 1,500 heads 3. Anti-hog cholera 1
D. e of deworming
2. assist in deworming of large cattle and swine 600 raisers
Deworming of Farm Animals 1. educate farmers-cooperators of the importanc600 raisers
E. Livestock and Poultry Upgrading Program a) Maintained animal breeders 1. Carabao 6 heads 2. Cattle 5 heads 3. Boar 5 heads Number of Recepients 1 recepients 2b) AI to swine 1. Maintained Boar at Ubay Agri-Park 1 head 2. Conduct AI to swine in different barangays in Ubay 60 heads c) Maintenance of Stocks of New Hampshire Sasso, Kabir in coordination 45 heads with OPV at Ubay Agri-Park 1. Dispersal of chicks (2 weeks old) 240 heads 2. Egg dispersal to interested recepients 40 heads 2d) Monitoring of animal dispersal 1. carabao 43 heads 2. cattle 141 heads 3. swine 458 heads 4. goat 29 heads 5. ducks 10 heads
Maintenance of Municipal Nursery 1. Collection and propagation of seeds of nutritious fruits a) jackfruit 500 b) chicos 500 c) star apple 500 d) mango 500 2. Forest trees a) mahogany 250 b) gmelina 250 3. Ornamental tree
135
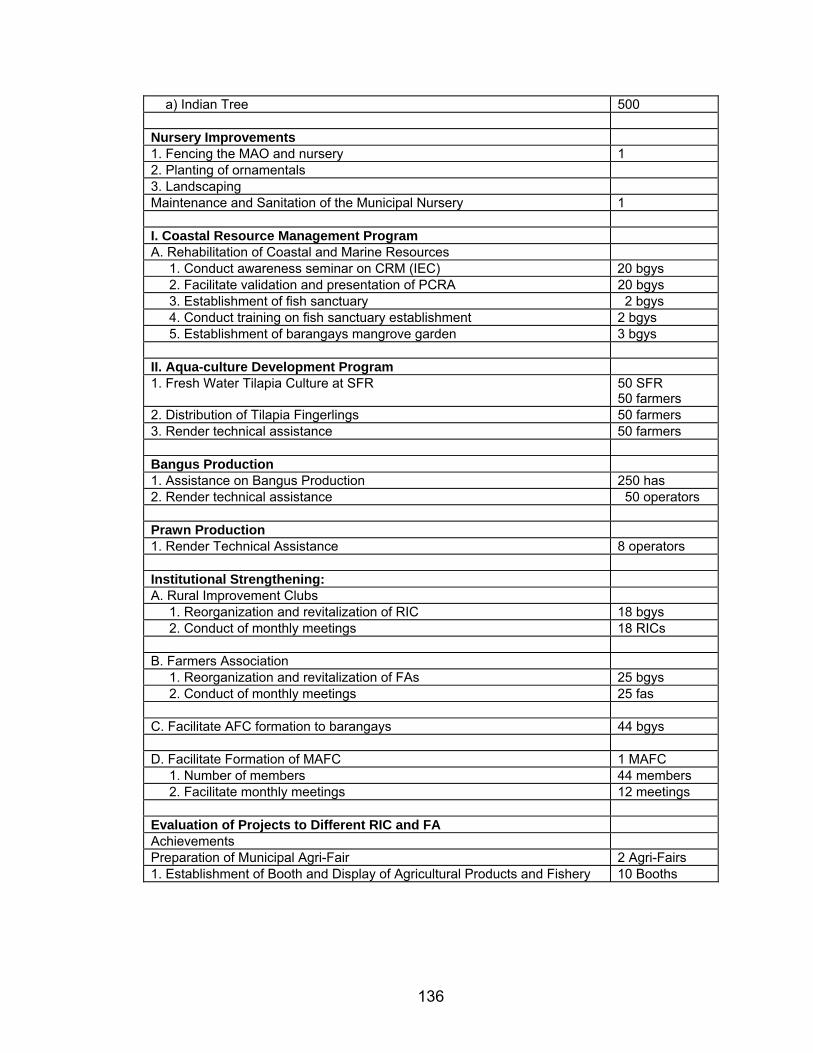
a) Indian Tree 00 5
Nursery Improvements 1. Fencing the MAO and nursery 12. Planting of ornamentals 3. Landscaping Maintenance and Sanitation of the Municipal Nursery 1
I. Coastal Resource Management Program A. Rehabilitation of Coastal and Marine Resources 1. Conduct awareness seminar on CRM (IEC) 20 bgys 2. Facilitate validation and presentation of PCRA 20 bgys 3. Establishment of fish sanctuary 2 bgys 4. Conduct training on fish sanctuary establishment 2 bgys 5. Establishment of barangays mangrove garden bgys 3
II. Aqua-culture Development Program 1. Fresh Water Tilapia Culture at SFR 50 SFR
50 farmers 2. Distribution of Tilapia Fingerlings 50 farmers 3. Render technical assistance 0 farmers 5
Bangus Production 1. Assistance on Bangus Production 250 has 2. Render technical assistance 50 operators
Prawn Production 1. Render Technical Assistance operators 8
Institutional Strengthening: A. Rural Improvement Clubs 1. Reorganization and revitalization of RIC 18 bgys 2. Conduct of monthly meetings 8 RICs 1 B. Farmers Association 1. Reorganization and revitalization of FAs 25 bgys 2. Conduct of monthly meetings 5 fas 2 C. Facilitate AFC formation to barangays 4 bgys 4 D. Facilitate Formation of MAFC 1 MAFC 1. Number of members 44 members 2. Facilitate monthly meetings 2 meetings 1 Evaluation of Projects to Different RIC and FA Achievements Preparation of Municipal Agri-Fair 2 Agri-Fairs 1. Establishment of Booth and Display of Agricultural Products and Fishery 10 Booths
136