A complete sample of radio sources in the North Ecliptic Cap, selected at 38 MHz – III. Further...
9
Mon. Not. R. Astron. Soc. 308, 1087–1095 (1999) A complete sample of radio sources in the North Ecliptic Cap, selected at 38 MHz – III. Further imaging observations and the photometric properties of the sample Mark Lacy, 1w Mary Elizabeth Kaiser, 2,3 Gary J. Hill, 2 Steve Rawlings 1 and Gareth Leyshon 4 1 Astrophysics, Department of Physics, Keble Road, Oxford OX1 3RH 2 McDonald Observatory, University of Texas at Austin, TX 78712-1083, USA 3 Bloomberg Center for Physics and Astronomy, John Hopkins University, 3400 Charles Street, Baltimore, MD 21218, USA 4 Astronomy Department, University of Wales College of Cardiff, PO Box 913, Cardiff CF2 3YB Accepted 1999 May 10. Received 1999 April 7; in original form 1998 November 30 ABSTRACT Further imaging observations of a sample of radio sources in the North Ecliptic Cap are presented and a number of new identifications are made. Using redshifts from spectroscopic data presented in a companion paper by Lacy et al., the photometric properties of the galaxies in the sample are discussed. It is shown that: (1) out to at least z < 0:6 radio galaxies are good standard candles irrespective of radio luminosity; (2) for 0:6 & z & 1a large fraction of the sample has magnitudes and colours consistent with a non-evolving giant elliptical, and (3) at higher redshifts, where the R-band samples the rest-frame UV flux, most objects have less UV luminosity than expected if they form their stellar populations at a constant rate from a high redshift to z , 1 in unobscured star-forming regions (assuming an Einstein–de Sitter cosmology). The consequences of these observations are briefly discussed. Key words: galaxies: active – galaxies: evolution – galaxies: formation – radio continuum: galaxies. 1 INTRODUCTION Radio galaxies are at present the only high-redshift galaxies that are not explicitly selected on the basis of high star formation rates, but which can nevertheless be found in reasonably large numbers. This makes them potentially very valuable for understanding the evolution of massive galaxies at early times. Unfortunately, the strong correlation of the radio and UV emission in the most radio- luminous galaxies (the ‘alignment effect’; see, e.g., Best, Longair & Ro ¨ttgering 1997 and Ridgway & Stockton 1997) indicates that their photometric properties are probably dominated by the presence of an active galactic nucleus (AGN), at least at rest wavelengths , 4000 A, a deduction which was confirmed by spectroscopically for most z , 1 3C radio galaxies by Hammer, LeFe `vre & Angonin (1993). This makes defining and studying samples of radio sources selected at fainter flux density levels important, as, owing to the correlation of radio luminosity with the optical/UV luminosity of the AGN (e.g. Willott et al. 1999), such objects should have only a very small fraction of their light produced by the AGN. In two previous papers (Lacy, Rawlings & Warner 1992; Lacy et al. 1993; hereafter Papers I and II), we defined and presented radio and optical imaging data for a sample of radio sources selected from the 38-MHz survey of Rees (1990) in the region of the North Ecliptic Cap (NEC). In a companion paper (Lacy et al. 1999b ; hereafter Paper IV) we present optical spectroscopy of this sample, along with that of a sample selected at 151 MHz with a comparable flux limit and in the same region of sky (the 7C-iii sample, Lacy et al., in preparation) and which therefore has most objects in common with this sample. We have already discussed the outcome of high-resolution optical observations of a 0:5 , z , 0:82 sub-sample of objects from the 7C-iii sample which show that the radio–optical ‘alignment effect’ in the 7C-iii sample is weak, but probably present, even at wavelengths longward of 4000 A ˚ (Lacy et al. 1999a). Thus is it possible that even in these radio-faint (<20 times fainter than 3C) samples, the radio source is influencing the properties of the host galaxy. As we discuss there, however, the scale of the alignments does seem to change with radio luminosity, q 1999 RAS w Guest observer, McDonald Observatory, University of Texas at Austin, TX78712-1083, USA.
Transcript of A complete sample of radio sources in the North Ecliptic Cap, selected at 38 MHz – III. Further...

Mon. Not. R. Astron. Soc. 308, 1087±1095 (1999)
A complete sample of radio sources in the North Ecliptic Cap,selected at 38 MHz ± III. Further imaging observations and thephotometric properties of the sample
Mark Lacy,1w Mary Elizabeth Kaiser,2,3 Gary J. Hill,2 Steve Rawlings1 and Gareth
Leyshon4
1Astrophysics, Department of Physics, Keble Road, Oxford OX1 3RH2McDonald Observatory, University of Texas at Austin, TX 78712-1083, USA3Bloomberg Center for Physics and Astronomy, John Hopkins University, 3400 Charles Street, Baltimore, MD 21218, USA4Astronomy Department, University of Wales College of Cardiff, PO Box 913, Cardiff CF2 3YB
Accepted 1999 May 10. Received 1999 April 7; in original form 1998 November 30
A B S T R A C T
Further imaging observations of a sample of radio sources in the North Ecliptic Cap are
presented and a number of new identifications are made. Using redshifts from spectroscopic
data presented in a companion paper by Lacy et al., the photometric properties of the
galaxies in the sample are discussed. It is shown that: (1) out to at least z < 0:6 radio
galaxies are good standard candles irrespective of radio luminosity; (2) for 0:6 & z & 1 a
large fraction of the sample has magnitudes and colours consistent with a non-evolving giant
elliptical, and (3) at higher redshifts, where the R-band samples the rest-frame UV flux, most
objects have less UV luminosity than expected if they form their stellar populations at a
constant rate from a high redshift to z , 1 in unobscured star-forming regions (assuming an
Einstein±de Sitter cosmology). The consequences of these observations are briefly
discussed.
Key words: galaxies: active ± galaxies: evolution ± galaxies: formation ± radio continuum:
galaxies.
1 I N T R O D U C T I O N
Radio galaxies are at present the only high-redshift galaxies that
are not explicitly selected on the basis of high star formation rates,
but which can nevertheless be found in reasonably large numbers.
This makes them potentially very valuable for understanding the
evolution of massive galaxies at early times. Unfortunately, the
strong correlation of the radio and UV emission in the most radio-
luminous galaxies (the `alignment effect'; see, e.g., Best, Longair
& RoÈttgering 1997 and Ridgway & Stockton 1997) indicates that
their photometric properties are probably dominated by the
presence of an active galactic nucleus (AGN), at least at rest
wavelengths , 4000 �A, a deduction which was confirmed by
spectroscopically for most z , 1 3C radio galaxies by Hammer,
LeFeÁvre & Angonin (1993). This makes defining and studying
samples of radio sources selected at fainter flux density levels
important, as, owing to the correlation of radio luminosity with the
optical/UV luminosity of the AGN (e.g. Willott et al. 1999), such
objects should have only a very small fraction of their light
produced by the AGN.
In two previous papers (Lacy, Rawlings & Warner 1992; Lacy
et al. 1993; hereafter Papers I and II), we defined and presented
radio and optical imaging data for a sample of radio sources
selected from the 38-MHz survey of Rees (1990) in the region of
the North Ecliptic Cap (NEC). In a companion paper (Lacy et al.
1999b ; hereafter Paper IV) we present optical spectroscopy of this
sample, along with that of a sample selected at 151 MHz with a
comparable flux limit and in the same region of sky (the 7C-iii
sample, Lacy et al., in preparation) and which therefore has most
objects in common with this sample.
We have already discussed the outcome of high-resolution
optical observations of a 0:5 , z , 0:82 sub-sample of objects
from the 7C-iii sample which show that the radio±optical
`alignment effect' in the 7C-iii sample is weak, but probably
present, even at wavelengths longward of 4000 AÊ (Lacy et al.
1999a). Thus is it possible that even in these radio-faint (<20
times fainter than 3C) samples, the radio source is influencing the
properties of the host galaxy. As we discuss there, however, the
scale of the alignments does seem to change with radio luminosity,
q 1999 RAS
w Guest observer, McDonald Observatory, University of Texas at Austin,
TX78712-1083, USA.

1088 M. Lacy et al.
in the sense that the alignments of the 7C-iii radio galaxies are
detectable only on small scales (in , 15 kpc radius apertures),
whereas the 3C radio galaxies have equally strong alignments at
15 and 50 kpc. This could be because the highly radio-luminosity
dependent mechanisms such as scattering of the hidden quasar
nucleus and nebular emission disappear in the 7C-iii objects,
leaving a less luminosity dependent mechanism which only
operates on small scales. Relatively `passive' mechanisms may be
responsible for these alignments, for example dust discs with axes
along the radio axis and/or selection effects. If this were the case
the photometric properties of the underlying galaxy would be
unaffected by the presence of the radio source. However, it is
possible that jet-induced star formation is only weakly radio-
luminosity dependent, and if this mechanism operates then it
would imply an intimate connection between the presence of the
radio source and the stellar population of the host. The
observational evidence for this mechanism is as yet only
circumstantial however, and it is not clear whether such a
mechanism could be effective (Icke 1999).
In this paper we discuss further optical, radio and near-infrared
observations of the 8C sample, and use the spectroscopy presented
in Paper IV to discuss the photometric properties and evolution of
the radio source hosts. Unless otherwise stated we assume an
VM � 1; VL � 0 (Einstein±de Sitter) cosmology with
H0 � 50 km s21 Mpc21.
2 O B S E RVAT I O N S
Radio snapshot observations of two of the sources in the sample,
8C 1804� 632 and 8C 1826� 660 were made with the VLA in
C-array at 1.4 GHz on 1993 June 28 to attempt to resolve
ambiguities of identification in Paper II. 8C 1742� 637 was
observed in A-array at 1.4 GHz on 1995 June 29 for 2 � 2 min
q 1999 RAS, MNRAS 308, 1087±1095
Figure 1. New radio observations of sources in the 8C sample at 1.4 GHz:
(a) 8C 1804� 632, (b) 8C 1826� 660 and (c) 8C 1742� 637. Contours
are logarithmic, spaced by factors of two from ^1 mJy beam21 in (a) and
(b), and by factors of���2p
from 0:3 mJy beam21 in (c). The restoring beam
in (a) and (b) has FWHM 17 � 13 arcsec2 at PA 358, that in (c) has FWHM
1:8 � 1:2 arcsec2 at PA 508. The polarization vectors in (c) are E-field and
scaled such that 1-arcsec is equivalent to 1:1 mJy beam21. Negative
contours are shown dashed.
Table 1. H-band observations.
Source Date Exposure time airmass Seeing/s /arcsec
8C 1743� 645 07/05/93 2970 1.22 2.812/06/93 2970 1.22 1.9
8C 1745� 642 06/05/93 1890 1.20 1.613/06/93 1620 1.20 1.5
8C 1748� 675 07/05/93 2160 1.32 2.4
8C 1755� 632 07/05/93 1890 2.0 2.7
8C 1755� 685B 07/05/93 1620 1.6 1.8
8C 1757� 653 09/05/93 1890 1.32 3.0
8C 1803� 661 08/05/93 1800 1.28 2.012/06/93 5490 1.24 1.6
8C 1805� 635 11/06/93 3780 1.25 1.6
8C 1807� 685 07/05/93 2700 1.29 2.6
8C 1811� 633 08/05/93 2520 2.0 2.3
8C 1815� 682 09/05/93 1350 1.27 2.012/06/93 3240 1.4 1.713/06/93 810 1.36 1.5
8C 1816� 671 09/05/93 2610 1.28 2.3
8C 1821� 643 08/05/93 1080 1.4 3.2
8C 1823� 660 08/05/93 1980 1.6 3.5
8C 1826� 651 06/05/93 1620 1.22 1.6
8C 1827� 671 11/06/93 1080 1.4 1.513/06/93 5670 1.25 1.4

A complete sample of radio sources ± III 1089
snapshots. These data were calibrated and analysed in the standard
manner and the maps are presented in Fig. 1. In addition a four-
minute 8-GHz A-array observation of 8C 1826� 651 was made
on 1996 December 31 to attempt to identify a central component.
A 0.6-mJy point source was detected at 18 26 31:41� 65 10 46.0
(B1950), this is consistent with the identification in Paper II and
corresponds to optical/infrared component `b' of Fig. 2 being the
probable radio source host (see also Lacy et al. 1998a).
Observations of several sources were made in the near-infared
H-band with ROKAM, a near-infrared camera with a 256 � 256
HgCdTe array, during 1993 May and June. ROCAM was placed at
the f/18 straight Cassegrain focus of the McDonald 2.7-m
telescope, giving a pixel scale of 0.40 arcsec pixel21. Objects
with estimated redshifts < 1 in Paper II were the primary targets,
though some lower redshift objects were also observed when the
seeing was very poor. The observations are detailed in Table 1,
and the photometry in Table 4. Grey-scales of selected images are
presented in Fig. 2. The observations were calibrated using the
infrared standard stars HD 136754 and HD 162208 (Elias et al.
1982). Extinction was determined to be 0:15 � airmass and a
correction of 0.05 mag was made for galactic extinction, assuming
E�B 2 V� � 0:085 (Kolman et al. 1991) and the extinction curve
of Cardelli, Clayton & Mathis (1989).
Further R- and I-band observations of the unidentified sources
in the sample were made on the McDonald 2.7-m using IGI (see
Paper II) and on the William Herschel Telescope on La Palma
using the Auxilliary Port. Details of these observations are given
in Table 2. The extinction assumed at the WHT in July was 0:15 �airmass in R, with a galactic extinction of 0.19 and the data were
calibrated in the standard star PG 2331� 055. In I-band, an
extinction of 0:02 � airmass was assumed for the observations
made in 1994 January, and 0:05 � airmass in 1994 July (higher
owing to Saharan dust). A value of 0:07 � airmass was assumed
for the McDonald observations. Galactic extinction in the I band
was estimated to be 0.13 mag using the extinction curve of
Cardelli et al. (1989).
3 A D D I T I O N S T O T H E S A M P L E
Careful study of a 7C survey of the NEC (Lacy et al. 1995a)
revealed four objects which, although absent from the original
sample of Paper I because of confusion, should probably be
included in the complete sample. Two of these remain excluded
owing to radio or optical confusion as discussed below. A full
description of the objects including further radio maps and finding
charts will be presented in a future paper, but is summarized here
and in Table 3 for completeness:
8C 1732� 672 (7C 1742� 6715)
The 1.5-GHz VLA map of this source is very confused, and so it
has been temporarily removed from the sample again pending
improved radio data.
8C 1733� 673 (7C 1733� 6719)
This is a small (2 00.5) apparently double radio source, PA 158. It is
identified with an R < 22:6 galaxy (measured from the optical
spectrum and corrected to the standard metric aperture).
8C 1742� 637 (7C 1742� 6346)
An FRII radio source with a marginal detection of a possible
q 1999 RAS, MNRAS 308, 1087±1095
Figure 2. Selected H-band observations of the sources in the 8C sample. The host galaxies are indicated by either a ring around the radio position of Paper 1,
or, where there are several candidate identifications, by lettering. Candidate companion objects are also indicated by lettering in some cases.

1090 M. Lacy et al.
central component at 17 42 44:36� 63 46 15:0 (B1950) which is
51 00 in size (Fig. 1). The position of the nearest likely optical
identification, ringed in Fig. 3, is given in Table 3. It lies along the
radio axis, but not coincident with the putative central component,
and has an R magnitude of 22.6 in the standard metric aperture.
Both the hotspots are projected close to what are probably
foreground galaxies (the source lies 4.5 arcmin from the cluster
Abell 2280) so significant gravitational lensing may be occuring.
8C 1827� 652 (7C 1827� 6517)
Another FRII radio source 17 00 in size at PA 1558. This object is
very close to several bright stars so has again been temporarily
removed from the sample.
4 C O M M E N T S O N I N D I V I D UA L O B J E C T S
8C 1743� 645
The identification given in Paper II (`a' in Fig. 2) closely
coincides in position with the eastern radio hotspot. The H-band
image (Fig. 2) reveals a faint red object coincident with the
putative radio central component (Paper I) which is a much more
likely identification. This galaxy is also just visible in R-band
(Fig. 3). Lensing of the eastern hotspot by the (presumably)
foreground galaxy `a' is likely to be occuring.
8C 1748� 670
There are two candidate identifications, the first one was listed in
Paper II, but our WHT R-band image (Fig. 3) also revealed a
fainter object 1.4 arcsec closer to the radio central component
whose position is given in Table 3. If real, this is the more likely
identification. The revised position of the object discussed in
Paper II is 17 48 12:95� 67 03 55:6 (B1950), the old position was
in error, presumably due to the low signal-to-noise ratio of the
detection.
8C 1754� 643
The identification given in Paper II is incorrect; the true
identification is a faint, diffuse galaxy located between the radio
hotspots, ringed in Fig. 3.
8C 1804� 632
As discussed further in Paper IV, despite the additional radio
imaging presented in Fig. 1, the nature of this radio source and its
identification continues to elude us. The fairly compact source
detected at 5 GHz in Paper I now appears as just a part, perhaps a
hotspot, of a larger, < 30 00 radio source in our 20-cm map. Spectra
taken through objects `a', `F' and `b' of Fig. 4 showed that all
three were probably stars. The most likely identification at present
is object `c', which is unfortunately very close to star `F'.
Consequently the magnitude of this object is very uncertain, but
we estimate R < 23:6 in a 2 00 diameter aperture.
8C 1805� 635
The original identification of this object in Paper II was an R �21:1 galaxy 3 arcsec from the line joining the midpoint of the
radio hotspots (`a' in Fig. 2). The spectroscopy of Paper IV shows
that the true identification is on the axis, and that `a' is foreground,
and possibly lensing the radio emission.
q 1999 RAS, MNRAS 308, 1087±1095
Table 2. Further optical observations.
Source Telescope/instrument Filter Date Exposure time airmass seeing/s /arcsec
8C 1743� 645 McDonald 2.7-m/IGI R 21/5/93 1200 1.20 2.08C 1748� 670 WHT/Aux Port (TEK) R 31/7/95 600 1.8 0.88C 1753� 664 WHT/Aux Port (TEK) I 25/1/95 900 1.7 0.88C 1754� 643 WHT/Aux Port (TEK) I 26/1/95 900 1.6 2.08C 1757� 653 McDonald 2.7-m/IGI I 21/5/93 3300 1.7 1.98C 1757� 653 WHT/Aux Port (TEK) I 25/1/95 600 1.6 0.88C 1814� 670 WHT/Aux Port (TEK) I 25/1/95 900 1.7 1.08C 1816� 671 McDonald 2.7-m/IGI I 21/5/93 2400 1.6 1.58C 1826� 660A WHT/Aux Port (TEK) R 30/7/95 900 1.8 0.8
Table 3. Additions to and new identifications for objects in the 8C sample.
Name R.A. (1950) Dec. (1950) R magnitude Type Notes8C 1732� 672 - - ? Addition, but badly confused in radio so excluded from complete sample8C 1733� 673 17 32 59.81 �67 19 32:3 22.6 G Addition, R-magnitude from spectrum8C 1736� 650 17 36 26.61 �65 04 10:7 23.0 G Misidentification in Paper II, position uncertain, R from spectrum8C 1742� 637 17 42 43.39 �63 46 11:8 22.6 G Addition, identification assmued to be `a' in Fig. 38C 1743� 645 17 43 28.55 �64 31 30:7 23.3 G Misidentification in Paper II8C 1748� 670 17 48 12.90 �67 03 54:2 23.9 G Misidentification in Paper II ?8C 1754� 643 17 54 11.89 �64 20 36:5 . 23:1 G Misidentification in Paper II. I � 21:18C 1804� 632 18 04 49.37 �63 13 07:9 , 23 G New identification; see Section 48C 1805� 635 18 05 37.33 �63 32 47:8 . 23:7 G Misidentification in Paper II8C 1814� 670 18 14 16.09 �67 02 44:5 . 22:9 G New identification (I � 23:4)8C 1816� 671 18 16 30.40 �67 11 00:2 .23.8 G New identification �I � 22:4�8C 1826� 660A 18 25 47.54 �66 02 24:0 23.8 G New identification; note the finding chart in Paper II is incorrect8C 1827� 652 18 27 59.13 �65 17 49:4 - G? Addition, but near bright stars so excluded from complete sample

A complete sample of radio sources ± III 1091
8C 1814� 670
There is a 3s detection of a possible identification, 4.5 arcsec NW
from the mid-point of the radio hotspots (Fig. 3).
8C 1816� 671
Another new identification, faintly visible in both H (Fig. 2) and R
(Fig. 3).
8C 1821� 643
Better known as the quasar E1821� 643, this object is one of the
most luminous radio-quiet quasars (RQQ) known with z , 0:5,
and thus has one of the brightest radio fluxes of an RQQ.The
optical, X-ray and near-infrared properties of the quasar have been
studied by Kolman et al. (1993, 1991). The long-term variability
study of Kolman et al. (1993) shows that the optical and UV flux
from the quasar declined between 1987 and 1991; our H-band data
is consistent with a decline from 1988 April 25, when Kolman et
al. measured H � 12:19, to our observations in 1993 May 8
(H � 12:6), although because of the errors in the photometry this
result should be considered tentative.
8C 1826� 660
A further radio image of this object (Fig. 1) was taken to search
q 1999 RAS, MNRAS 308, 1087±1095
Figure 3. New optical (R- or I-band) observations of sources in the 8C sample. The identification, or the best estimate of the radio source position where no
identification exists, is indicated by the circle. The positions of the radio hotspots of 8C 1742� 637 are marked with stars.

1092 M. Lacy et al.
for any association of the three radio sources discussed in Paper I.
None was found, and henceforth they are treated as separate
objects. A very faint identification has been found for 8C 1826�660A (Fig. 3).
5 A N A LY S I S
5.1 The R±z relation
In Fig. 5 we plot the R±z relation for the 8C galaxies and quasars.
Although such diagrams as this and the more famous K±z relation
are somewhat `blunt instruments' for studying radio galaxy
evolution, where a number of different effects may be contributing
to the light as a function of redshift, they have some useful
features which can be exploited if they are used in conjunction
with detailed studies of smaller samples of objects.
As expected, the scatter in the R±z relation is fairly low (with a
few notable exceptions) until z<0.6, where the 4000-AÊ break
moves through the R band. Above this redshift there is a wide
range in the amount of rest-frame UV light, as has been noted
for the 3C sample (Lilly & Longair 1984), but generally the
galaxies are less luminous than their 3C counterparts, consistent
with the findings of Dunlop & Peacock (1993) for their PSR
sample.
Up to at least z � 1 there seems to be an upper envelope to the
magnitudes which traces the expected locus of an old stellar
population, consistent with the idea that in many objects the host
galaxy is not strongly evolving out to these redshifts. The presence
of a weak alignment effect in the 7C sample (Lacy et al. 1998a)
suggests some of the light may be influenced by the presence of
the radio galaxy, however, so deep spectroscopy of these objects is
really needed to confirm this.
Six objects have no redshift information, and are plotted as
open squares at the top left of Fig. 5 with arbitary redshifts. Their
most likely redshifts are in the range z � 1:2±1:8 where no strong
emission lines fall in the optical. They mostly have faint optical
magnitudes and so do not affect the discussion below.
There is one interesting low-z outlier on this plot. 8C 1743�637 (R � 21:3; z � 0:324) is in the cluster A2280, close to 8C
1742� 637, but was originally thought to be behind it from the
point of view of both the radio structure (which is more FRII-like
than FRI-like) and its magnitude (Paper II). It is possible that
emission from a cluster galaxy is contaminating our spectrum,
however.
5.2 R 2 H colours
Fig. 6 shows the R 2 H colours for the sample. The low redshift
objects cluster around the no evolution prediction fairly well.
There are two very red objects, 8C 1743� 645 with R 2 H � 4:7,
but an unknown redshift, and 8C 1816� 671 with R 2 H . 5
which has a (tentative) redshift of 0.92 based on a single weak
emission line (Paper IV). Presumably these are both z * 1 objects
with little blue light.
5.3 Discussion
A remarkable property of the radio galaxies out to at least z < 0:6
q 1999 RAS, MNRAS 308, 1087±1095
Figure 4. Finding chart for 8C 1804� 632. The objects mentioned in the
text are labelled and the positions of the presumed radio hotspots from Fig.
1 marked with stars.
Figure 5. The R±z relation for the radio sources in the 8C sample, and the
z . 0:03 objects from the mostly 3C low-z sample of Owen & Laing
(1989). The magnitudes have been corrected to a standard metric aperture
of 63.9 kpc according to the prescription of Eales et al. (1997). In the few
cases where only an I-band magnitude has been measured (Table 5) an
R 2 I of 0.5, appropriate for a flat (in fl) spectrum has been assumed. The
8C objects are plotted as follows: solid squares represent narrow-line FRII
radio galaxies, solid circles broad-line radio galaxies or quasars, and
crosses represent FRI radio galaxies. The Owen & Laing sample has been
plotted as triangles (FRII sources) or three-pointed crosses (FRI sources).
The cluster of open squares in the top left of the diagram represent 8C
sources for which no redshift has been obtained, in these cases an aperture
correction appropriate to z � 1 has been made. The vertical dashed line is
at z � 0:6 where the 4000-AÊ break is in the middle of the R band. The
dotted line is the expected R±z relation for a non-evolving galaxy formed
in a single burst at z � 20 (using k-corrections from the Guiderdoni &
Rocca-Volmerange galaxy models). The long-dashed line is the R-band
magnitude expected from a star formation rate of 65 M( yr21 (see text).
The solid line is the R±z relation for 3C radio galaxies from Eales (1985).

A complete sample of radio sources ± III 1093
is their `standard candle' nature over a wide range in radio
luminosities, illustrated here in Fig. 5 and also present in other low
radio luminosity, moderate redshift samples (e.g. Rixon, Wall &
Benn 1991). This has interesting implications for our under-
standing of what determines radio luminosity. To relate radio
luminosity to the mass of the black hole, one could assume that
radio jet power scales with accretion power and therefore with
black hole mass in the Eddington limit; thus one might expect less
radio-luminous galaxies to have less massive black holes.
Correlations between black hole mass and the mass of spheroidal
components in nearby galaxies (Kormendy & Richstone 1995;
Magorrian et al. 1998), however, suggest that the small dispersion
in host galaxy luminosities tranlates to a small dispersion in black
hole mass. Two possible explanations which would allow similar
black hole masses to produce a wide range of radio luminosities
are: (1) the radio jet power is constant for black holes of a given
mass, and what determines the radio luminosity is the environ-
mental density into which the jets propagate (Barthel & Arnaud
1996); or (2) the radio jet power is determined by a factor which
operates within the `central engine' region of galaxies with only
the most massive black holes and which has to be linked in some
way to the accretion power to produce the radio-luminosity ±
emission-line luminosity correlation over a wide range in
accretion rates (Willott et al. 1999). The lack of a strong
correlation between radio luminosity and environment (Hill &
Lilly 1991) and the correlation of radio-loud quasar optical and
radio luminosities found by Serjeant et al. (1998); Willott et al.
(1998) both argue that the dominant factor in determining the
radio luminosity is jet power, although environmental effects may
of course play a secondary roÃle.
The excess blue light above that expected from a non-evolving
elliptical seen in many objects at z . 2 could clearly have a
number of origins, including ones associated with nuclear activity
such as scattered quasar light and nebular continuum emission, but
q 1999 RAS, MNRAS 308, 1087±1095
Figure 6. R2H versus redshift for a subset of the 8C sample. The objects
plotted are those radio source identifications with R 2 H-band colours in
Table 4 and redshifts in Paper IV. Crosses represent narrow-line radio
galaxies and filled circles broad-line radio galaxies. The dotted line
represents the non-evolving 1-Gyr starburst model of Fig. 5.
Table 4. H-band photometry of sources in the 8C sample.
Source H-magnitude aperture diameter R ÿ H/arcsec
8C 1743� 645 18.8 5 4.7
8C 1745� 642 17.5 6 3.2object `a' 18.9 5 . 4:2object `b' 17.9 5 3.4
8C 1748� 675a 16.4 8.2 3.58C 1748� 675b 17.8 6 3.18C 1748� 675c 17.9 6 3.6
8C 1755� 632 15.3 18 2.6
8C 1755� 685B 16.9 6 3.2
8C 1757� 653 . 19:4 5 ±
8C 1803� 661 18.3 7.1 2.8
8C 1805� 635 . 20:7 5 ±object `a' 18.5 4.6 2.6
8C 1807� 685 16.5 6 3.7
8C 1811� 633 16.2 7.1 3.1
8C 1815� 682a 17.8 6 3.38C 1815� 682b 19.6 4.6 1.78C 1815� 682c 17.1 6 3.88C 1815� 682d 17.0 6 3.08C 1815� 682e 17.9 6 3.88C 1815� 682f 17.7 6 3.78C 1815� 682g 18.3 4.6 3.4
8C 1816� 671 19.0 5 . 5:0
8C 1821� 643 12.6 8 ±
8C 1823� 660 15.8 12 2.9
8C 1826� 651a 17.0 5 2.28C 1826� 651b 17.1 5 3.88C 1826� 651c 18.4 5 3.48C 1826� 651d 17.9 5 3.5
8C 1827� 671 18.5 8.2 2.6object `a' 18.3 5 3.8object `b' 17.1 8.2 3.1object `c' 19.2 5 . 4:3object `d' 18.9 5 . 4:6
Table 5. Further optical photometry of sources in the 8C sample.
Source magnitude aperture diameter R 2 I/arcsec
8C 1743� 645 R � 23:5 5 ±8C 1748� 670 R � 24:2 3 ±8C 1753� 664 I � 23:2 (3.0s) 5 . 0:48C 1754� 643 I � 21:3 5 . 1:38C 1757� 653 I . 23:1 5 ±8C 1814� 670 I � 24:0 (3.0s) 2 . 20:88C 1816� 671 I � 22:6 (3.7s) 5 . 2:68C 1826� 660A R � 24:0 2 ±
1094 M. Lacy et al.
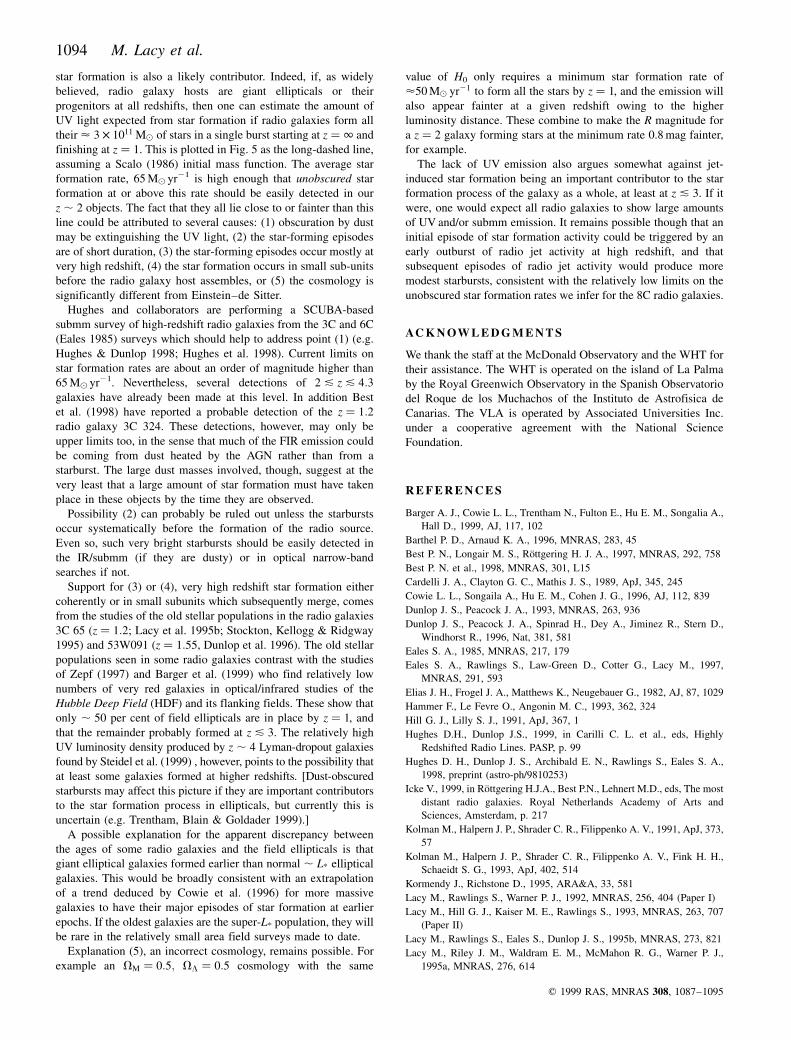
star formation is also a likely contributor. Indeed, if, as widely
believed, radio galaxy hosts are giant ellipticals or their
progenitors at all redshifts, then one can estimate the amount of
UV light expected from star formation if radio galaxies form all
their < 3 � 1011 M( of stars in a single burst starting at z � 1 and
finishing at z � 1. This is plotted in Fig. 5 as the long-dashed line,
assuming a Scalo (1986) initial mass function. The average star
formation rate, 65 M( yr21 is high enough that unobscured star
formation at or above this rate should be easily detected in our
z , 2 objects. The fact that they all lie close to or fainter than this
line could be attributed to several causes: (1) obscuration by dust
may be extinguishing the UV light, (2) the star-forming episodes
are of short duration, (3) the star-forming episodes occur mostly at
very high redshift, (4) the star formation occurs in small sub-units
before the radio galaxy host assembles, or (5) the cosmology is
significantly different from Einstein±de Sitter.
Hughes and collaborators are performing a SCUBA-based
submm survey of high-redshift radio galaxies from the 3C and 6C
(Eales 1985) surveys which should help to address point (1) (e.g.
Hughes & Dunlop 1998; Hughes et al. 1998). Current limits on
star formation rates are about an order of magnitude higher than
65 M( yr21. Nevertheless, several detections of 2 & z & 4:3galaxies have already been made at this level. In addition Best
et al. (1998) have reported a probable detection of the z � 1:2radio galaxy 3C 324. These detections, however, may only be
upper limits too, in the sense that much of the FIR emission could
be coming from dust heated by the AGN rather than from a
starburst. The large dust masses involved, though, suggest at the
very least that a large amount of star formation must have taken
place in these objects by the time they are observed.
Possibility (2) can probably be ruled out unless the starbursts
occur systematically before the formation of the radio source.
Even so, such very bright starbursts should be easily detected in
the IR/submm (if they are dusty) or in optical narrow-band
searches if not.
Support for (3) or (4), very high redshift star formation either
coherently or in small subunits which subsequently merge, comes
from the studies of the old stellar populations in the radio galaxies
3C 65 (z � 1:2; Lacy et al. 1995b; Stockton, Kellogg & Ridgway
1995) and 53W091 (z � 1:55, Dunlop et al. 1996). The old stellar
populations seen in some radio galaxies contrast with the studies
of Zepf (1997) and Barger et al. (1999) who find relatively low
numbers of very red galaxies in optical/infrared studies of the
Hubble Deep Field (HDF) and its flanking fields. These show that
only , 50 per cent of field ellipticals are in place by z � 1, and
that the remainder probably formed at z & 3. The relatively high
UV luminosity density produced by z , 4 Lyman-dropout galaxies
found by Steidel et al. (1999) , however, points to the possibility that
at least some galaxies formed at higher redshifts. [Dust-obscured
starbursts may affect this picture if they are important contributors
to the star formation process in ellipticals, but currently this is
uncertain (e.g. Trentham, Blain & Goldader 1999).]
A possible explanation for the apparent discrepancy between
the ages of some radio galaxies and the field ellipticals is that
giant elliptical galaxies formed earlier than normal , L* elliptical
galaxies. This would be broadly consistent with an extrapolation
of a trend deduced by Cowie et al. (1996) for more massive
galaxies to have their major episodes of star formation at earlier
epochs. If the oldest galaxies are the super-L* population, they will
be rare in the relatively small area field surveys made to date.
Explanation (5), an incorrect cosmology, remains possible. For
example an VM � 0:5; VL � 0:5 cosmology with the same
value of H0 only requires a minimum star formation rate of
<50 M( yr21 to form all the stars by z � 1, and the emission will
also appear fainter at a given redshift owing to the higher
luminosity distance. These combine to make the R magnitude for
a z � 2 galaxy forming stars at the minimum rate 0.8 mag fainter,
for example.
The lack of UV emission also argues somewhat against jet-
induced star formation being an important contributor to the star
formation process of the galaxy as a whole, at least at z & 3. If it
were, one would expect all radio galaxies to show large amounts
of UV and/or submm emission. It remains possible though that an
initial episode of star formation activity could be triggered by an
early outburst of radio jet activity at high redshift, and that
subsequent episodes of radio jet activity would produce more
modest starbursts, consistent with the relatively low limits on the
unobscured star formation rates we infer for the 8C radio galaxies.
AC K N OW L E D G M E N T S
We thank the staff at the McDonald Observatory and the WHT for
their assistance. The WHT is operated on the island of La Palma
by the Royal Greenwich Observatory in the Spanish Observatorio
del Roque de los Muchachos of the Instituto de Astrofisica de
Canarias. The VLA is operated by Associated Universities Inc.
under a cooperative agreement with the National Science
Foundation.
R E F E R E N C E S
Barger A. J., Cowie L. L., Trentham N., Fulton E., Hu E. M., Songalia A.,
Hall D., 1999, AJ, 117, 102
Barthel P. D., Arnaud K. A., 1996, MNRAS, 283, 45
Best P. N., Longair M. S., RoÈttgering H. J. A., 1997, MNRAS, 292, 758
Best P. N. et al., 1998, MNRAS, 301, L15
Cardelli J. A., Clayton G. C., Mathis J. S., 1989, ApJ, 345, 245
Cowie L. L., Songaila A., Hu E. M., Cohen J. G., 1996, AJ, 112, 839
Dunlop J. S., Peacock J. A., 1993, MNRAS, 263, 936
Dunlop J. S., Peacock J. A., Spinrad H., Dey A., Jiminez R., Stern D.,
Windhorst R., 1996, Nat, 381, 581
Eales S. A., 1985, MNRAS, 217, 179
Eales S. A., Rawlings S., Law-Green D., Cotter G., Lacy M., 1997,
MNRAS, 291, 593
Elias J. H., Frogel J. A., Matthews K., Neugebauer G., 1982, AJ, 87, 1029
Hammer F., Le Fevre O., Angonin M. C., 1993, 362, 324
Hill G. J., Lilly S. J., 1991, ApJ, 367, 1
Hughes D.H., Dunlop J.S., 1999, in Carilli C. L. et al., eds, Highly
Redshifted Radio Lines. PASP, p. 99
Hughes D. H., Dunlop J. S., Archibald E. N., Rawlings S., Eales S. A.,
1998, preprint (astro-ph/9810253)
Icke V., 1999, in RoÈttgering H.J.A., Best P.N., Lehnert M.D., eds, The most
distant radio galaxies. Royal Netherlands Academy of Arts and
Sciences, Amsterdam, p. 217
Kolman M., Halpern J. P., Shrader C. R., Filippenko A. V., 1991, ApJ, 373,
57
Kolman M., Halpern J. P., Shrader C. R., Filippenko A. V., Fink H. H.,
Schaeidt S. G., 1993, ApJ, 402, 514
Kormendy J., Richstone D., 1995, ARA&A, 33, 581
Lacy M., Rawlings S., Warner P. J., 1992, MNRAS, 256, 404 (Paper I)
Lacy M., Hill G. J., Kaiser M. E., Rawlings S., 1993, MNRAS, 263, 707
(Paper II)
Lacy M., Rawlings S., Eales S., Dunlop J. S., 1995b, MNRAS, 273, 821
Lacy M., Riley J. M., Waldram E. M., McMahon R. G., Warner P. J.,
1995a, MNRAS, 276, 614
q 1999 RAS, MNRAS 308, 1087±1095

A complete sample of radio sources ± III 1095
Lacy M., Ridgway S. E., Wold M., Lilje P. B., Rawlings S., 1999a,
MNRAS, in press
Lacy M., Rawlings S., Hill G. J., Bunker A. J., Stern D., Ridgway S. E.,
1999b, in press (Paper IV)
Lilly S. J., Longair M. S., 1984, MNRAS, 211, 833
Magorrian J. et al., 1998, AJ, 115, 2285
Owen F. N., Laing R. A., 1989, MNRAS, 238, 357
Rees N., 1990, MNRAS, 244, 233
Ridgway S. E., Stockton A. N., 1997, AJ, 114, 511
Rixon G. T., Wall J. V., Benn C. R., 1991, MNRAS, 251, 243
Scalo J. M., 1986, Fund. Cosmic Phys., 11, 1
Serjeant S., Rawlings S., Maddox S. J., Baker J. C., Clements D., Lacy M.,
Lilje P. B., 1998, MNRAS, 294, 494
Steidel C. C., Adelberger K. L., Giavalisco M., Dickinson M., Pettini M.,
1999, ApJ, 519, 1
Stockton A. N., Kellogg M., Ridgway S. E., 1995, ApJ, 443, L69
Trentham N., Blain A. W., Goldader J., 1999, MNRAS, 305, 61
Willott C. J., Rawlings S., Blundell K. M., Lacy M., 1998, MNRAS, 300,
625
Willott C. J., Rawlings S., Blundell K. M., Lacy M., 1999, MNRAS, in
press
Zepf S. E., 1997, Nat, 390, 377
This paper has been typeset from a TEX/LATEX file prepared by the author.
q 1999 RAS, MNRAS 308, 1087±1095