A compilation of evidence - healthyplaces.org.au · A compilation of evidence ... Landscapes, flora...
86
Australian Institute of Health and Welfare Canberra Cat. no. PHE 136 Health and the environment A compilation of evidence March 2011
-
Upload
hoangkhanh -
Category
Documents
-
view
221 -
download
0
Transcript of A compilation of evidence - healthyplaces.org.au · A compilation of evidence ... Landscapes, flora...
Australian Institute of Health and Welfare
Canberra
Cat. no. PHE 136
Health and the environment
A compilation of evidence
March 2011

The Australian Institute of Health and Welfare is Australia’s national
health and welfare statistics and information agency. The Institute’s mission is
better information and statistics for better health and wellbeing.
© Australian Institute of Health and Welfare 2011
This work is copyright. Apart from any use as permitted under the Copyright Act 1968, no part may be
reproduced without prior written permission from the Australian Institute of Health and Welfare.
Requests and enquiries concerning reproduction and rights should be directed to the Head of the
Communications, Media and Marketing Unit, Australian Institute of Health and Welfare, GPO Box 570,
Canberra ACT 2601.
A complete list of the Institute’s publications is available from the Institute’s website
<www.aihw.gov.au>.
ISBN 978-1-74249-129-5
Suggested citation
Australian Institute of Health and Welfare 2011. Health and the environment: a compilation of
evidence. Cat. no. PHE 136. Canberra: AIHW.
Australian Institute of Health and Welfare
Board Chair
Hon. Peter Collins, AM, QC
Director
David Kalisch
Any enquiries about or comments on this publication should be directed to:
Communications, Media and Marketing Unit
Australian Institute of Health and Welfare
GPO Box 570
Canberra ACT 2601
Phone: (02) 6244 1032
Email: [email protected]
Published by the Australian Institute of Health and Welfare
Printed by Bluestar Print
Please note that there is the potential for minor revisions of data in this report.
Please check the online version at <www.aihw.gov.au> for any amendments.
iii
Contents
Acknowledgments............................................................................................................................... v
Abbreviations ...................................................................................................................................... vi
Summary ............................................................................................................................................. vii
1 Introduction .................................................................................................................................... 1
1.1 Australia’s environment at a glance ............................................................................................ 2
1.2 Environment and the global burden of disease ......................................................................... 3
1.3 Governance and policy .................................................................................................................. 3
1.4 Definition of key terms used in this report ................................................................................. 4
1.5 Selection of environmental factors ............................................................................................... 4
1.6 Review methods and scope .......................................................................................................... 5
1.7 Structure of this report .................................................................................................................. 6
2 Understanding the relationship between environment and health .................................... 7
2.1 Environmental health surveillance .............................................................................................. 7
2.2 Complications and confounders .................................................................................................. 8
3 The natural environment ........................................................................................................... 10
3.1 Introduction .................................................................................................................................. 10
3.2 Air temperature ............................................................................................................................ 11
3.3 Extreme weather events .............................................................................................................. 14
3.4 Ultraviolet radiation .................................................................................................................... 18
3.5 Food safety and water quality .................................................................................................... 20
3.6 Vector populations ....................................................................................................................... 24
3.7 Outdoor air quality ...................................................................................................................... 27
4 The built environment ............................................................................................................... 31
4.1 Introduction .................................................................................................................................. 31
4.2 Indoor air quality ......................................................................................................................... 32
4.3 Walkability .................................................................................................................................... 37
4.4 Transport ....................................................................................................................................... 40
4.5 Green space ................................................................................................................................... 43
4.6 Environmental noise .................................................................................................................... 46
4.7 Overcrowding in housing ........................................................................................................... 50
4.8 Housing condition ........................................................................................................................ 53
4.9 Hazards in and around the home .............................................................................................. 56
4.10 Water fluoridation ....................................................................................................................... 60
iv
References ............................................................................................................................................ 63
List of tables ........................................................................................................................................ 77
List of figures ...................................................................................................................................... 77
List of boxes ......................................................................................................................................... 78

v
Acknowledgments
The authors of this report were Lisa Sainsbury and Robert Long. Sally Bullock was extensively involved in the development of this report and her contribution is gratefully acknowledged.
Valuable contributions were also received from:
• Mark Cooper-Stanbury and the Population Health Unit of the Australian Institute of Health and Welfare (AIHW)
• Environmental Health Section (Office of Health Protection) of the Australian Government Department of Health and Ageing
• Andrew D’Addona and Narelle Mullan from the Western Australian Environmental Health Directorate
• Jane Heyworth from the University of Western Australia.
David Batts, Karen Bishop, Katrina Burgess, Ann Hunt, Ingrid Seebus and Adrian Webster, all from the AIHW, provided comments during the drafting of this report.
Staff of the AIHW Information Services and Publishing Unit provided support with the design and publication process.
vi
Abbreviations
ABS Australian Bureau of Statistics
AIHW Australian Institute of Health and Welfare
BMI body mass index
BoM Bureau of Meteorology
CNOS Canadian National Occupancy Standard
CO carbon monoxide
COPD chronic obstructive pulmonary disease
DALY disability-adjusted life year
dB decibel
DMFT decayed, missing or filled teeth (permanent teeth)
dmft decayed, missing or filled teeth (deciduous teeth)
DoHA Department of Health and Ageing
ETS environmental tobacco smoke
FSANZ Food Standards Australian and New Zealand
IARC International Agency for Research on Cancer
ICD-10 International Statistical Classification of Diseases and Related Health Problems, 10th Revision
NHMRC National Health and Medical Research Council
NO2 nitrogen dioxide
OECD Organisation for Economic Co-operation and Development
OR odds ratio
PM (PM10 or PM2.5) particulate matter (with diameter of particles)
ppb parts per billion
RR rate ratio
SO2 sulphur dioxide
UVR ultraviolet radiation
VOC volatile organic compound
WHO World Health Organization
vii
Summary
Why look at environment and health?
There is increasing awareness that our health and the environment in which we live are closely linked, and in 2006 the World Health Organization (WHO) estimated that 24% of the global burden of disease was due to modifiable environmental factors. This growing awareness is reflected in recent health and environmental initiatives from governments and other organisations.
How does this report help?
Given the abundance and diversity of literature, it is useful to summarise and increase access to information regarding health and the environment. As new evidence is constantly emerging, this report does not seek to provide definitive conclusions about this relationship. Rather, it draws upon key studies and synthesises the main findings related to a selected list of 15 environmental factors. The report also notes that it can be difficult to assess the relationship between health status and environmental factors for a number of reasons.
What are the main findings?
Overall, the report indicates that the environment can be a major determinant of our health and how we live. In general, the results reported here demonstrate that:
• Our surroundings can influence our health through a variety of channels—through exposure to physical, chemical and biological risk factors or by triggering changes to our own behaviour or the behaviour of those around us. Such effects may be direct (such as injury or death) or indirect (through changes in lifestyle and health behaviours).
• The environment has the potential to affect physical health (for example, respiratory problems due to air pollution) and mental wellbeing (for example, poor mental health associated with drought conditions). Conversely, there are natural and modified features of the environment (such as green space and water fluoridation) which benefit health.
• There is a growing awareness that humans, through their intervention in the environment, play a vital role in exacerbating or reducing health risks.
Examples of the report’s detailed findings include:
• From official records, bushfires killed 815 people in Australia between January 1851 and December 2010 (see Section 3.3).
• A large study found that people living in more walkable neighbourhoods (characterised by connected streets, high residential density and pedestrian-oriented shopping) were less likely to be obese than people living in less walkable areas (see Section 4.3).
• A study using data from the National Health Survey showed that overcrowding was responsible for 30% of the health gap between Indigenous adults living in remote areas and the non-Indigenous population (see Section 4.7).
What don’t we know?
There is a lack of data on exposure to environmental hazards and health outcomes, particularly at a local level. As such, the health effects of many aspects of the environment have not been systematically evaluated, and there is associated uncertainty about causality because the pathways involved may be indirect and complex. Despite these limitations, this report provides insight into the relationship between the environment and health

Health and the environment: a compilation of evidence 1
1 Introduction
The natural and built environment can be a major determinant of health and how we live. Our surroundings can influence our health through a variety of channels—through exposure to physical, chemical and biological risk factors or by triggering behavioural changes. Likewise, there is a growing awareness that humans, through their intervention in the environment, play a vital role in exacerbating or mitigating health risks.
This report compiles evidence regarding the potential relationships between health and the environment. It covers 15 environmental factors ranging from ‘natural’ features (such as temperature and ultraviolet radiation) to aspects of our surroundings which have been created or modified by humans (such as housing and transport). The relationships between these environmental factors and health outcomes are not always obvious or transparent, and there is considerable uncertainty about causality in some circumstances.
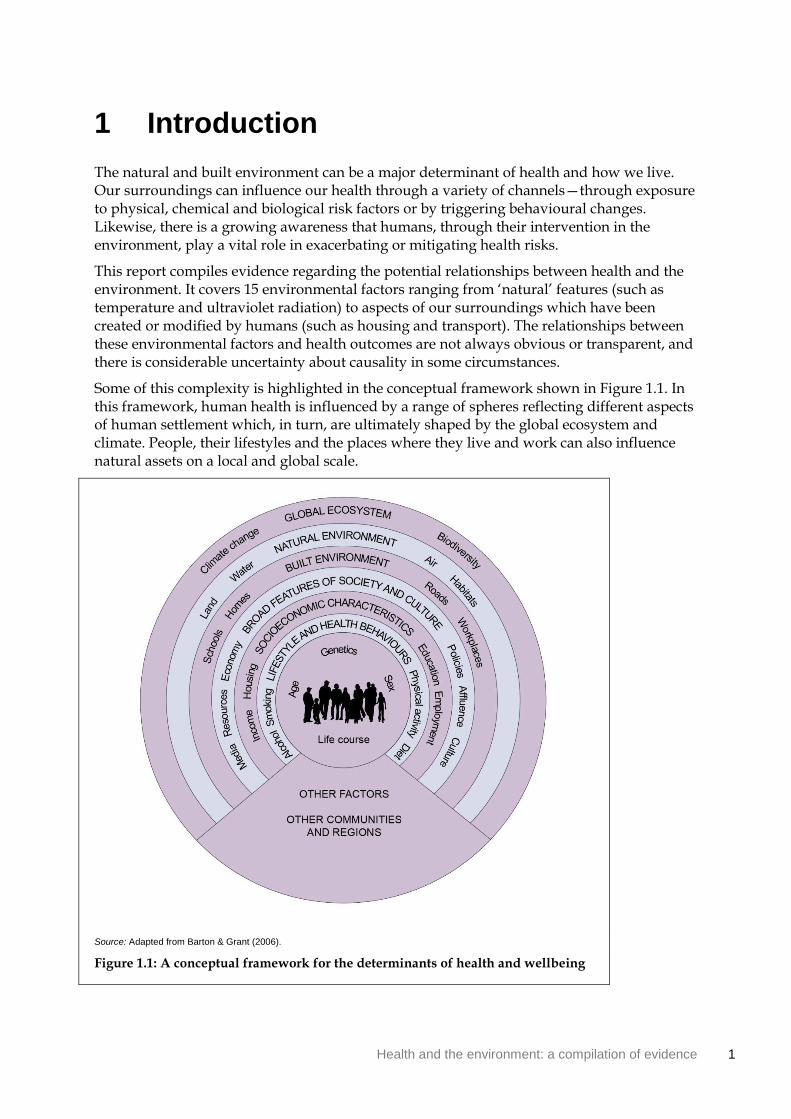
Some of this complexity is highlighted in the conceptual framework shown in Figure 1.1. In this framework, human health is influenced by a range of spheres reflecting different aspects of human settlement which, in turn, are ultimately shaped by the global ecosystem and climate. People, their lifestyles and the places where they live and work can also influence natural assets on a local and global scale.
Source: Adapted from Barton & Grant (2006).
Figure 1.1: A conceptual framework for the determinants of health and wellbeing
2 Health and the environment: a compilation of evidence
1.1 Australia’s environment at a glance The Australian continent has an extremely varied natural environment with distinctive landscapes, flora and fauna. Within this environment, a rich human culture has developed since the first migrants arrived on the mainland more than 40,000 years ago. The arrival of Europeans in 1788 triggered substantial changes in the Australian landscape, particularly through land clearing, water extraction and agriculture. Sustained migration from rural to urban areas over the last 150 years has also transformed the landscape. The majority of Australians (68%) now live in cities of more than half a million people (Box 1.1).
Box 1.1: Australia’s environment at a glance
Landscapes, flora and fauna
Australia’s land area is almost 7.7 million square kilometres.
Australia is the lowest, flattest and, apart from Antarctica, driest continent in the world. Around 80% of the continent has an average rainfall of below 600mm per year, and 50% below 300mm.
Average annual air temperatures range from 28°C in the extreme north of Western Australia to 4°C in the alpine areas of south-eastern Australia.
The highest maximum temperature ever recorded was 51°C in Oodnadatta, South Australia (2 January 1960). The lowest temperature ever recorded was –23°C in Charlotte Pass, New South Wales (29 June 1994).
The Australian continent is home to more than one million species. Many of these are found nowhere else in the world—around 85% of flowering plants, 84% of mammals, 45% of birds and 90% of in-shore temperate fish.
Around 11% of land (81 million hectares) in mainland Australia and Tasmania is protected under legislation.
The people
As of June 2009, Australia’s estimated resident population was 21.9 million.
Approximately two-thirds (68%) of the population live in Major cities and the remainder in regional and remote areas.
The population is projected to increase to between 30.9 and 42.5 million by 2056, and to between 33.7 million and 62.2 million by 2101.
Source: ABS 2008a; BoM 2007.
The Australian continent features a wide range of climatic zones. These include tropical regions in the north, arid expanses in the interior and more temperate regions in the south and east. The continent experiences some of nature’s extremes including droughts, floods, tropical cyclones, bushfires and storms. In the twenty-first century, there has also been growing recognition that the climate is progressively changing. Minimum and maximum temperatures have shown an increasing trend with an overall mean increase of 0.7°C between 1910 and 2006 (ABS 2008b). Climate change has been identified as the largest threat facing the environment and a defining issue for the Australian population (Australian Government Treasury 2010).
The majority of Australians currently benefit from unpolluted drinking water, non-contaminated food products, waste collection and sanitation measures, and few endemic vectorborne diseases (such as malaria and dengue). However, water and energy use,
Health and the environment: a compilation of evidence 3
waterway health, soil salinity and climate variability (among others) are prominent environmental concerns. Further information can be found in the 2006 State of the Environment Report, published by the Department of the Environment, Water, Heritage and the Arts (2006).
1.2 Environment and the global burden of disease The World Health Organization (WHO) provides estimates of the global burden of disease—the aggregated impact of disease, injuries and risk factors across world regions. The key measure is the disability-adjusted life year (DALY), defined as years of life lost due to premature mortality and time lived in states of less than full health (AIHW: Begg et al. 2007).
More recently, attention has turned to the contribution of environmental factors to the burden of disease. Using WHO data from 2002, Prüss-Üstün & Corvalán (2006) estimated that 24% of the global burden of disease and 23% of all deaths were due to modifiable environmental factors (for example, pollution, occupational risks, land use practices and sanitation). Diseases with the largest absolute burden from environmental exposure included diarrhoea, lower respiratory infections and malaria.
The burden of disease attributed to modifiable environmental factors varies across population groups and world regions. Children suffer a disproportionate share—the per capita number of DALYs lost to environmental factors was about five times greater in children under five years of age than in the total population. The environmental health burden was also much higher in the developing world, although in the case of certain non-communicable diseases, such as cardiovascular diseases and cancers, the per capita disease burden was found to be larger in developed countries.
Global estimates of environmental disease burden are likely to be conservative due to difficulties in quantifying the complex pathways between environmental factors and health (see Chapter 2 Understanding the relationship between environment and health for further information). Nevertheless, the estimates reflect how much death, illness and disability could be avoided as a result of reduced human exposures to environmental hazards.
1.3 Governance and policy There has been a long history of organised efforts related to environmental hazards. In England during the mid-1800s, concerns about the poor quality of living conditions and environmental changes brought about by industrialisation and urbanisation led to widespread public health measures (for example, publicly-funded sewerage systems, public water supplies and paved streets) (Butterworth 2000). The first examples of Australian environmental and public health efforts took their lead from existing British statutes and were concerned with quarantine, improving sanitation, the control of infectious diseases and other immediate health issues such as clean milk and water (NPHP 1998). Other interventions and policies since this time have aimed to improve air quality, reduce vector populations, increase the safety of transport systems, implement and enforce standards for exposure to toxic levels of chemicals and address many other environmental factors which are considered modifiable.
In more recent history, there has been a growing awareness that environmental hazards extend beyond traditional limits. While some environmental problems (such as indoor air pollution) may be restricted to one home or workplace, other issues exist on a regional,

4 Health and the environment: a compilation of evidence
national or global scale (such as health impacts associated with climate change). This presents new challenges for governments, particularly as it is, by definition, a cross-cutting issue—that is, it involves environment and health policy and, in some circumstances, agricultural and water policy areas.
As in many countries, the Australian Government has taken an interest in this emerging field. The National Environmental Health Strategy 2007–2012 was approved by the Australian Health Protection Committee in October 2007 (DoHA 2007). The strategy outlines directions and priorities for environmental health management in Australia. Specific health risks identified include emergencies and disasters, climate change, increasing pressure on drinking water supplies, the intensity of urban development and lack of effective environmental health infrastructure in Aboriginal and Torres Strait Islander communities. One of the key objectives within the strategy is to develop Australia’s environmental surveillance capacity (see Section 2.1 Environmental health surveillance for more information).
As a national statutory authority promoting better information and statistics, the Australian Institute of Health and Welfare (AIHW) is interested in how best to study interactions between the environment and our health. For example, see Monitoring the impact of air pollution on asthma in Australia: a methods paper (AIHW 2010a).
1.4 Definition of key terms used in this report By definition, the scope of the term ‘the environment’ is very broad. One way it can be conceptualised is as all of the external elements which surround, influence and affect life. While this is often associated with natural environmental factors (such as air, water and climate), human settlements are ‘environments’ in their own right. For the purposes of this report, the environment has been divided into natural and built domains.
The natural environment encompasses all the species, habitats and landscapes found on earth. It includes universal natural resources such as air, water and climate as well as complete ecological units such as vegetation, animals, micro-organisms, soil and rocks. In contrast to the built environment, the natural environment does not originate from humans, although it may be subject to human intervention and impact.
The built environment refers to aspects of our surroundings which are created or modified by people rather than naturally occurring. It includes homes, schools and workplaces, recreation areas, transport systems and many other settings.
There is considerable crossover between the natural and built environments. For example, outdoor air quality is listed here under the natural environment, despite being subject to considerable human intervention (such as through industrial emissions). Similarly, water fluoridation is considered here as part of the built environment even though it involves a natural element.
1.5 Selection of environmental factors This report was designed to highlight associations between the environment and health from an Australian perspective. As a central repository for this information, the report may be useful for policy-makers, researchers, students and the general public who are interested in this emerging field. The report is not intended to cover all potential associations—a task which would be sizeable given the broad scope of the environment—so a select rather than exhaustive list of environmental factors were chosen for study. These factors were selected
Health and the environment: a compilation of evidence 5
because they may have either a direct or indirect relationship to health and are the subject of academic, political or popular interest. Environmental factors which are modifiable by human intervention were prioritised but not exclusively included. This report also focuses on the health of humans rather than on animals, plants or landscapes, although undeniably these concepts are connected to the health and wellbeing of humans.
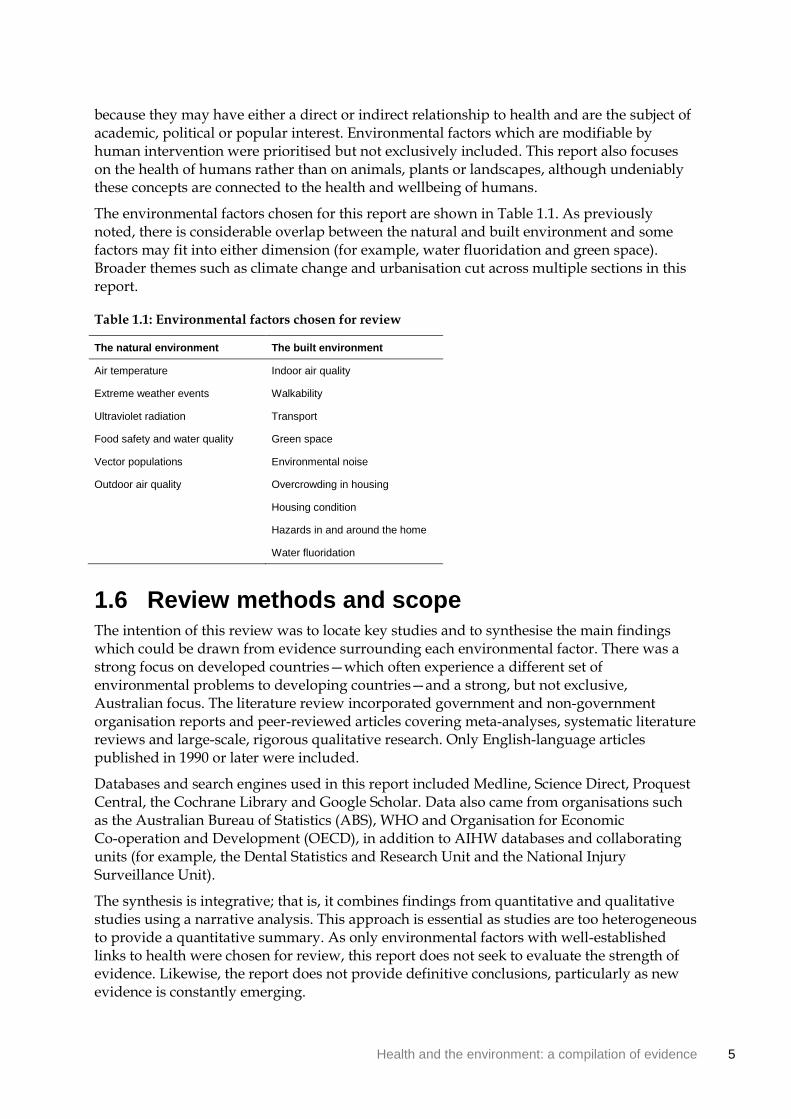
The environmental factors chosen for this report are shown in Table 1.1. As previously noted, there is considerable overlap between the natural and built environment and some factors may fit into either dimension (for example, water fluoridation and green space). Broader themes such as climate change and urbanisation cut across multiple sections in this report.
Table 1.1: Environmental factors chosen for review
The natural environment The built environment
Air temperature Indoor air quality
Extreme weather events Walkability
Ultraviolet radiation Transport
Food safety and water quality Green space
Vector populations Environmental noise
Outdoor air quality Overcrowding in housing
Housing condition
Hazards in and around the home
Water fluoridation
1.6 Review methods and scope The intention of this review was to locate key studies and to synthesise the main findings which could be drawn from evidence surrounding each environmental factor. There was a strong focus on developed countries—which often experience a different set of environmental problems to developing countries—and a strong, but not exclusive, Australian focus. The literature review incorporated government and non-government organisation reports and peer-reviewed articles covering meta-analyses, systematic literature reviews and large-scale, rigorous qualitative research. Only English-language articles published in 1990 or later were included.
Databases and search engines used in this report included Medline, Science Direct, Proquest Central, the Cochrane Library and Google Scholar. Data also came from organisations such as the Australian Bureau of Statistics (ABS), WHO and Organisation for Economic Co-operation and Development (OECD), in addition to AIHW databases and collaborating units (for example, the Dental Statistics and Research Unit and the National Injury Surveillance Unit).
The synthesis is integrative; that is, it combines findings from quantitative and qualitative studies using a narrative analysis. This approach is essential as studies are too heterogeneous to provide a quantitative summary. As only environmental factors with well-established links to health were chosen for review, this report does not seek to evaluate the strength of evidence. Likewise, the report does not provide definitive conclusions, particularly as new evidence is constantly emerging.

6 Health and the environment: a compilation of evidence
1.7 Structure of this report The first chapter of Health and the environment: a compilation of evidence provides contextual information and outlines the methodology used in this report. Chapter 2 discusses some of the approaches used to examine the relationship between the environment and health, as well as some of the challenges involved in this process and limitations of the evidence. Chapter 3 (The natural environment) and Chapter 4 (The built environment) synthesize available evidence and literature on the relationship between the environment and health. A description for each environmental factor is provided along with a case study and/or examples of Australian data.
Health and the environment: a compilation of evidence 7
2 Understanding the relationship between environment and health
This chapter examines some of the approaches and challenges involved when determining if (and how) the natural and built environment affect health. While there are many difficulties involved, exploring these connections is an important task which may require new research methods and collaborations to be developed. A range of disciplines may collaborate, including public health and epidemiology, the biological and chemical sciences, urban planning, demography, sociology and psychology. All levels of government, the private sector and not-for-profit organisations may play a role in research, evaluation and the dissemination of results.
A variety of research approaches is used to evaluate the effects of environmental factors on health. These include experimental studies (both in animals and humans), in-vitro studies, epidemiological research and large-scale monitoring programs. While some projects cover a large population (such as national surveillance), others are focused on specific population groups or a bounded area. According to Rushton & Elliott (2003), the primary aims of research in this field vary but can include:
• the identification of causal relationships between environmental hazards and ill-health in general populations and specific subgroups
• the evaluation and monitoring of changes in health with environmental changes
• the provision of evidence for the setting of ‘acceptable’ standards for known environmental contaminants.
2.1 Environmental health surveillance Environmental health surveillance is the routine and ongoing collection, integration, analysis and interpretation of data about environmental hazards, exposure to these hazards and the health effects potentially related to exposure (Centers for Disease Control and Prevention 2003). This is conducted in order to monitor and prevent disease. Surveillance information can be displayed in different ways such as maps, charts or tables. A surveillance system can help determine health impacts and trends, disease clusters and outbreaks, population and geographic areas that are most at risk and the effectiveness of public health interventions.
Examples of questions answered by a surveillance system may include: Are birth defects linked to environmental factors? To what extent is cancer associated with toxic waste? Is there a relationship between childhood allergies and chemical usage? (Western Australian Environmental Health Directorate: Mullan et al. 2008). For these reasons and more, there is strong interest in a nationwide environmental health surveillance program for Australia.
One of the eight key objectives of the Australian Government’s National Environmental Health Strategy 2007–2012 was the development of an environmental health surveillance capacity to ensure that environmental risks are being appropriately managed (DoHA 2007). In order to address this, the Western Australian Environmental Health Directorate examined the feasibility of a Australian environmental health surveillance system. The report based on this study was released in November 2008 and indicated that this kind of system was feasible for Australia given recent developments in technology and widespread support across all
8 Health and the environment: a compilation of evidence
agencies and jurisdictions (Western Australian Environmental Health Directorate: Mullan et al. 2008). Further work is currently being undertaken by the Western Australian Environmental Health Directorate regarding the scope and specifications of an Australian surveillance system.
2.2 Complications and confounders Attributing specific health outcomes to environmental factors and quantifying these relationships is a difficult task. As such, the health effects of many aspects of the environment have not been systematically evaluated. This section describes some of the challenges involved in this process, specifically those related to causality and data availability.
Determining causality
The relationship between the environment and health often involves indirect and complex pathways. The following features make it difficult to determine causality:
• Health may be affected in the long rather than short term; therefore, effects may be displaced or delayed from an initial exposure to an environmental factor.
• Whether or not health effects actually occur depends on a wide range of other variables such as age, socioeconomic status, existing health conditions and access to health care services. As such, particular population groups may be more vulnerable—for example, children, the elderly and people with existing socioeconomic disadvantage.
• Health effects may vary with the season and time of day and, therefore, the timing and duration of measurement is an important consideration (for example, air pollution measurement).
• While some health effects may be localised (for example, due to indoor air pollution in a home), other effects may be community-based, citywide, national or even transnational (for example, in the case of ozone depletion or global warming).
• Effects may be bi-directional—that is, the environment can both influence and be influenced by human health and wellbeing. In some circumstances, humans can modify their environment to mitigate (or magnify) health risks.
Data availability
There are few data sources which can be used to accurately measure how environmental factors affect health, particularly at the local level. Data limitations may include the following:
• Surveys and administrative data sets may focus on collecting health data or environmental data, but not collecting and linking both types of data.
• Surveys are often conducted on a one-off basis rather than at regular intervals, which makes it difficult to monitor health responses to ongoing environmental changes.
• Data coverage may be inadequate at a local level, or alternatively national coverage may be incomplete.
• The size and diversity of Australia’s geographic and environmental regions may reduce the relevance of data aggregated at a national level.
Health and the environment: a compilation of evidence 9
• Spatial information (that is, data connected to geographic location) may be necessary, creating a need for new tools and methodologies (for example, in measuring areas of green space).
Due to these factors, it is often impossible to say with useful certainty that an environmental factor affects health in a particular (quantifiable) way. A great deal of the literature describes this relationship in terms of the risk or probability of an outcome (such as the development of a disease). Despite a degree of uncertainty, this approach provides useful insights into the relationship between the environment and health.
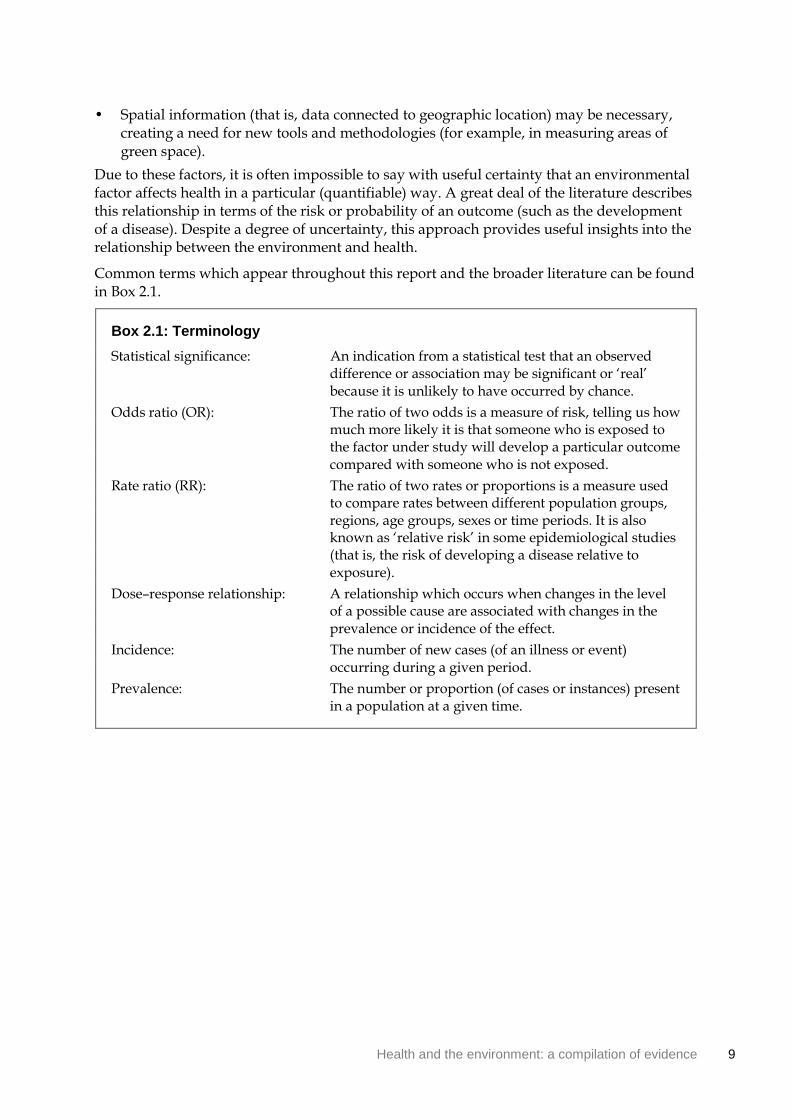
Common terms which appear throughout this report and the broader literature can be found in Box 2.1.
Box 2.1: Terminology
Statistical significance: An indication from a statistical test that an observed difference or association may be significant or ‘real’ because it is unlikely to have occurred by chance.
Odds ratio (OR): The ratio of two odds is a measure of risk, telling us how much more likely it is that someone who is exposed to the factor under study will develop a particular outcome compared with someone who is not exposed.
Rate ratio (RR): The ratio of two rates or proportions is a measure used to compare rates between different population groups, regions, age groups, sexes or time periods. It is also known as ‘relative risk’ in some epidemiological studies (that is, the risk of developing a disease relative to exposure).
Dose–response relationship: A relationship which occurs when changes in the level of a possible cause are associated with changes in the prevalence or incidence of the effect.
Incidence: The number of new cases (of an illness or event) occurring during a given period.
Prevalence: The number or proportion (of cases or instances) present in a population at a given time.
10 Health and the environment: a compilation of evidence
3 The natural environment
3.1 Introduction The natural environment encompasses all species, habitats and landscapes found on earth—excluding aspects of the environment which originate from human activities (addressed in Chapter 4 The built environment). It includes universal natural resources such as air, water and climate, as well as complete ecological units such as vegetation, rocks, micro-organisms and animals. For the purposes of this report, food safety and water quality has been included as part of the natural environment, even though they are subject to considerable human intervention.
The continent of Australia has a distinctive and varied natural environment with inherent fragility and extremes (see Box 1.1). As many natural environmental factors are subject to human intervention, it is important to understand the health risks and benefits posed by these actions. There is a growing awareness that humans, through their intervention in the natural environment, play a vital role in exacerbating or mitigating health risks (see Box 3.1).
One of the most prominent examples of the human–environment relationship is climate change—a human-induced progression of changes to the global environment primarily caused by the burning of fossil fuels and land use practices (Holdren et al. 2008). Australia’s climate is already changing and serious impacts on the natural environment (and thus human health) are likely to continue to occur (CSIRO & BoM 2010).
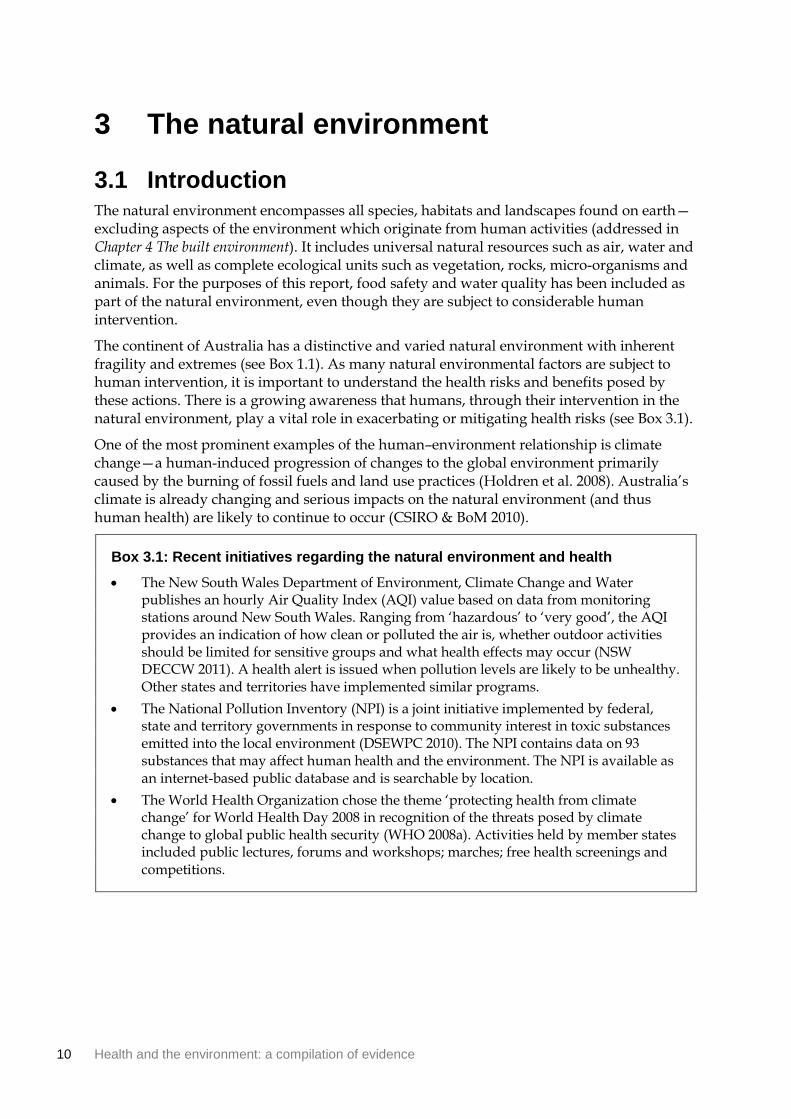
Box 3.1: Recent initiatives regarding the natural environment and health
The New South Wales Department of Environment, Climate Change and Water publishes an hourly Air Quality Index (AQI) value based on data from monitoring stations around New South Wales. Ranging from ‘hazardous’ to ‘very good’, the AQI provides an indication of how clean or polluted the air is, whether outdoor activities should be limited for sensitive groups and what health effects may occur (NSW DECCW 2011). A health alert is issued when pollution levels are likely to be unhealthy. Other states and territories have implemented similar programs.
The National Pollution Inventory (NPI) is a joint initiative implemented by federal, state and territory governments in response to community interest in toxic substances emitted into the local environment (DSEWPC 2010). The NPI contains data on 93 substances that may affect human health and the environment. The NPI is available as an internet-based public database and is searchable by location.
The World Health Organization chose the theme ‘protecting health from climate change’ for World Health Day 2008 in recognition of the threats posed by climate change to global public health security (WHO 2008a). Activities held by member states included public lectures, forums and workshops; marches; free health screenings and competitions.
Health and the environment: a compilation of evidence 11
3.2 Air temperature
What is temperature and how is it measured?
Temperature is a physical property that commonly underlies our notions of hot and cold, although other environmental and personal factors may be involved in determining our thermal comfort (such as air flow, humidity, levels of clothing and physical activity) (BoM 2010).
Air temperature varies greatly depending on how and where it is measured. The Australian Bureau of Meteorology (BoM) measures air temperature in a shaded enclosure at a height of approximately 1.2 metres above the ground (BoM 2010). In this way, the thermometer is freely exposed to the air but shielded from radiation and moisture. The Celsius scale (ºC) is used for temperature in Australia (and most other countries) while the Fahrenheit scale (ºF) is still used in countries such as the United States and Belize.
There are few standard definitions for when maximum or minimum temperatures become ‘extreme’, particularly as it depends upon ‘normal’ temperatures in a geographical area. Furthermore, people living in certain areas may be able to acclimatise and cope with some weather conditions better than others. As such, those living in areas where extreme heat is rare are more likely to be affected by heat-related health problems (O’Neil & Ebi 2009). In contrast, some populations which are subject to regular hot spells may develop adaptive behaviours and thus be less affected by heat (Nitschke et al. 2007; Tong et al. 2010).
How can air temperature affect health?
The majority of studies in this field look at air temperature in a bounded area (usually a city) and examine health outcomes in that area. The time frame may be long term, seasonal or limited to extreme events such as heat waves. Mortality data are often used due to their availability and reliability and, likewise, hospital admissions data can also be used.
As temperature is a key aspect of the natural environment, some studies have examined its interaction with other environmental factors. A number of studies (see Ren & Tong 2006) suggest that air temperature (especially heat) may exacerbate the health effects of air pollution (Section 3.7 Outdoor air quality) and increase the risk of biological hazards (Section 3.6 Vector populations). See also Section 3.3 Extreme weather events for information specifically related to drought, bushfires, storms and flooding.
Hot weather
A number of recent studies have confirmed a significant association between temperature and health effects at a population level, most notably in terms of mortality. These effects are usually of a ‘U’- or ‘J’-shaped pattern, meaning that any health effects are usually lowest at the average temperature (Lin et al. 2009). Mortality typically increases rapidly after passing a certain high temperature threshold which will vary between cities (Basu & Samet 2002; State Government of Victoria DoHS 2009). For example, Vaneckova et al. (2008) found mortality was lowest in Sydney when the maximum temperature was 23–24ºC.
A number of studies have attempted to quantify the increase in all-cause mortality as temperatures change. For example, studies in the region have found:
12 Health and the environment: a compilation of evidence
• A 0.9% increase in mortality for every 1°C increase in maximum temperature in Sydney with mortality 7.8% higher than expected when the maximum temperature reached 32°C (Hu et al. 2008).
• A 4.5–12.1% increase in mortality for every 10°C increase in maximum temperature in Sydney (Vaneckova et al. 2008).
• Similar increases in New Zealand (Hales et al. 2000) and East Asian capital cities (Chung et al. 2009).
Hot weather has also been associated with an increase in morbidity. Elevated temperatures can cause heat cramps, heat syncope (fainting), heat exhaustion, heat stroke and dehydration (State Government of Victoria DoHS 2009). A study in Melbourne (Loughnan et al. 2010) found that acute myocardial infarction admissions increased by 10% on days over 30°C, while another study in Brisbane (Wang et al. 2009) found increase in temperature was significantly associated with hospital admissions for stroke although the impact varied with different type of stroke.
The risk of heat-related problems may increase for those living in urban areas (known as the ‘heat island effect’) and those without air conditioning. Elderly persons have also been identified as being at particular risk of heat-related health problems. This is due to both physiological reasons (such as reduced ability to regulate body temperatures) (Basu & Samet 2002) and other factors (for example, social isolation, mental illness and housing type) (Vaneckova et al. 2008).
Heat waves
A number of studies have specifically measured the effect of short-term extreme heat events known as heat waves. Understanding these effects is especially important in Australia, where heat waves are not uncommon and the frequency and duration of these events is expected to increase due to climate change (Tong et al. 2010). Although heat waves can differ in their impact depending on their intensity and duration (Chung et al. 2009), many studies have found short-term elevated mortality for cardiovascular disease, respiratory disease and cerebrovascular disease (Basu & Samet 2002; State Government of Victoria DoHS 2009). For example, Tong et al. (2010) found a 23% increase in non-external cause mortality and a 20% increase in cardiovascular mortality during a 2004 heatwave in Brisbane. However, Nitschke et al. (2007) found no significant excess mortality for heat waves in Adelaide between 1993 and 2006.
One possible explanation for excess mortality during heat waves is that frail people expected to die in the short-term do so in large numbers when temperatures are very high (known as ‘harvesting’) (Basu & Samet 2002). There is still some debate over the importance of harvesting; for example, Tong et al. (2010) found no significant effect in their Brisbane study.
Health and the environment: a compilation of evidence 13
Box 3.2: Heat wave, January 2009, Victoria (Australia)
At the end of January 2009, Victoria recorded extremely high day and night-time temperatures. Maximum daily temperatures were 12–15ºC above normal, a peak of 45ºC was reached on 30 January and temperatures surpassed 43ºC for three days in a row (28–30 January).
A preliminary assessment by the State Government of Victoria Department of Human Services (2009) suggests that the heat wave had a significant impact on health in the state. During the week of the heat wave, 980 people died compared with a mean of 606 deaths from the past five years. Many of those who died (248 people) were aged 75 years or older. Ambulance attendances increased by 25% compared with the same time in the previous year, while there was a 12% increase in emergency department presentations (including a 64% increase in the most severe triage category).
Cold weather
Although this section has focused mainly on the health outcomes of heat, exposure to cold also has adverse health effects such as increased blood pressure and heart rate (Bi et al. 2008), thrombosis and hypothermia (O’Neil & Ebi 2009). Breathing cold air may also exacerbate respiratory conditions (Bi et al. 2008).
While Australia is often known for its hot climate, low temperatures can also be an important environmental hazard in our region. Between 1997 and 2007, 231 people died of ‘exposure to excessive natural cold’. Similar to high temperatures, Bi et al. (2008) found that mortality was higher among the elderly when temperatures were low during Brisbane winters. Weerasinghe et al. (2002) also found a significant increase in cardiac deaths during winter months in New South Wales, while Barnett et al. (2005a) found a worldwide increase in coronary events during cold periods, especially in warm climates.
Climate change and temperature-related death
The effects of prolonged global warming on temperature-related mortality are likely to be highly variable over place and time. According to the Garnaut Climate Change Review, temperature-related deaths may fall in some parts of Australia (due to fewer cold-related deaths) but increase in others (Garnaut 2008). The report predicted that unmitigated climate change may modestly reduce temperature-related deaths in Victoria, South Australia, New South Wales and Tasmania, but markedly increase deaths in Queensland and the Northern Territory (with 10 times as many deaths by the end of the century compared with no climate change) (Bambrick et al. 2008). In Australia as a whole, small declines in total annual temperature-related deaths are expected in the first half of the century. However, by mid-century, heat-related deaths are expected to increase substantially, overtaking cold-related deaths (Bambrick et al. 2008).

14 Health and the environment: a compilation of evidence
3.3 Extreme weather events
What are extreme weather events?
The term ‘extreme weather’ describes unusual weather events or phenomena that are at the extremes of a historical distribution. Extreme weather events include unusually violent storms, exceptionally high levels of precipitation, heat waves or droughts that are longer or hotter than normal and a range of other events such as bushfires, floods and landslides which are triggered by extreme weather.
Extreme weather events often have substantial social and economic consequences and may be hazardous to human life or property. The health effects of these events may be immediate and physical (such as deaths and injury due to bushfires) or damaging in the long term (for example, mental health problems or chronic injury) (Morrissey & Reser 2007). It is anticipated that climate change will increase the risk of drought, high fire danger and possibly extreme precipitation events (CSIRO 2007). As such, understanding any impacts of extreme weather on human health and wellbeing is increasingly important.
How can extreme weather affect health?
This section examines bushfires, drought and storms and flooding—weather phenomena that are relevant to the Australian continent. It focuses on some of the direct and indirect effects that these extreme weather events have on health (excluding temperature which is discussed in Section 3.2 Air temperature). Weather events may also affect infrastructure and the provision of health services, in addition to having broader social and economic consequences; however, these are beyond the scope of this report.
Bushfires
Bushfires are occurring more frequently than in the past, and global warming is likely to increase the frequency and severity of fires, as well as the length of the bushfire season (Johnston 2009; Tham et al. 2009). As well as leading to widespread destruction, bushfires (and fuel-reduction burns) are also sources of air pollution, increasing particulate matter across wide geographic areas (Morgan et al. 2010).
Bushfires can lead to large-scale loss of life and injury (Johnston 2009). From official records, bushfires killed 815 people in Australia between January 1851 and December 2010 (Emergency Management Australia 2010). Exposure to radiant heat can cause burns to the face, skin and larynx, while smoke inhalation can cause respiratory failure. Bushfires also may increase the likelihood of physical trauma such as car accidents (Johnston 2009). Broader literature suggests that natural disasters have long-term health consequences, especially on the occurrence of psychological disorders including post-traumatic stress, major depression and anxiety, and on behavioural disorders such as those associated with substance use and domestic violence (McDermott & Palmer 1999; Yzermans et al. 2005; Johnston 2009).
As mentioned previously, bushfires may lead to dangerous levels of particulate air pollution, affecting populations which are not directly threatened by the fire (Johnston 2009). A number of recent Australian studies have found a relationship between bushfires and adverse respiratory effects, although the evidence for other health outcomes is limited. Examples of relevant findings include:
Health and the environment: a compilation of evidence 15
• Bushfire smoke was found to be significantly associated with respiratory hospital admissions in Brisbane over a three-year period (Chen et al. 2006).
• Emergency asthma presentations were significantly higher during ‘continuous’ bushfire conditions around Darwin during the 2000 dry season (Johnston et al. 2002).
• Respiratory emergency admissions (although not hospital admissions) greatly increased in the city of Melbourne during the 2003 Victorian bushfires (Tham et al. 2009). This relationship was not observed in the more rural area of Gippsland.
• Bushfire smoke in Sydney (1994–2002) was associated with increased hospital admissions for respiratory disorders (especially asthma among adults) but not cardiovascular admissions or increased mortality (Morgan et al. 2010).
• A survey during a bushfire near Albury, New South Wales found that 70% of respondents experienced health symptoms such as eye irritation and respiratory problems, the most common being coughing, throat irritation and shortness of breath (Kolbe & Gilchrist 2009).
For additional information of the health effects of outdoor air pollution, see Section 3.7 Outdoor air quality.
Box 3.3: Black Saturday, February 2009, Victoria (Australia)
The Victorian bushfires on Saturday, 7 February 2009 (commonly referred to as ‘Black Saturday’) were one of the world’s worst bushfire events in terms of human fatalities (Cameron et al. 2009) and the worst in Australian history (Emergency Management Australia 2010).
The bushfires occurred after a period of extremely hot weather (see Box 3.2) which, combined with gusting winds, led to 14 separate fires burning out of control across at least 70 communities. The bushfires killed 173 people, destroyed around 2,500 buildings and killed over 5,000 livestock (Emergency Management Australia 2010).
Cameron et al. (2009) reviewed over 400 bushfire-related hospital emergency presentations immediately after Black Saturday. These presentations included care for burns, physical trauma and smoke inhalation. The researchers found that the number of patients with severe burns was low in relation to the high number of deaths during the bushfires. It is suggested that during bushfires, the majority of victims either die or survive with minor injuries, and thus the number of survivors with severe burns injuries is relatively low.
Drought
Drought is considered a serious problem in Australia and can lead to adverse consequences for the community beyond the agricultural and ecological spheres (Raphael et al. 2009). Drought may indirectly lead to certain health risks such as reducing the supply and quality of water and food, increasing the probability of bushfires, or creating an environment where vectorborne disease incidence may increase (Kalis et al. 2009).
However, there is limited evidence on the direct effects of drought on human health. The most researched area concerns the potential mental health effects of drought, especially among rural communities in Australia (Figure 3.1). Mental health problems may increase through a combination of the socioeconomic effects of drought (Berry et al. 2008) and more intangible impacts, such as drought creating an environment of death and loss leading to emotional distress (Dean & Stain 2010).
16 Health and the environment: a compilation of evidence
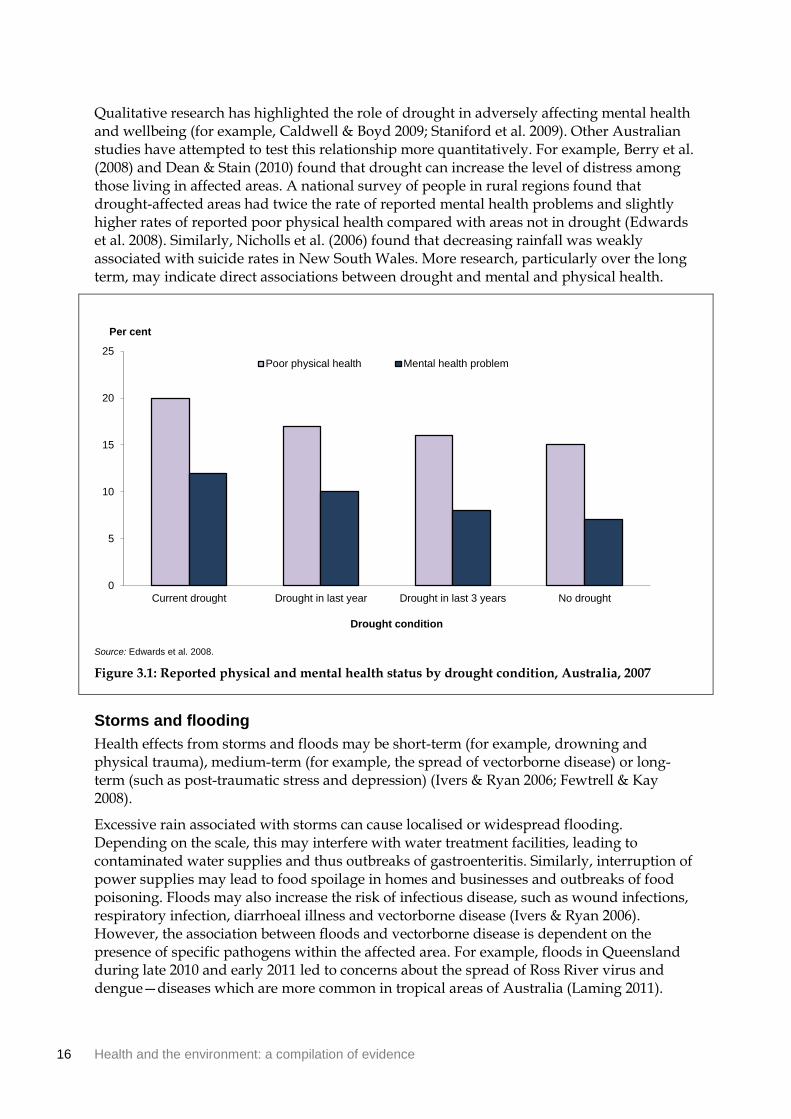
Qualitative research has highlighted the role of drought in adversely affecting mental health and wellbeing (for example, Caldwell & Boyd 2009; Staniford et al. 2009). Other Australian studies have attempted to test this relationship more quantitatively. For example, Berry et al. (2008) and Dean & Stain (2010) found that drought can increase the level of distress among those living in affected areas. A national survey of people in rural regions found that drought-affected areas had twice the rate of reported mental health problems and slightly higher rates of reported poor physical health compared with areas not in drought (Edwards et al. 2008). Similarly, Nicholls et al. (2006) found that decreasing rainfall was weakly associated with suicide rates in New South Wales. More research, particularly over the long term, may indicate direct associations between drought and mental and physical health.
Source: Edwards et al. 2008.
Figure 3.1: Reported physical and mental health status by drought condition, Australia, 2007
Storms and flooding
Health effects from storms and floods may be short-term (for example, drowning and physical trauma), medium-term (for example, the spread of vectorborne disease) or long-term (such as post-traumatic stress and depression) (Ivers & Ryan 2006; Fewtrell & Kay 2008).
Excessive rain associated with storms can cause localised or widespread flooding. Depending on the scale, this may interfere with water treatment facilities, leading to contaminated water supplies and thus outbreaks of gastroenteritis. Similarly, interruption of power supplies may lead to food spoilage in homes and businesses and outbreaks of food poisoning. Floods may also increase the risk of infectious disease, such as wound infections, respiratory infection, diarrhoeal illness and vectorborne disease (Ivers & Ryan 2006). However, the association between floods and vectorborne disease is dependent on the presence of specific pathogens within the affected area. For example, floods in Queensland during late 2010 and early 2011 led to concerns about the spread of Ross River virus and dengue—diseases which are more common in tropical areas of Australia (Laming 2011).
0
5
10
15
20
25
Current drought Drought in last year Drought in last 3 years No drought
Drought condition
Per cent
Poor physical health Mental health problem
Health and the environment: a compilation of evidence 17
Depending on the geographic area, there may also be concerns about bites from some species of snakes and spiders that have taken refuge in flooded houses.
After floods, water damage to buildings may cause mould contamination, particularly as mould tends to grow best in warm, damp environments (Brandt et al. 2006). This may be dangerous to people with impaired immune systems or pre-existing allergies. The strongest health associations with mould are found for upper and lower respiratory tract conditions (such as the exacerbation of asthma and allergic rhinitis or by causing hypersensitivity pneumonitis) (Committee on Damp Indoor Spaces and Health 2004; Brandt et al. 2006). However, public health surveillance after Hurricane Katrina in New Orleans did not show an increase in adverse health effects due to mould exposure (Barbeau et al. 2010). For more information on mould in housing see Section 4.8 Housing condition.
Several reports have indicated that increased episodes of acute asthma occur during thunderstorms (Marks et al. 2001; Pulimood et al. 2007). A study of six rural towns in New South Wales found that during late spring and summer, nearly 50% of days with excessive emergency attendances for asthma coincided with the passage of thunderstorm outflows over these towns (Marks et al. 2001). It was hypothesised that high concentrations of allergenic particles were produced by outflows of colder air, associated with a down-draught from a thunderstorm. These outflows would sweep up pollen grains and particles, and concentrate them in a shallow band of air at ground level. This in turn would trigger asthma and, in some cases, the need for emergency care.

18 Health and the environment: a compilation of evidence
3.4 Ultraviolet radiation
What is ultraviolet radiation?
Ultraviolet radiation (UVR) consists of high-energy rays which are invisible to the human eye. The most common source of UVR is sunlight, although some people may be exposed to artificial sources such as in solariums and when using incandescent lamps, arc discharges and lasers. UVR is divided into three types according to wavelength (UVA, UVB and UVC). UVA, and to a lesser extent UVB, are not wholly absorbed by atmospheric ozone and therefore are of interest for human health.
Stratospheric ozone, which protects the earth from UVR, has been depleted by human activity in recent years (Lucas et al. 2006). Due to its location, Australia has higher levels of solar UVR than many other countries (Lagerlund et al. 2006). In light of the risks, cancer councils and health departments have delivered public health messages urging Australians to reduce their exposure to the sun.
A person’s degree of exposure to UVR can be influenced by behavioural factors (for example, use of sunscreen and protective clothing and outdoor activities) and non-behavioural factors (for example, latitude, atmospheric conditions and time of year and day). In turn, these factors influence the extent of health risk. There is also increasing awareness that due to global migration patterns, people’s skin pigmentation may not be suited to the environment in which they live (Lucas et al. 2006; MacKie 2006). This may be particularly relevant to fair-skinned populations in Australia.
How can ultraviolet radiation affect health?
UVR exposure can have both beneficial and detrimental effects on health. Unlike many other environmental exposures (which tend to exhibit a more linear relationship), burden of disease plotted against UVR exposure gives a ‘U’-shaped curve (Lucas & Ponsonby 2002). This is because there are health risks associated with both low and high UVR exposure.
Low UVR exposure
Low UVR exposure can cause vitamin D deficiency, which is associated with rickets and osteoporosis (Lucas et al. 2006). There is also some suggestion of a link with cancers of the breast, prostate and colon and with auto-immune disorders, although evidence for these associations is not as strong as for musculoskeletal conditions (Lucas & Ponsonby 2002; Lucas et al. 2006). There is also evidence (although again less well-established) of a link between decreased UVR exposure and psychiatric disorders, such as seasonal affective disorder, mood disorders and schizophrenia (Lucas et al. 2006).
High UVR exposure
There is strong evidence associating high UVR exposure with chronic skin and eye diseases (Gallagher & Lee 2006). For example, laboratory and epidemiologic evidence suggests that UVR exposure is a major cause of melanoma and non-melanoma skin cancer (such as basal and squamous cell carcinomas) (Gallagher & Lee 2006; Coelho et al. 2009; Young 2009). Those with light skin, hair and eye colour, as well as freckles and moles, are at particular risk (Gallagher & Lee 2006). Although not as strong, there is also evidence of a possible association between UVR and lip cancer (Gallagher & Lee 2006). Furthermore, UVR exposure

Health and the environment: a compilation of evidence 19
is associated with eye problems such as cancer of the eye, cataract and pterygium (a benign growth on the eye) (Gallagher & Lee 2006; Lucas et al. 2006). Excessive UVR exposure can also lead to more minor health conditions such as sunburn (Lucas et al. 2006).
The WHO estimates that UVR exposure has only a modest effect on global disease burden (0.1%) with melanoma and cataract responsible for the highest number of disability-adjusted life years (Lucas et al. 2008). However, this burden may be heavier in Australia where melanoma alone contributed 0.8% of disease burden in 2003 (AIHW: Begg et al. 2007). Indeed, fair-skinned Australians and New Zealanders have the highest incidence of melanoma in the world (MacKie 2006).
Melanoma of the skin was the third most commonly diagnosed cancer in Australia during 2007 (behind prostate and bowel cancer for males and breast and bowel cancer for females) (AIHW & AACR 2010). There were 10,342 newly diagnosed cases of melanoma (46.7 cases per 100,000 population) and 1,279 deaths (5.7 deaths per 100,000) during that year. Melanoma constituted 9.5% of all new cancers diagnosed and 3.2% of all cancer deaths.
Non-melanoma skin cancer (such as basal and squamous cell carcinoma) is the most common cancer diagnosis in Australia. However, unlike other invasive cancers, it is not reportable by law to cancer registries and, as a result, incidence and prevalence statistics are not routinely available. One study by AIHW and Cancer Australia (2008) estimated that in 2002, over 370,000 Australians were diagnosed and treated for non-melanoma skin cancer and it was projected that in 2008, 434,000 Australians would be diagnosed. Because of its high incidence, non-melanoma skin cancer imposed the highest health-system expenditure of any cancer in Australia during 2000–01 (at an estimated $264 million).
Sun safety behaviours
A combination of an outdoor lifestyle and extreme UVR levels means Australia has the highest incidence of skin cancer in the world. While there is public awareness that sun exposure can cause skin cancer, many Australians have not adhered to sun safety messages. Compliance is particularly low amongst those in adolescence—a life stage where high sun exposure greatly increases the lifetime risk of developing skin cancer (DoHA 2006).
Findings from the National Sun Protection Survey show that 24% of Australian adolescents (aged 12–17 years) and 14% of Australian adults (aged 18–69 years) were sunburnt on an average summer weekend in 2006–07 (Cancer Council of South Australia 2008). During the summer, 29% of adolescents and 50% of adults generally wore a hat when outdoors in the peak radiation hours (11am to 3pm). Overall, 37% of both adolescents and adults used sunscreen while 19% of adults and only 9% of adolescents wore a three-quarter or long-sleeved top while outdoors during this time.
There are strong social norms driving sun tanning and sun exposure behaviour amongst Australians. Findings from the National Sun Protection Survey show that 22% of Australian adolescents—15% of boys and 29% of girls—deliberately tanned in the summer of 2006–07. Adults were less likely to attempt a tan than adolescents—11% of Australian adults indicated that they deliberately tanned in 2006–07.

20 Health and the environment: a compilation of evidence
3.5 Food safety and water quality
What is food safety?
Food is said to be unsafe when it is likely to cause physical harm to a person who may later consume it. This primarily relates to foodborne illness such as gastroenteritis (‘food poisoning’), although other forms of illness and injury can be triggered by short- or long-term exposure to particular contaminants. Food safety can be compromised anywhere in the food chain—from production and transport to storage and meal preparation. While risks associated with food businesses have drawn substantial attention, food safety can also be affected through incorrect food handling practices in the home or workplace.
Ensuring the safety of food relies upon a complex system of regulation. Food Standards Australia and New Zealand (FSANZ) is the bi-national statutory authority which regulates the delivery of safe food for Australians. It is responsible for developing standards for food composition, labelling and contaminants (including microbiological limits) that apply to all foods produced or imported for sale in Australia and New Zealand. These standards are enforced by Australian state and territory governments and the New Zealand Government through their individual food Acts.
This section looks at two major public health concerns in regard to food safety—foodborne illness and chemical contamination. It then considers issues related to water quality.
How can food safety affect health?
Foodborne illness
Foodborne illnesses are defined as diseases, usually infectious or toxic in nature, caused by agents that enter the body through the ingestion of food (WHO 2010a). An occurrence of foodborne illness may be isolated or part of a recognised ‘outbreak’ if a known food source is responsible for causing a group of people to be ill.
The two major foodborne illnesses are:
• Salmonellosis (caused by the Salmonella bacterium) with symptoms such as fever, headache, nausea, vomiting, abdominal pain and diarrhoea. Examples of foods involved in outbreaks of salmonellosis are eggs, poultry and other meats, raw milk and chocolate.
• Campylobacteriosis (caused by certain species of Campylobacter bacteria) with symptoms such as severe abdominal pain, fever, nausea and diarrhoea. Foodborne cases are caused mainly by raw milk, raw or undercooked poultry and drinking water.
The incidence of foodborne illness is difficult to estimate. It is estimated that up to 30% of the population in industrialised countries may suffer from foodborne illness each year (WHO 2010a). In Australia, it is estimated that there are 5.4 million cases of foodborne illness annually, costing $1.2 billion per year to the Australian economy (Hall et al. 2005).
OzFoodNet was established by the Australian Department of Health and Ageing to provide a better understanding of the causes and incidence of foodborne diseases in the community and to provide an evidence base for policy makers. In 2008, OzFoodNet reported 25,260 notifications of eight diseases that are commonly transmitted by food (OzFoodNet Working Group 2008). The most commonly reported infections were linked to Campylobacter (15,535 notifications) and Salmonella (8,310 notifications). Food was suspected or confirmed as the

Health and the environment: a compilation of evidence 21
mode of transmission for 149 outbreaks affecting 2,290 people (Table 3.1). In these outbreaks, 266 people were hospitalised and 5 deaths were reported. The highest rate of outbreak reporting was in the Northern Territory (23.3 per million population) although these outbreaks were smaller in size with a mean of 5.2 persons affected per outbreak.
Table 3.1: Outbreaks of foodborne illness reported by OzFoodNet, by state and territory, 2007
State or territory
No. of
outbreaks
No. of
people
affected
Mean size of
outbreak
(no. of
persons)
No. of people
hospitalised
Outbreaks per
million
population
New South Wales 53 829 15.6 187 7.7
Victoria 36 642 17.8 39 6.9
Queensland 32 406 12.7 19 7.7
Western Australia 9 171 19.0 16 4.3
South Australia 6 115 19.2 0 3.8
Tasmania 5 55 11.0 2 10.1
Australian Capital Territory 3 46 15.3 0 8.8
Northern Territory 5 26 5.2 3 23.3
Total 149 2,290 15.4 266 7.1
Source: OzFoodNet Working Group 2008.
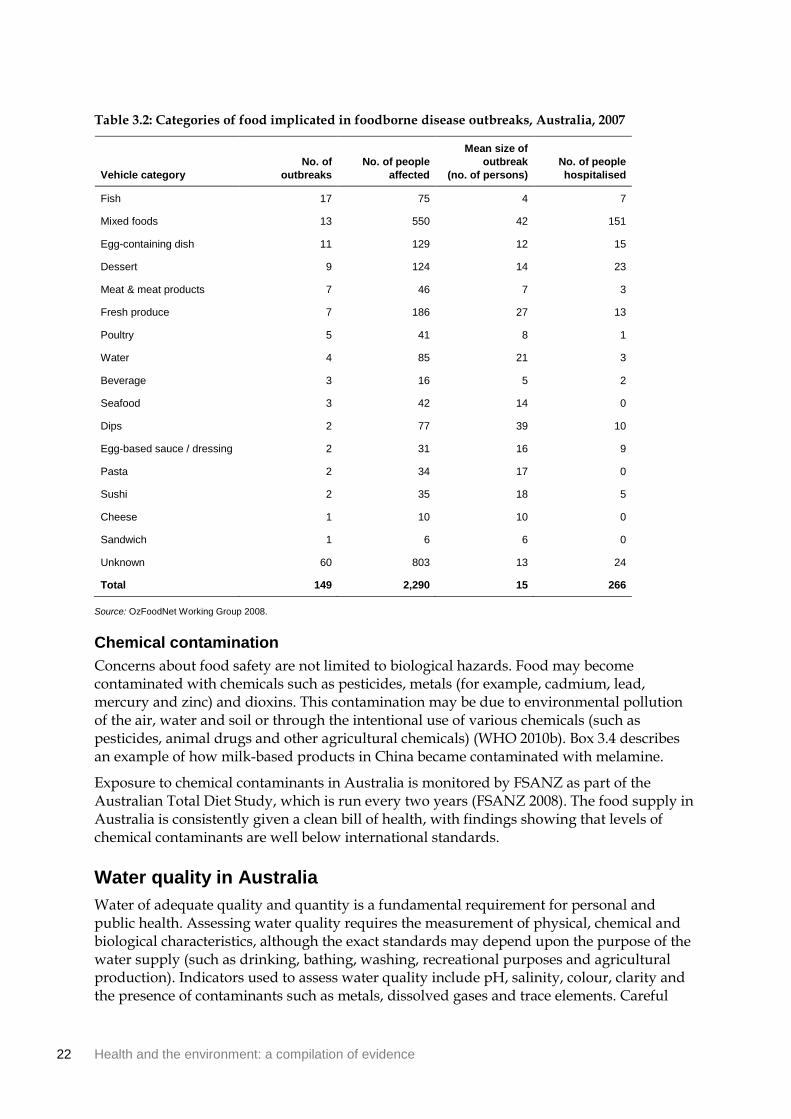
A wide variety of foods may be implicated in an outbreak of foodborne illness (Table 3.2). However, in many cases the food source cannot be identified by investigators (OzFoodNet Working Group 2008). Contaminated fish, mixed foods (for example, buffet meals) and egg-based dishes were the most common food sources leading to an outbreak.
There is strong evidence of a relationship between ambient temperature and some foodborne illness, such as Salmonella infection. Salmonella notifications generally peak in summer and the rate of notifications has been shown to be positively correlated with the mean temperature of the previous week or month (D’Souza et al. 2004; Kovats et al. 2004). According to research commissioned as part of the Garnaut Climate Change Review, notification rates for Salmonella may increase as temperatures rise due to climate change (Bambrick et al. 2008). The researchers projected that there would be 580–1000 extra cases of Salmonella infection in Australia annually by 2050.
22 Health and the environment: a compilation of evidence
Table 3.2: Categories of food implicated in foodborne disease outbreaks, Australia, 2007
Vehicle category
No. of
outbreaks
No. of people
affected
Mean size of
outbreak
(no. of persons)
No. of people
hospitalised
Fish 17 75 4 7
Mixed foods 13 550 42 151
Egg-containing dish 11 129 12 15
Dessert 9 124 14 23
Meat & meat products 7 46 7 3
Fresh produce 7 186 27 13
Poultry 5 41 8 1
Water 4 85 21 3
Beverage 3 16 5 2
Seafood 3 42 14 0
Dips 2 77 39 10
Egg-based sauce / dressing 2 31 16 9
Pasta 2 34 17 0
Sushi 2 35 18 5
Cheese 1 10 10 0
Sandwich 1 6 6 0
Unknown 60 803 13 24
Total 149 2,290 15 266
Source: OzFoodNet Working Group 2008.
Chemical contamination
Concerns about food safety are not limited to biological hazards. Food may become contaminated with chemicals such as pesticides, metals (for example, cadmium, lead, mercury and zinc) and dioxins. This contamination may be due to environmental pollution of the air, water and soil or through the intentional use of various chemicals (such as pesticides, animal drugs and other agricultural chemicals) (WHO 2010b). Box 3.4 describes an example of how milk-based products in China became contaminated with melamine.
Exposure to chemical contaminants in Australia is monitored by FSANZ as part of the Australian Total Diet Study, which is run every two years (FSANZ 2008). The food supply in Australia is consistently given a clean bill of health, with findings showing that levels of chemical contaminants are well below international standards.
Water quality in Australia
Water of adequate quality and quantity is a fundamental requirement for personal and public health. Assessing water quality requires the measurement of physical, chemical and biological characteristics, although the exact standards may depend upon the purpose of the water supply (such as drinking, bathing, washing, recreational purposes and agricultural production). Indicators used to assess water quality include pH, salinity, colour, clarity and the presence of contaminants such as metals, dissolved gases and trace elements. Careful
Health and the environment: a compilation of evidence 23
monitoring is also required for microbial contaminants. These may include viruses (such as hepatitis and rotaviruses), bacteria (such as Campylobacter and Enterococci) and protozoa (such as Cryptosporidium and Giardia) (AIHW 2010b).
In Australia, most water sources require some form of treatment to ensure that the water is safe to drink. Water supplied though utilities in Australia is required to meet guidelines for microbial and chemical contamination. While states and territories are largely responsible for managing water supplies, national (and some international) organisations provide recommendations and guidelines. For example, the National Health and Medical Research Council (NHMRC) (2004) has developed the Australian Drinking Water Guidelines to provide the Australian community and water supply industry with guidance on what constitutes good quality drinking water. See Section 4.10 for information on the addition of fluoride to drinking water.
Examples of health effects from water contamination include skin and eye irritation, mild gastroenteritis, severe diarrhoea and potentially life-threatening dysentery, hepatitis and cholera. However, water quality in Australia is generally of a very high standard and contamination is rare, especially among major population centres (AIHW 2010b). In 2007–08, 82% of all water utilities reported full compliance with microbiological and chemical contamination standards (National Water Commission 2009). Nonetheless, waterborne disease pose a substantial threat to human health worldwide. The WHO (2010d) estimates that the most predominant waterborne disease, diarrhoea, has an estimated annual incidence of 4.6 billion episodes and causes 2.2 million deaths every year.
Box 3.4: Melamine contamination—2008 milk scandal (China)
Melamine is a nitrogen-based compound commonly used in the manufacturing of plastics, adhesives, countertops and whiteboards. While there is insufficient human data, toxicology studies in animals suggest that melamine causes kidney stones and renal blockages, and may be carcinogenic in some circumstances (WHO 2010c). Melamine is not approved for use in food production by any national authorities.
In 2008, media reports emerged that more than 50,000 infants and young children in China had been hospitalised for renal tube blockages and kidney stones following consumption of infant formula contaminated with melamine (WHO 2008b). Around 300,000 infants and children were affected and 6 deaths were reported in China. It is alleged that melamine was added to these products in order to give the illusion of higher protein content.
Liu et al. (2010) conducted ultrasound-based screening of 7,933 children who lived in rural areas where the dairy products most highly contaminated with melamine were sold . Children with evidence of kidney damage were monitored at one, three and six month intervals. Among children who underwent initial screening, 48 (0.61%) showed evidence of nephrolithiasis (kidney stone formation) or hydronephrosis (dilation of the kidney with urine). While the majority of affected children recovered without specific treatment, renal abnormalities remained in 12%.
Around one dozen Chinese food products containing dairy were withdrawn from sale in Australia. Beginning in October 2008, FSANZ and other state and territory authorities began a nationally coordinated surveillance program of food products at risk of contamination.

24 Health and the environment: a compilation of evidence
3.6 Vector populations
What is a vector and how are vector populations controlled?
A vector is an agent that transmits a disease, parasite or infection from one host to another. The largest group of vectors are insects and other arthropods, most commonly mosquitoes, ticks, flies, lice and fleas. The abundance and distribution of vector populations (and hence the spread of vectorborne diseases) is closely intertwined with environmental conditions that encourage their survival.
Strategies to control vector populations (particularly mosquitoes) are vital for the global prevention of vectorborne diseases. Strategies for control include reducing or eliminating vector breeding grounds, biological controls that target and kill vector larvae and chemical methods such as insecticide sprays. Personal protection methods may include the use of insect repellent, house screens or bed nets, appropriate clothing and preventive drugs.
How can vector populations affect health?
While the overall burden of vectorborne disease is higher among developing countries than in the developed world, a significant health risk for the Australian population still exists, particularly in light of increasing travel to regions where vectorborne diseases are endemic. This section focuses on the most common mosquito-borne diseases in Australia including Ross River virus, Barmah Forest virus and overseas-acquired malaria.
Ross River virus infection
Ross River virus infection is the most common and widespread vectorborne disease reported in Australia, with an average of around 3,600 cases per year over the period 2002 to 2007 (Table 3.4). First identified in 1963, the virus is transmitted by a number of different mosquitoes although there is no evidence of transmission from person to person in the absence of a vector (DoHA 2004). Ross River virus infection can cause joint inflammation and pain, fatigue, muscle aches and rash. While some infected people will have long-lasting intermittent symptoms (lasting one year or more), Ross River virus is rarely fatal.
Infection can occur in most regions of Australia although it is more common around inland water bodies and coastal regions. Epidemics of Ross River virus infection relate to environmental conditions that encourage mosquito breeding and usually occur following heavy rains or after high tides which inundate salt marshes and coastal wetlands (DoHA 2004).
There were 4,203 notifications of Ross River virus infection in 2007 (62% of total vectorborne disease notifications) (Table 3.3). The majority of these notifications were from Queensland (51%)—an area with high rainfall and tropical conditions that support year-round transmission. Between 2002 and 2007, notifications ranged annually from 1,459 (2002) to 5,547 (2006) (Table 3.4).
Barmah Forest virus
Barmah Forest virus was first discovered in 1974 (Victorian Government Health Information 2010). Similar to Ross River virus, it is relatively widespread in Australia and shares common potentially long-lasting symptoms such as fever, rash and joint pain. Barmah Forest virus is
Health and the environment: a compilation of evidence 25
also spread by mosquitoes and has been detected in most parts of mainland Australia. Accordingly, outbreaks of Barmah Forest virus often occur concurrently with Ross River virus, making diagnosis difficult.
There were 1,716 notifications of Barmah Forest virus infection during 2007 (25% of all mosquito-borne disease notifications) (Table 3.3). Around half (48%) of notifications were from Queensland, followed by New South Wales (33%). Between 2002 and 2007, notifications ranged annually from 910 (2002) to 2,142 (2006) (Table 3.4).
Malaria
Malaria is a parasitic disease transmitted between humans by an infected female Anopheles mosquito. After entering the human body, the parasites multiply in the liver and then infect red blood cells. Symptoms of infection include fever, headache and vomiting, and usually appear between 10 and 15 days after the mosquito bite (WHO 2009a). If left untreated, malaria can become life-threatening as it disrupts blood supply to vital organs.
There were 567 notifications of overseas-acquired malaria in Australia during 2007 (compared with 772 in 2006) and no reports of locally-acquired cases (Table 3.3). The largest number of malaria notifications was for people aged 20–24 years.
Dengue
Dengue is a viral disease transmitted to human through a bite of an infected mosquito, usually Aedes aegypti. In Australia, dengue usually only occurs in north Queensland although it is not endemic (that is, it does not occur naturally). Outbreaks can occur when the virus is transmitted to the local mosquito population by infected international travellers or residents returning home from overseas (Queensland Health 2010). Symptoms can include high fever, headache, joint pain, vomiting and rash—most resolving in one to two weeks.
There were 314 notifications in Australia during 2007 (compared with 188 in 2006 and 861 in 2003) with the majority occurring in Queensland (tables 3.3 & 3.4).
Climate change and vectorborne diseases
Climate change is predicted to affect the abundance and geographic range of vector populations and hence the incidence of vectorborne diseases worldwide. It is thought that global warming, increased rainfall (leading to more stagnant pools of water) and tidal changes increase the spread of vector populations such as mosquitoes (van Lieshout et al. 2004; Environment Sustainability and Health ACT 2010). The Garnaut Climate Change Review suggests that with global warming, mosquitoes will move into previously inhospitable regions and higher altitudes, and disease transmission seasons may last longer (Garnaut 2008).
Even though diseases such as malaria and dengue fever are not endemic in Australia, their spread in developing regions combined with increased worldwide travel, migration and trade means that the burden of these diseases could still increase in Australia (Environment Sustainability and Health ACT 2010).
Vectorborne diseases in Australia
National notifications for vectorborne diseases in Australia are shown below by state and territory for 2007 (Table 3.3) and nationally for the period 2002 to 2007 (Table 3.4).
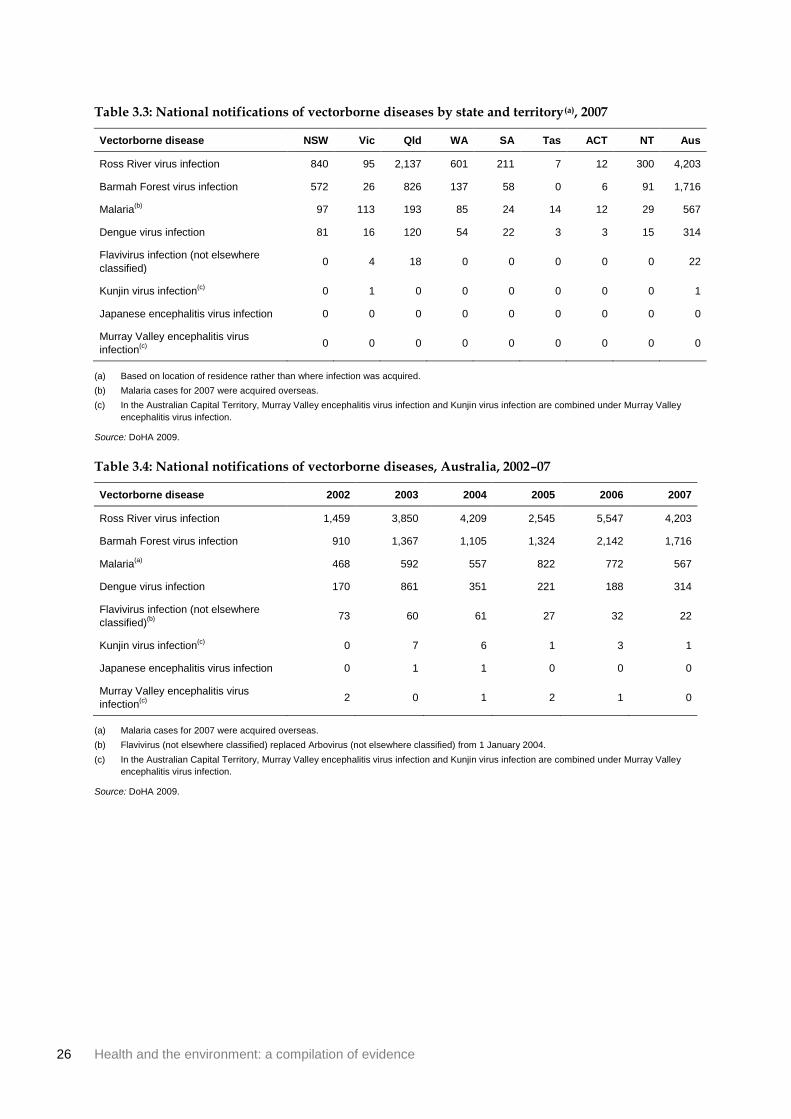
26 Health and the environment: a compilation of evidence
Table 3.3: National notifications of vectorborne diseases by state and territory(a), 2007
Vectorborne disease NSW Vic Qld WA SA Tas ACT NT Aus
Ross River virus infection 840 95 2,137 601 211 7 12 300 4,203
Barmah Forest virus infection 572 26 826 137 58 0 6 91 1,716
Malaria(b)
97 113 193 85 24 14 12 29 567
Dengue virus infection 81 16 120 54 22 3 3 15 314
Flavivirus infection (not elsewhere
classified) 0 4 18 0 0 0 0 0 22
Kunjin virus infection(c)
0 1 0 0 0 0 0 0 1
Japanese encephalitis virus infection 0 0 0 0 0 0 0 0 0
Murray Valley encephalitis virus
infection(c) 0 0 0 0 0 0 0 0 0
(a) Based on location of residence rather than where infection was acquired.
(b) Malaria cases for 2007 were acquired overseas.
(c) In the Australian Capital Territory, Murray Valley encephalitis virus infection and Kunjin virus infection are combined under Murray Valley
encephalitis virus infection.
Source: DoHA 2009.
Table 3.4: National notifications of vectorborne diseases, Australia, 2002–07
Vectorborne disease 2002 2003 2004 2005 2006 2007
Ross River virus infection 1,459 3,850 4,209 2,545 5,547 4,203
Barmah Forest virus infection 910 1,367 1,105 1,324 2,142 1,716
Malaria(a)
468 592 557 822 772 567
Dengue virus infection 170 861 351 221 188 314
Flavivirus infection (not elsewhere
classified)(b) 73 60 61 27 32 22
Kunjin virus infection(c)
0 7 6 1 3 1
Japanese encephalitis virus infection 0 1 1 0 0 0
Murray Valley encephalitis virus
infection(c) 2 0 1 2 1 0
(a) Malaria cases for 2007 were acquired overseas.
(b) Flavivirus (not elsewhere classified) replaced Arbovirus (not elsewhere classified) from 1 January 2004.
(c) In the Australian Capital Territory, Murray Valley encephalitis virus infection and Kunjin virus infection are combined under Murray Valley
encephalitis virus infection.
Source: DoHA 2009.
Health and the environment: a compilation of evidence 27
3.7 Outdoor air quality
What is air pollution?
Air pollution occurs when the air contains gases, dust or fumes in amounts that are considered harmful to the health or comfort of humans and animals, or which could cause damage to plants and materials. It can consist of many individual components, including elements which are not easily detectable by sight or smell (Fisher et al. 2007). These include:
• carbon monoxide (CO)—a colourless, odourless gas formed when carbon in fuel is not burned completely
• nitrogen dioxide (NO2)—a highly reactive gas which forms quickly from emissions from cars, trucks and power plants
• sulphur dioxide (SO2)—a highly reactive gas sourced largely from fossil fuel combustion in power plants and other industrial processes.
• ozone (O3)—a gas composed of three oxygen atoms which may form naturally or from the combustion of nitrogen oxides and volatile organic compounds
• particulate matter (PM)—particles suspended in the air with a diameter in a specified range, typically either 0–10 microns (PM10 from sources such as construction debris and road dust) or 0–2.5 microns (PM2.5 from sources such as fossil fuel combustion)
• airborne biological pollutants—pollutants that are, or are produced by, living organisms, including bacteria, moulds, mildew, viruses, house dust and pollen.
This section examines ambient or outdoor air quality. For further information on air pollution occurring indoors, see Section 4.2 Indoor air quality. Further information on specific contaminants related to housing (for example, lead and asbestos) can be found in Section 4.8 Housing condition.
How can outdoor air pollution affect health?
While there are various channels through which air pollution can affect human health, often the exact mechanisms are unknown (Bernstein 2004). Most studies investigating the health effects of outdoor air pollution at a population level compare administrative statistics (such as registered deaths or hospital admissions) with air pollution data for a bounded area, and apply models to determine if there is a statistically significant relationship (Bernstein 2004).
The most common adverse health outcomes in relation to air pollution are disorders of the respiratory and cardiovascular systems (both chronic and acute). The pollutant with the most substantial effects for humans is particulate matter. For example, Fisher et al. (2007) estimates that long-term elevated PM10 exposure is responsible for up to 85% of health costs related to air pollution in New Zealand, while the WHO (Lucas et al. 2006) claims that PM2.5 has a significant impact on mortality in Europe. It is more difficult to separately quantify the effects of the other air pollutants (for example, CO, NO2, SO2 and ozone).
Levels of air pollution may fluctuate from day to day, or remain at similar levels over a longer period of time. Health effects may therefore differ depending on whether people are subject to long- or short-term exposure to air pollutants. For example, short-term exposure to the industrial solvent benzene may cause headaches, while long-term exposure may cause leukaemia (Centers for Disease Control and Prevention 2006).

28 Health and the environment: a compilation of evidence
Mortality
Because of the availability and reliability of mortality data, many studies have examined the association between air pollution and mortality. The majority of studies conclude that long-term exposure to elevated levels of particulate matter can lead to increased mortality. SO2 has been shown to have a slightly weaker association with mortality, while the evidence for the mortality effects of NO2, CO and ozone are less significant (due mainly to methodological difficulties) (Committee on the Medical Effects of Air Pollutants 2009).
Examples of findings related to particulate matter exposure and mortality include:
• An increase of 10 micrograms/m3 long-term exposure to PM2.5 may result in an all-cause mortality increase of 6% in the United Kingdom, and as high as 17% in Los Angeles (Committee on the Medical Effects of Air Pollutants 2009).
• An increase of 10 micrograms/m3 short-term exposure to PM2.5 may result in an all-cause mortality increase of 0.6% across 33 European cities (Anderson et al. 2004).
• An increase of 10 micrograms/m3 long-term exposure to PM2.5 may result in a cardiopulmonary mortality increase of 9% and cancer mortality increase of 8% in the United Kingdom (Committee on the Medical Effects of Air Pollutants 2009).
• The WHO (Prüss-Üstün & Corvalán 2006) indicated that an average 8.6 months of life expectancy was lost in the European Union due to particulate matter.
These associations suggest that reducing air pollution may lead to gains in life expectancy. Indeed, case studies such as that discussed in Box 3.5 illustrate how policy interventions may affect air pollution-related mortality.
Box 3.5: Coal bans and air pollution in Dublin (Ireland)
The ban of coal sales in Dublin provides an illustration of how health can benefit from reduced air pollution levels (Clancy et al. 2002). Particulate air pollution was especially bad in Dublin during the 1980s, due in part to the use of bituminous coal for domestic heating. On 1 September 1990, legislation was introduced banning the sale of coal in Dublin, leading to an immediate fall in particulate matter air pollution.
Average particulate matter concentrations fell by around two-thirds after the ban, while the concentration of sulphur dioxide fell by one-third. After adjusting for confounding factors (such as temperature and respiratory epidemics), Clancy et al. (2002) estimated that after the ban total non-trauma mortality fell by 6%, cardiovascular deaths fell by 10% and respiratory deaths fell by 16%. It would appear that the improvement in air quality led to immediate and substantial health benefits among the city’s inhabitants.
Health and the environment: a compilation of evidence 29
Morbidity
Mortality data will only capture extreme health effects due to air pollution, but there is evidence that air pollution may cause a wide range of non-fatal health problems. As previously discussed, air pollution is most strongly associated with adverse respiratory effects. Air pollution can exacerbate asthma and allergies, although not necessarily cause them (Kulkarni & Gridd 2008). For example, the AIHW (2010a) has estimated (using Melbourne data) that 3.1% of asthma hospitalisations are related to NO2 exposure, and 3.9% of child asthma hospitalisations are related to particulate matter exposure. In a separate study, it has been found that ground-level ozone acts as a pulmonary irritant, while elevated atmospheric ozone is also associated with chronic obstructive pulmonary disease (COPD) and asthma (Ebi & McGregor 2008).
SO2 and NO2 are associated with an increase in cardiopulmonary hospital admissions (Bernstein 2004), while CO and ozone may exacerbate heart conditions (Fisher et al. 2007) such as congestive heart failure (Goldberg et al. 2008). There is some (more limited) evidence that air pollution may contribute to non-cardiorespiratory diseases such as auto-immune disorders (Ritz 2009) and less severe short-term disorders such as headache, conjunctivitis and skin rash (Larrieu et al. 2009).
Certain population groups such as children are more susceptible than others to adverse health outcomes caused by air pollution. For example, associations have been found between air pollution and pneumonia, acute bronchitis and asthma hospitalisations among children in Australian cities (Barnett et al. 2005b). Particulate matter inhalation may also have a negative effect on children’s lung function and growth, while exposure to NO2 is associated with low birth-weight (Kulkarni & Gridd 2008), although the strength of this association is still a matter of debate (see Hansen et al. 2007). Exposure to lead (via the air or hand–mouth transmission) also has toxic effects, particularly for children. See Section 4.8 Housing condition for further information.
Some biological pollutants may trigger allergic reactions, asthma and other mild or serious health issues (for example, mould, dust mites, pest droppings and pollen). Symptoms of health problems caused by biological pollutants may include sneezing, watery eyes, coughing, shortness of breath, dizziness, lethargy and digestive problems. For more information on biological pollutants see Section 4.2 Indoor air quality and Section 4.8 Housing condition.
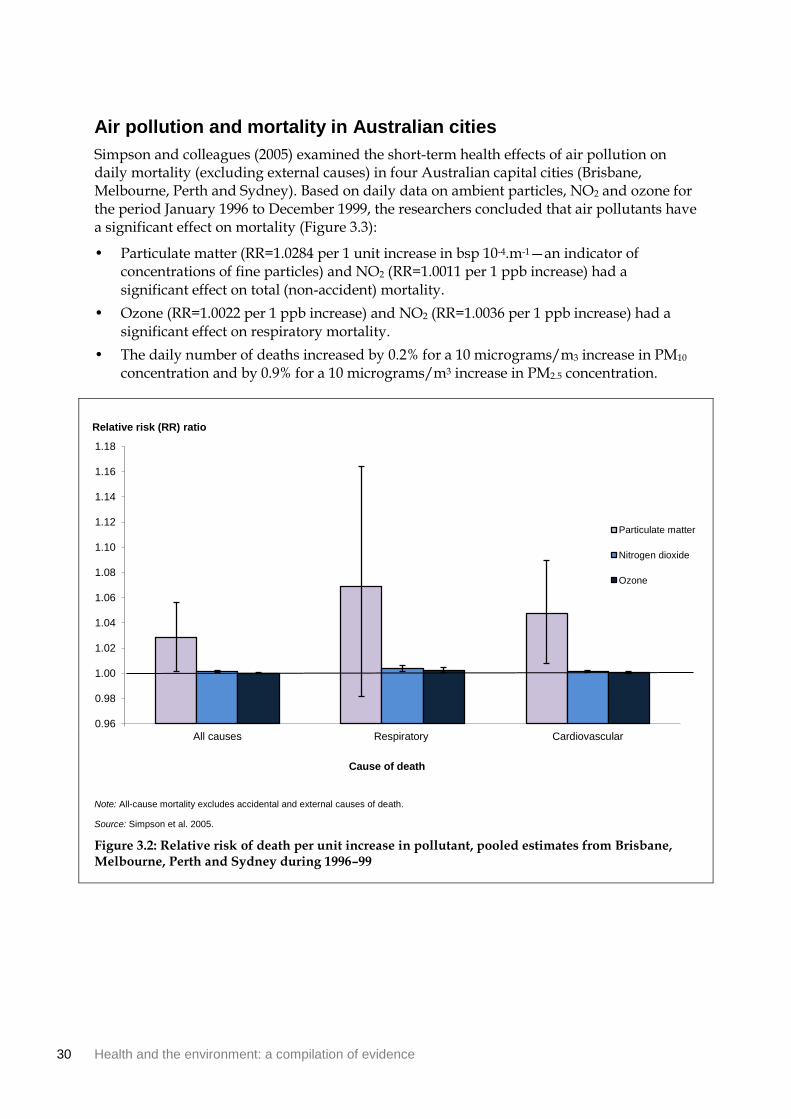
30 Health and the environment: a compilation of evidence
Air pollution and mortality in Australian cities
Simpson and colleagues (2005) examined the short-term health effects of air pollution on daily mortality (excluding external causes) in four Australian capital cities (Brisbane, Melbourne, Perth and Sydney). Based on daily data on ambient particles, NO2 and ozone for the period January 1996 to December 1999, the researchers concluded that air pollutants have a significant effect on mortality (Figure 3.3):
• Particulate matter (RR=1.0284 per 1 unit increase in bsp 10-4.m-1—an indicator of concentrations of fine particles) and NO2 (RR=1.0011 per 1 ppb increase) had a significant effect on total (non-accident) mortality.
• Ozone (RR=1.0022 per 1 ppb increase) and NO2 (RR=1.0036 per 1 ppb increase) had a significant effect on respiratory mortality.
• The daily number of deaths increased by 0.2% for a 10 micrograms/m3 increase in PM10 concentration and by 0.9% for a 10 micrograms/m3 increase in PM2.5 concentration.
Note: All-cause mortality excludes accidental and external causes of death.
Source: Simpson et al. 2005.
Figure 3.2: Relative risk of death per unit increase in pollutant, pooled estimates from Brisbane, Melbourne, Perth and Sydney during 1996–99
0.96
0.98
1.00
1.02
1.04
1.06
1.08
1.10
1.12
1.14
1.16
1.18
All causes Respiratory Cardiovascular
Cause of death
Relative risk (RR) ratio
Particulate matter
Nitrogen dioxide
Ozone

Health and the environment: a compilation of evidence 31
4 The built environment
4.1 Introduction The built environment refers to aspects of our surroundings which are created or modified by people, rather than occurring naturally. It includes our homes, schools and workplaces, recreation areas, transport, energy infrastructure and waste disposal systems. While the built environment is often closely associated with large cities and urbanisation, its effects extend to rural locations and all other areas of human settlement.
In recent years, there has been a growing awareness that the design and structure of the built environment is an important determinant of lifestyle and health (see Box 4.1). It is also recognised that aspects of the built environment (such as housing) can magnify health disparities and compound existing health conditions, especially among children, the elderly and other vulnerable groups (Marmot et al. 2010).
Researchers in this field have examined direct associations with illness and mortality (such as motor vehicle accidents) and indirect associations through health and lifestyle behaviours (such as walking for transport). The impact of the built environment also reaches beyond health in physical terms. Some research has found that aspects of the built environment, such as a lack of green space, household overcrowding and environmental noise, may affect mental health and child development. More broadly, public recreation areas may shape the quality of social relationships and sense of community in an area.
Box 4.1: Recent initiatives regarding the built environment and health
The Year of the Built Environment (2004) was a joint initiative between Australian government, industry, environment and community groups. Activities focused on understanding how the built environment influences quality of life and designing approaches to create sustainable, healthy cities (ABC 2004).
The National Heart Foundation document Healthy by Design is a guide for professionals such as planners, developers and urban designers. The guide presents evidence, tools and case studies to facilitate the design of environments which support healthy living (National Heat Foundation Victorian Division 2004).
The Healthy Spaces and Places (2009a) website was launched as a collaboration between the Australian Local Government Association, National Heart Foundation, Planning Institute of Australia and the Australian Government Department of Health and Ageing. The website provides an evidence-based national guide for planning, designing and creating health-supportive environments.
The World Health Organization chose the theme ‘urbanisation and health’ for World Health Day on 7 April 2010 in recognition of the profound health impacts of urbanisation. As part of this initiative, the ‘1000 cities, 1000 lives’ campaign called upon cities to open up public spaces for health activities for one day (WHO 2010e).
32 Health and the environment: a compilation of evidence
4.2 Indoor air quality
What is indoor air and how is its quality determined?
The NHMRC defines indoor air as any non-industrial indoor space where a person spends a period of an hour or more in any day (Environment Australia 2001). It includes the air inside homes, offices, classrooms, cars and public transport and commercial premises such as shopping centres and restaurants.
Indoor air quality can be affected by four main mechanisms (Gilbert & Black 2000):
• outdoor air entering and being distributed throughout the building
• emissions generated inside the building by processes and equipment (for example, photocopiers and cleaning substances)
• emissions from occupants (for example, environmental tobacco smoke)
• emissions from construction and finishing material (for example, asbestos fibres).
Whether or not a pollution source causes an indoor air quality problem will depend on the nature of the contaminant, its rate of emission and ventilation in the area. As many indoor areas have poor ventilation, pollutants may build up to levels 2–5 times (and occasionally up to 100 times) higher than outdoors (Watson 2004). Given that Australians spend 90% or more of their time inside (ABS 2004), the costs of poor indoor air quality are likely to be high. In 1998, the CSIRO estimated that the economic cost of poor indoor air quality amounted to $12 billion a year, mostly due to ill health and lost production (CSIRO 1998).
This section examines the relationship between indoor air quality and health, focusing on non-occupational settings in developed countries. There are thousands of chemical and biological contaminants which may affect indoor air quality and possibly human health. This section outlines a number of contaminants which have received substantial academic attention. For information on outdoor air pollution see Section 3.7 Outdoor air quality and for specific information on asbestos see Section 4.8 Housing condition.
Why is indoor air quality important for health?
While much attention has been focused on outdoor air quality, there is a growing interest in the quality of air inside the workplace and at home. The long-term health impacts of exposure to specific chemicals or combinations of chemicals present in indoor air are often not well understood (Environment Australia 2001). A major limitation in understanding the adverse health effects of indoor air pollutants is that exposure is often subtle, especially in non-occupational settings, and symptoms may be complex and often poorly defined (Bernstein et al. 2008). For example, the term ‘sick building syndrome’ (SBS) has been coined to refer to an unexplained constellation of symptoms attributed to exposure to a combination of indoor pollutants (see Box 4.2).

Health and the environment: a compilation of evidence 33
Box 4.2: What is sick building syndrome?
Coined by the World Health Organization in 1983, the term ‘sick building syndrome’ (SBS) is used to describe situations in which building occupants experience acute health effects that appear to be linked to time spent in that building, but where no specific illness or cause can be identified (US Environmental Protection Agency 2008). The term should not be confused with ‘building-related illness’ which is used when symptoms can be attributed directly to airborne contaminants such as for asbestosis or legionnaires’ disease.
The origins of SBS can be traced back to energy crises in the early 1970s. In response to the escalating costs of heating and cooling outside air (as opposed to recirculated air), buildings were increasingly sealed from the outside atmosphere and the amount of outside air taken in by air-conditioning systems was reduced (Parliament of New South Wales 2001).
SBS is usually associated with air-conditioned office buildings; however, the exact causes are unknown. Poor ventilation and chemical and biological contaminants (for example, volatile organic compounds (VOCs), combustion products, bacteria or viruses) may act in combination or supplement other complaints such as inadequate temperature, humidity or lighting. Symptoms include headaches; eye, nose, or throat irritation; dry cough; dry and itchy skin; dizziness and nausea; difficulty concentrating and fatigue (SafeWork SA 2000). Symptoms usually diminish when occupants leave the building.
Actions to alleviate SBS include removing or modifying pollution sources (for example, cleaning air-conditioning units), increasing ventilation rates and air distribution and more effective education and communication with occupants regarding symptoms.
Environmental tobacco smoke
Environmental tobacco smoke (ETS), sometimes called second-hand smoke, is the term used to describe a complex airborne mixture of gaseous and particulate chemicals that results from tobacco smoking. This mixture contains around 3,800 chemicals including carbon monoxide (CO), nicotine, formaldehyde and ammonia. A 2004 study by the International Agency for Research on Cancer (IARC) concluded that non-smokers are exposed to the same carcinogens as active smokers and have stated, along with regulatory authorities, that ETS should be classified as a Class A carcinogen (IARC 2004, 2006b).
The acute and chronic health effects of ETS for smokers and non-smokers are well recognised in many countries. In several large reviews (for example, National Cancer Institute 1999; US Environmental Protection Agency 1992; California Environmental Protection Agency 2005), ETS has been causally associated with:
• developmental effects—poor fetal growth, low birth weight, sudden infant death syndrome and pre-term delivery
• respiratory effects—acute lower respiratory tract infections in children (for example, bronchitis and pneumonia), asthma induction and exacerbation in children and adults, chronic respiratory symptoms in children, reduced lung function in children, eye and nasal irritation in adults and middle ear infections in children
• carcinogenic effects—lung cancer, nasal sinus cancer and breast cancer (in younger, primarily premenopausal women)
• cardiovascular effects—heart disease mortality, acute and chronic coronary heart disease morbidity and altered vascular properties.

34 Health and the environment: a compilation of evidence
Many studies of ETS have focused on infants and young children—populations at risk due to their higher metabolic and respiratory rates and lower resilience to inhaled chemicals (Gilbert & Black 2000). Since the 1980s, numerous large studies have identified a significant relationship between parental smoking and development of asthma in children. Meta-analyses based on these studies have demonstrated dose-response relationships—for example, it has been found that children’s rate of asthma increases with the number of household smokers (Gilmour et al. 2006). In one meta-analysis of seven studies in infancy and childhood, an odds ratio (OR) of 1.98 for increased risk of wheeze was found for children with ETS exposure. Other studies have found that ETS exposure increases the risk of developing asthma by 40–200% (Bernstein et al. 2008).
Nitrous dioxide
Nitrous dioxide (NO2) is a highly reactive gas produced during combustion (for example, in gas stoves, ovens, heaters and when smoking). It is one of the most widely studied indoor pollutants. The most consistent findings emerging from the literature relate to NO2 exposure among children, particularly those with asthma.
Children with asthma and infants at risk of developing asthma are more sensitive to the respiratory effects of NO2 exposure (van Strein et al. 2004; Belanger et al. 2006). Between 1997 and 1999, the Yale Childhood Asthma Study enrolled 1,002 families who had a newborn infant and an older child with physician-diagnosed asthma. Infants living in homes with NO2 concentrations exceeding 17.4 parts per billion (the highest quartile) had increased frequency of wheeze (OR=2.2) and persistent cough (OR=1.8) and twice the frequency of shortness of breath (OR=3.1) compared with those in the lowest quartile of exposure (less than 5.1 pbb) (van Strein et al. 2004). Among older children living in multi-family housing in this study, exposure to gas stoves was found to increase the likelihood of wheeze (OR=2.3), shortness of breath (OR=2.3) and chest tightness (OR=4.3). Each 20 ppb increase in NO2 increased both the likelihood of days of wheeze (RR=1.3) and chest tightness (RR=1.5) (Belanger et al. 2006).
These overseas findings confirm Australian research showing a significant correlation between NO2 exposure and adverse health outcomes. Garrett et al. (1998) measured NO2 levels in 80 homes in the Latrobe Valley, Victoria and recruited 148 children aged 7–14 years. The researchers found that respiratory symptoms were more common in children exposed to gas stoves (OR=2.3).
In another Australian study (Pilotto et al. 2004), 18 schools with unflued gas heaters were randomly assigned to either retain their heaters (10 control schools) or have replacement flued gas or electric heaters installed (8 intervention schools). A total of 199 children with asthma were monitored for 12 weeks after the replacement. Difficulty breathing during the day (RR=0.41), chest tightness during the day (RR=0.45) and daytime asthma attacks (RR=0.39) were significantly reduced in the intervention group.
Volatile organic compounds
Volatile organic compounds (VOCs) is the collective term for vapour-phase carbon-based chemicals (Watson 2004). Hundreds of VOCs have been identified from sources which include paints, solvents, pesticides, building construction materials and office equipment. VOCs are known irritants of the respiratory system and can trigger inflammation and episodes of bronchial obstruction in susceptible individuals (Fuentes-Leonarte et al. 2009).
Health and the environment: a compilation of evidence 35
Other adverse health responses attributed to VOCs include fatigue and difficulty concentrating, neurotoxic effects and cancer (Bernstein et al. 2008).
The Leipzig Allergy High-Risk Children Study found a correlation between increased episodes of obstructive bronchitis in children who lived in an apartment that had been redecorated during their first year of life (Diez et al. 2000). In children exposed during their second year, in addition to obstructive bronchitis, there was also a significant correlation with wheezing. An increased risk of pulmonary infections was observed in infants aged six weeks in circumstances where restoration painting (OR=5.6) had occurred during pregnancy and where there had been higher concentrations of styrene (used in flooring) (OR=2.1).
Rumchev et al. (2004) conducted a population based case-control study among 88 children aged between six months and three years in Perth, Western Australia. Children discharged with asthma as the primary diagnosis were recruited at Princess Margaret Hospital in 1997–99 and 104 children from the same age group without an asthma diagnosis were recruited as controls through the Western Australian Health Department. Children with asthma had significantly higher exposure to VOCs than exposure among the control group. Many VOCs appeared to be significant risk factors for asthma. The highest odds ratios were for benzene followed by ethylbenzene and toluene. For every 10 unit increase in the concentration of toluene and benzene, the risk of having asthma increased by almost two and three times respectively.
Formaldehyde
Found in almost all areas of the home, formaldehyde is one of the most researched VOCs. Sources include environmental tobacco smoke, foam insulation, resin in particle board, plywood, carpets and upholstery fabrics. Formaldehyde behaves as a common odorant at low concentrations (0.06–1.2mg/m-3) and as an eye, skin or airway irritant at higher concentrations (>0.5mg/m-3) (Fuentes-Leonarte et al. 2009). Higher levels can even cause throat spasms and a build-up of fluid in the lungs, leading to death. Some people are very sensitive to formaldehyde, whereas others have no reaction to the same level of exposure.
Although the short-term health effects of formaldehyde exposure are well known, less is known about its potential long-term health effects. Studies of workers with high exposure have shown an association between exposure to formaldehyde and several cancers, including nasopharyngeal cancer and leukaemia (National Cancer Institute 2009). The weight of evidence has led the International Agency for Research on Cancer (2006b) to classify formaldehyde as a known human carcinogen.
Environmental tobacco smoke in Australian homes
In 2007, 8% of Australian households with dependent children aged 0–14 years had someone who smoked at least one cigarette, cigar or pipe of tobacco inside the home per day. The proportion of children exposed to tobacco smoke has decreased markedly over the last decade. In 1995, almost one-third (31%) of children lived in households where someone smoked indoors (Figure 4.1).

36 Health and the environment: a compilation of evidence
Notes
1. Household smoking status as reported by respondents aged 14 years or older. This may include a small number of 14 year olds who
smoked inside the home.
2. Smoking status is defined as smoking at least one cigarette, cigar or pipe of tobacco per day in the last 12 months.
Source: National Drug Strategy Household Survey (AIHW 2009a).
Figure 4.1: Smoking status of households with children aged 0–14 years, 1995, 1998, 2001, 2004, 2007
Rates of exposure to environmental tobacco smoke vary across population groups. In 2007, Indigenous children were around 3 times more likely to be exposed to tobacco smoke in the home than non-Indigenous children, and households with children in the lowest socioeconomic areas were 3.6 times as likely to be exposed than the highest socioeconomic areas (AIHW 2009a).
0
10
20
30
40
50
60
70
80
90
100
1995 1998 2001 2004 2007
Year
Per cent
Smokes inside the home
Only smokes outside the home
No one at home smokesregularly
Health and the environment: a compilation of evidence 37
4.3 Walkability
What is walkability?
Walkability is a relatively new concept that captures how conducive an area is to walking for either leisure, exercise or transport (Leslie et al. 2007). Some of the key characteristics related to walkability include:
• street connectivity—the directness or ease of travel between households, shops and places of employment, based on the design and characteristics of the street network (Saelens et al. 2003). Direct travel is facilitated when there is a lack of barriers (for example, walls, freeways or bodies of water), a well-connected street network (for example, a regular grid pattern) and multiple route options.
• land use—the types of activities taking place on the land and the way in which it is used (for example, residential, commercial, industrial or recreational purposes). Land can be primarily single-use with residential and commercial areas located separately, or it can be mixed-use with a range of complementary land uses located together. An area with mixed land use may include a residential development, shops, employment, community and recreation facilities, parks and open spaces (Healthy Spaces and Places 2009b).
• residential density—the number of dwellings per given unit of land area. A higher residential density means that there are more people to support and use a range of activities and institutions within a smaller area, often leading to shorter walking distances to such destinations (Saelens & Handy 2008).
Other characteristics discussed in regard to walkability include the presence and quality of footpaths, attractiveness of surrounds, availability of pedestrian crossings, traffic volume and speed, and feelings of safety and security.
Why is walkability important for health?
Inadequate physical activity is associated with an increased risk of ill-health and death, and has been linked to increased rates of overweight and obesity, cardiovascular disease, diabetes and some cancers (AIHW 2008). The National Physical Activity Guidelines for Australians (2005) emphasise that adults should accumulate 30 minutes of moderate-intensity physical activity on most days of the week (DoHA 2005). In order to increase activity levels, Australians are encouraged to choose, where possible, walking or cycling over motorised transport.
There is increasing recognition that the built environment plays an important role in constraining or facilitating walking for physical activity, transport and recreation. Several recent and comprehensive reviews (for example, Saelens et al. 2003; Frank et al. 2007; Saelens & Handy 2008) report a consistent positive association between walkability and levels of non-motorised travel. Considering relevant studies published in 2002–06, Saelens & Handy (2008) identified density, distance to non-residential destinations and land use mix as the most important correlates of walking for transport. In separate studies, people living in neighbourhoods with ‘walkable’ designs reported about 30 minutes more walking for transport each week (Saelens et al. 2003) and more total physical activity (Frank et al. 2005).
Some recent studies have shown an inverse relationship between neighbourhood walkability and obesity. In a cross-sectional study of 11,000 adults from Atlanta, Georgia (United States),

38 Health and the environment: a compilation of evidence
Frank et al. (2004) found that people living in more walkable neighbourhoods (characterised by mixed land use, connected streets, high residential density and pedestrian-oriented retail) did more walking and cycling for transport, drove less and had lower body mass indexes than people living in less walkable neighbourhoods. For each kilometre walked by respondents, there was a decrease of 4.8% in the risk of obesity and for each hour a day spent in their cars, there was an increased risk of obesity of around 6%. In addition, the researchers found that for each quartile of increasing land use mix, there was a decrease in obesity rates of around 12%.
In an Australian cross-sectional study, Giles-Corti et al. (2003) found that overweight Australian adults working in Perth, Western Australia were more likely to live near highways and in neighbourhoods that lacked adequate footpaths and places for physical activity.
Measuring the walkability of a community
Many studies in this field rely on self-reported information about the pedestrian-friendly nature of the environment (for example, Saelens et al. 2003; Frank et al. 2004). More recently, researchers have emphasised the importance of using objective measures to better understand relationships between the built environment and health behaviours.
A geographic information system (GIS) is a computer-based tool designed to integrate different types of spatial and attribute information (such as topography, existing land uses, geographical features, infrastructure, recreation facilities and dwellings) and to analyse and present data by location. GIS was used in the 2005 Physical Activity in Localities and Community Environment Study (PLACE). The study sought to understand how environmental factors influence habitual physical activity. Four GIS-derived attributes—dwelling density, street connectivity, land use mix and net retail area—were used to create a ‘walkability index’ for each of 32 communities in Adelaide, South Australia (du Toit et al. 2005). The index was further classified into quartiles with the first quartile representing the lowest walkability and the fourth representing the highest walkability.
The technique identified areas in Adelaide which were conducive for walking to daily destinations (that is, walking for transport rather than for recreation). The study showed a strong independent association between the walkability index and weekly frequency of walking, even after controlling for gender, household income and neighbourhood self-selection (that is, choosing to live in a particular neighbourhood based on an underlying preference for physical activity) (Owen et al. 2007). These findings suggest that the built environment characteristics which make up the walkability index may be important candidates for policy initiatives designed to increase physical activity. See Box 4.3 for current initiatives that use the concept of walkability.
Walking in Australian communities
Based on AIHW analysis of the ABS National Health Survey 2007–08, over half (57%) of the Australian population aged 15 years or older walked for transport in the last week, and 43% walked for fitness, recreation or sport. Walking for transport was most common among young adults (15–24 years)—more than two-thirds (68%) walked for transport (Figure 4.2). Walking for fitness, recreation or sport was less common across all age groups but particularly among young adults. Walking for recreation and fitness increased across the age groups until 65–74 years, after which both forms of walking declined.
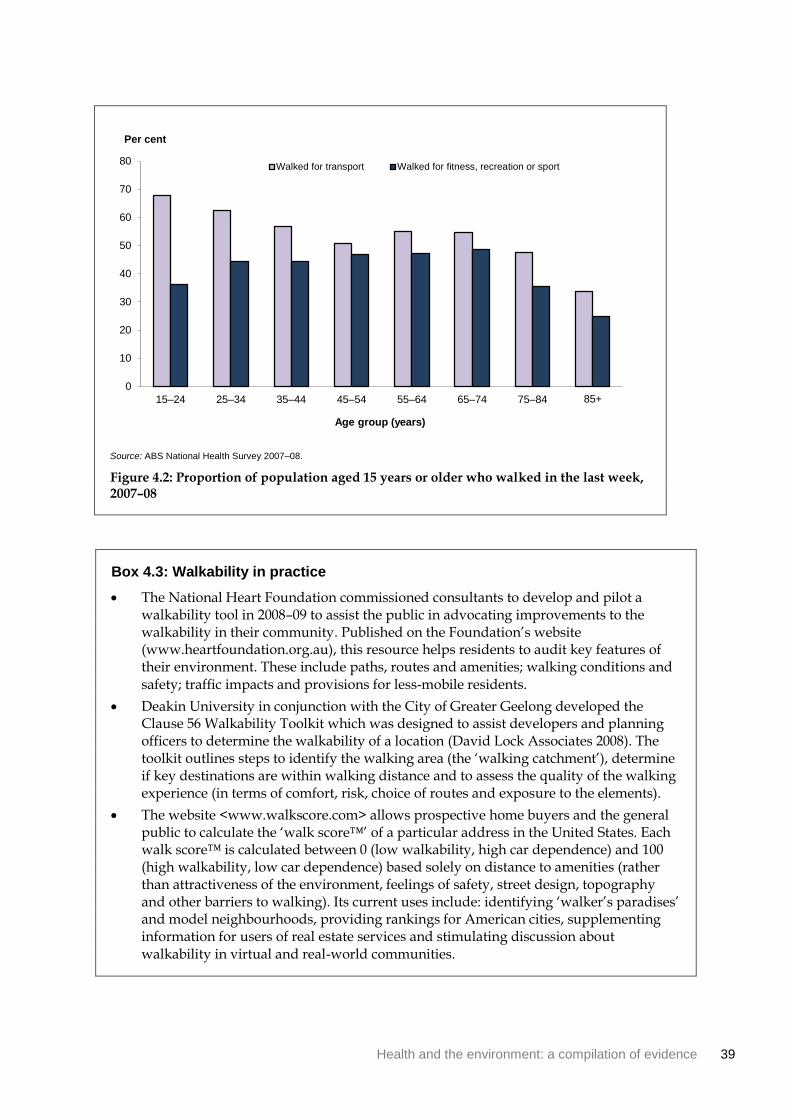
Health and the environment: a compilation of evidence 39
Source: ABS National Health Survey 2007–08.
Figure 4.2: Proportion of population aged 15 years or older who walked in the last week, 2007–08
Box 4.3: Walkability in practice
The National Heart Foundation commissioned consultants to develop and pilot a walkability tool in 2008–09 to assist the public in advocating improvements to the walkability in their community. Published on the Foundation’s website (www.heartfoundation.org.au), this resource helps residents to audit key features of their environment. These include paths, routes and amenities; walking conditions and safety; traffic impacts and provisions for less-mobile residents.
Deakin University in conjunction with the City of Greater Geelong developed the Clause 56 Walkability Toolkit which was designed to assist developers and planning officers to determine the walkability of a location (David Lock Associates 2008). The toolkit outlines steps to identify the walking area (the ‘walking catchment’), determine if key destinations are within walking distance and to assess the quality of the walking experience (in terms of comfort, risk, choice of routes and exposure to the elements).
The website <www.walkscore.com> allows prospective home buyers and the general public to calculate the ‘walk score™’ of a particular address in the United States. Each walk score™ is calculated between 0 (low walkability, high car dependence) and 100 (high walkability, low car dependence) based solely on distance to amenities (rather than attractiveness of the environment, feelings of safety, street design, topography and other barriers to walking). Its current uses include: identifying ‘walker’s paradises’ and model neighbourhoods, providing rankings for American cities, supplementing information for users of real estate services and stimulating discussion about walkability in virtual and real-world communities.
0
10
20
30
40
50
60
70
80
15–24 25–34 35–44 45–54 55–64 65–74 75–84 85+
Age group (years)
Per cent
Walked for transport Walked for fitness, recreation or sport
40 Health and the environment: a compilation of evidence
4.4 Transport
What is transport?
Transport is the physical infrastructure, vehicles and operations that provide for the movement of people and goods from one location to another. Infrastructure includes roads, waterways, railways, footpaths and cycle paths, along with terminals such as bus stops, airports, railway stations and wharves. Modes of everyday travel include public transport (such as bus, ferry, train and tram), private motor vehicles (such as cars, trucks and motorbikes) and non-motorised methods (walking and cycling). This section focuses on motorised forms of transport—for information on walking for transport, see Section 4.3 Walkability.
How does transport affect health?
While transport enables access to employment, health services and spaces for recreation and physical activity, potential health-damaging impacts include traffic accident injuries and deaths, noise and air pollution and lost opportunities for physical activity. For more information on air and noise pollution, see Section 3.7 Outdoor air quality and Section 4.6 Environmental noise.
Road traffic accident mortality and injuries
Road traffic accidents are crashes involving a motor vehicle, pedal cycle or other road vehicle on a public road (AIHW: Henley & Harrison 2009). Within this category, motor vehicle accidents are defined as accidents originating on, terminating on or involving a motor vehicle partially or fully on a road (AIHW: Magnus & Sadkowsky 2006).
Deaths resulting from traffic accidents are considered to be a major global public health problem, particularly as the majority are considered preventable (WHO 2004). Worldwide, an estimated 1.3 million people are killed in road traffic accidents each year and between 20 and 50 million are injured (WHO 2009b). Young men are proportionally overrepresented in traffic-related accidents, injuries and deaths. Besides adverse physical and psychological consequences, other direct and indirect financial costs of road traffic accidents are substantial. A study from the University of Queensland estimated that in 2003, road traffic accidents on Australian roads cost $17 billion including costs associated with medical treatment, workplace absence and vehicle replacement or repair (Connelly & Supangan 2006).
In 2007, there were 912 male deaths and 319 female deaths from motor vehicle accidents in Australia (AIHW 2010c). Male rates have consistently been around three times higher than female rates throughout the twentieth century (AIHW: Magnus & Sadkowsky 2006). While mortality from motor vehicle accidents fluctuates from year to year, there has been a general trend of decline since the early 1970s (Figure 4.3). Progress in reducing the road toll can be attributed to a number of laws and regulations (such as compulsory seatbelt and helmet usage and lower speed limits), traffic control initiatives (for example, random breath testing), improved vehicle safety, upgrades to road infrastructure and more education and prevention campaigns (AIHW: de Looper & Bhatia 1999; AIHW: Magnus & Sadkowsky 2006).

Health and the environment: a compilation of evidence 41
Note: Age standardised to the 2001 Australian Standard Population.
Source: AIHW National Mortality Database.
Figure 4.3: Trends in death rates from motor vehicle accidents, Australia, 1924–2007
Serious injury is defined as an injury that results in a person being admitted to hospital, and subsequently discharged alive (deaths in hospital are excluded). In the one-year period 2006–07, the age-standardised rate of serious injury due to road vehicle traffic accidents in Australia was 157 per 100,000 persons (AIHW: Henley & Harrison 2009). There were twice as many males as females seriously injured as a result of a road traffic crash (210 per 100,000 males, compared with 105 per 100,000 females).
When looking at injury rates in relation to the number of registered vehicles, motorcyclists had by far the highest rate—1,430 serious injury cases per 100,000 registered vehicles (AIHW: Henley & Harrison 2009). This was more than 10 times the rate for car occupants. For the period from 2000–01 to 2006–07, there was an increase of 47% in age-standardised rates of serious injury for motorcyclists and an increase of 47% in rates for pedal cyclists. All other modes of transport recorded relatively small changes in rates during this period.
0
10
20
30
40
50
60
1920 1930 1940 1950 1960 1970 1980 1990 2000 2010
Deaths per 100,000
Year
Males Females
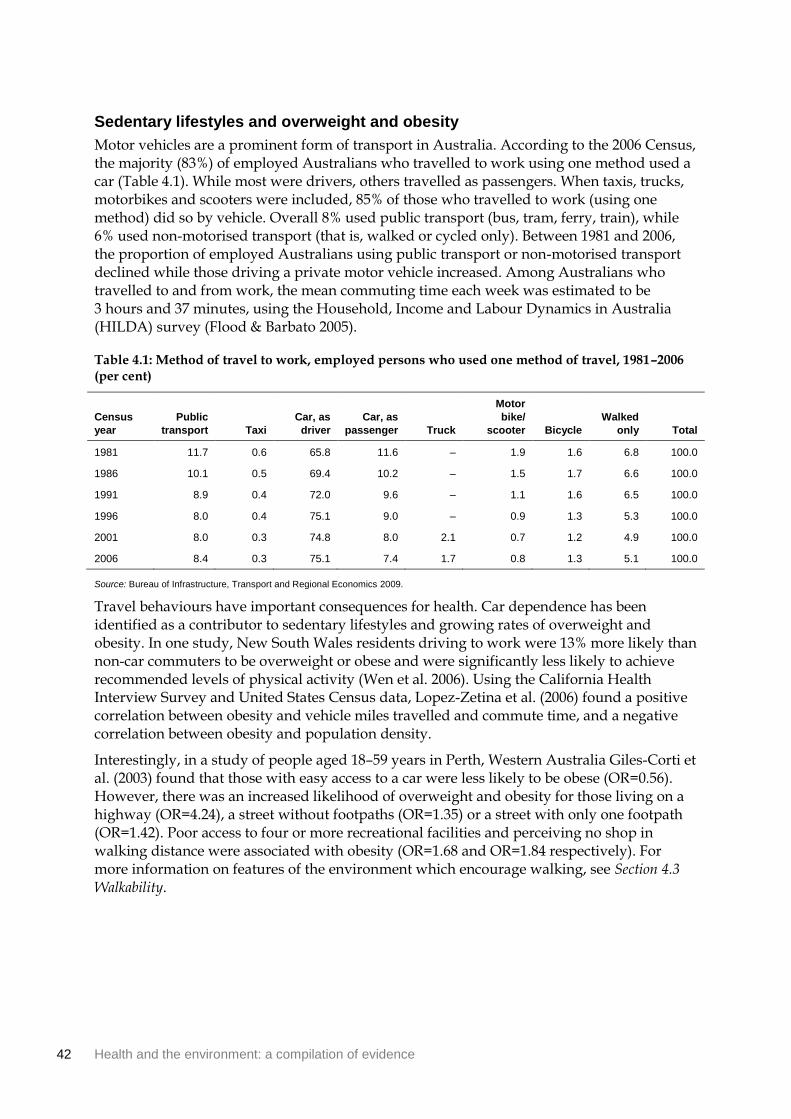
42 Health and the environment: a compilation of evidence
Sedentary lifestyles and overweight and obesity
Motor vehicles are a prominent form of transport in Australia. According to the 2006 Census, the majority (83%) of employed Australians who travelled to work using one method used a car (Table 4.1). While most were drivers, others travelled as passengers. When taxis, trucks, motorbikes and scooters were included, 85% of those who travelled to work (using one method) did so by vehicle. Overall 8% used public transport (bus, tram, ferry, train), while 6% used non-motorised transport (that is, walked or cycled only). Between 1981 and 2006, the proportion of employed Australians using public transport or non-motorised transport declined while those driving a private motor vehicle increased. Among Australians who travelled to and from work, the mean commuting time each week was estimated to be 3 hours and 37 minutes, using the Household, Income and Labour Dynamics in Australia (HILDA) survey (Flood & Barbato 2005).
Table 4.1: Method of travel to work, employed persons who used one method of travel, 1981–2006 (per cent)
Census
year
Public
transport Taxi
Car, as
driver
Car, as
passenger Truck
Motor
bike/
scooter Bicycle
Walked
only Total
1981 11.7 0.6 65.8 11.6 – 1.9 1.6 6.8 100.0
1986 10.1 0.5 69.4 10.2 – 1.5 1.7 6.6 100.0
1991 8.9 0.4 72.0 9.6 – 1.1 1.6 6.5 100.0
1996 8.0 0.4 75.1 9.0 – 0.9 1.3 5.3 100.0
2001 8.0 0.3 74.8 8.0 2.1 0.7 1.2 4.9 100.0
2006 8.4 0.3 75.1 7.4 1.7 0.8 1.3 5.1 100.0
Source: Bureau of Infrastructure, Transport and Regional Economics 2009.
Travel behaviours have important consequences for health. Car dependence has been identified as a contributor to sedentary lifestyles and growing rates of overweight and obesity. In one study, New South Wales residents driving to work were 13% more likely than non-car commuters to be overweight or obese and were significantly less likely to achieve recommended levels of physical activity (Wen et al. 2006). Using the California Health Interview Survey and United States Census data, Lopez-Zetina et al. (2006) found a positive correlation between obesity and vehicle miles travelled and commute time, and a negative correlation between obesity and population density.
Interestingly, in a study of people aged 18–59 years in Perth, Western Australia Giles-Corti et al. (2003) found that those with easy access to a car were less likely to be obese (OR=0.56). However, there was an increased likelihood of overweight and obesity for those living on a highway (OR=4.24), a street without footpaths (OR=1.35) or a street with only one footpath (OR=1.42). Poor access to four or more recreational facilities and perceiving no shop in walking distance were associated with obesity (OR=1.68 and OR=1.84 respectively). For more information on features of the environment which encourage walking, see Section 4.3 Walkability.

Health and the environment: a compilation of evidence 43
4.5 Green space
What is green space?
A green space is an area of vegetated land within or adjoining an urban area (Health Scotland et al. 2008). It includes natural green spaces such as bushland, amenity parks and grasslands, outdoor sports facilities, school playgrounds, vacant land and countryside immediately adjoining an urban area. Green spaces are usually open to the public although some definitions will include private green space such as home gardens or backyards (for example, CSIRO 2004).
The quality and quantity of green space is largely considered a problem for urban populations as their contact with nature is likely to be limited. In this regard, green space access is of considerable interest for urban planning in Australia. In the 2006 Census, two-thirds of Australians (66%) lived in urban areas of greater than 100,000 people, with most (60% of the total population) living in cities of more than 1 million people (ABS 2008c).
How can green space affect health?
There is a general intuitive understanding that green space such as parks and recreation areas are good for individual and community health. However, the relationship between green space and health is complex and difficult to quantify. Determining causation in cross-sectional studies is difficult, as researchers must decide whether living near green space leads to a specific health benefit or if healthy individuals are choosing to live near green space.
A large amount of the research in this field comes from the Netherlands and England—countries with national databases classifying land cover and land use. It is important to note that these countries have a higher population density than Australia and other unique demographic and socioeconomic characteristics which may reduce the ability to transfer findings to the Australian context.
Self-assessed health status
After controlling for socioeconomic status and demographic variables, several studies have found that green space is associated with better self-assessed health status (for example, de Vries et al. 2003; Maas et al. 2006). Maas and colleagues (2006) used self-reported health data from 250,782 people registered with 104 Dutch general practices. They calculated the amount of green space within a one or three kilometre radius of each household using green space data from the Dutch National Land Cover Classification database. There was a significant relationship between the percentage of green space within a one or three kilometre radius and self-assessed health. In areas where 90% of the environmental surrounds were green, only 10.2% of residents felt unhealthy, compared with areas where only 10% was green where 15.5% of residents felt unhealthy. Elderly and young people in large cities were found to benefit more from green space than other population groups.
De Vries et al. (2003) found a similar effect for self-assessed health status, also among a Dutch sample. The positive relationship between green space and health was stronger for housewives and the elderly—groups hypothesised to spend more time in the local area. This research included additional measures—the number of symptoms experienced in the last 14 days and score on the Dutch General Health Questionnaire indicating propensity towards
44 Health and the environment: a compilation of evidence
morbidity. People living in a greener environment were found to be significantly healthier than others and displayed fewer symptoms in the last 14 days. Overall 10% more green space was associated with a reduction in the number of symptoms which was comparable to a decrease in age of five years.
A study conducted in Adelaide, South Australia used a mail-out survey to examine the association between perceived neighbourhood greenness and self-assessed physical and mental health (Sugiyama et al. 2008). When adjusted for socioeconomic variables, the results showed that respondents who perceived their neighbourhood as very green had a 1.37 to 1.60 times greater likelihood of better physical and mental health respectively (when compared with people who perceived their neighbourhoods to be lower in greenness).
Morbidity and mental health
In 2009, Maas et al. (2009) published a study that used a more objective physician-assessed measure of morbidity. The researchers combined morbidity data derived from the electronic medical records of 195 general practitioners in 96 Dutch practices, with green space data from the National Land Cover Classification database.
The annual prevalence for 15 out of 24 diseases was lower in people living in environments with more green space in a one kilometre radius. The strongest relationship was found for anxiety and depression, although there were also smaller reductions in the risk of heart disease, diabetes, chronic neck and back pain, asthma and migraine. For anxiety disorders, the annual prevalence for people with 10% green space in a one kilometre radius was 26 per 1,000 people and, for those with 90% green space, 18 per 1,000 people. For depression, these figures were 32 and 24 per 1,000 people respectively. People who are hypothesised to spend more time around their homes (such as children and people of lower socioeconomic status) were found to experience the strongest effects of this relationship.
Several reviews have found evidence that green space (within and outside of urban areas) has a positive effect on recovery from stress and attention fatigue (for example, Health Scotland et al. 2008; Deakin University 2008; Townsend & Weerasuriya 2010). Aspects of green space which may reduce stress include outdoor activity and exercise, social interaction, natural daylight, stimulation of the senses and aesthetic experience. A study of almost 1,000 adults in nine Swedish cities found that the more time people spend in outdoor public green space, the less stressed they felt and the fewer stress-related illnesses they reported, regardless of age, gender and socioeconomic status (Grahn & Stigsdotter 2003). The study also showed that distance to urban green spaces was associated with frequency of use, and surprisingly those who had access to a private garden visited green space more often than those who did not.
Health and the environment: a compilation of evidence 45
Physical activity
Sedentary lifestyles are a prominent public health concern and considerable attention has focused on the role of green space in promoting an active lifestyle. Some but not all studies included in a recent literature review by Health Scotland (2008) support the argument that access to green space increases the odds of undertaking exercise. The amount of physical activity undertaken was mediated by a number of personal factors (for example, self-efficacy and motivation) and was sensitive to the space’s attractiveness, distance, size, quality and ease of access (Giles-Corti 2005; Jones et al. 2009; Maas et al. 2009). See Box 4.4 for more information about inequalities in the provision of green and public open space.
Giles-Corti (2005) conducted a survey of 1,803 healthy and working residents in a metropolitan area of Perth, Western Australia. Overall 28% of the sample had used a public open space for physical activity in the previous week. The researchers found that easy access to large open spaces with attractive attributes such as trees, water features and bird life was associated with higher levels of walking. Those using public open space were three times more likely to achieve recommended levels of physical activity than those who did not use these spaces.
Box 4.4: Inequalities and the provision of green space
Not all neighbourhoods have equivalent access to green spaces and amenities. Crawford et al. (2008) found that in Melbourne, Victoria public open space in poorer neighbourhoods had fewer amenities to support physical activity in children. Compared the lowest socioeconomic areas, public open space in the highest socioeconomic areas had more amenities (such as picnic tables and play equipment), and were more likely to have good lighting, signage, walking tracks and trees for shade.
Very few studies have looked at the relationship between green space and mortality. Mitchell & Popham (2008) studied the association between income deprivation and mortality in England. They found that the mortality gap between socioeconomic groups differed significantly across groups of exposure to green space, and that health inequalities were lower in populations living in the greenest areas. The all-cause mortality ratio in the most deprived quartile compared with the least deprived was 1.93 in the least green areas and 1.43 in the most green. For circulatory disease mortality, it was 2.19 in the least green and 1.59 in the most green. This research suggests that a physical environment which promotes good health may be an important tool in reducing health inequalities.

46 Health and the environment: a compilation of evidence
4.6 Environmental noise
What is environmental noise?
In the disciplines of psychology and acoustics, noise is defined as unwanted sound that may cause annoyance, disturb communication or interfere with sleep and mental tasks. This review focuses on environmental noise (also known as community pollution or noise pollution), which includes noise emitted from all sources except at the industrial workplace (WHO 1999). The main outdoor sources of environmental noise according to the WHO (1999) are road, rail and air traffic, industries, construction and the neighbourhood. Indoor sources include ventilation systems, office machines, home appliances and neighbours. As populations grow, particularly in urban areas, and road, rail and air traffic increases, noise from these sources may become an increasing source of concern (see Australian surveys of noise exposure below).
Sound has many important properties which may influence whether it is perceived as noise:
• the duration of a sound—for example, whether it is continuous or intermittent
• the level or intensity of a sound—measured in decibels (dB) on a logarithmic scale, with higher decibels indicating a louder sound (for example, a 30dB whisper, 70dB traffic on a busy street and a 120dB jackhammer)
• the frequency or pitch of a sound—the number of sound waves passing a given point per second, as measured in cycles per second or Hertz. As we hear some frequencies more acutely than others, sound measurements are often filtered to reflect this sensitivity (enHealth Council 2004). For example, ‘A-weighting’ (indicated as dBA) focuses on mid- and high-range frequencies and gives less emphasis to low frequencies to which our hearing is less sensitive.
The context or setting where the sound is heard, an individual’s attitude towards it and the ability to control or predict the sound will also determine annoyance levels and the perception of sound as noise pollution (Miedema & Vos 1999).
How can environmental noise affect health?
The direct impact of continued exposure to loud noise on the ear and its contribution to hearing loss has been documented since the sixteenth century. Excessive noise, particularly in occupational settings, can cause damage to the delicate hair cells in the inner ear that are responsible for conducting auditory signals to the brain (Better Hearing Australia 2010). Children, adolescents, adults and the elderly may be affected by noise-induced hearing loss.
This section focuses on the lesser known extra-auditory effects of environmental noise which occur outside the occupational setting, and include sleep disturbance, cardiovascular disease and reduced mental wellbeing. A range of other documented health effects are beyond the scope of this section. For further information, see reports such as The health effects of environmental noise—other than hearing loss by the enHealth Council (2004) and Occupational noise-induced hearing loss in Australia by Safe Work Australia (2010).
Sleep disturbance
Sleep is necessary to restore essential biological processes and maintain good health. Its disruption is detrimental in the long and short term, leading to tiredness, reduced quality of
Health and the environment: a compilation of evidence 47
life and poorer daytime performance (Muzet 2007). It is generally well-recognised that environmental factors such as noise have an adverse impact on quality and amount of sleep. External stimuli are still processed by sleepers’ sensory functions despite a non-conscious perception of their presence. Noise interferes with sleep by triggering awakening, altering sleep patterns, reducing the percentage and total time in rapid eye movement (REM) sleep, increasing body movement and changing cardiovascular responses (enHealth Council 2004). These changes may affect mood and performance during the day.
For optimal sleep and low annoyance, guidelines on community noise recommend an average noise level not greater than 30dBA for continuous noise, and a maximum level not greater than 45dBA for single sound events (WHO 1999).
Cardiovascular disease
There is some evidence that persistent noise-induced stress increases cardiovascular risk. In particular, studies in laboratories, occupational settings and the wider community have drawn attention to the effects of environmental noise on hypertension, coronary heart disease and myocardial infarction (heart attack). It is thought that unwanted sound triggers stress-response mechanisms—the release of cortisol, adrenalin and noradrenalin—which has cascade effects such as increased blood pressure and constriction of the blood vessels (enHealth Council 2004).
The intensity of noise is an important factor in determining whether there will be a measurable impact on the cardiovascular system. Babisch (2008) reviewed epidemiological studies on exposure to road traffic noise and cardiovascular risk carried out in European and Japanese cities. He found evidence for the relationship between traffic noise and hypertension only for those exposed to more than 65dBA, and an increased risk of myocardial infarction was found only for noise levels above 60 dBA.
Black et al. (2007) conducted a cross-sectional study of environmental noise and community health among neighbourhoods near Sydney Airport in New South Wales. They found that respondents chronically exposed to high aircraft noise (above 70dBA) were more likely to report stress and hypertension compared with those living in a matched suburb unaffected by aircraft noise. See Box 4.5 for information on another airport study conducted near Munich, Germany.
Mental health, learning and psychosocial outcomes
The most widespread subjective response to noise exposure is annoyance—a feeling of irritation and perhaps anger towards an unwanted stimulus. Miedema & Vos (1999) reviewed available population annoyance data on transport noise, finding that the percentage of highly annoyed individuals began to increase above a noise level of 42dBA. Levels of annoyance can also be moderated by characteristics of the noise and personal attitudes.
Although there is reasonable evidence that exposure to noise can cause psychological symptoms, there is little evidence that it results in serious mental health problems (enHealth Council 2004). Determining causal direction can be problematic—noise may lead to mental ill-health, or mental ill-health may lead to heightened reactions to noise or selection effects (such as the inability to move away). Pre-existing disorders may result in greater sensitivity to the noise, an inability to habituate or may exacerbate problems stemming from noise exposure.

48 Health and the environment: a compilation of evidence
There is strong evidence that noise exposure impairs cognitive performance, with the strongest effects found for central processing and language comprehension among children. Several studies have examined the impact of chronic aircraft, rail and road traffic noise on school children’s performance (for example, the Munich Airport Study in Box 4.5). Effects observed in these studies included deficits in sustained attention, poorer auditory discrimination and speech perception, poorer memory of semantic material and poorer reading ability and school performance on national standardised tests (enHealth Council 2004; Matheson et al. 2003).
Box 4.5: The Munich Airport study (Germany)
The Munich Airport study carried out in the 1990s was an important naturalistic field study examining the effects of noise exposure on children (Evans et al. 1995; Evans et al. 1998; Hygge et al. 2002). Its prospective longitudinal design took advantage of a naturally occurring situation in which the existing Munich Airport was closed down and a new airport opened at another location.
Data for up to 326 third- and fourth-grade children were collected at both sites across three testing waves. Children near the old airport initially displayed negative effects on long-term episodic memory and reading comprehension which declined by the third wave of testing. By this stage, children at the new airport were exhibiting deficiencies in long-term memory and reading comprehension.
It was also observed that chronic noise exposure was associated with elevated neuroendocrine and cardiovascular measures (adrenaline and noradrenalin levels and systolic blood pressure), muted cardiovascular reactivity to a task presented under acute noise, deficits in a standardised reading test administered under quiet conditions and diminished quality of life on a standardised index. The study provided strong evidence for a causal link between noise and cognitive and cardiovascular effects.
Australian surveys of noise exposure
Australian community surveys have found that residents are concerned about environmental noise from a wide range of sources. In a survey conducted on behalf of the New South Wales Department of Environment and Conservation in 2004, 46% of respondents in New South Wales thought traffic noise was a problem in their local area, 34% barking dogs and 21% noise from neighbours (NSW DEC 2004).
In 2006, Victoria’s Environmental Protection Agency (EPA) conducted a community survey to better understand the impact of noise on Victorian communities and assist with future noise management programs. Almost half (49%) of all respondents were disturbed or annoyed by environmental noise and one-quarter (24%) reported noise-induced sleep disturbance at some stage in the past 12 months. Both the 2006 survey and a comparable survey in 1986 found that noise from traffic was the most common source of environmental noise affecting Victorians. In 2006, 70% of respondents heard noise from traffic in their homes and 21% were annoyed by it. The proportion of people exposed to and annoyed by most sources of environmental noise has increased between 1986 and 2006 (Table 4.2).

Health and the environment: a compilation of evidence 49
Table 4.2: Noise exposure and level of annoyance(a), Victoria, 1986 and 2006 (per cent)
1986 2006
Source of noise Heard Annoyance Heard Annoyance
Traffic 47 15 70 21
Alarms 8 2 48 8
Construction 5 2 34 7
Aircraft 21 5 61 6
Railway (tram/train) 22 5 33 2
(a) Percentage of respondents nominating an annoyance level of 5 or above on a scale of 0–10.
Source: Environmental Protection Agency Victoria 2007.

50 Health and the environment: a compilation of evidence
4.7 Overcrowding in housing
What is overcrowding?
Overcrowding occurs when a dwelling is too small for the size and composition of the household living in it (AIHW 2009b). There are several methods used to determine if a dwelling is too small, and hence whether its occupants are living in overcrowded conditions. The Canadian National Occupancy Standard (CNOS) for housing appropriateness is an internationally accepted measure that is commonly used in Australia. The CNOS is sensitive to household size and composition. It uses the following criteria to assess bedroom requirements:
• there should be no more than two people per bedroom
• children less than 5 years of age of different sexes may reasonably share a bedroom
• children less than 18 years of age and of the same sex may reasonably share a bedroom
• single household members aged 18 years or over should have a separate bedroom
• a lone person household may reasonably occupy a bed sitter.
Using this measure, households that require one or more additional bedrooms to meet the standard are considered to be overcrowded.
In Australia, national data on overcrowding across all tenure types come from ABS surveys and the five-yearly Census of Population and Housing (see Overcrowding in Aboriginal and Torres Strait Islander households below).
How can overcrowding in housing affect health?
Overcrowding has the potential to influence physical and mental health through a variety of channels. For example, it may place stress on bathroom, kitchen and laundry facilities and on sewerage systems such as septic tanks. It may alter the relationships between household members, induce psychological stress or affect childhood development.
It is necessary to consider a possible interrelationship between overcrowding and poor health. People with poor health may have difficulty securing employment and may not be able to afford appropriate housing, or they may live in overcrowded conditions as a result of their need for care and support from relatives (United Kingdom Office of the Deputy Prime Minister 2004). The relationship between living arrangements and health is intertwined with broader socioeconomic and cultural factors. The health effects of overcrowding may also occur in combination with other household features (such as tobacco smoke and noise), making attribution difficult. See Section 4.8 Housing condition for other aspects of housing which may influence health.
In 2004, the Office of the Deputy Prime Minister in the United Kingdom compiled an extensive review of evidence and literature related to overcrowding. The authors found 40 studies on overcrowding and physical health and 25 studies related to mental health. The weight of evidence suggested that overcrowding affects several aspects of health in adults and children, and that living in overcrowded conditions as a child affects health in later life. The most consistent findings surrounded respiratory conditions in children, childhood meningitis and tuberculosis infection in both children and adults.
Health and the environment: a compilation of evidence 51
The New Zealand Housing, Crowding and Health study (2003–05) looked at public housing applicants and tenant households (Baker et al. 2006). The researchers found that hospitalisation rates for several major disease categories (particularly neoplasms, musculoskeletal and connective tissue diseases and subcutaneous diseases) were significantly higher for households classified as overcrowded. For specific diseases (such as shingles, acute bronchiolitis, most forms of skin infection, acute myocardial infarction and heart failure), hospitalisation rates were also significantly elevated in those households classified as overcrowded. Injuries to wrist and hand and injuries to hip and thigh were all significantly more frequent causes of hospitalisation in overcrowded households.
Not all results suggest that overcrowding is associated with poor health. The New Zealand Housing, Crowding and Health study found that there were significantly lower rates of mental and behavioural disorders in households experiencing overcrowding (Baker et al. 2006). Likewise, the Australian Housing and Urban Research Institute (AHURI 2002) found that people living in overcrowded households reported (in the 2001 National Health Survey) a significantly lower average number of health conditions compared with individuals living in non-crowded households. However, people living in overcrowded households were also significantly less likely to have visited a doctor in the previous two weeks.
Overcrowding in Indigenous housing is considered an important issue. Using the ABS 2001 National Health Survey, Booth & Carroll (2005) found that overcrowding was associated with poorer health status among Indigenous Australians. They estimated that overcrowding was responsible for 30% of the health gap between Indigenous adults living in remote areas and the non-Indigenous population. However, for non-remote Indigenous people the impact of education and income appeared to be more important than housing for the difference in health status.
The 2001–02 Western Australian Aboriginal Child Health Survey examined housing characteristics of families with Aboriginal children and its relationship to life stresses, family functioning and community characteristics (Silburn et al. 2006). Overcrowding was independently associated with poor housing quality, higher levels of life stresses, overuse of alcohol (causing problems in the household) and a higher number of neighbourhood problems. However, an earlier report from the survey (Zubrick et al. 2005) found that overcrowding had some positive effects. Children living in households with a high household occupancy level were half as likely to be at risk of clinically significant emotional or behavioural difficulties than children living in homes with a low household occupancy level.
Overcrowding in Aboriginal and Torres Strait Islander households
A higher proportion of Indigenous Australians live in overcrowded conditions compared with other Australians. In the 2006 Census, around one in eight Indigenous households (13.7%) were in need of one or more extra bedrooms, compared with 3.0% of other households (Table 4.3). Reflecting the generally higher rates of overcrowding in remote areas, some 38.5% of Indigenous households in the Northern Territory were living in overcrowded conditions, followed by 16.0% in Western Australia and 14.8% in Queensland. The disparity between Indigenous and non-Indigenous households was most prominent in Western Australia (16.0% and 1.6%).
Rates of overcrowding also vary with tenure (Table 4.3). The highest rates of overcrowding among Indigenous households were found among those renting in community housing (40%) and lowest among home owners and purchasers (6.9%). The disparity in

52 Health and the environment: a compilation of evidence
overcrowding between Indigenous and non-Indigenous households was particularly evident in community housing (40% Indigenous compared with 4% non-Indigenous).
Table 4.3: Proportion of households(a) which are overcrowded, by tenure type and state and territory, 2006 (per cent)
(a) Excludes those households for which overcrowding could not be determined.
(b) Indigenous households are defined as households in which there was at least one Indigenous usual resident.
(c) Includes dwellings being rented from a real estate agent and from persons not in the same household, and the category ‘landlord not
stated’.
(d) Defined as those receiving assistance under a public rental housing program offered by state and territory housing authorities who are
paying rent to the relevant government housing authority.
(e) Defined as those receiving assistance under a community housing program offered by not-for-profit community agencies which may or may
not be funded by state and territory housing authorities.
(f) Includes households being purchased under a rent/buy scheme, occupied rent-free, occupied under a life tenure scheme or other tenure not
further defined.
(g) Includes not stated Indigenous status.
Note: Overcrowded households are defined as households in which one or more additional bedrooms were needed based on the CNOS (see
What is overcrowding?).
Source: AIHW 2009b.
Household and tenure type NSW/ACT Vic Qld WA SA Tas NT Aus
Indigenous households(b)
Home owner/purchaser 6.6 6.0 7.8 7.2 6.1 4.8 11.6 6.9
Private and other renter(c)
11.1 10.2 13.1 9.7 9.3 9.2 17.4 10.5
Renter state/territory housing
authority(d)
11.4 12.3 21.5 20.5 14.5 10.7 24.8 15.9
Renter Indigenous/mainstream
community housing(e)
18.0 15.5 33.0 41.7 36.8 11.6 60.8 40.0
Other/not stated(f)
11.3 10.5 20.0 18.8 15.5 10.5 40.0 17.4
Total 9.8 9.0 14.8 16.0 11.7 7.2 38.5 13.7
Non-Indigenous
households(g)
Home owner/purchaser 2.5 2.2 1.7 1.1 1.1 1.7 3.7 2.1
Private and other renter(c)
7.4 5.7 4.5 2.9 4.1 4.1 4.7 5.6
Renter state/territory housing
authority(d)
5.4 6.8 4.9 2.6 2.7 4.8 5.1 4.9
Renter Indigenous/mainstream
community housing(e)
4.8 3.0 4.0 1.3 2.9 3.1 2.3 3.6
Other/not stated(f)
3.9 4.0 3.3 2.1 2.2 2.4 5.6 3.6
Total 3.9 3.1 2.6 1.6 2.2 2.3 4.2 3.0

Health and the environment: a compilation of evidence 53
4.8 Housing condition
Measuring housing condition
What constitutes adequate housing condition is not necessarily fixed over time, between locations or across cultures. In Australia and other developed nations, there are a number of features which have been used to assess whether dwellings are in liveable condition. These include:
• the presence or absence of major structural problems—problems which relate to the main physical structures of the dwelling such as walls, floors, foundations, roof, electrical wiring and plumbing (ABS 2002). Problems may include rising damp, major cracks in walls and floors, sinking or moving foundations or sagging floors.
• the need and cost for major repairs or replacement—any internal or external work undertaken with the purpose of either preventing deterioration or repairing something to its original condition or functionality. It does not include work carried out as part of alterations or additions (ABS 2002).
• the availability and function of basic facilities and services—these are facilities that assist in washing people, clothes and bedding; safely removing waste; and enabling the safe storage and cooking of food (ABS 2009; AIHW 2009b).
These measures have been used in several Australian surveys (see Housing and Aboriginal and Torres Strait Islanders below). Other specific features used to indicate poor housing conditions include:
• the visible presence of mould
• pest infestations such as cockroaches, termites or rats
• indoor walls and floors showing signs of dampness
• poor temperature control resulting in indoor living spaces that are extremely cold or hot
• the presence of toxic building materials (for example, lead-based paint or asbestos).
Overcrowding, poor indoor air quality, exposure to noise and household hazards (discussed elsewhere in Chapter 4 The built environment) also contribute to poor housing quality.
How can housing condition impact health?
A large number of reviews and studies have pointed to associations between different aspects of housing and health. Yet the direction of causation cannot always be known with certainty—poor quality housing may lead to ill-health, vice versa or a third set of determinants may be involved (Waters 2001). Nevertheless, it is well-established that inadequate or poorly maintained housing can pose serious risks. This section examines selected aspects of housing condition which have well-established links to health.
Dampness and mould
Adverse health effects associated with damp and mouldy dwellings have been widely researched. The most common health conditions are respiratory problems and the strongest associations are found for young children, particularly as results are less likely to be confounded by smoking and workplace exposure. Fisk et al. (2007) conducted a quantitative meta-analysis of 33 studies of associations between dampness and mould and health. The
54 Health and the environment: a compilation of evidence
researchers found that dampness and mould increased the risk of a variety of respiratory and asthma-related health outcomes by 30–52%. Most studies included in the meta-analysis found a significantly increased risk of at least one adverse health effect—such as wheeze, cough, nasal symptoms and asthma development. Mudarri & Fisk (2007) later estimated that 21% (4.6 million) of current asthma cases in the United States are attributable to dampness and mould exposure. However, it is difficult to predict whether the impact of dampness and mould is similar in Australia due to a different climate and relatively newer housing stock (Waters 2001).
Asbestos
Asbestos is a naturally occurring fibrous mineral widely used in Australia in construction and other industries prior to the mid-1980s. Some of the 3,000 asbestos-based products include cement sheet, roofing sheet, plastics, vinyl floor tiles, pipe lagging and fire-resistant material (SafeWork SA 2002). While all forms of asbestos are currently banned in Australia, these products remain in thousands of private and commercial buildings.
Asbestos becomes a health risk when its fibres are released into the air and inhaled, usually during renovation or demolition. The risk to health increases with the number of fibres inhaled and length of exposure. Diseases caused by exposure to asbestos fibres include two types of cancers (mesothelioma and lung cancer) and asbestosis (a progressive, fibrotic lung disease causing increasing breathlessness) (Environment Australia 2001). These diseases are often associated with a long latency period—it may take up to 40 years between the initial exposure and the disease onset. Between 1997 and 2007, there were 659 deaths from asbestosis and 4,442 deaths from mesothelioma in Australia (AIHW 2010c); however, due to this long latency period, many more deaths are expected into the 21st century.
Lead
Lead is a naturally occurring metal found in small amounts in the earth’s crust. Before 1970, paints containing high levels of lead were used in many Australian homes. Lead is highly toxic in all forms—even small amounts of dust or paint chips generated during home repairs can be a health risk (Environment Australia 2001). Children under the age of four, pregnant women and workers occupationally exposed to lead are most at risk (NSW Government Human Services 2009).
Ingestion of lead can lead to poor appetite; nausea; pain; leg cramps; muscle weakness; damage to the brain, kidneys and reproductive organs and even death (Environment Australia 2001). Furthermore, the International Agency for Research on Cancer have classified inorganic lead as a probable human carcinogen (IARC 2006a). The relation between lead exposure and neurodevelopmental abnormalities is also well-established (Dockery et al. 2010). Young children exposed to lead may experience learning difficulties, slow growth and defective hearing. Lead exposure during pregnancy can contribute to premature birth, low birth-weight and abortion.
Housing and Aboriginal and Torres Strait Islanders
Housing has been identified as a major factor affecting the health of Indigenous Australians (see also Section 4.7 Overcrowding in housing). According to the 2008 National Aboriginal and Torres Strait Islander Social Survey (NATSISS), almost three in ten (28%) Indigenous Australians aged 15 years or older were living in dwellings that had major structural problems (ABS 2009). This proportion was higher in Remote/Very remote areas (39%) than in Major cities (25%). Furthermore, 13% of Indigenous people aged 15 years or older were living

Health and the environment: a compilation of evidence 55
in a household which did not have basic facilities or if available, these facilities did not work. This proportion also varied across remoteness areas. More than three times the proportion of Indigenous people living in Remote/Very remote areas (28%) reported problems with basic facilities than Indigenous people living in Inner/Outer regional areas (9%) or Major cities (8%).
Between the 2002 and 2008 NATSISS, the proportion of Indigenous people living in dwellings with major structural problems decreased from 38% to 28% (ABS 2009). This decrease corresponded with an increase in the proportion of dwellings which had repairs and maintenance carried out in the previous 12 months. In 2008, almost six in ten (58%) Indigenous people aged 15 years or over lived in housing where repairs and maintenance had been carried out.
The 2001–02 Western Australian Aboriginal Child Health Survey classified 16% of dwellings with Aboriginal children in Western Australia as being of ‘poor housing quality’ (based on the healthy living practices outlined in the National Framework for Indigenous Housing) (Australian Human Rights Commission 2009). Dwellings in poor condition were more likely to be rented and located in areas of extreme isolation and socioeconomic disadvantage (Silburn et al. 2006). The study also found that households living in poor quality dwellings had poorer economic wellbeing, lower levels of family functioning, were experiencing more life stresses and were more likely to misuse alcohol.
The 2006 Community Housing and Infrastructure Needs Survey provides detailed information on housing condition in discrete Indigenous communities (ABS & AIHW 2008). In these communities across Australia, there were around 6,674 dwellings (31%) that required major repair or replacement. Dwellings in Remote and Very remote areas were more likely to be in poorer condition compared with dwellings in non-remote areas (Table 4.4).
Table 4.4: Condition of permanent dwellings in Indigenous communities by remoteness, 2006 (per cent)
Dwelling condition Non-remote Remote Very remote Total
Minor or no repair required 71.6 63.9 69.4 69.5
Major repair required 24.5 26.0 22.2 23.4
Replacement required 3.9 10.1 8.4 7.2
Total 100.0 100.0 100.0 100.0
Notes
1. Discrete Indigenous communities are those inhabited predominantly by Aboriginal and Torres Strait Islander people,
with housing or infrastructure that is managed on a community basis. These communities have an estimated
population of 92,960 people and are primarily located in Remote and Very remote areas of Australia (ABS 2007).
2. Data were collected for permanent dwellings and categorised according to the cost of repairs required to
the dwelling.
Source: ABS 2006 Community Housing and Infrastructure Needs Survey.

56 Health and the environment: a compilation of evidence
4.9 Hazards in and around the home
What is an injury?
An injury can be defined as a trauma, poisoning or other condition of rapid onset where external factors and circumstances have contributed significantly (Department of Health and Family Services and AIHW 1998). A home injury is an injury that occurs in a private dwelling, excluding injuries which occur in an occupational setting, residential institution or hospital. Many types of injuries can occur in and around the home— for example, injuries from falls, trips and slips; fire and burn injuries; poisoning by household substances and electrocution. Drowning, particularly among young children, has received a substantial amount of attention in Australia and is explored in detail in Box 4.6.
Injury is a leading cause of death (especially among children aged 1–14 years) and a major reason for hospital admission and emergency department visits in Australia (AIHW 2010b). This section examines home injuries and draws upon hospital and mortality data. For information on other conditions associated with housing, see Section 4.7 Overcrowding in housing and Section 4.8 Housing condition.
Morbidity and the home environment
Injury prevention and control was first considered a national health priority for Australia in 1986 (Department of Health and Family Services and AIHW 1998). Even less severe injuries can cause a considerable burden when the cost of providing treatment and time away from work is considered. From the National Health Survey 2004–05, it is estimated that 18% of the population (3.6 million people) had sustained an injury in the previous four weeks (ABS 2006). The home was the most common place of occurrence—people who received a recent injury were most likely to experience them inside (30%) or outside (25%) their own or someone else’s home. Females were almost twice as likely to be injured inside a home (39%) than males (21%).
Depending on severity, an injury may require hospitalisation. In 2007–08, there were almost 160,000 home injury-related hospitalisations (that is, hospitalisations due to an external cause that were triggered by an action or event in the home environment) (Table 4.5). It should be noted that this number includes injuries that were intentional (for example, assault or intentional self-harm) and those where the intent could not be determined.
Falls were by far the most common cause of home injury-related hospitalisation (88,008 hospitalisations) followed by intentional self-harm (17,405), exposure to mechanical forces (16,901), accidental poisoning (5,918) and exposure to smoke, fire, flames and hot substances (4,711). Overall, 18% of injury-related hospitalisations were the result of an action or event in the home. The home was the most common place of occurrence for falls (38.1% of hospitalisations), intentional self-harm (55.2%) and exposure to smoke, fire, flames and hot substances (51.6%) (AIHW 2010c).

Health and the environment: a compilation of evidence 57
Table 4.5: Hospitalisations that reported a home injury as the cause, by ICD-10-AM groupings, all hospitals, Australia, 2007–08
External cause
Hospitalisations for injury
with home as place of
occurrence
(number)
Proportion of hospitalisations
for injury with home as place
of occurrence
(per cent)(a)
Unintentional injuries
Falls 88,008 38.1
Exposure to mechanical forces 16,901 19.1
Accidental poisoning 5,918 44.0
Exposure to smoke, fire, flames, hot substances 4,711 51.6
Transport accidents 1,803 2.6
Other accidental threats to breathing 1,623 14.0
Exposure to venomous plants, animals, forces of nature 1,500 27.0
Exposure to electricity, radiation, extreme temperature/pressure 240 15.4
Accidental drowning and submersion 219 36.2
Other external causes 15,030 3.4
Intentional injuries
Assault 4,332 15.4
Intentional self-harm 17,405 55.2
Events of undetermined intent 2,225 32.3
Total(b)
159,032 17.6
(a) Proportion of all hospitalisations for injury that reported the external cause category for which home was reported as the place of
occurrence.
(b) As more than one external cause and place of occurrence can be reported for each hospitalisation, the total is not the sum of the column in
the table.
Source: AIHW 2009c.
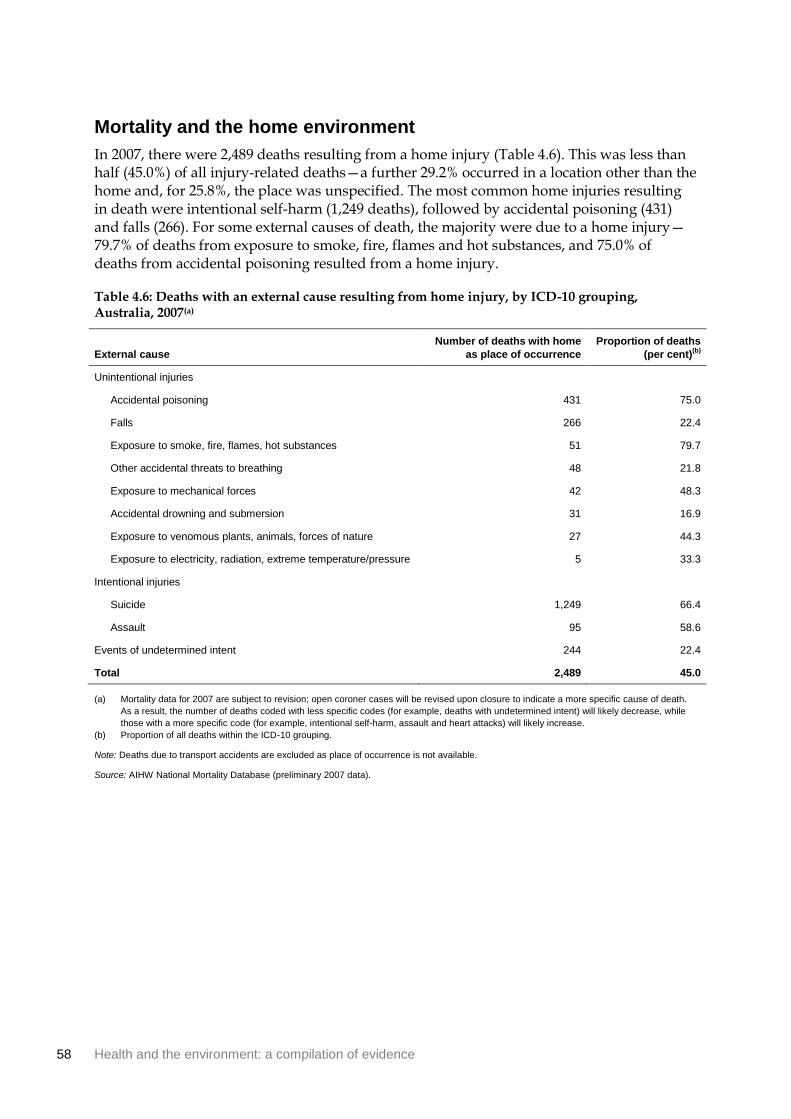
58 Health and the environment: a compilation of evidence
Mortality and the home environment
In 2007, there were 2,489 deaths resulting from a home injury (Table 4.6). This was less than half (45.0%) of all injury-related deaths—a further 29.2% occurred in a location other than the home and, for 25.8%, the place was unspecified. The most common home injuries resulting in death were intentional self-harm (1,249 deaths), followed by accidental poisoning (431) and falls (266). For some external causes of death, the majority were due to a home injury—79.7% of deaths from exposure to smoke, fire, flames and hot substances, and 75.0% of deaths from accidental poisoning resulted from a home injury.
Table 4.6: Deaths with an external cause resulting from home injury, by ICD-10 grouping, Australia, 2007(a)
External cause
Number of deaths with home
as place of occurrence
Proportion of deaths
(per cent)(b)
Unintentional injuries
Accidental poisoning 431 75.0
Falls 266 22.4
Exposure to smoke, fire, flames, hot substances 51 79.7
Other accidental threats to breathing 48 21.8
Exposure to mechanical forces 42 48.3
Accidental drowning and submersion 31 16.9
Exposure to venomous plants, animals, forces of nature 27 44.3
Exposure to electricity, radiation, extreme temperature/pressure 5 33.3
Intentional injuries
Suicide 1,249 66.4
Assault 95 58.6
Events of undetermined intent 244 22.4
Total 2,489 45.0
(a) Mortality data for 2007 are subject to revision; open coroner cases will be revised upon closure to indicate a more specific cause of death.
As a result, the number of deaths coded with less specific codes (for example, deaths with undetermined intent) will likely decrease, while
those with a more specific code (for example, intentional self-harm, assault and heart attacks) will likely increase.
(b) Proportion of all deaths within the ICD-10 grouping.
Note: Deaths due to transport accidents are excluded as place of occurrence is not available.
Source: AIHW National Mortality Database (preliminary 2007 data).

Health and the environment: a compilation of evidence 59
Box 4.6: Drowning in swimming pools
Deaths due to drowning have received a substantial amount of attention in Australia—a nation with a reputation for enjoying water activities. Much has been achieved in the prevention of drowning deaths. Over the last decade, the absolute number of deaths and per capita risk of drowning have reduced substantially (Mackie 1999; Franklin et al. 2010).
Swimming pools and other water hazards (such as spa pools) are a major cause of drowning, particularly among young children (Pearn et al. 2008). An audit of all unintentional drowning deaths (2002–2007) found that 13% of these deaths occurred in swimming pools, although this was slightly less than the proportion that occurred in rivers (20%) and beaches (18%) (Franklin et al. 2010). The average number of deaths per year due to drowning in home swimming pools had nearly halved since a previous study published in 1999 (Mackie 1999).
As many drowning deaths are preventable, studies have looked at factors that could reduce the risk of drowning in home swimming pools. These factors include safety legislation, public education of risks, improved safety design (for example, safety barriers) and improved measures after a drowning occurs (for example, rescue and revival):
Pearn et al. (2008) found that the swimming pool drowning rate among 0–4 year olds in Brisbane, Queensland fell after the introduction of safety legislation in 1999, as did the ratio of pool drowning deaths to all drowning deaths in this age group.
In a retrospective review of coroners data in Western Australia, Stevenson et al. (2003) found that 68% of drowning deaths in private swimming pools occurred in pools that did not have four-sided fencing. There was almost a two-fold increased risk of a child drowning in a swimming pool with three-sided versus four-sided fencing.
A systematic review by Thompson & Rivara (1998) found that pool fencing significantly reduced the risk of drowning—the odds ratio for the risk of drowning in a fenced pool compared with an unfenced pool was 0.27. Fencing which completely encloses a swimming pool and isolates it from the home was found to be superior to perimeter fencing that encloses the property and the pool.
Legislation regarding pool fencing in Australia is currently formulated separately by each state and territory. Penalties and on-the-spot fines exist for home owners who do not comply with pool fencing standards.

60 Health and the environment: a compilation of evidence
4.10 Water fluoridation
What is water fluoridation?
Water fluoridation is the practice of adjusting the level of fluoride in drinking water to achieve a concentration of approximately one part fluoride per million parts water (AIHW DSRU 2007a). This concentration is effective in preventing dental decay by making teeth less susceptible to the acids formed by microorganisms living on and around teeth. It can also assist in reversing the process of decay once it has commenced.
While fluoride can occur naturally in drinking water, most occurs as a result of the water fluoridation process. Water fluoridation has been practiced for over 60 years internationally and over 55 years in Australia. As of 2001, more than two-thirds (69%) of the Australian population (including residents in all capital cities except Brisbane) had access to fluoridated drinking water (AIHW 2010b). In December 2008, fluoride was introduced to the water supply for Brisbane and parts of south-east Queensland (Brisbane City Council 2009). Non-fluoridated water supplies are generally more likely to be found in regional and remote areas (AIHW DSRU 2009).
How can water fluoridation affect health?
Preventing dental decay
Dental problems such as tooth decay and gum disease are common in Australia and other developed countries (AIHW DSRU 2007b). Poor dental health—primarily dental caries, periodontal diseases, tooth loss and oral cancer—create a financial burden for individuals and society, and can reduce self-confidence and quality of life. Good dental health in childhood is also critical for dental health in later life because it increases the likelihood of retaining natural teeth and avoiding decay (AIHW DSRU 2009).
Decades of research have highlighted the effectiveness of water fluoridation in reducing dental decay, especially among children. Because there are now many studies which have examined water fluoridation, systematic reviews have been conducted to compile and interpret the large amount of data. One of the most recent reviews was conducted in 2007 by the NHMRC. The review affirmed that water fluoridation was beneficial in reducing dental caries and that it remains the most effective and socially equitable means of achieving community-wide exposure to the preventative effects of fluoride (NHMRC 2007).
Specific studies in Australia, such as the Child Dental Health Survey and National Survey of Adult Oral Health, can be used to look at the relationship between dental health and fluoride concentration in drinking water. The 2002 Child Dental Health Survey (AIHW DSRU 2007a) found that:
• Apart from 4-year-olds, average decayed, missing or filled teeth (dmft) per child were higher for children residing in areas with a lower fluoride concentration than for children residing in areas with a higher fluoride concentration. Relative differences for deciduous (baby) teeth dmft ranged from 7.1% (4-year-olds) to 65.8% (7-year-olds). For permanent teeth, the difference ranged between 12.7% (11-year-olds) and 50.6% (12-year-olds).
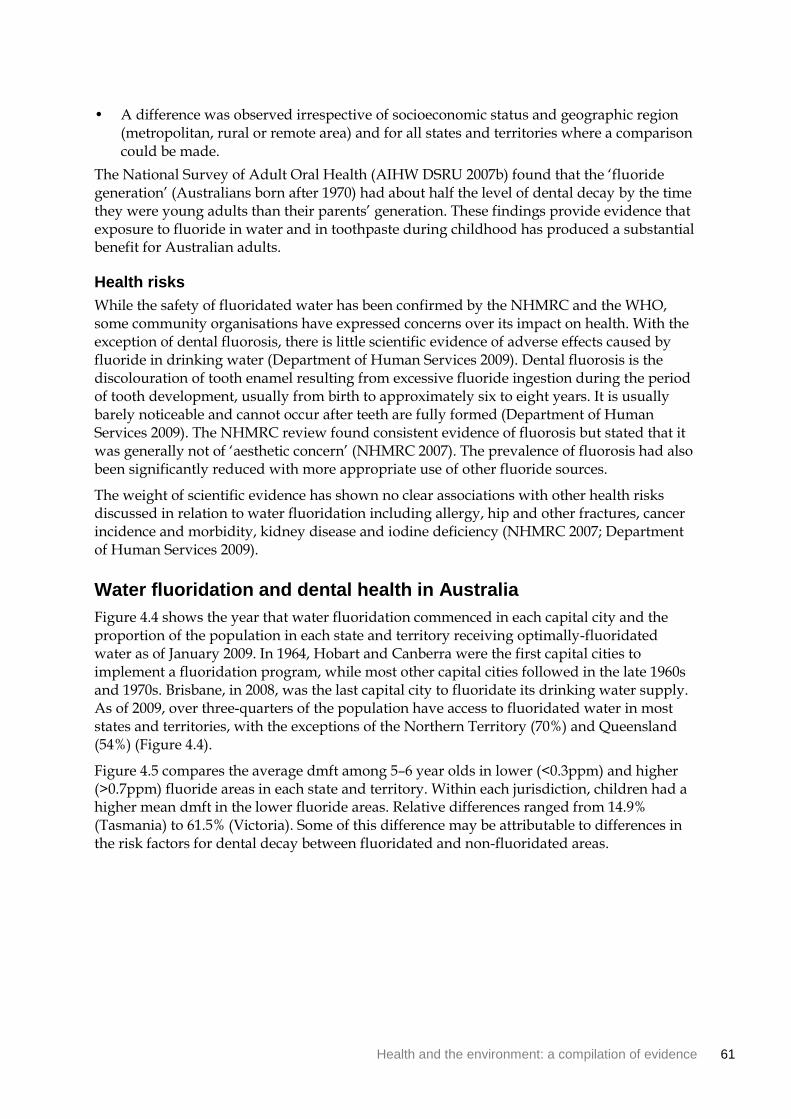
Health and the environment: a compilation of evidence 61
• A difference was observed irrespective of socioeconomic status and geographic region (metropolitan, rural or remote area) and for all states and territories where a comparison could be made.
The National Survey of Adult Oral Health (AIHW DSRU 2007b) found that the ‘fluoride generation’ (Australians born after 1970) had about half the level of dental decay by the time they were young adults than their parents’ generation. These findings provide evidence that exposure to fluoride in water and in toothpaste during childhood has produced a substantial benefit for Australian adults.
Health risks
While the safety of fluoridated water has been confirmed by the NHMRC and the WHO, some community organisations have expressed concerns over its impact on health. With the exception of dental fluorosis, there is little scientific evidence of adverse effects caused by fluoride in drinking water (Department of Human Services 2009). Dental fluorosis is the discolouration of tooth enamel resulting from excessive fluoride ingestion during the period of tooth development, usually from birth to approximately six to eight years. It is usually barely noticeable and cannot occur after teeth are fully formed (Department of Human Services 2009). The NHMRC review found consistent evidence of fluorosis but stated that it was generally not of ‘aesthetic concern’ (NHMRC 2007). The prevalence of fluorosis had also been significantly reduced with more appropriate use of other fluoride sources.
The weight of scientific evidence has shown no clear associations with other health risks discussed in relation to water fluoridation including allergy, hip and other fractures, cancer incidence and morbidity, kidney disease and iodine deficiency (NHMRC 2007; Department of Human Services 2009).
Water fluoridation and dental health in Australia
Figure 4.4 shows the year that water fluoridation commenced in each capital city and the proportion of the population in each state and territory receiving optimally-fluoridated water as of January 2009. In 1964, Hobart and Canberra were the first capital cities to implement a fluoridation program, while most other capital cities followed in the late 1960s and 1970s. Brisbane, in 2008, was the last capital city to fluoridate its drinking water supply. As of 2009, over three-quarters of the population have access to fluoridated water in most states and territories, with the exceptions of the Northern Territory (70%) and Queensland (54%) (Figure 4.4).
Figure 4.5 compares the average dmft among 5–6 year olds in lower (<0.3ppm) and higher (>0.7ppm) fluoride areas in each state and territory. Within each jurisdiction, children had a higher mean dmft in the lower fluoride areas. Relative differences ranged from 14.9% (Tasmania) to 61.5% (Victoria). Some of this difference may be attributable to differences in the risk factors for dental decay between fluoridated and non-fluoridated areas.
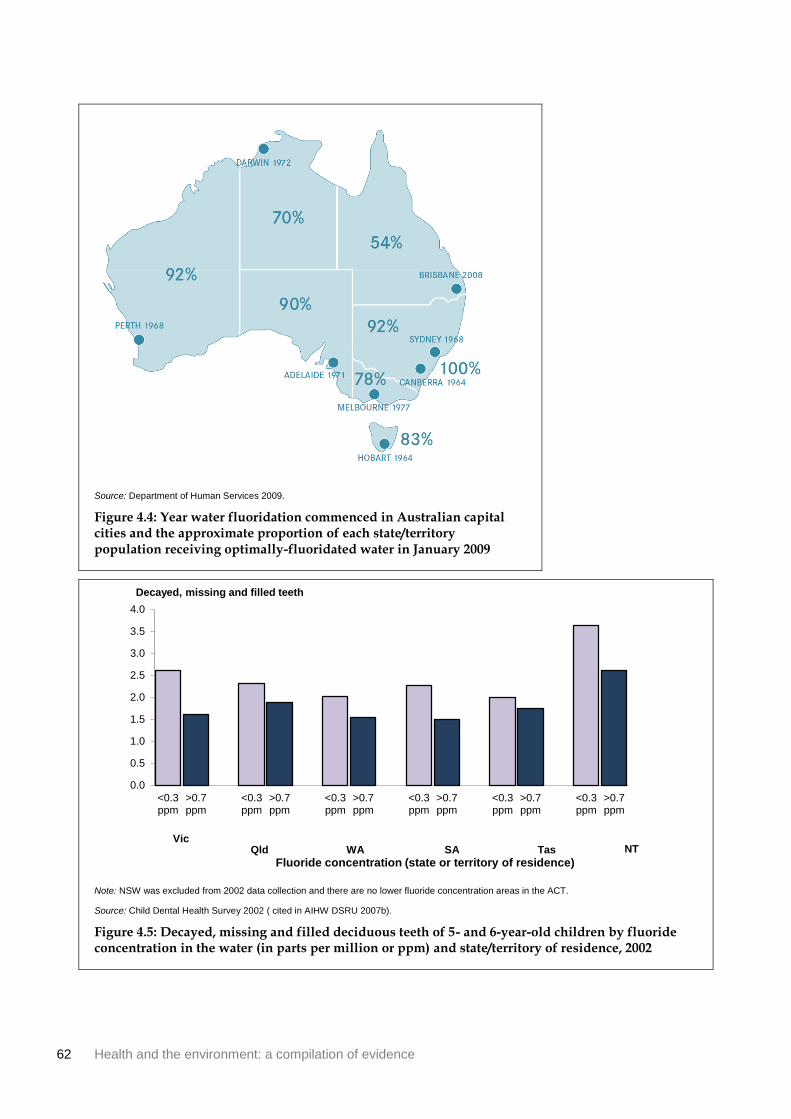
62 Health and the environment: a compilation of evidence
Source: Department of Human Services 2009.
Figure 4.4: Year water fluoridation commenced in Australian capital cities and the approximate proportion of each state/territory population receiving optimally-fluoridated water in January 2009
Note: NSW was excluded from 2002 data collection and there are no lower fluoride concentration areas in the ACT.
Source: Child Dental Health Survey 2002 ( cited in AIHW DSRU 2007b).
Figure 4.5: Decayed, missing and filled deciduous teeth of 5- and 6-year-old children by fluoride concentration in the water (in parts per million or ppm) and state/territory of residence, 2002
0.0
0.5
1.0
1.5
2.0
2.5
3.0
3.5
4.0
<0.3ppm
>0.7ppm
<0.3ppm
>0.7ppm
<0.3ppm
>0.7ppm
<0.3ppm
>0.7ppm
<0.3ppm
>0.7ppm
<0.3ppm
>0.7ppm
Fluoride concentration (state or territory of residence)
Decayed, missing and filled teeth
Vic Qld WA SA Tas NT

Health and the environment: a compilation of evidence 63
References
ABC (Australian Broadcasting Corporation) 2004. Year of the Built Environment—about this project. Viewed 24 February 2010, <http://www.abc.net.au/built/about.htm>.
ABS (Australian Bureau of Statistics) 2002. Australian social trends, 2002. Cat. no. 4102.0. Canberra: ABS.
ABS 2004. Year book Australia, 2004. Cat. no. 1301.0. Canberra: ABS.
ABS 2006. Injury in Australia: a snapshot, 2004–05. Cat. no. 4825.0.55.001. Canberra: ABS.
ABS 2007. Housing and infrastructure in Aboriginal and Torres Strait Islander communities, Australia, 2006. Cat. no. 4710.0. Canberra: ABS.
ABS 2008a. Population projections, Australia, 2006 to 2101. Cat. no. 3222.0. Canberra: ABS.
ABS 2008b. Year book Australia, 2008. Cat. no. 1301.0. Canberra: ABS.
ABS 2008c 2006 CDATA online. Cat. no. 2064.0. Canberra: ABS. Viewed 31 August 2009, <http://www.abs.gov.au/CDataOnline>.
ABS 2009. National Aboriginal and Torres Strait Islander Social Survey, 2008. Cat. no. 4714.0. Canberra: ABS.
ABS & AIHW (Australian Institute of Health and Welfare) 2008. The health and welfare of Australia’s Aboriginal and Torres Strait Islander peoples 2008. ABS cat. no. 4704.0. AIHW cat. no. IHW 21. Canberra: ABS.
AHURI (Australian Housing and Urban Research Institute) 2002. Do housing conditions make a difference to your health? A study of home ownership and renting in Australia. AHURI Research and Policy Bulletin 6:1–4.
AIHW (Australian Institute of Health and Welfare) 2008. Australia’s health 2008. Australia’s health no. 11. Cat. no. AUS 99. Canberra: AIHW.
AIHW 2009a. A picture of Australia’s children 2009. Cat. no. PHE 112. Canberra: AIHW.
AIHW 2009b. Indigenous housing needs 2009: a multi-measure needs model. Cat. no. HOU 214. Canberra: AIHW.
AIHW 2009c. Australian hospital statistics 2007–08. Health services series no. 33. Cat. no. HSE 71. Canberra: AIHW.
AIHW 2010a. Monitoring the impact of air pollution on asthma in Australia: a methods paper. Cat. no. ACM 18. Canberra: AIHW.
AIHW 2010b. Australia’s health 2010. Australia’s health no. 12. Cat. no. AUS 122. Canberra: AIHW.
AIHW 2010c. GRIM (General Record of Incidence of Mortality) books. Canberra: AIHW.
AIHW: Begg S, Vos T, Barker B, Stevenson C, Stanley L & Lopez A 2007. The burden of disease and injury in Australia 2003. Cat. no. PHE 82. Canberra: AIHW.
AIHW: de Looper M & Bhatia K 1999. International health—how Australia compares. ABS cat. no. 8920.0. AIHW cat. no. PHE 8. Canberra: AIHW.

64 Health and the environment: a compilation of evidence
AIHW: Henley G & Harrison J 2009. Serious injury due to land transport accidents, Australia 2006–07. Injury research and statistics series no. 53. Cat. no. INJCAT 129. Adelaide: AIHW NISU.
AIHW: Magnus P & Sadkowsky K 2006. Mortality over the twentieth century in Australia: trends and patterns in major causes of death. Mortality surveillance series no. 4. Cat. no. PHE 73. Canberra: AIHW.
AIHW & AACR (Australasian Association of Cancer Registries) 2010. Cancer in Australia: an overview, 2010. Cancer series no. 60. Cat. no. CAN 56. Canberra: AIHW.
AIHW & Cancer Australia 2008. Non-melanoma skin cancer: general practice consultations, hospitalisation and mortality. Cancer series no. 43. Cat. no. 39. Canberra: AIHW.
AIHW DSRU (Dental Statistics Research Unit) 2007a. Water fluoridation and children’s dental health: The Child Dental Health Survey, Australia 2002. Cat. no. DEN 170. Adelaide: AIHW DSRU.
AIHW DSRU 2007b. Australia’s dental generations: the National Survey of Adult Oral Health 2004–06. Cat. no. DEN 165. Canberra: AIHW.
AIHW DSRU 2009. Geographic variation in oral health and use of dental services in the Australian population 2004–06. Cat. no. DEN 188. Adelaide: AIHW DSRU.
Anderson H, Atkinson R, Peacock J, Marstin L & Konstantinou K 2004. Meta-analysis of time-series studies and panel studies of particulate matter and ozone. Copenhagen: World Health Organization.
Australian Government Treasury 2010. 2010 Intergenerational Report overview: Australia to 2050: future challenges. Canberra: Commonwealth of Australia.
Australian Human Rights Commission 2009. Social Justice Report 2008. Sydney: Australian Human Rights Commission.
Babisch W 2008. Road traffic noise and cardiovascular risk. Noise & Health 10:27–33.
Baker M, Zhang J, Howden-Chapman P, Blakely T, Saville-Smith K & Crane J 2006. Housing, Crowding and Health Study: characteristics of cohort members and their hospitalisations, February 2003 to June 2005. Wellington: Wellington School of Medicine & Health Sciences.
Bambrick H, Dear K, Woodruff R, Hanigan I & McMichael A 2008. Garnaut Climate Change Review: The impacts of climate change on three health outcomes: temperature-related mortality and hospitalisations, salmonellosis and other bacterial gastroenteritis, and population at risk from dengue. Canberra: University of Western Sydney & Australian National University.
Barbeau D, Grimsley L, White L, El-Dahr J & Lichtveld M 2010. Mold exposure and health effects following hurricanes Katrina and Rita. Annual Review of Public Health 31:2.1–2.14.
Barnett A, Dobson A, McElduff P, Salomaa V, Kuulasmaa K & Sans S 2005a. Cold periods and coronary events: an analysis of populations worldwide. Journal of Epidemiology and Community Health 59:551–7.
Barnett A, Williams G, Schwartz J, Neller A, Best T, Petroeschevsky A et al. 2005b. Air pollution and child respiratory health: a case-crossover study in Australia and New Zealand. American Journal of Respiratory and Critical Care Medicine 171:1272–8.
Health and the environment: a compilation of evidence 65
Barton H & Grant M 2006. A health map for the local human habitat. The Journal of the Royal Society for the Promotion of Health 126:252.
Basu R & Samet J 2002. Relation between elevated ambient temperature and mortality: a review of the epidemiologic evidence. Epidemiologic Reviews 24:190–202.
Belanger K, Gent J, Triche E, Bracken M & Leaderer B 2006. Association of indoor nitrogen dioxide exposure with respiratory symptoms in children with asthma. American Journal of Respiratory and Critical Care Medicine 173:297–304.
Bernstein J 2004. Health effects of air pollution. Journal of Allergy and Clinical Immunology 114:1116–23.
Bernstein J, Alexis N, Bacchus H, Bernstein I, Fritz P, Horner E et al. 2008. The health effects of nonindustrial indoor air pollution. Journal of Allergy and Clinical Immunology 121:585–91.
Better Hearing Australia 2010. Noise and hearing loss. Viewed 2 February 2010, <http://www.betterhearingsydney.org.au/content/view/46/53/>.
Berry HL, Kelly BJ, Hanigan IC, Coates Jamie H, McMichael A, Welsh JA et al. 2008. Rural mental health impacts of climate change. Canberra: Garnaut Climate Change Review.
Bi P, Parton K, Wang J & Donald K 2008. Temperature and direct effects on population health in Brisbane, 1986–1995. Journal of Environmental Health 70:48–53.
Black D, Black J, Issarayangyun T & Samuels S 2007. Aircraft noise exposure and resident’s stress and hypertension: A public health perspective for airport environmental management. Journal of Air Transport Management 13:264–76.
BoM (Bureau of Meteorology) 2007. Climate statistics for Australian locations: definitions for temperatures. Viewed 8 April 2010, <http://www.bom.gov.au/climate/cdo/about/definitionstemp.shtml>.
BoM 2010. Thermal comfort observations. Viewed 7 April 2010, <http://www.bom.gov.au/info/thermal_stress/>.
Booth A & Carroll N 2005. Overcrowding and Indigenous health in Australia. Discussion Paper No. 498. Canberra: The Australian National University.
Brandt M, Brown C, Burkhart J, Button N, Cox-Gasner J, Damon S et al. 2006. Mold prevention strategies and possible health effects in the aftermath of hurricanes and major floods. Morbidity and Mortality Weekly Report 55:1–27.
Brisbane City Council 2009. Water treatment. Viewed 20 November 2009, <http://www.brisbane.qld.gov.au/BCC:BASE::pc=PC_1427>.
Bureau of Infrastructure Transport and Regional Economics (BITRE) 2009. Australian transport statistics yearbook 2009. Canberra: BITRE.
Butterworth I 2000. The relationship between the built environment and wellbeing: a literature review. Melbourne: Victorian Health Foundation.
Caldwell K & Boyd C 2009. Coping and resilience in farming families affected by drought. Rural and remote health 9:1–10.
California Environmental Protection Agency 2005. Proposed identification of environmental tobacco smoke as a toxic air contaminant. Sacramento: California Environmental Protection Agency. Viewed 18 February 2010, <http://www.arb.ca.gov/regact/ets2006/ets2006.htm>.

66 Health and the environment: a compilation of evidence
Cameron PA, Mitra B, Fitzgerald M, Scheinkestel CD, Stripp A, Batey C et al. 2009. Black Saturday: the immediate impact of the February 2009 bushfires in Victoria, Australia. Medical Journal of Australia 191:11–6.
Cancer Council of South Australia 2008. National Sun Protection Survey 2006–07. Viewed 7 August 2009, <www.cancersa.org.au/cms_resources/media/Survey_Summary0607.pdf>.
Centers for Disease Control and Prevention 2003. Environmental public health tracking program: closing America’s environmental public health gap. Atlanta: Centers for Disease Control and Prevention.
Centers for Disease Control and Prevention 2006. Facts about benzene. Viewed 29 January 2009, <http://www.bt.cdc.gov/agent/benzene/basics/facts.asp>.
Chen L, Verrall K & Tong S 2006. Air particulate pollution due to bushfires and respiratory hospital admissions in Brisbane, Australia. International Journal of Environmental Health Research 16:181–91.
Chung J-Y, Honda Y, Hong Y-C, Pan X-C, Guo Y-L & Kim H 2009. Ambient temperature and mortality: an international study in four capital cities of East Asia. Science of the Total Environment 408:390–6.
Clancy L, Goodman P, Sinclair H & Dockery DW 2002. Effect of air-pollution control on death rates in Dublin, Ireland: an intervention study. Lancet 360:1210–14.
Coelho SG, Choi W, Brenner M, Miyamura Y, Yamaguchi Y, Wolber R et al. 2009. Short- and long-term effects of UV radiation on the pigmentation of human skin. Journal of Investigative Dermatology Symposium Proceedings 14:32–5.
Committee on Damp Indoor Spaces and Health 2004. Damp indoor spaces and health. Washington DC: The National Academies Press.
Committee on the Medical Effects of Air Pollutants 2009. Long-term exposure to air pollution: effect on mortality. Didcot: Department of Health (UK).
Connelly L & Supangan R 2006. The economic costs of road traffic crashes: Australia, states and territories. Accident Analysis & Prevention 38:1087–93.
Crawford D, Timperio A, Giles-Corti B, Ball K, Hume C, Roberts R et al. 2008. Do features of public open spaces vary according to neighbourhood socio-economic status? Health & Place 2008:889–93.
CSIRO & BoM 2010. State of the climate. Canberra: CSIRO & BoM.
CSIRO 1998. Beating the $12 billion cost Of polluted air. Media release—Ref 98/55. Canberra: Dickson.
CSIRO 2004. Do greener cities mean healthier people? ECOS Magazine 119:9–11.
CSIRO 2007. Climate change in Australia. Canberra: CSIRO.
David Lock Associates 2008. Clause 56 walkability toolkit. Viewed 24 February 2011, <http://www.dlaaust.com/downloadfiles/Walkability%20Toolkit_email.pdf>.
Deakin University 2008. Healthy parks, healthy people: the health benefits of contact with nature in a park context: a review of relevant literature. Melbourne: Deakin University.
Dean JG & Stain HJ 2010. Mental health impact for adolescents living with prolonged drought. Australian Journal of Rural Health 18:32–7.

Health and the environment: a compilation of evidence 67
Department of the Environment, Water, Heritage and the Arts (2006 Australian State of the Environment Committee) 2006. Australian State of the Environment 2006. Canberra: Commonwealth of Australia.
Department of Health and Family Services (DHFS) and AIHW 1998. National Health Priority Areas report : injury prevention and control 1997. Cat. no. PHE 3. Canberra : DHFS and AIHW.
Department of Human Services 2009. Water fluoridation: questions and answers. Viewed 16 March 2010, <http://www.health.vic.gov.au/environment/downloads/fluori_qa07.pdf#page=14>.
de Vries S, Verheij RA, Groenewegen P & P S 2003. Natural environments—healthy environments? An exploratory analysis of the relationship between greenspace and health. Environment and Planning A 35:1717–31.
Diez U, Kroeßner T, Rehwagen M, Richter M, Wetzig H, Schulz R et al. 2000. Effects of indoor painting and smoking on airway symptoms in atopy risk children in the first year of life results of the LARS-study. International Journal of Hygiene and Environmental Health 203:23–8.
Dockery A, Kendall G, Li J, Mahendran A, Ong R & Strazdins L 2010. Housing and children’s development and wellbeing: a scoping study. AHURI final report no. 149. Melbourne: Australian Housing and Urban Research Institute.
DoHA (Department of Health and Ageing) 2004. Ross River virus infection—fact sheet. Viewed 16 April 2010, <http://www.health.gov.au/internet/main/Publishing.nsf/Content/health-arbovirus-pdf-fsrossriver.htm>.
DoHA 2005. National Physical Activity Guidelines for Adults. Viewed 25 January 2010, <http://www.healthyactive.gov.au/internet/main/publishing.nsf/Content/health-pubhlth-strateg-phys-act-guidelines>.
DoHA 2006. Developmental research for national skin cancer awareness campaign. Canberra: Eureka Strategic Research.
DoHA 2007. National Environmental Health Strategy 2007–2012. Canberra: Office of Health Protection, DoHA).
DoHA 2009. Australia’s notifiable disease status, 2008: annual report of the National Notifiable Diseases Surveillance System. Communicable Diseases Intelligence (June 2009) 33: 157–222.
DSEWPC (Department of Sustainability, Environment, Water, Population and Communities) 2010. About the NPI. Viewed 24 February 2011, <http://www.npi.gov.au/npi/index.html>.
D’Souza R, Becker N, Hall G & Moodie K 2004. Does ambient temperature affect foodborne disease? Epidemiology 15:86–92.
du Toit L, Cerin E & Leslie E 2005. An account of spatially based survey methods and recruitment outcomes of the Physical Activity in Localities and Community Environments (PLACE) study. Brisbane: Cancer Prevention Research Centre, School of Population Health, The University of Queensland. Viewed 18 February 2011, <http://www.uq.edu.au/cprc/index.html?page=22862&pid=23437>.
68 Health and the environment: a compilation of evidence
Ebi K & McGregor G 2008. Climate change, tropospheric ozone and particulate matter, and health impacts. Environmental Health Perspectives 116:1449–55.
Edwards B, Gray M & Hunter B 2008. Social and economic impacts of drought on farm families and rural communities. Viewed 24 May 2010, <http://www.daff.gov.au/__data/assets/pdf_file/0006/819591/Australian_Institute_of_Family_Studies.pdf>.
Emergency Management Australia 2010. Emergency Management Australia Disasters Database. Attorney-General’s Department. Viewed March 3 2010, <http://www.ema.gov.au/ema/emaDisasters.nsf>.
enHealth Council 2004. The health effects of environmental noise—other than hearing loss. Canberra: EnHealth Council.
Environment Australia 2001. State of knowledge report: air toxics and indoor air quality in Australia. Viewed 11 February 2010, <http://www.environment.gov.au/atmosphere/airquality/indoorair/index.html>.
Environment Sustainability and Health ACT 2010. Climate change and vectorborne diseases. Viewed 19 April 2010, <http://www.saharov.com/eshact/Research/ClimateChangeVectorBorneDiseases/tabid/128/Default.aspx>.
EPA (Environmental Protection Agency) Victoria 2007. EPA noise surveys 2007. Melbourne: EPA Victoria.
Evans G, Bullinger M & Hygge S 1998. Chronic noise exposure and physiological response: a prospective study of children living under environmental stress. Psychological Science 9:75–7.
Evans G, Hygge S & Bullinger M 1995. Noise and psychological stress. Psychological Science 6:333–8.
Fewtrell L & Kay D 2008. An attempt to quantify the health impacts of flooding in the UK using an urban case study. Public Health 122:446–51.
Fisher G, Kjellstrom T, Kingham S, Hales S & Shrestha R 2007. Health and air pollution in New Zealand: main report. Wellington: Health Research Council of New Zealand, Ministry for the Environment and Ministry of Transport.
Fisk W, Lei-Gomez Q & Mendell M 2007. Meta-analyses of the associations of respiratory health effects with dampness and mold in homes. Indoor Air Journal 17:284–95.
Flood M & Barbato C 2005. Off to work: commuting in Australia. Canberra: The Australia Institute.
Frank L, Andresen M & Schmid T 2004. Obesity relationships with community design, physical activity, and time spent in cars. American Journal of Preventive Medicine 27:87–96.
Frank L, Saelens B, Powell K & Chapman J 2007. Stepping towards causation: do built environments or neighborhood and travel preferences explain physical activity, driving, and obesity? Social Science & Medicine 65:1898–914.
Frank L, Schmid T, Sallis J, Chapman J & Saelens B 2005. Linking objectively measured physical activity with objectively measured urban form findings from SMARTRAQ. American Journal of Preventive Medicine 28:117–25.
Health and the environment: a compilation of evidence 69
Franklin R, Scarr J & Pearn J 2010. Reducing drowning deaths: the continued challenge of immersion fatalities in Australia. The Medical Journal of Australia 192:123–6.
FSANZ (Food Standards Australian and New Zealand) 2008. The 22nd Australian Total Diet Study. Canberra: FSANZ.
Fuentes-Leonarte V, Tenias J & Ballester F 2009. Levels of pollutants in indoor air and respiratory health in preschool children: a systematic review. Pediatric Pulmonology 44:231–43.
Gallagher R & Lee T 2006. Adverse effects of ultraviolet radiation: a brief review. Progress in Biophysics and Molecular Biology 92:119–31.
Garnaut R 2008. The Garnaut Climate Change Review. Canberra: Cambridge University Press.
Garrett M, Hooper M, Hooper B & Abramson M 1998. Respiratory symptoms in children and indoor exposure to nitrogen dioxide and gas stoves. American Journal of Respiratory and Critical Care Medicine 158:891–5.
Gilbert D & Black M 2000. Developing policies and risk management systems to ensure healthy indoor air quality. In: Department of Health and Aged Care (ed.). Indoor air quality—a report on health impacts and management options. Canberra: Department of Health and Aged Care.
Giles-Corti B, Broomhall MH, Knuiman M, Collins C, Douglas K, Ng K et al. 2005. Increasing walking: how important is distance to, attractiveness, and size of public open space? American Journal of Preventive Medicine 28:169–76.
Giles-Corti B, Macintyre S, Clarkson J, Pikora T & Donovan R 2003. Environmental and lifestyle factors associated with overweight and obesity in Perth, Australia. American Journal of Health Promotion 2003:93–102.
Gilmour M, Jaakkola M, London S, Nel A & Rogers C 2006. How exposure to environmental tobacco smoke, outdoor air pollutants, and increased pollen burdens influences the incidence of asthma. Environmental Health Perspectives 114:627–33.
Goldberg MS, Giannetti N, Burnett RT, Mayo NE, Valois M-F & Brophy JM 2008. Shortness of breath at night and health status in congestive heart failure: effects of environmental conditions and health-related and dietary factors. Environmental Research 109:166–74.
Grahn P & Stigsdotter UA 2003. Landscape planning and stress. Urban Forestry & Urban Greening 2:1–18.
Hales S, Salmond C, Town GI, Kjellstrom T & Woodward A 2000. Daily mortality in relation to weather and air pollution in Christchurch, New Zealand. Australian and New Zealand Journal of Public Health 24:89–91.
Hall G, Kirk M, Becker N, Gregory J, Unicomb L, Millard G et al. 2005. Estimating foodborne gastroenteritis, Australia. Emerging Infectious Disease 11:1257–64.
Hansen C, Neller A, Williams G & Simpson R 2007. Low levels of ambient air pollution during pregnancy and fetal growth among term neonates in Brisbane, Australia. Environmental Research 103:383–9.
Health Scotland, greenspace scotland, Scottish Natural Heritage & Institute of Occupational Medicine 2008. Health impact assessment of greenspace: a guide. Stirling: Health Scotland.

70 Health and the environment: a compilation of evidence
Healthy Spaces and Places 2009a. Healthy Places and Spaces: about us. Viewed 24 February 2011, <http://www.healthyplaces.org.au/site/about.php>.
Healthy Places and Spaces 2009b. Design principles: mixed land use. Viewed 25 February 2010, <http://www.healthyplaces.org.au/site/mixed_land_use.php>.
Holdren J, Tao S & Carpenter DO 2008. Environment and health in the twenty-first century. Annals of the New York Academy of Sciences 1140:1–21.
Hu W, Mengersen K, McMichael A & Tong S 2008. Temperature, air pollution and total mortality during summers in Sydney, 1994–2004. International Journal of Biometeorology 52:689–96.
Hygge S, Evans G & Bullinger M 2002. A prospective study of some effects of aircraft noise on cognitive performance in school children. Psychological Science 13:469–74.
IARC (International Agency for Research on Cancer ) 2004. Tobacco smoke and involuntary smoking. Volume 83. Lyon: IARC (WHO).
IARC 2006a. Inorganic and organic lead compounds. Volume 87. Lyon: IARC (WHO).
IARC 2006b. Monographs on the evaluation of carcinogenic risks to humans: formaldehyde, 2-butoxyethanol and 1-tert-butoxypropan-2-ol. Lyon: IARC (WHO).
Ivers LC & Ryan ET 2006. Infectious diseases of severe weather-related and flood-related natural disasters. Current Opinion in Infectious Diseases 19:408–14.
Johnston F 2009. Bushfires and human health in a changing environment. Australian Family Physician 38:720–4.
Johnston F, Kavanagh A, Bowmann D & Scott R 2002. Exposure to bushfire smoke and asthma: an ecological study. Medical Journal of Australia 176:535–8.
Jones A, Hillsdon M & Coombes E 2009. Greenspace access, use, and physical activity: understanding the effects of area deprivation. Preventive Medicine 49:500–5.
Kalis MA, Miller MD & Wilson RJ 2009. Public health and drought. Journal of Environmental Health 72:10–1.
Kolbe A & Gilchrist KL 2009. An extreme bushfire smoke pollution event: health impacts and public health challenges. NSW Public Health Bulletin 20:19–23.
Kovats R, Edwards S, Hajat S, Armstrong B, Ebi K & Menne B 2004. The effect of temperature on food poisoning: a time-series analysis of salmonellosis in ten European countries. Epidemiology and Infection 132:443–53.
Kulkarni N & Gridd J 2008. Effect of air pollution on children. Paediatrics and Child Health 18:238–43.
Lagerlund M, Dixon HG, Simpson JA, Spittal M, Taylor HR & Dobbinson SJ 2006. Observed use of sunglasses in public outdoor settings around Melbourne, Australia: 1993 to 2002. Preventive Medicine 42:291–6.
Laming A 2011. Our woes are just beginning. Sydney Morning Herald. 13 January. Viewed 21 January 2011, <http://www.smh.com.au/opinion/society-and-culture/our-woes-are-just-beginning-20110112-19o66.html>.
Health and the environment: a compilation of evidence 71
Larrieu S, Lefranc A, Gaelle G, Chatignoux E, Couvy F, Jouves B et al. 2009. Are the short-term effects of air pollution restricted to cardiorespiratory diseases? American Journal of Epidemiology 169:1201–8.
Leslie E, Coffee N, Frank L, Owen N, Bauman A & Hugo G 2007. Walkability of local communities: using geographic information systems to objectively assess relevant environmental attributes. Health & Place 13:111–22.
Lin S, Luo M, Walker RJ, Liu X, Hwang S-A & Chinery R 2009. Extreme high temperatures and hospital admissions for respiratory and cardiovascular diseases. Epidemiology 20:738–46.
Liu J, Ren A, Yang L, Gao J, Pei L, Ye R et al. 2010. Urinary tract abnormalities in Chinese rural children who consumed melamine-contaminated dairy products: a population-based screening and follow-up study. Canadian Medical Association Journal 182:439–43.
Lopez-Zetina J, Lee H & Friis R 2006. The link between obesity and the built environment. Evidence from an ecological analysis of obesity and vehicle miles of travel in California. Health & Place 12:656–64.
Loughnan M, Nicholls N & Tapper N 2010. When the heat is on: threshold temperatures for AMI admissions to hospital in Melbourne Australia. Applied Geography 30:63–9.
Lucas R & Ponsonby A 2002. Ultraviolet radiation and health: friend and foe. Medical Journal of Australia 177:594–8.
Lucas R, McMichael A, Armstrong B & Smith W 2008. Estimating the global disease burden due to ultraviolet radiation exposure. International Journal of Epidemiology 37:654–67.
Lucas R, McMichael T, Smith W & Armstrong B 2006. Solar ultraviolet radiation: global burden of disease from solar ultraviolet radiation. Geneva: World Health Organization.
Maas J, Verheij R, de Vries S, Spreeuwenberg P, Groenewegen P & Schellevis F 2009. Morbidity is related to a green living environment. Journal of Epidemiology & Community Health 63:967–73.
Maas J, Verheij R, Groenewegen P, de Vries S & Spreeuwenberg P 2006. Green space, urbanity, and health: how strong is the relation? Journal of Epidemiology and Community Health 60:587–92.
MacKie R 2006. Long-term health risk to the skin of ultraviolet radiation. Progress in Biophysics and Molecular Biology 92:92–6.
Mackie, IJ 1999. Patterns of drowning in Australia, 1992–1997. Medical Journal of Australia 171:587–90.
Marks G, Colquhoun J, Girgis S, Koski M, Treloar A, Hansen P et al. 2001. Thunderstorm outflows preceding epidemics of asthma during spring and summer. Thorax 56:468–71.
Marmot M, Allen J, Goldblatt P, Boyce T, McNeish D, Grady M et al. 2010. Strategic review of health inequalities in England post-2010 (Marmot Review). London: University College London.
Matheson M, Stansfeld S & Haines M 2003. The effects of chronic aircraft noise exposure on children’s cognition and health: 3 field studies. Noise & Health. 5:31–40.
72 Health and the environment: a compilation of evidence
McDermott BM & Palmer LJ 1999. Post-disaster service provision following proactive identification of children with emotional distress and depression. Australian and New Zealand Journal of Psychiatry 33:855–63.
Miedema H & Vos H 1999. Demographic and attitudinal factors that modify annoyance from transportation noise. Journal of the Acoustical Society of America 105:3336–44.
Mitchell R & Popham F 2008. Effect of exposure to natural environment on health inequalities: an observational population study. Lancet 372:1655–60.
Morgan G, Sheppeard V, Khalaj B, Ayyar A, Lincoln D, Jalaludin B et al. 2010. Effects of bushfire smoke on daily mortality and hospital admissions in Sydney, Australia. Epidemiology 21:47–55.
Morrissey S & Reser J 2007. Natural disasters, climate change and mental health considerations for rural Australia. Australian Journal of Rural Health 15:120–5.
Mudarri D & Fisk W 2007. Public health and economic impact of dampness and mold. Indoor Air 17:226–35.
Muzet A 2007. Environmental noise, sleep and health. Sleep Medicine Reviews 2007:135–42.
National Cancer Institute 1999. Monograph 10: health effects of exposure to environmental tobacco smoke. California: United States Department of Health and Human Services.
National Cancer Institute 2009. Formaldehyde and cancer risk. Viewed 18 February 2010, <http://www.cancer.gov/cancertopics/factsheet/Risk/formaldehyde>.
National Heart Foundation of Australia Victorian Division 2004. Healthy by design: a planners’ guide to environments for active living. Melbourne: National Heart Foundation of Australia (Victorian Division).
National Water Commission 2009. National performance report 2007–08: urban water utilities. Canberra: National Water Commission.
NHMRC (National Health and Medical Research Council) 2004. Australian Drinking Water Guidelines. Canberra: NHMRC.
NHMRC 2007. A systematic review of the efficacy and safety of fluoridation. Canberra: NHMRC.
Nicholls N, Butler CD & Hanigan I 2006. Inter-annual rainfall variations and suicide in New South Wales, Australia, 1964–2001. International Journal of Biometeorology 50:139–43.
Nitschke M, Tucker GR & Bi P 2007. Morbidity and mortality during heatwaves in metropolitan Adelaide. Medical Journal of Australia 187:662–5.
NPHP (National Public Health Partnership) 1998. Public health in Australia—the public health landscape, person, society, environment. Melbourne: NPHP.
NSW DEC (NSW Department of Environment and Conservation) 2004. Neighbourhood noise: survey results. Sydney: DEC.
NSW DECCW (Department of Environment, Climate Change and Water) 2011. Air quality index (AQI) values —updated hourly. Viewed 24 February 2011, <http://www.environment.nsw.gov.au/AQMS/aqi.htm>.

Health and the environment: a compilation of evidence 73
NSW Government Human Services 2009. Lead Paint—REP0950A. Viewed 1 March 2010, <http://www.housing.nsw.gov.au/Forms+Policies+and+Fact+Sheets/Policies/Lead+Paint+-+REP0950A.htm>.
O’Neil MS & Ebi KL 2009. Temperature extremes and health: impacts of climate variability and change in the United States. Journal of Occupational and Environmental Medicine 51:13–25.
Owen N, Cerin E, Leslie E, duToit L, Coffee N, Frank L et al. 2007. Neighborhood walkability and the walking behavior of Australian adults. American Journal of Preventive Medicine 33:387-95.
OzFoodNet Working Group 2008. Monitoring the incidence and causes of diseases potentially transmitted by food in Australia: annual report of the OzFoodNet Network, 2007. Communicable Diseases Intelligence 32:400–24.
Parliament of New South Wales 2001. Report on sick building syndrome. Report no. 52/07. Sydney: Standing Committee on Public Works.
Pearn J, Nixon J, Franklin R & Wallis B 2008. Safety legislation, public health policy and drowning prevention. International Journal of Injury Control and Safety Promotion 15:122–3.
Pilotto LS, Nitschke M, Smith BJ, Pisaniello D, Ruffin RE, McElroy HJ et al. 2004. Randomized controlled trial of unflued gas heater replacement on respiratory health of asthmatic schoolchildren. International Journal of Epidemiology 33:208–11.
Prüss-Üstün A & Corvalán C 2006. Preventing disease through healthy environments: towards an estimate of the environmental burden of disease. Geneva: World Health Organization.
Pulimood T, Corden J, Bryden C, Sharples L & Nasser S 2007. Epidemic asthma and the role of fungal mold, Alternaria alternata. Journal of Allergy and Clinical Immunology 120:610–7.
Queensland Health 2010. Dengue in north Queensland. Viewed 20 January 2011, <http://www.health.qld.gov.au/dengue/dengue_fever/australia.asp>.
Raphael B, Taylor M, Stevens G, Barr M, Gorringe M & Agho K 2009. Factors associated with population risk perceptions of continuing drought in Australia. Australian Journal of Rural Health 17:330–7.
Ren C & Tong S 2006. Temperature modifies the health effects of particulate matter in Brisbane, Australia. International Journal of Biometeorology 51:87–96.
Ritz S 2009. Air pollution as a potential contributor to the ‘epidemic’ of autoimmune disease. Medical Hypotheses 74:110–7.
Rumchev K, Spickett J, Bulsara M, Phillips M & Stick S 2004. Association of domestic exposure to volatile organic compounds with asthma in young children. Thorax 59:746–51.
Rushton L & Elliott P 2003. Evaluating evidence on environmental health risks. British Medical Bulletin 68:113–28.
Saelens B & Handy S 2008. Built environment correlates of walking: a review. Medicine and Science in Sports and Exercise 40:S550–S566.
Saelens B, Sallis J & Frank L 2003. Environmental correlates of walking and cycling: findings from the transportation, urban design, and planning literatures. Annuals of Behavioural Medicine 25:80–91.

74 Health and the environment: a compilation of evidence
Safe Work Australia 2010. Occupational noise-induced hearing loss in Australia: overcoming barriers to effective noise control and hearing loss prevention. Canberra: Attorney General’s Department.
SafeWork SA 2000. Sick building syndrome. Viewed 17 February 2010, <http://www.safework.sa.gov.au/show_page.jsp?id=2315>.
SafeWork SA 2002. Asbestos used in housing construction. Viewed 1 March 2010, <http://www.safework.sa.gov.au/show_page.jsp?id=2974>.
Silburn S, Zubrick S, de Maio J, Shepherd C, Griffin J, Mitrou F et al. 2006. The Western Australian Aboriginal Child Health Survey: strengthening the capacity of Aboriginal children. Perth: Curtin University of Technology.
Simpson R, Williams G, Petroeschevsky A, Best T, Morgan G, Denison L et al. 2005. The short-term effects of air pollution on daily mortality in four Australian cities. Australian and New Zealand Journal of Public Health 29:205–12.
Staniford AK, Dollard MF & Guerin B 2009. Stress and help-seeking for drought-stricken citrus growers in the Riverland of South Australia. Australian Journal of Rural Health 17:147–54.
State Government of Victoria DoHS (Department of Human Services) 2009. January 2009 heatwave in Victoria: an assessment of health impacts. Melbourne: State of Victoria.
Stevenson M, Rimajova M, Edgecombe D & Vickery K 2003. Childhood drowning: barriers surrounding private swimming pools. Pediatrics 111:e115–e119.
Sugiyama T, Leslie E, Giles-Corti B & Owen N 2008. Associations of neighbourhood greenness with physical and mental health: do walking, social coherence and local social interaction explain the relationships? Journal of Epidemiolgy and Community Health 62(5):e9.
Tham R, Erbas B, Akram M, Dennekamp M & Abramson MJ 2009. The impact of smoke on respiratory hospital outcomes during the 2002–2003 bushfire season, Victoria, Australia. Respirology 14:69–75.
Thompson D & Rivara F 1998. Pool fencing for preventing drowning in children. Cochrane Database of Systematic Reviews 1.
Tong S, Ren C & Becker N 2010. Excess deaths during the 2004 heatwave in Brisbane, Australia. International Journal of Biometeorology 54:393–400.
Townsend M & Weerasuriya R 2010. Beyond blue to green: the benefits of contact with nature for mental health and well-being. Melbourne: Beyond Blue Limited.
United States (US) Environmental Protection Agency 1992. Respiratory health effects of passive smoking. EPA/600/6–90/006F. Washington: US Environmental Protection Agency, Office of Research and Development, Office of Health and Environmental Assessment.
US Environmental Protection Agency 2008. Indoor air facts no. 4 (revised): sick building syndrome. Viewed 17 February 2010, <http://www.epa.gov/iaq/pubs/sbs.html>.
United Kingdom Office of the Deputy Prime Minister 2004. The impact of overcrowding on health and education: a review of evidence and literature. London: Office of the Deputy Prime Minister.
Health and the environment: a compilation of evidence 75
van Lieshout M, Kovats RS, Livermore MTJ & Martens P 2004. Climate change and malaria: analysis of the SRES climate and socio-economic scenarios. Global Environmental Change 14:87–99.
van Strein R, Gent J, Belanger K, Triche E, Bracken M & Leaderer B 2004. Association of NO2 and nitrous acid and respiratory symptoms in the first year of life. Epidemiology 2004:471–8.
Vaneckova P, Beggs PJ, de Dear RJ & McCracken KW 2008. Effect of temperature on mortality during the six warmer months in Sydney, Australia, between 1993 and 2004. Environmental Research 108:361–9.
Victorian Government Health Information 2010. Barmah Forest virus disease. Viewed 16 April 2010, <http://www.health.vic.gov.au/ideas/bluebook/barmah_forest>.
Wang XY, Barnett AG, Hu W & Tong S 2009. Temperature variation and emergency hospital admissions for stroke in Brisbane, Australia, 1996–2005. International Journal of Biometeorology 53:535–41.
Waters A 2001. Do housing conditions impact on health inequalities between Australia’s rich and poor? Canberra: Australian Housing and Urban Research Institute.
Watson A 2004. Indoor air quality in industrial nations. In: Cleveland CJ (ed.). Encyclopedia of Energy. New York: Elsevier, 351–63.
Weerasinghe D, MacIntyre C & Rubin G 2002. Seasonality of coronary artery deaths in New South Wales, Australia. Heart 88:30–4.
Wen LM, Orr N, Millet C & Rissel C 2006. Driving to work and overweight and obesity: findings from the 2003 New South Wales Health Survey, Australia. International Journal of Obesity 30:782–6.
Western Australia Environmental Health Directorate: Mullan N, Ferguson C & Paech D 2008. Environmental health surveillance: a feasbility study. Perth: Western Australian Department of Health.
WHO (World Health Organization) 1999. Guidelines for community noise. Geneva: WHO.
WHO 2004. World report on road traffic injury prevention: summary. Geneva: WHO.
WHO 2008a. World Health Day 2008: protecting health from climate change. Viewed 24 February 2011, <http://www.who.int/world-health-day/previous/2008/en/index.html>.
WHO 2008b. Expert meeting to review toxicological aspects of melamine and cyanuric acid, 1–4 December 2008. Ottowa: WHO.
WHO 2009a. World malaria report. Geneva: WHO.
WHO 2009b. Global status report on road safety. Geneva: WHO.
WHO 2010a. Food safety and foodborne illness. Viewed 15 April 2010, <http://www.who.int/mediacentre/factsheets/fs237/en/>.
WHO 2010b. Chemical risks in food. Viewed 15 April 2010, <http://www.who.int/foodsafety/chem/en/>.
WHO 2010c. Questions and answers on melamine. Viewed 16 April 2010, <http://www.who.int/csr/media/faq/QAmelamine/en/index.html>.

76 Health and the environment: a compilation of evidence
WHO 2010d. Water for health: WHO guidelines for drinking water quality. Viewed 28 September 2010, <www.who.int/water_sanitation_health/WHS_WWD2010_guidelines_2010_6_en.pdf>.
WHO 2010e. World Health Day 2010: urbanization and health. Viewed 24 February 2011, <http://www.who.int/world-health-day/2010/en/index.html>.
Young C 2009. Solar ultraviolet radiation and skin cancer. Occupational Medicine 59:82–8.
Yzermans CJ, Donker GA, Kerssens JJ, Dirkzwager AJE, Soeteman RJH & ten Veen PMH 2005. Health problems of victims before and after disaster: a longitudinal study in general practice. International Journal of Epidemiology 34:820–6.
Zubrick S, Silburn S, Lawrence D, Mitrou F, Dalby R, Blair E et al. 2005. The Western Australian Aboriginal Child Health Survey: the social and emotional wellbeing of Aboriginal children and young people. Perth: Curtin University of Technology and Telethon Institute for Child Health Research.
Health and the environment: a compilation of evidence 77
List of tables
Table 1.1: Environmental factors chosen for review ................................................................................. 5
Table 3.1: Outbreaks of foodborne illness reported by OzFoodNet, by state and territory, 2007 .............................................................................................................................................. 21
Table 3.2: Categories of food implicated in foodborne disease outbreaks, Australia, 2007 .............. 22
Table 3.3: National notifications of vectorborne diseases by state and territory, 2007 ...................... 26
Table 3.4: National notifications of vectorborne diseases, Australia, 2002–07 .................................... 26
Table 4.1: Method of travel to work, employed persons who used one method of travel, 1981–2006 (per cent) .................................................................................................................. 42
Table 4.2: Noise exposure and level of annoyance, Victoria, 1986 and 2006 (per cent) ..................... 49
Table 4.3: Proportion of households which are overcrowded, by tenure type and state and territory, 2006 (per cent) .................................................................................................... 52
Table 4.4: Condition of permanent dwellings in Indigenous communities by remoteness, 2006 (per cent) ............................................................................................................................ 55
Table 4.5: Hospitalisations that reported a home injury as the cause, by ICD-10-AM groupings, all hospitals, Australia, 2007–08 ........................................................................... 57
Table 4.6: Deaths with an external cause resulting from home injury, by ICD-10 grouping, Australia, 2007 ............................................................................................................................ 58
List of figures
Figure 1.1: A conceptual framework for the determinants of health and wellbeing ............................. 1
Figure 3.1: Reported physical and mental health status by drought condition, Australia, 2007 ....... 16
Figure 3.2: Relative risk of death per unit increase in pollutant, pooled estimates from Brisbane, Melbourne, Perth and Sydney during 1996–99 .................................................... 30
Figure 4.1: Smoking status of households with children aged 0–14 years, 1995, 1998, 2001, 2004, 2007 .................................................................................................................................... 36
Figure 4.2: Proportion of population aged 15 years or older who walked in the last week, 2007–08 ........................................................................................................................................ 39
Figure 4.3: Trends in death rates from motor vehicle accidents, Australia, 1924–2007 ....................... 41
Figure 4.4: Year water fluoridation commenced in Australian capital cities and the approximate proportion of each state/territory population receiving optimally-fluoridated water in January 2009 ......................................................................... 62
Figure 4.5: Decayed, missing and filled deciduous teeth of 5- and 6-year-old children by fluoride concentration in the water (in parts per million or ppm) and state/territory of residence, 2002 ............................................................................................. 62

78 Health and the environment: a compilation of evidence
List of boxes
Box 1.1: Australia’s environment at a glance .......................................................................................... 2
Box 2.1: Terminology ................................................................................................................................. 9
Box 3.1: Recent initiatives regarding the natural environment and health ...................................... 10
Box 3.2: Heat wave, January 2009, Victoria (Australia) ....................................................................... 13
Box 3.3: Black Saturday, February 2009, Victoria (Australia) ............................................................. 15
Box 3.4: Melamine contamination—2008 milk scandal (China) ......................................................... 23
Box 3.5: Coal bans and air pollution in Dublin (Ireland) .................................................................... 28
Box 4.1: Recent initiatives regarding the built environment and health ........................................... 31
Box 4.2: What is sick building syndrome? ............................................................................................ 33
Box 4.3: Walkability in practice .............................................................................................................. 39
Box 4.4: Inequalities and the provision of green space ....................................................................... 45
Box 4.5: The Munich Airport study (Germany) ................................................................................... 48
Box 4.6: Drowning in swimming pools ................................................................................................. 59