
A Compensation and Benefits Survey of and for Nonprofits in...
186
A Compensation and Benefits Survey of and for Nonprofits in Massachusetts, Rhode Island and Adjoining Communities 2014
Transcript of A Compensation and Benefits Survey of and for Nonprofits in...

A Compensation and Benefits Survey of and for Nonprofits inMassachusetts, Rhode Island and Adjoining Communities 2014

Valuing Our Nonprofit Workforce 2014: A Compensation and Benefits Survey of and for Nonprofits in Massachusetts, Rhode Island and Adjoining Communities
Copyright © 2014 by Third Sector New England, Bob Orser and Rita Haronian. All rights reserved. Published in the United States by Bob Orser and Rita Haronian, Nonprofit Compensation Associates. No portion of this survey may be reproduced in any form without written permission from the publishers. Third Sector New England Nonprofit Compensation Associates NonProfit Center P.O. Box 10737 89 South Street, Suite 700 Oakland, CA 94610 Boston, MA 02111-2670 510.645.1005/phone 617.523.6565/phone www.nonprofitcomp.com 617.523.2070/fax [email protected] www.tsne.org [email protected] This survey has been produced by Nonprofit Compensation Associates using FAIRPAY, a nonprofit salary and benefits model and software. Based on over 50 years of combined experience in conducting nonprofit salary and benefits surveys, this stand-alone application, in conjunction with a specially formatted questionnaire, allows nonprofit organizations and associations to publish a survey with accurate and detailed data for their local community or constituency. Rodney Byrd, Human Resources Manager served as TSNE’s Project Manager for this survey, working hand in hand with the survey partner organizations and with Fairpay to coordinate survey design, distribution, collection, analysis and production of this final report. Lyn Freundlich, TSNE’s Director of Administration and Human Resources teamed with Rodney to provide data analysis. Sandy St. Louis, TSNE Director of Strategic Communications and Marketing and Ning Yuan, TSNE Online Communications Specialist provided expertise in the presentation and communications of the survey results including the PDF survey report and the new searchable report database.

Dedication In 2010 Third Sector New England worked with Nonprofits Compensation Partners on our first Valuing Our Nonprofit Workforce survey report in 2010. We embarked on this effort to compile a resource for nonprofits to help them assess their own compensation practices and policies and compare them to others from different types of organizations. We firmly believe that fair wages and equity are the keys to keeping our workforce productive and thriving. A dedicated workforce is a critical element of successful organizations. And as nonprofits are asked to address increasingly pressing issues, success is more important than ever. Treating employees fairly and with respect, is consistent with Third Sector New England’s values, commitments and practices as an employer of 40 staff in our Boston offices and over 370 project staff in 28 states across the country. We also share what we have learned through training, consulting and disseminating knowledge, like this compensation report, to our colleagues throughout the nonprofit sector. We dedicate this report to all of our colleagues and especially the hard-working, committed, passionate members of the nonprofit workforce represented in this study.
Acknowledgements Thanks! Many people contributed to the release of this, our second compensation survey of nonprofit organizations in Massachusetts and adjoining communities. We are thrilled to add a report of benefits practices in nonprofits and a searchable database of the 2010 and 2014 results, this time around. We are deeply grateful for the combined efforts of our survey partners, which made it possible for us to provide such relevant, critically important data to you. We especially thank our funding partners. Through their generosity, we are able to produce and to provide this report to you free of charge, once again. We also want to thank the staff from the 250 reporting organizations (see Appendix A) who generously gave their time and effort to report on their organizations’ compensation and benefits practices, to the benefit of all members of our nonprofit workforce. Rodney Byrd Jonathan Spack Survey Project Manager Executive Director

Major Funding Partners
Barr Foundation Stefan Lanfer Casner & Edwards, LLP Robert E. Cowden III, Anita Lichtblau, Sandy Tarrant
Greater Worcester Community Foundation Gail Randall, Ann Lisi
Funding Partners Associated Grant Makers (Jeff Poulos, Allistair Mallillin) Berkshire Chamber of Commerce (Kathleen Quinn) Berkshire Health Systems (Ruth Blodgett, Arthur Milano) Berkshire Taconic Community Foundation (Jennifer Dowley) Berkshire United Way (Kristine Hazzard) Hillcrest Educational Centers, Inc. (Jerry Burke, Richard J. Belair) Massachusetts Council of Human Service Providers (Michael Weekes, Lore Stevens) Supporting Partners Cape Cod Foundation (Kristin O’Malley) Community Foundation of Western Massachusetts (Donna Roseman David) Essex County Community Foundation (Julie Bishop) Human Service Forum (Kathleen Dowd) Massachusetts Cultural Council (David T. Slatery) Massachusetts Nonprofit Network (Rick Jakious) United Way of Pioneer Valley (Sylvia deHaas-Phillips) United Way of Rhode Island (Lyn Corwin) We extend a special ‘Thank You’ to Employers Association of the NorthEast, The Boston Foundation and The Rhode Island Foundation for their assistance with this important project.

Table of Contents
Valuing Our Nonprofit Workforce 2014 Page v
Preface xi
I Guide to Using the Survey Report
Matching Jobs 1 Determining/Comparing Compensation 2 Terminology and Abbreviations 2 Data Confidentiality 4 Positions Reported in the Survey 5 Additional Information 5
II Survey Highlights 7 III Participant Overview
Effective Date 9 Participants 9 Fields of Service 9 Budgets 10 Using Budget Data to Evaluate Pay 11 Staff Size 12 Employee Turnover 14 Supervisory Responsibility 15 Geographic Location 15
IV Compensation and Benefits Practices
Compensation Practices 17 Salary Increase Budgets 17 Salary Increase Practices 17 Salary Grades and Ranges 18 Incentive Pay or Bonuses 18 On-Call Practices 18 Practices for Dealing with Extensive Overtime by Exempt Staff 19 Evening/Night Shift Differentials 19 Premium for Bilingual Skills 20
Employment Practices 21 Full-Time Workweek 21 Introductory Period 21 Performance Reviews 22 Union Contracts 22 Miscellaneous Employee Benefits 23 Time-Off Practices 24

Table of Contents
Page vi © 2014 Third Sector New England & Nonprofit Compensation Associates
Insurance & Retirement Benefits 28
Insurance Coverage Offered 28 Waiting Period for New Employees 29 Part-Time Employee Benefits 29 Domestic Partner Benefits 29 Employer Contribution – HMO Insurance (Traditional) 30 Employer Contribution – PPO Insurance (Traditional) 31 Employer Contribution – POS Insurance (Traditional) 32 Employer Contribution – Dental Care (Traditional) 33 Employer Contribution – Vision Care (Traditional) 34 Employer Contribution – Life Insurance Benefits (Traditional) 35 Employer Contribution – Short-Term Disability (Traditional) 35 Employer Contribution – Long-Term Disability (Traditional) 36 Employer Contribution – Long-Term Care (Traditional) 36 Voluntary Supplemental Plans (Traditional) 36 Section 125 Plans 37 Special Insurance-Related Accounts 38 Retirement Benefits 39 Retirement Benefits—Funding 40 Retirement Benefits—Contributions 40
Executive Director/CEO Profile 41 Employment Contract 41 Gender 41 Gender and Compensation 41 Education and Compensation 42 Time in Position and Compensation 42 Setting Compensation of the Executive Director/CEO 43 Executive Director/CEO Search 43 Additional Benefits Provided to the Executive Director/CEO 43
V Compensation by Position
Executive 46 Executive Director/Chief Executive Officer 46 Associate Director/Chief Operating Officer 47 Director, Program(s) 48
Administrative 49
Director, Administration 49 Regional Manager/Center Manager 50 Office Manager 51 Executive Assistant 52 Administrative Assistant, Senior Level 53 Administrative Assistant, Intermediate Level 54 Administrative Assistant, Junior Level 55 Receptionist 56
Table of Contents
Valuing Our Nonprofit Workforce 2014 Page vii
Accounting/Finance 57
Chief Financial Officer 57 Controller 58 Accounting Manager 59 Accounting Supervisor 60 Senior Accountant 61 Staff Accountant 62 Accounting Clerk 63
Community Activism and Advocacy 64
Grass Roots Program Manager 64 Grass Roots Activist/Advocate 64 Lead Organizer 65 Organizer 65 Community Liaison 66
Cultural, Artistic, Performing Arts 67
Artistic Director 67 Curator 67 Instructor 68 Production Manager/Coordinator 68
Development 69
Director, Development 69 Development Manager 70 Development Manager, Annual Giving 71 Development Manager, Major Gifts 71 Grant Writer, All Types of Funding 72 Special Events Coordinator 73 Development Associate 74
Education and Recreation 75
Director, Education 75 Outside of School Program Manager 76 Educator or Teacher, Adult Education 77 Teacher, K-12 78 Teacher, Pre-School 79 Teaching Assistant, K-12 80 Teaching Assistant, Pre-School 81 Child Care Assistant 82 Lifeguard/Swim Instructor 82 Recreation or Activity Leader, Children or Youth 83 Recreation or Activity Leader, Adults 84 Fitness Instructor 84

Table of Contents
Page viii © 2014 Third Sector New England & Nonprofit Compensation Associates
Employment/Work Training 85
Job Developer 85 Vocational Counselor 86 Job Coach 87
Food, Food Service and Food Bank 88
Food Service Manager/Supervisor 88 Nutritionist/Dietician 89 Chef 89 Cook 90 Food Service Assistant/Worker 91
Government Affairs, Legislative Advocacy and Policy 92
Director or Manager, Government Affairs 92 Director or Manager, Policy 92
Housing and Residential Programs and Services 93
Director, Housing or Residential Services 93 Manager, Housing or Residential Services 94 Coordinator, Housing or Residential Services 95 Director, Property Management 96 Property Manager 96 Shelter Manager/Supervisor 97 Program Director: Housing/Homelessness Prevention 97 Program Manager: Housing/Homelessness Prevention 98 Housing Case Manager 98 Housing Advocate 99
Human Resources 100
Director, Human Resources 100 Human Resources Manager 101 Human Resources Representative/Specialist 102 Human Resources Assistant 103
Information Technology 104
Director, Information Technology Services 104 Information Technology Manager 105 Database Administrator 106 Network Technician 107 Personal Computer Technician 108 Data Entry Operator 109 Web Site Developer 110 Accidental Techie 110

Table of Contents
Valuing Our Nonprofit Workforce 2014 Page ix
Legal Services 111
Legal Aid Attorney 111 Legal Secretary/Assistant 111
Maintenance and Grounds 112
Facilities Manager 112 Security Guard/Officer 113 Maintenance Technician/Specialist 114 Driver 115 Janitor/Custodian 116
Medical and Clinic Services 117
Director, Medical Services 117 Clinic Director 118 Director, Nursing 119 Registered Nurse 120 Nurse Practitioner 121 Licensed Vocational Nurse 122 Medical Assistant 123 Case Manager, Medical 123 Medical Records Clerk 124 Billing Clerk 124 Receptionist, Medical 125 Physical Therapist 125 Occupational Therapist 126 Speech Pathologist 127
Retail Gift/Thrift Shop 128
Gift/Thrift Shop Manager 128 Gift/Thrift Shop Retail Sales Clerk 128 Customer Service Representative 129
Table of Contents
Page x © 2014 Third Sector New England & Nonprofit Compensation Associates
Social Services and Mental Health 130
Program Director/Administrator, Social Services/Mental Health 130 Program Manager/Administrator, Social Services/Mental Health 131 Program Coordinator, Social Services/Mental Health 132 Program Assistant, Social Services/Mental Health 133 Psychiatrist 134 Licensed Clinical Social Worker 135 Psychologist 136 Case Manager, Master’s Level 137 Case Manager 138 Counselor, Master’s Level 139 Counselor 140 Eligibility Specialist 141 Senior or Adult Program Assistant 142 Children or Youth Program Assistant 143 Personal Attendant/Home Health Care Worker 144 Direct Care Counselor 145 Outreach and Prevention Worker 146
Volunteer, Membership and Marketing 147
Volunteer Director 147 Volunteer Coordinator 148 Communications Director/Manager 149 Public Relations Manager 150 Marketing Coordinator 151 Graphic Artist 152 Writer/Editor 152 Membership Director or Manager 153 Membership Assistant/Coordinator 153 Social Media Specialist 154
Other Program or Issues-‐Based Campaign Positions 155
Program or Campaign Director 155 Program or Campaign Manager 156 Program or Campaign Coordinator 157 Program or Campaign Assistant 158 Trainer, Outside Consultants 158
VI Appendices
Appendix A: List of Organizations That Responded to the Survey 159 Appendix B: Who We Are: Third Sector New England and Our
Survey Partners 165
Appendix C: Wage Conversion Formulas and Tables 168

Preface
Valuing Our Nonprofit Workforce 2014 Page xi
This report summarizes the results of Valuing Our Nonprofit Workforce 2014: A Compensation and Benefits Survey of and for Nonprofits in Massachusetts, Rhode Island and Adjoining Communities. It was published in June 2014 using survey information gathered from 250 nonprofit organizations across the region. Purpose of this Report Third Sector New England provides information and services to build the knowledge, power and effectiveness of individuals and groups that engage people in community and public life.
In 2010, TSNE published the first Valuing Our Nonprofit Workforce report, which provided a deep look at nonprofit compensation practices across Massachusetts and bordering communities. The resulting free, online report has since been used by executive directors, board members, human resources staff and consultants to help establish pay rates across entire organizations, as well as for individual positions. We have heard from our constituents that the data we have provided is valuable for a number of reasons:
• The data is locally relevant to the New England region • It includes positions that are common to our nonprofit workforce but are difficult to find
and make comparisons to in other compensation studies, and • The information is relevant for distinct segments of social justice-oriented organizations.
Compensation In our previous report, nonprofits were still reeling from the national financial crisis. Many organizations found themselves having to do more with fewer resources, while trying to maintain their commitments to paying fair wages. Now, in 2014, our economy is improving. Organizations are seeing increased job turnover as employees have been able to find new positions, vacant positions are being filled, fringe benefits and raises have begun to creep back into the compensation equations, and increased funding is available to maintain and expand programming and create new positions. TSNE’s main goal in re-commissioning this study has not changed: we want to provide nonprofit leaders with relevant data to inform and support fair and consistent compensation decisions and practices, even in the smallest organizations. Benefits This year’s survey also reports on the benefits offered by nonprofits in our region. Participating organizations were asked to provide information on the benefits they offer to employees including: time-off, health and dental insurance, retirement and other forms of coverage and benefits. The landscape, particularly as it relates to health insurance, is changing rapidly and dramatically. This report presents a snapshot in time – a picture of how nonprofits in our region are meeting the health and welfare needs of their employees - today. The data can be useful as nonprofits explore their options in this increasingly costly and evolving healthcare and insurance environment.

Preface
Page xii © 2014 Third Sector New England & Nonprofit Compensation Associates
Using the Report Third Sector New England contracted with Bob Orser, The Nonprofit Doctor, and Rita Haronian who administer a software application survey program called FAIRPAY. FAIRPAY has developed a solid track record of producing thoughtful, values-based nonprofit compensation and benefits studies and reports around the country. Their survey program has given us great flexibility in designing a survey and report that can support and address our goals of providing the most relevant information possible for our region’s nonprofits. And, as we expected, FAIRPAY has been an invaluable resource. We suggest that this report will:
• Enable nonprofit leaders to make informed hiring and pay decisions in these shifting financial times, and to more effectively plan for the futures of their organizations
• Help leaders explain compensation rates and policies to employees in a meaningful context
• Provide data that nonprofit boards need to determine appropriate compensation practices for executive directors and other top positions, as required for many nonprofits by IRS Section 990
All nonprofits are different, and all jobs are unique. We urge you not to view this survey report as your "final answer" in deciding what and how to pay your staff. Rather, use this survey as one tool or resource, along with many others, to decide what is right for your organization. While the report provides a much-needed informational base for nonprofit managers, there are several important things to keep in mind:
• As the publishers of this report, the information we've included is not our recommendations for what compensation and benefits practices ought to be. Rather, the information is presented as a report of what these practices were on October 1, 2013, for the 250 organizations that participated in the survey
• The information in this report is not a scientific sampling from which conclusions can be drawn about all nonprofit compensation across our region. Rather, this report presents only information about the 250 organizations that chose to participate in the survey
• The report is not a scientific comparison of nonprofits located in different regions of Massachusetts, or in one field versus another. The mix of sizes and types of nonprofits, and the jobs associated with each organization means there are multiple variables for you to compare and consider
Be sure to review and follow the Guide to Using the Survey, which provides details about our survey methodology, along with helpful terminology. The Guide will help you understand and interpret the data in meaningful ways. You can also view salary data by organization budget, employee population, location, or field of service from our searchable database at www.tsne.org.
Preface
Valuing Our Nonprofit Workforce 2014 Page xiii
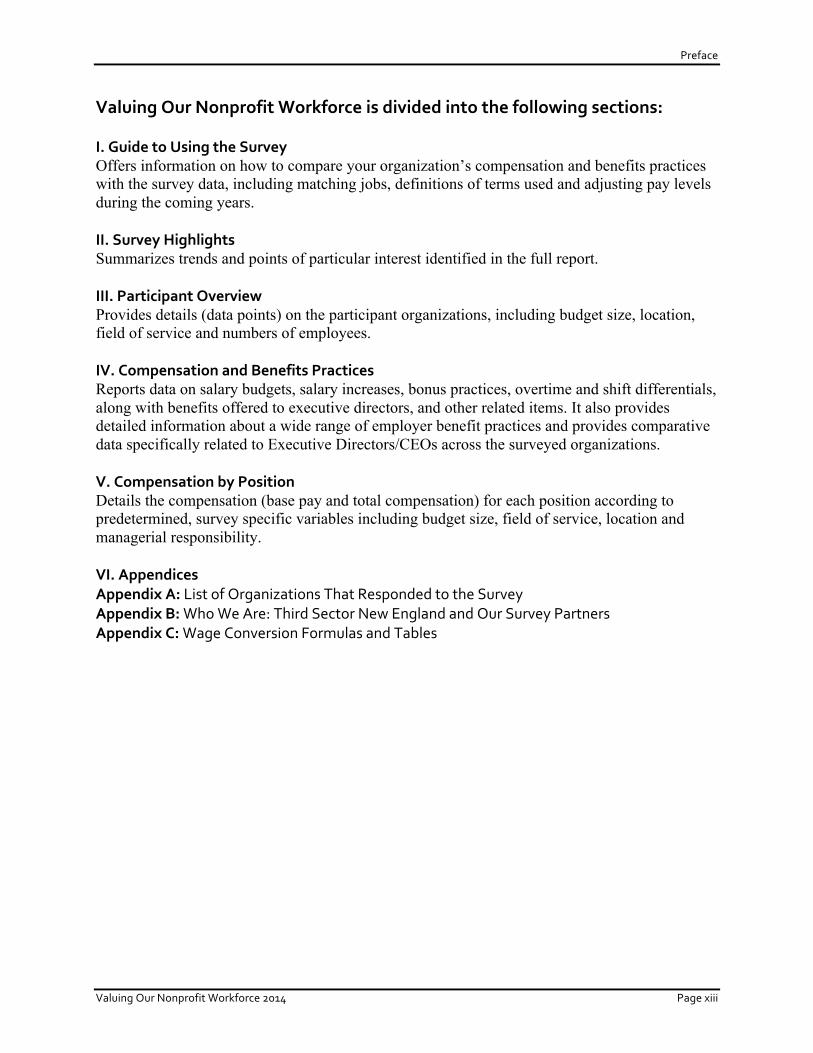
Valuing Our Nonprofit Workforce is divided into the following sections: I. Guide to Using the Survey Offers information on how to compare your organization’s compensation and benefits practices with the survey data, including matching jobs, definitions of terms used and adjusting pay levels during the coming years. II. Survey Highlights Summarizes trends and points of particular interest identified in the full report. III. Participant Overview Provides details (data points) on the participant organizations, including budget size, location, field of service and numbers of employees. IV. Compensation and Benefits Practices Reports data on salary budgets, salary increases, bonus practices, overtime and shift differentials, along with benefits offered to executive directors, and other related items. It also provides detailed information about a wide range of employer benefit practices and provides comparative data specifically related to Executive Directors/CEOs across the surveyed organizations. V. Compensation by Position Details the compensation (base pay and total compensation) for each position according to predetermined, survey specific variables including budget size, field of service, location and managerial responsibility. VI. Appendices Appendix A: List of Organizations That Responded to the Survey Appendix B: Who We Are: Third Sector New England and Our Survey Partners Appendix C: Wage Conversion Formulas and Tables

Preface
Page xiv © 2014 Third Sector New England & Nonprofit Compensation Associates

I. Guide to Using the Survey Report
Valuing Our Nonprofit Workforce 2014 Page 1
When using the data in this report, we suggest that you consider the following: • The survey reports the compensation and benefit practices in effect on October 1, 2013, as
reported by 250 nonprofit organizations in Massachusetts, Rhode Island and adjoining communities.
• The survey findings represent actual practices reported by the participants in the survey. The
survey, therefore, is not a scientifically selected sample from which conclusions can be drawn about all nonprofits in the survey area. Also, the results are not intended to represent an ideal of what compensation and benefits should be.
• When developing compensation and benefits programs, a nonprofit organization should
consider its compensation philosophy and the internal value of its jobs, in addition to the reported survey data.
Matching Jobs When seeking information for a particular job, it is important to carefully match your job’s duties and responsibilities with those indicated for the survey positions: • Each job title is defined by an accompanying job description. Different organizations may
use the same or similar job title to designate very different jobs. We recommend that you use the job descriptions provided to match your jobs along with the job titles.
• Jobs are grouped under general classifications or functions. To find compensation data for a
specific job within your organization, first match the position to the job description that is found at the top of each Compensation by Position page. You can review several job descriptions within a function to determine the best match.
• To ensure that the job description you choose is as similar as possible to the actual job in
your organization, at least 80% of the job responsibilities and requirements should be the same or comparable.
Guide to Using the Survey Report
Page 2 © 2014 Third Sector New England & Nonprofit Compensation Associates
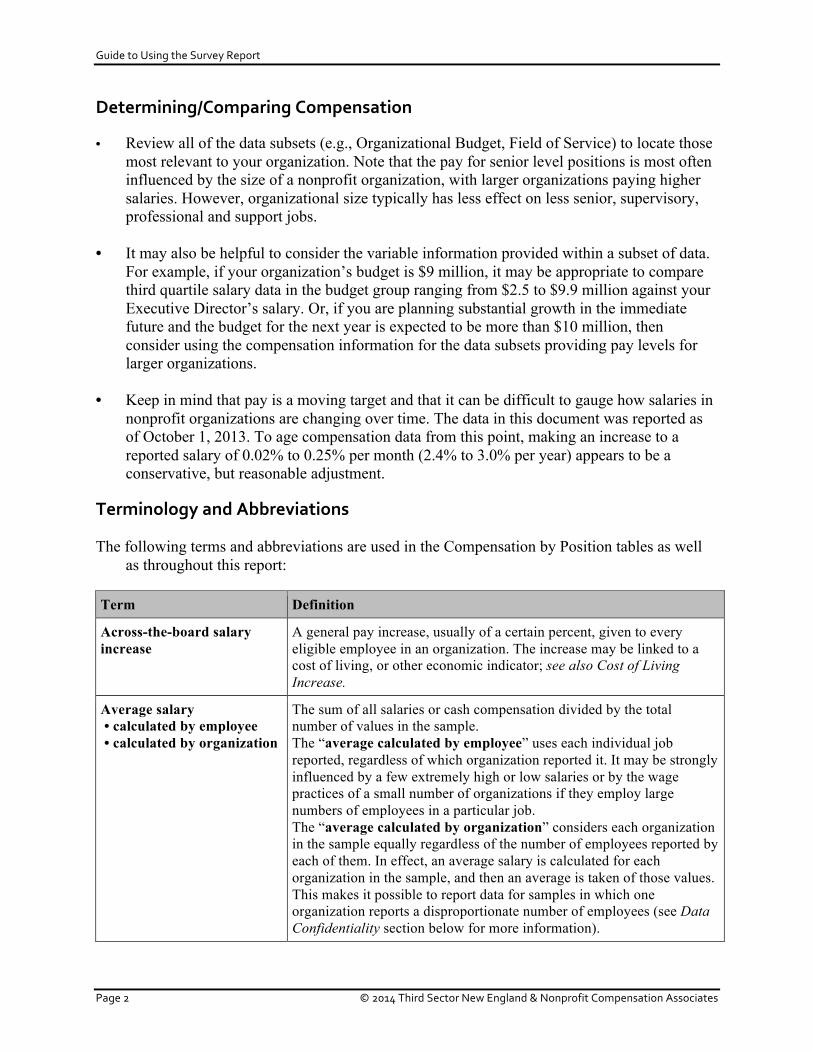
Determining/Comparing Compensation • Review all of the data subsets (e.g., Organizational Budget, Field of Service) to locate those
most relevant to your organization. Note that the pay for senior level positions is most often influenced by the size of a nonprofit organization, with larger organizations paying higher salaries. However, organizational size typically has less effect on less senior, supervisory, professional and support jobs.
• It may also be helpful to consider the variable information provided within a subset of data.
For example, if your organization’s budget is $9 million, it may be appropriate to compare third quartile salary data in the budget group ranging from $2.5 to $9.9 million against your Executive Director’s salary. Or, if you are planning substantial growth in the immediate future and the budget for the next year is expected to be more than $10 million, then consider using the compensation information for the data subsets providing pay levels for larger organizations.
• Keep in mind that pay is a moving target and that it can be difficult to gauge how salaries in
nonprofit organizations are changing over time. The data in this document was reported as of October 1, 2013. To age compensation data from this point, making an increase to a reported salary of 0.02% to 0.25% per month (2.4% to 3.0% per year) appears to be a conservative, but reasonable adjustment.
Terminology and Abbreviations The following terms and abbreviations are used in the Compensation by Position tables as well
as throughout this report: Term Definition
Across-the-board salary increase
A general pay increase, usually of a certain percent, given to every eligible employee in an organization. The increase may be linked to a cost of living, or other economic indicator; see also Cost of Living Increase.
Average salary • calculated by employee • calculated by organization
The sum of all salaries or cash compensation divided by the total number of values in the sample. The “average calculated by employee” uses each individual job reported, regardless of which organization reported it. It may be strongly influenced by a few extremely high or low salaries or by the wage practices of a small number of organizations if they employ large numbers of employees in a particular job. The “average calculated by organization” considers each organization in the sample equally regardless of the number of employees reported by each of them. In effect, an average salary is calculated for each organization in the sample, and then an average is taken of those values. This makes it possible to report data for samples in which one organization reports a disproportionate number of employees (see Data Confidentiality section below for more information).

Guide to Using the Survey Report
Valuing Our Nonprofit Workforce 2014 Page 3
Term Definition
Annual base salaries The full-time, annual base salary paid for the position as reported in the Compensation by Position tables. Part-time salaries have been annualized based on a 40-hour workweek. Base salaries do not include the cost of benefits, incentive pay, or perquisites. To convert annual salaries to hourly, weekly or monthly figures, consult Appendix C of this report.
Cafeteria plan See Flexible Spending Benefits Plan.
Cost of living increase Periodic, across-the-board increases in base pay, designed to keep employees’ salaries in line with the rising cost of living.
Defined benefit plan A retirement plan in which a retired employee receives a specific amount based on salary history and years of service, and in which the employer bears the investment risk. Contributions may be made by the employee, the employer, or both.
Defined contribution plan A retirement plan that specifies the amount of an organization’s contribution, but which may not have a formula for determining eventual benefits. The organization’s contribution usually equals a certain percentage of the worker’s salary, and a vesting period—specific length of employment—may be required. See also Individual Retirement Account (IRA), Tax-sheltered annuity 401(k), Tax-sheltered annuity 403(b).
Dependent Care Spending Account (DCSA)
One of the two types of FSA (Flexible Spending Account), which holds pre-tax dollars set aside by employees on an annual basis to pay for their dependent care expenses. No amount may be left in the DCSA at the end of the year, or it will be lost.
Exempt vs. Non-Exempt employees
Employees are classified as “exempt” or “nonexempt” in reference to the FLSA (Fair Labor Standards Act). An exempt employee is paid a salary and is not compensated for overtime hours worked. The three categories under which an employee may be considered exempt are administrative, executive and professional. These categories generally define an exempt employee as one who customarily and regularly exercises discretion and independent judgment in the performance of his/her duties. Exempt employees must pass a Salary Basis Test; that is, they must be compensated at a minimum weekly salary of at least $455. A non-exempt employee is paid for all regular hours and all overtime hours worked. Most employees are classified as non-exempt and generally perform a wide variety of professional, and/or administrative responsibilities.
Flexible Spending Account (FSA)
A type of Section 125 account, an FSA holds pre-tax dollars set aside by employees to pay for their health care or dependent care expenses. No amount may be left in the FSA at the end of the year, or it will be lost. There are two types of FSA: Health Care Spending Account (HCSA) and Dependent Care Spending Account (DCSA) (see DCSA).

Guide to Using the Survey Report
Page 4 © 2014 Third Sector New England & Nonprofit Compensation Associates
Term Definition
Flexible benefit plan Benefit plans that allow employees to choose the benefits they desire from a predetermined list. Employers provide a certain number of credits or dollars to each worker to ensure core coverage, and additional benefits may be purchased at an individual employee’s expense. Also called cafeteria plan.
Health Care Spending Account (HCSA)
One of the two types of FSA (Flexible Spending Account), which holds pre-tax dollars set aside by employees to pay for their health care expenses. No amount may be left in the HCSA at the end of the year, or it will be lost.
Health Reimbursement Arrangement (HRA)
An arrangement in which the employer contributes a certain amount per employee, per year to pay for health-care expenses. This money may be rolled over from one year into the next, but is not portable if an employee leaves employment with the organization.
Health Savings Account (HSA)
Employee and/or employer make pre-tax contributions that are used by the employee to pay for future medical, retirement, and/or long-term care premium expenses. These accounts are used in conjunction with a high-deductible health insurance plan. These funds can roll over from year to year, and the account is portable.
Incentive or bonus pay A periodic or one-time financial reward that compensates employees for outstanding job performance. Bonuses may be given for specific instances of employee achievement or initiative and/or, when an employee meets or exceeds preset performance goals.
Individual Retirement Account (IRA)
A defined contribution benefit plan that allows employees to make tax-deductible contributions to their own retirement accounts.
Median The data point at which 50 percent of the sample is lower and 50 percent of the sample is higher. The median is synonymous with the 50th percentile.
Number of employees In the V. Compensation by Position tables, the total number of individuals reported for a specific job; the size of the sample.
Number of employees managed
In V. Compensation by Position tables, the total number of employees managed by a specific position.
Number of organizations In V. Compensation by Position tables, the number of organizations reporting employees in a specific position.
Paid Time Off (PTO) program
In a Paid Time Off (PTO) program, employees are given a set number of days off each year to be taken at their discretion (as opposed to separate time off for vacation days, sick days and holidays).
Paid time-off benefits Employer-paid time-off benefits may include vacation, sick days and holidays.

Guide to Using the Survey Report
Valuing Our Nonprofit Workforce 2014 Page 5
Term Definition
Percentiles • The 10th percentile is the data point below which 10% of the sample falls; conversely, the level above which the top 90% of the sample falls.
• The 25th percentile is the data point below which 25% of the sample falls; conversely, the level above which the top 75% of the sample falls.
• The 75th percentile is the data point below which 75% of the sample falls; conversely, the level above which the top 25% of the sample falls.
• The 90th percentile is the data point below which 90% of the sample falls; conversely, the level above which the top 10% of the sample falls.
Performance-based or merit increases
Salary increases based on employee merit and/or performance over a given period of time. It is usually accompanied by an evaluation of the employee’s performance.
Personal days Days off taken at the discretion of the employee; May also called floating holidays.
Section 125 plan A benefits plan in which certain employee benefits are paid with pre-tax dollars. Section 125 plans include premium-only plans, Flexible Spending Accounts and cafeteria plans.
Tax-sheltered annuity 401(k) A defined contribution retirement plan that allows workers to make pre-tax contributions through salary reduction agreements with their employers. Following a change in tax regulations in 1997, 401(k) plans can be offered by nonprofit organizations.
Tax-sheltered annuity 403(b) A defined contribution plan, similar to a 401(k), but specifically designed for use by nonprofit and public organizations.

Guide to Using the Survey Report
Page 6 © 2014 Third Sector New England & Nonprofit Compensation Associates
Positions Reported in the Survey The survey instrument requested information for 189 job titles. This report presents compensation levels for each of the 134 jobs for which data was collected from at least five unique organizations. This threshold ensures the confidentiality of data for all participating organizations. Therefore, a number of jobs presented in the survey instrument are not reported herein. Nearly 23,000 individual salaries have been used to generate this report. Data Confidentiality To ensure the confidentiality of all data, a minimum number of responses are required for each statistic reported on. A minimum of five organizations is required to report compensation in any data subset. There must be at least five employees in a data subset in order to report the average pay, and five incumbents are required to report the median pay. In order to report the 10th, 25th, 75th and 90th percentiles, at least twelve employees are required. When the data collected does not meet these minimum levels, cells in the individual position reports in Section V. are left blank. In cases where 50% or more of the data for a position was reported by a single organization, only the median and average are reported. Additional Information Please contact us with any questions about this survey or for help in interpreting the data. Rodney D. Byrd Survey Project Manager Lyn Freundlich Director of Administration and Human Resources Third Sector New England 89 South Street, Suite 700 Boston, Mass. 02111 (617) 523-6565 www.tsne.org [email protected]

II. Survey Highlights
Valuing Our Nonprofit Workforce 2014 Page 7
General Observations
• Two hundred fifty (250) nonprofit organizations completed the survey instrument. • Data was compiled on nearly 23,000 individual salaries and these were categorized into the 134
job titles contained within the report. • The annual operating budgets of participating nonprofits range from under $50,000 to over
$100,000,000. The average budget of those reported is $8,279,586. Budget sizes are divided into six categories (page 10).
• Fifty-three percent (53%) of participating nonprofits define a full-time workweek as 40 hours per week; 18% use 37.5 hours and 19% use 35 hours. Most of the remaining organizations tended to be smaller nonprofits, with workweeks of 32 hours or less.
• Sixty-six percent (66%) of employees at participating organizations work full-time, while 34% work part-time.
• Respondents reported annual voluntary turnover rates during the twelve months prior to the survey of 17% for full-time employees (12% in 2010) and 21% for part-time employees (11% in 2010). As the economy improves, it is reasonable to surmise that employees feel increasingly comfortable making job or career changes that they may have rejected during the recession.
• Involuntary turnover rates in 2014 were 6% for full-time employees and 5% for part-time employees.
• Executive directors in 59% of the participating organizations are female; 41% are male. Benefits: Time Off
• Seventy-three percent (73%) of participating nonprofits provide full-time employees with specified numbers of paid days off each for vacation, holiday and sick leave.
• Twenty-two percent (22%) offer a PTO (Paid Time Off) program instead, giving employees a set number of days off to be used for any purpose.
• Another 5% offer some other benefit, most of which are small organizations which tend to have less formal practices.
• Seventy-seven percent (77%) of nonprofits with part-time employees pay for time off for their part-time staff.
• Of these organizations, 52% require that those employees work a minimum number of hours per week to be eligible, with an average of 21 hours per week required.
• Eighty-two percent (82%) of participants reporting a formal policy regarding paid time off, offer one vacation schedule for all employees, which often gives an increasing number of vacation days the longer an employee remains with the organization.
• Thirteen percent (13%) offer two or more time-off schedules, depending on the type of employee within their organizations.
• Reporting nonprofits provide an average of 11 paid holidays and 10 paid sick days per year. Benefits: Insurance & Retirement
• Ninety percent (90%) of responding nonprofits offer some type of medical insurance to full-time employees. A significant number pay 80% or more of individual’s premiums.
• Seventy percent (70%) offer a traditional health plan, 17% offer a cafeteria plan, 3% pay a stipend directly to employees allowing them to purchase their own coverage, and 10% do not offer insurance benefits.
• Of the respondents reporting part-time employees, 43% indicate that only full-time employees are eligible for insurance benefits.

Survey Highlights
Page 8 © 2014 Third Sector New England & Nonprofit Compensation Associates
• Fifty-four (54%) indicate that their part-time employees are eligible for medical insurance
coverage, as long as they maintain a minimum number of hours per week (on average, 22 hours per week), while 3% make benefits available to employees regardless of the number of hours worked.
• Over two-thirds of surveyed organizations (71%) provide some type of retirement benefit to their full-time employees.
• For these employers, tax-sheltered annuities such as 401(k) and 403(b) plans are by far the most popular type (58% of all reporting organizations), followed by IRA/SEP-IRA plans (8%).
• Almost two-thirds (63%) of those offering retirement benefits have plans in which both the employer and the employee contribute to retirement.
• In 25% of the organizations, only the employee contributes, and in 8%, only the employer contributes.
• Eighty-eight percent (88%) of organizations that contribute to their employees’ retirement plans indicated that they contribute a percentage of each employee’s annual salary, usually the same percentage for all employees.
• These reported employer contributions range from 1% to 15%, with an average of 4.88%. Compensation
• In 2010, 51% of the nonprofit workforce represented in our study earned less than $28,000 annually. It appears that the needle has shifted a little bit in this area as this time around; about 43% are earning less than $28,000.
• On average, male Executive Directors/CEOs earn significantly higher pay than those who are female.
• The average pay for all Executive Directors/CEOs is $119,952 per year: $139,506 for men and $106,627 for women.
• In 2014, 59% of the executive directors represented are women. However, women still hold most of those positions in the smallest organizations, which are also the ones that pay the lowest salaries. Seventy-five percent (75%) of the groups with budgets under $250,000 have female executive directors, while 60% of the largest groups – those with budgets over $25,000,000- employ male directors.
• 574 individuals in the survey hold the 10 highest paying jobs. Of those, 56% are women and 44% are men; 90% are white. On the other hand, of the 7,453 individuals in the survey holding the 10 lowest paying job titles, 61% are women. Forty percent (40%) are white, which means that people of color hold 10% of the highest paying jobs and 60% of the lowest.
• Many participating nonprofits use more than one method to grant salary increases. Merit or performance based pay was cited by 43%, across-the-board increases by 39%, cost of living increases by 29%, and length of service by 9%.
• Seventy-one percent (71%) of participating organizations have salary increases budgeted for their current fiscal year. This seems to indicate improved economic conditions since the 2010 survey, when just 58% reported budgets for salary increases – a 13% increase.
• Eighty-five percent (85%) of the nonprofits report having annual employee performance reviews, while 5% conduct reviews every six months, and 10% do not have a set schedule.
• Twenty-two percent (22%) of the nonprofits reported that they have a formal policy that allows for incentive pay for their executive directors.

III. Participant Overview
Valuing Our Nonprofit Workforce 2014 Page 9
Effective Date Participants provided compensation and benefits data in effect as of October 1, 2013. Participants Two hundred fifty (250) nonprofit organizations located in Massachusetts, Connecticut, New Hampshire and Rhode Island participated in the survey. These organizations provided comprehensive information on compensation for positions common to nonprofits. A list of the participants is included in Appendix A. The tables that follow in this section provide an overview of the organizations — where they are located, their budget size, field of service and the number of staff they employ. Field of Service Participants are classified by 15 separate Fields of Service.
Field of Service
# of Organizations
Child and youth services and advocacy 42
Elderly and developmentally disabled services and advocacy 39
Arts, culture, recreation 37
Family and individual counseling, crisis intervention, mental health and medical-related services 25
Community and economic development, social justice, legal services, civil rights 22
Housing and homelessness prevention 18 Environment, conservation, animal welfare 15
Food programs and pantries, nutrition, agriculture 10
Immigrant, GLBT, minority and other demographic populations services and advocacy 10
Public policy and education reform 10
Health and fitness, wellness 7
Association and memberships 6
Philanthropy 6
Religion, spiritual awareness and development 2
Management and organizational support 1
Total 250

Participant Overview
Page 10 © 2014 Third Sector New England & Nonprofit Compensation Associates
Budgets Budget size groups have been established where natural breaks occurred in the data and to ensure a sufficient number of responses in each to provide you with valid information.
Budget Groups # of Organizations Average Annual Operating Budget Size
to $249,999 31 $137,961 $250,000 - $999,999 53 $599,941
$1,000,000 - $2,499,999 46 $1,559,893 $2,500,000 - $9,999,999 66 $4,984,471
$10,000,000 - $24,999,999 33 $16,214,806 $25,000,000 and over 21 $52,285,903
All Organizations 250 $8,279,586
The following chart illustrates the distribution of participants by budget size.
Distribution of Participants by Budget Size

Participant Overview
Valuing Our Nonprofit Workforce 2014 Page 11
Using Budget Data to Evaluate Pay The size of an organization typically affects pay for management-level staff because of the increased complexity of the organization, number of employees supervised and overall financial responsibility (i.e., the larger the nonprofit, the higher the compensation for a senior manager). The following table generally demonstrates this pattern.
Budget Groups # of Organizations Average Base Pay for
Executive Director/CEO
to $249,999 31 $52,944 $250,000 - $999,999 53 $72,916
$1,000,000 - $2,499,999 46 $106,533 $2,500,000 - $9,999,999 66 $136,865
$10,000,000 - $24,999,999 33 $162,587 $25,000,000 and over 21 $221,071
All Organizations 250 $119,952
Average Executive Director/CEO Pay Across Survey Budget Groups
Budget size does not have quite the same impact on pay for professional or support staff, as these non-executive jobs are more similar, whether they are in a large organization or a small one. Instead, factors that may influence the pay levels of these jobs include: the pay philosophy of the organization, whether it has a formal salary administration program or not, and the sources of, and availability of funding for the organization.

Participant Overview
Page 12 © 2014 Third Sector New England & Nonprofit Compensation Associates
Staff Size The average number of employees in each size group is another measure against which to evaluate pay for those individuals with responsibility for the entire organization, or for a substantial part of it.
Budget Groups # of Organizations Average Number of Employees
to $249,999 31 4 $250,000 - $999,999 53 10
$1,000,000 - $2,499,999 46 32 $2,500,000 - $9,999,999 66 94
$10,000,000 - $24,999,999 33 254 $25,000,000 and over 21 717
Total 250 127 *Staff size is the sum of regular full-time and regular part-time employees. The following chart illustrates the average number of employees per budget group.
Average # of Employees Across Survey Budget Groups

Participant Overview
Valuing Our Nonprofit Workforce 2014 Page 13
Data is also calculated on employee size groupings. TIP: If your organization has a particularly small budget relative to the number of employees,
or vice versa, then compare your data based upon both budget and employee size groups.
Employee Size Groups # of Organizations From 1 to 2 employees 17 From 3 to 5 employees 28
From 6 to 10 employees 32 From 11 to 25 employees 41 From 26 to 50 employees 37
From 51 to 100 employees 20 From 101 to 250 employees 39
251 employees and more 36 Total 250
The following chart illustrates the distribution of participants by number of employees.
Distribution of Participants by Employee Size Groups

Participant Overview
Page 14 © 2014 Third Sector New England & Nonprofit Compensation Associates
Employee Turnover We asked respondents to identify the source of the positions into which they hired new employees when an existing employee left, either voluntarily, or involuntarily. The table below shows the percentage rate for these variables for both full-time and part-time positions based upon the size of organization. Please note that these numbers do not include discontinued positions that were not refilled after being vacated by an employee (typically due to layoff). Full-‐Time Positions
Employee Size Groups Refilled Due To: Voluntary Involuntary Turnover Turnover
From 1 to 2 employees 6% 6% From 3 to 5 employees 16% 7%
From 6 to 10 employees 17% 5% From 11 to 25 employees 12% 3% From 26 to 50 employees 13% 4%
From 51 to 100 employees 15% 5% From 101 to 250 employees 13% 5%
251 employees and more 20% 6% Overall Percentage 17% 6%
Part-‐Time Positions
Employee Size Groups Refilled Due To: Voluntary Involuntary Turnover Turnover
From 1 to 2 employees 17% 8% From 3 to 5 employees 17% 3%
From 6 to 10 employees 10% 2% From 11 to 25 employees 22% 2% From 26 to 50 employees 10% 1%
From 51 to 100 employees 27% 2% From 101 to 250 employees 13% 3%
251 employees and more 24% 6% Overall Percentage 21% 5%

Participant Overview
Valuing Our Nonprofit Workforce 2014 Page 15
Supervisory Responsibility Another measure against which to evaluate your own jobs is the number of staff managed. The table below represents the number of employees directly and indirectly supervised by the position being reported on. Typically, the manager has substantial responsibility for hiring, firing and reviewing performance. The survey provides pay data based upon these groups:
Data Categories - Number of Employees Managed 1 to 3 4 to 8
9 to 14 15 and over
This measure is particularly valuable when evaluating supervisory positions. It enables you to determine more precisely the value of your organization’s particular job relative to other jobs with similar circumstances. Often, the more supervisory responsibility held by a manager or supervisor, the higher the pay. Geographic Location of Responding Organization Compensation levels are reported for nonprofits based on the following geographic areas:
Area/County # of Organizations
Berkshire County Massachusetts Region 22 Western Massachusetts Region (Franklin, Hampshire & Hampden Counties and Hartford County, CT) 49 Central Massachusetts Region (Worcester County) 35 Greater Boston Massachusetts Region (Suffolk County and Norfolk, Essex & Middlesex Counties within Route 128) 64 Northeastern Massachusetts Region (Essex & Middlesex Counties outside of Route 128 and Rockingham County, NH) 39 Southeastern Massachusetts Region (Bristol & Plymouth Counties, Cape Cod & The Islands, Norfolk County outside of Route 128 and Rhode Island counties) 41
Total 250

Participant Overview
Page 16 © 2014 Third Sector New England & Nonprofit Compensation Associates

IV. Compensation & Benefits Practices
Valuing Our Nonprofit Workforce 2014 Page 17
Compensation Practices Salary Increase Budgets Organizations that have budgeted for salary increases in the current fiscal year report an average increase of 3.07%. The median salary increase budget (including all organizations who responded to the survey) for the current fiscal year, is 2.0% as detailed in the table below. Twenty-nine percent (29%) of organizations report salary increase budgets of 0.0%, while 71% report that their budgets include some salary increases. This indicates improvement in organizations’ ability to increase salaries compared with the 2010 survey, in which 58% of organizations indicated budgets for salary increases.
Salary Increase Budgets for Current Fiscal Year
# of Organizations Responding 250 # Organizations Responding Indicating No Budgeted Increase 72
# Organizations Responding With an Increase Budget 178
25th Percentile for All Organizations 0.0% Median for All Organizations 2.0%
75th Percentile for All Organizations 3.0%
Average (Including those reporting 0.00%) 2.21% Average (Excluding those reporting 0.00%) 3.07%
Salary Increase Practices When asked what method best describes their salary increase practices, more than half of participants report that they award salary increases based on merit or performance. Note that this question asks about their general policy, so organizations that do not plan to give increases this year may still choose one or more of the methods listed. Some organizations report more than one answer, as shown below:
Salary Increase Practice
% of Total Sample with
Policy
% of these that gave increase in
previous 12 months
Average increase
given
% of these expecting to give increase in next
12 months
Average increase expected
Merit/Performance 43% 72% 3.29% 71% 2.84%
Across the Board 39% 72% 2.89% 77% 2.81%
Cost of Living 26% 71% 2.02% 58% 2.10%
Length of Service 9% 63% 2.84% 59% 2.67%

Compensation & Benefits Practices
Page 18 © 2014 Third Sector New England & Nonprofit Compensation Associates
Salary Grades and Ranges One-third of respondents use salary grades or ranges.
Grade & Ranges # of Organizations % of Organizations
Use grades or ranges 83 33% Do not use grades or ranges 167 67%
Total # of Organizations 250
Incentive Pay or Bonuses Of the 250 respondents, 22% indicate that they provide the Executive Director with some type of incentive or bonus opportunity. Incentive or bonus pay is slightly less common for other categories of employees.
Employee Group – Eligible for Incentive and/or Bonus Pay # of Organizations % of Organizations
Executive Director 55 22% Management Staff 49 20% Professional Staff 43 17%
Support and Administrative Staff 43 17% Note that the existence of incentive or bonus plans does not necessarily mean employees in those plans were paid bonuses. Actual payments are detailed in Section V. Compensation by Position. On-‐Call Practices Eighty-nine respondents (36% of the 250 participants) indicate that they have some type of on-call pay practice as follows:
On-Call Pay Practices # of Organizations % of Organizations Pay for hours worked (including overtime) 25 28% Pay a flat rate for employees’ on-call time 24 27%
Provide compensatory time off or flex-time 10 11% No additional pay or time off for exempt employees 17 19%
Pay a show-up rate and in addition to hourly pay rate 11 12% Other 2 2%
Total # of Organizations 89

Compensation & Benefits Practices
Valuing Our Nonprofit Workforce 2014 Page 19
Practices for Dealing with Extensive Overtime Worked by Exempt Staff Thirty-six percent (36%) of respondents indicate that they do not compensate for extensive overtime worked by exempt staff, and 25% of organizations report that they have no formal policy. Thirty percent (30%) provide compensatory time off and the remaining have some other policy or practice. (Note that the wage and hour laws do not mandate overtime pay for exempt staff).
Practice/Policy # of Organizations % of Organizations
No formal policy 62 25% Provide compensatory time off 75 30%
Pay straight time 8 3% Pay overtime rates 7 3%
Do not compensate for extensive overtime 90 36% Other Practices 8 3%
Total # of Organizations 250 Evening/Night Shift Differentials Of the 94 nonprofits reporting that they have an evening and/or night shift (38% of the total sample), the majority (85%) indicates that they do not pay any special rates beyond regular hourly pay and overtime, if applicable. Only 15% of the organizations that report an evening or night shift indicate that they pay any additional compensation.
Practice/Policy # of Organizations % of Organizations Do not have evening/night shift positions 156 62%
Do have evening/night shift positions 94 38%
# Organizations Responding 250
Practice/Policy # of Organizations % of Organizations Of the 94 organization reporting evening/night shift:
positions:
Do not pay a differential for evening/night shift 80 85% Do pay a differential 14 15%
Among the nonprofits that do pay a premium are the following practices: • Paying an additional hourly wage, from 50 cents to $1.00 per hour • Paying a salary or shift differential of up to 15% • Paying overtime rates for a night shift • Paying a stipend per overnight shift, amount depending on the position.

Compensation & Benefits Practices
Page 20 © 2014 Third Sector New England & Nonprofit Compensation Associates
Premium for Bilingual Skills The great majority of organizations report that they do not pay a premium for bilingual skills:
Practice/Policy # of Organizations % of Organizations Do not pay a premium for bilingual skills 225 90%
Pay a premium for bilingual skills 25 10% Among organizations that do pay a premium, the practices for compensating bilingual skills vary widely including: • Paying an hourly premium, from 50 cents to $2.00 per hour, depending on the position • Paying a percentage of salary, typically 3% - 5% • Adding some dollar amount to pay, with a median reported of $1000 per year Job classifications that are subject to additional pay for bilingual skills include many program-related jobs, as well as some administrative jobs including: • Attorneys, Paralegals, Legal Assistants • Case Managers, Client Advocates, Clinicians, Counselors, Direct Service Providers • Teachers • Medical Assistants, Nurses • Customer Service Representatives, Receptionists, Administrative Support Staff

Compensation & Benefits Practices
Valuing Our Nonprofit Workforce 2014 Page 21
Employment Practices Full-‐Time Workweek More than 50% of organizations report a 40-hour full-time workweek. Nine percent (9%) of the organizations report a workweek of fewer than 35 hours.
Length of Full-Time Workweek # of Organizations % of Organizations 40 hours 133 53% 38 hours 2 1%
37.5 hours 46 18% 35 hours 47 19% 32 hours 4 2% 30 hours 15 6%
Other 3 1% Total # of Organizations 250
Introductory Period For the 186 nonprofits reporting an Introductory Period, the average length is 3.76 months. The average Introductory Period for all organizations is 2.80 months including the 64 organizations that indicate they have no Introductory Period, which is calculated as 0 months.
Length of Introductory Period # of Organizations % of Organizations 30 – 45 days 6 2%
Two months/60 days 3 1% Three months/90 days 122 49% Four months/120 days 4 2% Five months/150 days 1 <1% Six months /180 days 50 20%
None 64 26% Total # of Organizations 250
Of those organizations that have an Introductory Period, 53% report that employees are eligible to use their time-off benefits and 73% report that employees are eligible to use their insurance benefits during the introductory period.

Compensation & Benefits Practices
Page 22 © 2014 Third Sector New England & Nonprofit Compensation Associates
Performance Reviews The vast majority (85%) of organizations review staff on an annual basis.
Performance Review Period # of Organizations % of Organizations
Do not review 1 <1%
Every six months 12 5%
Annually 212 85%
No set schedule 25 10%
Total # of Organizations 250
Union Contracts Twenty-four organizations (10%) reported having union contracts for one or more of their positions. The types of positions are varied and include both exempt and non-exempt positions. Examples of the types of jobs represented by unions in this survey are: • Actors, Musicians • Attorneys, Paralegals • Case Manager, Direct Care Providers, Nurses, Protective Services Workers, Residential
Counselors, Social Workers • Cooks, Food Services Workers, Kitchen Staff • Teachers, Lead Teachers, Assistant Teachers • Drivers, Maintenance Supervisors, Maintenance Technicians • Employment Specialists, Vocational Counselors • Administrative Support Staff, Payroll Clerks, Receptionists, Volunteer Coordinators

Compensation & Benefits Practices
Valuing Our Nonprofit Workforce 2014 Page 23
Miscellaneous Employee Benefits Organizations were asked whether the following benefits are provided to the CEO/Executive Director, other executive-level staff and non-executive level staff.
% of Organizations Offering Benefits to:
Benefits Offered to All Staff Executive Director/CEO
Senior Staff (other than Executive
Director/CEO)
Other Staff
Professional conference attendance 81% 75% 65% Professional development classes 76% 74% 73%
Work from home or elsewhere 54% 49% 34% Flex Time 47% 46% 40%
Professional membership dues 47% 39% 23% Cellular phone 45% 42% 24%
Employee Assistance Program (EAP) 37% 36% 47% Professional liability insurance 31% 27% 22%
Tuition assistance/reimbursement 27% 32% 34% Access to products and services discount programs 22% 22% 22%
Reimbursement for cost of professional license/credential 20% 24% 24% Financial planning services 15% 14% 14%
Access to credit union membership 13% 13% 13% Car leasing 8% 2% <1%
Sabbatical (paid ) 7% 5% 4% Health club membership 6% 5% 5%
Local mass transit subsidy 5% 4% 4% Home computer purchase or lease 4% 3% 1%
Car ownership 4% 1% <1% Low-interest or no-interest loan program 3% 3% 4%
Personal liability insurance 2% 2% 2% Cost of home internet provider 2% 1% 1% Housing or housing allowance 2% <1% <1%
Personal legal expenses 0% 0% 0%
Benefits Offered Only to Senior and Executive Staff
Executive
Director/CEO
Senior Staff (other than Executive Director/CEO)
Additional vacation time 20% 10% Additional contribution to medical insurance 10% 4%
Additional contribution to retirement plan 10% 4% Additional contribution to life insurance 6% 3%
Additional contribution to disability insurance 4% 3% Additional contribution to long-term care insurance 2% 1%

Compensation & Benefits Practices
Page 24 © 2014 Third Sector New England & Nonprofit Compensation Associates
Time-‐Off Practices The primary methods reported for providing time-off benefits to employees are:
• Separate vacation, sick leave and holiday benefits: 183 organizations (73%) • Combined “Paid Time Off” (PTO): 54 organizations (22%) • 13 respondents (5%) report other time-off policies for their staff including some that have
no formal time-off policies. • Of the respondents that have part-time employees, 77% indicate that they pay for time-off
benefits for these employees. These benefits are generally pro-rated according to the employees’ scheduled number of hours each work week.
• Fifty-two percent (52%) require that part-time employee work a minimum number of hours per week to be eligible. The average minimum is 21 hours per week.
• Another 25% offer time-off benefits to part-time employees regardless of the number of hours they work each week.
• In the remaining 23% of organizations, part-time employees are not eligible for time-off benefits.
Separate Vacation, Sick Leave & Holidays—All Employees Receiving the Same Benefit The survey results show that 161 survey participants (64%) provide the same benefit to both exempt and non-exempt staff - where employees accrue vacation, holiday and sick leave as separate benefits. Time-off days indicated are based on full time equivalency (FTE).
Exempt and Non
Exempt Staff Years of Service
Vacation Days Sick Leave Holiday Personal
Days Total Days
First Year 12.7 10.0 10.8 2.5 36.0 Second Year 14.0 10.0 10.8 2.5 37.3
Third Year 15.5 10.0 10.8 2.5 38.8 Fourth Year 16.5 10.0 10.8 2.5 39.8
Fifth Year 18.0 10.0 10.8 2.5 41.3 Sixth to Ninth Years 19.3 10.0 10.8 2.5 42.6
Tenth Year 20.9 10.0 10.8 2.5 44.2 Eleventh Year + 21.2 10.0 10.8 2.5 44.5

Compensation & Benefits Practices
Valuing Our Nonprofit Workforce 2014 Page 25
Separate Vacation, Sick Leave & Holidays—Exempt & Non-Exempt Staff Receiving Different Benefits The survey results show that 22 survey respondents (9%) provide different benefits to exempt and non-exempt staff - where employees accrue vacation, holiday and sick leave as separate benefits, as detailed in the following two tables. Time-off days indicated are based on full-time equivalency (FTE).
Exempt Staff Years of Service
Vacation Days Sick Leave Holiday Personal
Days Total Days
First Year 16.0 9.0 11.8 2.7 39.5 Second Year 17.1 9.0 11.8 2.7 40.6
Third Year 17.4 9.0 11.8 2.7 40.9 Fourth Year 17.6 9.0 11.8 2.7 41.1
Fifth Year 18.2 9.0 11.8 2.7 41.7 Sixth to Ninth Years 18.9 9.0 11.8 2.7 42.4
Tenth Year 20.3 9.0 11.8 2.7 43.8 Eleventh Year + 20.3 9.0 11.8 2.7 43.8
Non-Exempt Staff Years of Service
Vacation Days Sick Leave Holiday Personal
Days Total Days
First Year 10.0 9.0 11.8 2.7 33.5 Second Year 11.0 9.0 11.8 2.7 34.5
Third Year 12.8 9.0 11.8 2.7 36.3 Fourth Year 13.3 9.0 11.8 2.7 36.8
Fifth Year 15.0 9.0 11.8 2.7 38.5 Sixth to Ninth Years 16.0 9.0 11.8 2.7 39.5
Tenth Year 17.1 9.0 11.8 2.7 40.6 Eleventh Year + 17.4 9.0 11.8 2.7 40.9

Compensation & Benefits Practices
Page 26 © 2014 Third Sector New England & Nonprofit Compensation Associates
Paid Time Off (PTO) Policies—All Employees Receiving the Same Benefit Forty-four (44) survey respondents (18%) provide PTO benefits that combine at least some portion of vacation, holidays and sick leave, with all employees receiving the same benefits. Time-off days indicated are based on full time equivalency (FTE).
All Staff Years of Service
Paid Time Off Holidays Total Days
First Year 20.2 10.0 30.2 Second Year 21.7 10.0 31.7
Third Year 23.5 10.0 33.5 Fourth Year 24.3 10.0 34.3
Fifth Year 26.4 10.0 36.4 Sixth to Ninth Years 27.5 10.0 37.5
Tenth Year 29.6 10.0 39.6 Eleventh Year + 30.2 10.0 40.2
Paid Time Off (PTO) Policies—Exempt & Non-Exempt Staff Receiving Different Benefits Ten survey respondents (4%) provide PTO benefits that combine at least some portion of vacation, holidays and sick leave, with exempt and non-exempt staff receiving different benefits, as shown in the two tables below:
Exempt Staff Years of Service
Paid Time Off Holidays Total Days
First Year 24.6 10.4 35.0 Second Year 25.4 10.4 35.8
Third Year 26.3 10.4 37.7 Fourth Year 27.9 10.4 38.3
Fifth Year 28.0 10.4 38.4 Sixth to Ninth Years 29.4 10.4 39.8
Tenth Year 29.9 10.4 40.3 Eleventh Year + 31.7 10.4 42.1
Non-Exempt Staff Years of Service
Paid Time Off Holidays Total Days
First Year 18.9 10.4 29.3 Second Year 19.7 10.4 30.1
Third Year 20.6 10.4 31.0 Fourth Year 21.4 10.4 31.8
Fifth Year 22.3 10.4 32.7 Sixth to Ninth Years 24.4 10.4 34.8
Tenth Year 26.3 10.4 36.7 Eleventh Year + 28.1 10.4 38.5

Compensation & Benefits Practices
Valuing Our Nonprofit Workforce 2014 Page 27
Other Time-Off Benefits A majority of organizations provide additional paid time for bereavement leave (78%) and jury duty (75%). Close to one-third of organizations provide paid time for maternity/paternity time off, while close to one-fourth provide time-off pay for family illness and military service. They are less likely to provide time-off pay for job-related education/training (10%) and volunteer service (2%).
Type of Time-Off Pay # of Organizations % of Organizations Bereavement 195 78% Jury service 186 74%
Maternity/paternity 81 32% Family illness 71 28%
Military service 57 23% Job-related education/training 24 10%
Volunteer service 4 2% In addition, 20% of respondents report that their organizations close their operations for some or all of the week between the Christmas and New Year’s holidays, providing several days off for employees that are in addition to their regular vacation/PTO and holiday time-off benefits.

Compensation & Benefits Practices
Page 28 © 2014 Third Sector New England & Nonprofit Compensation Associates
Insurance and Retirement Benefits Insurance Coverage Offered The majority of survey participants (90%) offer some type of insurance benefit to employees, at an average cost to the organization of $628 per employee, per month. Note that this figure includes the cost of medical insurance as well as dental, vision, life, long-term disability and long-term care, along with any other optional types of insurance coverage, which will differ by organization depending on their offerings. Many respondents offer more than one type of medical insurance plan, as detailed below. The tables on this page include organizations that offer insurance through flexible benefit plans (a.k.a. cafeteria plans) as well as through traditional insurance plans.
*Types of Medical Insurance Plans # of Organizations Offering
% of Organizations Offering
Health Maintenance Organization (HMO) 182 73% Preferred Provider Organization (PPO) 76 30%
Point of Service Plan (POS) 16 6% A monthly stipend is paid directly to employees 8 3%
Insurance is not provided 26 10% Total # of Organizations 250
*These numbers include organizations offering flexible benefit plans as well as traditional plans. **Some organizations offer more than one type of insurance plan.
*Other Types of Insurance # of Organizations Offering
% of Organizations Offering
Dental Care Insurance 181 72% Vision Care Insurance 83 33%
Life Insurance 141 56% Short-Term Disability Insurance 107 43% Long-Term Disability Insurance 131 52%
Long-Term Care Insurance 47 19% Voluntary Supplemental Plans 73 29%
A monthly stipend is paid directly to employees 8 3% Other types of insurance are not provided 58 23%
**Total # of Organizations 250 *These numbers include organizations offering flexible benefit plans as well as traditional plans. **Many organizations offer more than one type of insurance plan. The Employer Contribution tables on pages 30 - 36 detail the percentage of healthcare premiums paid by employers who offer traditional plans rather than cafeteria or flexible benefit plans. Results are displayed for all organizations reporting each type of insurance and by their insurance market: “Small market” refers to employers covering 50 or fewer employees; “Large market” refers to employers covering 51 or more employees. Some employers offer both Small and Large market plans, so their data appears only in the column for All Organizations.

Compensation & Benefits Practices
Valuing Our Nonprofit Workforce 2014 Page 29
Waiting Period for New Employees Survey participants were asked to specify the waiting period before coverage begins for new employees.
Waiting Period for New Employees # of Organizations Responding
% of Organizations Responding
No waiting period (coverage begins immediately) 112 52% up to 1 month 41 19%
up to 2 months 19 9% up to 3 months 39 18%
6 months 3 1% Total # of Organizations 214
Part-‐Time Employee Benefits Forty-three percent (43%) of respondents provide insurance benefits only to full-time employees. Of the respondents who report having part-time employees, 54% indicate that these employees are eligible for medical insurance coverage as long as they maintain a minimum number of hours per week. Twenty-three percent (23%) offer full benefits to qualifying part-time employees, who must work an average of 25 hours per week to be eligible for benefits. The other 31% of respondents provide pro-rated benefits to qualifying part-time employees, who must work an average of 21 hours per week to be eligible for benefits. Just 3% of respondents provide full insurance benefits (either full or pro-rated) to part-time employees regardless of their work schedules. Domestic Partner Benefits Since 2013, all responding organizations in this survey operate in states that recognize same sex marriage, thus all employers must provide benefits equally to all legally married couples. In many cases, prior to legalizing same sex marriage, employers had offered certain benefits to domestic partners of employees on the same basis as a spouse. Sixty-two percent (62%) of the respondents continue to offer medical insurance coverage to domestic partners of employees on the same basis as a spouse. This includes 55% that extend coverage to both same- sex and opposite-sex domestic partners, and 7% that extend coverage to same-sex domestic partners only. The remaining 38% indicate that they do not offer any medical coverage to domestic partners, whether same or opposite sex.

Compensation & Benefits Practices
Page 30 © 2014 Third Sector New England & Nonprofit Compensation Associates
Employer Contribution—HMO Insurance (Traditional Plans) The following tables show the average reported payment of medical insurance premiums by employers for both employees and their dependents, through a Health Maintenance Organization (HMO) plan. Results show that 99% of respondents that offer HMO coverage pay at least half of the premium cost for the employee. Twelve (12%) pay the entire premium cost for the employee. Note that the information in these tables does not include organizations that offer HMO coverage through a flexible benefit plan. Please note that a small number of employers offer both Small and Large market plans, so their data appears only in the column for All Organizations.
HMO Employer Contribution to
Employee Health All Organizations
# of Orgs % of Orgs Small Market Plans
# of Orgs % of Orgs Large Market Plans
# of Orgs % of Orgs Pay 100% of premium 17 12% 17 18% 0 0%
Pay 90 to 99% of premium 6 4% 2 2% 3 6% Pay 80 to 89% of premium 36 25% 22 24% 14 29% Pay 70 to 79% of premium 51 35% 31 33% 18 37% Pay 60 to 69% of premium 25 17% 14 15% 11 22% Pay 50 to 59% of premium 8 6% 6 6% 2 4%
Pay from 1 to 49% of premium 2 1% 1 1% 1 2% Do not pay any of the premium 0 0% 0 0% 0 0%
Total # Offering HMO 145 93 49 Seventy-two percent (72%) of respondents pay at least 50% of the cost of HMO coverage for their employees’ dependents.
HMO Employer Contribution to
Dependent Health All Organizations
# of Orgs % of Orgs Small Market Plans
# of Orgs % of Orgs Large Market Plans
# of Orgs % of Orgs Pay 100% of premium 4 3% 4 4% 0 0%
Pay 90 to 99% of premium 3 2% 1 1% 2 4% Pay 80 to 89% of premium 16 11% 13 14% 3 6% Pay 70 to 79% of premium 45 31% 26 28% 17 35% Pay 60 to 69% of premium 22 15% 12 13% 10 20% Pay 50 to 59% of premium 14 10% 8 9% 6 12%
Pay from 1 to 49% of premium 14 10% 7 8% 7 14% Do not pay any of the premium 27 19% 22 24% 4 8%
Total # Offering HMO 145 93 49
Respondents were asked to indicate a typical or average office co-payment for the types of insurance they offer. For HMO plans, co-payments ranged from $10 - $50, with an average of $21.93 and a median of $20.

Compensation & Benefits Practices
Valuing Our Nonprofit Workforce 2014 Page 31
Employer Contribution—PPO Insurance (Traditional Plans) The following tables show the average payment of premiums by employers for both employees and their dependents for medical insurance through a Preferred Provider (PPO) plan. Results show that 98% of respondents that offer PPO coverage pay at least half of the premium cost for the employee, and 6% pay the entire premium cost for the employee. Note that the information in these tables does not include organizations that offer PPO coverage through a flexible benefit plan. Please note that a small number of employers offer both Small and Large market plans, so their data appears only in the column for All Organizations.
PPO Employer Contribution to
Employee Health All Organizations
# of Orgs % of Orgs Small Market Plans
# of Orgs % of Orgs Large Market Plans
# of Orgs % of Orgs Pay 100% of premium 4 6% 3 9% 1 4%
Pay 90 to 99% of premium 3 5% 2 6% 0 0% Pay 80 to 89% of premium 19 31% 10 30% 9 35% Pay 70 to 79% of premium 21 34% 12 36% 7 27% Pay 60 to 69% of premium 9 15% 3 9% 6 23% Pay 50 to 59% of premium 5 8% 3 9% 2 8%
Pay from 1 to 49% of premium 1 2% 0 0% 1 4% Do not pay any of the premium 0 0% 0 0% 0 0%
Total # Offering PPO 62 33 26 Sixty-six percent (66%) of the organizations pay at least 50% of the cost of PPO coverage for their employees’ dependents.
PPO Employer Contribution to
Dependent Health All Organizations
# of Orgs % of Orgs Small Market Plans
# of Orgs % of Orgs Large Market Plans
# of Orgs % of Orgs Pay 100% of premium 0 0% 0 0% 0 0%
Pay 90 to 99% of premium 1 2% 1 3% 0 0% Pay 80 to 89% of premium 9 15% 6 18% 3 12% Pay 70 to 79% of premium 15 24% 8 24% 5 19% Pay 60 to 69% of premium 6 10% 2 6% 4 15% Pay 50 to 59% of premium 10 16% 4 12% 6 23%
Pay from 1 to 49% of premium 7 11% 3 9% 4 15% Do not pay any of the premium 14 23% 9 27% 4 15%
Total # Offering PPO 62 33 26 Respondents were asked to indicate a typical or average office co-payment for the types of insurance they offer. For PPO plans, co-payments ranged from $10 - $40, with an average of $20.98 and a median of $20.

Compensation & Benefits Practices
Page 32 © 2014 Third Sector New England & Nonprofit Compensation Associates
Employer Contribution—POS Insurance (Traditional Plans) The following tables show the average payment of premiums by employers for both employees and their dependents for medical insurance through a Point of Service (POS) plan. Results show that all respondents that offer POS coverage pay at least half of the premium cost for the employee, and 13% pay the entire premium cost for the employee. Note that the information in these tables does not include organizations that offer POS coverage through a flexible benefit plan. Please note that a small number of employers offer both Small and Large market plans, so their data appears only in the column for All Organizations.
POS Employer Contribution to
Employee Health All Organizations
# of Orgs % of Orgs Small Market Plans
# of Orgs % of Orgs Large Market Plans
# of Orgs % of Orgs Pay 100% of premium 2 13% 2 40% 0 0%
Pay 90 to 99% of premium 0 0% 0 0% 0 0% Pay 80 to 89% of premium 6 40% 1 20% 5 56% Pay 70 to 79% of premium 5 33% 1 20% 3 33% Pay 60 to 69% of premium 2 13% 1 20% 1 11% Pay 50 to 59% of premium 0 0% 0 0% 0 0%
Pay from 1 to 49% of premium 0 0% 0 0% 0 0% Do not pay any of the premium 0 0% 0 0% 0 0%
Total # Offering POS 15 5 9 Seventy-three percent (73%) of respondents pay at least 50% of the cost of POS coverage for their employees’ dependents.
POS Employer Contribution to
Dependent Health All Organizations
# of Orgs % of Orgs Small Market Plans
# of Orgs % of Orgs Large Market Plans
# of Orgs % of Orgs Pay 100% of premium 0 0% 0 0% 0 0%
Pay 90 to 99% of premium 0 0% 0 0% 0 0% Pay 80 to 89% of premium 3 20% 1 20% 2 22% Pay 70 to 79% of premium 4 27% 0 0% 3 33% Pay 60 to 69% of premium 4 27% 1 20% 3 33% Pay 50 to 59% of premium 0 0% 0 0% 0 0%
Pay from 1 to 49% of premium 2 13% 2 40% 0 0% Do not pay any of the premium 2 13% 1 20% 1 11%
Total # Offering POS 15 5 9
Respondents were asked to indicate a typical or average office co-payment for the types of insurance they offer. For POS plans, co-payments ranged from $15 - $50 with an average of $26.25 and a median of $25. Please note that because data about the POS plans is limited to a relatively small sample, it may not be informative of larger trends.

Compensation & Benefits Practices
Valuing Our Nonprofit Workforce 2014 Page 33
Employer Contribution—Dental Care (Traditional Plans) The following tables show the average payment of premiums by employers for both employees and their dependents for dental insurance. Sixty-seven percent (67%) of survey participants that offer dental insurance pay at least half of the premium cost for the employee, and 13% pay the entire premium cost for the employee. Note that the information in these tables does not include organizations that offer dental coverage through a flexible benefit plan. Please note that a small number of employers offer both Small and Large market plans, so their data appears only in the column for All Organizations.
Employer Contribution to Employee Dental Care
All Organizations # of Orgs % of Orgs
Small Market Plans # of Orgs % of Orgs
Large Market Plans # of Orgs % of Orgs
Pay 100% of premium 19 13% 15 18% 4 7% Pay 90 to 99% of premium 2 1% 2 2% 0 0% Pay 80 to 89% of premium 16 11% 10 12% 5 9% Pay 70 to 79% of premium 25 17% 17 20% 8 14% Pay 60 to 69% of premium 11 8% 6 7% 5 9% Pay 50 to 59% of premium 24 17% 9 11% 15 26%
Pay from 1 to 49% of premium 16 11% 6 7% 9 16% Do not pay any of the premium 31 22% 19 23% 11 19%
Total # Offering Dental 144 84 57 Fifty-two percent (52%) of respondents pay at least 50% of the cost of dental care for their employees’ dependents.
Employer Contribution to Dependent Dental Care
All Organizations # of Orgs % of Orgs
Small Market Plans # of Orgs % of Orgs
Large Market Plans # of Orgs % of Orgs
Pay 100% of premium 9 6% 7 8% 2 4% Pay 90 to 99% of premium 2 1% 2 2% 0 0% Pay 80 to 89% of premium 10 7% 7 8% 2 4% Pay 70 to 79% of premium 22 15% 13 15% 9 16% Pay 60 to 69% of premium 12 8% 5 6% 7 12% Pay 50 to 59% of premium 20 14% 9 11% 11 19%
Pay from 1 to 49% of premium 15 10% 5 6% 9 16% Do not pay any of the premium 54 38% 36 43% 17 30%
Total # Offering Dental 144 84 57

Compensation & Benefits Practices
Page 34 © 2014 Third Sector New England & Nonprofit Compensation Associates
Employer Contribution—Vision Care (Traditional Plans) The following tables show the average payment of premiums by employers for both employees and their dependents for vision insurance. Thirty-one percent (31%) of survey participants that offer vision insurance pay at least half of the premium cost for the employee, and 12% pay the entire premium cost for the employee. Note that the information in these tables does not include vision coverage offered through a flexible benefit plan. Please note that a small number of employers offer both Small and Large market plans, so their data appears only in the column for All Organizations.
Employer Contribution to Employee Vision Care
All Organizations # of Orgs % of Orgs
Small Market Plans # of Orgs % of Orgs
Large Market Plans # of Orgs % of Orgs
Pay 100% of premium 9 12% 6 14% 3 10% Pay 90 to 99% of premium 0 0% 0 0% 0 0% Pay 80 to 89% of premium 4 5% 2 5% 2 7% Pay 70 to 79% of premium 4 5% 3 7% 1 3% Pay 60 to 69% of premium 2 3% 0 0% 2 7% Pay 50 to 59% of premium 4 5% 2 5% 2 7%
Pay from 1 to 49% of premium 2 3% 2 5% 0 0% Do not pay any of the premium 48 66% 28 65% 19 66%
Total # Offering Vision 73 43 29 Twenty-five percent (25%) of respondents pay at least 50% of the cost of vision care for their employees’ dependents.
Employer Contribution to Dependent Vision Care
All Organizations # of Orgs % of Orgs
Small Market Plans # of Orgs % of Orgs
Large Market Plans # of Orgs % of Orgs
Pay 100% of premium 7 10% 5 12% 2 7% Pay 90 to 99% of premium 0 0% 0 0% 0 0% Pay 80 to 89% of premium 0 0% 0 0% 0 0% Pay 70 to 79% of premium 3 4% 2 5% 1 3% Pay 60 to 69% of premium 3 4% 1 2% 2 7% Pay 50 to 59% of premium 5 7% 3 7% 2 7%
Pay from 1 to 49% of premium 1 1% 1 2% 0 0% Do not pay any of the premium 54 74% 31 72% 22 76%
Total # Offering Vision 73 43 29

Compensation & Benefits Practices
Valuing Our Nonprofit Workforce 2014 Page 35
Employer Contribution—Life Insurance Benefits (Traditional Plans) Seventy-three percent (73%) of respondents that provide life insurance for their staff pay the entire premium for their employees. Note that the information in this table does not include organizations that offer life insurance through a flexible benefit plan. Please note that a small number of employers offer both Small and Large market plans, so their data appears only in the column for All Organizations.
Employer Contribution to Employee Life
All Organizations # of Orgs % of Orgs
Small Market Plans # of Orgs % of Orgs
Large Market Plans # of Orgs % of Orgs
Pay 100% of premium 90 73% 47 69% 42 78% Pay 50 to 99% of premium 6 5% 3 4% 3 6%
Pay from 1 to 49% of premium 1 1% 0 0% 1 2% Do not pay any of the premium 26 21% 18 26% 8 15%
Total # Offering Life 123 68 54 Employer Contribution—Short-‐Term Disability (Traditional Plans) Fifty-six percent (56%) of respondents that provide short-term disability insurance for their staff pay the entire premium for their employees. Note that the information in this table does not include organizations that offer long-term disability coverage through a flexible benefit plan. Please note that a small number of employers offer both Small and Large market plans, so their data appears only in the column for All Organizations.
Employer Contribution to Employee STD
All Organizations # of Orgs % of Orgs
Small Market Plans # of Orgs % of Orgs
Large Market Plans # of Orgs % of Orgs
Pay 100% of premium 53 56% 33 59% 20 54% Pay 50 to 99% of premium 4 4% 1 2% 3 8%
Pay from 1 to 49% of premium 0 0% 0 0% 0 0% Do not pay any of the premium 37 39% 22 39% 14 38%
Total # Offering LTD 94 56 37

Compensation & Benefits Practices
Page 36 © 2014 Third Sector New England & Nonprofit Compensation Associates
Employer Contribution—Long-‐Term Disability (Traditional Plans) Sixty-eight percent (68%) of respondents that provide long-term disability (LTD) insurance for their staff pay the entire premium for their employees. Note that the information in this table does not include organizations that offer long-term disability coverage through a flexible benefit plan. Please note that a small number of employers offer both Small and Large market plans, so their data appears only in the column for All Organizations.
Employer Contribution to Employee LTD
All Organizations # of Orgs % of Orgs
Small Market Plans # of Orgs % of Orgs
Large Market Plans # of Orgs % of Orgs
Pay 100% of premium 82 68% 43 64% 38 75% Pay 50 to 99% of premium 4 3% 2 3% 1 2%
Pay from 1 to 49% of premium 0 0% 0 0% 0 0% Do not pay any of the premium 34 28% 22 33% 12 24%
Total # Offering LTD 120 67 51 Employer Contribution—Long-‐Term Care (Traditional Plans) Thirteen percent (13%) of respondents that provide long-term care (LTC) insurance for their staff pay the entire premium for their employees. Note that the information in this table does not include organizations that offer long-term care coverage through a flexible benefit plan. Please note that a small number of employers offer both Small and Large market plans, so their data appears only in the column for All Organizations.
Employer Contribution to Employee Long-Term Care
All Organizations # of Orgs % of Orgs
Small Market Plans # of Orgs % of Orgs
Large Market Plans # of Orgs % of Orgs
Pay 100% of premium 6 13% 3 11% 3 16% Pay 50 to 99% of premium 0 0% 0 0% 0 0%
Pay from 1 to 49% of premium 0 0% 0 0% 0 0% Do not pay any of the premium 40 87% 24 89% 16 84%
Total # Offering LTC 46 27 19 Voluntary Supplemental Plans (Traditional Plans) Voluntary supplemental plans are paid for by employees, and may include additional life insurance, accidental death and dismemberment insurance, short-term disability insurance, as well as other types of plans. Of the organizations that administer traditional group insurance benefits rather than flexible benefits plans or stipends, sixty-one organizations offer some type of voluntary supplemental plans to employees. This number represents 35% of this sample of organizations.

Compensation & Benefits Practices
Valuing Our Nonprofit Workforce 2014 Page 37
Section 125 Plans Section 125 plans use pre-tax dollars to pay for employee benefits. The most comprehensive type of Section 125 plans reported in this survey is the cafeteria plan or flexible benefits plan, in which employers provide a certain dollar allotment per employee and employees choose their benefits from a list, paying the difference if their chosen benefits cost more than the allotment. Overall, 17% of all participants indicate they offer employees a choice of benefits through a cafeteria or flexible benefit plan. On average, employers contribute $455 per month, per employee toward these plans. The types of insurance offered as a part of these programs follow:
*Type of Insurance Offered All Organizations
# of Orgs % of Orgs Small Market Plans
# of Orgs % of Orgs Large Market Plans
# of Orgs % of Orgs HMO 37 88% 17 89% 20 87%
PPO 14 33% 5 26% 9 39% POS 1 2% 0 0% 1 4%
Dental Care 37 88% 16 84% 21 91% Vision Care 10 24% 3 16% 7 30%
Life Insurance 18 43% 7 37% 11 48% Short-Term Disability 13 31% 4 21% 9 39% Long-Term Disability 11 26% 4 21% 7 30%
Long-Term Care 1 2% 0 0% 1 4% Voluntary Supplemental Plans 12 29% 4 21% 8 35%
Other 2 5% 0 0% 2 9%
Total # Offering Cafeteria Plan 42 19 23 * Many of these plans may be the same or similar to plans otherwise offered by an organization. In this case, employees may have a wider array of choices. Other types of Section 125 plans include: • Premium-Only Plan, which is a simplified version of the cafeteria plan. Forty-five percent
(45%) of surveyed organizations administer their insurance benefits through a premium-only plan.
• Flexible Spending Account (FSA), in which pre-tax dollars are set aside by employees for their health care (Health Care Spending Account or HCSA) or dependent care (Dependent Care Spending Account or DCSA). Forty-seven percent (47%) of surveyed organizations offer an HCSA and/or DCSA to employees. These accounts are usually funded completely by employee contributions. Respondents reported that the maximum amount employees may contribute annually to HCSA accounts ranges between $1,000 to $5,000 per organization. The median maximum contribution reported is $2,500.

Compensation & Benefits Practices
Page 38 © 2014 Third Sector New England & Nonprofit Compensation Associates
Special Insurance-‐Related Accounts HRA (Health Reimbursement Arrangement): The employer contributes a certain amount per employee per year for health-care expenses. This money may be rolled from one year to the next, but may not be portable when an employee leaves his/her job. An HRA is often used in conjunction with traditional insurance coverage, but in some cases an HRA replaces traditional coverage and reimburses employees for coverage that they purchase as individuals. Sixty responding organizations (24%) offer an HRA to employees, with the average annual contribution ranging from $500 to $3,500 per employee. HSA (Health Savings Account): The employee and/or employer make pre-tax contributions that are used by the employee for future medical or long-term care premium expenses. These accounts are used in conjunction with a high-deductible health insurance plan. The funds can roll over from year to year and the account is portable. Eighteen organizations (7%) offer an HSA-compatible HMO plan, with a median annual contribution from the organization of $900 for a single employee, $1,800 for an employee plus one dependent, and $1,800 for a family. Seven organizations (3%) offer an HSA-compatible PPO plan, with a median annual contribution from the organization of $750 for a single employee, $1,125 for an employee plus one dependent, and $1,500 for a family.

Compensation & Benefits Practices
Valuing Our Nonprofit Workforce 2014 Page 39
Retirement Benefits Seventy-one percent (71%) of survey participants indicate they offer some type of retirement benefit to their employees. Of the respondents who have part-time employees, 55% indicate that their part-time employees are eligible for retirement benefits as long as they maintain a minimum number of hours per week (on average, 21 hours per week), while 26% make benefits available to employees regardless of the number of hours worked. The remaining 19% cover only full-time employees. In 66% of organizations that contribute to retirement benefits, there is a vesting period of time after which the benefits fully belong to the employee. This period ranges from 1 year to 6 years, with an average of 3.6 years and median of 3 years. The remaining 34% of respondents have no vesting period. Among organizations that offer benefits through a cafeteria plan, 48% allow employees to designate some portion of their benefit dollars toward an organization-sponsored retirement plan. The types of plans offered are detailed below:
Type of Plan Offered # of
Organizations Who Offer
% of Organizations
Who Offer Tax-Sheltered Annuity: 401(k), 403(b) 144 58%
Other Defined Contribution Plan 13 5% IRA/SEP-IRA 21 8%
Defined Benefit Plan 8 3% Other 3 1%
No Retirement Benefit 72 29% *Total # of Organizations 250
*Some organizations offer more than one type of plan. Among organizations that offer a tax-sheltered annuity plan, 41% have conducted an audit of the plan during the past 12 months. Of those, 7% either have considered, or are considering discontinuing the plan. Reasons cited included both budgetary and compliance issues.

Compensation & Benefits Practices
Page 40 © 2014 Third Sector New England & Nonprofit Compensation Associates
Retirement Benefits—Funding Almost two-thirds of responding organizations (63%) offering a single or multiple retirement plan, share responsibility for funding with their employees. Twenty-five percent (25%) offer plans that are funded solely by the employee.
Funding of Retirement Plans *
# of Organizations
Who Fund Through:
% of Organizations
Who Fund Through:
Employee contribution only 44 25% Organization contribution only 14 8%
Organization contributes/employee may contribute 50 28% If employee contributes, organization contributes 62 35%
Other 8 4% Total # of Organizations 178
*If organization has more than one type of plan, the responses are based on the plan with higher level of contribution from the organization.
Retirement Benefits—Contributions Of the organizations that contribute to the funding of a retirement benefit, 88% base their contribution on a percentage of their employees’ salary and 4% use a flat dollar amount:
Type of Limit on Contribution * # of Organizations
% of Organizations Average Limit
% of salary 118 88% 4.88% Flat dollar amount 5 4% insufficient data
Other 11 8% *Total # of Organizations 134
*If organization has more than one type of plan, the responses are based on the plan with the highest level of contribution from the organization.

Compensation & Benefits Practices
Valuing Our Nonprofit Workforce 2014 Page 41
Executive Director/CEO Profile Employment Contract Twenty percent (20%) of the Executive Directors/CEOs (Executive Directors) in the survey have an employment contract:
Employment Contract # of Organizations % of Organizations
Executive Director has contract 50 20% Executive Director does not have contract 194 80%
Gender Well over half of the Executive Directors in the sample are female.
Executive Director Gender # of Organizations % of Organizations
Male Executive Director/CEO 91 41% Female Executive Director/CEO 131 59%
Gender and Compensation Male Executive Directors in this survey’s sample earn on average 32% more than female Executive Directors. The difference in pay appears to be related to the fact that, while over half (59 percent) of the Executive Directors in the sample are female, the male Executive Directors are more heavily represented in the largest organizations. When this is taken into account, pay for males is not consistently and/or significantly higher than for females in each group of similarly sized organizations, though the difference between pay for males and females tends to increase with organizational size. The issue of the disproportionate representation of men and women at small and large organizations remains, however. (See the chart below for details).
Annual Operating Budget % Male Average Salary,
Males % Female Average Salary,
Females Female Pay as %
of Male Pay
to $249,999 25% $53,069 75% $52,902 99.7% $250,000 - $999,999 28% $75,906 72% $71,738 94.5%
$1,000,000 - $2,499,999 38% $111,335 62% $103,617 93.1% $2,500,000 - $9,999,999 46% $145,769 54% $129,310 88.7%
$10,000,000 - $24,999,999 52% $175,459 48% $148,857 84.8% $25,000,000 and over 60% $228,981 40% $209,206 91.4%
All Responses 41% $139,506 59% $106,214 76.0%

Compensation & Benefits Practices
Page 42 © 2014 Third Sector New England & Nonprofit Compensation Associates
Education and Compensation Seventy percent (70%) of the Executive Directors in the survey hold Master’s Degrees or Doctorates. As indicated below, salaries generally increase with the level of education.
Level of Education # of Incumbents Achieving Level Average Salary
High School 3 n. a. Some College/Associate’s Degree 8 $74,025
Bachelor’s Degree 56 $94,254 Master’s Degree 131 $127,116
Doctorate 22 $170,084
Time in Position and Compensation The table below illustrates the average salaries of Executive Directors in terms of how long they have been in their current position. On average, incumbents have served in these positions for 13.2 years. As you can see from the table below, the correlation in pay for Executive Directors based upon their time in the job is not as clear as it is for other factors (for example, budget, numbers of employees, education).
Years in Current Job # of Incumbents Average Salary
Less than one year 15 $108,652 1.0 to 1.9 years 27 $103,214 2.0 to 2.9 years 19 $101,575 3.0 to 4.9 years 27 $122,338 5.0 to 6.9 years 24 $114,526 7.0 to 9.9 years 24 $124,503
10.0 years and over 91 $130,141
Average of 13.2 years 227 $119,952 The table below illustrates the average salaries of these employees in terms of their total number of years of experience as an Executive Director, both in their current position, and in previous nonprofit and/or private sector experience. Individuals have an average of 15.5 years of total experience.

Compensation & Benefits Practices
Valuing Our Nonprofit Workforce 2014 Page 43
Years as Executive
Director/CEO # of Incumbents Average Salary
Less than one year 9 $107,681 1.0 to 1.9 years 16 $104,890 2.0 to 2.9 years 11 $93,950 3.0 to 4.9 years 24 $103,233 5.0 to 6.9 years 23 $107,099 7.0 to 9.9 years 29 $121,502
10.0 years and over 115 $131,164
Average of 15.5 years 227 $119,952
Setting Compensation of the Executive Director/CEO Ninety-six percent (96%) of survey participants confirmed that their organization’s board of directors formally approved the current compensation of their Executive Director. Fifty-four percent (54%) report that a formal salary survey was conducted to determine reasonable compensation for the Executive Director. Executive Director/CEO Search Organizations whose current Executive Director has served in that position for five years or less were asked how the organization identified this individual as a candidate to fill the position at the time of hire.
Search Method # of Organizations % of Organizations
Word of mouth 18 17% Craigslist or other online service 13 12%
Executive search firm 24 22% Internal candidate/former employee/founder 38 35%
Current or former Board member 2 2% Other 14 13%
# Organizations Responding 109 Additional Benefits Provided to the Executive Director For a list of other benefits provided to Executive Director incumbents, please see the chart detailing miscellaneous employee benefits on page 23.

Compensation & Benefits Practices
Page 44 © 2014 Third Sector New England & Nonprofit Compensation Associates

V. Compensation by Position
Valuing Our Nonprofit Workforce 2014 Page 45
This section details the compensation for individual job titles according to multiple parameters including:
• Annual operating budget of organization • Location of organization • Field of service of organization • Total number of employees of organization • Years of experience required by position • Education level required by position • Sex of employee • Race of employee • Number of years of tenure in position • Number of employees managed by employee in this position
To ensure the confidentiality of all data, a minimum number of responses must have been received in order to report on each statistic.
• At least five organizations are required to report compensation in any data subset • At least five incumbents (employees) in a data subset are required to report the average • Five incumbents are required to report the median • Meaningful percentiles require a larger sample of data, so where the findings for any
positions reported on less than twelve (12) employees, pay at the 10th, 25th, 75th and 90th percentiles is not included
• When there is insufficient data, cells in the individual reports are left blank • In cases where 50% or more of the responses came from a single organization, only the
median and average are reported

Responsible to the Board of Directors for management of the entire nonprofit organization including fundraising/development, human resources, strategic planning, programs, finance and communications. Represents organization to government agencies, community and the public.
005Executive
© 2014 Third Sector New England & Nonprofit Compensation Associates
Executive Director/Chief Executive Officer
Page 46
Number of Orgs Emps
25th %ile
Median (50%)
Avg by Org
75th %ile
Annual Base Salaries10th %ile
90th %ile
Avg by Employee
All Organizations:
By Budget Size: to $249,999 $250,000 - $999,999 $1,000,000 - $2,499,999 $2,500,000 - $9,999,999 $10,000,000 - $24,999,999 $25,000,000 and overBy Geographic Location: Berkshire County Region Western Massachusetts Region Central Massachusetts Region Greater Boston Region Northeastern Massachusetts Region Southeastern Massachusetts/Rhode Island RegionBy Field of Service: Srvcs & Adv: Children and youth Srvcs & Adv: Immigrant, GLBT, minority, other Srvcs & Adv: Elderly, developmentally disabled Philanthropy Arts, culture, recreation Environment, conservation, animal welfare Housing and homelessness prevention Cmnty/econ dev, social justice, legal, civil rights Counseling, crisis interv, mental hlth, medical Association and memberships Public policy and education reform Food programs & pantries, nutrition, agriculture Health and fitness, wellnessBy Number of Employees: 1 - 2 3 - 5 6 - 10 11 - 25 26 - 50 51 -100 101 - 250 251+By Years of Experience Required: 2 - 3 Years 4 - 6 Years 7 - 10 Years More than 10 yearsBy Level of Education Required: Bachelor's Degree Master's Degree DoctorateBy Gender of Employee: Male FemaleBy Race/Ethnicity of Employee: Black WhiteBy Number of Years in Position: Up to 5 Years 5 - 10 Years 11 - 20 Years More than 20 Years
227
-----------------244645613120
-----------------204532603535
-----------------40
836
53313162222
510
95
-----------------1223313835183733
-----------------11646318
-----------------8193
7-----------------
92135
-----------------7
198-----------------
96463748
227
-----------------244645613120
-----------------204532603535
-----------------40
836
53313162222
510
95
-----------------1223313835183733
-----------------11646318
-----------------8193
7-----------------
92135
-----------------7
198-----------------
96463748
$54,596
-------------------35,36049,49675,64585,010
111,509129,860
-------------------40,36671,89748,61969,09456,09445,053
-------------------52,416
63,430
48,35639,39566,29256,66868,664
-------------------37,85636,20948,10659,78769,33179,17398,866
122,300-------------------
47,74780,96244,720
-------------------50,33663,540
-------------------66,95349,970
-------------------
54,795-------------------
49,49661,98060,00651,800
$75,005
-----------------40,91955,99991,25099,382
128,003185,900
-----------------49,00580,03961,35090,54376,00369,992
-----------------86,045
98,894
62,27260,16086,75787,87579,238
-----------------43,75852,00061,00075,75487,52690,002
112,143142,253
-----------------
60,00298,88396,086
-----------------65,27189,991
-----------------91,62466,997
-----------------
74,532-----------------
66,74976,59671,13691,031
$104,998
-----------------50,44069,49398,114
120,536150,134221,427
-----------------82,556
105,019100,932116,855
98,86299,174
-----------------109,481
77,442136,290113,693
80,00070,24796,897
100,922131,841
94,515151,014
76,003105,019
-----------------52,95762,40079,99794,006
108,160130,000138,549180,003
-----------------124,509
81,339133,328163,883
-----------------91,499
120,016213,325
-----------------124,755
95,680-----------------
107,931103,990
-----------------97,022
104,51098,862
122,263
$150,134
-----------------62,40086,648
114,473172,122187,500271,306
-----------------117,296148,907173,966153,603159,994158,787
-----------------138,669
181,511
138,091113,631125,819137,992209,482
-----------------64,80874,88096,907
112,819154,128174,897189,753240,126
-----------------
109,538177,008188,927
-----------------116,543174,159
-----------------187,821134,992
-----------------
148,354-----------------
139,189171,085152,839175,891
$209,447
-----------------71,78496,587
151,740217,297211,856297,546
-----------------150,896201,573224,536200,039221,886242,104
-----------------186,750
242,345
197,434267,887200,570169,363234,848
-----------------69,87190,002
135,554153,394213,324242,784214,519287,519
-----------------
130,406248,883208,504
-----------------153,612240,153
-----------------233,486179,163
-----------------
213,325-----------------
205,298222,308192,113235,198
$119,952
-----------------52,94472,916
106,533136,865162,587221,071
-----------------91,407
121,277118,269127,652121,776121,075
-----------------116,815
95,907143,126135,383102,678102,024112,362110,125141,470
99,399160,519
84,293126,464
-----------------53,21362,09584,53099,476
126,171135,827150,314192,101
-----------------121,094
86,079146,327145,601
-----------------96,987
135,928232,868
-----------------139,506106,627
-----------------131,168119,366
-----------------112,391124,863116,027133,393

010Executive
Associate Director/Chief Operating OfficerProvides direction and day-to-day management of several key functions other than programs such as finance, administration, human resources, and/or development; assumes responsibility for major projects; assumes responsibility for organization in absence of Executive Director. Participates as a member of the senior management team to formulate and implement policies and plans to meet the organization's short- and long-term objectives.
Valuing our Nonprofit Workforce 2014 Page 47
Number of Orgs Emps
All Organizations:
By Budget Size: $250,000 - $999,999 $1,000,000 - $2,499,999 $2,500,000 - $9,999,999 $10,000,000 - $24,999,999 $25,000,000 and overBy Geographic Location: Western Massachusetts Region Central Massachusetts Region Greater Boston Region Northeastern Massachusetts Region Southeastern Massachusetts/Rhode Island RegionBy Field of Service: Srvcs & Adv: Children and youth Srvcs & Adv: Elderly, developmentally disabled Arts, culture, recreation Housing and homelessness prevention Cmnty/econ dev, social justice, legal, civil rights Counseling, crisis interv, mental hlth, medicalBy Number of Employees: 11 - 25 26 - 50 51 -100 101 - 250 251+By Years of Experience Required: 2 - 3 Years 4 - 6 Years 7 - 10 YearsBy Level of Education Required: Bachelor's Degree Master's DegreeBy Gender of Employee: Male FemaleBy Race/Ethnicity of Employee: Black WhiteBy Number of Years in Position: Up to 5 Years 5 - 10 Years 11 - 20 Years More than 20 YearsBy Number of Employees Managed: 1 to 3 4 to 8 15 and over
75
-----------------6
10252014
-----------------1512211114
-----------------1320
8678
-----------------1111
82020
-----------------8
2518
-----------------3127
-----------------2546
-----------------5
60-----------------
29171014
-----------------111934
83
-----------------6
10262417
-----------------1713251214
-----------------1324
8889
-----------------1112
82522
-----------------8
2619
-----------------3230
-----------------2551
-----------------5
67-----------------
31191015
-----------------112036
$60,594
-------------------
59,40376,83588,936
-------------------56,79262,60060,73269,55552,021
-------------------64,18958,251
-------------------
52,948
71,83986,690
-------------------
59,49073,944
-------------------53,34877,302
-------------------60,60758,690
-------------------
59,663-------------------
56,85171,760
64,617-------------------
70,00069,661
$78,000
-----------------
76,67491,01694,422
-----------------78,96892,14474,81872,93069,519
-----------------79,07277,751
-----------------
70,086
83,741113,189
-----------------
73,75279,997
-----------------69,52490,428
-----------------72,85278,000
-----------------
78,146-----------------
69,99289,835
97,001-----------------
80,23181,120
$95,680
-----------------59,64471,71894,131
115,721129,459
-----------------89,835
115,19093,725
100,08088,379
-----------------92,123
110,39681,71392,758
115,700113,568
-----------------75,69188,30784,20997,001
128,730-----------------
85,38484,885
125,008-----------------
80,975123,864
-----------------100,630
92,123-----------------
79,99799,008
-----------------81,016
117,54193,340
128,001-----------------
72,23889,835
101,504
$129,459
-----------------
119,777132,933165,371
-----------------120,994149,916130,956133,526124,972
-----------------117,385134,503
-----------------
132,521
129,459162,552
-----------------
112,835164,008
-----------------107,838149,521
-----------------144,310123,427
-----------------
130,000-----------------
119,600141,544
143,166-----------------
139,760133,526
$157,901
-----------------
148,368150,790207,854
-----------------151,536259,563163,946154,989161,367
-----------------126,171176,343
-----------------
156,514
150,014179,878
-----------------
148,233182,000
-----------------139,491174,504
-----------------171,995152,768
-----------------
160,846-----------------
153,117170,040
229,466-----------------
179,806152,635
$105,906
-----------------60,46974,41699,598
113,803138,966
-----------------99,286
131,800101,346104,357
99,559-----------------
94,821116,464
90,966111,163115,146110,129
-----------------76,88299,27388,449
105,765138,408
-----------------86,51894,758
129,965-----------------
87,547126,871
-----------------116,030100,660
-----------------94,856
108,124-----------------
93,179114,934
92,602131,456
-----------------83,652
114,663107,279
25th %ile
Median (50%)
Avg by Org
75th %ile
Annual Base Salaries10th %ile
90th %ile
$103,883
-----------------60,46974,41698,090
114,795138,294
-----------------100,546122,230
99,884101,427
99,559-----------------
94,821112,484
90,966118,272111,983106,822
-----------------76,88295,81788,449
108,283133,088
-----------------86,51893,085
123,483-----------------
88,121121,980
-----------------116,030100,183
-----------------94,856
106,377-----------------
93,524117,887
92,602131,090
-----------------83,652
107,717106,930
Avg by Employee

Directs delivery of programs in accordance with the organization's goals and objectives. May write or participate in writing of grant applications, depending on structure of organization. Ensures program activities comply with contracts. Supervises program staff either directly or through intermediary supervisors. Acts as liaison with government agencies, the community and the public relative to funding, contracts and delivery of services. Participates as a member of the senior management team in the development and implementation of organization-wide policies and programs that contribute to its overall success. This is a single-incumbent position. Report others in other program-related jobs (e.g., 140, 420, 421, 430, 435, 853, 856, 950, 955).
015Executive
© 2014 Third Sector New England & Nonprofit Compensation Associates
Director, Program(s)
Page 48
Number of Orgs Emps
All Organizations:
By Budget Size: $1,000,000 - $2,499,999 $2,500,000 - $9,999,999 $10,000,000 - $24,999,999 $25,000,000 and overBy Geographic Location: Western Massachusetts Region Central Massachusetts Region Greater Boston Region Northeastern Massachusetts Region Southeastern Massachusetts/Rhode Island RegionBy Field of Service: Srvcs & Adv: Children and youth Srvcs & Adv: Elderly, developmentally disabled Arts, culture, recreation Housing and homelessness prevention Cmnty/econ dev, social justice, legal, civil rights Counseling, crisis interv, mental hlth, medicalBy Number of Employees: 6 - 10 11 - 25 26 - 50 51 -100 101 - 250 251+By Years of Experience Required: 4 - 6 Years 7 - 10 YearsBy Level of Education Required: Bachelor's Degree Master's DegreeBy Gender of Employee: Male FemaleBy Race/Ethnicity of Employee: WhiteBy Number of Years in Position: Up to 5 Years 5 - 10 Years 11 - 20 Years More than 20 YearsBy Number of Employees Managed: 1 to 3 4 to 8 9 to 14 15 and over
60
-----------------12211311
-----------------11
622
810
-----------------1212
5587
-----------------6798
1217
-----------------2513
-----------------2924
-----------------2639
-----------------53
-----------------251918
8-----------------
1117
923
82
-----------------13242118
-----------------14
6301513
-----------------1519
57
1212
-----------------68
138
1729
-----------------3219
-----------------3730
-----------------3248
-----------------69
-----------------292220
9-----------------
12201028
$68,409
-------------------66,43172,70068,01382,389
-------------------67,517
72,72367,06365,416
-------------------67,88469,326
66,62773,900
-------------------
71,305
70,09672,446
-------------------67,16170,699
-------------------68,86467,997
-------------------78,88267,964
-------------------69,326
-------------------67,01868,47172,913
-------------------66,62767,548
69,162
$77,381
-----------------67,74680,22174,70389,477
-----------------72,915
85,21372,44682,389
-----------------72,53073,653
74,40282,420
-----------------
85,145
80,98582,972
-----------------72,55283,554
-----------------73,08582,197
-----------------84,00172,905
-----------------77,054
-----------------73,45577,38181,562
-----------------76,25374,402
72,615
$89,752
-----------------70,26294,94285,862
112,674-----------------
83,88784,18890,72081,61992,206
-----------------85,86290,00290,66790,29384,282
111,041-----------------
68,76581,43287,381
108,45189,85694,474
-----------------83,92898,446
-----------------84,21991,250
-----------------102,534
85,540-----------------
90,002-----------------
90,00288,61992,06184,219
-----------------85,38490,33585,01090,075
$113,314
-----------------85,811
117,41695,784
145,265-----------------
86,970
114,588120,304120,006
-----------------104,998114,039
90,423137,761
-----------------
115,399
109,148122,375
-----------------100,168123,594
-----------------106,943115,096
-----------------121,352103,022
-----------------113,329
-----------------112,643118,918113,869
-----------------91,655
111,514
119,842
$137,244
-----------------113,672144,102121,572195,677
-----------------136,750
149,019160,954128,610
-----------------122,266160,014
133,301185,734
-----------------
148,108
116,580171,434
-----------------126,283149,323
-----------------124,700145,849
-----------------168,008124,573
-----------------140,348
-----------------127,982149,344147,391
-----------------120,207122,664
144,870
$98,129
-----------------78,670
101,00888,726
124,196-----------------
87,82595,394
103,85496,41398,453
-----------------89,130
102,666100,199
95,42587,443
115,124-----------------
72,50985,189
100,313106,090
92,163108,463
-----------------90,145
107,806-----------------
90,540101,570
-----------------110,752
89,718-----------------
98,807-----------------
97,96598,312
100,07692,580
-----------------86,86599,04699,73899,775
25th %ile
Median (50%)
Avg by Org
75th %ile
Annual Base Salaries10th %ile
90th %ile
$98,195
-----------------78,77199,84592,936
128,336-----------------
88,56895,394
104,39294,305
100,039-----------------
89,652109,984100,199
94,24587,603
114,331-----------------
72,50986,29399,619
106,09093,264
113,125-----------------
90,981104,164
-----------------92,28398,517
-----------------111,238
90,869-----------------
97,439-----------------
99,98196,447
100,35393,922
-----------------86,95699,155
101,72798,272
Avg by Employee

055Administrative
Director, AdministrationDirects a group of functions for the organization including any or all of the following: human resources, information technology, office services, facilities and grounds, transportation, food service, and purchasing. Manages department budgets. Participates as a member of the senior management team in the development and implementation of organization-wide policies and programs that will contribute to its overall success.
Valuing our Nonprofit Workforce 2014 Page 49
Number of Orgs Emps
All Organizations:
By Budget Size: $2,500,000 - $9,999,999 $10,000,000 - $24,999,999By Geographic Location: Western Massachusetts Region Central Massachusetts Region Greater Boston RegionBy Field of Service: Srvcs & Adv: Children and youth Srvcs & Adv: Elderly, developmentally disabledBy Number of Employees: 101 - 250 251+By Years of Experience Required: 4 - 6 Years 7 - 10 YearsBy Level of Education Required: Bachelor's Degree Master's DegreeBy Gender of Employee: Male FemaleBy Race/Ethnicity of Employee: WhiteBy Number of Years in Position: Up to 5 Years 5 - 10 Years 11 - 20 Years More than 20 YearsBy Number of Employees Managed: 1 to 3 4 to 8
28
-----------------8
13-----------------
86
10-----------------
58
-----------------10
9-----------------
810
-----------------1110
-----------------7
22-----------------
26-----------------
8677
-----------------89
32
-----------------1015
-----------------88
11-----------------
610
-----------------1112
-----------------1010
-----------------1112
-----------------8
23-----------------
29-----------------
9778
-----------------8
10
$60,308
-------------------
58,797-------------------
-------------------
-------------------
60,308-------------------
-------------------
60,830-------------------
58,195-------------------
60,000-------------------
-------------------
$70,195
-----------------
63,045-----------------
-----------------
-----------------
71,807-----------------
-----------------
78,041-----------------
69,992-----------------
70,367-----------------
-----------------
$83,897
-----------------85,58276,321
-----------------85,56084,36587,959
-----------------85,58085,062
-----------------74,66784,365
-----------------82,16096,720
-----------------84,59487,817
-----------------72,80887,959
-----------------84,594
-----------------70,01387,95984,59480,926
-----------------72,14585,062
$93,325
-----------------
102,003-----------------
-----------------
-----------------
89,490-----------------
-----------------
99,991-----------------
110,074-----------------
97,979-----------------
-----------------
$122,140
-----------------
121,622-----------------
-----------------
-----------------
114,702-----------------
-----------------
119,538-----------------
123,220-----------------
122,658-----------------
-----------------
$85,197
-----------------87,26883,638
-----------------90,67586,14383,828
-----------------79,93784,170
-----------------83,42382,747
-----------------82,90998,736
-----------------85,72389,099
-----------------76,26088,749
-----------------85,908
-----------------84,50692,05082,70783,433
-----------------79,13286,453
25th %ile
Median (50%)
Avg by Org
75th %ile
Annual Base Salaries10th %ile
90th %ile
$86,146
-----------------86,99285,930
-----------------90,67585,39984,813
-----------------81,12983,119
-----------------85,41682,471
-----------------81,54398,736
-----------------85,72389,244
-----------------74,33489,421
-----------------86,177
-----------------87,13195,06282,70782,531
-----------------79,13286,550
Avg by Employee

Manages the day-to-day operations of a regional facility that delivers program services in accordance with organization goals and objectives. Functions include: program development and implementation, staffing, volunteer coordination, community relations, budgeting, record keeping and facility maintenance. May participate in or lead fundraising activities for the region.
060Administrative
© 2014 Third Sector New England & Nonprofit Compensation Associates
Regional Manager/Center Manager
Page 50
Number of Orgs Emps
All Organizations:
By Budget Size: $2,500,000 - $9,999,999 $10,000,000 - $24,999,999By Geographic Location: Greater Boston RegionBy Field of Service: Srvcs & Adv: Children and youthBy Number of Employees: 251+By Years of Experience Required: 2 - 3 YearsBy Level of Education Required: Bachelor's DegreeBy Gender of Employee: Male FemaleBy Race/Ethnicity of Employee: WhiteBy Number of Years in Position: Up to 5 Years 5 - 10 YearsBy Number of Employees Managed: 1 to 3 4 to 8
17
-----------------56
-----------------8
-----------------6
-----------------8
-----------------8
-----------------13
-----------------6
14-----------------
16-----------------
119
-----------------67
53
-----------------1722
-----------------29
-----------------30
-----------------32
-----------------20
-----------------35
-----------------1825
-----------------45
-----------------2320
-----------------9
14
$43,101
-------------------
41,500-------------------
41,500-------------------
41,600-------------------
41,800-------------------
41,202-------------------
44,412-------------------
41,50041,833
-------------------43,400
-------------------42,09841,600
-------------------
45,198
$45,479
-----------------
44,751-----------------
44,778-----------------
45,001-----------------
49,644-----------------
45,926-----------------
50,960-----------------
48,39447,502
-----------------46,935
-----------------49,52545,050
-----------------
53,763
$57,034
-----------------
62,201-----------------
50,960-----------------
52,749-----------------
64,865-----------------
55,100-----------------
60,570-----------------
64,86560,466
-----------------59,634
-----------------62,40056,868
-----------------56,45161,485
$71,365
-----------------
72,488-----------------
61,286-----------------
67,420-----------------
80,000-----------------
62,400-----------------
72,405-----------------
84,05174,506
-----------------71,365
-----------------77,00276,755
-----------------
67,600
$98,384
-----------------
99,840-----------------
70,000-----------------
97,856-----------------
99,840-----------------
70,350-----------------
99,840-----------------
100,36293,937
-----------------97,656
-----------------99,84099,476
-----------------
74,704
$62,183
-----------------
62,828-----------------
53,280-----------------
58,813-----------------
68,152-----------------
55,150-----------------
65,822-----------------
66,97763,517
-----------------62,715
-----------------64,01462,489
-----------------68,20560,689
25th %ile
Median (50%)
Avg by Org
75th %ile
Annual Base Salaries10th %ile
90th %ile
$60,371
-----------------55,38659,544
-----------------54,645
-----------------57,912
-----------------65,418
-----------------53,993
-----------------59,280
-----------------69,14759,895
-----------------60,390
-----------------57,01164,432
-----------------60,23762,474
Avg by Employee

065Administrative
Office ManagerProvides direct supervision of the organization's office services including mail pick up and distribution, records maintenance, copy/print services, reception, office maintenance and cleaning services, communications/telephones, and similar.
Valuing our Nonprofit Workforce 2014 Page 51
Number of Orgs Emps
All Organizations:
By Budget Size: $250,000 - $999,999 $1,000,000 - $2,499,999 $2,500,000 - $9,999,999 $10,000,000 - $24,999,999 $25,000,000 and overBy Geographic Location: Berkshire County Region Western Massachusetts Region Central Massachusetts Region Greater Boston Region Northeastern Massachusetts Region Southeastern Massachusetts/Rhode Island RegionBy Field of Service: Srvcs & Adv: Children and youth Srvcs & Adv: Elderly, developmentally disabled Arts, culture, recreation Cmnty/econ dev, social justice, legal, civil rights Counseling, crisis interv, mental hlth, medical Public policy and education reformBy Number of Employees: 3 - 5 11 - 25 26 - 50 101 - 250 251+By Years of Experience Required: 1 Year 2 - 3 YearsBy Level of Education Required: High School Diploma Associate's Degree Bachelor's DegreeBy Gender of Employee: FemaleBy Race/Ethnicity of Employee: Black WhiteBy Number of Years in Position: Up to 5 Years 5 - 10 Years 11 - 20 Years More than 20 YearsBy Number of Employees Managed: 1 to 3 4 to 8
59
-----------------12121014
8-----------------
515
517
98
-----------------8755
156
-----------------6
1012
915
-----------------8
27-----------------
205
16-----------------
51-----------------
742
-----------------3114
96
-----------------18
7
86
-----------------1212122126
-----------------1028
6181311
-----------------8756
407
-----------------6
10131139
-----------------1640
-----------------42
517
-----------------76
-----------------8
60-----------------
391913
6-----------------
3012
$31,200
-------------------30,35633,90439,52029,42830,098
-------------------
30,139
32,54835,185
-------------------
29,956
-------------------
36,217
29,952-------------------
29,28630,264
-------------------30,014
34,478-------------------
31,200-------------------
31,200-------------------
30,16029,28632,065
-------------------30,26429,775
$34,773
-----------------34,32037,45640,99731,25234,086
-----------------
34,195
39,48937,471
-----------------
33,280
-----------------
39,520
32,616-----------------
31,22634,762
-----------------33,847
38,043-----------------
34,585-----------------
34,216-----------------
33,28036,17136,099
-----------------33,34234,944
$40,467
-----------------39,70043,77448,78739,52038,043
-----------------
40,03046,84246,39541,45437,800
-----------------44,86146,80039,39552,27437,47141,454
-----------------39,52042,86945,19843,86737,440
-----------------38,04340,050
-----------------40,24832,61641,600
-----------------40,050
-----------------43,83640,467
-----------------39,52042,74442,70242,479
-----------------39,95741,402
$46,369
-----------------45,84946,59756,70546,43642,715
-----------------
43,846
57,08044,733
-----------------
43,509
-----------------
52,274
42,752-----------------
42,74046,265
-----------------45,396
47,362-----------------
45,791-----------------
45,149-----------------
44,26746,80046,707
-----------------46,19248,448
$55,264
-----------------56,61148,74962,38257,87848,445
-----------------
46,921
64,05447,000
-----------------
47,058
-----------------
62,833
47,112-----------------
52,28155,801
-----------------54,633
61,144-----------------
55,264-----------------
53,354-----------------
54,99549,44252,387
-----------------57,42558,198
$41,581
-----------------40,80042,09149,76540,18938,830
-----------------
39,83447,79847,40841,21040,875
-----------------45,62447,75438,73851,56138,38841,172
-----------------38,65342,74846,64947,38038,226
-----------------38,42741,397
-----------------40,55336,77943,905
-----------------41,247
-----------------46,00240,751
-----------------40,47341,03141,82944,445
-----------------40,92342,231
25th %ile
Median (50%)
Avg by Org
75th %ile
Annual Base Salaries10th %ile
90th %ile
$43,514
-----------------40,80042,09149,24043,77142,111
-----------------36,10442,15346,85847,12142,20042,422
-----------------45,62447,75438,73851,41841,14241,702
-----------------38,65342,74846,18047,85541,663
-----------------42,78343,438
-----------------45,48036,77944,355
-----------------43,470
-----------------45,07442,822
-----------------40,69242,99143,58044,445
-----------------43,84343,136
Avg by Employee

Provides a wide variety of skilled administrative and clerical support for chief executive, directors or other senior management staff. Responsibilities include exposure to sensitive information and require considerable use of tact, diplomacy, discretion and judgment. Is responsible for special projects as assigned, may attend board or similar meetings to take or transcribe and distribute minutes, prepares board packets, maintains databases, and researches/analyzes data and develops reports to aid in management decision-making. May follow up on projects assigned to managers by senior executives.
070Administrative
© 2014 Third Sector New England & Nonprofit Compensation Associates
Executive Assistant
Page 52
Number of Orgs Emps
All Organizations:
By Budget Size: $250,000 - $999,999 $2,500,000 - $9,999,999 $10,000,000 - $24,999,999 $25,000,000 and overBy Geographic Location: Berkshire County Region Western Massachusetts Region Central Massachusetts Region Greater Boston Region Northeastern Massachusetts Region Southeastern Massachusetts/Rhode Island RegionBy Field of Service: Srvcs & Adv: Children and youth Srvcs & Adv: Elderly, developmentally disabled Arts, culture, recreation Housing and homelessness prevention Cmnty/econ dev, social justice, legal, civil rights Counseling, crisis interv, mental hlth, medicalBy Number of Employees: 11 - 25 26 - 50 51 -100 101 - 250 251+By Years of Experience Required: 1 Year 2 - 3 Years 4 - 6 YearsBy Level of Education Required: High School Diploma Associate's Degree Bachelor's DegreeBy Gender of Employee: FemaleBy Race/Ethnicity of Employee: Black WhiteBy Number of Years in Position: Up to 5 Years 5 - 10 Years 11 - 20 Years More than 20 YearsBy Number of Employees Managed: 1 to 3
70
-----------------6
271716
-----------------5
14102111
9-----------------
1615
665
10-----------------
710
71922
-----------------8
2020
-----------------181527
-----------------65
-----------------5
60-----------------
37121010
-----------------16
82
-----------------7
281824
-----------------5
1710231611
-----------------1616
776
16-----------------
910
72031
-----------------102326
-----------------202328
-----------------76
-----------------7
67-----------------
41121210
-----------------17
$33,536
-------------------
31,31337,77336,130
-------------------
33,987
30,15233,334
-------------------31,39531,861
35,606-------------------
31,83236,075
-------------------
36,80337,896
-------------------27,41834,93136,154
-------------------34,613
-------------------
34,682-------------------
30,13536,24037,841
-------------------37,228
$38,461
-----------------
37,46142,38641,839
-----------------
37,807
38,00042,042
-----------------36,15538,942
41,652-----------------
41,27241,309
-----------------
39,10440,872
-----------------37,42438,58441,577
-----------------38,875
-----------------
39,104-----------------
35,74037,60339,655
-----------------43,441
$45,875
-----------------38,93845,73953,46745,698
-----------------41,60045,71853,23845,03250,00045,219
-----------------41,49248,34035,10047,27847,14345,505
-----------------38,93845,37553,62247,67446,010
-----------------34,47646,59244,403
-----------------45,55245,21948,038
-----------------46,000
-----------------38,93846,280
-----------------45,03244,09645,30356,898
-----------------51,293
$54,231
-----------------
53,61261,54755,182
-----------------
52,947
53,58160,877
-----------------53,57058,651
50,000-----------------
56,69553,893
-----------------
55,64050,934
-----------------54,50653,89358,630
-----------------54,532
-----------------
55,931-----------------
53,04053,44656,436
-----------------54,631
$61,520
-----------------
58,17572,78560,393
-----------------
58,956
59,34269,243
-----------------56,97762,483
63,511-----------------
68,96060,973
-----------------
61,23966,743
-----------------59,85259,72968,411
-----------------62,644
-----------------
62,404-----------------
60,60753,85567,296
-----------------62,870
$46,926
-----------------41,04945,47053,63647,487
-----------------42,15745,80752,84345,37150,44343,578
-----------------43,24948,12243,56047,74849,58446,555
-----------------38,88949,00449,43049,38647,616
-----------------38,04548,55347,785
-----------------44,53346,23550,568
-----------------47,381
-----------------38,00647,965
-----------------44,48744,96048,65359,950
-----------------49,642
25th %ile
Median (50%)
Avg by Org
75th %ile
Annual Base Salaries10th %ile
90th %ile
$47,530
-----------------43,64145,42754,05648,712
-----------------42,15746,24152,84346,25752,33043,723
-----------------43,24948,12546,57047,93451,12847,858
-----------------40,37749,00449,43049,53148,605
-----------------38,35849,12248,806
-----------------44,76846,63950,714
-----------------48,105
-----------------39,24048,330
-----------------45,04944,96049,73959,950
-----------------50,137
Avg by Employee

075Administrative
Administrative Assistant, Senior LevelProvides administrative and clerical support to managers and/or other department members. Duties may include researching and compiling information and coordinating activities between departments and/or outside services. Maintains data, generates and formats reports and other documents, using a range of computer software skills including spreadsheets, word processing, desktop publishing, database management, and/or presentation software, etc. May be responsible for administering special projects related to departmental functions.
Valuing our Nonprofit Workforce 2014 Page 53
Number of Orgs Emps
All Organizations:
By Budget Size: $250,000 - $999,999 $2,500,000 - $9,999,999 $10,000,000 - $24,999,999 $25,000,000 and overBy Geographic Location: Western Massachusetts Region Central Massachusetts Region Greater Boston Region Northeastern Massachusetts Region Southeastern Massachusetts/Rhode Island RegionBy Field of Service: Srvcs & Adv: Children and youth Srvcs & Adv: Elderly, developmentally disabled Cmnty/econ dev, social justice, legal, civil rights Counseling, crisis interv, mental hlth, medicalBy Number of Employees: 26 - 50 51 -100 101 - 250 251+By Years of Experience Required: 1 Year 2 - 3 Years 4 - 6 YearsBy Level of Education Required: High School Diploma Associate's Degree Bachelor's DegreeBy Gender of Employee: FemaleBy Race/Ethnicity of Employee: Black Hispanic or Latino WhiteBy Number of Years in Position: Up to 5 Years 5 - 10 Years 11 - 20 Years More than 20 YearsBy Number of Employees Managed: 1 to 3
52
-----------------6
181411
-----------------14
814
510
-----------------1115
56
-----------------65
1517
-----------------5
288
-----------------15
723
-----------------46
-----------------95
42-----------------
291216
8-----------------
9
92
-----------------7
222733
-----------------271022
725
-----------------1426
710
-----------------96
3037
-----------------6
4615
-----------------232033
-----------------85
-----------------10
670
-----------------401523
8-----------------
10
$31,275
-------------------
30,65331,10030,802
-------------------29,761
32,296
31,383-------------------
30,87830,700
-------------------
34,14329,848
-------------------
30,95635,056
-------------------32,03229,75734,150
-------------------31,164
-------------------
31,225-------------------
31,38930,84130,335
-------------------
$34,076
-----------------
33,21339,95733,707
-----------------31,803
37,950
34,279-----------------
33,21332,911
-----------------
40,51832,594
-----------------
33,28039,520
-----------------33,80031,19538,740
-----------------33,800
-----------------
33,753-----------------
34,64339,52033,280
-----------------
$41,174
-----------------35,36041,49643,68037,939
-----------------37,45541,54847,46250,50239,520
-----------------44,29438,25246,88338,657
-----------------51,93833,14543,79537,455
-----------------33,88437,69743,680
-----------------41,49633,28043,035
-----------------40,414
-----------------49,17134,99640,602
-----------------40,60244,99037,45553,217
-----------------43,607
$48,532
-----------------
50,31549,15047,081
-----------------42,994
51,969
46,686-----------------
52,71747,345
-----------------
49,49345,687
-----------------
46,93549,150
-----------------49,15036,92551,531
-----------------48,648
-----------------
47,263-----------------
47,05548,54141,496
-----------------
$54,024
-----------------
60,25454,25050,136
-----------------48,422
57,391
56,572-----------------
59,54551,157
-----------------
53,99650,960
-----------------
54,75852,736
-----------------53,32340,17356,256
-----------------54,358
-----------------
52,780-----------------
52,05052,25753,926
-----------------
$42,101
-----------------38,63543,27244,16340,247
-----------------38,37040,96145,76746,91341,822
-----------------44,20440,49045,43039,576
-----------------51,28835,76944,90038,972
-----------------34,45940,41644,235
-----------------42,18334,29145,145
-----------------41,997
-----------------47,79636,54841,533
-----------------41,62643,49239,54051,550
-----------------43,729
25th %ile
Median (50%)
Avg by Org
75th %ile
Annual Base Salaries10th %ile
90th %ile
$42,887
-----------------39,42641,85944,84243,817
-----------------37,73739,78446,00948,63744,934
-----------------43,43341,23044,52441,564
-----------------49,26536,42344,69341,634
-----------------34,57441,63945,316
-----------------40,96433,52046,045
-----------------42,833
-----------------47,19935,46742,349
-----------------41,39042,75142,03251,550
-----------------42,550
Avg by Employee

Performs clerical duties including answering telephones, screening calls, taking messages and acting as receptionist. Sets up and maintains files, uses computer skills to enter and maintain data, prepares correspondence and develops other routine documents. May make appointments and handle travel arrangements. Coordinates activities related to departmental functions.
080Administrative
© 2014 Third Sector New England & Nonprofit Compensation Associates
Administrative Assistant, Intermediate Level
Page 54
Number of Orgs Emps
All Organizations:
By Budget Size: $250,000 - $999,999 $1,000,000 - $2,499,999 $2,500,000 - $9,999,999 $10,000,000 - $24,999,999 $25,000,000 and overBy Geographic Location: Berkshire County Region Western Massachusetts Region Central Massachusetts Region Greater Boston Region Northeastern Massachusetts Region Southeastern Massachusetts/Rhode Island RegionBy Field of Service: Srvcs & Adv: Children and youth Srvcs & Adv: Elderly, developmentally disabled Arts, culture, recreation Housing and homelessness prevention Cmnty/econ dev, social justice, legal, civil rights Counseling, crisis interv, mental hlth, medical Health and fitness, wellnessBy Number of Employees: 6 - 10 11 - 25 26 - 50 51 -100 101 - 250 251+By Years of Experience Required: 1 Year 2 - 3 YearsBy Level of Education Required: High School Diploma Associate's Degree Bachelor's DegreeBy Gender of Employee: Male FemaleBy Race/Ethnicity of Employee: Black Hispanic or Latino WhiteBy Number of Years in Position: Up to 5 Years 5 - 10 Years 11 - 20 Years More than 20 Years
88
-----------------12
9292215
-----------------6
2112171715
-----------------142011
88
115
-----------------1010
98
2324
-----------------2537
-----------------362323
-----------------1080
-----------------141670
-----------------623220
8
272
-----------------12114273
133-----------------
139724353469
-----------------317312
9179112
-----------------1011121566
154-----------------
8789
-----------------145
4434
-----------------12
247-----------------
1643
191-----------------
1495040
8
$26,000
-------------------27,165
25,09129,05824,960
-------------------27,19424,96028,01827,64729,26627,102
-------------------27,68126,56724,421
28,17124,960
-------------------
26,31226,19529,19324,981
-------------------24,96026,520
-------------------24,96027,43728,486
-------------------24,29026,000
-------------------27,14423,95327,040
-------------------24,96027,17128,952
$29,120
-----------------29,245
27,44130,77428,580
-----------------27,96627,04033,38929,24531,13330,036
-----------------29,12031,20026,260
28,74627,040
-----------------
28,96428,35031,95428,865
-----------------27,04030,639
-----------------28,35030,83631,200
-----------------29,12029,120
-----------------29,41726,00029,370
-----------------28,83929,09432,334
$32,417
-----------------32,76029,99432,06333,28031,824
-----------------29,97330,16035,99531,53334,13333,280
-----------------31,20035,25632,63530,80531,20030,077
-----------------32,03229,99436,05731,99035,25631,221
-----------------30,16033,280
-----------------31,72033,01034,060
-----------------31,81432,323
-----------------31,36729,74433,010
-----------------31,20032,95837,97138,813
$37,138
-----------------37,690
35,09537,99137,388
-----------------32,83334,33142,95835,00639,24439,010
-----------------33,80040,27939,442
37,77035,006
-----------------
40,31433,21840,87235,115
-----------------35,00636,140
-----------------37,22234,94440,633
-----------------34,13837,336
-----------------34,92934,25837,960
-----------------34,74635,14742,827
$42,407
-----------------39,410
40,27143,43142,815
-----------------39,10437,98948,90141,35849,00543,451
-----------------40,44844,08544,327
42,64038,380
-----------------
49,37737,70644,22540,383
-----------------40,22741,226
-----------------41,72539,38544,710
-----------------37,63942,782
-----------------41,77938,28043,443
-----------------40,31038,02446,923
$33,379
-----------------33,38131,26232,31934,69333,169
-----------------31,34430,90337,45732,68436,47934,651
-----------------32,43235,57833,43132,16433,33531,377
-----------------32,83131,55635,99731,40036,04532,403
-----------------31,54933,517
-----------------32,86333,67135,625
-----------------31,30133,493
-----------------32,73930,64934,163
-----------------31,93333,20837,57139,702
25th %ile
Median (50%)
Avg by Org
75th %ile
Annual Base Salaries10th %ile
90th %ile
$33,582
-----------------33,38131,72231,67936,09234,878
-----------------31,93531,82235,25632,29336,47833,545
-----------------32,09734,45632,92432,54431,87033,64932,900
-----------------32,83131,79934,58331,32334,99433,769
-----------------31,97933,846
-----------------33,66833,81634,910
-----------------32,01433,788
-----------------32,80531,89834,006
-----------------32,90133,27637,70039,702
Avg by Employee

085Administrative
Administrative Assistant, Junior LevelPerforms routine clerical duties such as answering telephone, taking and delivering messages, setting up and maintaining files, sorting/delivering mail, entering data into the computer, preparing routine correspondence.
Valuing our Nonprofit Workforce 2014 Page 55
Number of Orgs Emps
All Organizations:
By Budget Size: $250,000 - $999,999 $1,000,000 - $2,499,999 $2,500,000 - $9,999,999 $10,000,000 - $24,999,999 $25,000,000 and overBy Geographic Location: Berkshire County Region Western Massachusetts Region Central Massachusetts Region Greater Boston Region Northeastern Massachusetts Region Southeastern Massachusetts/Rhode Island RegionBy Field of Service: Srvcs & Adv: Children and youth Srvcs & Adv: Elderly, developmentally disabled Arts, culture, recreation Housing and homelessness prevention Counseling, crisis interv, mental hlth, medicalBy Number of Employees: 11 - 25 26 - 50 51 -100 101 - 250 251+By Years of Experience Required: 1 Year 2 - 3 YearsBy Level of Education Required: High School Diploma Associate's Degree Bachelor's DegreeBy Gender of Employee: Male FemaleBy Race/Ethnicity of Employee: Black Hispanic or Latino WhiteBy Number of Years in Position: Up to 5 Years 5 - 10 Years 11 - 20 Years More than 20 Years
69
-----------------75
211716
-----------------7
198
156
14-----------------
1223
569
-----------------967
2022
-----------------2222
-----------------4011
6-----------------
862
-----------------101750
-----------------561610
8
208
-----------------76
386687
-----------------158427291142
-----------------2482
78
52-----------------
9111057
115-----------------
8049
-----------------139
228
-----------------8
185-----------------
1339
133-----------------
1252116
9
$20,800
-------------------
18,72023,01119,760
-------------------19,16920,280
20,800
21,401-------------------
20,80020,800
19,032-------------------
20,53420,800
-------------------19,76023,088
-------------------20,80021,195
-------------------
20,800-------------------
18,97018,72020,800
-------------------19,64421,56919,448
$22,880
-----------------
22,38127,42021,923
-----------------23,00521,876
24,627
24,685-----------------
24,27423,192
20,800-----------------
26,12521,985
-----------------21,28926,406
-----------------22,88026,032
-----------------
22,880-----------------
22,94320,80023,140
-----------------21,29923,47328,366
$27,487
-----------------24,96027,43525,85529,39024,844
-----------------25,96026,520
28,80822,88030,056
-----------------27,72729,39020,88329,56722,880
-----------------21,21628,80826,14630,55525,480
-----------------25,52228,974
-----------------27,53928,36132,209
-----------------21,54127,560
-----------------28,80823,56627,560
-----------------25,56327,06133,07234,445
$31,705
-----------------
29,52133,28031,200
-----------------33,28029,390
32,563
34,050-----------------
30,74233,935
26,032-----------------
34,05030,846
-----------------29,47931,200
-----------------31,76231,871
-----------------
31,897-----------------
31,34629,39032,542
-----------------30,35831,89734,695
$35,010
-----------------
35,06034,61335,381
-----------------38,67632,760
40,518
37,975-----------------
33,61337,197
31,630-----------------
37,49934,333
-----------------34,03533,280
-----------------34,90234,266
-----------------
35,098-----------------
38,70835,00635,173
-----------------34,05037,84436,832
$27,426
-----------------26,25826,78726,22229,76326,622
-----------------28,04426,164
29,46524,70529,878
-----------------27,38129,29822,06028,87324,021
-----------------23,40528,85727,45829,97226,428
-----------------26,00828,787
-----------------27,31128,24430,651
-----------------22,68027,639
-----------------28,03425,57028,024
-----------------26,19228,02031,32234,646
25th %ile
Median (50%)
Avg by Org
75th %ile
Annual Base Salaries10th %ile
90th %ile
$27,169
-----------------26,25826,59926,50929,02527,710
-----------------26,37027,01325,44229,30123,61028,010
-----------------26,80528,45923,10727,73024,598
-----------------23,40529,49626,83728,17727,277
-----------------26,63928,575
-----------------27,10127,72831,435
-----------------22,68027,400
-----------------27,56327,06027,317
-----------------26,48027,62630,17634,329
Avg by Employee

Receives and greets visitors. Determines the nature of their visits and notifies appropriate staff members. Answers and transfers telephone calls using multiple-line equipment, and represents organization to callers and visitors in a friendly, professional manner. May issue security badges, maintains visitor logs and calls vendors as requested. May perform routine clerical duties including filing, word processing, and sorting and distributing mail. For employees who are responsible for scheduling patient appointments, facilitating patient flow, and referring patients to other resources, please refer to (752) Receptionist, Medical.
090Administrative
© 2014 Third Sector New England & Nonprofit Compensation Associates
Receptionist
Page 56
Number of Orgs Emps
All Organizations:
By Budget Size: $1,000,000 - $2,499,999 $2,500,000 - $9,999,999 $10,000,000 - $24,999,999 $25,000,000 and overBy Geographic Location: Western Massachusetts Region Central Massachusetts Region Greater Boston Region Northeastern Massachusetts Region Southeastern Massachusetts/Rhode Island RegionBy Field of Service: Srvcs & Adv: Children and youth Srvcs & Adv: Elderly, developmentally disabled Housing and homelessness prevention Cmnty/econ dev, social justice, legal, civil rights Counseling, crisis interv, mental hlth, medicalBy Number of Employees: 11 - 25 26 - 50 51 -100 101 - 250 251+By Years of Experience Required: 1 Year 2 - 3 YearsBy Level of Education Required: High School DiplomaBy Gender of Employee: Male FemaleBy Race/Ethnicity of Employee: Black Hispanic or Latino WhiteBy Number of Years in Position: Up to 5 Years 5 - 10 Years 11 - 20 Years More than 20 Years
63
-----------------6
221911
-----------------1613111011
-----------------8
2256
12-----------------
789
1820
-----------------2312
-----------------42
-----------------1150
-----------------131641
-----------------39161411
145
-----------------8
463253
-----------------4733161530
-----------------1536
61551
-----------------8
10204066
-----------------6316
-----------------106
-----------------15
120-----------------
183381
-----------------76241813
$20,800
-------------------
19,76022,02320,800
-------------------20,57119,76022,43126,13321,468
-------------------21,17421,973
21,14920,800
-------------------
20,94819,76020,800
-------------------19,76021,711
-------------------19,760
-------------------18,72020,800
-------------------22,68919,76020,862
-------------------19,76019,70822,60823,953
$22,880
-----------------
22,01726,85321,965
-----------------21,17421,01923,56627,31024,643
-----------------22,88027,310
23,56621,861
-----------------
23,56622,35022,017
-----------------20,80025,984
-----------------22,589
-----------------19,65623,208
-----------------23,56620,80023,161
-----------------21,53321,81924,38626,655
$27,040
-----------------24,13924,96028,03927,310
-----------------23,72525,00226,72831,20029,557
-----------------27,35229,82827,44626,79024,960
-----------------24,00327,17624,53428,49627,321
-----------------24,21128,725
-----------------27,040
-----------------24,00327,352
-----------------26,88426,79028,226
-----------------27,17524,17028,45533,176
$30,912
-----------------
31,21631,20030,379
-----------------27,35230,54533,07733,61331,579
-----------------27,85133,140
32,46930,888
-----------------
29,45832,81830,259
-----------------28,87031,668
-----------------30,186
-----------------28,39231,133
-----------------31,20030,90931,231
-----------------30,73729,76533,33235,402
$33,501
-----------------
37,23034,67033,022
-----------------28,54235,15240,83939,74935,410
-----------------37,76435,922
43,16832,074
-----------------
41,58635,57533,062
-----------------32,43634,318
-----------------33,207
-----------------32,86433,613
-----------------33,79835,15234,927
-----------------33,31132,30336,84343,123
$27,179
-----------------24,76827,21029,01826,608
-----------------24,18026,85929,01631,61228,729
-----------------27,13729,50729,51528,82426,090
-----------------26,08128,36327,07128,03026,698
-----------------25,53228,484
-----------------26,866
-----------------24,56227,567
-----------------27,39126,74827,626
-----------------26,65825,49728,98032,418
25th %ile
Median (50%)
Avg by Org
75th %ile
Annual Base Salaries10th %ile
90th %ile
$28,383
-----------------25,05728,76929,40628,844
-----------------25,92928,12830,91531,65026,559
-----------------26,64229,06529,93331,09127,839
-----------------26,45829,47928,35228,72928,543
-----------------27,90529,280
-----------------28,423
-----------------25,49029,055
-----------------28,37328,03728,181
-----------------28,12324,70228,35933,067
Avg by Employee

105Accounting/Finance
Chief Financial OfficerManages the financial resources of the organization including accounting, finance, organization-wide budgets, investments, and treasury in accordance with generally accepted accounting principles and organization/contract policies and procedures. Safeguards assets through the maintenance of proper controls. Participates as a member of the senior management team in the development and implementation of organization-wide policies and programs that will contribute to its overall success.
Valuing our Nonprofit Workforce 2014 Page 57
Number of Orgs Emps
All Organizations:
By Budget Size: $1,000,000 - $2,499,999 $2,500,000 - $9,999,999 $10,000,000 - $24,999,999 $25,000,000 and overBy Geographic Location: Berkshire County Region Western Massachusetts Region Central Massachusetts Region Greater Boston Region Northeastern Massachusetts Region Southeastern Massachusetts/Rhode Island RegionBy Field of Service: Srvcs & Adv: Children and youth Srvcs & Adv: Elderly, developmentally disabled Arts, culture, recreation Housing and homelessness prevention Cmnty/econ dev, social justice, legal, civil rights Counseling, crisis interv, mental hlth, medicalBy Number of Employees: 11 - 25 26 - 50 51 -100 101 - 250 251+By Years of Experience Required: 2 - 3 Years 4 - 6 Years 7 - 10 YearsBy Level of Education Required: Bachelor's Degree Master's DegreeBy Gender of Employee: Male FemaleBy Race/Ethnicity of Employee: WhiteBy Number of Years in Position: Up to 5 Years 5 - 10 Years 11 - 20 Years More than 20 YearsBy Number of Employees Managed: 1 to 3 4 to 8 9 to 14 15 and over
86
-----------------11312814
-----------------7
1912261210
-----------------1722
56
1011
-----------------9
159
2129
-----------------6
2328
-----------------4330
-----------------4436
-----------------70
-----------------382112
6-----------------
223810
7
86
-----------------11312814
-----------------7
1912261210
-----------------1722
56
1011
-----------------9
159
2129
-----------------6
2328
-----------------4330
-----------------4436
-----------------70
-----------------382112
6-----------------
223810
7
$74,399
-------------------
68,91990,29494,578
-------------------
67,57975,94375,70172,968
-------------------65,79882,158
-------------------
70,491
71,20286,940
-------------------
75,99578,647
-------------------69,26080,700
-------------------74,07969,472
-------------------75,190
-------------------72,97972,57972,281
-------------------66,69174,720
$88,182
-----------------
80,01892,882
117,222-----------------
80,01894,73986,99091,395
-----------------74,18392,700
-----------------
82,742
91,21994,411
-----------------
88,50491,130
-----------------87,15291,582
-----------------87,04388,665
-----------------88,988
-----------------86,32590,33591,265
-----------------75,84790,766
$100,256
-----------------86,84097,157
102,555134,160
-----------------91,520
107,328109,699
97,143103,251105,571
-----------------90,667
100,50687,006
106,652101,421130,000
-----------------93,600
106,66291,60397,157
110,594-----------------
98,02099,840
102,835-----------------
97,531106,163
-----------------105,830
98,416-----------------
99,424-----------------
101,338104,998
97,57095,920
-----------------90,79299,424
105,123130,000
$129,922
-----------------
117,707131,638177,310
-----------------
130,000131,477124,535169,271
-----------------119,174124,472
-----------------
128,232
127,504144,737
-----------------
120,640133,911
-----------------108,139136,084
-----------------138,060109,980
-----------------124,535
-----------------121,013147,244120,125
-----------------109,423131,514
$151,799
-----------------
142,268155,982206,604
-----------------
140,109136,537145,511197,022
-----------------140,433160,486
-----------------
143,254
160,730182,582
-----------------
139,685157,057
-----------------138,927163,818
-----------------170,175135,641
-----------------144,417
-----------------140,544191,526152,893
-----------------134,977155,982
$109,392
-----------------88,007
100,083111,604143,826
-----------------88,299
107,148110,100104,343124,574122,481
-----------------97,824
109,95490,380
108,81299,996
126,369-----------------
91,767105,490103,455108,391121,591
-----------------93,149
104,368112,646
-----------------101,809114,686
-----------------114,725102,290
-----------------108,481
-----------------105,593119,100105,398105,796
-----------------95,730
110,062117,568124,603
25th %ile
Median (50%)
Avg by Org
75th %ile
Annual Base Salaries10th %ile
90th %ile
$109,392
-----------------88,007
100,083111,604143,826
-----------------88,299
107,148110,100104,343124,574122,481
-----------------97,824
109,95490,380
108,81299,996
126,369-----------------
91,767105,490103,455108,391121,591
-----------------93,149
104,368112,646
-----------------101,809114,686
-----------------114,725102,290
-----------------108,481
-----------------105,593119,100105,398105,796
-----------------95,730
110,062117,568124,603
Avg by Employee

Manages the accounting operations of the organization including budgeting, auditing, payroll, accounts payable and receivable, general ledger and financial reporting, in accordance with generally accepted accounting principles and internal policies and procedures. Oversees development and implementation of financial systems. May interpret accounting reports to management and board. Assumes responsibility for the financial function in the absence of the Chief Financial Officer.
110Accounting/Finance
© 2014 Third Sector New England & Nonprofit Compensation Associates
Controller
Page 58
Number of Orgs Emps
All Organizations:
By Budget Size: $1,000,000 - $2,499,999 $2,500,000 - $9,999,999 $10,000,000 - $24,999,999 $25,000,000 and overBy Geographic Location: Berkshire County Region Western Massachusetts Region Central Massachusetts Region Greater Boston Region Northeastern Massachusetts Region Southeastern Massachusetts/Rhode Island RegionBy Field of Service: Srvcs & Adv: Children and youth Srvcs & Adv: Elderly, developmentally disabled Counseling, crisis interv, mental hlth, medicalBy Number of Employees: 11 - 25 101 - 250 251+By Years of Experience Required: 4 - 6 YearsBy Level of Education Required: Bachelor's Degree Master's DegreeBy Gender of Employee: Male FemaleBy Race/Ethnicity of Employee: WhiteBy Number of Years in Position: Up to 5 Years 5 - 10 Years 11 - 20 YearsBy Number of Employees Managed: 1 to 3 4 to 8
39
-----------------69
1011
-----------------575
1066
-----------------787
-----------------67
17-----------------
17-----------------
278
-----------------1523
-----------------33
-----------------21
78
-----------------1710
41
-----------------6
101012
-----------------585
1166
-----------------788
-----------------68
18-----------------
18-----------------
288
-----------------1723
-----------------35
-----------------21
78
-----------------1710
$61,950
-------------------
63,560-------------------
-------------------
-------------------
62,344-------------------
61,699-------------------
58,311
-------------------62,43456,480
-------------------60,574
-------------------55,748
-------------------57,550
$70,782
-----------------
78,333-----------------
-----------------
-----------------
68,375-----------------
73,518-----------------
65,162
-----------------70,78268,640
-----------------70,574
-----------------65,541
-----------------63,222
$78,582
-----------------75,27681,07873,00393,507
-----------------61,83876,05574,27791,54187,73589,087
-----------------74,27776,79477,355
-----------------79,77979,48780,891
-----------------76,970
-----------------76,97080,891
-----------------85,01077,230
-----------------83,574
-----------------75,40092,26991,738
-----------------75,40089,087
$97,032
-----------------
108,019-----------------
-----------------
-----------------
95,623-----------------
91,723-----------------
93,106
-----------------97,08499,902
-----------------99,902
-----------------93,392
-----------------91,905
$108,032
-----------------
125,952-----------------
-----------------
-----------------
108,469-----------------
99,912-----------------
108,239
-----------------107,644112,682
-----------------109,628
-----------------106,492
-----------------95,060
$83,743
-----------------77,35283,50877,93393,431
-----------------61,62679,03579,20290,59990,20693,201
-----------------79,05080,57082,155
-----------------81,55785,44083,889
-----------------79,918
-----------------81,16283,082
-----------------84,43383,482
-----------------84,921
-----------------79,49288,08692,217
-----------------76,46988,434
25th %ile
Median (50%)
Avg by Org
75th %ile
Annual Base Salaries10th %ile
90th %ile
$83,509
-----------------77,35282,98077,93393,892
-----------------61,62677,70379,20290,83390,20693,201
-----------------79,05080,57081,269
-----------------81,55785,03883,626
-----------------79,422
-----------------80,89983,082
-----------------83,91683,482
-----------------84,715
-----------------79,49288,08692,217
-----------------76,46988,434
Avg by Employee

115Accounting/Finance
Accounting ManagerManages and performs various accounting activities including developing, implementing and maintaining accounting systems, policies and procedures and compiling, analyzing and reporting accounting data for management reports and decision-making purposes. May act as a primary liaison to outside auditors and government agencies regarding contract issues. Manages monthly closings. Typically supervises more than three staff members.
Valuing our Nonprofit Workforce 2014 Page 59
Number of Orgs Emps
All Organizations:
By Budget Size: $1,000,000 - $2,499,999 $2,500,000 - $9,999,999 $10,000,000 - $24,999,999 $25,000,000 and overBy Geographic Location: Western Massachusetts Region Central Massachusetts Region Greater Boston Region Northeastern Massachusetts Region Southeastern Massachusetts/Rhode Island RegionBy Field of Service: Srvcs & Adv: Children and youth Srvcs & Adv: Elderly, developmentally disabled Cmnty/econ dev, social justice, legal, civil rights Counseling, crisis interv, mental hlth, medicalBy Number of Employees: 11 - 25 26 - 50 101 - 250 251+By Years of Experience Required: 2 - 3 Years 4 - 6 YearsBy Level of Education Required: Bachelor's DegreeBy Gender of Employee: Male FemaleBy Race/Ethnicity of Employee: WhiteBy Number of Years in Position: Up to 5 Years 5 - 10 Years 11 - 20 Years More than 20 YearsBy Number of Employees Managed: 1 to 3 4 to 8
53
-----------------6
161610
-----------------14
71410
7-----------------
815
57
-----------------57
1715
-----------------1320
-----------------35
-----------------1933
-----------------39
-----------------2011
88
-----------------19
5
60
-----------------6
161914
-----------------16
71514
7-----------------
915
513
-----------------57
1821
-----------------1520
-----------------41
-----------------1937
-----------------45
-----------------2311
99
-----------------20
5
$52,013
-------------------
44,99055,84860,559
-------------------44,990
50,09149,567
-------------------
51,505
57,699-------------------
52,49756,930
-------------------46,20148,035
-------------------48,006
-------------------52,00047,390
-------------------52,075
-------------------45,298
-------------------52,497
$60,000
-----------------
53,06660,00062,780
-----------------58,178
60,00059,046
-----------------
65,998
64,054-----------------
60,00064,802
-----------------59,19760,227
-----------------59,603
-----------------57,20060,004
-----------------59,384
-----------------52,125
-----------------60,227
$67,424
-----------------58,38664,35568,53675,003
-----------------63,86660,00869,55575,00365,000
-----------------60,00071,40663,71075,000
-----------------52,12575,94167,12275,005
-----------------66,99766,924
-----------------67,850
-----------------64,02267,850
-----------------66,997
-----------------60,00875,94174,61063,710
-----------------66,49875,000
$76,269
-----------------
74,10276,95086,258
-----------------74,131
76,52385,650
-----------------
82,014
76,253-----------------
75,38177,324
-----------------77,14777,365
-----------------76,835
-----------------75,00577,574
-----------------75,692
-----------------75,005
-----------------76,513
$84,446
-----------------
77,65282,18196,291
-----------------77,545
83,07596,291
-----------------
87,194
97,232-----------------
88,74790,204
-----------------91,03888,123
-----------------90,451
-----------------76,95090,988
-----------------84,710
-----------------82,114
-----------------87,872
$67,852
-----------------57,58162,93968,88875,595
-----------------63,89566,42668,85772,60665,636
-----------------62,33271,53467,10173,761
-----------------52,46670,10267,72372,968
-----------------67,41668,256
-----------------68,622
-----------------64,97268,733
-----------------67,615
-----------------62,67370,69176,96467,316
-----------------67,78870,024
25th %ile
Median (50%)
Avg by Org
75th %ile
Annual Base Salaries10th %ile
90th %ile
$67,324
-----------------57,58162,93970,08974,288
-----------------63,23266,42669,49071,06565,636
-----------------62,62471,53467,10173,712
-----------------52,46670,10268,17772,628
-----------------67,24368,256
-----------------67,732
-----------------64,97268,378
-----------------66,661
-----------------62,31670,69174,54868,230
-----------------67,98570,024
Avg by Employee

Provides day-to-day supervision to one or more general accounting functions such as accounts payable, accounts receivable or payroll. Ensures accuracy and compliance with accounting policies and procedures. Researches and resolves related problems. Typically supervises from one to five hourly accounting staff.
120Accounting/Finance
© 2014 Third Sector New England & Nonprofit Compensation Associates
Accounting Supervisor
Page 60
Number of Orgs Emps
All Organizations:
By Budget Size: $1,000,000 - $2,499,999 $2,500,000 - $9,999,999 $10,000,000 - $24,999,999 $25,000,000 and overBy Geographic Location: Western Massachusetts Region Central Massachusetts Region Northeastern Massachusetts Region Southeastern Massachusetts/Rhode Island RegionBy Field of Service: Srvcs & Adv: Children and youth Srvcs & Adv: Elderly, developmentally disabled Counseling, crisis interv, mental hlth, medicalBy Number of Employees: 11 - 25 51 -100 101 - 250 251+By Years of Experience Required: 2 - 3 Years 4 - 6 YearsBy Level of Education Required: Bachelor's DegreeBy Gender of Employee: Male FemaleBy Race/Ethnicity of Employee: WhiteBy Number of Years in Position: Up to 5 Years 5 - 10 Years 11 - 20 Years More than 20 YearsBy Number of Employees Managed: 1 to 3 4 to 8
30
-----------------5868
-----------------8766
-----------------695
-----------------555
12-----------------
106
-----------------20
-----------------5
25-----------------
27-----------------
15665
-----------------13
6
40
-----------------586
18-----------------
14886
-----------------6
1113
-----------------555
22-----------------
166
-----------------25
-----------------5
33-----------------
34-----------------
20675
-----------------17
7
$41,868
-------------------
42,295-------------------
41,829
-------------------
41,471-------------------
41,989-------------------
44,071
-------------------43,185
-------------------
41,471-------------------
42,755-------------------
42,669
-------------------41,001
$47,102
-----------------
51,615-----------------
47,200
-----------------
45,209-----------------
45,568-----------------
51,366
-----------------48,027
-----------------
45,895-----------------
48,038-----------------
47,279
-----------------48,360
$52,738
-----------------51,50150,87746,88357,523
-----------------54,09150,35752,53154,964
-----------------51,68856,70156,638
-----------------51,25151,50157,34655,099
-----------------55,87953,498
-----------------52,582
-----------------53,18652,894
-----------------53,373
-----------------53,37351,77157,34641,808
-----------------52,58255,120
$57,627
-----------------
61,454-----------------
58,646
-----------------
60,341-----------------
59,945-----------------
60,689
-----------------57,533
-----------------
58,794-----------------
57,876-----------------
57,590
-----------------58,794
$62,292
-----------------
63,500-----------------
61,776
-----------------
64,963-----------------
62,937-----------------
64,202
-----------------61,655
-----------------
62,434-----------------
62,432-----------------
60,917
-----------------61,081
$52,482
-----------------50,39450,57549,21355,780
-----------------52,56949,78853,07654,461
-----------------51,05054,63854,169
-----------------49,42552,08352,70353,660
-----------------55,57453,019
-----------------52,859
-----------------53,56052,658
-----------------53,227
-----------------52,65952,48555,95347,723
-----------------52,61254,894
25th %ile
Median (50%)
Avg by Org
75th %ile
Annual Base Salaries10th %ile
90th %ile
$51,327
-----------------50,39450,57549,21355,570
-----------------51,22149,17650,82854,461
-----------------51,05054,15351,673
-----------------49,42552,08352,70351,754
-----------------55,05353,019
-----------------52,014
-----------------53,56051,642
-----------------51,918
-----------------52,47152,48555,35047,723
-----------------52,42555,032
Avg by Employee

124Accounting/Finance
Senior AccountantWorking with general supervision, performs relatively complex accounting duties including maintaining and analyzing accounting records and preparing accounting schedules, reports and financial statements. Prepares journal entries, reconciles ledger accounts and ensures compliance with generally accepted accounting principles and organizational policies, procedures and contracts. May prepare federal, state and local tax returns. Does not supervise, but may advise less experienced accounting staff.
Valuing our Nonprofit Workforce 2014 Page 61
Number of Orgs Emps
All Organizations:
By Budget Size: $2,500,000 - $9,999,999 $10,000,000 - $24,999,999 $25,000,000 and overBy Geographic Location: Western Massachusetts Region Central Massachusetts Region Greater Boston Region Northeastern Massachusetts RegionBy Field of Service: Srvcs & Adv: Elderly, developmentally disabledBy Number of Employees: 26 - 50 101 - 250 251+By Years of Experience Required: 2 - 3 Years 4 - 6 YearsBy Level of Education Required: Bachelor's DegreeBy Gender of Employee: Male FemaleBy Race/Ethnicity of Employee: Black WhiteBy Number of Years in Position: Up to 5 Years 5 - 10 Years 11 - 20 YearsBy Number of Employees Managed: 1 to 3
27
-----------------86
12-----------------
5785
-----------------12
-----------------55
13-----------------
118
-----------------19
-----------------8
21-----------------
520
-----------------12
67
-----------------6
33
-----------------88
16-----------------
8788
-----------------14
-----------------55
19-----------------
158
-----------------25
-----------------1122
-----------------5
23-----------------
1667
-----------------6
$48,947
-------------------
46,374-------------------
-------------------48,683
-------------------
48,651-------------------
46,268
-------------------48,689
-------------------
49,400-------------------
48,947-------------------
46,330
-------------------
$52,718
-----------------
51,584-----------------
-----------------50,576
-----------------
49,837-----------------
52,104
-----------------51,241
-----------------
53,024-----------------
54,579-----------------
50,404
-----------------
$59,301
-----------------65,06357,26357,814
-----------------55,75561,15270,88754,746
-----------------58,438
-----------------69,09863,66955,661
-----------------57,11759,343
-----------------58,864
-----------------63,96357,814
-----------------53,33161,152
-----------------55,75562,76469,098
-----------------68,272
$66,810
-----------------
63,760-----------------
-----------------63,913
-----------------
60,008-----------------
61,859
-----------------63,816
-----------------
63,279-----------------
69,098-----------------
59,722
-----------------
$76,914
-----------------
75,075-----------------
-----------------77,438
-----------------
73,394-----------------
67,735
-----------------74,388
-----------------
69,061-----------------
77,750-----------------
67,904
-----------------
$60,609
-----------------65,92158,17058,411
-----------------56,23059,50368,23458,112
-----------------58,934
-----------------70,94564,98356,673
-----------------57,07262,931
-----------------58,776
-----------------65,14758,340
-----------------57,54161,478
-----------------56,09563,45167,213
-----------------68,126
25th %ile
Median (50%)
Avg by Org
75th %ile
Annual Base Salaries10th %ile
90th %ile
$62,070
-----------------65,92160,95759,166
-----------------58,78759,50368,23459,320
-----------------60,455
-----------------70,94564,98357,891
-----------------57,40962,931
-----------------60,274
-----------------68,00558,784
-----------------57,54162,478
-----------------57,72063,45167,213
-----------------68,126
Avg by Employee

Performs various professional accounting duties including maintaining and analyzing accounting records and preparing accounting schedules, reports and financial statements. Prepares journal entries, reconciles ledger accounts and ensures compliance with generally accepted accounting principles and organizational policies, procedures and contracts. May prepare federal, state and local tax returns.
125Accounting/Finance
© 2014 Third Sector New England & Nonprofit Compensation Associates
Staff Accountant
Page 62
Number of Orgs Emps
All Organizations:
By Budget Size: $250,000 - $999,999 $1,000,000 - $2,499,999 $2,500,000 - $9,999,999 $10,000,000 - $24,999,999 $25,000,000 and overBy Geographic Location: Western Massachusetts Region Central Massachusetts Region Greater Boston Region Northeastern Massachusetts Region Southeastern Massachusetts/Rhode Island RegionBy Field of Service: Srvcs & Adv: Children and youth Srvcs & Adv: Elderly, developmentally disabled Arts, culture, recreation Housing and homelessness prevention Cmnty/econ dev, social justice, legal, civil rights Counseling, crisis interv, mental hlth, medicalBy Number of Employees: 11 - 25 26 - 50 51 -100 101 - 250 251+By Years of Experience Required: 1 Year 2 - 3 Years 4 - 6 YearsBy Level of Education Required: High School Diploma Associate's Degree Bachelor's DegreeBy Gender of Employee: Male FemaleBy Race/Ethnicity of Employee: Asian Black WhiteBy Number of Years in Position: Up to 5 Years 5 - 10 Years 11 - 20 Years More than 20 YearsBy Number of Employees Managed: 1 to 3
77
-----------------58
291817
-----------------21
8211113
-----------------7
22856
13-----------------
1013
71924
-----------------143014
-----------------131734
-----------------1862
-----------------6
1054
-----------------412021
8-----------------
6
116
-----------------59
333039
-----------------30
8341724
-----------------1036
899
23-----------------
1116
72948
-----------------184017
-----------------152147
-----------------2087
-----------------6
1079
-----------------502123
9-----------------
6
$38,538
-------------------
39,24739,53039,395
-------------------37,711
40,06134,47437,908
-------------------
38,742
40,498-------------------
37,860
38,85439,470
-------------------36,93737,76138,172
-------------------40,06535,26939,029
-------------------38,49738,322
-------------------
38,397-------------------
37,31738,87540,598
-------------------
$41,063
-----------------
41,28840,86242,640
-----------------40,846
43,77540,79940,857
-----------------
40,898
43,680-----------------
40,829
40,71641,344
-----------------39,32240,00941,382
-----------------41,89138,18940,165
-----------------41,44440,456
-----------------
40,394-----------------
39,45744,24242,640
-----------------
$46,717
-----------------46,01043,97146,34244,85547,986
-----------------45,92746,05147,75847,27246,426
-----------------42,26245,31344,11747,84049,15046,342
-----------------44,99047,36345,40647,00845,542
-----------------45,63544,17947,611
-----------------46,01044,26245,843
-----------------47,14046,800
-----------------46,71747,00847,840
-----------------45,87447,98644,47054,226
-----------------46,322
$52,000
-----------------
53,47750,03454,995
-----------------52,250
52,98054,13251,127
-----------------
54,103
50,336-----------------
52,614
52,73952,631
-----------------53,94349,01052,468
-----------------53,47752,41650,003
-----------------53,73752,728
-----------------
53,019-----------------
52,00054,49051,376
-----------------
$55,746
-----------------
56,64253,32957,886
-----------------55,482
59,05856,35155,235
-----------------
58,891
54,404-----------------
57,379
56,99255,546
-----------------58,01754,35757,658
-----------------56,47658,20755,324
-----------------56,84656,019
-----------------
56,992-----------------
58,11555,61954,953
-----------------
$46,951
-----------------45,27842,52047,40545,79148,696
-----------------46,19447,12048,56847,03946,299
-----------------44,28847,33745,05146,15746,87446,900
-----------------43,96247,60345,63547,21347,045
-----------------46,10944,98147,455
-----------------47,34445,35246,286
-----------------47,53846,968
-----------------47,56047,62047,260
-----------------46,15847,90246,74153,478
-----------------46,607
25th %ile
Median (50%)
Avg by Org
75th %ile
Annual Base Salaries10th %ile
90th %ile
$46,180
-----------------45,27841,58746,37746,28348,162
-----------------45,58547,12046,91945,48147,281
-----------------45,54546,60445,05143,73346,37046,229
-----------------42,39446,29745,63547,66645,860
-----------------47,04344,90547,422
-----------------47,63946,16346,488
-----------------47,39346,063
-----------------47,56047,62046,474
-----------------45,74547,97846,85753,289
-----------------46,607
Avg by Employee

130Accounting/Finance
Accounting ClerkProcesses and posts a variety of accounting transactions such as invoices, payments and expenses, in accordance with departmental procedures. Maintains accounting files. Checks and verifies accounting data. Enters data into computerized accounting systems and uses the systems to research questions and generate reports. Performs related general clerical duties.
Valuing our Nonprofit Workforce 2014 Page 63
Number of Orgs Emps
All Organizations:
By Budget Size: $2,500,000 - $9,999,999 $10,000,000 - $24,999,999 $25,000,000 and overBy Geographic Location: Berkshire County Region Western Massachusetts Region Central Massachusetts Region Greater Boston Region Northeastern Massachusetts Region Southeastern Massachusetts/Rhode Island RegionBy Field of Service: Srvcs & Adv: Children and youth Srvcs & Adv: Elderly, developmentally disabled Arts, culture, recreation Cmnty/econ dev, social justice, legal, civil rights Counseling, crisis interv, mental hlth, medicalBy Number of Employees: 26 - 50 51 -100 101 - 250 251+By Years of Experience Required: 1 Year 2 - 3 Years 4 - 6 YearsBy Level of Education Required: High School Diploma Associate's Degree Bachelor's DegreeBy Gender of Employee: Male FemaleBy Race/Ethnicity of Employee: Asian Black Hispanic or Latino WhiteBy Number of Years in Position: Up to 5 Years 5 - 10 Years 11 - 20 Years More than 20 Years
77
-----------------311918
-----------------5
2414101014
-----------------1526
55
10-----------------
119
2526
-----------------2339
6-----------------
372311
-----------------8
69-----------------
6111164
-----------------512124
9
172
-----------------524169
-----------------126326172133
-----------------3059
61140
-----------------15144790
-----------------506811
-----------------903416
-----------------8
153-----------------
61411
128-----------------
872735
9
$27,697
-------------------27,29027,83427,040
-------------------23,23027,93531,36227,09029,38627,040
-------------------28,88727,040
27,040-------------------
26,72026,52028,15527,048
-------------------27,04028,072
-------------------27,16726,52027,040
-------------------
27,585-------------------
23,119
27,841-------------------
27,10624,41128,858
$30,946
-----------------28,81930,62831,502
-----------------28,84029,70931,96433,18734,93428,673
-----------------31,63730,285
30,358-----------------
28,12230,24330,28531,024
-----------------29,25631,824
-----------------30,22233,16130,285
-----------------
30,503-----------------
28,673
30,946-----------------
30,16031,20030,706
$35,006
-----------------34,92434,17435,651
-----------------33,34232,98935,18336,79539,14635,006
-----------------35,04833,19737,00331,20036,088
-----------------34,98735,30834,90235,006
-----------------33,23935,75531,574
-----------------33,01035,65137,440
-----------------37,43035,006
-----------------35,52734,88232,73935,194
-----------------34,32035,00635,85941,413
$38,751
-----------------37,69538,39740,674
-----------------35,18936,25443,53541,99240,78138,875
-----------------37,97138,355
39,578-----------------
37,52340,14938,35539,146
-----------------38,63039,931
-----------------37,52838,51138,059
-----------------
38,709-----------------
37,414
39,695-----------------
37,75238,62639,957
$43,263
-----------------39,99843,26345,677
-----------------37,26139,78249,04644,59248,93743,410
-----------------41,37142,738
44,880-----------------
49,09643,96143,48043,208
-----------------41,55444,656
-----------------42,79042,65139,663
-----------------
43,145-----------------
44,720
43,766-----------------
40,90445,42743,437
$35,144
-----------------33,79634,91536,198
-----------------31,88333,49837,48237,15438,38234,535
-----------------34,84934,40536,75732,65235,610
-----------------35,09935,41135,09235,031
-----------------33,91736,20334,517
-----------------34,14935,45334,928
-----------------39,10934,978
-----------------34,76333,81633,45235,537
-----------------34,17435,34736,11142,245
25th %ile
Median (50%)
Avg by Org
75th %ile
Annual Base Salaries10th %ile
90th %ile
$35,542
-----------------34,16136,60936,719
-----------------32,16234,05837,59638,36335,04635,581
-----------------35,21934,18237,59233,90535,578
-----------------35,59935,06635,63435,320
-----------------33,84935,75237,200
-----------------33,34235,99034,932
-----------------39,10935,409
-----------------34,76334,52133,45235,893
-----------------34,57834,97835,93742,245
Avg by Employee

Provides overall management and supervision to one or two grass roots program(s) including supervision of staff, developing/controlling the budget, developing/implementing policies and procedures, participating in obtaining funds/grants, coordinating/integrating program with others in the organization. Typically, this position directly or indirectly manages fewer than ten staff.
140Community Activism and Advocacy
© 2014 Third Sector New England & Nonprofit Compensation Associates
Grass Roots Program Manager
Page 64
Number of Orgs Emps
All Organizations:
By Level of Education Required: Bachelor's DegreeBy Gender of Employee: FemaleBy Number of Years in Position: Up to 5 Years
7
-----------------5
-----------------7
-----------------6
14
-----------------11
-----------------12
-----------------9
$38,085
-------------------
-------------------37,652
-------------------
$40,544
-----------------
-----------------40,799
-----------------
$47,050
-----------------48,693
-----------------47,050
-----------------44,990
$61,880
-----------------
-----------------73,320
-----------------
$93,465
-----------------
-----------------94,134
-----------------
$54,665
-----------------54,558
-----------------55,883
-----------------52,014
25th %ile
Median (50%)
Avg by Org
75th %ile
Annual Base Salaries10th %ile
90th %ile
$57,309
-----------------55,811
-----------------57,334
-----------------56,330
Avg by Employee
Conducts outreach in assigned communities in order to increase community awareness and engagement. Establishes relationships with community-based organizations to promote collaboration and identify potential resources. Implements public advocacy campaigns to mobilize members and supporters. Builds and maintains coalitions with grassroots groups and advocacy organizations. Organizes large-scale public education and organizing events, such as rallies, community forums, lobby visits, public hearings, news conferences, panel discussions and trainings.
142
Number of Orgs Emps
Grass Roots Activist/Advocate
All Organizations:
By Years of Experience Required: 2 - 3 YearsBy Gender of Employee: FemaleBy Race/Ethnicity of Employee: WhiteBy Number of Years in Position: Up to 5 Years
8
-----------------5
-----------------8
-----------------6
-----------------8
15
-----------------7
-----------------13
-----------------10
-----------------9
$27,560
-------------------
-------------------27,040
-------------------
-------------------
$28,621
-----------------
-----------------28,621
-----------------
-----------------
$36,275
-----------------52,645
-----------------36,920
-----------------46,592
-----------------43,264
$52,645
-----------------
-----------------55,599
-----------------
-----------------
$62,783
-----------------
-----------------64,014
-----------------
-----------------
$40,413
-----------------51,025
-----------------41,910
-----------------45,332
-----------------43,569
25th %ile
Median (50%)
Avg by Org
75th %ile
Annual Base Salaries10th %ile
90th %ile
$42,020
-----------------47,909
-----------------42,150
-----------------46,407
-----------------42,125
Avg by Employee
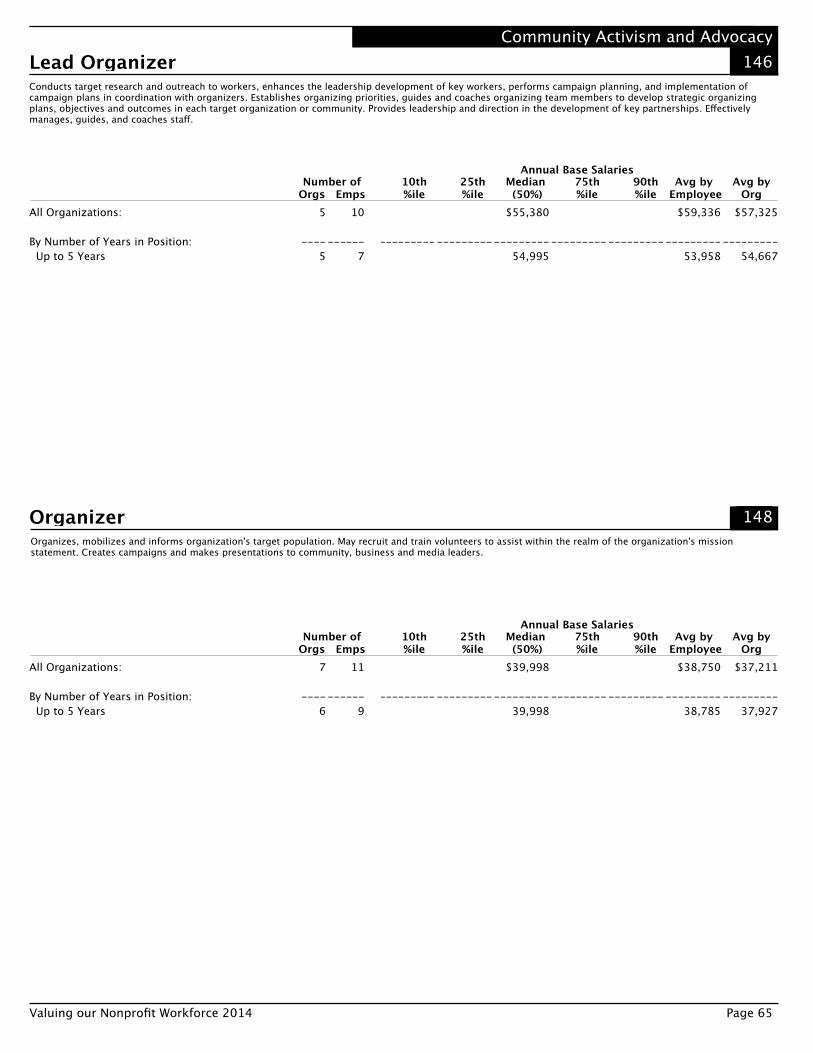
146Community Activism and Advocacy
Lead OrganizerConducts target research and outreach to workers, enhances the leadership development of key workers, performs campaign planning, and implementation of campaign plans in coordination with organizers. Establishes organizing priorities, guides and coaches organizing team members to develop strategic organizing plans, objectives and outcomes in each target organization or community. Provides leadership and direction in the development of key partnerships. Effectively manages, guides, and coaches staff.
Valuing our Nonprofit Workforce 2014 Page 65
Number of Orgs Emps
All Organizations:
By Number of Years in Position: Up to 5 Years
5
-----------------5
10
-----------------7
------------------------------------
$55,380
-----------------54,995
----------------------------------
$59,336
-----------------53,958
25th %ile
Median (50%)
Avg by Org
75th %ile
Annual Base Salaries10th %ile
90th %ile
$57,325
-----------------54,667
Avg by Employee
Organizes, mobilizes and informs organization's target population. May recruit and train volunteers to assist within the realm of the organization's mission statement. Creates campaigns and makes presentations to community, business and media leaders.
148Organizer
Number of Orgs Emps
All Organizations:
By Number of Years in Position: Up to 5 Years
7
-----------------6
11
-----------------9
------------------------------------
$39,998
-----------------39,998
----------------------------------
$38,750
-----------------38,785
25th %ile
Median (50%)
Avg by Org
75th %ile
Annual Base Salaries10th %ile
90th %ile
$37,211
-----------------37,927
Avg by Employee

Primarily responsible for raising the awareness of community residents about issues that are going on in the community. Serves as an advocate for residents, schools, hospitals and other institutions to local officials. Plans and attends meetings where residents and other community members voice their concerns. Conducts surveys in local neighborhoods to determine residents’ and community needs, to refer them to government officials and utility or other companies who can contribute to a resolution.
150Community Activism and Advocacy
© 2014 Third Sector New England & Nonprofit Compensation Associates
Community Liaison
Page 66
Number of Orgs Emps
All Organizations:
By Gender of Employee: FemaleBy Number of Years in Position: Up to 5 Years
7
-----------------6
-----------------6
17
-----------------8
-----------------10
$30,959
-------------------
-------------------
$32,999
-----------------
-----------------
$41,600
-----------------36,220
-----------------32,999
$65,271
-----------------
-----------------
$71,265
-----------------
-----------------
$48,981
-----------------41,673
-----------------42,801
25th %ile
Median (50%)
Avg by Org
75th %ile
Annual Base Salaries10th %ile
90th %ile
$38,691
-----------------39,468
-----------------38,667
Avg by Employee

154Cultural, Artistic, Performing Arts
Artistic DirectorResponsible for setting the artistic direction and programming of a performing arts or cultural organization. Organizations reporting this position will also have a CEO/Executive Director who has overall responsibility for running the organization's administrative functions. Both the Artistic Director and CEO/Executive Director report to the Board of Directors.
Valuing our Nonprofit Workforce 2014 Page 67
Number of Orgs Emps
All Organizations:
By Field of Service: Arts, culture, recreation
5
-----------------5
5
-----------------5
------------------------------------
$93,000
-----------------93,000
----------------------------------
$126,365
-----------------126,365
25th %ile
Median (50%)
Avg by Org
75th %ile
Annual Base Salaries10th %ile
90th %ile
$126,365
-----------------126,365
Avg by Employee
Directs, coordinates and may participate in the activities involved in operating a museum, art gallery or zoo. Directs instructional activities, acquisition of new items, special and standing exhibits, safekeeping, research and public service objectives of the organization.
155Curator
Number of Orgs Emps
All Organizations:
By Budget Size: $2,500,000 - $9,999,999By Field of Service: Arts, culture, recreationBy Years of Experience Required: 4 - 6 YearsBy Level of Education Required: Bachelor's DegreeBy Gender of Employee: Male FemaleBy Race/Ethnicity of Employee: WhiteBy Number of Years in Position: 11 - 20 Years
10
-----------------6
-----------------9
-----------------6
-----------------5
-----------------57
-----------------9
-----------------5
17
-----------------12
-----------------16
-----------------6
-----------------5
-----------------5
12-----------------
15-----------------
6
$33,611
-------------------33,607
-------------------33,610
-------------------
-------------------
-------------------
35,260-------------------
33,609-------------------
$41,974
-----------------45,578
-----------------40,986
-----------------
-----------------
-----------------
49,213-----------------
39,998-----------------
$66,206
-----------------68,103
-----------------68,103
-----------------54,985
-----------------43,950
-----------------62,40072,544
-----------------66,019
-----------------75,109
$82,327
-----------------78,910
-----------------83,398
-----------------
-----------------
-----------------
89,102-----------------
75,088-----------------
$93,034
-----------------89,011
-----------------94,072
-----------------
-----------------
-----------------
98,224-----------------
94,923-----------------
$65,448
-----------------64,523
-----------------65,412
-----------------58,338
-----------------51,814
-----------------54,41170,046
-----------------62,765
-----------------74,554
25th %ile
Median (50%)
Avg by Org
75th %ile
Annual Base Salaries10th %ile
90th %ile
$60,880
-----------------61,077
-----------------60,309
-----------------58,338
-----------------51,814
-----------------54,41162,989
-----------------58,137
-----------------70,267
Avg by Employee
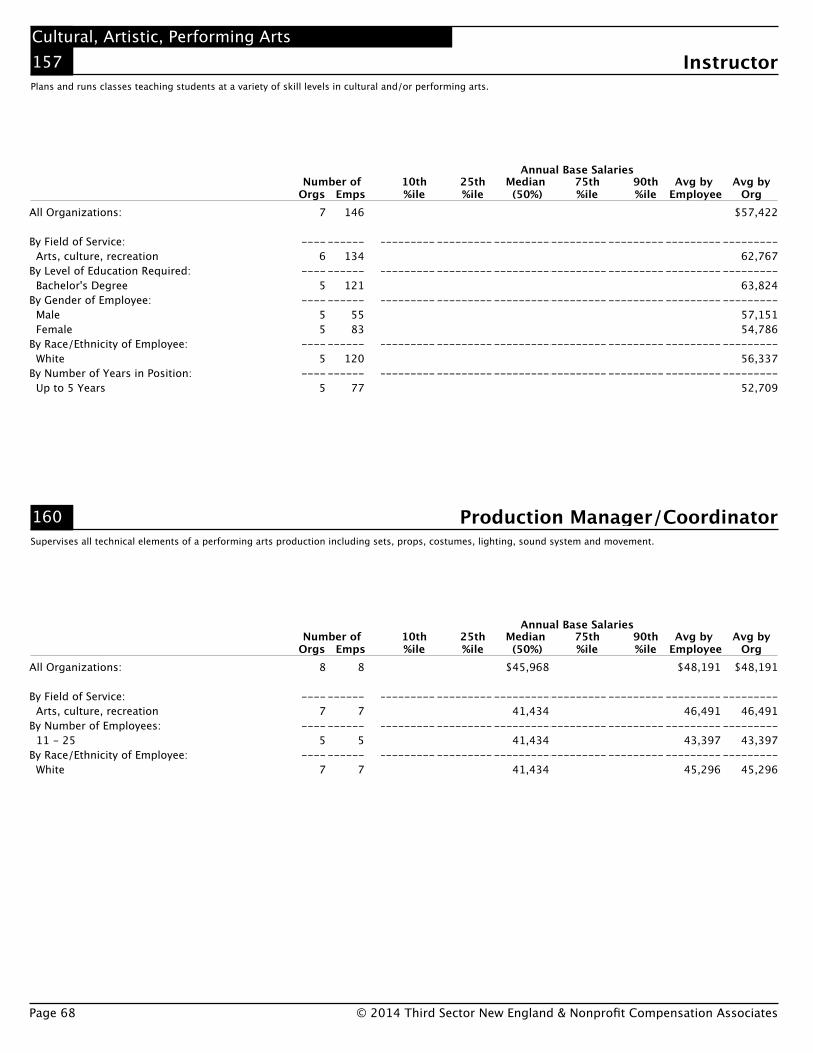
Plans and runs classes teaching students at a variety of skill levels in cultural and/or performing arts.
157Cultural, Artistic, Performing Arts
© 2014 Third Sector New England & Nonprofit Compensation Associates
Instructor
Page 68
Number of Orgs Emps
All Organizations:
By Field of Service: Arts, culture, recreationBy Level of Education Required: Bachelor's DegreeBy Gender of Employee: Male FemaleBy Race/Ethnicity of Employee: WhiteBy Number of Years in Position: Up to 5 Years
7
-----------------6
-----------------5
-----------------55
-----------------5
-----------------5
146
-----------------134
-----------------121
-----------------5583
-----------------120
-----------------77
-------------------
-------------------
-------------------
-------------------
-------------------
-----------------
-----------------
-----------------
-----------------
-----------------
-----------------
-----------------
-----------------
-----------------
-----------------
-----------------
-----------------
-----------------
-----------------
-----------------
-----------------
-----------------
-----------------
-----------------
-----------------
-----------------
-----------------
-----------------
-----------------
-----------------
25th %ile
Median (50%)
Avg by Org
75th %ile
Annual Base Salaries10th %ile
90th %ile
$57,422
-----------------62,767
-----------------63,824
-----------------57,15154,786
-----------------56,337
-----------------52,709
Avg by Employee
Supervises all technical elements of a performing arts production including sets, props, costumes, lighting, sound system and movement.
160
Number of Orgs Emps
Production Manager/Coordinator
All Organizations:
By Field of Service: Arts, culture, recreationBy Number of Employees: 11 - 25By Race/Ethnicity of Employee: White
8
-----------------7
-----------------5
-----------------7
8
-----------------7
-----------------5
-----------------7
-------------------
-------------------
-------------------
-----------------
-----------------
-----------------
$45,968
-----------------41,434
-----------------41,434
-----------------41,434
-----------------
-----------------
-----------------
-----------------
-----------------
-----------------
$48,191
-----------------46,491
-----------------43,397
-----------------45,296
25th %ile
Median (50%)
Avg by Org
75th %ile
Annual Base Salaries10th %ile
90th %ile
$48,191
-----------------46,491
-----------------43,397
-----------------45,296
Avg by Employee

205Development
Director, DevelopmentProvides leadership for the organization's efforts to obtain financial and other support to help sustain its work - including planned, annual, deferred and other giving. Identifies and contacts individuals, foundations and corporations to solicit donations. Manages the overall marketing and promotions of the organization in order to market an appropriate image, to develop partners with the community, and to meet membership and participation goals. Manages departmental budgets. Participates as a member of the senior management team to formulate and implement fundraising and other policies and plans to help meet the organization's short- and long-term goals.
Valuing our Nonprofit Workforce 2014 Page 69
Number of Orgs Emps
All Organizations:
By Budget Size: $250,000 - $999,999 $1,000,000 - $2,499,999 $2,500,000 - $9,999,999 $10,000,000 - $24,999,999 $25,000,000 and overBy Geographic Location: Western Massachusetts Region Central Massachusetts Region Greater Boston Region Northeastern Massachusetts Region Southeastern Massachusetts/Rhode Island RegionBy Field of Service: Srvcs & Adv: Children and youth Srvcs & Adv: Elderly, developmentally disabled Arts, culture, recreation Housing and homelessness prevention Cmnty/econ dev, social justice, legal, civil rights Counseling, crisis interv, mental hlth, medicalBy Number of Employees: 6 - 10 11 - 25 26 - 50 51 -100 101 - 250 251+By Years of Experience Required: 2 - 3 Years 4 - 6 Years 7 - 10 YearsBy Level of Education Required: Bachelor's Degree Master's DegreeBy Gender of Employee: Male FemaleBy Race/Ethnicity of Employee: WhiteBy Number of Years in Position: Up to 5 Years 5 - 10 Years 11 - 20 YearsBy Number of Employees Managed: 1 to 3 4 to 8 9 to 14
91
-----------------7
20351513
-----------------1514311513
-----------------191112
910
9-----------------
71819
91422
-----------------153515
-----------------6413
-----------------2069
-----------------82
-----------------601410
-----------------4915
5
97
-----------------7
20381516
-----------------1515341515
-----------------201213
91111
-----------------7
1821
91525
-----------------153517
-----------------6713
-----------------2073
-----------------87
-----------------621410
-----------------4915
5
$60,008
-------------------
60,24760,00863,83177,160
-------------------52,89957,70361,41265,89561,006
-------------------60,24759,93160,258
-------------------
53,34858,722
58,67674,281
-------------------52,89960,98163,702
-------------------60,00861,244
-------------------70,59959,018
-------------------59,887
-------------------58,95466,404
-------------------58,76069,003
$70,107
-----------------
64,06465,01673,19588,925
-----------------58,32362,40074,36072,80081,349
-----------------66,20278,56772,163
-----------------
63,75263,253
70,22179,477
-----------------57,63765,00077,106
-----------------69,99283,440
-----------------77,32964,501
-----------------70,221
-----------------68,24575,441
-----------------63,75278,083
$81,120
-----------------58,76074,11184,10578,93696,990
-----------------75,00579,99790,00278,77093,600
-----------------86,74789,28490,00271,76076,14994,994
-----------------71,76075,15176,14990,00288,56694,994
-----------------68,57876,98190,002
-----------------78,083
103,064-----------------
90,98078,770
-----------------81,120
-----------------79,38483,74179,477
-----------------78,77098,966
124,800
$99,923
-----------------
91,125104,442
95,181119,850
-----------------78,936
101,005114,078
99,840108,576
-----------------113,847104,000102,191
-----------------
90,50198,114
110,864103,389
-----------------88,56691,998
127,151-----------------
95,014135,533
-----------------122,507
96,339-----------------
100,006-----------------
100,25696,831
-----------------95,930
130,000
$124,842
-----------------
106,562145,191113,502137,952
-----------------88,674
139,443146,495108,726138,245
-----------------181,688120,619152,818
-----------------
111,301135,654
132,829124,883
-----------------105,722101,829197,995
-----------------114,063170,156
-----------------184,727109,949
-----------------116,962
-----------------122,007132,933
-----------------114,296183,385
$89,080
-----------------63,94880,13694,79485,253
101,650-----------------
70,21387,61498,56085,28395,314
-----------------99,59790,17892,46174,04383,21295,796
-----------------72,00879,20285,320
114,06091,13795,733
-----------------72,63579,748
106,933-----------------
85,633109,059
-----------------109,947
83,140-----------------
88,992-----------------
89,70089,67880,120
-----------------82,211
107,882144,141
25th %ile
Median (50%)
Avg by Org
75th %ile
Annual Base Salaries10th %ile
90th %ile
$87,606
-----------------63,94880,13693,05085,253
100,251-----------------
70,21387,01696,58785,28393,382
-----------------97,42788,61392,16674,04380,67293,113
-----------------72,00879,20281,173
114,06090,79094,100
-----------------72,63579,748
106,808-----------------
84,076109,059
-----------------109,947
82,107-----------------
87,590-----------------
88,74289,67880,120
-----------------82,211
107,882144,141
Avg by Employee

Manages one or more functions within the development department such as foundations and corporate grants, direct mail, special events, communications, annual giving, major gifts, planned/deferred giving, etc. Supervises grant writers and administrative/support staff.
210Development
© 2014 Third Sector New England & Nonprofit Compensation Associates
Development Manager
Page 70
Number of Orgs Emps
All Organizations:
By Budget Size: $1,000,000 - $2,499,999 $2,500,000 - $9,999,999 $10,000,000 - $24,999,999By Geographic Location: Western Massachusetts Region Greater Boston Region Northeastern Massachusetts Region Southeastern Massachusetts/Rhode Island RegionBy Field of Service: Srvcs & Adv: Elderly, developmentally disabled Arts, culture, recreation Cmnty/econ dev, social justice, legal, civil rightsBy Number of Employees: 11 - 25 26 - 50 51 -100 101 - 250 251+By Years of Experience Required: 2 - 3 Years 4 - 6 YearsBy Level of Education Required: Bachelor's DegreeBy Gender of Employee: FemaleBy Race/Ethnicity of Employee: WhiteBy Number of Years in Position: Up to 5 Years 5 - 10 YearsBy Number of Employees Managed: 1 to 3
37
-----------------7
157
-----------------5
1185
-----------------667
-----------------75687
-----------------13
7-----------------
22-----------------
29-----------------
31-----------------
237
-----------------12
47
-----------------7
1811
-----------------8
1313
5-----------------
868
-----------------7779
13-----------------
148
-----------------30
-----------------37
-----------------38
-----------------27
8-----------------
13
$40,797
-------------------
42,143
-------------------
38,64845,498
-------------------
-------------------
36,885-------------------
42,387
-------------------43,278
-------------------37,535
-------------------37,727
-------------------37,535
-------------------38,992
$45,760
-----------------
45,505
-----------------
48,52747,819
-----------------
-----------------
46,062-----------------
46,020
-----------------47,357
-----------------45,542
-----------------45,115
-----------------45,323
-----------------51,106
$54,080
-----------------51,00255,12054,683
-----------------49,81658,71853,60262,858
-----------------66,46247,34145,802
-----------------46,53054,08060,11257,13862,453
-----------------53,04061,828
-----------------54,382
-----------------53,602
-----------------53,841
-----------------54,68353,040
-----------------62,453
$64,480
-----------------
63,264
-----------------
65,86465,395
-----------------
-----------------
73,868-----------------
61,142
-----------------64,954
-----------------64,480
-----------------64,954
-----------------64,938
-----------------68,942
$73,519
-----------------
67,319
-----------------
72,93874,697
-----------------
-----------------
75,018-----------------
66,290
-----------------71,931
-----------------71,076
-----------------73,510
-----------------74,389
-----------------73,941
$55,023
-----------------52,84154,67158,592
-----------------50,13957,14156,45464,301
-----------------59,42548,09148,679
-----------------48,69355,14957,93756,80659,024
-----------------53,46759,818
-----------------55,906
-----------------54,303
-----------------54,760
-----------------55,67955,736
-----------------59,365
25th %ile
Median (50%)
Avg by Org
75th %ile
Annual Base Salaries10th %ile
90th %ile
$55,066
-----------------52,84153,92561,897
-----------------49,71257,08856,58364,301
-----------------63,86248,09149,127
-----------------48,69354,53657,28958,21462,769
-----------------53,50059,531
-----------------56,108
-----------------54,032
-----------------54,742
-----------------54,65355,653
-----------------58,478
Avg by Employee

211Development
Development Manager, Annual GivingManages the organization's annual giving campaign. Responsible for the overall campaign strategy and execution, and for long-range planning, donor relations, data management, and supervision of administrative and support staff.
Valuing our Nonprofit Workforce 2014 Page 71
Number of Orgs Emps
All Organizations:
By Budget Size: $2,500,000 - $9,999,999 $25,000,000 and overBy Geographic Location: Greater Boston RegionBy Number of Employees: 251+By Years of Experience Required: 4 - 6 YearsBy Level of Education Required: Bachelor's DegreeBy Gender of Employee: Male FemaleBy Race/Ethnicity of Employee: WhiteBy Number of Years in Position: Up to 5 YearsBy Number of Employees Managed: 1 to 3
15
-----------------55
-----------------7
-----------------7
-----------------5
-----------------12
-----------------59
-----------------12
-----------------12
-----------------6
16
-----------------55
-----------------8
-----------------8
-----------------5
-----------------12
-----------------5
10-----------------
12-----------------
13-----------------
6
$44,990
-------------------
-------------------
-------------------
-------------------
-------------------44,990
-------------------
-------------------44,990
-------------------44,990
-------------------
$49,223
-----------------
-----------------
-----------------
-----------------
-----------------48,230
-----------------
-----------------48,230
-----------------48,475
-----------------
$62,712
-----------------60,42476,066
-----------------59,998
-----------------70,533
-----------------54,995
-----------------55,692
-----------------60,42459,998
-----------------55,692
-----------------56,389
-----------------62,057
$75,324
-----------------
-----------------
-----------------
-----------------
-----------------75,177
-----------------
-----------------75,177
-----------------74,288
-----------------
$87,949
-----------------
-----------------
-----------------
-----------------
-----------------80,012
-----------------
-----------------97,062
-----------------94,416
-----------------
$64,208
-----------------61,20370,595
-----------------64,068
-----------------69,579
-----------------56,584
-----------------59,708
-----------------62,03464,405
-----------------62,346
-----------------61,989
-----------------63,118
25th %ile
Median (50%)
Avg by Org
75th %ile
Annual Base Salaries10th %ile
90th %ile
$62,821
-----------------61,20370,595
-----------------61,077
-----------------67,376
-----------------56,584
-----------------59,708
-----------------62,03462,117
-----------------62,346
-----------------60,071
-----------------63,118
Avg by Employee
Manages the organization's major gifts program. Responsible for the overall strategy and execution, and for long-range planning, donor relations, data management and supervision of administrative and support staff.
212Development Manager, Major Gifts
Number of Orgs Emps
All Organizations:
By Budget Size: $2,500,000 - $9,999,999By Geographic Location: Greater Boston RegionBy Years of Experience Required: 4 - 6 YearsBy Level of Education Required: Bachelor's DegreeBy Gender of Employee: FemaleBy Race/Ethnicity of Employee: WhiteBy Number of Years in Position: Up to 5 Years
12
-----------------7
-----------------5
-----------------5
-----------------8
-----------------11
-----------------11
-----------------12
15
-----------------10
-----------------8
-----------------5
-----------------10
-----------------13
-----------------14
-----------------13
$51,564
-------------------
-------------------
-------------------
-------------------
-------------------47,966
-------------------49,765
-------------------47,966
$62,858
-----------------
-----------------
-----------------
-----------------
-----------------62,629
-----------------62,744
-----------------62,629
$67,500
-----------------74,662
-----------------76,139
-----------------65,998
-----------------66,654
-----------------67,018
-----------------67,259
-----------------67,018
$85,509
-----------------
-----------------
-----------------
-----------------
-----------------83,752
-----------------82,873
-----------------82,275
$117,537
-----------------
-----------------
-----------------
-----------------
-----------------108,189
-----------------117,947
-----------------105,731
$75,653
-----------------78,167
-----------------82,792
-----------------63,611
-----------------71,538
-----------------72,297
-----------------74,594
-----------------71,754
25th %ile
Median (50%)
Avg by Org
75th %ile
Annual Base Salaries10th %ile
90th %ile
$72,229
-----------------73,375
-----------------78,860
-----------------63,611
-----------------67,317
-----------------70,069
-----------------70,570
-----------------71,242
Avg by Employee

Researches grant opportunities that match the goals and objectives of the organization. Gathers information from various departments and coordinates/writes grant proposals for government, corporate and foundation funds. Develops/maintains effective, long-term working relationships with grantors to facilitate approval of grants. Follows up with grantors to determine/monitor grant status.
215Development
© 2014 Third Sector New England & Nonprofit Compensation Associates
Grant Writer, All Funding Types
Page 72
Number of Orgs Emps
All Organizations:
By Budget Size: $1,000,000 - $2,499,999 $2,500,000 - $9,999,999 $10,000,000 - $24,999,999 $25,000,000 and overBy Geographic Location: Central Massachusetts Region Greater Boston RegionBy Field of Service: Srvcs & Adv: Children and youth Srvcs & Adv: Elderly, developmentally disabledBy Number of Employees: 26 - 50 101 - 250 251+By Years of Experience Required: 2 - 3 Years 4 - 6 YearsBy Level of Education Required: Bachelor's DegreeBy Gender of Employee: FemaleBy Race/Ethnicity of Employee: WhiteBy Number of Years in Position: Up to 5 Years
30
-----------------7785
-----------------69
-----------------57
-----------------678
-----------------99
-----------------22
-----------------24
-----------------26
-----------------22
34
-----------------77
107
-----------------7
10-----------------
59
-----------------68
11-----------------
1010
-----------------24
-----------------28
-----------------30
-----------------23
$38,501
-------------------
-------------------
-------------------
-------------------
-------------------
-------------------40,643
-------------------40,250
-------------------39,102
-------------------38,384
$43,098
-----------------
-----------------
-----------------
-----------------
-----------------
-----------------45,994
-----------------43,186
-----------------43,114
-----------------43,181
$52,978
-----------------45,98945,86452,97858,136
-----------------60,79846,000
-----------------65,00052,208
-----------------46,27352,97858,011
-----------------46,28458,074
-----------------56,015
-----------------52,978
-----------------52,978
-----------------53,747
$66,451
-----------------
-----------------
-----------------
-----------------
-----------------
-----------------66,061
-----------------66,524
-----------------65,354
-----------------66,414
$70,003
-----------------
-----------------
-----------------
-----------------
-----------------
-----------------68,630
-----------------69,994
-----------------69,782
-----------------69,755
$53,901
-----------------53,15946,92654,97457,586
-----------------56,83252,955
-----------------60,44952,885
-----------------53,10055,44253,690
-----------------54,63256,811
-----------------55,022
-----------------53,828
-----------------53,252
-----------------53,757
25th %ile
Median (50%)
Avg by Org
75th %ile
Annual Base Salaries10th %ile
90th %ile
$53,639
-----------------53,15946,92656,19655,965
-----------------55,11252,986
-----------------60,44950,877
-----------------53,10056,57851,830
-----------------53,24157,846
-----------------54,420
-----------------53,488
-----------------52,851
-----------------53,148
Avg by Employee

220Development
Special Event CoordinatorDevelops and coordinates special events that generate funds and attendance, and/or to increase members volunteers and/or clients for the organization. Identifies special events that are appropriate to the organization's image and mission. Plans budgets, locates and secures facilities, food, entertainment and equipment. Solicits donations and participation. Plans and organizes ticket sales. Attends events to coordinate activities, to ensure smooth operations and to resolve problems that may arise. Oversees marketing and promotions for the event. Conducts an evaluation after the event to determine its successes and improvements needed for the next time the event occurs. Develops and maintains donor and participant databases.
Valuing our Nonprofit Workforce 2014 Page 73
Number of Orgs Emps
All Organizations:
By Budget Size: $1,000,000 - $2,499,999 $2,500,000 - $9,999,999 $25,000,000 and overBy Geographic Location: Western Massachusetts Region Greater Boston RegionBy Field of Service: Srvcs & Adv: Children and youth Srvcs & Adv: Elderly, developmentally disabledBy Number of Employees: 26 - 50 251+By Years of Experience Required: 1 Year 2 - 3 Years 4 - 6 YearsBy Level of Education Required: Bachelor's DegreeBy Gender of Employee: Male FemaleBy Race/Ethnicity of Employee: WhiteBy Number of Years in Position: Up to 5 Years 5 - 10 YearsBy Number of Employees Managed: 1 to 3
27
-----------------895
-----------------6
12-----------------
65
-----------------77
-----------------5
136
-----------------23
-----------------5
22-----------------
25-----------------
225
-----------------6
39
-----------------8
179
-----------------8
22-----------------
87
-----------------7
11-----------------
521
6-----------------
33-----------------
532
-----------------33
-----------------30
5-----------------
6
$33,966
-------------------
30,998
-------------------
37,609-------------------
-------------------
-------------------
31,872
-------------------33,055
-------------------
32,903-------------------
34,382-------------------
34,070
-------------------
$40,997
-----------------
38,283
-----------------
46,878-----------------
-----------------
-----------------
41,101
-----------------37,721
-----------------
38,751-----------------
39,604-----------------
40,108
-----------------
$49,982
-----------------48,83949,13053,539
-----------------40,17550,003
-----------------47,49753,539
-----------------50,00353,539
-----------------37,44047,38257,762
-----------------47,382
-----------------53,56047,382
-----------------50,003
-----------------48,25666,560
-----------------60,892
$57,491
-----------------
52,978
-----------------
64,376-----------------
-----------------
-----------------
52,478
-----------------53,550
-----------------
53,883-----------------
60,892-----------------
53,669
-----------------
$67,999
-----------------
68,286
-----------------
73,070-----------------
-----------------
-----------------
59,705
-----------------62,799
-----------------
65,584-----------------
68,072-----------------
63,436
-----------------
$49,879
-----------------48,56048,30555,480
-----------------41,60053,268
-----------------50,46954,199
-----------------47,62154,978
-----------------39,28346,87458,677
-----------------47,403
-----------------60,72048,118
-----------------51,055
-----------------48,00059,571
-----------------58,164
25th %ile
Median (50%)
Avg by Org
75th %ile
Annual Base Salaries10th %ile
90th %ile
$47,862
-----------------48,56044,38553,608
-----------------38,52451,712
-----------------48,35949,953
-----------------47,62153,354
-----------------39,28344,19758,677
-----------------45,257
-----------------60,72045,868
-----------------49,284
-----------------46,94759,571
-----------------58,164
Avg by Employee

Performs a variety of skilled administrative and clerical duties directly related to development activities. These include maintaining donor databases, developing/sending mass mailings, coordinating placement of advertisements, assisting and participating in special events, arranging for pick up of donated items, acknowledging gifts and donations, developing effective working relationships with donors, volunteers, government and foundation representatives and others to nurture their connection to the organization. May provide secretarial support to development managers and staff.
225Development
© 2014 Third Sector New England & Nonprofit Compensation Associates
Development Associate
Page 74
Number of Orgs Emps
All Organizations:
By Budget Size: $250,000 - $999,999 $1,000,000 - $2,499,999 $2,500,000 - $9,999,999 $10,000,000 - $24,999,999 $25,000,000 and overBy Geographic Location: Western Massachusetts Region Central Massachusetts Region Greater Boston Region Northeastern Massachusetts Region Southeastern Massachusetts/Rhode Island RegionBy Field of Service: Srvcs & Adv: Children and youth Srvcs & Adv: Elderly, developmentally disabled Arts, culture, recreation Counseling, crisis interv, mental hlth, medicalBy Number of Employees: 11 - 25 26 - 50 51 -100 101 - 250 251+By Years of Experience Required: 1 Year 2 - 3 YearsBy Level of Education Required: High School Diploma Bachelor's DegreeBy Gender of Employee: Male FemaleBy Race/Ethnicity of Employee: WhiteBy Number of Years in Position: Up to 5 Years 5 - 10 Years
64
-----------------7
1324
711
-----------------7
102312
9-----------------
131215
5-----------------
1477
1216
-----------------1624
-----------------7
36-----------------
1153
-----------------56
-----------------4810
82
-----------------7
1332
820
-----------------1110311611
-----------------15181610
-----------------1412
91326
-----------------2033
-----------------8
46-----------------
1267
-----------------66
-----------------6010
$27,381
-------------------
28,23430,621
26,932-------------------
27,26926,838
-------------------28,70426,62625,688
-------------------26,82231,824
27,21427,157
-------------------25,06427,269
-------------------
28,413-------------------
24,96028,651
-------------------28,677
-------------------27,432
$31,200
-----------------
35,40233,727
27,678-----------------
31,20035,391
-----------------34,00827,26931,200
-----------------29,12040,804
32,25129,721
-----------------29,47732,822
-----------------
33,920-----------------
27,14931,200
-----------------33,085
-----------------31,398
$38,428
-----------------31,20037,44041,54840,86235,423
-----------------30,68040,23839,99839,88437,336
-----------------38,00237,12836,50338,803
-----------------35,40242,78241,49639,99837,471
-----------------37,38841,413
-----------------38,80339,759
-----------------39,27138,376
-----------------38,491
-----------------38,18941,278
$42,744
-----------------
44,97043,113
40,877-----------------
43,78443,264
-----------------41,99544,47642,245
-----------------42,67751,002
41,79841,465
-----------------40,04043,649
-----------------
43,342-----------------
43,65442,661
-----------------43,342
-----------------42,744
$50,571
-----------------
58,12050,802
51,517-----------------
47,84052,031
-----------------54,74653,41746,450
-----------------54,17455,089
46,97951,214
-----------------45,79653,414
-----------------
52,000-----------------
60,03151,102
-----------------51,214
-----------------47,923
$38,597
-----------------32,92940,44339,96041,95836,619
-----------------36,86639,75739,18239,78036,623
-----------------39,22437,87936,55739,310
-----------------36,62344,20339,31738,06737,593
-----------------35,83640,247
-----------------36,08039,625
-----------------38,57738,523
-----------------39,045
-----------------38,28940,319
25th %ile
Median (50%)
Avg by Org
75th %ile
Annual Base Salaries10th %ile
90th %ile
$38,326
-----------------32,92940,44338,56041,20538,255
-----------------35,79039,75738,79539,82636,298
-----------------37,96239,18936,31139,808
-----------------36,62342,82538,78237,88538,663
-----------------35,33640,004
-----------------35,69139,023
-----------------38,23138,704
-----------------38,798
-----------------37,89040,319
Avg by Employee

253Education & Recreation
Director, EducationDevelops, organizes and implements community education programs and activities for targeted clients including adult education programs, school-aged programs and pre-school activities. Ensures programs meet needs of community and goals and objectives of organization. Manages program budgets. Participates as a member of the senior management team in the development and implementation of organization-wide policies and programs that will contribute to its overall success.
Valuing our Nonprofit Workforce 2014 Page 75
Number of Orgs Emps
All Organizations:
By Budget Size: $1,000,000 - $2,499,999 $2,500,000 - $9,999,999 $10,000,000 - $24,999,999 $25,000,000 and overBy Geographic Location: Western Massachusetts Region Central Massachusetts Region Greater Boston Region Northeastern Massachusetts Region Southeastern Massachusetts/Rhode Island RegionBy Field of Service: Srvcs & Adv: Children and youth Srvcs & Adv: Elderly, developmentally disabled Arts, culture, recreation Counseling, crisis interv, mental hlth, medicalBy Number of Employees: 11 - 25 26 - 50 101 - 250 251+By Years of Experience Required: 2 - 3 Years 4 - 6 Years 7 - 10 YearsBy Level of Education Required: Bachelor's Degree Master's DegreeBy Gender of Employee: Male FemaleBy Race/Ethnicity of Employee: WhiteBy Number of Years in Position: Up to 5 Years 5 - 10 Years 11 - 20 Years More than 20 YearsBy Number of Employees Managed: 1 to 3 4 to 8 9 to 14 15 and over
44
-----------------101311
8-----------------
97
1285
-----------------12
696
-----------------869
15-----------------
916
8-----------------
1917
-----------------1332
-----------------39
-----------------23
711
7-----------------
1214
611
54
-----------------13151410
-----------------10
91611
5-----------------
16996
-----------------10
61020
-----------------9
218
-----------------2122
-----------------1538
-----------------47
-----------------24
812
8-----------------
1214
612
$42,443
-------------------38,33948,38146,800
-------------------
46,752
-------------------48,268
-------------------
46,795-------------------
40,918
-------------------41,77549,484
-------------------54,17141,575
-------------------42,249
-------------------45,843
41,687
-------------------40,97247,845
47,376
$49,135
-----------------42,44349,62974,196
-----------------
63,731
-----------------59,847
-----------------
57,409-----------------
47,845
-----------------47,75762,525
-----------------64,48047,535
-----------------48,006
-----------------48,245
53,857
-----------------43,10351,569
52,525
$64,740
-----------------48,00664,29381,99674,516
-----------------54,36259,42675,75257,990
101,566-----------------
68,39180,00149,19284,500
-----------------44,78368,04870,75179,001
-----------------57,99059,42679,685
-----------------52,00076,222
-----------------75,94157,357
-----------------63,544
-----------------69,09861,83964,01261,454
-----------------54,54874,56886,26861,860
$84,240
-----------------64,01276,50286,897
-----------------
81,808
-----------------79,241
-----------------
87,110-----------------
72,967
-----------------70,51290,766
-----------------85,01080,603
-----------------84,989
-----------------88,754
83,147
-----------------88,96787,199
76,445
$102,783
-----------------83,525
121,172108,327
-----------------
130,595
-----------------88,021
-----------------
103,757-----------------
92,027
-----------------85,172
117,716-----------------
143,483101,809
-----------------107,919
-----------------115,825
112,886
-----------------134,052147,441
112,013
$70,590
-----------------54,38769,78580,20284,358
-----------------59,32964,30977,68863,05499,183
-----------------68,85578,80154,38583,779
-----------------49,55677,48081,56976,728
-----------------64,73462,09084,484
-----------------58,68479,608
-----------------81,97865,742
-----------------69,923
-----------------72,44871,21268,84463,537
-----------------68,55077,93572,91867,434
25th %ile
Median (50%)
Avg by Org
75th %ile
Annual Base Salaries10th %ile
90th %ile
$72,457
-----------------56,30871,60079,84990,533
-----------------60,12165,30679,79666,14499,183
-----------------67,85084,56754,38583,779
-----------------51,95277,48084,57478,050
-----------------64,73462,54184,484
-----------------58,75782,415
-----------------83,16667,715
-----------------71,786
-----------------73,32875,84969,28463,834
-----------------68,55077,93572,91867,977
Avg by Employee

Provides overall management and supervision to one or more Outside of School Time Program(s) including supervising staff, developing and managing the budget, developing and implementing policies and procedures, participating in obtaining funds and grants, coordinating and integrating the program with other organizational programs. Typically, this position manages fewer than ten staff members, directly and/or indirectly.
255Education & Recreation
© 2014 Third Sector New England & Nonprofit Compensation Associates
Outside of School Program Manager
Page 76
Number of Orgs Emps
All Organizations:
By Budget Size: $1,000,000 - $2,499,999 $2,500,000 - $9,999,999By Geographic Location: Greater Boston RegionBy Field of Service: Srvcs & Adv: Children and youthBy Number of Employees: 11 - 25 26 - 50By Years of Experience Required: 2 - 3 Years 4 - 6 YearsBy Level of Education Required: Bachelor's DegreeBy Gender of Employee: Male FemaleBy Race/Ethnicity of Employee: WhiteBy Number of Years in Position: Up to 5 Years 5 - 10 Years 11 - 20 YearsBy Number of Employees Managed: 1 to 3 4 to 8
21
-----------------88
-----------------8
-----------------11
-----------------75
-----------------79
-----------------18
-----------------8
16-----------------
16-----------------
1477
-----------------11
8
53
-----------------1718
-----------------15
-----------------32
-----------------1117
-----------------2418
-----------------44
-----------------1537
-----------------38
-----------------33
99
-----------------1811
$31,200
-------------------29,76523,444
-------------------34,507
-------------------29,193
-------------------
23,092-------------------
30,59735,659
-------------------32,386
-------------------26,82831,832
-------------------34,704
-------------------30,476
-------------------27,993
$35,714
-----------------33,89434,507
-----------------42,494
-----------------34,632
-----------------
42,224-----------------
35,36040,711
-----------------38,137
-----------------32,78138,023
-----------------38,855
-----------------34,757
-----------------34,881
$45,510
-----------------42,84845,781
-----------------55,058
-----------------45,375
-----------------38,41859,821
-----------------46,38448,225
-----------------47,341
-----------------47,00844,990
-----------------46,738
-----------------41,60044,99046,051
-----------------42,04758,074
$55,609
-----------------59,82159,005
-----------------65,062
-----------------59,384
-----------------
71,365-----------------
58,59959,005
-----------------59,384
-----------------56,16056,504
-----------------58,511
-----------------57,117
-----------------49,987
$70,541
-----------------75,02669,951
-----------------71,797
-----------------73,397
-----------------
75,026-----------------
75,02669,951
-----------------72,020
-----------------71,79770,999
-----------------73,322
-----------------67,783
-----------------57,050
$47,237
-----------------47,48547,671
-----------------53,553
-----------------47,435
-----------------41,24855,490
-----------------48,27950,244
-----------------49,580
-----------------46,67047,499
-----------------49,887
-----------------45,87045,67751,702
-----------------41,81653,038
25th %ile
Median (50%)
Avg by Org
75th %ile
Annual Base Salaries10th %ile
90th %ile
$47,908
-----------------44,37348,912
-----------------53,021
-----------------45,908
-----------------44,46755,020
-----------------47,65548,489
-----------------49,486
-----------------49,29146,415
-----------------48,019
-----------------46,08047,87648,624
-----------------41,32648,711
Avg by Employee

256Education & Recreation
Educator or Teacher, Adult EducationDetermines needs of adult clients and develops/implements appropriate curricula to meet those needs. Conducts educational sessions with adult clients to improve skills and functioning. May provide supervision to teaching assistants.
Valuing our Nonprofit Workforce 2014 Page 77
Number of Orgs Emps
All Organizations:
By Budget Size: $2,500,000 - $9,999,999 $10,000,000 - $24,999,999By Geographic Location: Western Massachusetts RegionBy Field of Service: Cmnty/econ dev, social justice, legal, civil rightsBy Number of Employees: 26 - 50By Years of Experience Required: 2 - 3 Years 4 - 6 YearsBy Level of Education Required: Bachelor's Degree Master's DegreeBy Gender of Employee: Male FemaleBy Race/Ethnicity of Employee: WhiteBy Number of Years in Position: Up to 5 Years 5 - 10 Years
21
-----------------75
-----------------6
-----------------5
-----------------5
-----------------55
-----------------12
5-----------------
1016
-----------------16
-----------------20
6
75
-----------------3527
-----------------9
-----------------20
-----------------8
-----------------13
8-----------------
298
-----------------1541
-----------------47
-----------------4010
$33,047
-------------------
37,877-------------------
-------------------33,210
-------------------
-------------------30,888
-------------------33,010
-------------------29,85232,810
-------------------32,619
-------------------32,149
$38,002
-----------------
38,480-----------------
-----------------41,371
-----------------
-----------------40,009
-----------------36,171
-----------------37,37837,721
-----------------37,440
-----------------37,347
$41,600
-----------------
41,371-----------------
42,994-----------------
41,371-----------------
44,335-----------------
43,76348,006
-----------------38,48044,855
-----------------41,37141,371
-----------------41,371
-----------------41,37139,250
$44,720
-----------------
46,675-----------------
-----------------44,481
-----------------
-----------------44,855
-----------------44,242
-----------------48,00644,855
-----------------44,990
-----------------46,431
$53,997
-----------------
55,469-----------------
-----------------49,608
-----------------
-----------------52,316
-----------------49,920
-----------------57,95755,145
-----------------52,399
-----------------55,388
$42,332
-----------------
43,587-----------------
42,691-----------------
42,236-----------------
46,636-----------------
42,63748,355
-----------------40,72147,650
-----------------42,44241,917
-----------------41,478
-----------------42,22841,115
25th %ile
Median (50%)
Avg by Org
75th %ile
Annual Base Salaries10th %ile
90th %ile
$41,971
-----------------40,11944,465
-----------------41,836
-----------------43,118
-----------------47,177
-----------------42,63449,192
-----------------41,67446,688
-----------------41,66641,346
-----------------40,153
-----------------41,84039,289
Avg by Employee

Develops and implements grade appropriate curricula to meet the academic and other needs of children in a K - 12 classroom setting. Ensures safety and health of students. Participates in development and implementation of IEP's for specific students, as needed. Assesses and documents students' progress. May participate in implementing therapeutic programs for students. May supervise teaching assistant(s).
259Education & Recreation
© 2014 Third Sector New England & Nonprofit Compensation Associates
Teacher, K-12
Page 78
Number of Orgs Emps
All Organizations:
By Budget Size: $10,000,000 - $24,999,999 $25,000,000 and overBy Geographic Location: Greater Boston RegionBy Field of Service: Srvcs & Adv: Children and youth Srvcs & Adv: Elderly, developmentally disabled Counseling, crisis interv, mental hlth, medicalBy Number of Employees: 251+By Years of Experience Required: 1 Year 2 - 3 YearsBy Level of Education Required: High School Diploma Bachelor's Degree Credential/Certification/LicenseBy Gender of Employee: Male FemaleBy Race/Ethnicity of Employee: Black WhiteBy Number of Years in Position: Up to 5 Years 5 - 10 Years 11 - 20 Years
21
-----------------67
-----------------5
-----------------855
-----------------13
-----------------6
10-----------------
512
6-----------------
1620
-----------------5
19-----------------
1713
7
220
-----------------6590
-----------------25
-----------------944570
-----------------135
-----------------4029
-----------------489830
-----------------52
146-----------------
7174
-----------------111
2017
$34,530
-------------------44,48231,061
-------------------36,740
-------------------40,664
33,259-------------------
32,092-------------------
31,82427,040
-------------------
39,95033,559
-------------------36,25533,983
-------------------
34,029-------------------
34,30836,32641,065
$40,753
-----------------46,14534,986
-----------------42,578
-----------------44,964
35,277-----------------
37,136-----------------
34,01936,779
-----------------
43,83135,142
-----------------44,01939,520
-----------------
40,539-----------------
39,99841,34047,715
$46,592
-----------------49,50441,216
-----------------46,405
-----------------48,797
44,304-----------------
44,990-----------------
37,85642,640
-----------------
47,72641,642
-----------------49,36944,990
-----------------39,52045,958
-----------------44,99048,97455,973
$52,000
-----------------55,72347,533
-----------------52,770
-----------------54,730
52,000-----------------
51,501-----------------
44,69449,234
-----------------
54,91245,630
-----------------54,99549,920
-----------------
52,000-----------------
49,50457,24163,045
$60,819
-----------------65,07155,827
-----------------55,868
-----------------60,819
62,908-----------------
57,179-----------------
51,50153,560
-----------------
60,81952,000
-----------------64,59657,178
-----------------
60,819-----------------
54,99560,81966,493
$46,960
-----------------51,56242,051
-----------------46,864
-----------------50,190
44,716-----------------
45,035-----------------
39,72143,306
-----------------
49,30841,730
-----------------49,86345,076
-----------------43,18146,784
-----------------45,00448,49154,753
25th %ile
Median (50%)
Avg by Org
75th %ile
Annual Base Salaries10th %ile
90th %ile
$46,886
-----------------49,70841,087
-----------------47,175
-----------------50,84845,12345,529
-----------------44,933
-----------------42,81946,043
-----------------39,09148,54542,016
-----------------47,93045,894
-----------------45,26947,242
-----------------44,49848,02454,685
Avg by Employee

262Education & Recreation
Teacher, Pre-SchoolProvides a safe, nurturing environment for pre-school children. Develops and implements a curricula program with the goal of developing kindergarten-readiness skills. Ensures the safety and health of students. Assists children with physical needs. Maintains effective communications with parents and guardians. May supervise a teacher's assistant.
Valuing our Nonprofit Workforce 2014 Page 79
Number of Orgs Emps
All Organizations:
By Budget Size: $2,500,000 - $9,999,999 $10,000,000 - $24,999,999By Geographic Location: Greater Boston Region Southeastern Massachusetts/Rhode Island RegionBy Field of Service: Srvcs & Adv: Children and youth Cmnty/econ dev, social justice, legal, civil rightsBy Number of Employees: 51 -100 101 - 250 251+By Years of Experience Required: 1 Year 2 - 3 YearsBy Level of Education Required: High School Diploma Associate's Degree Bachelor's Degree Credential/Certification/LicenseBy Gender of Employee: Male FemaleBy Race/Ethnicity of Employee: Black Hispanic or Latino WhiteBy Number of Years in Position: Up to 5 Years 5 - 10 Years 11 - 20 Years More than 20 YearsBy Number of Employees Managed: 1 to 3
26
-----------------10
6-----------------
56
-----------------13
5-----------------
657
-----------------13
9-----------------
51112
6-----------------
724
-----------------101126
-----------------232015
6-----------------
8
431
-----------------120164
-----------------76
118-----------------
25055
-----------------6761
235-----------------
14934
-----------------119201
4164
-----------------7
404-----------------
4675
291-----------------
221109
6711
-----------------118
$22,277
-------------------21,85927,477
-------------------26,855
-------------------25,49321,516
-------------------26,29125,52222,110
-------------------23,40021,840
-------------------
26,29126,62419,417
-------------------
22,256-------------------
20,80423,11722,880
-------------------21,75723,00526,441
-------------------27,562
$25,480
-----------------25,69328,340
-----------------28,636
-----------------27,56024,960
-----------------27,56027,75824,440
-----------------25,48024,685
-----------------
27,56027,76823,384
-----------------
25,397-----------------
22,18925,68825,958
-----------------23,92025,36629,390
-----------------30,680
$29,120
-----------------29,12031,939
-----------------31,990
-----------------31,20029,120
-----------------29,20332,34428,517
-----------------27,56028,288
-----------------
31,55430,68027,040
-----------------25,08528,881
-----------------25,88629,16229,120
-----------------27,56029,12034,63240,165
-----------------34,632
$34,278
-----------------32,55737,029
-----------------37,185
-----------------36,74934,944
-----------------32,01137,66934,632
-----------------31,20030,545
-----------------
36,95136,77429,224
-----------------
33,353-----------------
30,62835,38134,632
-----------------31,85533,10339,915
-----------------38,501
$40,144
-----------------42,18441,226
-----------------42,411
-----------------41,60036,774
-----------------37,46142,41139,973
-----------------32,76040,872
-----------------
41,64241,60033,020
-----------------
39,208-----------------
33,01840,43140,793
-----------------38,22239,22942,411
-----------------41,226
$30,114
-----------------30,03033,302
-----------------33,151
-----------------32,17829,493
-----------------30,59333,16529,905
-----------------28,30929,304
-----------------
32,75432,65426,596
-----------------29,66129,754
-----------------26,51830,56630,468
-----------------28,59729,97834,39939,006
-----------------34,336
25th %ile
Median (50%)
Avg by Org
75th %ile
Annual Base Salaries10th %ile
90th %ile
$31,070
-----------------28,98037,601
-----------------36,96826,825
-----------------33,00329,407
-----------------29,62331,42634,185
-----------------28,59531,479
-----------------27,99931,83832,81228,161
-----------------29,66129,899
-----------------28,09127,43831,518
-----------------29,58330,85333,55137,497
-----------------31,744
Avg by Employee

Assists the teacher in implementing educational plans and curricula in a classroom with special emphasis on maintenance of discipline and tutoring one-on-one with students. Reviews lesson plans with teacher to contribute information and ideas as appropriate. Supervises and works with students in small group learning situations. Implements behavior management techniques. Corrects/grades completed work.
265Education & Recreation
© 2014 Third Sector New England & Nonprofit Compensation Associates
Teaching Assistant, K-12
Page 80
Number of Orgs Emps
All Organizations:
By Budget Size: $10,000,000 - $24,999,999By Geographic Location: Greater Boston RegionBy Field of Service: Srvcs & Adv: Children and youthBy Number of Employees: 251+By Years of Experience Required: 1 Year 2 - 3 YearsBy Level of Education Required: High School Diploma Bachelor's DegreeBy Gender of Employee: Male FemaleBy Race/Ethnicity of Employee: Asian Black Hispanic or Latino WhiteBy Number of Years in Position: Up to 5 Years 5 - 10 Years 11 - 20 Years
16
-----------------6
-----------------5
-----------------5
-----------------8
-----------------65
-----------------68
-----------------1414
-----------------588
12-----------------
1475
203
-----------------97
-----------------44
-----------------48
-----------------129
-----------------3534
-----------------7360
-----------------59
115-----------------
92319
115-----------------
1161712
$20,800
-------------------28,434
-------------------21,840
-------------------
-------------------21,840
-------------------24,711
-------------------
23,207-------------------
20,80020,800
-------------------
21,80717,68020,800
-------------------20,80021,957
$24,960
-----------------28,891
-----------------28,247
-----------------
-----------------24,960
-----------------28,621
-----------------
28,621-----------------
24,96023,338
-----------------
25,83421,84023,546
-----------------22,88026,916
$28,891
-----------------30,618
-----------------28,621
-----------------
-----------------28,621
-----------------28,621
-----------------
30,420-----------------
28,62128,621
-----------------22,88028,74628,60028,621
-----------------28,62132,032
$31,824
-----------------32,739
-----------------33,093
-----------------
-----------------31,200
-----------------31,970
-----------------
34,221-----------------
33,07231,200
-----------------
33,01034,88231,200
-----------------31,20034,851
$35,119
-----------------34,882
-----------------37,003
-----------------
-----------------34,882
-----------------37,003
-----------------
38,815-----------------
37,52334,807
-----------------
36,95337,00335,730
-----------------34,48937,457
$28,809
-----------------31,087
-----------------29,279
-----------------
-----------------28,660
-----------------30,058
-----------------
30,954-----------------
29,10828,134
-----------------25,17529,37127,88028,661
-----------------27,67330,801
25th %ile
Median (50%)
Avg by Org
75th %ile
Annual Base Salaries10th %ile
90th %ile
$29,496
-----------------31,889
-----------------28,436
-----------------31,742
-----------------30,977
-----------------30,97228,298
-----------------27,03132,204
-----------------30,52428,402
-----------------26,55828,46428,28931,520
-----------------29,59230,04733,921
Avg by Employee

268Education & Recreation
Teaching Assistant, Pre-SchoolUnder the supervision of a teacher, participates in the direct supervision of children to ensure their health and safety. Provides nurture, care, and guidance to each child. Interacts with the children in the implementation of learning programs and activities. Assists children with physical needs. Supervises children in play areas.
Valuing our Nonprofit Workforce 2014 Page 81
Number of Orgs Emps
All Organizations:
By Budget Size: $2,500,000 - $9,999,999 $10,000,000 - $24,999,999By Geographic Location: Southeastern Massachusetts/Rhode Island RegionBy Field of Service: Srvcs & Adv: Children and youth Cmnty/econ dev, social justice, legal, civil rightsBy Number of Employees: 101 - 250 251+By Years of Experience Required: 1 YearBy Level of Education Required: High School Diploma Credential/Certification/LicenseBy Gender of Employee: FemaleBy Race/Ethnicity of Employee: Black Hispanic or Latino WhiteBy Number of Years in Position: Up to 5 Years 5 - 10 Years 11 - 20 Years More than 20 Years
19
-----------------85
-----------------6
-----------------95
-----------------67
-----------------7
-----------------13
7-----------------
18-----------------
81615
-----------------19
887
274
-----------------73
120-----------------
80-----------------
17126
-----------------73
175-----------------
56-----------------
19149
-----------------231
-----------------2275
164-----------------
1802637
8
$17,680
-------------------17,160
-------------------
-------------------18,72418,874
-------------------17,16017,680
-------------------18,741
-------------------17,430
-------------------17,680
-------------------17,160
17,680-------------------
17,43019,242
$18,975
-----------------20,707
-----------------
-----------------22,04822,880
-----------------20,70718,741
-----------------21,216
-----------------18,200
-----------------18,720
-----------------17,550
18,725-----------------
18,03422,407
$23,951
-----------------24,606
-----------------
-----------------25,64624,440
-----------------25,66723,358
-----------------22,048
-----------------22,048
-----------------23,192
-----------------24,596
22,880-----------------
22,20426,187
27,768
$26,790
-----------------26,790
-----------------
-----------------27,00027,768
-----------------27,39426,312
-----------------23,935
-----------------25,646
-----------------26,187
-----------------27,010
26,281-----------------
25,66726,187
$27,768
-----------------27,893
-----------------
-----------------27,76836,774
-----------------29,94427,768
-----------------26,094
-----------------27,227
-----------------27,768
-----------------27,931
27,893-----------------
27,00030,550
$23,466
-----------------23,687
-----------------
-----------------24,65925,951
-----------------24,64023,145
-----------------22,694
-----------------22,234
-----------------22,904
-----------------22,656
23,001-----------------
22,34324,925
26,991
25th %ile
Median (50%)
Avg by Org
75th %ile
Annual Base Salaries10th %ile
90th %ile
$22,962
-----------------22,42525,535
-----------------21,083
-----------------23,07623,426
-----------------23,25223,655
-----------------24,114
-----------------21,35324,450
-----------------22,771
-----------------23,36723,00323,442
-----------------22,41424,67025,00726,880
Avg by Employee

Provides a safe, nurturing, welcoming environment for young children. Provides overall guidance and care to the children. Attends to the physical needs of children. Serves snacks and drinks to children. Coordinates, supervises and/or plays indoor and outdoor games with children. Reads to children. Maintains communications with parents and/or guardians.
271Education & Recreation
© 2014 Third Sector New England & Nonprofit Compensation Associates
Child Care Assistant
Page 82
Number of Orgs Emps
All Organizations:
By Race/Ethnicity of Employee: WhiteBy Number of Years in Position: 5 - 10 Years
5
-----------------5
-----------------5
108
-----------------94
-----------------22
-------------------16,640
-------------------17,204
-----------------17,639
-----------------17,883
-----------------18,720
-----------------19,396
-----------------20,800
-----------------20,800
-----------------23,452
-----------------24,349
-----------------19,569
-----------------19,943
25th %ile
Median (50%)
Avg by Org
75th %ile
Annual Base Salaries10th %ile
90th %ile
$19,988
-----------------20,140
-----------------20,809
Avg by Employee
Ensures a safe, secure pool environment for clients using the organization's swimming pool or other water facilities. Provides continuous observation of clients in the pool to ensure their safety. Provides active supervision and feedback to swimmers when they act in a manner unsafe to self or others. Rescues individuals experiencing difficulty; administers CPR and other first aid treatment as necessary. Teaches water safety and swimming to individuals and groups. Maintains active lifeguard and CPR certification.
274
Number of Orgs Emps
Life Guard/Swim Instructor
All Organizations:
By Gender of Employee: FemaleBy Race/Ethnicity of Employee: WhiteBy Number of Years in Position: Up to 5 Years
7
-----------------7
-----------------6
-----------------7
252
-----------------132
-----------------216
-----------------217
-------------------
-------------------
-------------------
-----------------
-----------------
-----------------
-----------------
-----------------
-----------------
-----------------
-----------------
-----------------
-----------------
-----------------
-----------------
-----------------
-----------------
-----------------
25th %ile
Median (50%)
Avg by Org
75th %ile
Annual Base Salaries10th %ile
90th %ile
$23,336
-----------------23,867
-----------------23,397
-----------------21,961
Avg by Employee

277Education & Recreation
Recreation or Activity Leader, Children or YouthDevelops program content, organizes and leads recreation activities to enhance the social development of clients (children or youth). Activities may include individual or group sports, arts and crafts, music, dance, drama. Teaches and participates in activities, assesses/reports progress toward goals.
Valuing our Nonprofit Workforce 2014 Page 83
Number of Orgs Emps
All Organizations:
By Budget Size: $1,000,000 - $2,499,999 $2,500,000 - $9,999,999By Geographic Location: Greater Boston RegionBy Field of Service: Srvcs & Adv: Children and youthBy Number of Employees: 11 - 25 51 -100 101 - 250By Years of Experience Required: 1 Year 2 - 3 YearsBy Level of Education Required: High School Diploma Bachelor's DegreeBy Gender of Employee: Male FemaleBy Race/Ethnicity of Employee: Black Hispanic or Latino WhiteBy Number of Years in Position: Up to 5 Years 5 - 10 YearsBy Number of Employees Managed: 1 to 3
20
-----------------57
-----------------7
-----------------10
-----------------555
-----------------97
-----------------10
8-----------------
1318
-----------------88
16-----------------
188
-----------------5
336
-----------------3143
-----------------33
-----------------65
-----------------281943
-----------------177
28-----------------
14079
-----------------85
229-----------------
4222
241-----------------
25748
-----------------60
-------------------17,68019,169
-------------------22,048
-------------------18,695
-------------------17,68020,80023,612
-------------------
27,969-------------------
-------------------
-------------------
17,443
-------------------
-------------------
-----------------20,80020,800
-----------------23,712
-----------------20,800
-----------------20,80021,84024,960
-----------------
31,200-----------------
-----------------
-----------------
17,680
-----------------
-----------------
-----------------24,96024,086
-----------------27,040
-----------------23,858
-----------------21,21624,96027,040
-----------------
36,348-----------------
-----------------
-----------------
19,188
-----------------
-----------------
-----------------38,21029,058
-----------------31,200
-----------------27,560
-----------------27,04029,99431,200
-----------------
43,904-----------------
-----------------
-----------------
22,074
-----------------
-----------------
-----------------49,27939,507
-----------------40,364
-----------------38,684
-----------------31,20040,83044,645
-----------------
54,072-----------------
-----------------
-----------------
28,897
-----------------
-----------------
-----------------28,65026,386
-----------------29,371
-----------------26,457
-----------------23,82027,10729,744
-----------------
38,743-----------------
-----------------
-----------------
21,131
-----------------
-----------------
25th %ile
Median (50%)
Avg by Org
75th %ile
Annual Base Salaries10th %ile
90th %ile
$29,722
-----------------32,31428,154
-----------------32,490
-----------------28,149
-----------------28,37529,73931,376
-----------------25,42737,942
-----------------23,58135,525
-----------------29,72630,858
-----------------25,57723,53030,249
-----------------28,86131,499
-----------------33,427
Avg by Employee

Develops program content, organizes and leads recreation activities to enhance the social development of adult clients. Activities may include individual or group sports, arts and crafts, music, dance, drama. Teaches and participates in activities, assesses/reports progress toward goals.
278Education & Recreation
© 2014 Third Sector New England & Nonprofit Compensation Associates
Recreation or Activity Leader, Adults
Page 84
Number of Orgs Emps
All Organizations:
By Budget Size: $2,500,000 - $9,999,999By Geographic Location: Greater Boston RegionBy Field of Service: Srvcs & Adv: Children and youthBy Number of Employees: 251+By Level of Education Required: High School DiplomaBy Gender of Employee: Male FemaleBy Race/Ethnicity of Employee: WhiteBy Number of Years in Position: Up to 5 Years
13
-----------------6
-----------------5
-----------------5
-----------------6
-----------------6
-----------------5
10-----------------
12-----------------
9
23
-----------------8
-----------------7
-----------------7
-----------------14
-----------------9
-----------------8
12-----------------
21-----------------
18
$27,751
-------------------
-------------------
-------------------
-------------------27,040
-------------------
-------------------
27,710-------------------
27,656-------------------
27,456
$29,120
-----------------
-----------------
-----------------
-----------------28,179
-----------------
-----------------
28,450-----------------
28,673-----------------
28,184
$35,758
-----------------41,600
-----------------41,600
-----------------41,600
-----------------33,686
-----------------29,120
-----------------32,53134,883
-----------------37,606
-----------------33,686
$44,304
-----------------
-----------------
-----------------
-----------------41,683
-----------------
-----------------
43,373-----------------
44,647-----------------
41,600
$51,667
-----------------
-----------------
-----------------
-----------------50,546
-----------------
-----------------
52,158-----------------
51,834-----------------
45,691
$37,404
-----------------38,493
-----------------40,204
-----------------42,608
-----------------35,739
-----------------33,934
-----------------37,00436,622
-----------------37,926
-----------------35,113
25th %ile
Median (50%)
Avg by Org
75th %ile
Annual Base Salaries10th %ile
90th %ile
$39,056
-----------------37,457
-----------------39,646
-----------------43,011
-----------------38,497
-----------------36,765
-----------------39,18236,467
-----------------39,829
-----------------34,344
Avg by Employee
Develops physical fitness program content to meet needs of adults to improve general or specific health and fitness. Conducts classes/instructs individuals and groups in such programs. Provides continuous observation of clients to ensure their health and safety. Participates in keeping records. Promotes participation of current and prospective clients in fitness programs. May determine specific goals for participants and assess/report progress towards goals.
280
Number of Orgs Emps
Fitness Instructor
All Organizations:
By Gender of Employee: FemaleBy Race/Ethnicity of Employee: WhiteBy Number of Years in Position: 5 - 10 Years
7
-----------------6
-----------------7
-----------------5
403
-----------------295
-----------------356
-----------------62
-------------------
-------------------
-------------------19,879
-----------------
-----------------
-----------------23,509
-----------------
-----------------
-----------------35,006
-----------------
-----------------
-----------------48,547
-----------------
-----------------
-----------------51,701
-----------------
-----------------
-----------------35,984
25th %ile
Median (50%)
Avg by Org
75th %ile
Annual Base Salaries10th %ile
90th %ile
$36,341
-----------------38,406
-----------------36,301
-----------------33,882
Avg by Employee

305Employment/Work Training
Job DeveloperResearches, locates and develops job openings for the purpose of placing clients by making personal visits to companies and/or organizations, by placing telephone calls, and through other research and outreach efforts. Develops and maintains effective working relationships with representatives of employment and governmental agencies, companies, organizations and other potential sources that may offer employment opportunities.
Valuing our Nonprofit Workforce 2014 Page 85
Number of Orgs Emps
All Organizations:
By Budget Size: $2,500,000 - $9,999,999 $10,000,000 - $24,999,999By Geographic Location: Western Massachusetts RegionBy Field of Service: Srvcs & Adv: Elderly, developmentally disabledBy Number of Employees: 101 - 250 251+By Years of Experience Required: 2 - 3 YearsBy Level of Education Required: High School Diploma Bachelor's DegreeBy Gender of Employee: Male FemaleBy Race/Ethnicity of Employee: WhiteBy Number of Years in Position: Up to 5 Years 5 - 10 YearsBy Number of Employees Managed: 1 to 3
18
-----------------77
-----------------6
-----------------13
-----------------76
-----------------9
-----------------66
-----------------9
11-----------------
15-----------------
115
-----------------5
46
-----------------1917
-----------------26
-----------------31
-----------------1622
-----------------25
-----------------31
7-----------------
1529
-----------------36
-----------------28
5-----------------
5
$29,132
-------------------27,040
-------------------28,220
-------------------27,745
-------------------
33,126-------------------
28,051-------------------
28,841
-------------------29,90627,500
-------------------28,358
-------------------27,454
-------------------
$32,521
-----------------29,307
-----------------31,590
-----------------29,869
-----------------
34,502-----------------
31,335-----------------
32,115
-----------------33,53030,701
-----------------32,250
-----------------30,539
-----------------
$34,871
-----------------33,488
-----------------34,352
-----------------34,549
-----------------
36,015-----------------
35,776-----------------
34,36242,078
-----------------37,44034,549
-----------------34,851
-----------------34,35241,288
-----------------41,600
$41,366
-----------------41,600
-----------------36,296
-----------------41,600
-----------------
40,321-----------------
41,600-----------------
36,254
-----------------41,60037,305
-----------------39,790
-----------------36,130
-----------------
$45,887
-----------------45,094
-----------------44,847
-----------------45,023
-----------------
41,935-----------------
45,939-----------------
41,600
-----------------54,51247,736
-----------------45,968
-----------------42,671
-----------------
$37,011
-----------------34,555
-----------------34,676
-----------------36,135
-----------------
37,081-----------------
36,531-----------------
34,55445,008
-----------------39,15835,764
-----------------36,867
-----------------35,14139,928
-----------------44,129
25th %ile
Median (50%)
Avg by Org
75th %ile
Annual Base Salaries10th %ile
90th %ile
$39,241
-----------------36,25639,256
-----------------37,057
-----------------36,806
-----------------36,08937,060
-----------------37,038
-----------------33,19745,562
-----------------39,82237,532
-----------------39,184
-----------------38,00339,928
-----------------44,129
Avg by Employee

Provides individual and group vocational guidance services. Assesses client interests, aptitudes, abilities, and personality characteristics for vocational planning purposes. Assists clients in understanding and overcoming social and emotional issues through counseling. Ensures accurate, complete files are established and maintained. Prepares associated reports. Develops and implements client habilitation plans.
310Employment/Work Training
© 2014 Third Sector New England & Nonprofit Compensation Associates
Vocational Counselor
Page 86
Number of Orgs Emps
All Organizations:
By Budget Size: $10,000,000 - $24,999,999By Geographic Location: Greater Boston RegionBy Field of Service: Srvcs & Adv: Children and youth Srvcs & Adv: Elderly, developmentally disabledBy Number of Employees: 101 - 250 251+By Years of Experience Required: 1 Year 2 - 3 YearsBy Level of Education Required: High School Diploma Bachelor's DegreeBy Gender of Employee: Male FemaleBy Race/Ethnicity of Employee: Black Hispanic or Latino WhiteBy Number of Years in Position: Up to 5 Years 5 - 10 Years 11 - 20 YearsBy Number of Employees Managed: 1 to 3
18
-----------------10
-----------------7
-----------------57
-----------------6
10-----------------
66
-----------------7
10-----------------
1217
-----------------96
15-----------------
1696
-----------------6
159
-----------------59
-----------------33
-----------------1475
-----------------5697
-----------------4579
-----------------8748
-----------------42
117-----------------
2620
102-----------------
992911
-----------------7
$25,189
-------------------28,621
-------------------25,189
-------------------30,160
-------------------
27,028-------------------
23,87424,856
-------------------23,58725,189
-------------------23,73125,189
-------------------23,92223,58725,189
-------------------23,58725,272
-------------------
$27,040
-----------------30,160
-----------------31,620
-----------------30,160
-----------------
30,160-----------------
25,51127,040
-----------------25,97931,034
-----------------25,67728,028
-----------------26,17726,60327,352
-----------------26,56226,697
-----------------
$31,034
-----------------31,034
-----------------35,776
-----------------34,507
-----------------
31,200-----------------
30,16031,034
-----------------29,45334,549
-----------------30,16031,200
-----------------30,87830,16030,909
-----------------30,57631,38730,722
-----------------44,554
$34,549
-----------------32,469
-----------------44,419
-----------------41,501
-----------------
34,320-----------------
33,86332,074
-----------------31,49144,486
-----------------33,82135,058
-----------------35,11532,31334,227
-----------------34,54934,549
-----------------
$43,597
-----------------41,371
-----------------51,466
-----------------55,118
-----------------
36,275-----------------
37,49035,131
-----------------34,50750,320
-----------------42,98143,734
-----------------43,68038,76137,840
-----------------43,00044,554
-----------------
$32,513
-----------------32,825
-----------------38,142
-----------------37,244
-----------------
31,905-----------------
30,72530,845
-----------------29,22937,207
-----------------31,46132,890
-----------------31,79030,52931,826
-----------------32,11532,23632,913
-----------------45,891
25th %ile
Median (50%)
Avg by Org
75th %ile
Annual Base Salaries10th %ile
90th %ile
$38,289
-----------------38,026
-----------------41,505
-----------------40,46636,349
-----------------44,06132,126
-----------------30,60833,177
-----------------30,26341,067
-----------------36,20536,713
-----------------34,45833,77236,062
-----------------37,80337,17534,753
-----------------44,701
Avg by Employee

315Employment/Work Training
Job CoachWorks with employers to determine skills and behavioral requirements for a job that will be filled by a client. Coaches the employee/client prior to reporting for the job on expectations including transportation to job, behavior at work, required job skills and work production. Coaches employee/client on-the-job in meeting production and behavioral expectations of employer. Sets goals for employee/client and works with him/her to achieve those goals. Periodically assesses employee/client achievement. Maintains associated records. Maintains effective working relationship with employer to promote placement of other clients. Note: Employer may be a sheltered workshop or other company in the community.
Valuing our Nonprofit Workforce 2014 Page 87
Number of Orgs Emps
All Organizations:
By Budget Size: $2,500,000 - $9,999,999 $10,000,000 - $24,999,999 $25,000,000 and overBy Geographic Location: Western Massachusetts Region Central Massachusetts Region Northeastern Massachusetts RegionBy Field of Service: Srvcs & Adv: Elderly, developmentally disabledBy Number of Employees: 26 - 50 101 - 250 251+By Years of Experience Required: 1 Year 2 - 3 YearsBy Level of Education Required: High School Diploma Bachelor's DegreeBy Gender of Employee: Male FemaleBy Race/Ethnicity of Employee: Black Hispanic or Latino WhiteBy Number of Years in Position: Up to 5 Years 5 - 10 Years 11 - 20 Years
23
-----------------10
66
-----------------855
-----------------16
-----------------669
-----------------98
-----------------14
6-----------------
2020
-----------------121320
-----------------221212
268
-----------------125
9249
-----------------139
4338
-----------------207
-----------------3475
125-----------------
11059
-----------------226
16-----------------
110157
-----------------6139
158-----------------
1714535
$22,880
-------------------20,77923,17523,421
-------------------23,046
23,899-------------------
22,040-------------------
20,71723,400
-------------------23,40023,421
-------------------23,04624,419
-------------------22,89722,040
-------------------23,11723,08821,840
-------------------22,88021,55324,157
$23,634
-----------------23,04623,95624,814
-----------------24,440
24,627-----------------
23,343-----------------
23,04624,627
-----------------24,62724,960
-----------------23,89925,470
-----------------23,89923,411
-----------------24,62723,92023,379
-----------------23,37923,68125,418
$25,522
-----------------26,00025,95925,522
-----------------27,040
24,783-----------------
24,960-----------------
24,06625,522
-----------------26,52026,520
-----------------25,88630,826
-----------------26,10425,522
-----------------26,52025,52225,522
-----------------25,48025,27228,538
$29,066
-----------------31,23128,03828,600
-----------------29,203
29,182-----------------
28,704-----------------
28,70428,038
-----------------28,60029,120
-----------------28,60033,472
-----------------29,13628,600
-----------------28,03829,18229,198
-----------------28,60027,68531,470
$32,544
-----------------35,36029,34729,619
-----------------32,531
35,360-----------------
32,693-----------------
31,92829,182
-----------------31,47032,240
-----------------31,47051,501
-----------------31,92832,593
-----------------32,51033,28032,300
-----------------32,17830,44335,818
$26,875
-----------------27,32026,54526,508
-----------------27,382
27,246-----------------
26,390-----------------
26,00226,339
-----------------27,00627,443
-----------------26,72432,178
-----------------27,20426,602
-----------------26,76127,00426,931
-----------------26,61725,84228,779
25th %ile
Median (50%)
Avg by Org
75th %ile
Annual Base Salaries10th %ile
90th %ile
$29,999
-----------------31,54631,41227,151
-----------------28,49532,41427,032
-----------------28,851
-----------------33,57531,42926,544
-----------------26,78832,483
-----------------26,40437,673
-----------------28,66928,524
-----------------27,42427,13829,463
-----------------29,54425,68327,772
Avg by Employee

Supervises food preparation facilities to ensure the safe handling, preparation and serving of nutritionally balanced meals for clients, staff and others. Ensures that all kitchen and preparation activities and equipment comply with licensing, sanitation and safety regulations in order to ensure the quality of food. Participates in preparing menus. Selects and orders food and supplies. Recommends purchase of new equipment as needed. Supervises kitchen staff in the safe handling, preparation and serving of food.
355Food, Food Service and Food Bank
© 2014 Third Sector New England & Nonprofit Compensation Associates
Food Service Manager/Supervisor
Page 88
Number of Orgs Emps
All Organizations:
By Budget Size: $2,500,000 - $9,999,999 $10,000,000 - $24,999,999 $25,000,000 and overBy Geographic Location: Greater Boston Region Northeastern Massachusetts RegionBy Field of Service: Srvcs & Adv: Children and youth Srvcs & Adv: Elderly, developmentally disabledBy Number of Employees: 101 - 250 251+By Years of Experience Required: 2 - 3 YearsBy Level of Education Required: High School Diploma Associate's Degree Bachelor's DegreeBy Gender of Employee: Male FemaleBy Race/Ethnicity of Employee: WhiteBy Number of Years in Position: Up to 5 Years 11 - 20 YearsBy Number of Employees Managed: 1 to 3 4 to 8
21
-----------------765
-----------------75
-----------------77
-----------------69
-----------------6
-----------------755
-----------------10
9-----------------
16-----------------
78
-----------------86
23
-----------------965
-----------------75
-----------------77
-----------------69
-----------------6
-----------------757
-----------------1011
-----------------18
-----------------98
-----------------96
$34,041
-------------------
-------------------
-------------------
-------------------
-------------------
-------------------
-------------------
-------------------34,062
-------------------
-------------------
$37,835
-----------------
-----------------
-----------------
-----------------
-----------------
-----------------
-----------------
-----------------37,508
-----------------
-----------------
$44,158
-----------------40,29053,85152,250
-----------------52,25043,867
-----------------40,29055,000
-----------------42,76552,250
-----------------40,872
-----------------41,37143,86744,158
-----------------49,43144,158
-----------------44,013
-----------------36,52557,034
-----------------41,37142,224
$55,000
-----------------
-----------------
-----------------
-----------------
-----------------
-----------------
-----------------
-----------------55,233
-----------------
-----------------
$66,106
-----------------
-----------------
-----------------
-----------------
-----------------
-----------------
-----------------
-----------------71,552
-----------------
-----------------
$47,269
-----------------44,68152,98851,090
-----------------49,91545,153
-----------------43,32955,709
-----------------51,60151,016
-----------------42,969
-----------------45,31450,30745,573
-----------------50,74443,754
-----------------47,022
-----------------41,49255,864
-----------------43,09547,240
25th %ile
Median (50%)
Avg by Org
75th %ile
Annual Base Salaries10th %ile
90th %ile
$48,035
-----------------46,24052,98851,090
-----------------49,91545,153
-----------------43,32955,709
-----------------51,60151,016
-----------------42,969
-----------------45,31450,30748,113
-----------------50,74444,761
-----------------47,997
-----------------42,14055,864
-----------------43,41147,240
Avg by Employee

360Food, Food Service and Food Bank
Nutritionist/DieticianAssesses nutritional needs of clients and determines an appropriate diet; instructs clients in applying proper nutrition for optimal health and/or to resolve medical problems. May supervise and/or develop menus for clients for use by kitchen staff. Requires registration and membership in the American Dietetic Association.
Valuing our Nonprofit Workforce 2014 Page 89
Number of Orgs Emps
All Organizations:
By Budget Size: $10,000,000 - $24,999,999 $25,000,000 and overBy Field of Service: Srvcs & Adv: Elderly, developmentally disabledBy Number of Employees: 101 - 250 251+By Years of Experience Required: 2 - 3 YearsBy Level of Education Required: Bachelor's DegreeBy Gender of Employee: FemaleBy Race/Ethnicity of Employee: WhiteBy Number of Years in Position: Up to 5 Years 5 - 10 YearsBy Number of Employees Managed: 1 to 3
17
-----------------87
-----------------8
-----------------78
-----------------7
-----------------13
-----------------16
-----------------16
-----------------12
6-----------------
5
34
-----------------22
9-----------------
8-----------------
1615
-----------------11
-----------------21
-----------------31
-----------------32
-----------------19
8-----------------
6
$36,057
-------------------34,903
-------------------
-------------------35,62435,152
-------------------
-------------------35,210
-------------------35,714
-------------------35,828
-------------------35,485
-------------------
$40,383
-----------------38,938
-----------------
-----------------39,94640,643
-----------------
-----------------41,319
-----------------40,643
-----------------39,863
-----------------38,938
-----------------
$48,007
-----------------42,96267,974
-----------------64,127
-----------------45,76053,560
-----------------45,760
-----------------48,880
-----------------48,173
-----------------46,800
-----------------47,84047,830
-----------------45,947
$66,508
-----------------51,865
-----------------
-----------------56,42072,800
-----------------
-----------------66,997
-----------------66,019
-----------------65,634
-----------------64,480
-----------------
$81,120
-----------------80,891
-----------------
-----------------80,93383,699
-----------------
-----------------78,333
-----------------78,333
-----------------77,979
-----------------83,200
-----------------
$53,202
-----------------48,75267,122
-----------------64,329
-----------------50,56657,839
-----------------49,945
-----------------53,179
-----------------53,071
-----------------52,253
-----------------52,78654,265
-----------------57,651
25th %ile
Median (50%)
Avg by Org
75th %ile
Annual Base Salaries10th %ile
90th %ile
$59,510
-----------------55,53968,437
-----------------64,329
-----------------54,16168,030
-----------------56,353
-----------------57,261
-----------------58,008
-----------------58,309
-----------------54,88654,302
-----------------60,588
Avg by Employee
Directs the preparation, and cooking of foods prepared within a food service establishment. Plans and prices menu items, order supplies, and maintain records and accounts. Supervises and participates in cooking, baking and the preparation of foods. Writes weekly work schedules according to business and projected goals for labor dollars or percentages. Prices labor and food costs. Reviews all purchased supplies for quality, accounting for each delivered item. Maintains inventory. Hires and manages all kitchen staff.
363Chef
Number of Orgs Emps
All Organizations: 6 6 $42,619 $46,498
25th %ile
Median (50%)
Avg by Org
75th %ile
Annual Base Salaries10th %ile
90th %ile
$46,498
Avg by Employee

Prepares, cooks and serves nutritionally balanced meals for clients and employees of an organization, ensuring health and safety standards are met at all times. Plans menus. Maintains inventory of stock and orders more as necessary. Maintains food preparation and storage equipment and ensure that it meets all health and safety standards. Prepares food (e.g., chops, peels, bakes), cooks using deep fryers, grills, ovens and stove tops; hand mixes small items; bakes breads and pastry; cuts meat; cooks foodstuffs in quantities according to menu and number of persons to be served. May wash dishes and clean food preparation areas and equipment.
365Food, Food Service and Food Bank
© 2014 Third Sector New England & Nonprofit Compensation Associates
Cook
Page 90
Number of Orgs Emps
All Organizations:
By Budget Size: $2,500,000 - $9,999,999 $10,000,000 - $24,999,999 $25,000,000 and overBy Geographic Location: Western Massachusetts Region Greater Boston RegionBy Field of Service: Srvcs & Adv: Children and youth Srvcs & Adv: Elderly, developmentally disabled Counseling, crisis interv, mental hlth, medicalBy Number of Employees: 51 -100 101 - 250 251+By Years of Experience Required: 1 Year 2 - 3 YearsBy Level of Education Required: High School DiplomaBy Gender of Employee: Male FemaleBy Race/Ethnicity of Employee: Black Hispanic or Latino WhiteBy Number of Years in Position: Up to 5 Years 5 - 10 Years 11 - 20 Years
31
-----------------10
99
-----------------98
-----------------876
-----------------56
14-----------------
88
-----------------19
-----------------1625
-----------------10
822
-----------------24
910
85
-----------------192931
-----------------3319
-----------------261722
-----------------8
1154
-----------------1617
-----------------54
-----------------3049
-----------------171248
-----------------491116
$23,342
-------------------21,63225,75023,192
-------------------21,71524,856
-------------------23,41927,56024,440
-------------------
24,440-------------------
21,35323,246
-------------------22,360
-------------------23,72922,880
-------------------21,50721,05024,534
-------------------22,880
24,328
$25,595
-----------------23,79527,15524,544
-----------------24,44026,562
-----------------26,75030,25424,544
-----------------
25,688-----------------
22,88027,675
-----------------24,544
-----------------24,54425,751
-----------------24,04522,10027,010
-----------------24,544
27,685
$28,080
-----------------29,37028,08028,018
-----------------27,66428,500
-----------------27,87234,32026,364
-----------------29,73429,37027,706
-----------------27,58130,118
-----------------28,205
-----------------29,04728,080
-----------------26,56226,83228,696
-----------------27,26929,95229,734
$31,991
-----------------31,15832,54231,595
-----------------28,49631,545
-----------------29,66635,73529,172
-----------------
31,558-----------------
30,71132,615
-----------------33,150
-----------------32,78131,242
-----------------30,85729,52634,320
-----------------31,034
36,494
$36,284
-----------------32,84339,81135,194
-----------------32,07035,360
-----------------32,58542,06632,469
-----------------
34,944-----------------
39,24340,048
-----------------39,260
-----------------37,04536,546
-----------------31,82836,76439,549
-----------------32,760
43,099
$29,182
-----------------28,13630,37928,549
-----------------27,23629,300
-----------------28,18833,80127,326
-----------------28,30131,66928,702
-----------------27,83730,471
-----------------29,626
-----------------29,86228,790
-----------------26,92026,92330,702
-----------------27,80430,57732,097
25th %ile
Median (50%)
Avg by Org
75th %ile
Annual Base Salaries10th %ile
90th %ile
$29,400
-----------------27,55332,36828,751
-----------------27,02629,393
-----------------28,31933,75327,755
-----------------27,87732,85729,045
-----------------28,72431,606
-----------------30,052
-----------------30,08329,258
-----------------26,52326,92230,555
-----------------28,31331,09931,096
Avg by Employee

370Food, Food Service and Food Bank
Food Service Assistant/WorkerAssists cooks in preparation and serving of foods, including washing and chopping vegetables. Receives and stores supplies and food. Performs a wide variety of cleaning duties including mopping floors, bussing and cleaning tables and kitchen equipment; loads/unloads dishwashers; washes large items by hand. May assist in serving food to clients, employees and others.
Valuing our Nonprofit Workforce 2014 Page 91
Number of Orgs Emps
All Organizations:
By Budget Size: $2,500,000 - $9,999,999 $10,000,000 - $24,999,999 $25,000,000 and overBy Geographic Location: Western Massachusetts Region Greater Boston RegionBy Field of Service: Srvcs & Adv: Children and youth Srvcs & Adv: Elderly, developmentally disabledBy Number of Employees: 101 - 250 251+By Years of Experience Required: 1 YearBy Level of Education Required: High School DiplomaBy Gender of Employee: Male FemaleBy Race/Ethnicity of Employee: Black Hispanic or Latino WhiteBy Number of Years in Position: Up to 5 Years 5 - 10 Years 11 - 20 Years
25
-----------------10
85
-----------------78
-----------------6
11-----------------
117
-----------------6
-----------------15
-----------------1418
-----------------97
13-----------------
2110
8
177
-----------------368054
-----------------2555
-----------------12
139-----------------
9952
-----------------11
-----------------61
-----------------6087
-----------------322096
-----------------974324
$18,325
-------------------18,97618,75717,680
-------------------17,472
-------------------17,89618,325
-------------------20,21817,680
-------------------
-------------------18,795
-------------------17,78418,512
-------------------
19,53917,680
-------------------18,19620,46322,308
$19,739
-----------------20,37319,71820,379
-----------------18,606
-----------------19,78119,718
-----------------22,11018,720
-----------------
-----------------20,031
-----------------20,82620,218
-----------------
21,77819,900
-----------------19,57322,52622,880
$22,526
-----------------21,84023,54623,296
-----------------19,760
-----------------20,40523,379
-----------------24,50219,718
-----------------19,760
-----------------22,672
-----------------26,31222,963
-----------------
23,72322,464
-----------------20,38424,56527,487
$27,446
-----------------23,96228,62124,061
-----------------20,852
-----------------21,68928,621
-----------------28,62121,814
-----------------
-----------------24,128
-----------------28,62124,960
-----------------
28,62124,399
-----------------24,04528,62128,621
$28,621
-----------------25,85528,62126,354
-----------------23,612
-----------------30,29328,621
-----------------28,62123,546
-----------------
-----------------27,298
-----------------28,62128,621
-----------------
28,90228,621
-----------------28,62128,62128,871
$23,169
-----------------22,11724,35622,574
-----------------20,168
-----------------21,44623,481
-----------------24,96720,635
-----------------20,690
-----------------22,685
-----------------24,80223,028
-----------------
24,29722,487
-----------------21,92625,13026,187
25th %ile
Median (50%)
Avg by Org
75th %ile
Annual Base Salaries10th %ile
90th %ile
$22,939
-----------------21,77824,44923,285
-----------------19,54425,073
-----------------22,30923,610
-----------------23,19723,340
-----------------21,279
-----------------23,092
-----------------24,11722,210
-----------------24,41825,06422,494
-----------------21,76524,76025,819
Avg by Employee

Directs government affairs and advocacy activities for the agency. Manages staff involved in advocating for government policies and laws supporting the agency's field(s) of interest. This includes research and analysis of proposed and current legislation, budgets, ballot initiatives and state programs. Directs agency's grassroots activities including building and participating in coalitions. Develops and maintains effective working relationships with state, local and/or federal elected officials and advocates on behalf of the agency's interests and goals.
390Government Affairs, Legislative Advocacy & Policy
© 2014 Third Sector New England & Nonprofit Compensation Associates
Director or Manager, Government Affairs
Page 92
Number of Orgs Emps
All Organizations:
By Gender of Employee: MaleBy Race/Ethnicity of Employee: White
7
-----------------5
-----------------7
7
-----------------5
-----------------7
-------------------
-------------------
-----------------
-----------------
$106,766
-----------------106,766
-----------------106,766
-----------------
-----------------
-----------------
-----------------
$99,944
-----------------97,839
-----------------99,944
25th %ile
Median (50%)
Avg by Org
75th %ile
Annual Base Salaries10th %ile
90th %ile
$99,944
-----------------97,839
-----------------99,944
Avg by Employee
Plans and oversees organization’s advocacy strategy and activities related to local, state and federal policy. Works with constituents and elected officials to draft and pass legislation.
392
Number of Orgs Emps
Director or Manager, Policy
All Organizations:
By Number of Years in Position: Up to 5 Years
6
-----------------5
6
-----------------5
------------------------------------
$75,359
-----------------70,720
----------------------------------
$75,618
-----------------71,527
25th %ile
Median (50%)
Avg by Org
75th %ile
Annual Base Salaries10th %ile
90th %ile
$75,618
-----------------71,527
Avg by Employee
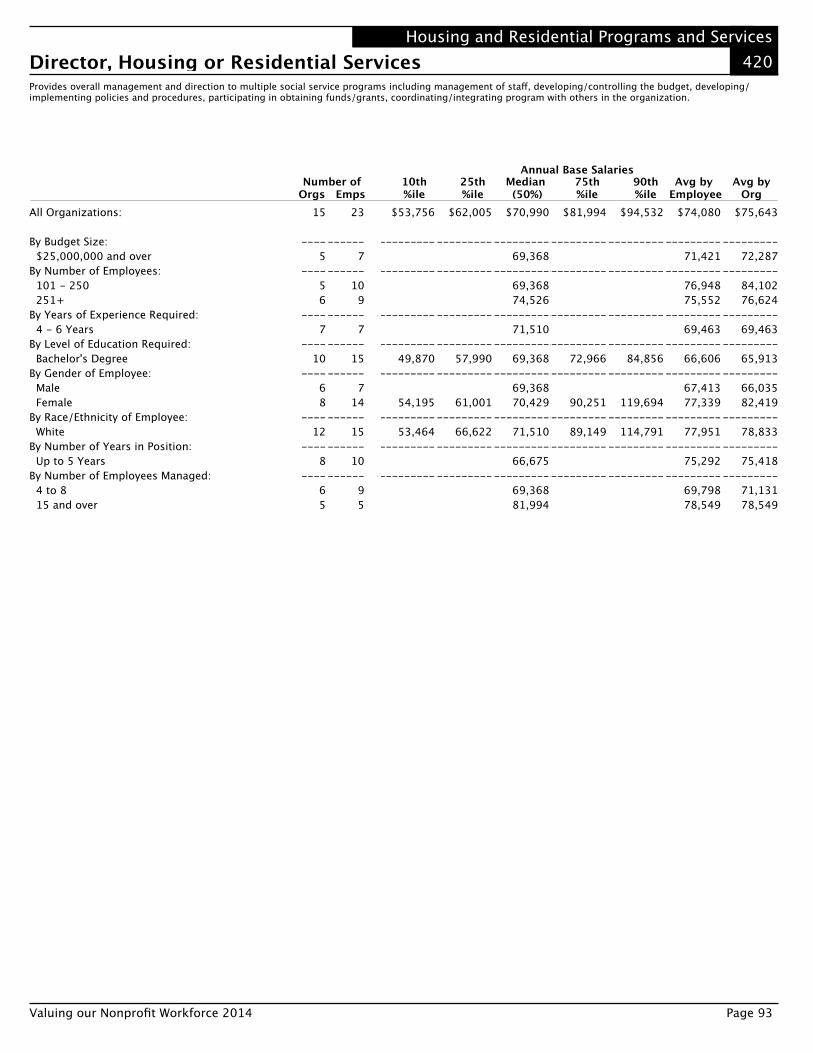
420Housing and Residential Programs and Services
Director, Housing or Residential ServicesProvides overall management and direction to multiple social service programs including management of staff, developing/controlling the budget, developing/implementing policies and procedures, participating in obtaining funds/grants, coordinating/integrating program with others in the organization.
Valuing our Nonprofit Workforce 2014 Page 93
Number of Orgs Emps
All Organizations:
By Budget Size: $25,000,000 and overBy Number of Employees: 101 - 250 251+By Years of Experience Required: 4 - 6 YearsBy Level of Education Required: Bachelor's DegreeBy Gender of Employee: Male FemaleBy Race/Ethnicity of Employee: WhiteBy Number of Years in Position: Up to 5 YearsBy Number of Employees Managed: 4 to 8 15 and over
15
-----------------5
-----------------56
-----------------7
-----------------10
-----------------68
-----------------12
-----------------8
-----------------65
23
-----------------7
-----------------10
9-----------------
7-----------------
15-----------------
714
-----------------15
-----------------10
-----------------95
$53,756
-------------------
-------------------
-------------------
-------------------49,870
-------------------
54,195-------------------
53,464-------------------
-------------------
$62,005
-----------------
-----------------
-----------------
-----------------57,990
-----------------
61,001-----------------
66,622-----------------
-----------------
$70,990
-----------------69,368
-----------------69,36874,526
-----------------71,510
-----------------69,368
-----------------69,36870,429
-----------------71,510
-----------------66,675
-----------------69,36881,994
$81,994
-----------------
-----------------
-----------------
-----------------72,966
-----------------
90,251-----------------
89,149-----------------
-----------------
$94,532
-----------------
-----------------
-----------------
-----------------84,856
-----------------
119,694-----------------
114,791-----------------
-----------------
$74,080
-----------------71,421
-----------------76,94875,552
-----------------69,463
-----------------66,606
-----------------67,41377,339
-----------------77,951
-----------------75,292
-----------------69,79878,549
25th %ile
Median (50%)
Avg by Org
75th %ile
Annual Base Salaries10th %ile
90th %ile
$75,643
-----------------72,287
-----------------84,10276,624
-----------------69,463
-----------------65,913
-----------------66,03582,419
-----------------78,833
-----------------75,418
-----------------71,13178,549
Avg by Employee

Provides overall management and supervision to one (or two) social service program(s) including supervision of staff, developing/controlling the budget, developing/implementing policies and procedures, participating in obtaining funds/grants, coordinating/integrating program with others in the organization.
421Housing and Residential Programs and Services
© 2014 Third Sector New England & Nonprofit Compensation Associates
Manager, Housing or Residential Services
Page 94
Number of Orgs Emps
All Organizations:
By Budget Size: $2,500,000 - $9,999,999 $10,000,000 - $24,999,999 $25,000,000 and overBy Number of Employees: 101 - 250 251+By Years of Experience Required: 2 - 3 Years 4 - 6 YearsBy Level of Education Required: Bachelor's DegreeBy Gender of Employee: Male FemaleBy Race/Ethnicity of Employee: Hispanic or Latino WhiteBy Number of Years in Position: Up to 5 Years 5 - 10 Years 11 - 20 YearsBy Number of Employees Managed: 1 to 3 4 to 8 9 to 14 15 and over
15
-----------------555
-----------------57
-----------------57
-----------------12
-----------------1013
-----------------5
12-----------------
1186
-----------------5665
88
-----------------8
2456
-----------------2262
-----------------3236
-----------------60
-----------------2266
-----------------1057
-----------------402315
-----------------5
311215
$39,798
-------------------
29,64041,288
-------------------44,99033,523
-------------------30,68042,126
-------------------32,321
-------------------29,95240,061
-------------------
41,043-------------------
30,68040,45241,097
-------------------
41,54639,612
$41,787
-----------------
33,22341,787
-----------------45,96841,787
-----------------40,06146,410
-----------------41,527
-----------------41,31441,787
-----------------
44,512-----------------
41,78741,78745,011
-----------------
45,01142,182
$45,927
-----------------44,99047,73645,011
-----------------47,73643,701
-----------------41,78751,876
-----------------48,007
-----------------42,21446,977
-----------------43,71149,920
-----------------42,12047,73656,430
-----------------42,016
46,05245,843
$52,957
-----------------
52,80155,915
-----------------52,28154,481
-----------------41,78756,477
-----------------54,538
-----------------47,73654,481
-----------------
56,462-----------------
47,38852,64562,691
-----------------
48,79754,101
$59,184
-----------------
60,44561,206
-----------------57,04262,055
-----------------45,01162,735
-----------------60,416
-----------------56,54761,206
-----------------
63,220-----------------
55,71958,98865,720
-----------------
61,56864,509
$47,503
-----------------44,72245,76948,644
-----------------49,47846,850
-----------------40,26651,970
-----------------47,844
-----------------44,22048,598
-----------------44,49150,672
-----------------43,92848,48254,456
-----------------47,886
47,83848,565
25th %ile
Median (50%)
Avg by Org
75th %ile
Annual Base Salaries10th %ile
90th %ile
$47,028
-----------------44,85846,64549,581
-----------------48,20946,860
-----------------39,20949,731
-----------------46,796
-----------------45,89148,028
-----------------45,60748,922
-----------------44,75450,42752,073
-----------------47,88649,97146,41253,427
Avg by Employee

422Housing and Residential Programs and Services
Coordinator, Housing or Residential ServicesProvides a wide range of support and community services for an assigned group of apartment residents. Orients new residents on services and activities available within the community and on-site. Assists residents in obtaining and coordinating needed service in such areas as employment, transportation, education, and in-home health. Develops and maintains resource guide for use by residents. Organizes and conducts community activities and participates in community groups relevant to resident needs. Handles crisis intervention actions until appropriate emergency agency arrives. Maintains confidential records of all resident transactions.
Valuing our Nonprofit Workforce 2014 Page 95
Number of Orgs Emps
All Organizations:
By Budget Size: $10,000,000 - $24,999,999 $25,000,000 and overBy Geographic Location: Greater Boston RegionBy Field of Service: Srvcs & Adv: Elderly, developmentally disabled Counseling, crisis interv, mental hlth, medicalBy Number of Employees: 101 - 250 251+By Years of Experience Required: 2 - 3 YearsBy Level of Education Required: High School Diploma Bachelor's DegreeBy Gender of Employee: Male FemaleBy Race/Ethnicity of Employee: Black Hispanic or Latino WhiteBy Number of Years in Position: Up to 5 Years 5 - 10 Years 11 - 20 Years
16
-----------------66
-----------------5
-----------------76
-----------------59
-----------------9
-----------------88
-----------------9
14-----------------
106
11-----------------
1498
232
-----------------82
144-----------------
47-----------------
14881
-----------------40
188-----------------
95-----------------
12064
-----------------68
144-----------------
6410
115-----------------
1104832
$29,230
-------------------31,996
-------------------28,492
-------------------
27,065-------------------
31,99029,151
-------------------28,475
-------------------
32,126-------------------
29,15128,205
-------------------28,486
28,937-------------------
27,988
$32,802
-----------------34,986
-----------------32,136
-----------------
30,576-----------------
32,80232,890
-----------------30,347
-----------------
35,589-----------------
33,39532,677
-----------------31,377
32,885-----------------
31,247
$35,995
-----------------37,086
-----------------36,109
-----------------
32,906-----------------
36,05736,234
-----------------33,738
-----------------
38,054-----------------
36,44236,047
-----------------36,62935,42336,109
-----------------35,756
$38,355
-----------------40,607
-----------------39,250
-----------------
38,002-----------------
37,77338,854
-----------------40,290
-----------------
41,340-----------------
38,85438,340
-----------------40,170
38,355-----------------
38,028
$41,556
-----------------44,048
-----------------42,195
-----------------
40,681-----------------
39,90542,005
-----------------43,277
-----------------
44,304-----------------
41,49142,547
-----------------41,637
43,277-----------------
40,995
$35,787
-----------------37,553
-----------------36,338
-----------------
33,693-----------------
35,74436,001
-----------------34,843
-----------------
38,139-----------------
36,09635,791
-----------------35,88535,81835,983
-----------------34,936
25th %ile
Median (50%)
Avg by Org
75th %ile
Annual Base Salaries10th %ile
90th %ile
$36,748
-----------------39,10735,535
-----------------38,407
-----------------38,95532,768
-----------------39,47537,031
-----------------33,553
-----------------32,48137,528
-----------------35,96536,738
-----------------36,13937,00236,404
-----------------36,34437,54638,851
Avg by Employee

Provides overall management and direction to residential and commercial property operations, including management of staff, developing/controlling the budget, developing/ implementing policies and procedures, participating in obtaining funds/grants, coordinating/integrating program with others in the organization. Typically, this position reports to the Executive Director/Chief Executive Officer, is a member of the senior executive team and directly or indirectly manages a minimum of ten staff. Develops and implements short and long range plans to take advantage of business opportunities and to ensure maintenance of property values. Directs efforts to ensure compliance with lenders and investors. Directs programs to develop and train site staff and supervisors.
425Housing and Residential Programs and Services
© 2014 Third Sector New England & Nonprofit Compensation Associates
Director, Property Management
Page 96
Number of Orgs Emps
All Organizations:
By Race/Ethnicity of Employee: White
5
-----------------5
5
-----------------5
------------------------------------
$83,200
-----------------83,200
----------------------------------
$82,734
-----------------82,734
25th %ile
Median (50%)
Avg by Org
75th %ile
Annual Base Salaries10th %ile
90th %ile
$82,734
-----------------82,734
Avg by Employee
Provides overall management to the general operations of multiple residential and/or commercial facilities including staffing, daily operations, budgeting, funding, developing policies and community outreach. Manages construction and/or renovations during design, construction, completion and occupancy. Reports on the status of sites, programs, and residents.
426
Number of Orgs Emps
Property Manager
All Organizations:
By Gender of Employee: FemaleBy Race/Ethnicity of Employee: White
8
-----------------5
-----------------5
23
-----------------18
-----------------13
$30,268
-------------------28,766
-------------------30,551
$38,688
-----------------37,071
-----------------46,249
$47,882
-----------------46,384
-----------------51,230
$53,830
-----------------51,303
-----------------53,976
$64,883
-----------------54,696
-----------------69,750
$47,596
-----------------44,401
-----------------50,371
25th %ile
Median (50%)
Avg by Org
75th %ile
Annual Base Salaries10th %ile
90th %ile
$52,851
-----------------45,492
-----------------55,026
Avg by Employee

427Housing and Residential Programs and Services
Shelter Manager/SupervisorSupervises the day-to-day operations of a shelter or residential facility including food service, cleaning, maintenance, client and day care activities and related activities. Ensures safe, secure living conditions for residents and staff. Supervises facility assistants and maintenance staff. May assist in implementing therapeutic program for residents.
Valuing our Nonprofit Workforce 2014 Page 97
Number of Orgs Emps
All Organizations:
By Years of Experience Required: 2 - 3 YearsBy Level of Education Required: Bachelor's DegreeBy Gender of Employee: Male FemaleBy Race/Ethnicity of Employee: Black WhiteBy Number of Years in Position: Up to 5 Years 5 - 10 YearsBy Number of Employees Managed: 4 to 8
10
-----------------6
-----------------7
-----------------57
-----------------67
-----------------65
-----------------6
41
-----------------21
-----------------21
-----------------1228
-----------------1321
-----------------23
9-----------------
16
$28,105
-------------------28,080
-------------------31,408
-------------------28,08031,443
-------------------28,080
-------------------28,080
-------------------
$32,240
-----------------29,380
-----------------33,218
-----------------28,21033,035
-----------------29,380
-----------------30,160
-----------------
$34,736
-----------------32,781
-----------------36,400
-----------------31,99135,360
-----------------32,781
-----------------33,21834,278
-----------------
$39,125
-----------------35,048
-----------------40,862
-----------------35,60539,561
-----------------37,679
-----------------36,462
-----------------
$45,065
-----------------43,472
-----------------46,671
-----------------43,19247,108
-----------------42,620
-----------------43,251
-----------------
$35,691
-----------------33,588
-----------------37,205
-----------------32,92336,653
-----------------33,867
-----------------34,05634,459
-----------------
25th %ile
Median (50%)
Avg by Org
75th %ile
Annual Base Salaries10th %ile
90th %ile
$38,622
-----------------36,920
-----------------39,740
-----------------36,70037,306
-----------------35,92636,824
-----------------35,79635,224
-----------------38,521
Avg by Employee
Provides overall management and direction to multiple housing or homelessness services programs including management of staff, developing/controlling the budget, developing/implementing policies and procedures, participating in obtaining funds/grants, coordinating/integrating program with others in the organization.
430Program Director, Housing/Homelessness Prevention
Number of Orgs Emps
All Organizations:
By Field of Service: Housing and homelessness preventionBy Years of Experience Required: 4 - 6 YearsBy Gender of Employee: FemaleBy Race/Ethnicity of Employee: WhiteBy Number of Years in Position: Up to 5 Years
10
-----------------5
-----------------6
-----------------8
-----------------9
-----------------5
11
-----------------5
-----------------7
-----------------9
-----------------9
-----------------5
-------------------
-------------------
-------------------
-------------------
-------------------
-----------------
-----------------
-----------------
-----------------
-----------------
$62,400
-----------------67,662
-----------------62,400
-----------------66,622
-----------------62,005
-----------------62,400
-----------------
-----------------
-----------------
-----------------
-----------------
-----------------
-----------------
-----------------
-----------------
-----------------
$64,365
-----------------68,994
-----------------66,093
-----------------64,845
-----------------62,067
-----------------62,770
25th %ile
Median (50%)
Avg by Org
75th %ile
Annual Base Salaries10th %ile
90th %ile
$63,331
-----------------68,994
-----------------64,659
-----------------63,613
-----------------62,067
-----------------62,770
Avg by Employee

Provides overall management and supervision to one (or two) program(s) including supervision of staff, developing/controlling the budget, developing/implementing policies and procedures, participating in obtaining funds/grants, coordinating/integrating program with others in the organization.
435Housing and Residential Programs and Services
© 2014 Third Sector New England & Nonprofit Compensation Associates
Program Manager, Housing/Homelessness Prevention
Page 98
Number of Orgs Emps
All Organizations:
By Gender of Employee: FemaleBy Number of Years in Position: Up to 5 YearsBy Number of Employees Managed: 4 to 8
6
-----------------5
-----------------5
-----------------5
15
-----------------12
-----------------9
-----------------6
$34,133
-------------------35,404
-------------------
-------------------
$35,506
-----------------37,461
-----------------
-----------------
$40,290
-----------------42,557
-----------------44,824
-----------------48,610
$49,005
-----------------49,286
-----------------
-----------------
$50,452
-----------------50,852
-----------------
-----------------
$42,221
-----------------43,254
-----------------42,702
-----------------45,978
25th %ile
Median (50%)
Avg by Org
75th %ile
Annual Base Salaries10th %ile
90th %ile
$44,969
-----------------45,050
-----------------44,438
-----------------45,415
Avg by Employee
Responsible for client case management including resident intake, assessment and, referral. Screens applicants for housing to determine eligibility for residency and implement the supportive services component of the program as directed.
440
Number of Orgs Emps
Housing Case Manager
All Organizations:
By Field of Service: Housing and homelessness preventionBy Years of Experience Required: 2 - 3 YearsBy Level of Education Required: Bachelor's DegreeBy Gender of Employee: FemaleBy Race/Ethnicity of Employee: Black Hispanic or Latino WhiteBy Number of Years in Position: Up to 5 Years
9
-----------------5
-----------------5
-----------------5
-----------------8
-----------------656
-----------------7
55
-----------------43
-----------------31
-----------------30
-----------------47
-----------------122318
-----------------45
$25,002
-------------------31,075
-------------------30,472
-------------------25,002
-------------------25,002
-------------------25,07730,53425,002
-------------------25,002
$31,013
-----------------33,987
-----------------31,720
-----------------27,389
-----------------31,699
-----------------31,11232,78127,326
-----------------30,607
$34,736
-----------------35,006
-----------------34,840
-----------------33,093
-----------------34,840
-----------------34,95534,96534,331
-----------------34,736
$36,046
-----------------36,234
-----------------36,046
-----------------36,129
-----------------36,046
-----------------35,71936,04636,426
-----------------35,974
$37,290
-----------------38,376
-----------------37,003
-----------------37,467
-----------------37,103
-----------------37,00338,85839,838
-----------------37,061
$33,597
-----------------35,303
-----------------34,050
-----------------32,485
-----------------33,666
-----------------33,14034,87433,087
-----------------33,265
25th %ile
Median (50%)
Avg by Org
75th %ile
Annual Base Salaries10th %ile
90th %ile
$32,352
-----------------35,020
-----------------33,575
-----------------31,914
-----------------32,844
-----------------33,17735,15332,546
-----------------32,475
Avg by Employee

445Housing and Residential Programs and Services
Housing AdvocateCompletes intakes for shelter services. Serves as advocate for clients and their families to address housing needs. Provides information about housing and rental assistance programs and resources. Assists with housing searches. Attends appointments at other agencies with clients to assist with the application processes and to advocate for their interests. Coordinates other support services as needed. Tracks changes in availability and eligibility requirements for housing subsidies, welfare and other benefits.
Valuing our Nonprofit Workforce 2014 Page 99
Number of Orgs Emps
All Organizations:
By Gender of Employee: FemaleBy Race/Ethnicity of Employee: WhiteBy Number of Years in Position: Up to 5 Years
9
-----------------8
-----------------7
-----------------8
40
-----------------32
-----------------12
-----------------20
$24,623
-------------------23,362
-------------------25,459
-------------------23,050
$26,109
-----------------25,459
-----------------28,059
-----------------25,085
$31,992
-----------------30,555
-----------------34,383
-----------------31,117
$36,786
-----------------37,113
-----------------35,786
-----------------36,109
$41,895
-----------------43,204
-----------------45,446
-----------------41,852
$32,305
-----------------32,157
-----------------33,302
-----------------31,433
25th %ile
Median (50%)
Avg by Org
75th %ile
Annual Base Salaries10th %ile
90th %ile
$34,704
-----------------34,884
-----------------34,061
-----------------34,136
Avg by Employee

Directs the human resources functions including employment, compensation, benefits, training, affirmative action/equal employment, employee relations and services in support of organizational objectives. Advises management on labor and other legal issues related to human resources. Participates as a member of the senior management team in developing and implementing organization-wide policies and programs that contribute to its overall success. The primary differences between the Director and Manager level (see below) are that the Director is a key member of the senior management team, reports to the Executive Director/CEO and typically manages professional and/or supervisory staff. The Manager position may report to a second level executive (e.g. Chief Financial Officer, Director of Administration), be the sole human resources practitioner in a small organization, have responsibility for implementing human resources programs, but tends to be less involved in the design of human resources strategies and related programs.
505Human Resources
© 2014 Third Sector New England & Nonprofit Compensation Associates
Director, Human Resources
Page 100
Number of Orgs Emps
All Organizations:
By Budget Size: $2,500,000 - $9,999,999 $10,000,000 - $24,999,999 $25,000,000 and overBy Geographic Location: Berkshire County Region Western Massachusetts Region Central Massachusetts Region Greater Boston Region Northeastern Massachusetts Region Southeastern Massachusetts/Rhode Island RegionBy Field of Service: Srvcs & Adv: Children and youth Srvcs & Adv: Elderly, developmentally disabled Counseling, crisis interv, mental hlth, medicalBy Number of Employees: 101 - 250 251+By Years of Experience Required: 2 - 3 Years 4 - 6 Years 7 - 10 YearsBy Level of Education Required: Bachelor's Degree Master's DegreeBy Gender of Employee: Male FemaleBy Race/Ethnicity of Employee: WhiteBy Number of Years in Position: Up to 5 Years 5 - 10 Years 11 - 20 YearsBy Number of Employees Managed: 1 to 3 4 to 8
53
-----------------162314
-----------------5
12888
12-----------------
924
6-----------------
1929
-----------------6
1711
-----------------3610
-----------------1042
-----------------49
-----------------28
710
-----------------2513
53
-----------------162314
-----------------5
12888
12-----------------
924
6-----------------
1929
-----------------6
1711
-----------------3610
-----------------1042
-----------------49
-----------------28
710
-----------------2513
$60,008
-------------------51,94064,66380,161
-------------------
50,833
60,008-------------------
56,389
-------------------58,92666,602
-------------------
55,748
-------------------58,196
-------------------
60,008-------------------
60,008-------------------
59,657
-------------------59,57554,005
$68,976
-----------------59,19768,95287,111
-----------------
67,190
65,359-----------------
67,763
-----------------62,85875,543
-----------------
61,433
-----------------66,789
-----------------
68,365-----------------
68,151-----------------
65,541
-----------------72,69664,553
$80,018
-----------------69,49677,70996,242
-----------------72,53073,50591,60487,67296,24279,758
-----------------85,86280,00887,246
-----------------72,86287,152
-----------------71,09577,70992,477
-----------------78,86498,946
-----------------92,12677,709
-----------------80,018
-----------------78,83281,80681,786
-----------------85,01086,986
$98,239
-----------------84,20991,774
109,632-----------------
84,401
87,880-----------------
99,476
-----------------85,010
100,006-----------------
92,945
-----------------87,880
-----------------
92,004-----------------
95,181-----------------
97,063
-----------------99,29998,946
$113,364
-----------------106,871110,144121,930
-----------------
102,001
108,235-----------------
115,184
-----------------110,906115,003
-----------------
103,005
-----------------116,850
-----------------
110,396-----------------
109,207-----------------
109,787
-----------------109,887115,519
$83,697
-----------------72,67382,50898,249
-----------------72,56875,01390,42091,46293,69180,697
-----------------86,78383,03087,703
-----------------76,90788,734
-----------------70,67578,60396,024
-----------------80,50993,980
-----------------92,48681,693
-----------------82,081
-----------------81,26892,62581,360
-----------------84,55082,451
25th %ile
Median (50%)
Avg by Org
75th %ile
Annual Base Salaries10th %ile
90th %ile
$83,697
-----------------72,67382,50898,249
-----------------72,56875,01390,42091,46293,69180,697
-----------------86,78383,03087,703
-----------------76,90788,734
-----------------70,67578,60396,024
-----------------80,50993,980
-----------------92,48681,693
-----------------82,081
-----------------81,26892,62581,360
-----------------84,55082,451
Avg by Employee
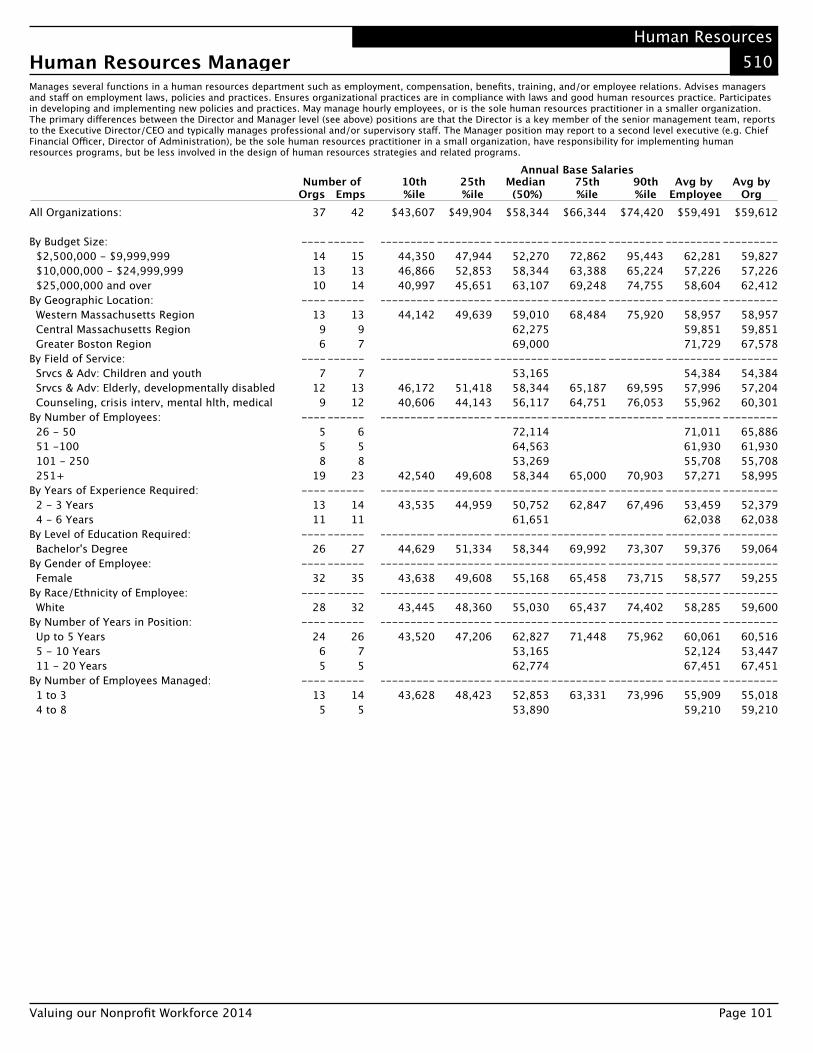
510Human Resources
Human Resources ManagerManages several functions in a human resources department such as employment, compensation, benefits, training, and/or employee relations. Advises managers and staff on employment laws, policies and practices. Ensures organizational practices are in compliance with laws and good human resources practice. Participates in developing and implementing new policies and practices. May manage hourly employees, or is the sole human resources practitioner in a smaller organization. The primary differences between the Director and Manager level (see above) positions are that the Director is a key member of the senior management team, reports to the Executive Director/CEO and typically manages professional and/or supervisory staff. The Manager position may report to a second level executive (e.g. Chief Financial Officer, Director of Administration), be the sole human resources practitioner in a small organization, have responsibility for implementing human resources programs, but be less involved in the design of human resources strategies and related programs.
Valuing our Nonprofit Workforce 2014 Page 101
Number of Orgs Emps
All Organizations:
By Budget Size: $2,500,000 - $9,999,999 $10,000,000 - $24,999,999 $25,000,000 and overBy Geographic Location: Western Massachusetts Region Central Massachusetts Region Greater Boston RegionBy Field of Service: Srvcs & Adv: Children and youth Srvcs & Adv: Elderly, developmentally disabled Counseling, crisis interv, mental hlth, medicalBy Number of Employees: 26 - 50 51 -100 101 - 250 251+By Years of Experience Required: 2 - 3 Years 4 - 6 YearsBy Level of Education Required: Bachelor's DegreeBy Gender of Employee: FemaleBy Race/Ethnicity of Employee: WhiteBy Number of Years in Position: Up to 5 Years 5 - 10 Years 11 - 20 YearsBy Number of Employees Managed: 1 to 3 4 to 8
37
-----------------141310
-----------------13
96
-----------------7
129
-----------------558
19-----------------
1311
-----------------26
-----------------32
-----------------28
-----------------24
65
-----------------13
5
42
-----------------151314
-----------------13
97
-----------------7
1312
-----------------658
23-----------------
1411
-----------------27
-----------------35
-----------------32
-----------------26
75
-----------------14
5
$43,607
-------------------44,35046,86640,997
-------------------44,142
-------------------
46,17240,606
-------------------
42,540-------------------
43,535
-------------------44,629
-------------------43,638
-------------------43,445
-------------------43,520
-------------------43,628
$49,904
-----------------47,94452,85345,651
-----------------49,639
-----------------
51,41844,143
-----------------
49,608-----------------
44,959
-----------------51,334
-----------------49,608
-----------------48,360
-----------------47,206
-----------------48,423
$58,344
-----------------52,27058,34463,107
-----------------59,01062,27569,000
-----------------53,16558,34456,117
-----------------72,11464,56353,26958,344
-----------------50,75261,651
-----------------58,344
-----------------55,168
-----------------55,030
-----------------62,82753,16562,774
-----------------52,85353,890
$66,344
-----------------72,86263,38869,248
-----------------68,484
-----------------
65,18764,751
-----------------
65,000-----------------
62,847
-----------------69,992
-----------------65,458
-----------------65,437
-----------------71,448
-----------------63,331
$74,420
-----------------95,44365,22474,755
-----------------75,920
-----------------
69,59576,053
-----------------
70,903-----------------
67,496
-----------------73,307
-----------------73,715
-----------------74,402
-----------------75,962
-----------------73,996
$59,491
-----------------62,28157,22658,604
-----------------58,95759,85171,729
-----------------54,38457,99655,962
-----------------71,01161,93055,70857,271
-----------------53,45962,038
-----------------59,376
-----------------58,577
-----------------58,285
-----------------60,06152,12467,451
-----------------55,90959,210
25th %ile
Median (50%)
Avg by Org
75th %ile
Annual Base Salaries10th %ile
90th %ile
$59,612
-----------------59,82757,22662,412
-----------------58,95759,85167,578
-----------------54,38457,20460,301
-----------------65,88661,93055,70858,995
-----------------52,37962,038
-----------------59,064
-----------------59,255
-----------------59,600
-----------------60,51653,44767,451
-----------------55,01859,210
Avg by Employee

Performs a wide variety of professional level human resources functions including recruiting, interviewing and hiring staff, administering benefits and/or compensation programs, resolving employee relations issues, counseling staff and advising managers and supervisors, conducting exit interviews and interpreting human resources policies and laws.
515Human Resources
© 2014 Third Sector New England & Nonprofit Compensation Associates
Human Resources Representative/Specialist
Page 102
Number of Orgs Emps
All Organizations:
By Budget Size: $2,500,000 - $9,999,999 $10,000,000 - $24,999,999 $25,000,000 and overBy Geographic Location: Western Massachusetts Region Central Massachusetts Region Greater Boston Region Northeastern Massachusetts Region Southeastern Massachusetts/Rhode Island RegionBy Field of Service: Srvcs & Adv: Children and youth Srvcs & Adv: Elderly, developmentally disabled Counseling, crisis interv, mental hlth, medicalBy Number of Employees: 101 - 250 251+By Years of Experience Required: 1 Year 2 - 3 Years 4 - 6 YearsBy Level of Education Required: High School Diploma Associate's Degree Bachelor's DegreeBy Gender of Employee: Male FemaleBy Race/Ethnicity of Employee: Black WhiteBy Number of Years in Position: Up to 5 Years 5 - 10 Years 11 - 20 YearsBy Number of Employees Managed: 1 to 3
45
-----------------9
1718
-----------------12
8768
-----------------6
209
-----------------1427
-----------------7
228
-----------------66
29-----------------
540
-----------------5
39-----------------
3013
7-----------------
6
70
-----------------122136
-----------------1915
91110
-----------------103316
-----------------1551
-----------------7
3410
-----------------88
46-----------------
661
-----------------5
60-----------------
4116
7-----------------
6
$35,179
-------------------31,74335,02736,335
-------------------33,01038,601
-------------------
35,56434,782
-------------------35,04435,247
-------------------
35,006
-------------------
35,079-------------------
35,247-------------------
35,179-------------------
35,00638,214
-------------------
$39,811
-----------------36,66038,50141,106
-----------------37,44041,184
-----------------
41,44435,989
-----------------37,44040,914
-----------------
36,530
-----------------
41,522-----------------
40,082-----------------
40,227-----------------
37,22241,839
-----------------
$44,138
-----------------43,89942,86946,030
-----------------41,60045,51043,68048,80242,339
-----------------39,62446,55041,413
-----------------47,34142,994
-----------------42,99441,64252,611
-----------------40,99737,00347,008
-----------------47,54144,595
-----------------41,08044,928
-----------------42,00048,96646,550
-----------------48,872
$51,553
-----------------56,20751,88650,159
-----------------49,95452,000
-----------------
50,95046,316
-----------------56,16050,003
-----------------
47,035
-----------------
51,828-----------------
51,886-----------------
51,870-----------------
48,84859,036
-----------------
$59,107
-----------------70,54758,55661,168
-----------------56,16072,351
-----------------
61,51452,303
-----------------63,89456,256
-----------------
53,997
-----------------
56,657-----------------
59,505-----------------
59,548-----------------
55,48263,434
-----------------
$46,331
-----------------46,69444,66947,408
-----------------42,99448,97051,36747,63744,238
-----------------43,01447,69242,215
-----------------47,36045,512
-----------------44,68443,28350,832
-----------------45,23837,90646,939
-----------------45,99746,626
-----------------44,80746,780
-----------------44,27850,35545,582
-----------------47,078
25th %ile
Median (50%)
Avg by Org
75th %ile
Annual Base Salaries10th %ile
90th %ile
$46,640
-----------------47,37844,57448,696
-----------------43,49549,41454,38346,30444,409
-----------------42,18948,05941,139
-----------------48,20744,897
-----------------44,68443,80251,475
-----------------47,24738,35947,161
-----------------44,53247,266
-----------------44,80746,815
-----------------44,30850,31645,582
-----------------47,078
Avg by Employee

520Human Resources
Human Resources AssistantPerforms a variety of skilled administrative and clerical duties directly related to human resources activities. These may include maintaining employee databases and files, processing status changes, assisting employees to sign up/apply for benefits, screening resumes/application forms, scheduling interviews for others, checking references, compiling data and preparing routine and special reports. Also provides information to employees on policies and procedures and oversees and participates in employee programs. May provide administrative/clerical support to human resources Managers and staff.
Valuing our Nonprofit Workforce 2014 Page 103
Number of Orgs Emps
All Organizations:
By Budget Size: $2,500,000 - $9,999,999 $10,000,000 - $24,999,999 $25,000,000 and overBy Geographic Location: Western Massachusetts Region Greater Boston RegionBy Field of Service: Srvcs & Adv: Children and youth Srvcs & Adv: Elderly, developmentally disabled Counseling, crisis interv, mental hlth, medicalBy Number of Employees: 101 - 250 251+By Years of Experience Required: 1 Year 2 - 3 YearsBy Level of Education Required: High School DiplomaBy Gender of Employee: FemaleBy Race/Ethnicity of Employee: Hispanic or Latino WhiteBy Number of Years in Position: Up to 5 Years
25
-----------------799
-----------------95
-----------------587
-----------------8
16-----------------
610
-----------------16
-----------------22
-----------------5
21-----------------
18
35
-----------------9
1115
-----------------12
6-----------------
71310
-----------------1024
-----------------8
14-----------------
24-----------------
31-----------------
525
-----------------22
$25,584
-------------------
27,111-------------------
24,960
-------------------
24,960
-------------------
25,480-------------------
26,915-------------------
25,480-------------------
25,168-------------------
25,584-------------------
24,960
$29,994
-----------------
31,096-----------------
26,458
-----------------
30,545
-----------------
29,775-----------------
30,821-----------------
29,775-----------------
29,994-----------------
29,848-----------------
27,846
$34,278
-----------------33,53034,27834,278
-----------------32,94636,671
-----------------36,25431,82434,819
-----------------34,38333,779
-----------------33,77932,093
-----------------32,677
-----------------33,530
-----------------35,36034,278
-----------------32,821
$37,107
-----------------
38,002-----------------
36,031
-----------------
35,298
-----------------
36,894-----------------
39,109-----------------
36,894-----------------
37,107-----------------
37,992-----------------
36,467
$42,636
-----------------
42,906-----------------
36,764
-----------------
42,936
-----------------
42,671-----------------
42,921-----------------
40,425-----------------
42,777-----------------
42,906-----------------
42,844
$34,095
-----------------33,80733,31634,840
-----------------31,56437,091
-----------------35,19132,90533,688
-----------------33,81933,591
-----------------32,09434,006
-----------------33,089
-----------------34,073
-----------------32,38634,476
-----------------33,287
25th %ile
Median (50%)
Avg by Org
75th %ile
Annual Base Salaries10th %ile
90th %ile
$34,217
-----------------35,36333,19934,344
-----------------31,75437,645
-----------------36,16832,99232,615
-----------------34,68933,060
-----------------30,73833,781
-----------------32,925
-----------------34,254
-----------------32,38634,188
-----------------33,391
Avg by Employee

Determines organizational needs for information management and manages the development and implementation systems and programs to meet those needs in a cost-effective, timely manner. Manages information technology functions including systems applications and development, database administration, financial systems, desktop support, web site development and maintenance, intra- and inter-networks, and internal telecommunications. Advises on purchase of new computer hardware and software.
555Information Technology
© 2014 Third Sector New England & Nonprofit Compensation Associates
Director, Information Technology/Services
Page 104
Number of Orgs Emps
All Organizations:
By Budget Size: $10,000,000 - $24,999,999 $25,000,000 and overBy Geographic Location: Western Massachusetts Region Central Massachusetts Region Northeastern Massachusetts Region Southeastern Massachusetts/Rhode Island RegionBy Field of Service: Srvcs & Adv: Elderly, developmentally disabled Counseling, crisis interv, mental hlth, medicalBy Number of Employees: 101 - 250 251+By Years of Experience Required: 2 - 3 Years 4 - 6 Years 7 - 10 YearsBy Level of Education Required: Bachelor's Degree Master's DegreeBy Gender of Employee: Male FemaleBy Race/Ethnicity of Employee: WhiteBy Number of Years in Position: Up to 5 Years 5 - 10 YearsBy Number of Employees Managed: 1 to 3 4 to 8
29
-----------------1114
-----------------8566
-----------------85
-----------------7
17-----------------
566
-----------------17
6-----------------
246
-----------------26
-----------------18
7-----------------
165
31
-----------------1116
-----------------9567
-----------------87
-----------------7
19-----------------
666
-----------------17
7-----------------
256
-----------------28
-----------------19
7-----------------
166
$64,011
-------------------
68,923-------------------
-------------------
-------------------
63,649-------------------
-------------------68,973
-------------------64,734
-------------------63,607
-------------------63,232
-------------------61,578
$75,005
-----------------
82,498-----------------
-----------------
-----------------
75,005-----------------
-----------------75,286
-----------------75,286
-----------------75,145
-----------------75,005
-----------------66,696
$90,667
-----------------75,56694,994
-----------------81,12090,00292,831
103,085-----------------
92,467103,002
-----------------87,65194,266
-----------------72,86390,54397,282
-----------------94,266
103,002-----------------
90,66789,981
-----------------92,394
-----------------90,667
108,389-----------------
81,60995,119
$103,002
-----------------
105,565-----------------
-----------------
-----------------
103,002-----------------
-----------------99,768
-----------------101,900
-----------------102,451
-----------------99,965
-----------------101,941
$122,406
-----------------
127,193-----------------
-----------------
-----------------
125,000-----------------
-----------------111,711
-----------------117,217
-----------------125,731
-----------------103,085
-----------------115,565
$92,291
-----------------89,38096,462
-----------------85,90484,702
102,356100,319
-----------------85,17198,924
-----------------95,33890,739
-----------------73,22792,909
108,164-----------------
90,587105,156
-----------------92,25692,435
-----------------92,544
-----------------86,559
111,824-----------------
84,95193,704
25th %ile
Median (50%)
Avg by Org
75th %ile
Annual Base Salaries10th %ile
90th %ile
$92,286
-----------------89,38097,047
-----------------86,64384,702
102,35699,582
-----------------85,171
101,546-----------------
95,33890,548
-----------------71,87292,909
108,164-----------------
90,587109,349
-----------------91,73692,435
-----------------92,558
-----------------85,549
111,824-----------------
84,95196,446
Avg by Employee

560Information Technology
Information Technology ManagerProvides day-to-day management of information technology functions including computer operations, applications and systems programming and networks. Analyzes the needs of departments and plans, organizes and implements new and/or modified systems to handle those needs. Determines costs and budgets for information technology projects and controls costs to approved budgets. Identifies training needs among staff and develops/implements training programs to enhance computer skills throughout the organization.
Valuing our Nonprofit Workforce 2014 Page 105
Number of Orgs Emps
All Organizations:
By Budget Size: $2,500,000 - $9,999,999 $10,000,000 - $24,999,999 $25,000,000 and overBy Geographic Location: Western Massachusetts Region Central Massachusetts Region Greater Boston Region Northeastern Massachusetts Region Southeastern Massachusetts/Rhode Island RegionBy Field of Service: Srvcs & Adv: Children and youth Srvcs & Adv: Elderly, developmentally disabled Arts, culture, recreation Counseling, crisis interv, mental hlth, medicalBy Number of Employees: 101 - 250 251+By Years of Experience Required: 2 - 3 Years 4 - 6 YearsBy Level of Education Required: Associate's Degree Bachelor's DegreeBy Gender of Employee: Male FemaleBy Race/Ethnicity of Employee: WhiteBy Number of Years in Position: Up to 5 Years 5 - 10 Years 11 - 20 YearsBy Number of Employees Managed: 1 to 3
36
-----------------9
139
-----------------76956
-----------------6
1066
-----------------1313
-----------------15
8-----------------
521
-----------------26
9-----------------
30-----------------
2059
-----------------18
40
-----------------9
179
-----------------76
1086
-----------------7
1066
-----------------1713
-----------------1510
-----------------5
25-----------------
309
-----------------33
-----------------20
512
-----------------19
$48,010
-------------------
47,405
-------------------
-------------------
-------------------47,55547,407
-------------------47,233
-------------------
47,208-------------------
47,108
-------------------48,023
-------------------48,237
45,901-------------------
49,941
$52,037
-----------------
50,856
-----------------
-----------------
-----------------52,07354,496
-----------------50,752
-----------------
53,886-----------------
52,110
-----------------52,957
-----------------52,037
57,262-----------------
52,146
$61,423
-----------------56,90957,22172,696
-----------------51,77157,06566,58174,84965,188
-----------------57,22158,29258,68864,876
-----------------64,00264,002
-----------------60,46673,643
-----------------61,04864,002
-----------------60,44569,909
-----------------64,002
-----------------58,53256,90973,393
-----------------61,797
$74,230
-----------------
75,993
-----------------
-----------------
-----------------76,46175,546
-----------------72,800
-----------------
75,993-----------------
74,610
-----------------75,993
-----------------72,956
84,079-----------------
74,090
$85,775
-----------------
88,637
-----------------
-----------------
-----------------88,63786,575
-----------------76,628
-----------------
82,081-----------------
87,451
-----------------87,164
-----------------78,294
91,362-----------------
92,000
$63,928
-----------------59,90963,15173,831
-----------------55,83960,02666,36675,07865,971
-----------------59,73462,85062,04762,608
-----------------65,39065,618
-----------------61,25172,925
-----------------61,72665,313
-----------------63,92865,677
-----------------65,515
-----------------61,84557,12570,503
-----------------65,286
25th %ile
Median (50%)
Avg by Org
75th %ile
Annual Base Salaries10th %ile
90th %ile
$62,865
-----------------59,90959,96873,831
-----------------55,83960,02668,12971,42765,971
-----------------61,27362,85062,04762,608
-----------------62,89665,618
-----------------61,25170,403
-----------------61,72663,754
-----------------62,45665,677
-----------------63,950
-----------------61,84557,12569,419
-----------------64,427
Avg by Employee

Develops and maintains computerized databases including base definition, structure, documentation, operations and security. Sets up master files and ensures accuracy and completeness of all data. Participates in exchanges of data (e.g. the Big List). Protects the integrity of data using proper security controls.
565Information Technology
© 2014 Third Sector New England & Nonprofit Compensation Associates
Database Administrator
Page 106
Number of Orgs Emps
All Organizations:
By Budget Size: $2,500,000 - $9,999,999 $10,000,000 - $24,999,999 $25,000,000 and overBy Geographic Location: Western Massachusetts Region Greater Boston Region Northeastern Massachusetts RegionBy Number of Employees: 251+By Years of Experience Required: 1 Year 2 - 3 YearsBy Level of Education Required: Bachelor's DegreeBy Gender of Employee: Male FemaleBy Race/Ethnicity of Employee: WhiteBy Number of Years in Position: Up to 5 Years 5 - 10 Years
22
-----------------859
-----------------665
-----------------11
-----------------56
-----------------14
-----------------8
15-----------------
20-----------------
127
29
-----------------95
15-----------------
986
-----------------17
-----------------59
-----------------19
-----------------1018
-----------------26
-----------------14
7
$43,160
-------------------
46,742-------------------
-------------------47,312
-------------------
-------------------45,032
-------------------
47,254-------------------
44,470-------------------
39,572
$50,648
-----------------
53,040-----------------
-----------------53,477
-----------------
-----------------52,000
-----------------
51,324-----------------
51,324-----------------
52,780
$57,262
-----------------52,00059,32260,008
-----------------59,32253,59150,461
-----------------59,322
-----------------52,00057,262
-----------------59,322
-----------------58,63557,252
-----------------58,292
-----------------63,75457,262
$69,992
-----------------
69,992-----------------
-----------------69,992
-----------------
-----------------71,406
-----------------
70,346-----------------
70,346-----------------
75,203
$76,378
-----------------
89,099-----------------
-----------------87,627
-----------------
-----------------76,378
-----------------
86,890-----------------
79,311-----------------
81,266
$60,238
-----------------55,25960,02563,298
-----------------61,62454,67358,070
-----------------62,603
-----------------55,84858,071
-----------------61,636
-----------------59,59961,543
-----------------61,123
-----------------62,58557,595
25th %ile
Median (50%)
Avg by Org
75th %ile
Annual Base Salaries10th %ile
90th %ile
$59,637
-----------------56,48560,02562,224
-----------------61,28054,28155,029
-----------------61,346
-----------------55,84858,725
-----------------61,752
-----------------58,88861,797
-----------------61,027
-----------------62,34957,595
Avg by Employee

570Information Technology
Network TechnicianInstalls, modifies, tests and maintains the organization's data communication network equipment. Responds to network problems, troubleshoots and performs repairs in a timely manner. Maintains associated records detailing downtime, changes, updates and related information.
Valuing our Nonprofit Workforce 2014 Page 107
Number of Orgs Emps
All Organizations:
By Budget Size: $10,000,000 - $24,999,999 $25,000,000 and overBy Geographic Location: Western Massachusetts Region Southeastern Massachusetts/Rhode Island RegionBy Field of Service: Srvcs & Adv: Elderly, developmentally disabled Counseling, crisis interv, mental hlth, medicalBy Number of Employees: 101 - 250 251+By Years of Experience Required: 2 - 3 YearsBy Level of Education Required: Bachelor's DegreeBy Gender of Employee: Male FemaleBy Race/Ethnicity of Employee: WhiteBy Number of Years in Position: Up to 5 Years 11 - 20 Years
24
-----------------8
13-----------------
58
-----------------56
-----------------6
13-----------------
9-----------------
14-----------------
176
-----------------20
-----------------14
7
28
-----------------9
16-----------------
58
-----------------77
-----------------7
16-----------------
10-----------------
17-----------------
216
-----------------23
-----------------15
7
$41,442
-------------------
42,650-------------------
-------------------
-------------------
40,976-------------------
-------------------44,962
-------------------42,078
-------------------45,577
-------------------42,203
$46,083
-----------------
47,804-----------------
-----------------
-----------------
45,510-----------------
-----------------55,672
-----------------48,464
-----------------50,440
-----------------46,925
$55,672
-----------------52,49960,112
-----------------58,51050,222
-----------------55,33955,994
-----------------58,51055,667
-----------------58,885
-----------------60,216
-----------------60,00852,895
-----------------58,510
-----------------55,99460,216
$63,175
-----------------
72,358-----------------
-----------------
-----------------
69,129-----------------
-----------------71,562
-----------------71,562
-----------------71,094
-----------------63,003
$74,044
-----------------
80,296-----------------
-----------------
-----------------
80,296-----------------
-----------------80,197
-----------------78,674
-----------------77,351
-----------------75,479
$57,105
-----------------52,60160,677
-----------------56,41053,612
-----------------56,55759,598
-----------------58,06457,237
-----------------60,811
-----------------62,034
-----------------59,10951,983
-----------------59,481
-----------------57,32956,558
25th %ile
Median (50%)
Avg by Org
75th %ile
Annual Base Salaries10th %ile
90th %ile
$56,164
-----------------52,14459,698
-----------------56,41053,612
-----------------56,32856,115
-----------------58,36655,465
-----------------58,624
-----------------60,432
-----------------58,25251,983
-----------------57,977
-----------------56,29756,558
Avg by Employee

Installs, modifies, and maintains the organization's personal computers and related systems. Installs, upgrades and backs-up software and hardware applications. Troubleshoots software and hardware failures and resolves as appropriate. Trains users in resolving routine problems, using new software and providing advice and guidance as needed.
575Information Technology
© 2014 Third Sector New England & Nonprofit Compensation Associates
Personal Computer Technician
Page 108
Number of Orgs Emps
All Organizations:
By Budget Size: $2,500,000 - $9,999,999 $10,000,000 - $24,999,999 $25,000,000 and overBy Geographic Location: Western Massachusetts Region Central Massachusetts Region Greater Boston Region Southeastern Massachusetts/Rhode Island RegionBy Field of Service: Srvcs & Adv: Elderly, developmentally disabled Counseling, crisis interv, mental hlth, medicalBy Number of Employees: 101 - 250 251+By Years of Experience Required: 1 Year 2 - 3 YearsBy Level of Education Required: High School Diploma Associate's Degree Bachelor's DegreeBy Gender of Employee: Male FemaleBy Race/Ethnicity of Employee: Hispanic or Latino WhiteBy Number of Years in Position: Up to 5 Years 5 - 10 Years 11 - 20 Years
28
-----------------5
1211
-----------------8566
-----------------85
-----------------9
14-----------------
109
-----------------12
68
-----------------23
7-----------------
524
-----------------18
57
50
-----------------6
1727
-----------------1611
68
-----------------1415
-----------------1430
-----------------1816
-----------------151018
-----------------3512
-----------------5
37-----------------
2769
$31,128
-------------------
33,91230,131
-------------------31,408
-------------------32,46927,926
-------------------35,93230,584
-------------------31,87634,320
-------------------30,027
31,826-------------------
32,56929,122
-------------------
30,934-------------------
30,131
$36,062
-----------------
36,84734,674
-----------------37,664
-----------------35,50631,034
-----------------38,53234,294
-----------------34,92338,750
-----------------34,674
36,878-----------------
36,19234,320
-----------------
34,840-----------------
33,280
$41,600
-----------------40,56042,59841,122
-----------------41,361
47,96535,433
-----------------41,80838,334
-----------------47,74740,841
-----------------39,19842,879
-----------------38,33439,75943,472
-----------------41,60041,247
-----------------52,00041,122
-----------------38,00249,95249,920
$49,925
-----------------
47,74752,000
-----------------46,587
-----------------50,78941,600
-----------------52,66644,980
-----------------45,83350,227
-----------------52,000
48,365-----------------
49,92053,248
-----------------
46,311-----------------
42,598
$55,374
-----------------
54,81761,680
-----------------53,273
-----------------66,63352,399
-----------------63,25352,898
-----------------53,61856,857
-----------------62,886
63,259-----------------
58,40659,170
-----------------
52,400-----------------
48,260
$43,041
-----------------41,08043,32243,301
-----------------41,785
49,35837,097
-----------------44,24938,491
-----------------47,22940,706
-----------------41,50244,487
-----------------42,43539,66644,354
-----------------43,45243,221
-----------------49,10941,294
-----------------38,66750,11147,267
25th %ile
Median (50%)
Avg by Org
75th %ile
Annual Base Salaries10th %ile
90th %ile
$44,095
-----------------42,64043,18245,751
-----------------42,87346,53249,35838,995
-----------------44,63638,243
-----------------47,29140,902
-----------------40,16647,151
-----------------42,81942,33344,037
-----------------43,98946,529
-----------------49,10942,519
-----------------39,77350,14346,672
Avg by Employee

580Information Technology
Data Entry OperatorEnters data from source documents into computer databases. Verifies information and makes changes where necessary. May run routine reports and perform related clerical duties.
Valuing our Nonprofit Workforce 2014 Page 109
Number of Orgs Emps
All Organizations:
By Budget Size: $2,500,000 - $9,999,999 $25,000,000 and overBy Geographic Location: Western Massachusetts Region Southeastern Massachusetts/Rhode Island RegionBy Field of Service: Srvcs & Adv: Children and youthBy Number of Employees: 251+By Years of Experience Required: 2 - 3 YearsBy Level of Education Required: High School DiplomaBy Gender of Employee: Male FemaleBy Race/Ethnicity of Employee: WhiteBy Number of Years in Position: Up to 5 Years 5 - 10 Years
20
-----------------96
-----------------66
-----------------5
-----------------8
-----------------8
-----------------11
-----------------7
16-----------------
15-----------------
155
35
-----------------1614
-----------------8
10-----------------
6-----------------
17-----------------
10-----------------
22-----------------
825
-----------------26
-----------------23
6
$24,523
-------------------24,20122,526
-------------------
-------------------
-------------------22,863
-------------------
-------------------23,806
-------------------
26,416-------------------
22,751-------------------
25,696
$27,165
-----------------27,37825,886
-----------------
-----------------
-----------------26,593
-----------------
-----------------26,806
-----------------
27,987-----------------
26,806-----------------
27,560
$29,162
-----------------30,34727,987
-----------------28,15328,507
-----------------28,288
-----------------28,122
-----------------33,551
-----------------28,756
-----------------28,18429,162
-----------------30,347
-----------------30,34725,792
$32,906
-----------------33,96629,656
-----------------
-----------------
-----------------31,603
-----------------
-----------------30,560
-----------------
32,487-----------------
32,277-----------------
31,200
$39,125
-----------------38,84436,834
-----------------
-----------------
-----------------40,968
-----------------
-----------------39,379
-----------------
37,877-----------------
39,081-----------------
39,687
$30,420
-----------------31,00928,461
-----------------28,05230,724
-----------------29,470
-----------------29,733
-----------------33,528
-----------------29,641
-----------------29,95730,627
-----------------30,332
-----------------30,82126,277
25th %ile
Median (50%)
Avg by Org
75th %ile
Annual Base Salaries10th %ile
90th %ile
$31,618
-----------------31,40429,938
-----------------28,13932,911
-----------------29,370
-----------------30,902
-----------------33,237
-----------------31,148
-----------------29,90131,760
-----------------31,825
-----------------31,29126,412
Avg by Employee

Develops and maintains web site content that motivates, informs and intrigues users so that they regularly access the site and use it for information and decision making. Seeks out users to gather feedback for improvements and enhancements. Maintains technical integrity of web site. Maintains and upgrades hardware and software. Communicates router configuration changes and troubleshoots system errors and bugs. Maintains servers and creates monitoring reports and logs. Monitors site for user accessibility. Establishes back-ups and monitors site security.
585Information Technology
© 2014 Third Sector New England & Nonprofit Compensation Associates
Web Site Developer
Page 110
Number of Orgs Emps
All Organizations:
By Budget Size: $2,500,000 - $9,999,999By Race/Ethnicity of Employee: White
6
-----------------5
-----------------5
6
-----------------5
-----------------5
-------------------
-------------------
-----------------
-----------------
$53,747
-----------------57,200
-----------------57,200
-----------------
-----------------
-----------------
-----------------
$54,340
-----------------55,149
-----------------56,888
25th %ile
Median (50%)
Avg by Org
75th %ile
Annual Base Salaries10th %ile
90th %ile
$54,340
-----------------55,149
-----------------56,888
Avg by Employee
The Accidental Techie is typically found in smaller to mid-size nonprofits. The organization usually has a full array of electronic equipment including telecommunications, telephones, computers (with sophisticated and complex software), printers, copiers, fax machines, scanning devices, etc., but does not have the finances to hire a fully-qualified staff member to maintain them. Under these circumstances, an employee with the background and some of the skills evolves into an ''Accidental Techie'': the person who troubleshoots software and hardware problems and fixes them; installs new software and hardware and provides training to other staff. He or she may also maintain the donor and member database and/or the web site, research the Internet for information, and provide advice when purchasing new equipment or software.
590
Number of Orgs Emps
Accidental Techie
All Organizations:
By Race/Ethnicity of Employee: White
5
-----------------5
5
-----------------5
------------------------------------
$38,168
-----------------38,168
----------------------------------
$41,092
-----------------41,092
25th %ile
Median (50%)
Avg by Org
75th %ile
Annual Base Salaries10th %ile
90th %ile
$41,092
-----------------41,092
Avg by Employee

605Legal Services
Legal Aid AttorneyProvides a wide variety of legal services to clients of an advocacy or legal aid-type of organization. Represents clients in court and other venues as necessary. Requires admission to practice law/membership in the State Bar Association.
Valuing our Nonprofit Workforce 2014 Page 111
Number of Orgs Emps
All Organizations:
By Gender of Employee: Female
7
-----------------5
57
-----------------29
--------------------------------------------------------------------------------------------------------
25th %ile
Median (50%)
Avg by Org
75th %ile
Annual Base Salaries10th %ile
90th %ile
$73,954
-----------------66,091
Avg by Employee
Performs all the duties of an Administrative Assistant in a legal environment that requires a working knowledge of legal terminology and formatting of legal documents such as pleadings, court forms, contracts, etc. Requires working knowledge of law library, state and federal regulations, code sections, and related matters.
620Legal Secretary/Assistant
Number of Orgs Emps
All Organizations:
By Race/Ethnicity of Employee: White
5
-----------------5
8
-----------------6
------------------------------------
$44,440
-----------------45,407
----------------------------------
$46,790
-----------------47,809
25th %ile
Median (50%)
Avg by Org
75th %ile
Annual Base Salaries10th %ile
90th %ile
$49,692
-----------------49,933
Avg by Employee

Manages the construction and maintenance of facilities, grounds and equipment. Plans, budgets and schedules facility modifications. Ensures compliance with government health and safety standards. Reviews/analyzes proposals for capital projects and advises senior management on acceptance. Manages capital projects to ensure compliance with budgets and contracts. Manages service contracts. Supervises maintenance and technical staff. May have responsibility for maintenance of organization's vehicles.
655Maintenance and Grounds
© 2014 Third Sector New England & Nonprofit Compensation Associates
Facilities Manager
Page 112
Number of Orgs Emps
All Organizations:
By Budget Size: $2,500,000 - $9,999,999 $10,000,000 - $24,999,999 $25,000,000 and overBy Geographic Location: Berkshire County Region Western Massachusetts Region Central Massachusetts Region Greater Boston Region Northeastern Massachusetts Region Southeastern Massachusetts/Rhode Island RegionBy Field of Service: Srvcs & Adv: Children and youth Srvcs & Adv: Elderly, developmentally disabled Arts, culture, recreation Counseling, crisis interv, mental hlth, medicalBy Number of Employees: 11 - 25 26 - 50 51 -100 101 - 250 251+By Years of Experience Required: 2 - 3 Years 4 - 6 YearsBy Level of Education Required: High School Diploma Bachelor's Degree Credential/Certification/LicenseBy Gender of Employee: Male FemaleBy Race/Ethnicity of Employee: Black Hispanic or Latino WhiteBy Number of Years in Position: Up to 5 Years 5 - 10 Years 11 - 20 Years More than 20 YearsBy Number of Employees Managed: 1 to 3 4 to 8
56
-----------------241410
-----------------5
139
1199
-----------------101310
6-----------------
577
1421
-----------------1521
-----------------2016
5-----------------
507
-----------------57
45-----------------
281415
7-----------------
2316
75
-----------------271822
-----------------6
141418
914
-----------------142112
7-----------------
578
1637
-----------------2030
-----------------2718
5-----------------
677
-----------------58
60-----------------
331617
8-----------------
2519
$40,335
-------------------39,59940,24840,635
-------------------
41,22638,90045,184
36,681-------------------
40,27950,07434,166
-------------------
37,20940,560
-------------------35,62445,267
-------------------39,59944,875
-------------------39,923
-------------------
39,718-------------------
40,66034,84840,448
-------------------41,35941,400
$45,760
-----------------45,26148,94250,882
-----------------
46,08344,99652,234
40,326-----------------
44,07553,20736,801
-----------------
44,93848,017
-----------------41,52350,981
-----------------45,76049,629
-----------------45,344
-----------------
45,277-----------------
45,54240,70647,112
-----------------45,03252,000
$52,499
-----------------50,35754,60056,228
-----------------45,76051,00252,00058,65669,99246,426
-----------------49,34862,00544,51252,000
-----------------45,76053,56047,00857,81453,914
-----------------50,82556,244
-----------------53,56065,99950,003
-----------------52,02164,002
-----------------57,32553,83152,000
-----------------51,43864,25155,61954,174
-----------------47,50760,320
$67,995
-----------------64,00279,47770,798
-----------------
60,11776,54068,473
54,137-----------------
60,08671,60469,510
-----------------
73,65468,765
-----------------55,10468,473
-----------------60,00878,874
-----------------65,874
-----------------
69,056-----------------
57,57579,20773,996
-----------------54,60078,499
$82,260
-----------------75,94989,13086,674
-----------------
70,48188,46384,265
59,270-----------------
74,42382,36088,812
-----------------
85,56583,450
-----------------77,68481,266
-----------------84,88189,130
-----------------82,210
-----------------
83,795-----------------
75,34689,17690,264
-----------------83,03488,608
$57,023
-----------------54,50160,64161,074
-----------------49,04352,81659,34662,02270,61647,163
-----------------52,38364,57152,59359,016
-----------------44,59158,94552,46559,71158,713
-----------------51,83759,928
-----------------57,09164,92757,683
-----------------56,32363,006
-----------------59,56756,89356,788
-----------------52,97560,56360,60058,169
-----------------52,68863,641
25th %ile
Median (50%)
Avg by Org
75th %ile
Annual Base Salaries10th %ile
90th %ile
$57,579
-----------------55,37863,76863,256
-----------------49,69953,70759,50959,94970,61649,685
-----------------53,45863,18153,44361,225
-----------------44,59158,94553,42361,33560,119
-----------------53,41857,974
-----------------55,83065,32757,683
-----------------56,63263,006
-----------------59,56756,98557,335
-----------------53,28961,03060,46757,907
-----------------53,48865,727
Avg by Employee

660Maintenance and Grounds
Security Guard/OfficerPatrols organization premises to control access to those having legitimate business with the organization. Investigates unusual or suspicious situations. Maintains visitor and other records. Enforces organization policies and procedures during and after normal working hours. Escorts staff and clients to vehicles after hours. Assists in emergencies. May operate fire equipment and radios. May administer CPR and first aid. May act as reception and provide identification cards.
Valuing our Nonprofit Workforce 2014 Page 113
Number of Orgs Emps
All Organizations:
By Level of Education Required: High School DiplomaBy Gender of Employee: MaleBy Race/Ethnicity of Employee: WhiteBy Number of Years in Position: Up to 5 Years
9
-----------------5
-----------------7
-----------------7
-----------------7
37
-----------------19
-----------------25
-----------------27
-----------------21
$16,640
-------------------19,282
-------------------16,640
-------------------16,640
-------------------16,640
$18,221
-----------------19,843
-----------------19,282
-----------------17,160
-----------------16,900
$20,800
-----------------21,445
-----------------20,800
-----------------20,800
-----------------19,843
$27,082
-----------------29,120
-----------------25,907
-----------------23,462
-----------------21,175
$31,554
-----------------31,554
-----------------31,554
-----------------31,554
-----------------31,067
$22,560
-----------------24,554
-----------------22,977
-----------------22,382
-----------------21,127
25th %ile
Median (50%)
Avg by Org
75th %ile
Annual Base Salaries10th %ile
90th %ile
$23,610
-----------------26,643
-----------------24,398
-----------------23,944
-----------------23,384
Avg by Employee

Performs a wide variety of semi-skilled maintenance duties related to the organization's residential, program, and office facilities. Duties include: routine maintenance of office equipment, painting of facilities, routine plumbing (e.g. repair/replace leaking faucets, unplug blockages), light construction (e.g. shelves, door repair, replacing ceiling tiles), routine electrical (e.g. replace light switches and electric outlets, troubleshooting/repairing fuse outages), preventive maintenance (e.g. clean furnace and air conditioning screens, oil motors and moving parts) and similar activities.
665Maintenance and Grounds
© 2014 Third Sector New England & Nonprofit Compensation Associates
Maintenance Technician/Specialist
Page 114
Number of Orgs Emps
All Organizations:
By Budget Size: $2,500,000 - $9,999,999 $10,000,000 - $24,999,999 $25,000,000 and overBy Geographic Location: Berkshire County Region Western Massachusetts Region Central Massachusetts Region Greater Boston Region Northeastern Massachusetts Region Southeastern Massachusetts/Rhode Island RegionBy Field of Service: Srvcs & Adv: Children and youth Srvcs & Adv: Elderly, developmentally disabled Arts, culture, recreation Housing and homelessness prevention Counseling, crisis interv, mental hlth, medicalBy Number of Employees: 26 - 50 51 -100 101 - 250 251+By Years of Experience Required: 1 Year 2 - 3 Years 4 - 6 YearsBy Level of Education Required: High School Diploma Associate's Degree Bachelor's DegreeBy Gender of Employee: Male FemaleBy Race/Ethnicity of Employee: Black Hispanic or Latino WhiteBy Number of Years in Position: Up to 5 Years 5 - 10 Years 11 - 20 Years More than 20 YearsBy Number of Employees Managed: 1 to 3
66
-----------------212216
-----------------8
1510
91113
-----------------8
2110
512
-----------------86
2028
-----------------1925
5-----------------
4156
-----------------5911
-----------------9
1155
-----------------49272211
-----------------9
244
-----------------4750
139-----------------
225038632051
-----------------15
101213044
-----------------201653
151-----------------
64107
9-----------------
1846
13-----------------
21717
-----------------2242
168-----------------
111584815
-----------------12
$23,556
-------------------22,71425,78022,901
-------------------23,59221,22328,022
29,18720,388
-------------------26,54128,67522,40627,47918,096
-------------------27,641
27,02322,052
-------------------19,88527,514
-------------------24,055
-------------------25,55116,956
-------------------21,36023,20724,931
-------------------21,29122,77427,73328,321
-------------------24,394
$29,120
-----------------29,12029,06328,558
-----------------30,28527,04032,828
31,10624,211
-----------------28,37131,20030,73229,12025,563
-----------------29,339
31,33528,371
-----------------24,19530,722
-----------------28,912
-----------------29,99419,677
-----------------26,99327,36829,885
-----------------27,70628,75631,78235,942
-----------------31,579
$33,280
-----------------33,28033,50932,240
-----------------34,12332,20935,277
39,54129,994
-----------------35,79733,28034,00833,91531,013
-----------------33,894
34,32031,782
-----------------29,12033,28034,445
-----------------32,21933,208
-----------------33,86226,853
-----------------31,78231,78234,185
-----------------31,45033,59234,06043,680
-----------------35,308
$38,266
-----------------37,12840,11337,877
-----------------40,71637,19637,175
43,30136,608
-----------------39,99837,70036,69136,81638,688
-----------------38,839
43,16037,502
-----------------35,42837,274
-----------------37,518
-----------------38,74031,845
-----------------38,35534,73139,998
-----------------35,36037,79942,22447,299
-----------------39,998
$46,114
-----------------43,80148,70147,819
-----------------56,54342,55144,339
49,71044,421
-----------------50,66048,03144,73341,73143,108
-----------------41,492
51,41846,213
-----------------48,01741,629
-----------------46,114
-----------------46,40947,199
-----------------47,82738,08147,877
-----------------45,80641,81247,05462,217
-----------------54,040
$34,135
-----------------33,14635,12134,183
-----------------36,58932,06035,053
38,40631,444
-----------------35,97435,36433,60233,69031,282
-----------------33,991
36,86033,557
-----------------30,91134,29236,201
-----------------33,91432,109
-----------------34,83027,558
-----------------33,14531,37935,226
-----------------32,37033,81936,07343,225
-----------------36,348
25th %ile
Median (50%)
Avg by Org
75th %ile
Annual Base Salaries10th %ile
90th %ile
$35,413
-----------------32,66639,02034,853
-----------------33,77235,36735,03537,04438,59132,949
-----------------36,54834,60132,66535,50134,247
-----------------35,79230,55437,70235,131
-----------------32,30235,93237,023
-----------------34,79732,36935,927
-----------------36,15527,442
-----------------34,61430,64736,178
-----------------33,14034,41836,42543,027
-----------------36,721
Avg by Employee

670Maintenance and Grounds
DriverOperates vehicles such as cars, vans and pickup trucks to transport clients, materials, merchandise and equipment to assigned destinations. Loads/unloads vehicles as necessary. Cleans, services and maintains vehicles and performs minor repairs. May assist clients unable to enter or exit vehicle independently. A valid driver's license is required.
Valuing our Nonprofit Workforce 2014 Page 115
Number of Orgs Emps
All Organizations:
By Budget Size: $2,500,000 - $9,999,999 $10,000,000 - $24,999,999 $25,000,000 and overBy Geographic Location: Western Massachusetts Region Greater Boston Region Northeastern Massachusetts RegionBy Field of Service: Srvcs & Adv: Children and youth Srvcs & Adv: Elderly, developmentally disabledBy Number of Employees: 26 - 50 101 - 250 251+By Years of Experience Required: 1 Year 2 - 3 YearsBy Level of Education Required: High School DiplomaBy Gender of Employee: Male FemaleBy Race/Ethnicity of Employee: Black Hispanic or Latino WhiteBy Number of Years in Position: Up to 5 Years 5 - 10 Years 11 - 20 Years More than 20 Years
33
-----------------11
810
-----------------878
-----------------8
14-----------------
51012
-----------------89
-----------------20
-----------------3022
-----------------161130
-----------------271815
5
723
-----------------112146447
-----------------129353151
-----------------39
542-----------------
23227432
-----------------102
83-----------------
315-----------------
483233
-----------------114114475
-----------------442127
806
$20,114
-------------------16,640
-------------------16,640
-------------------19,469
-------------------19,24418,658
-------------------17,28516,640
-------------------17,160
-------------------
17,576-------------------
20,467
19,718-------------------
20,276
$22,485
-----------------16,640
-----------------17,160
-----------------20,467
-----------------20,01020,405
-----------------19,55216,640
-----------------20,946
-----------------
21,840-----------------
22,443
22,880-----------------
22,755
$27,040
-----------------20,467
-----------------20,114
-----------------20,800
-----------------25,68823,026
-----------------25,68820,114
-----------------23,338
-----------------
24,336-----------------
26,520
27,040-----------------
26,520
40,633
$32,240
-----------------22,990
-----------------20,686
-----------------32,968
-----------------31,36627,040
-----------------32,44820,946
-----------------27,040
-----------------
29,848-----------------
32,370
31,741-----------------
29,848
$36,192
-----------------32,968
-----------------22,485
-----------------35,880
-----------------37,46532,448
-----------------32,44830,676
-----------------32,448
-----------------
33,592-----------------
36,400
34,840-----------------
31,408
$27,445
-----------------22,013
-----------------19,734
-----------------26,157
-----------------25,97224,583
-----------------25,94520,930
-----------------24,443
-----------------
25,726-----------------
27,620
27,179-----------------
26,043
39,430
25th %ile
Median (50%)
Avg by Org
75th %ile
Annual Base Salaries10th %ile
90th %ile
$27,395
-----------------26,99932,09125,145
-----------------23,34532,27530,209
-----------------31,06125,072
-----------------28,92524,64328,848
-----------------26,26928,238
-----------------26,651
-----------------26,69925,657
-----------------23,65423,91827,926
-----------------25,14127,59328,88438,836
Avg by Employee

Cleans facilities and work areas including furnishings, bathrooms, fixtures, walls and floors to ensure they meet health and safety standards and present an attractive appearance. Uses maintenance supplies; removes waste material; maintains inventory of tools and supplies. May perform routine repair of equipment and facilities and load/unload deliveries.
675Maintenance and Grounds
© 2014 Third Sector New England & Nonprofit Compensation Associates
Janitor/Custodian
Page 116
Number of Orgs Emps
All Organizations:
By Budget Size: $1,000,000 - $2,499,999 $2,500,000 - $9,999,999 $10,000,000 - $24,999,999 $25,000,000 and overBy Geographic Location: Berkshire County Region Western Massachusetts Region Central Massachusetts Region Greater Boston Region Northeastern Massachusetts Region Southeastern Massachusetts/Rhode Island RegionBy Field of Service: Srvcs & Adv: Children and youth Srvcs & Adv: Elderly, developmentally disabled Arts, culture, recreation Counseling, crisis interv, mental hlth, medicalBy Number of Employees: 11 - 25 26 - 50 51 -100 101 - 250 251+By Years of Experience Required: 1 YearBy Level of Education Required: High School DiplomaBy Gender of Employee: Male FemaleBy Race/Ethnicity of Employee: Black Hispanic or Latino WhiteBy Number of Years in Position: Up to 5 Years 5 - 10 Years 11 - 20 Years
50
-----------------7
1711
9-----------------
51410
795
-----------------1113
55
-----------------675
1415
-----------------18
-----------------32
-----------------4122
-----------------121937
-----------------361520
212
-----------------25644175
-----------------165636193451
-----------------32443522
-----------------7
26106997
-----------------53
-----------------101
-----------------154
55-----------------
2339
135-----------------
1312733
$17,680
-------------------
18,72021,07017,144
-------------------
17,489
16,64016,640
-------------------18,13817,066
-------------------
18,72017,462
-------------------19,760
-------------------19,847
-------------------17,63618,545
-------------------16,64017,68017,680
-------------------17,68018,42218,458
$18,720
-----------------
18,72021,99619,094
-----------------
20,111
23,92018,460
-----------------21,03419,738
-----------------
18,72019,105
-----------------21,736
-----------------21,445
-----------------18,72018,720
-----------------18,72019,76018,720
-----------------18,72019,96819,843
$21,060
-----------------
20,19728,53820,800
-----------------
22,215
29,70220,800
-----------------23,40028,860
-----------------23,920
20,80021,736
-----------------25,542
-----------------26,749
-----------------21,67420,446
-----------------20,69622,36020,800
-----------------20,69626,74927,082
$28,538
-----------------
22,28733,02029,702
-----------------
28,538
31,47035,490
-----------------28,53831,704
-----------------
27,36329,702
-----------------29,411
-----------------30,764
-----------------28,55925,979
-----------------27,95528,93328,538
-----------------25,54230,49330,493
$32,793
-----------------
26,61438,18933,912
-----------------
30,759
34,32038,189
-----------------37,49635,464
-----------------
31,55435,360
-----------------34,632
-----------------35,526
-----------------34,15430,193
-----------------33,80431,13834,528
-----------------31,41635,93935,684
$23,726
-----------------
21,21828,48724,141
-----------------
23,573
27,50325,249
-----------------25,57826,740
-----------------24,999
23,45724,653
-----------------26,023
-----------------26,719
-----------------24,06722,631
-----------------22,85224,24123,997
-----------------22,59826,30326,313
25th %ile
Median (50%)
Avg by Org
75th %ile
Annual Base Salaries10th %ile
90th %ile
$25,139
-----------------23,82623,01129,14024,724
-----------------22,73024,52623,72326,64428,12324,619
-----------------24,48525,46626,78520,671
-----------------25,78522,02426,61824,77626,043
-----------------26,063
-----------------25,661
-----------------25,01624,057
-----------------23,99123,61225,520
-----------------24,84526,21525,596
Avg by Employee

702Medical & Clinic Services
Director, Medical ServicesProvides leadership and oversight to an organization's medical and health service programs. Provides direction, consultation and support to medical practitioners. Oversees quality assurance programs. Ensures compliance with medical risk management and health care related regulations and policies. Develops and implements in-service training programs for clinical programs and services staff. Develops policies and protocols to ensure quality client/patient services and care. May provide direct patient care (e.g. conduct physical examination, determine course of treatment, provide appropriate treatment, document patient files). Participates as a member of the senior management team in developing and implementing organization-wide policies and programs that contribute to its overall success. Requires state licensure as a Medical Doctor.
Valuing our Nonprofit Workforce 2014 Page 117
Number of Orgs Emps
All Organizations:
By Budget Size: $25,000,000 and overBy Field of Service: Counseling, crisis interv, mental hlth, medicalBy Number of Employees: 251+By Years of Experience Required: 4 - 6 YearsBy Level of Education Required: Medical DegreeBy Gender of Employee: MaleBy Race/Ethnicity of Employee: White
8
-----------------5
-----------------6
-----------------6
-----------------5
-----------------5
-----------------6
-----------------7
9
-----------------6
-----------------6
-----------------7
-----------------5
-----------------5
-----------------6
-----------------7
-------------------
-------------------
-------------------
-------------------
-------------------
-------------------
-------------------
-----------------
-----------------
-----------------
-----------------
-----------------
-----------------
-----------------
$250,016
-----------------262,507
-----------------243,641
-----------------250,016
-----------------260,000
-----------------227,282
-----------------243,641
-----------------260,000
-----------------
-----------------
-----------------
-----------------
-----------------
-----------------
-----------------
-----------------
-----------------
-----------------
-----------------
-----------------
-----------------
-----------------
$235,874
-----------------248,764
-----------------241,404
-----------------245,695
-----------------246,970
-----------------223,570
-----------------233,989
-----------------247,121
25th %ile
Median (50%)
Avg by Org
75th %ile
Annual Base Salaries10th %ile
90th %ile
$232,143
-----------------245,373
-----------------241,404
-----------------242,358
-----------------246,970
-----------------223,570
-----------------233,989
-----------------247,121
Avg by Employee

Provides direction and supervision of the day-to-day activities of the clinic's medical programs. Manages, implements and monitors quality assurance programs. Develops and implements programs to retain volunteers and clinical staff. Implements credentialing, re-credentialing and in-service training programs. Assists in long- and short-term planning.
704Medical & Clinic Services
© 2014 Third Sector New England & Nonprofit Compensation Associates
Clinic Director
Page 118
Number of Orgs Emps
All Organizations:
By Budget Size: $2,500,000 - $9,999,999 $10,000,000 - $24,999,999By Geographic Location: Western Massachusetts RegionBy Field of Service: Srvcs & Adv: Elderly, developmentally disabled Counseling, crisis interv, mental hlth, medicalBy Number of Employees: 101 - 250 251+By Years of Experience Required: 4 - 6 YearsBy Level of Education Required: LCSW/LICSW/MFT/MFCCBy Gender of Employee: FemaleBy Race/Ethnicity of Employee: WhiteBy Number of Years in Position: Up to 5 Years 5 - 10 YearsBy Number of Employees Managed: 15 and over
16
-----------------66
-----------------6
-----------------56
-----------------58
-----------------7
-----------------6
-----------------11
-----------------15
-----------------11
5-----------------
7
25
-----------------77
-----------------10
-----------------6
14-----------------
615
-----------------9
-----------------14
-----------------20
-----------------23
-----------------17
6-----------------
12
$53,231
-------------------
-------------------
-------------------
51,584-------------------
52,333-------------------
-------------------51,584
-------------------52,794
-------------------54,546
-------------------54,887
-------------------57,198
$59,176
-----------------
-----------------
-----------------
55,391-----------------
58,344-----------------
-----------------55,391
-----------------57,034
-----------------60,008
-----------------60,008
-----------------60,008
$64,480
-----------------64,48093,122
-----------------63,492
-----------------80,15360,008
-----------------84,03262,504
-----------------82,035
-----------------60,008
-----------------62,775
-----------------64,480
-----------------67,99564,480
-----------------84,084
$84,084
-----------------
-----------------
-----------------
64,283-----------------
79,098-----------------
-----------------64,927
-----------------81,301
-----------------86,133
-----------------89,596
-----------------94,885
$96,886
-----------------
-----------------
-----------------
80,567-----------------
95,876-----------------
-----------------87,007
-----------------95,231
-----------------97,594
-----------------99,208
-----------------99,707
$71,116
-----------------66,55488,976
-----------------65,510
-----------------79,63361,599
-----------------83,53367,652
-----------------78,672
-----------------62,703
-----------------68,914
-----------------72,150
-----------------72,78367,985
-----------------78,946
25th %ile
Median (50%)
Avg by Org
75th %ile
Annual Base Salaries10th %ile
90th %ile
$76,318
-----------------68,53888,095
-----------------69,380
-----------------76,70666,640
-----------------81,38675,862
-----------------79,876
-----------------69,217
-----------------74,680
-----------------77,004
-----------------80,35770,651
-----------------87,753
Avg by Employee

712Medical & Clinic Services
Director of NursingManages patient care services. Ensures high quality delivery of nursing care and compliance with clinic policies, government regulations and accreditation standards. Supervises/utilizes professional, technical and support nursing staff. Oversees the development and implementation of patient care goals and objectives. Position typically requires a state Registered Nurse's license, and a Bachelor's or Master's degree in a related discipline.
Valuing our Nonprofit Workforce 2014 Page 119
Number of Orgs Emps
All Organizations:
By Budget Size: $10,000,000 - $24,999,999 $25,000,000 and overBy Geographic Location: Central Massachusetts Region Northeastern Massachusetts RegionBy Field of Service: Srvcs & Adv: Elderly, developmentally disabledBy Number of Employees: 101 - 250 251+By Years of Experience Required: 2 - 3 Years 4 - 6 YearsBy Level of Education Required: Nursing: RN/NPBy Gender of Employee: FemaleBy Race/Ethnicity of Employee: WhiteBy Number of Years in Position: Up to 5 YearsBy Number of Employees Managed: 4 to 8 9 to 14
20
-----------------99
-----------------55
-----------------17
-----------------7
13-----------------
88
-----------------14
-----------------18
-----------------17
-----------------11
-----------------66
23
-----------------1011
-----------------57
-----------------18
-----------------7
16-----------------
99
-----------------17
-----------------21
-----------------19
-----------------14
-----------------66
$63,906
-------------------
-------------------
-------------------62,729
-------------------
64,089-------------------
-------------------61,796
-------------------63,784
-------------------64,272
-------------------63,967
-------------------
$70,720
-----------------
-----------------
-----------------68,494
-----------------
69,534-----------------
-----------------70,647
-----------------69,930
-----------------70,949
-----------------68,494
-----------------
$79,310
-----------------81,85877,501
-----------------79,99780,000
-----------------76,253
-----------------80,26776,253
-----------------79,31075,005
-----------------79,310
-----------------77,501
-----------------79,310
-----------------76,253
-----------------79,65482,203
$84,406
-----------------
-----------------
-----------------83,736
-----------------
82,401-----------------
-----------------84,874
-----------------83,804
-----------------84,406
-----------------80,800
-----------------
$92,706
-----------------
-----------------
-----------------93,852
-----------------
93,180-----------------
-----------------94,207
-----------------91,936
-----------------93,496
-----------------88,951
-----------------
$77,373
-----------------77,96776,810
-----------------77,83078,499
-----------------76,360
-----------------78,47276,892
-----------------76,81277,197
-----------------77,433
-----------------76,607
-----------------77,781
-----------------75,926
-----------------79,61282,802
25th %ile
Median (50%)
Avg by Org
75th %ile
Annual Base Salaries10th %ile
90th %ile
$77,810
-----------------79,21876,472
-----------------77,83078,566
-----------------76,928
-----------------78,47277,454
-----------------78,07677,159
-----------------78,071
-----------------76,965
-----------------78,449
-----------------76,326
-----------------79,61282,802
Avg by Employee

Assesses patient's condition. Plans and provides professional nursing care to clinic patients. Performs medical examinations, evaluates and documents progress and provides health care instruction to patients. May dispense and administer medications. May provide leadership within areas of expertise and/or provide direct supervision to para-professionals and support staff. Position requires a current Registered Nurse's license.
714Medical & Clinic Services
© 2014 Third Sector New England & Nonprofit Compensation Associates
Registered Nurse
Page 120
Number of Orgs Emps
All Organizations:
By Budget Size: $2,500,000 - $9,999,999 $10,000,000 - $24,999,999 $25,000,000 and overBy Geographic Location: Berkshire County Region Western Massachusetts Region Central Massachusetts Region Greater Boston Region Northeastern Massachusetts Region Southeastern Massachusetts/Rhode Island RegionBy Field of Service: Srvcs & Adv: Children and youth Srvcs & Adv: Elderly, developmentally disabled Counseling, crisis interv, mental hlth, medicalBy Number of Employees: 101 - 250 251+By Years of Experience Required: 1 Year 2 - 3 Years 4 - 6 YearsBy Level of Education Required: Bachelor's Degree Nursing: RN/NPBy Gender of Employee: Male FemaleBy Race/Ethnicity of Employee: Black Hispanic or Latino WhiteBy Number of Years in Position: Up to 5 Years 5 - 10 Years 11 - 20 Years More than 20 YearsBy Number of Employees Managed: 1 to 3 4 to 8
58
-----------------162316
-----------------6
138
101011
-----------------7
3314
-----------------2129
-----------------1427
9-----------------
833
-----------------1352
-----------------15
850
-----------------482613
7-----------------
147
441
-----------------44
129264
-----------------38
11975319979
-----------------19
277133
-----------------123304
-----------------123155
19-----------------
75255
-----------------22
377-----------------
4016
333-----------------
265532811
-----------------17
8
$46,800
-------------------46,08344,38747,382
-------------------41,74647,768
52,19252,00047,840
-------------------40,64347,38245,835
-------------------47,38246,800
-------------------47,45747,49542,786
-------------------47,57046,800
-------------------47,42446,800
-------------------47,76849,47746,800
-------------------47,38246,62145,772
-------------------48,897
$51,232
-----------------50,96050,58652,000
-----------------44,06550,586
60,63253,04053,914
-----------------47,13350,64152,000
-----------------50,58652,000
-----------------54,08051,93850,440
-----------------52,00051,189
-----------------52,59350,842
-----------------52,13052,05750,745
-----------------52,00053,49853,602
-----------------54,663
$55,328
-----------------53,30054,99555,328
-----------------49,92054,309
63,96855,43255,328
-----------------53,35255,32856,160
-----------------55,32855,765
-----------------55,32854,99553,248
-----------------55,97355,328
-----------------55,93155,141
-----------------54,08054,89155,328
-----------------55,32858,53161,76668,286
-----------------61,36062,338
$62,400
-----------------60,37462,40062,400
-----------------52,13059,925
71,58562,92060,320
-----------------59,53062,40062,400
-----------------60,63262,400
-----------------60,92362,40065,770
-----------------64,27262,088
-----------------62,40062,400
-----------------60,55458,24062,400
-----------------62,26564,41169,757
-----------------65,250
$70,716
-----------------67,54869,68071,548
-----------------54,49666,726
82,17371,40669,992
-----------------72,00170,52072,734
-----------------69,72671,592
-----------------74,48568,81580,350
-----------------70,10870,707
-----------------70,98270,757
-----------------74,31776,20169,955
-----------------70,70769,75571,735
-----------------70,067
$57,153
-----------------55,59156,52257,697
-----------------49,18756,369
64,91658,68957,333
-----------------55,85157,13657,868
-----------------56,14957,670
-----------------57,39756,55758,337
-----------------58,12357,044
-----------------56,94056,959
-----------------56,87657,61956,949
-----------------56,95458,81561,11168,181
-----------------59,98061,878
25th %ile
Median (50%)
Avg by Org
75th %ile
Annual Base Salaries10th %ile
90th %ile
$58,493
-----------------57,39959,15158,297
-----------------48,31857,21659,40164,83560,54557,259
-----------------54,05760,04257,732
-----------------58,90158,766
-----------------56,37558,00261,528
-----------------60,86057,706
-----------------57,38457,763
-----------------56,47159,17657,046
-----------------57,91357,91359,37669,872
-----------------59,62661,287
Avg by Employee

716Medical & Clinic Services
Nurse PractitionerProvides primary care to clinic patients including taking histories, performing physical examinations, conducting laboratory tests and diagnosing and determining/providing appropriate treatment for common illnesses and injuries. Prescribes medications with furnishing license. Performs duties independently within the scope and limitations of licensure. Position requires a Master's degree in nursing and advanced education in providing primary care of patients.
Valuing our Nonprofit Workforce 2014 Page 121
Number of Orgs Emps
All Organizations:
By Budget Size: $25,000,000 and overBy Field of Service: Counseling, crisis interv, mental hlth, medicalBy Number of Employees: 251+By Years of Experience Required: 2 - 3 YearsBy Level of Education Required: Nursing: RN/NPBy Gender of Employee: FemaleBy Race/Ethnicity of Employee: WhiteBy Number of Years in Position: Up to 5 Years
10
-----------------6
-----------------5
-----------------6
-----------------5
-----------------5
-----------------10
-----------------9
-----------------9
37
-----------------27
-----------------25
-----------------27
-----------------14
-----------------21
-----------------35
-----------------31
-----------------28
$82,160
-------------------94,232
-------------------91,474
-------------------94,232
-------------------
-------------------97,726
-------------------81,120
-------------------83,200
-------------------83,200
$97,354
-----------------100,006
-----------------100,006
-----------------100,006
-----------------
-----------------102,003
-----------------96,990
-----------------96,990
-----------------100,006
$106,662
-----------------116,688
-----------------108,160
-----------------116,688
-----------------
-----------------108,160
-----------------106,246
-----------------106,662
-----------------117,780
$131,061
-----------------135,200
-----------------140,400
-----------------135,200
-----------------
-----------------140,400
-----------------124,800
-----------------135,200
-----------------135,980
$156,000
-----------------147,680
-----------------156,000
-----------------147,680
-----------------
-----------------156,000
-----------------156,000
-----------------153,920
-----------------156,000
$111,968
-----------------116,263
-----------------117,368
-----------------116,263
-----------------
-----------------118,506
-----------------110,046
-----------------113,285
-----------------117,452
25th %ile
Median (50%)
Avg by Org
75th %ile
Annual Base Salaries10th %ile
90th %ile
$109,270
-----------------117,349
-----------------120,331
-----------------117,349
-----------------109,724
-----------------118,143
-----------------108,590
-----------------115,809
-----------------117,376
Avg by Employee

Interviews patients and documents patient histories. Assists physicians in examinations. Provides treatment in accordance with physician's instructions, administers medications, draws blood and provides health care instruction to patients. Requires state licensure as a Licensed Vocational Nurse.
720Medical & Clinic Services
© 2014 Third Sector New England & Nonprofit Compensation Associates
Licensed Vocational Nurse
Page 122
Number of Orgs Emps
All Organizations:
By Budget Size: $10,000,000 - $24,999,999 $25,000,000 and overBy Geographic Location: Western Massachusetts RegionBy Field of Service: Srvcs & Adv: Elderly, developmentally disabledBy Number of Employees: 101 - 250 251+By Years of Experience Required: 1 Year 2 - 3 YearsBy Level of Education Required: Nursing: LVN/LPNBy Gender of Employee: Male FemaleBy Race/Ethnicity of Employee: Black WhiteBy Number of Years in Position: Up to 5 Years 5 - 10 Years 11 - 20 Years
19
-----------------78
-----------------5
-----------------14
-----------------6
13-----------------
78
-----------------13
-----------------6
18-----------------
916
-----------------16
97
189
-----------------46
132-----------------
23-----------------
159-----------------
18171
-----------------6811
-----------------132
-----------------25
131-----------------
31116
-----------------953422
$40,123
-------------------
-------------------39,000
-------------------41,600
-------------------37,10342,744
-------------------40,518
-------------------
-------------------
39,520-------------------
43,888
-------------------39,37941,12241,349
$44,720
-----------------
-----------------41,784
-----------------45,032
-----------------37,98645,760
-----------------46,280
-----------------
-----------------
43,680-----------------
46,904
-----------------42,64047,32047,268
$47,715
-----------------
-----------------45,677
-----------------47,507
-----------------39,37548,360
-----------------47,77843,680
-----------------
-----------------
47,424-----------------
47,840
-----------------47,32050,54449,283
$53,206
-----------------
-----------------52,000
-----------------53,206
-----------------43,00453,206
-----------------53,206
-----------------
-----------------
52,000-----------------
53,206
-----------------53,20653,35251,334
$54,000
-----------------
-----------------56,493
-----------------54,080
-----------------64,39753,974
-----------------53,206
-----------------
-----------------
53,976-----------------
53,206
-----------------54,03253,56054,870
$48,290
-----------------
-----------------46,877
-----------------48,524
-----------------42,22148,929
-----------------48,50145,106
-----------------
-----------------
47,779-----------------
49,458
-----------------47,68450,05749,044
25th %ile
Median (50%)
Avg by Org
75th %ile
Annual Base Salaries10th %ile
90th %ile
$46,424
-----------------46,98748,478
-----------------44,295
-----------------47,106
-----------------44,16347,468
-----------------45,87344,146
-----------------47,929
-----------------47,73646,220
-----------------46,39146,611
-----------------47,04850,03646,293
Avg by Employee

722Medical & Clinic Services
Medical AssistantMeets with patient to take history, check and record vital signs. Ensures physician or nurse has needed supplies, instruments and equipment. Sterilizes/cleans equipment, prepares/sets-up treatment rooms, ensures treatment rooms are maintained in a clean and orderly manner and assists physicians and nurses in providing treatment. Requires technical school certification as a medical assistant and/or equivalent working experience.
Valuing our Nonprofit Workforce 2014 Page 123
Number of Orgs Emps
All Organizations:
By Level of Education Required: Credential/Certification/LicenseBy Gender of Employee: FemaleBy Race/Ethnicity of Employee: Black WhiteBy Number of Years in Position: Up to 5 Years
9
-----------------7
-----------------8
-----------------57
-----------------7
98
-----------------87
-----------------86
-----------------1063
-----------------53
-------------------
-------------------
-------------------
-------------------22,880
-----------------
-----------------
-----------------
-----------------23,920
-----------------
-----------------
-----------------
-----------------27,352
-----------------
-----------------
-----------------
-----------------29,120
-----------------
-----------------
-----------------
-----------------31,616
-----------------
-----------------
-----------------
-----------------27,226
25th %ile
Median (50%)
Avg by Org
75th %ile
Annual Base Salaries10th %ile
90th %ile
$29,225
-----------------28,973
-----------------29,520
-----------------29,85129,746
-----------------28,816
Avg by Employee
Facilitates and actively participates in the delivery of psycho-social and health-related services for clients of the clinic. Assesses needs of individuals for family planning, health risk education, HIV counseling, pregnancy education, psychological services, medical or dental care, and/or social services. etc. Determines eligibility for various services and links/assists clients to obtaining various services within and/or outside of the clinic. Maintains accurate and complete records and participates in case conferences. Typically, this position requires a Bachelor's Degree (or equivalent) in social services or health field and Community Health Worker certification.
740Case Manager, Medical
Number of Orgs Emps
All Organizations:
By Budget Size: $10,000,000 - $24,999,999By Gender of Employee: FemaleBy Race/Ethnicity of Employee: White
6
-----------------5
-----------------6
-----------------6
19
-----------------17
-----------------18
-----------------19
$29,120
-------------------27,964
-------------------28,542
-------------------29,120
$33,280
-----------------31,491
-----------------32,386
-----------------33,280
$47,320
-----------------47,320
-----------------47,320
-----------------47,320
$52,000
-----------------51,262
-----------------52,016
-----------------52,000
$52,062
-----------------52,062
-----------------54,356
-----------------52,062
$44,747
-----------------42,755
-----------------44,622
-----------------44,747
25th %ile
Median (50%)
Avg by Org
75th %ile
Annual Base Salaries10th %ile
90th %ile
$45,386
-----------------42,126
-----------------45,802
-----------------45,386
Avg by Employee
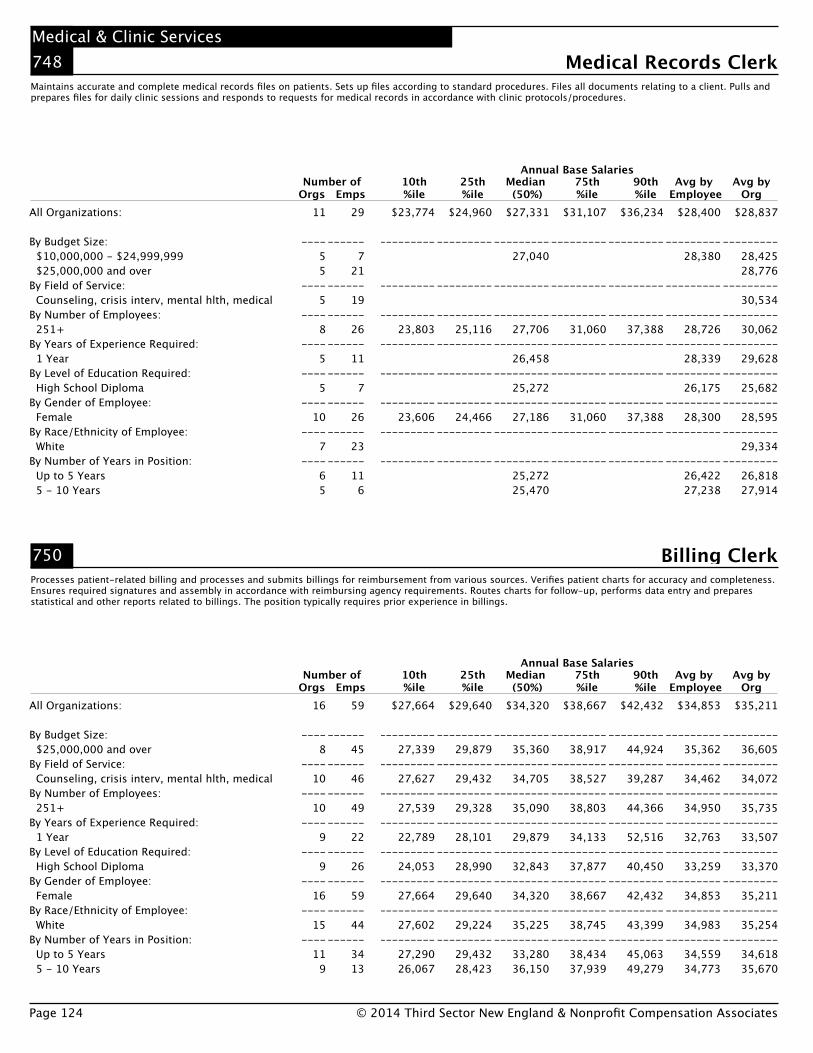
Maintains accurate and complete medical records files on patients. Sets up files according to standard procedures. Files all documents relating to a client. Pulls and prepares files for daily clinic sessions and responds to requests for medical records in accordance with clinic protocols/procedures.
748Medical & Clinic Services
© 2014 Third Sector New England & Nonprofit Compensation Associates
Medical Records Clerk
Page 124
Number of Orgs Emps
All Organizations:
By Budget Size: $10,000,000 - $24,999,999 $25,000,000 and overBy Field of Service: Counseling, crisis interv, mental hlth, medicalBy Number of Employees: 251+By Years of Experience Required: 1 YearBy Level of Education Required: High School DiplomaBy Gender of Employee: FemaleBy Race/Ethnicity of Employee: WhiteBy Number of Years in Position: Up to 5 Years 5 - 10 Years
11
-----------------55
-----------------5
-----------------8
-----------------5
-----------------5
-----------------10
-----------------7
-----------------65
29
-----------------7
21-----------------
19-----------------
26-----------------
11-----------------
7-----------------
26-----------------
23-----------------
116
$23,774
-------------------
-------------------
-------------------23,803
-------------------
-------------------
-------------------23,606
-------------------
-------------------
$24,960
-----------------
-----------------
-----------------25,116
-----------------
-----------------
-----------------24,466
-----------------
-----------------
$27,331
-----------------27,040
-----------------
-----------------27,706
-----------------26,458
-----------------25,272
-----------------27,186
-----------------
-----------------25,27225,470
$31,107
-----------------
-----------------
-----------------31,060
-----------------
-----------------
-----------------31,060
-----------------
-----------------
$36,234
-----------------
-----------------
-----------------37,388
-----------------
-----------------
-----------------37,388
-----------------
-----------------
$28,400
-----------------28,380
-----------------
-----------------28,726
-----------------28,339
-----------------26,175
-----------------28,300
-----------------
-----------------26,42227,238
25th %ile
Median (50%)
Avg by Org
75th %ile
Annual Base Salaries10th %ile
90th %ile
$28,837
-----------------28,42528,776
-----------------30,534
-----------------30,062
-----------------29,628
-----------------25,682
-----------------28,595
-----------------29,334
-----------------26,81827,914
Avg by Employee
Processes patient-related billing and processes and submits billings for reimbursement from various sources. Verifies patient charts for accuracy and completeness. Ensures required signatures and assembly in accordance with reimbursing agency requirements. Routes charts for follow-up, performs data entry and prepares statistical and other reports related to billings. The position typically requires prior experience in billings.
750
Number of Orgs Emps
Billing Clerk
All Organizations:
By Budget Size: $25,000,000 and overBy Field of Service: Counseling, crisis interv, mental hlth, medicalBy Number of Employees: 251+By Years of Experience Required: 1 YearBy Level of Education Required: High School DiplomaBy Gender of Employee: FemaleBy Race/Ethnicity of Employee: WhiteBy Number of Years in Position: Up to 5 Years 5 - 10 Years
16
-----------------8
-----------------10
-----------------10
-----------------9
-----------------9
-----------------16
-----------------15
-----------------11
9
59
-----------------45
-----------------46
-----------------49
-----------------22
-----------------26
-----------------59
-----------------44
-----------------3413
$27,664
-------------------27,339
-------------------27,627
-------------------27,539
-------------------22,789
-------------------24,053
-------------------27,664
-------------------27,602
-------------------27,29026,067
$29,640
-----------------29,879
-----------------29,432
-----------------29,328
-----------------28,101
-----------------28,990
-----------------29,640
-----------------29,224
-----------------29,43228,423
$34,320
-----------------35,360
-----------------34,705
-----------------35,090
-----------------29,879
-----------------32,843
-----------------34,320
-----------------35,225
-----------------33,28036,150
$38,667
-----------------38,917
-----------------38,527
-----------------38,803
-----------------34,133
-----------------37,877
-----------------38,667
-----------------38,745
-----------------38,43437,939
$42,432
-----------------44,924
-----------------39,287
-----------------44,366
-----------------52,516
-----------------40,450
-----------------42,432
-----------------43,399
-----------------45,06349,279
$34,853
-----------------35,362
-----------------34,462
-----------------34,950
-----------------32,763
-----------------33,259
-----------------34,853
-----------------34,983
-----------------34,55934,773
25th %ile
Median (50%)
Avg by Org
75th %ile
Annual Base Salaries10th %ile
90th %ile
$35,211
-----------------36,605
-----------------34,072
-----------------35,735
-----------------33,507
-----------------33,370
-----------------35,211
-----------------35,254
-----------------34,61835,670
Avg by Employee

752Medical & Clinic Services
Receptionist, MedicalReceives and registers patients. Makes and cancels appointments. Provides referrals to other departments or services. Helps walk-in patients obtain appropriate appointments or services, facilitates patient flow and assists patients to complete required documents. Receptionists working outside of Medical Services Programs are reported under Receptionist in Administrative Positions in (090).
Valuing our Nonprofit Workforce 2014 Page 125
Number of Orgs Emps
All Organizations:
By Number of Employees: 251+By Level of Education Required: High School DiplomaBy Gender of Employee: FemaleBy Race/Ethnicity of Employee: WhiteBy Number of Years in Position: Up to 5 Years
8
-----------------6
-----------------6
-----------------8
-----------------8
-----------------8
62
-----------------30
-----------------38
-----------------58
-----------------40
-----------------43
$22,911
-------------------23,076
-------------------23,808
-------------------22,811
-------------------20,939
-------------------21,632
$24,721
-----------------23,915
-----------------24,721
-----------------24,700
-----------------23,899
-----------------24,960
$26,790
-----------------26,291
-----------------26,790
-----------------26,790
-----------------26,790
-----------------28,080
$29,136
-----------------31,819
-----------------28,912
-----------------29,011
-----------------29,167
-----------------29,182
$36,192
-----------------36,881
-----------------30,828
-----------------34,971
-----------------36,492
-----------------33,434
$27,516
-----------------28,289
-----------------27,212
-----------------27,322
-----------------27,389
-----------------27,708
25th %ile
Median (50%)
Avg by Org
75th %ile
Annual Base Salaries10th %ile
90th %ile
$28,996
-----------------29,675
-----------------26,999
-----------------28,966
-----------------29,137
-----------------29,040
Avg by Employee
Under the direction of a physician, works with clients to overcome disabilities through therapeutic exercise, massage and other methods. Responsibilities include reviewing and evaluating patients' conditions and medical records, performing tests or measurements, developing programs for treatment plans, and helping patients attain maximum muscle strength and motor skills as well as accepting and adjusting to any limiting effects of their disabilities.
761Physical Therapist
Number of Orgs Emps
All Organizations:
By Field of Service: Srvcs & Adv: Elderly, developmentally disabledBy Number of Employees: 251+By Level of Education Required: Credential/Certification/LicenseBy Gender of Employee: FemaleBy Race/Ethnicity of Employee: WhiteBy Number of Years in Position: Up to 5 Years
12
-----------------9
-----------------7
-----------------8
-----------------11
-----------------11
-----------------10
41
-----------------34
-----------------17
-----------------15
-----------------32
-----------------34
-----------------30
$56,272
-------------------57,200
-------------------64,592
-------------------55,041
-------------------54,704
-------------------55,120
-------------------54,288
$60,820
-----------------62,067
-----------------69,680
-----------------60,008
-----------------60,065
-----------------60,180
-----------------60,180
$79,040
-----------------76,511
-----------------80,600
-----------------80,600
-----------------79,820
-----------------79,820
-----------------67,600
$104,000
-----------------96,200
-----------------111,987
-----------------119,974
-----------------104,000
-----------------104,520
-----------------93,600
$118,859
-----------------112,362
-----------------141,440
-----------------147,680
-----------------118,302
-----------------127,587
-----------------113,568
$82,909
-----------------80,155
-----------------92,654
-----------------95,160
-----------------82,099
-----------------84,027
-----------------76,743
25th %ile
Median (50%)
Avg by Org
75th %ile
Annual Base Salaries10th %ile
90th %ile
$94,700
-----------------93,674
-----------------99,632
-----------------98,365
-----------------94,733
-----------------96,101
-----------------85,254
Avg by Employee

Under the direction of a physician, works with mentally, emotionally and physically disabled clients to gain self-sufficiency. Designs programs that include educational, vocational and rehabilitative activities. Helps clients re-learn daily living routines, designs special equipment to help clients perform tasks, directs activities that help clients perform tasks.
762Medical & Clinic Services
© 2014 Third Sector New England & Nonprofit Compensation Associates
Occupational Therapist
Page 126
Number of Orgs Emps
All Organizations:
By Budget Size: $10,000,000 - $24,999,999 $25,000,000 and overBy Field of Service: Srvcs & Adv: Elderly, developmentally disabled Counseling, crisis interv, mental hlth, medicalBy Number of Employees: 101 - 250 251+By Years of Experience Required: 1 Year 2 - 3 YearsBy Level of Education Required: Bachelor's Degree Credential/Certification/LicenseBy Gender of Employee: FemaleBy Race/Ethnicity of Employee: WhiteBy Number of Years in Position: Up to 5 YearsBy Number of Employees Managed: 1 to 3
18
-----------------76
-----------------10
7-----------------
610
-----------------55
-----------------59
-----------------17
-----------------17
-----------------14
-----------------5
62
-----------------3119
-----------------4021
-----------------2831
-----------------34
7-----------------
626
-----------------56
-----------------55
-----------------45
-----------------5
$49,202
-------------------
41,600-------------------
54,13241,683
-------------------
43,813-------------------
51,636
-------------------
47,482-------------------
46,931-------------------
46,288-------------------
50,552-------------------
$54,907
-----------------
52,000-----------------
60,03949,931
-----------------
56,160-----------------
55,869
-----------------
54,907-----------------
54,730-----------------
54,600-----------------
56,202-----------------
$67,870
-----------------
58,240-----------------
82,16056,160
-----------------
67,870-----------------
83,20060,008
-----------------46,67575,518
-----------------66,238
-----------------64,605
-----------------79,040
-----------------78,090
$93,600
-----------------
93,600-----------------
93,60080,645
-----------------
93,600-----------------
93,600
-----------------
94,900-----------------
93,600-----------------
93,600-----------------
93,600-----------------
$104,000
-----------------
98,800-----------------
111,12293,600
-----------------
97,760-----------------
109,200
-----------------
112,580-----------------
104,000-----------------
104,000-----------------
104,000-----------------
$74,174
-----------------
68,762-----------------
80,59163,059
-----------------
72,131-----------------
78,56361,955
-----------------60,31776,720
-----------------73,068
-----------------72,723
-----------------76,378
-----------------84,387
25th %ile
Median (50%)
Avg by Org
75th %ile
Annual Base Salaries10th %ile
90th %ile
$72,401
-----------------69,33077,413
-----------------82,01361,739
-----------------72,90777,328
-----------------83,83067,823
-----------------64,01874,391
-----------------71,415
-----------------71,239
-----------------70,499
-----------------84,387
Avg by Employee

763Medical & Clinic Services
Speech PathologistHelps children and adults with language and hearing disorders develop the communication skills needed for self expression, social interaction, academic success, and employment. Diagnoses and treats such disorders as stuttering, delayed or impaired language, and voice and speaking problems. Observes and tests speech, language, hearing, and perception.
Valuing our Nonprofit Workforce 2014 Page 127
Number of Orgs Emps
All Organizations:
By Budget Size: $10,000,000 - $24,999,999 $25,000,000 and overBy Field of Service: Srvcs & Adv: Elderly, developmentally disabledBy Number of Employees: 251+By Level of Education Required: Master's Degree Credential/Certification/LicenseBy Gender of Employee: FemaleBy Race/Ethnicity of Employee: WhiteBy Number of Years in Position: Up to 5 Years
14
-----------------75
-----------------8
-----------------10
-----------------66
-----------------12
-----------------13
-----------------10
53
-----------------3016
-----------------36
-----------------23
-----------------2822
-----------------48
-----------------49
-----------------39
$54,080
-------------------
-------------------
-------------------57,000
-------------------
53,802-------------------
54,080-------------------
54,080-------------------
54,080
$58,240
-----------------
-----------------
-----------------62,400
-----------------
61,802-----------------
58,240-----------------
57,616-----------------
56,992
$64,480
-----------------
-----------------
-----------------70,720
-----------------
79,373-----------------
62,983-----------------
62,733-----------------
62,400
$92,560
-----------------
-----------------
-----------------91,520
-----------------
104,000-----------------
93,600-----------------
92,560-----------------
93,600
$104,000
-----------------
-----------------
-----------------124,800
-----------------
124,800-----------------
106,080-----------------
104,000-----------------
124,800
$73,543
-----------------
-----------------
-----------------80,488
-----------------
84,213-----------------
73,572-----------------
72,818-----------------
72,399
25th %ile
Median (50%)
Avg by Org
75th %ile
Annual Base Salaries10th %ile
90th %ile
$78,379
-----------------72,61590,739
-----------------72,874
-----------------83,607
-----------------63,20091,084
-----------------77,941
-----------------78,078
-----------------77,455
Avg by Employee

Responsible for managing a gift/thrift shop consistent with the organization's goals and efforts to realize reasonable profits. For a gift shop, plans and purchases a mix of merchandise that will sell profitably. For a thrift shop, evaluates sale patterns to determine customer preferences and procures additional items for sale. Receives, checks and shelves inventory. Maintains attractive displays of merchandise and ensures that the store is maintained in a clean, neat and attractive manner. Supervises retail clerks and volunteers who staff the shop. Provides training and guidance for employees and volunteers to ensure that they maintain high levels of customer service, promotions and sale of products. Maintains financial and other records. Monitors budgets. Promotes the store throughout the community.
805Retail Gift/Thrift Shop
© 2014 Third Sector New England & Nonprofit Compensation Associates
Gift/Thrift Shop Manager
Page 128
Number of Orgs Emps
All Organizations:
By Field of Service: Arts, culture, recreationBy Years of Experience Required: 2 - 3 YearsBy Level of Education Required: Bachelor's DegreeBy Gender of Employee: FemaleBy Race/Ethnicity of Employee: WhiteBy Number of Years in Position: Up to 5 YearsBy Number of Employees Managed: 1 to 3
11
-----------------6
-----------------7
-----------------6
-----------------8
-----------------10
-----------------6
-----------------8
11
-----------------6
-----------------7
-----------------6
-----------------8
-----------------10
-----------------6
-----------------8
-------------------
-------------------
-------------------
-------------------
-------------------
-------------------
-------------------
-----------------
-----------------
-----------------
-----------------
-----------------
-----------------
-----------------
$41,762
-----------------40,425
-----------------52,000
-----------------41,151
-----------------43,990
-----------------41,151
-----------------38,262
-----------------41,151
-----------------
-----------------
-----------------
-----------------
-----------------
-----------------
-----------------
-----------------
-----------------
-----------------
-----------------
-----------------
-----------------
-----------------
$44,986
-----------------44,411
-----------------47,400
-----------------44,615
-----------------46,308
-----------------43,767
-----------------42,047
-----------------45,081
25th %ile
Median (50%)
Avg by Org
75th %ile
Annual Base Salaries10th %ile
90th %ile
$44,986
-----------------44,411
-----------------47,400
-----------------44,615
-----------------46,308
-----------------43,767
-----------------42,047
-----------------45,081
Avg by Employee
Checks, shelves and prices stock. Maintains store in a neat, attractive manner. Provides service to customers, helping them locate needed items, operating cash register and credit card machine to take money and make change, wrapping and bagging merchandise.
810
Number of Orgs Emps
Gift/Thrift Shop Retail Sales Clerk
All Organizations:
By Field of Service: Arts, culture, recreationBy Years of Experience Required: 2 - 3 YearsBy Level of Education Required: High School DiplomaBy Gender of Employee: FemaleBy Race/Ethnicity of Employee: WhiteBy Number of Years in Position: Up to 5 Years
10
-----------------6
-----------------5
-----------------8
-----------------9
-----------------8
-----------------8
45
-----------------38
-----------------7
-----------------41
-----------------42
-----------------41
-----------------25
-------------------
-------------------
-------------------
-------------------
-------------------
-------------------
-----------------
-----------------
-----------------
-----------------
-----------------
-----------------
-----------------
-----------------32,774
-----------------
-----------------
-----------------
-----------------
-----------------
-----------------
-----------------
-----------------
-----------------
-----------------
-----------------
-----------------
-----------------
-----------------
-----------------
-----------------
-----------------
-----------------31,621
-----------------
-----------------
-----------------
-----------------
25th %ile
Median (50%)
Avg by Org
75th %ile
Annual Base Salaries10th %ile
90th %ile
$27,781
-----------------24,370
-----------------32,418
-----------------27,709
-----------------27,001
-----------------26,951
-----------------25,819
Avg by Employee

815Retail Gift/Thrift Shop
Customer Service RepresentativeFollowing guidelines and procedures, performs office support duties which involve providing information to the public, receiving payments, addressing customer questions, preparing and maintaining records.
Valuing our Nonprofit Workforce 2014 Page 129
Number of Orgs Emps
All Organizations:
By Geographic Location: Central Massachusetts RegionBy Field of Service: Arts, culture, recreationBy Gender of Employee: FemaleBy Race/Ethnicity of Employee: WhiteBy Number of Years in Position: Up to 5 Years
8
-----------------5
-----------------5
-----------------6
-----------------6
-----------------7
30
-----------------23
-----------------24
-----------------25
-----------------27
-----------------28
$18,720
-------------------
-------------------
-------------------18,720
-------------------18,720
-------------------18,720
$19,760
-----------------
-----------------
-----------------19,760
-----------------19,760
-----------------19,760
$24,960
-----------------
-----------------
-----------------24,960
-----------------24,960
-----------------24,960
$24,960
-----------------
-----------------
-----------------24,960
-----------------24,960
-----------------24,960
$31,200
-----------------
-----------------
-----------------31,200
-----------------31,200
-----------------31,200
$24,164
-----------------
-----------------
-----------------24,001
-----------------24,072
-----------------24,076
25th %ile
Median (50%)
Avg by Org
75th %ile
Annual Base Salaries10th %ile
90th %ile
$25,964
-----------------24,624
-----------------25,780
-----------------26,742
-----------------26,280
-----------------25,923
Avg by Employee

Provides overall management and direction to one or more large social service or mental health programs including managing staff, developing and managing the budget, developing and implementing policies and procedures, participating in obtaining funds/grants and coordinating and integrating single programs with others in the organization. Typically, this position reports to the Executive Director/Chief Executive Officer, is a member of the senior executive team and directly or indirectly manages a minimum of ten staff. Report on smaller programs in (856).
853Social Services & Mental Health
© 2014 Third Sector New England & Nonprofit Compensation Associates
Program Director/Administrator, Social Services/Mental Health
Page 130
Number of Orgs Emps
All Organizations:
By Budget Size: $2,500,000 - $9,999,999 $10,000,000 - $24,999,999 $25,000,000 and overBy Geographic Location: Berkshire County Region Western Massachusetts Region Central Massachusetts Region Greater Boston Region Northeastern Massachusetts Region Southeastern Massachusetts/Rhode Island RegionBy Field of Service: Srvcs & Adv: Children and youth Srvcs & Adv: Elderly, developmentally disabled Cmnty/econ dev, social justice, legal, civil rights Counseling, crisis interv, mental hlth, medicalBy Number of Employees: 51 -100 101 - 250 251+By Years of Experience Required: 1 Year 2 - 3 Years 4 - 6 Years 7 - 10 YearsBy Level of Education Required: Bachelor's Degree Master's Degree LCSW/LICSW/MFT/MFCCBy Gender of Employee: Male FemaleBy Race/Ethnicity of Employee: Asian Black Hispanic or Latino WhiteBy Number of Years in Position: Up to 5 Years 5 - 10 Years 11 - 20 Years More than 20 YearsBy Number of Employees Managed: 1 to 3 4 to 8 9 to 14 15 and over
70
-----------------252217
-----------------8
161115
713
-----------------1527
614
-----------------8
2328
-----------------7
163213
-----------------4031
6-----------------
3557
-----------------588
59-----------------
43333126
-----------------18192144
287
-----------------64
12790
-----------------177344427140
-----------------38
1083493
-----------------1871
181-----------------
1124
13828
-----------------137
8015
-----------------69
200-----------------
613
8233
-----------------108
655441
-----------------334635
127
$50,868
-------------------48,01749,91260,008
-------------------51,97549,24655,49554,42947,86150,951
-------------------52,23349,10946,43653,622
-------------------42,84450,07452,075
-------------------
51,97951,40161,339
-------------------49,03860,00859,201
-------------------50,35750,548
-------------------
47,707
50,415-------------------
49,37151,20148,19462,604
-------------------44,27548,30646,94552,724
$60,008
-----------------53,54556,82668,993
-----------------61,50360,00856,82660,00854,64260,154
-----------------62,30156,82657,41360,840
-----------------60,47656,82660,008
-----------------
61,72456,99268,417
-----------------56,82665,56269,992
-----------------62,67158,615
-----------------
56,909
60,008-----------------
56,82657,86661,17669,566
-----------------59,75957,15855,30760,008
$69,992
-----------------62,97265,56276,241
-----------------74,67269,99269,89869,67069,28569,992
-----------------72,92566,18669,63972,738
-----------------74,78768,37869,992
-----------------78,56271,66768,28782,472
-----------------65,56276,24174,194
-----------------74,67268,987
-----------------82,84661,90174,87069,992
-----------------64,00267,22671,42778,395
-----------------67,20567,70463,44072,738
$80,621
-----------------75,42579,99790,001
-----------------82,67079,19685,71777,25185,01079,487
-----------------85,21378,06380,59582,119
-----------------85,71776,83583,980
-----------------
77,37680,109
101,078-----------------
77,48085,01085,280
-----------------87,80778,520
-----------------
72,072
81,370-----------------
76,79475,83781,99391,000
-----------------75,04583,97084,05383,990
$96,221
-----------------85,71790,135
106,072-----------------
93,81687,48194,900
102,712101,857102,671
-----------------100,206
94,07685,71795,580
-----------------87,42985,13899,890
-----------------
102,41987,041
120,754-----------------
92,374104,364
97,099-----------------
106,41391,312
-----------------
83,466
96,804-----------------
93,24985,75993,371
101,868-----------------
82,38297,75299,024
100,626
$71,793
-----------------66,14969,48379,842
-----------------73,94069,55771,94271,95672,45573,453
-----------------75,26669,27067,92573,137
-----------------71,90268,76973,547
-----------------79,89972,79569,22187,065
-----------------68,16678,99076,232
-----------------77,07570,110
-----------------88,57763,40073,65671,893
-----------------69,11168,61671,65381,299
-----------------65,93971,02969,14974,394
25th %ile
Median (50%)
Avg by Org
75th %ile
Annual Base Salaries10th %ile
90th %ile
$73,223
-----------------69,72573,53882,569
-----------------70,80468,82977,07573,73475,27275,167
-----------------69,50572,76168,98178,203
-----------------68,42374,35275,986
-----------------76,63871,38471,78385,944
-----------------70,12979,71979,492
-----------------76,31171,651
-----------------86,27663,42173,65672,859
-----------------70,27972,10173,09378,960
-----------------66,04872,62372,28176,935
Avg by Employee

856Social Services & Mental Health
Program Manager/Administrator, Social Services/Mental HealthProvides overall management and supervision to one or two social service or mental health program(s) including supervising staff, developing and managing the budget, developing and implementing policies and procedures, participating in obtaining funds/grants and coordinating and integrating single programs with others in the organization. Typically, this position directly or indirectly manages fewer than ten staff. Report on larger programs in (853).
Valuing our Nonprofit Workforce 2014 Page 131
Number of Orgs Emps
25th %ile
Median (50%)
Avg by Org
75th %ile
Annual Base Salaries10th %ile
90th %ile
Avg by Employee
All Organizations:
By Budget Size: $250,000 - $999,999 $1,000,000 - $2,499,999 $2,500,000 - $9,999,999 $10,000,000 - $24,999,999 $25,000,000 and overBy Geographic Location: Berkshire County Region Western Massachusetts Region Central Massachusetts Region Greater Boston Region Northeastern Massachusetts Region Southeastern Massachusetts/Rhode Island RegionBy Field of Service: Srvcs & Adv: Children and youth Srvcs & Adv: Elderly, developmentally disabled Cmnty/econ dev, social justice, legal, civil rights Counseling, crisis interv, mental hlth, medicalBy Number of Employees: 11 - 25 26 - 50 51 -100 101 - 250 251+By Years of Experience Required: 1 Year 2 - 3 Years 4 - 6 Years 7 - 10 YearsBy Level of Education Required: High School Diploma Associate's Degree Bachelor's Degree Master's Degree LCSW/LICSW/MFT/MFCC Credential/Certification/LicenseBy Gender of Employee: Male FemaleBy Race/Ethnicity of Employee: Asian Black Hispanic or Latino WhiteBy Number of Years in Position: Up to 5 Years 5 - 10 Years 11 - 20 Years More than 20 YearsBy Number of Employees Managed: 1 to 3 4 to 8 9 to 14 15 and over
91
-----------------7
10302617
-----------------9
2112251312
-----------------2331
619
-----------------79
132433
-----------------8
4432
6-----------------
95
6121
77
-----------------5079
-----------------9
261376
-----------------63473920
-----------------39483532
633
-----------------8
26140193265
-----------------39
19228
119147108
-----------------86
26929
200-----------------
132539
151400
-----------------34
273159
23-----------------
3231
378633312
-----------------148455
-----------------9
6723
484-----------------
327117106
25-----------------
71165125149
$39,146
-------------------
42,52831,56439,14646,975
-------------------42,66132,74944,03043,86739,14636,005
-------------------40,95334,94442,84842,309
-------------------41,51342,34540,95536,70439,146
-------------------39,86334,69443,86751,925
-------------------
40,18448,50646,88353,425
-------------------37,95039,146
-------------------
33,98730,39740,851
-------------------37,99840,14845,52540,435
-------------------40,24839,14631,45843,451
$45,184
-----------------
45,97736,73843,45150,232
-----------------46,00041,38247,84049,92043,45150,003
-----------------46,37540,17650,48249,005
-----------------44,15945,95350,96043,01446,534
-----------------45,59939,99849,13057,907
-----------------
45,47950,86651,41854,454
-----------------44,99045,115
-----------------
39,14635,46447,221
-----------------42,84046,84248,90144,387
-----------------45,53142,93139,49948,932
$52,562
-----------------46,68651,29344,64752,27055,619
-----------------53,64350,00348,78754,99551,50058,063
-----------------51,47050,27454,99553,851
-----------------49,92051,77154,99550,00353,571
-----------------53,85148,85954,99559,488
-----------------
52,00053,85157,67855,911
-----------------50,70153,061
-----------------44,30447,00840,99753,612
-----------------50,96053,22755,03754,080
-----------------52,31250,81450,00355,016
$59,175
-----------------
55,38554,44857,37764,054
-----------------55,59856,23354,85061,26258,00065,338
-----------------58,78157,14061,30860,008
-----------------61,85956,11860,54956,51460,819
-----------------59,24954,99561,19470,013
-----------------
59,02059,48864,42863,451
-----------------57,79359,821
-----------------
52,00056,00060,008
-----------------58,01158,15263,38860,267
-----------------56,49357,27358,45960,507
$68,149
-----------------
61,39462,75862,69175,005
-----------------60,00865,77665,00068,57867,22675,929
-----------------67,61566,06162,85869,894
-----------------68,99464,72066,99761,22371,409
-----------------75,45262,85869,01478,516
-----------------
68,99468,11669,41491,753
-----------------65,56869,297
-----------------
57,62867,76270,850
-----------------67,18065,00874,30067,872
-----------------62,84164,91568,16672,800
$53,084
-----------------46,56951,29846,31751,68558,080
-----------------51,88049,74951,60755,89452,62157,364
-----------------53,29350,23854,71155,221
-----------------52,70152,15654,69250,46154,041
-----------------54,96748,76155,64663,131
-----------------
53,40556,49457,82362,293
-----------------51,57653,540
-----------------44,39546,36545,81554,450
-----------------51,68452,88257,34453,853
-----------------51,79051,67250,40656,028
$52,894
-----------------47,09051,02750,93653,05060,081
-----------------49,78149,58553,37353,86253,58656,540
-----------------51,63753,85955,77751,382
-----------------51,16450,65352,59751,64655,521
-----------------51,63750,36455,17662,604
-----------------49,63954,47152,65556,18158,63560,139
-----------------52,44353,272
-----------------44,39549,46346,80353,597
-----------------52,82753,09156,39654,223
-----------------52,00654,61753,67354,194

Assumes responsibility for the implementing a single social services or mental health program ensuring compliance with the stated objectives of the project. Coordinates the work of others within the program or project. Works with other departments as necessary.
859Social Services & Mental Health
© 2014 Third Sector New England & Nonprofit Compensation Associates
Program Coordinator, Social Services/Mental Health
Page 132
Number of Orgs Emps
All Organizations:
By Budget Size: $250,000 - $999,999 $1,000,000 - $2,499,999 $2,500,000 - $9,999,999 $10,000,000 - $24,999,999 $25,000,000 and overBy Geographic Location: Berkshire County Region Western Massachusetts Region Central Massachusetts Region Greater Boston Region Northeastern Massachusetts Region Southeastern Massachusetts/Rhode Island RegionBy Field of Service: Srvcs & Adv: Children and youth Srvcs & Adv: Elderly, developmentally disabled Counseling, crisis interv, mental hlth, medicalBy Number of Employees: 11 - 25 26 - 50 51 -100 101 - 250 251+By Years of Experience Required: 1 Year 2 - 3 Years 4 - 6 YearsBy Level of Education Required: High School Diploma Associate's Degree Bachelor's Degree Master's Degree Credential/Certification/LicenseBy Gender of Employee: Male FemaleBy Race/Ethnicity of Employee: Asian Black Hispanic or Latino White Mixed RaceBy Number of Years in Position: Up to 5 Years 5 - 10 Years 11 - 20 Years More than 20 YearsBy Number of Employees Managed: 1 to 3 4 to 8 9 to 14 15 and over
71
-----------------78
172116
-----------------5
158
191113
-----------------182612
-----------------769
1528
-----------------203518
-----------------12124815
7-----------------
3864
-----------------14262560
5-----------------
54323211
-----------------27332318
787
-----------------1429
106162473
-----------------20
22593
103231115
-----------------101326301
-----------------17243593
609-----------------
115455101
-----------------144106378
3344
-----------------197579
-----------------17
15065
5126
-----------------485134
9120
-----------------67
238182
52
$31,200
-------------------28,92237,31533,28029,43633,434
-------------------33,28032,82235,60530,63834,06228,405
-------------------31,20031,02131,208
-------------------29,889
31,82435,56031,034
-------------------29,34933,09730,638
-------------------
28,61536,50442,588
-------------------32,79131,034
-------------------30,94629,99432,27233,280
-------------------30,76334,73635,25639,154
-------------------32,13835,00631,75834,811
$35,838
-----------------32,13640,50837,48731,23236,525
-----------------39,62434,83037,85634,00837,44034,445
-----------------34,91336,96235,038
-----------------34,882
36,10938,86535,126
-----------------35,67236,10932,677
-----------------
29,84339,31244,783
-----------------36,00335,838
-----------------33,22834,58036,03637,263
-----------------35,12637,40438,89641,995
-----------------36,96238,57434,99239,624
$40,000
-----------------41,91244,28340,82036,91040,310
-----------------47,05039,37440,99741,20539,99841,933
-----------------41,10140,23839,936
-----------------39,645
41,60041,60039,998
-----------------40,31039,99836,858
-----------------
31,82440,97650,482
-----------------39,99840,165
-----------------39,47837,30540,22740,99739,073
-----------------39,99840,84141,97442,827
-----------------40,56040,78938,56340,903
$44,470
-----------------46,23951,29344,49242,27144,506
-----------------50,48243,43044,30447,65341,99548,027
-----------------47,50743,13444,627
-----------------43,826
45,76048,80743,430
-----------------48,02742,99446,187
-----------------
36,08844,91554,413
-----------------43,99644,616
-----------------46,74841,02744,52344,990
-----------------43,99244,74147,54947,934
-----------------45,15744,51243,43045,043
$50,015
-----------------56,45157,84548,21550,31350,003
-----------------51,99246,92149,97052,31246,91456,638
-----------------51,95449,66249,999
-----------------49,587
50,11257,22148,006
-----------------55,07447,29552,192
-----------------
43,67250,05361,012
-----------------48,41150,482
-----------------52,18345,24350,11151,016
-----------------49,33450,36855,37452,491
-----------------49,32152,07148,00649,789
$40,692
-----------------41,00046,05841,02938,23141,189
-----------------45,16039,47241,71841,55640,04841,992
-----------------41,49140,83440,141
-----------------39,877
41,10044,16139,881
-----------------41,87240,16339,823
-----------------
34,11042,22050,124
-----------------40,51640,745
-----------------40,38337,76540,86241,75236,979
-----------------40,15041,71043,56944,974
-----------------40,63742,25939,41841,891
25th %ile
Median (50%)
Avg by Org
75th %ile
Annual Base Salaries10th %ile
90th %ile
$42,502
-----------------41,43643,94040,87642,99844,578
-----------------45,03340,67038,44044,96640,99743,813
-----------------42,44443,12642,739
-----------------40,40045,43340,51344,27842,363
-----------------41,80642,35443,161
-----------------39,96336,78543,07050,80941,680
-----------------42,17742,126
-----------------41,32040,19141,26242,88437,032
-----------------40,79543,31345,39946,531
-----------------40,16942,72543,50142,397
Avg by Employee

862Social Services & Mental Health
Program Assistant, Social Services/Mental HealthPerforms a variety of skilled administrative and clerical duties directly related to program management activities. These include maintaining databases, preparing routine correspondence, providing customer service to clients and assisting and participating in program events.
Valuing our Nonprofit Workforce 2014 Page 133
Number of Orgs Emps
All Organizations:
By Budget Size: $2,500,000 - $9,999,999 $10,000,000 - $24,999,999 $25,000,000 and overBy Geographic Location: Western Massachusetts Region Central Massachusetts Region Greater Boston Region Northeastern Massachusetts Region Southeastern Massachusetts/Rhode Island RegionBy Field of Service: Srvcs & Adv: Children and youth Srvcs & Adv: Elderly, developmentally disabledBy Number of Employees: 101 - 250 251+By Years of Experience Required: 1 Year 2 - 3 YearsBy Level of Education Required: High School Diploma Associate's Degree Bachelor's DegreeBy Gender of Employee: Male FemaleBy Race/Ethnicity of Employee: Black Hispanic or Latino WhiteBy Number of Years in Position: Up to 5 Years 5 - 10 Years 11 - 20 Years More than 20 YearsBy Number of Employees Managed: 1 to 3
36
-----------------9
119
-----------------75
1166
-----------------9
16-----------------
1212
-----------------1212
-----------------19
69
-----------------1231
-----------------121029
-----------------271610
5-----------------
6
265
-----------------3077
117-----------------
541873
10118
-----------------63
117-----------------
40170
-----------------7796
-----------------115
2166
-----------------62
197-----------------
7525
141-----------------
1564825
5-----------------
13
$24,960
-------------------28,10621,32026,957
-------------------20,89417,68024,96026,707
-------------------20,89124,960
-------------------28,32124,960
-------------------
24,960-------------------
24,96027,327
-------------------23,50424,960
-------------------24,96023,73324,960
-------------------24,96024,55429,070
-------------------24,461
$27,155
-----------------31,20024,96029,806
-----------------24,57024,74726,00029,723
-----------------24,96028,315
-----------------29,47426,327
-----------------
26,000-----------------
26,00029,391
-----------------26,00028,974
-----------------26,00029,12028,985
-----------------26,62427,78430,878
-----------------24,960
$31,200
-----------------33,91526,10431,200
-----------------29,82831,20031,20031,179
-----------------31,20031,574
-----------------33,40530,555
-----------------
29,675-----------------
29,12032,677
-----------------29,80631,200
-----------------29,80631,20031,200
-----------------30,74231,27333,32233,779
-----------------26,104
$33,717
-----------------36,87831,05533,832
-----------------35,11035,77634,44533,041
-----------------33,28034,954
-----------------36,52033,108
-----------------
33,379-----------------
32,53138,798
-----------------32,67233,925
-----------------33,01033,72735,110
-----------------32,96335,54234,965
-----------------35,901
$37,482
-----------------39,88436,54637,830
-----------------39,38137,06441,18434,798
-----------------35,82239,659
-----------------42,65736,092
-----------------
36,693-----------------
36,40049,271
-----------------36,73539,799
-----------------34,92337,69540,374
-----------------36,03643,23141,965
-----------------45,852
$31,216
-----------------34,18728,31332,279
-----------------30,06629,73131,87431,171
-----------------29,20532,024
-----------------33,74430,280
-----------------
30,437-----------------
29,98934,970
-----------------29,40931,850
-----------------29,70331,32032,039
-----------------30,64332,52633,84535,982
-----------------30,471
25th %ile
Median (50%)
Avg by Org
75th %ile
Annual Base Salaries10th %ile
90th %ile
$32,795
-----------------34,20532,79333,986
-----------------33,62629,00736,47231,65830,599
-----------------30,35134,433
-----------------34,49232,353
-----------------31,07033,765
-----------------32,30433,08837,946
-----------------31,31833,547
-----------------31,94432,37133,273
-----------------32,38933,51033,79235,982
-----------------35,637
Avg by Employee

Provides primary psychiatric assessment and care to clients of the organization including comprehensive examinations, making diagnoses, determining course of treatment, providing/supervising appropriate treatment, prescribing medications, documenting patient files. Provides consultation and supervision to psychiatric and social service professionals, technicians and other staff. Requires state licensure as a medical doctor, and board certification in psychiatry.
865Social Services & Mental Health
© 2014 Third Sector New England & Nonprofit Compensation Associates
Psychiatrist
Page 134
Number of Orgs Emps
All Organizations:
By Budget Size: $25,000,000 and overBy Field of Service: Counseling, crisis interv, mental hlth, medicalBy Number of Employees: 251+By Level of Education Required: Medical DegreeBy Gender of Employee: Male FemaleBy Race/Ethnicity of Employee: WhiteBy Number of Years in Position: Up to 5 Years
8
-----------------6
-----------------6
-----------------7
-----------------7
-----------------75
-----------------7
-----------------6
23
-----------------20
-----------------20
-----------------21
-----------------22
-----------------16
7-----------------
15-----------------
17
$151,220
-------------------153,205
-------------------150,328
-------------------150,625
-------------------150,923
-------------------142,461
-------------------139,938
-------------------152,410
$161,990
-----------------162,063
-----------------156,905
-----------------158,600
-----------------160,295
-----------------156,978
-----------------161,990
-----------------158,600
$173,368
-----------------172,266
-----------------170,581
-----------------171,163
-----------------172,266
-----------------175,911166,254
-----------------179,462
-----------------171,163
$187,741
-----------------182,717
-----------------182,114
-----------------182,437
-----------------190,206
-----------------195,135
-----------------197,600
-----------------190,299
$239,200
-----------------207,522
-----------------235,040
-----------------206,419
-----------------239,200
-----------------239,200
-----------------268,320
-----------------253,760
$182,036
-----------------179,181
-----------------174,216
-----------------176,591
-----------------182,043
-----------------179,984186,724
-----------------188,762
-----------------182,573
25th %ile
Median (50%)
Avg by Org
75th %ile
Annual Base Salaries10th %ile
90th %ile
$185,766
-----------------187,021
-----------------173,990
-----------------178,132
-----------------186,321
-----------------182,385196,173
-----------------196,207
-----------------196,222
Avg by Employee

868Social Services & Mental Health
Licensed Clinical Social WorkerEvaluates needs of clients and develops treatment plans in coordination with others. Implements counseling and mental health services according to treatment plans. Provides individual, marital, group and family psychotherapy and/or drug and/or alcohol counseling services. May develop and implement specialized therapy programs. Maintains accurate and complete client records. Requires state licensure (LCSW).
Valuing our Nonprofit Workforce 2014 Page 135
Number of Orgs Emps
All Organizations:
By Budget Size: $2,500,000 - $9,999,999 $10,000,000 - $24,999,999 $25,000,000 and overBy Geographic Location: Berkshire County Region Western Massachusetts Region Greater Boston Region Northeastern Massachusetts Region Southeastern Massachusetts/Rhode Island RegionBy Field of Service: Srvcs & Adv: Children and youth Srvcs & Adv: Elderly, developmentally disabled Counseling, crisis interv, mental hlth, medicalBy Number of Employees: 26 - 50 101 - 250 251+By Years of Experience Required: 1 Year 2 - 3 Years 4 - 6 YearsBy Level of Education Required: Master's Degree LCSW/LICSW/MFT/MFCCBy Gender of Employee: Male FemaleBy Race/Ethnicity of Employee: Asian Black Hispanic or Latino WhiteBy Number of Years in Position: Up to 5 Years 5 - 10 Years 11 - 20 Years More than 20 YearsBy Number of Employees Managed: 1 to 3 4 to 8
41
-----------------121412
-----------------59
1076
-----------------101313
-----------------5
1121
-----------------8
216
-----------------2018
-----------------2238
-----------------599
37-----------------
362216
8-----------------
86
460
-----------------5584
309-----------------
20117
46118127
-----------------7480
257-----------------
1731
400-----------------
34216
28-----------------
217187
-----------------85
372-----------------
61726
388-----------------
2807542
8-----------------
296
$40,000
-------------------40,78540,00039,998
-------------------
40,60440,000
40,232-------------------
39,99937,75240,602
-------------------40,71442,08739,998
-------------------41,65239,80738,523
-------------------40,48940,497
-------------------40,36939,999
-------------------
36,38744,99240,000
-------------------39,99841,52942,255
-------------------47,008
$43,961
-----------------43,24343,03544,990
-----------------
47,21643,354
43,389-----------------
42,61941,99545,968
-----------------43,87849,50443,794
-----------------44,92343,79443,306
-----------------44,45043,992
-----------------44,54343,540
-----------------
43,54551,14243,477
-----------------42,88547,50749,291
-----------------51,501
$52,447
-----------------49,50448,38156,451
-----------------
64,48048,000
50,378-----------------
48,00046,75957,200
-----------------54,64253,58152,198
-----------------59,66554,11247,071
-----------------54,99552,499
-----------------55,16251,761
-----------------62,40052,99862,76451,210
-----------------50,23256,82658,44858,802
-----------------55,74456,576
$63,851
-----------------58,24056,19667,654
-----------------
74,88058,677
62,400-----------------
56,83655,01170,720
-----------------64,48067,99564,355
-----------------72,80063,18053,753
-----------------62,40070,720
-----------------65,03163,330
-----------------
64,48076,96062,400
-----------------62,40068,64065,827
-----------------60,507
$72,800
-----------------71,70263,75274,880
-----------------
79,04064,234
68,382-----------------
63,26272,80076,960
-----------------69,05681,54872,800
-----------------75,95172,80058,677
-----------------72,80076,960
-----------------74,04472,800
-----------------
72,80079,04072,800
-----------------72,80079,04072,800
-----------------65,582
$55,056
-----------------52,38450,72456,742
-----------------
61,33751,313
53,090-----------------
50,16450,84257,880
-----------------54,73258,12955,000
-----------------59,96655,11248,227
-----------------54,67156,751
-----------------56,20954,729
-----------------59,42254,23362,46054,294
-----------------54,21358,25558,21659,233
-----------------56,42757,730
25th %ile
Median (50%)
Avg by Org
75th %ile
Annual Base Salaries10th %ile
90th %ile
$53,577
-----------------54,87751,90455,641
-----------------43,25057,90655,52956,05953,714
-----------------48,08753,19454,801
-----------------51,34157,76853,387
-----------------52,93951,38752,496
-----------------52,63451,919
-----------------53,88652,574
-----------------56,74752,63759,00753,216
-----------------52,16753,81955,88059,233
-----------------54,91757,730
Avg by Employee

Provides professional, clinical psychological services, such as assessments, biofeedback therapies, group and individual therapy, crisis intervention, consulting and educational workshops and programs. Provides consultation to other counseling and technical staff. Requires a Ph.D. in clinical psychology and valid state license in psychology.
874Social Services & Mental Health
© 2014 Third Sector New England & Nonprofit Compensation Associates
Psychologist
Page 136
Number of Orgs Emps
All Organizations:
By Geographic Location: Western Massachusetts RegionBy Field of Service: Counseling, crisis interv, mental hlth, medicalBy Number of Employees: 251+By Years of Experience Required: 2 - 3 YearsBy Level of Education Required: DoctorateBy Gender of Employee: FemaleBy Race/Ethnicity of Employee: WhiteBy Number of Years in Position: Up to 5 Years 5 - 10 Years
9
-----------------5
-----------------7
-----------------5
-----------------5
-----------------8
-----------------8
-----------------8
-----------------55
27
-----------------14
-----------------24
-----------------23
-----------------19
-----------------26
-----------------16
-----------------26
-----------------11
6
$67,168
-------------------
-------------------62,588
-------------------61,972
-------------------72,500
-------------------65,641
-------------------72,288
-------------------65,641
-------------------
$77,002
-----------------
-----------------77,027
-----------------77,002
-----------------77,100
-----------------76,274
-----------------77,027
-----------------76,274
-----------------
$86,216
-----------------
-----------------85,956
-----------------86,216
-----------------88,000
-----------------87,108
-----------------85,353
-----------------87,108
-----------------85,01090,137
$94,058
-----------------
-----------------93,408
-----------------94,058
-----------------93,600
-----------------94,058
-----------------93,408
-----------------94,058
-----------------
$99,378
-----------------
-----------------94,058
-----------------94,906
-----------------94,058
-----------------101,331
-----------------116,750
-----------------101,331
-----------------
$87,030
-----------------
-----------------86,051
-----------------86,350
-----------------85,237
-----------------87,081
-----------------88,871
-----------------87,107
-----------------90,75890,002
25th %ile
Median (50%)
Avg by Org
75th %ile
Annual Base Salaries10th %ile
90th %ile
$88,326
-----------------90,479
-----------------85,021
-----------------86,236
-----------------83,416
-----------------88,654
-----------------93,906
-----------------88,740
-----------------98,35989,975
Avg by Employee

879Social Services & Mental Health
Case Manager, Master's LevelCounsels and aids individuals and families requiring social service organization assistance. Interviews and evaluates applicants for services, formulates and implements treatment plan of action and goals. Assists applicants in applying for and obtaining social and other services. Requires a MSW degree. Positions not requiring a MSW degree are reported in (880).
Valuing our Nonprofit Workforce 2014 Page 137
Number of Orgs Emps
All Organizations:
By Budget Size: $10,000,000 - $24,999,999 $25,000,000 and overBy Geographic Location: Western Massachusetts RegionBy Field of Service: Srvcs & Adv: Children and youth Counseling, crisis interv, mental hlth, medicalBy Number of Employees: 101 - 250 251+By Years of Experience Required: 2 - 3 YearsBy Level of Education Required: Master's DegreeBy Gender of Employee: Male FemaleBy Race/Ethnicity of Employee: WhiteBy Number of Years in Position: Up to 5 Years 5 - 10 Years
15
-----------------55
-----------------5
-----------------55
-----------------67
-----------------8
-----------------12
-----------------5
14-----------------
11-----------------
107
64
-----------------8
41-----------------
25-----------------
1337
-----------------1344
-----------------26
-----------------57
-----------------1053
-----------------41
-----------------42
9
$28,278
-------------------
27,610-------------------
33,322-------------------
35,680
-------------------38,00027,623
-------------------29,026
-------------------27,726
-------------------
28,171-------------------
27,610-------------------
27,674
$33,322
-----------------
30,483-----------------
40,414-----------------
38,199
-----------------39,49930,737
-----------------42,994
-----------------33,020
-----------------
33,020-----------------
32,272-----------------
31,143
$41,076
-----------------43,70138,397
-----------------48,006
-----------------41,995
-----------------42,99439,032
-----------------51,002
-----------------39,000
-----------------42,99740,830
-----------------41,322
-----------------39,33341,322
$49,392
-----------------
65,520-----------------
68,640-----------------
46,504
-----------------48,00663,149
-----------------68,640
-----------------51,002
-----------------
49,368-----------------
51,706-----------------
55,500
$69,257
-----------------
70,720-----------------
72,800-----------------
54,695
-----------------59,30170,720
-----------------72,800
-----------------70,043
-----------------
68,640-----------------
68,640-----------------
70,096
$44,283
-----------------45,38744,764
-----------------52,948
-----------------42,744
-----------------45,01844,913
-----------------53,621
-----------------43,913
-----------------47,77543,648
-----------------44,054
-----------------44,25443,808
25th %ile
Median (50%)
Avg by Org
75th %ile
Annual Base Salaries10th %ile
90th %ile
$47,253
-----------------48,31547,220
-----------------46,941
-----------------44,31047,543
-----------------47,89548,015
-----------------49,817
-----------------46,800
-----------------49,58146,959
-----------------47,710
-----------------44,91144,602
Avg by Employee

Counsels and aids individuals and families requiring social service organization assistance. Interviews and evaluates applicants for services, formulates and implements treatment plan of action and goals; assists applicants in applying for and obtaining social and other services. Most Case Manager positions require a bachelor's degree in psychology or other behavioral science. Senior-level positions requiring a MSW degree are reported in (879). Case Managers working in a medical setting are reported in (740).
880Social Services & Mental Health
© 2014 Third Sector New England & Nonprofit Compensation Associates
Case Manager
Page 138
Number of Orgs Emps
All Organizations:
By Budget Size: $2,500,000 - $9,999,999 $10,000,000 - $24,999,999 $25,000,000 and overBy Geographic Location: Berkshire County Region Western Massachusetts Region Central Massachusetts Region Greater Boston Region Northeastern Massachusetts Region Southeastern Massachusetts/Rhode Island RegionBy Field of Service: Srvcs & Adv: Children and youth Srvcs & Adv: Elderly, developmentally disabled Counseling, crisis interv, mental hlth, medicalBy Number of Employees: 26 - 50 51 -100 101 - 250 251+By Years of Experience Required: 1 Year 2 - 3 Years 4 - 6 YearsBy Level of Education Required: High School Diploma Associate's Degree Bachelor's DegreeBy Gender of Employee: Male FemaleBy Race/Ethnicity of Employee: Asian Black Hispanic or Latino White Mixed Race Other Racial IdentityBy Number of Years in Position: Up to 5 Years 5 - 10 Years 11 - 20 Years More than 20 YearsBy Number of Employees Managed: 1 to 3 4 to 8
54
-----------------161715
-----------------6
128
117
10-----------------
112113
-----------------66
1820
-----------------2227
5-----------------
131138
-----------------3447
-----------------1025264510
5-----------------
433427
9-----------------
67
931
-----------------155338428
-----------------34
232119174
86286
-----------------130435257
-----------------4677
366435
-----------------190395
8-----------------
11869
594-----------------
151702
-----------------32
114114566
127
-----------------527127
8813
-----------------8
24
$27,685
-------------------27,60228,27927,189
-------------------28,62127,04029,14127,74831,03426,563
-------------------26,66629,14126,000
-------------------28,41331,20029,14126,666
-------------------27,04027,851
-------------------26,64525,48029,120
-------------------27,68527,685
-------------------29,25326,65626,63528,60525,097
-------------------27,30627,58928,70430,435
-------------------
$30,200
-----------------30,16030,50429,994
-----------------30,50429,12031,20030,57131,65829,323
-----------------28,09631,99028,580
-----------------30,81733,00033,07228,725
-----------------29,32830,160
-----------------27,85128,37131,809
-----------------29,95230,363
-----------------31,59027,96129,39531,03427,020
-----------------29,66130,16031,58032,292
-----------------
$34,029
-----------------33,32236,05533,280
-----------------31,99133,32233,07235,98433,94635,256
-----------------30,99237,50232,011
-----------------32,94736,00538,85431,346
-----------------31,99035,36043,548
-----------------29,16231,20036,172
-----------------33,07234,320
-----------------33,03131,27333,30135,36031,07539,312
-----------------33,28032,50036,06735,048
-----------------35,710
$39,894
-----------------37,19043,05638,002
-----------------34,44037,71036,35843,51939,08341,475
-----------------36,13043,22335,891
-----------------34,87141,18443,68535,360
-----------------37,64340,269
-----------------31,93835,41241,600
-----------------38,18940,706
-----------------35,75537,76738,85441,47534,981
-----------------38,37641,47544,40636,785
-----------------
$45,635
-----------------41,70450,60642,976
-----------------46,07242,06440,72649,73245,83548,012
-----------------40,45049,52040,006
-----------------38,84644,09650,15941,455
-----------------45,05548,389
-----------------36,19439,99848,412
-----------------44,96146,010
-----------------42,64444,46043,71147,45343,871
-----------------43,82648,39850,96451,523
-----------------
$35,598
-----------------34,18537,51034,675
-----------------33,75234,54634,29437,06236,36336,092
-----------------32,45238,33132,939
-----------------33,09737,02339,03632,765
-----------------34,13836,42541,963
-----------------30,58732,12837,425
-----------------34,90035,928
-----------------34,48833,90134,46736,61131,96836,980
-----------------34,80135,44138,35536,605
-----------------37,202
25th %ile
Median (50%)
Avg by Org
75th %ile
Annual Base Salaries10th %ile
90th %ile
$34,961
-----------------35,23735,40635,064
-----------------34,53033,90834,43734,84036,31336,091
-----------------32,99336,54734,710
-----------------32,25837,50136,93333,574
-----------------35,78435,76140,209
-----------------31,39833,76736,229
-----------------35,51335,130
-----------------36,82833,97733,79035,85432,18537,525
-----------------34,34036,27338,18837,503
-----------------38,09837,671
Avg by Employee

882Social Services & Mental Health
Counselor, Master's LevelResponsible for providing a safe and supportive environment for organization's clientele. Adheres to laws regarding confidentiality and reporting requirements. Maintains observation and progress records as needed. Provides crisis intervention and/or conflict resolution to individuals and groups. Requires a Master degree. Positions not requiring a Master degree are reported in (883).
Valuing our Nonprofit Workforce 2014 Page 139
Number of Orgs Emps
All Organizations:
By Budget Size: $2,500,000 - $9,999,999 $10,000,000 - $24,999,999 $25,000,000 and overBy Geographic Location: Western Massachusetts Region Northeastern Massachusetts RegionBy Field of Service: Srvcs & Adv: Elderly, developmentally disabled Counseling, crisis interv, mental hlth, medicalBy Number of Employees: 251+By Years of Experience Required: 1 Year 2 - 3 YearsBy Level of Education Required: Master's DegreeBy Gender of Employee: Male FemaleBy Race/Ethnicity of Employee: Asian Black Hispanic or Latino WhiteBy Number of Years in Position: Up to 5 Years 5 - 10 Years 11 - 20 Years
19
-----------------558
-----------------65
-----------------69
-----------------14
-----------------5
11-----------------
18-----------------
1214
-----------------597
16-----------------
1777
686
-----------------62
166457
-----------------385124
-----------------23
654-----------------
617-----------------
126252
-----------------646
-----------------121549
-----------------104672
516-----------------
4787336
$34,133
-------------------
34,486-------------------
-------------------32,63534,071
-------------------34,008
-------------------
38,002-------------------
34,008-------------------
34,03334,008
-------------------
34,008-------------------
34,00836,33736,566
$38,126
-----------------
37,606-----------------
-----------------41,37138,033
-----------------37,606
-----------------
41,423-----------------
38,126-----------------
38,00238,085
-----------------
38,126-----------------
37,60642,35941,772
$43,524
-----------------
43,430-----------------
-----------------44,74143,504
-----------------42,723
-----------------
46,031-----------------
43,722-----------------
42,86943,701
-----------------47,611
43,337-----------------
42,72350,21144,658
$62,400
-----------------
57,127-----------------
-----------------50,00362,400
-----------------53,581
-----------------
56,045-----------------
62,400-----------------
52,26064,397
-----------------
57,813-----------------
62,40066,56053,581
$72,800
-----------------
71,136-----------------
-----------------68,19972,800
-----------------70,720
-----------------
72,800-----------------
72,800-----------------
68,64072,800
-----------------
70,720-----------------
72,80076,12864,501
$49,138
-----------------
48,764-----------------
-----------------46,88049,226
-----------------47,558
-----------------
50,802-----------------
49,431-----------------
47,08049,680
-----------------50,744
48,493-----------------
48,95453,45047,611
25th %ile
Median (50%)
Avg by Org
75th %ile
Annual Base Salaries10th %ile
90th %ile
$50,377
-----------------55,95645,55548,401
-----------------53,49247,016
-----------------49,14650,248
-----------------47,794
-----------------45,35850,747
-----------------50,621
-----------------48,92549,059
-----------------48,21947,91754,79849,362
-----------------50,00048,91847,698
Avg by Employee

Responsible for providing a safe and supportive environment for organization's clientele. Adheres to laws regarding confidentiality and reporting requirements. Maintains observation and progress records as needed. Provides crisis intervention and/or conflict resolution to individuals and groups. Senior-level positions requiring a Master degree are reported in (882).
883Social Services & Mental Health
© 2014 Third Sector New England & Nonprofit Compensation Associates
Counselor
Page 140
Number of Orgs Emps
All Organizations:
By Budget Size: $2,500,000 - $9,999,999 $10,000,000 - $24,999,999 $25,000,000 and overBy Geographic Location: Western Massachusetts Region Greater Boston Region Northeastern Massachusetts Region Southeastern Massachusetts/Rhode Island RegionBy Field of Service: Srvcs & Adv: Children and youth Srvcs & Adv: Elderly, developmentally disabled Counseling, crisis interv, mental hlth, medicalBy Number of Employees: 26 - 50 101 - 250 251+By Years of Experience Required: 1 Year 2 - 3 YearsBy Level of Education Required: High School Diploma Bachelor's DegreeBy Gender of Employee: Male FemaleBy Race/Ethnicity of Employee: Asian Black Hispanic or Latino White Mixed RaceBy Number of Years in Position: Up to 5 Years 5 - 10 Years 11 - 20 Years More than 20 YearsBy Number of Employees Managed: 4 to 8
36
-----------------9
1011
-----------------7
1067
-----------------9
118
-----------------68
16-----------------
1714
-----------------1223
-----------------2132
-----------------7
191932
8-----------------
312117
9-----------------
5
1,539
-----------------102403999
-----------------140247381379
-----------------373460483
-----------------4455
1,402-----------------
344128
-----------------934309
-----------------692800
-----------------12
418121873
36-----------------
1,014222103
22-----------------
11
$22,880
-------------------
26,00022,214
-------------------
21,216-------------------
24,003
23,995-------------------
24,96028,97422,880
-------------------24,96029,588
-------------------22,27724,003
-------------------22,88022,880
-------------------25,14121,63222,88022,88024,024
-------------------22,88023,51927,07730,472
-------------------
$24,752
-----------------
28,62123,442
-----------------
22,547-----------------
26,437
25,875-----------------
31,20239,77024,440
-----------------26,62433,140
-----------------23,42129,702
-----------------23,79525,563
-----------------25,67223,33824,96024,96024,960
-----------------24,00325,58428,99931,772
-----------------
$28,080
-----------------
29,99426,000
-----------------
24,960-----------------
29,640
28,538-----------------
33,50043,55527,685
-----------------28,62137,659
-----------------26,31235,006
-----------------26,32328,902
-----------------28,42226,00028,82928,62127,603
-----------------27,72428,77732,36535,911
-----------------
$32,136
-----------------
33,80030,472
-----------------
35,984-----------------
33,800
32,989-----------------
40,88343,70131,200
-----------------32,98942,266
-----------------29,12041,475
-----------------30,16033,296
-----------------31,59529,64532,50532,98930,360
-----------------31,41234,84538,12638,252
-----------------
$39,478
-----------------
38,00239,603
-----------------
43,701-----------------
39,458
41,903-----------------
42,66150,30736,991
-----------------40,74845,883
-----------------32,92744,554
-----------------36,38742,636
-----------------34,73635,41239,35840,69732,148
-----------------37,86742,71543,72653,749
-----------------
$29,516
-----------------
31,46228,428
-----------------
29,735-----------------
30,684
30,800-----------------
35,16041,73428,869
-----------------30,79938,383
-----------------27,26935,572
-----------------27,96130,782
-----------------28,87427,59029,91430,26427,791
-----------------28,81031,32834,33137,424
-----------------
25th %ile
Median (50%)
Avg by Org
75th %ile
Annual Base Salaries10th %ile
90th %ile
$34,840
-----------------37,94232,98835,796
-----------------32,39739,19731,58033,785
-----------------35,79238,00034,607
-----------------37,43637,60933,154
-----------------33,41038,829
-----------------30,69737,783
-----------------32,77034,885
-----------------29,42531,10433,19535,08029,205
-----------------33,02134,71136,13140,101
-----------------39,268
Avg by Employee

886Social Services & Mental Health
Eligibility SpecialistInterviews clients/prospective clients to determine their eligibility for a wide range of social services. Gathers and verifies information. Assists clients to complete application forms for government and other social services and submits for approval. Eligibility Specialists working in housing eligibility programs are reported in Housing Case Manager (440).
Valuing our Nonprofit Workforce 2014 Page 141
Number of Orgs Emps
All Organizations:
By Budget Size: $10,000,000 - $24,999,999 $25,000,000 and overBy Geographic Location: Western Massachusetts Region Northeastern Massachusetts Region Southeastern Massachusetts/Rhode Island RegionBy Field of Service: Srvcs & Adv: Elderly, developmentally disabled Counseling, crisis interv, mental hlth, medicalBy Number of Employees: 101 - 250 251+By Years of Experience Required: 1 Year 2 - 3 YearsBy Level of Education Required: High School Diploma Bachelor's DegreeBy Gender of Employee: Male FemaleBy Race/Ethnicity of Employee: Black Hispanic or Latino WhiteBy Number of Years in Position: Up to 5 Years 5 - 10 Years 11 - 20 Years
22
-----------------78
-----------------656
-----------------76
-----------------89
-----------------13
9-----------------
812
-----------------9
16-----------------
81118
-----------------1910
5
111
-----------------4448
-----------------471032
-----------------3326
-----------------5244
-----------------5232
-----------------2750
-----------------1688
-----------------122663
-----------------612112
$27,410
-------------------27,29027,189
-------------------27,340
26,836-------------------
33,84626,387
-------------------34,73226,895
-------------------27,09031,699
-------------------26,63730,316
-------------------27,15627,373
-------------------28,60226,70727,273
-------------------27,07333,29328,556
$30,576
-----------------29,47428,954
-----------------29,474
28,335-----------------
35,76628,225
-----------------36,36327,493
-----------------28,10136,442
-----------------28,49635,058
-----------------32,50029,646
-----------------32,46434,18029,474
-----------------28,37136,26534,507
$36,754
-----------------36,69236,296
-----------------37,25336,27634,445
-----------------41,47530,524
-----------------39,72829,370
-----------------34,22637,755
-----------------35,61037,898
-----------------36,30736,619
-----------------39,98836,63936,629
-----------------34,32038,60539,687
$41,475
-----------------40,86741,787
-----------------41,122
40,758-----------------
43,39938,371
-----------------42,84336,437
-----------------40,97642,105
-----------------38,60542,443
-----------------44,00241,259
-----------------43,97138,76141,954
-----------------37,44041,92343,571
$44,641
-----------------43,08750,878
-----------------44,154
50,434-----------------
52,67842,865
-----------------50,43441,229
-----------------42,92547,468
-----------------43,28550,729
-----------------49,92043,680
-----------------48,02142,05350,078
-----------------41,57549,24256,006
$36,768
-----------------35,84936,956
-----------------36,26237,36335,390
-----------------41,54833,161
-----------------40,52531,853
-----------------34,91738,920
-----------------34,65438,997
-----------------37,61736,354
-----------------38,48735,56637,106
-----------------33,75939,41140,437
25th %ile
Median (50%)
Avg by Org
75th %ile
Annual Base Salaries10th %ile
90th %ile
$36,735
-----------------36,69735,842
-----------------37,05736,13434,718
-----------------39,63635,617
-----------------41,14132,903
-----------------34,32338,440
-----------------34,29737,751
-----------------34,98437,017
-----------------36,88535,24036,643
-----------------34,90939,44340,711
Avg by Employee

Provides support services to adults or senior clients in residence or day programs. Duties include any or all of the following: provides training and assistance with personal skills and care such as hygiene, clothing care, mobility, taking medicines, managing money, meal preparation, household maintenance, etc. Assists adults with transportation, making and meeting medical and other appointments, community participation, communication, meals, etc.
889Social Services & Mental Health
© 2014 Third Sector New England & Nonprofit Compensation Associates
Senior or Adult Program Assistant
Page 142
Number of Orgs Emps
All Organizations:
By Budget Size: $10,000,000 - $24,999,999 $25,000,000 and overBy Geographic Location: Greater Boston RegionBy Field of Service: Srvcs & Adv: Elderly, developmentally disabled Counseling, crisis interv, mental hlth, medicalBy Number of Employees: 101 - 250 251+By Years of Experience Required: 1 Year 2 - 3 YearsBy Level of Education Required: High School DiplomaBy Gender of Employee: Male FemaleBy Race/Ethnicity of Employee: Black Hispanic or Latino WhiteBy Number of Years in Position: Up to 5 Years 5 - 10 Years 11 - 20 Years More than 20 Years
17
-----------------76
-----------------5
-----------------11
5-----------------
511
-----------------96
-----------------12
-----------------1414
-----------------121113
-----------------1512
95
522
-----------------165230
-----------------15
-----------------292229
-----------------143378
-----------------287119
-----------------411
-----------------182338
-----------------177
53280
-----------------307
865610
$21,879
-------------------
21,879-------------------
20,987-------------------
21,87923,795
-------------------
21,879-------------------
21,84023,046
-------------------21,879
-------------------21,88021,879
-------------------23,046
21,879-------------------
21,84023,44223,088
$23,046
-----------------
25,022-----------------
24,690-----------------
23,04625,075
-----------------
24,232-----------------
23,04623,733
-----------------23,046
-----------------23,04623,046
-----------------23,962
23,046-----------------
23,04624,54426,291
$25,085
-----------------
28,163-----------------
25,314-----------------
23,44226,291
-----------------
26,291-----------------
25,06426,645
-----------------24,213
-----------------25,52225,075
-----------------25,418
25,522-----------------
24,23226,27126,83232,791
$28,205
-----------------
32,656-----------------
35,360-----------------
31,07328,122
-----------------
29,684-----------------
26,31228,517
-----------------26,291
-----------------29,26628,122
-----------------28,268
29,136-----------------
28,08028,82930,950
$32,656
-----------------
32,656-----------------
44,196-----------------
32,65629,869
-----------------
32,656-----------------
29,67532,926
-----------------28,796
-----------------32,65632,639
-----------------32,656
32,656-----------------
32,65632,65632,681
$26,203
-----------------
28,525-----------------
29,996-----------------
26,03726,451
-----------------
27,138-----------------
25,28726,924
-----------------24,986
-----------------26,74225,927
-----------------26,528
26,331-----------------
25,63727,23827,99733,028
25th %ile
Median (50%)
Avg by Org
75th %ile
Annual Base Salaries10th %ile
90th %ile
$26,658
-----------------25,06431,067
-----------------29,133
-----------------28,08025,327
-----------------25,59027,960
-----------------26,62828,673
-----------------25,352
-----------------28,57125,717
-----------------27,56225,78126,831
-----------------25,58529,17628,15633,098
Avg by Employee

890Social Services & Mental Health
Children or Youth Program AssistantProvides support services to children or youth in residence or day programs. Duties include any or all of the following: provides training and assistance with personal and communication skills. Report jobs exclusively involved with education and/or recreation in (259-277).
Valuing our Nonprofit Workforce 2014 Page 143
Number of Orgs Emps
All Organizations:
By Budget Size: $10,000,000 - $24,999,999By Number of Employees: 251+By Years of Experience Required: 1 YearBy Level of Education Required: High School DiplomaBy Gender of Employee: Male FemaleBy Race/Ethnicity of Employee: Black WhiteBy Number of Years in Position: Up to 5 Years
10
-----------------6
-----------------6
-----------------6
-----------------5
-----------------88
-----------------69
-----------------6
156
-----------------38
-----------------76
-----------------123
-----------------128
-----------------7580
-----------------5381
-----------------93
$21,295
-------------------
-------------------22,402
-------------------22,402
-------------------22,402
-------------------21,75320,800
-------------------22,12721,565
-------------------20,800
$24,773
-----------------
-----------------25,272
-----------------24,960
-----------------24,960
-----------------25,06423,702
-----------------24,96024,659
-----------------24,357
$26,291
-----------------
-----------------28,839
-----------------26,291
-----------------26,416
-----------------27,31025,501
-----------------26,41626,291
-----------------25,480
$30,301
-----------------
-----------------32,011
-----------------29,120
-----------------30,971
-----------------31,53327,685
-----------------31,30429,557
-----------------27,622
$33,386
-----------------
-----------------33,929
-----------------32,223
-----------------33,638
-----------------34,13332,946
-----------------33,65933,451
-----------------32,294
$26,969
-----------------
-----------------28,814
-----------------26,998
-----------------27,540
-----------------27,93426,058
-----------------27,72626,913
-----------------25,995
25th %ile
Median (50%)
Avg by Org
75th %ile
Annual Base Salaries10th %ile
90th %ile
$28,010
-----------------28,637
-----------------28,186
-----------------27,685
-----------------27,584
-----------------26,09128,023
-----------------26,79928,118
-----------------26,876
Avg by Employee

Provides personal assistance (i.e. cooking, shopping, housekeeping) and care (i.e. bathing, grooming, feeding, dressing) to elderly and people with disabilities in their homes.
891Social Services & Mental Health
© 2014 Third Sector New England & Nonprofit Compensation Associates
Personal Attendant/Home Health Care Worker
Page 144
Number of Orgs Emps
All Organizations:
By Budget Size: $25,000,000 and overBy Field of Service: Srvcs & Adv: Elderly, developmentally disabledBy Number of Employees: 251+By Years of Experience Required: 1 YearBy Level of Education Required: High School DiplomaBy Gender of Employee: Male FemaleBy Race/Ethnicity of Employee: Black Hispanic or Latino WhiteBy Number of Years in Position: Up to 5 Years 5 - 10 Years
10
-----------------6
-----------------9
-----------------7
-----------------5
-----------------7
-----------------7
10-----------------
767
-----------------85
587
-----------------455
-----------------574
-----------------475
-----------------61
-----------------202
-----------------121455
-----------------8065
315-----------------
26050
-------------------
-------------------
-------------------
-------------------23,343
-------------------
-------------------
-------------------20,238
-------------------
-----------------
-----------------
-----------------
-----------------24,419
-----------------
-----------------
-----------------21,278
-----------------
-----------------
-----------------
-----------------
-----------------25,465
-----------------
-----------------
-----------------21,840
-----------------
-----------------
-----------------
-----------------
-----------------37,440
-----------------
-----------------
-----------------24,357
-----------------
-----------------
-----------------
-----------------
-----------------46,592
-----------------
-----------------
-----------------27,540
-----------------
-----------------
-----------------
-----------------
-----------------30,760
-----------------
-----------------
-----------------22,881
-----------------
25th %ile
Median (50%)
Avg by Org
75th %ile
Annual Base Salaries10th %ile
90th %ile
$26,257
-----------------25,013
-----------------26,657
-----------------27,523
-----------------28,639
-----------------26,294
-----------------25,48426,293
-----------------23,55127,91727,469
-----------------24,09823,279
Avg by Employee

892Social Services & Mental Health
Direct Care CounselorProvides personal assistance (i.e. cooking, shopping, housekeeping) and care (i.e. bathing, grooming, feeding, dressing) to elderly and people with disabilities in an residential program or group home.
Valuing our Nonprofit Workforce 2014 Page 145
Number of Orgs Emps
All Organizations:
By Budget Size: $2,500,000 - $9,999,999 $10,000,000 - $24,999,999 $25,000,000 and overBy Geographic Location: Western Massachusetts Region Greater Boston Region Northeastern Massachusetts RegionBy Field of Service: Srvcs & Adv: Elderly, developmentally disabled Counseling, crisis interv, mental hlth, medicalBy Number of Employees: 101 - 250 251+By Years of Experience Required: 1 Year 2 - 3 YearsBy Level of Education Required: High School Diploma Associate's Degree Bachelor's DegreeBy Gender of Employee: Male FemaleBy Race/Ethnicity of Employee: American Indian/Alaskan Native Asian Black Hispanic or Latino Native Hawaiian/Pacific Islander White Mixed RaceBy Number of Years in Position: Up to 5 Years 5 - 10 Years 11 - 20 Years More than 20 Years
29
-----------------6
1110
-----------------876
-----------------17
9-----------------
819
-----------------17
6-----------------
2356
-----------------2327
-----------------5
172420
72611
-----------------26252216
5,803
-----------------1,1461,1423,506
-----------------1,943
802957
-----------------3,8391,725
-----------------812
4,982-----------------
1,685257
-----------------5,098
57141
-----------------2,2803,438
-----------------1263
2,984449
81,815
110-----------------
3,840828372
60
$21,424
-------------------21,21617,53421,840
-------------------21,40318,42722,880
-------------------21,65321,403
-------------------16,99421,840
-------------------21,40323,192
-------------------21,653
22,880-------------------
21,42421,403
-------------------23,32320,86621,84021,403
21,40321,653
-------------------21,40322,47223,17722,025
$23,026
-----------------22,88023,02623,192
-----------------22,23521,42423,421
-----------------23,19222,880
-----------------21,23723,026
-----------------22,88023,203
-----------------23,026
24,492-----------------
23,09322,880
-----------------24,91421,84022,88022,880
23,21323,338
-----------------22,88024,19024,48724,971
$24,357
-----------------24,27424,62724,357
-----------------23,81623,19224,482
-----------------24,41923,920
-----------------25,99024,274
-----------------24,04525,563
-----------------24,274
26,645-----------------
24,40924,274
-----------------26,67624,41924,04524,27425,07524,56524,357
-----------------23,92025,06426,18828,690
$26,520
-----------------26,35427,34726,478
-----------------26,35626,22926,000
-----------------26,41626,874
-----------------28,62126,000
-----------------26,22928,995
-----------------26,130
29,318-----------------
26,52026,400
-----------------28,01328,49625,91226,541
27,04025,969
-----------------26,00027,06129,34430,852
$29,099
-----------------29,44529,09928,689
-----------------29,41128,62127,543
-----------------28,49631,075
-----------------30,88228,496
-----------------29,06632,731
-----------------28,621
35,005-----------------
28,62129,120
-----------------31,75131,66227,99730,285
29,70228,107
-----------------28,62129,06431,91232,870
$24,918
-----------------24,83324,82124,973
-----------------24,82923,95125,092
-----------------24,80625,182
-----------------25,35624,844
-----------------24,76926,926
-----------------24,826
27,803-----------------
24,90524,854
-----------------26,90025,36024,60325,10925,50125,29224,750
-----------------24,55625,81826,93228,134
25th %ile
Median (50%)
Avg by Org
75th %ile
Annual Base Salaries10th %ile
90th %ile
$26,062
-----------------24,63925,34227,260
-----------------24,94328,26326,742
-----------------26,26226,107
-----------------25,19426,192
-----------------25,81126,738
-----------------24,66027,23029,331
-----------------24,95125,990
-----------------27,39925,66624,62924,10225,56226,29024,571
-----------------24,81025,28426,56927,645
Avg by Employee

Conducts outreach (both individually and as a team member) to members of target populations within the community to build strong relationships with youth, residents, businesses, and community groups. Identifies at-risk community members and intervenes in their lives through case management and other programs designed to aid in resolving current problems and preventing future ones. Conducts presentations in targeted schools and community organizations and make referrals at outreach events and on websites. Maintains client charts and documentation. Submits logs and reports as required.
893Social Services & Mental Health
© 2014 Third Sector New England & Nonprofit Compensation Associates
Outreach and Prevention Worker
Page 146
Number of Orgs Emps
All Organizations:
By Budget Size: $2,500,000 - $9,999,999 $25,000,000 and overBy Geographic Location: Western Massachusetts Region Greater Boston Region Southeastern Massachusetts/Rhode Island RegionBy Field of Service: Srvcs & Adv: Children and youth Srvcs & Adv: Elderly, developmentally disabled Counseling, crisis interv, mental hlth, medicalBy Number of Employees: 26 - 50 101 - 250 251+By Years of Experience Required: 1 Year 2 - 3 YearsBy Level of Education Required: High School Diploma Bachelor's DegreeBy Gender of Employee: Male FemaleBy Race/Ethnicity of Employee: Black Hispanic or Latino White Mixed RaceBy Number of Years in Position: Up to 5 Years 5 - 10 Years 11 - 20 Years
26
-----------------99
-----------------765
-----------------678
-----------------599
-----------------8
11-----------------
915
-----------------1221
-----------------111220
5-----------------
201311
291
-----------------88
146-----------------
1181149
-----------------4072
145-----------------
1979
174-----------------
34102
-----------------82
136-----------------
66222
-----------------3234
19311
-----------------185
4316
$24,960
-------------------
26,672-------------------
21,278
25,813-------------------
25,010
28,496-------------------
26,947-------------------
25,56428,894
-------------------20,88129,120
-------------------21,27824,960
-------------------24,96026,30224,960
-------------------24,96028,67932,279
$27,643
-----------------
28,959-----------------
25,542
28,569-----------------
27,191
30,493-----------------
29,120-----------------
27,89331,559
-----------------24,96031,990
-----------------26,14128,496
-----------------28,74530,33126,947
-----------------27,10330,61833,644
$31,990
-----------------
33,041-----------------
29,82738,75033,072
-----------------30,857
34,050-----------------
33,041-----------------
33,07235,360
-----------------26,12535,227
-----------------30,46232,604
-----------------31,09632,57331,99028,496
-----------------31,20035,00637,378
$37,440
-----------------
39,354-----------------
32,994
37,399-----------------
33,072
39,593-----------------
38,053-----------------
38,58939,936
-----------------29,39539,983
-----------------35,53437,471
-----------------36,96737,39337,784
-----------------35,84940,66441,132
$41,000
-----------------
41,860-----------------
37,197
45,594-----------------
35,824
41,049-----------------
41,000-----------------
45,67741,684
-----------------37,02843,027
-----------------40,00641,563
-----------------39,41839,98842,365
-----------------39,96149,22951,228
$32,901
-----------------
34,321-----------------
30,15839,92533,612
-----------------30,890
35,007-----------------
33,982-----------------
34,83635,509
-----------------27,47336,610
-----------------31,01033,452
-----------------32,05933,01933,18729,462
-----------------31,80137,51438,799
25th %ile
Median (50%)
Avg by Org
75th %ile
Annual Base Salaries10th %ile
90th %ile
$35,981
-----------------35,31135,221
-----------------31,75041,60938,644
-----------------35,27936,26034,600
-----------------36,46439,18533,157
-----------------40,70935,702
-----------------33,33139,347
-----------------32,57536,379
-----------------32,47433,59335,87531,363
-----------------34,43337,22139,949
Avg by Employee

905Volunteer, Membership & Marketing
Volunteer DirectorRecruits, trains and coordinates the activities of the organization's volunteers. Maintains volunteer database. Nurtures volunteers to improve their connection to the organization. Identifies work throughout the organization that can be accomplished by volunteers and promotes their services. Recognizes volunteer service on a regular basis, both formally and informally. Identifies leaders among the volunteers and recruits them for additional responsibilities.
Valuing our Nonprofit Workforce 2014 Page 147
Number of Orgs Emps
All Organizations:
By Budget Size: $2,500,000 - $9,999,999By Level of Education Required: Bachelor's DegreeBy Gender of Employee: FemaleBy Race/Ethnicity of Employee: WhiteBy Number of Years in Position: Up to 5 Years
9
-----------------5
-----------------7
-----------------8
-----------------9
-----------------6
9
-----------------5
-----------------7
-----------------8
-----------------9
-----------------6
-------------------
-------------------
-------------------
-------------------
-------------------
-----------------
-----------------
-----------------
-----------------
-----------------
$51,646
-----------------55,328
-----------------52,978
-----------------52,312
-----------------51,646
-----------------54,153
-----------------
-----------------
-----------------
-----------------
-----------------
-----------------
-----------------
-----------------
-----------------
-----------------
$51,746
-----------------56,397
-----------------54,425
-----------------52,517
-----------------51,746
-----------------56,028
25th %ile
Median (50%)
Avg by Org
75th %ile
Annual Base Salaries10th %ile
90th %ile
$51,746
-----------------56,397
-----------------54,425
-----------------52,517
-----------------51,746
-----------------56,028
Avg by Employee

Responsible for recruiting new volunteers, training and coordinating the organization's volunteer staff. Provides administrative support to program.
906Volunteer, Membership & Marketing
© 2014 Third Sector New England & Nonprofit Compensation Associates
Volunteer Coordinator
Page 148
Number of Orgs Emps
All Organizations:
By Budget Size: $1,000,000 - $2,499,999 $2,500,000 - $9,999,999By Geographic Location: Western Massachusetts Region Greater Boston RegionBy Field of Service: Srvcs & Adv: Children and youthBy Number of Employees: 26 - 50By Years of Experience Required: 1 Year 2 - 3 YearsBy Level of Education Required: High School Diploma Bachelor's DegreeBy Gender of Employee: FemaleBy Race/Ethnicity of Employee: WhiteBy Number of Years in Position: Up to 5 Years 5 - 10 Years
24
-----------------5
10-----------------
610
-----------------5
-----------------7
-----------------5
11-----------------
512
-----------------22
-----------------22
-----------------17
5
31
-----------------5
14-----------------
814
-----------------7
-----------------9
-----------------7
14-----------------
714
-----------------25
-----------------24
-----------------18
5
$26,998
-------------------
27,248-------------------
31,159-------------------
-------------------
-------------------
30,160-------------------
31,495-------------------
26,083-------------------
25,896-------------------
26,645
$30,160
-----------------
33,022-----------------
35,001-----------------
-----------------
-----------------
31,839-----------------
38,813-----------------
30,580-----------------
30,370-----------------
30,160
$37,440
-----------------39,58240,831
-----------------31,68940,674
-----------------45,302
-----------------45,032
-----------------35,36042,286
-----------------33,69642,006
-----------------38,251
-----------------36,400
-----------------35,56838,834
$44,990
-----------------
46,618-----------------
45,370-----------------
-----------------
-----------------
46,618-----------------
46,618-----------------
45,011-----------------
42,333-----------------
43,243
$48,818
-----------------
49,795-----------------
49,795-----------------
-----------------
-----------------
49,795-----------------
50,263-----------------
48,069-----------------
49,660-----------------
49,286
$37,064
-----------------37,67339,954
-----------------35,34240,575
-----------------44,378
-----------------41,578
-----------------36,01740,217
-----------------32,43342,025
-----------------37,078
-----------------36,563
-----------------36,59339,121
25th %ile
Median (50%)
Avg by Org
75th %ile
Annual Base Salaries10th %ile
90th %ile
$37,109
-----------------37,67339,644
-----------------34,37741,871
-----------------43,927
-----------------41,218
-----------------37,36940,654
-----------------30,60541,445
-----------------37,063
-----------------36,942
-----------------36,97239,121
Avg by Employee

910Volunteer, Membership & Marketing
Communications Director/ManagerActs as the spokesperson for the organization within the community, to government, prospective funders and others. Markets and promotes the organization's goals and objectives in order to develop grass-roots support within the community. Coordinates media and public relations activities, and supervises public relations staff.
Valuing our Nonprofit Workforce 2014 Page 149
Number of Orgs Emps
All Organizations:
By Budget Size: $1,000,000 - $2,499,999 $2,500,000 - $9,999,999 $25,000,000 and overBy Geographic Location: Greater Boston Region Southeastern Massachusetts/Rhode Island RegionBy Field of Service: Arts, culture, recreationBy Number of Employees: 11 - 25 26 - 50By Years of Experience Required: 4 - 6 Years 7 - 10 YearsBy Level of Education Required: Bachelor's DegreeBy Gender of Employee: Male FemaleBy Race/Ethnicity of Employee: WhiteBy Number of Years in Position: Up to 5 Years 5 - 10 YearsBy Number of Employees Managed: 1 to 3 4 to 8
26
-----------------5
125
-----------------14
5-----------------
6-----------------
66
-----------------95
-----------------18
-----------------5
21-----------------
23-----------------
165
-----------------14
5
30
-----------------6
155
-----------------17
6-----------------
7-----------------
77
-----------------96
-----------------21
-----------------5
23-----------------
26-----------------
205
-----------------14
5
$60,240
-------------------
72,538
-------------------64,299
-------------------
-------------------
-------------------
-------------------62,974
-------------------
58,957-------------------
59,478-------------------
62,687
-------------------55,048
$70,445
-----------------
79,997
-----------------74,113
-----------------
-----------------
-----------------
-----------------68,796
-----------------
65,499-----------------
70,445-----------------
67,844
-----------------61,800
$81,682
-----------------76,76285,28073,346
-----------------82,56486,580
-----------------65,499
-----------------85,28082,564
-----------------79,997
100,859-----------------
81,203-----------------
95,99279,997
-----------------81,682
-----------------84,63582,160
-----------------80,600
108,576
$93,319
-----------------
95,992
-----------------94,318
-----------------
-----------------
-----------------
-----------------92,924
-----------------
88,150-----------------
94,261-----------------
95,082
-----------------87,043
$107,318
-----------------
128,140
-----------------123,298
-----------------
-----------------
-----------------
-----------------105,959
-----------------
94,836-----------------
111,540-----------------
117,468
-----------------94,672
$82,998
-----------------76,07992,49573,513
-----------------86,38085,641
-----------------75,325
-----------------79,34687,881
-----------------77,616
106,285-----------------
81,871-----------------
98,76279,039
-----------------83,533
-----------------85,98283,480
-----------------76,615
104,096
25th %ile
Median (50%)
Avg by Org
75th %ile
Annual Base Salaries10th %ile
90th %ile
$80,224
-----------------72,71089,68573,513
-----------------82,75883,912
-----------------72,164
-----------------77,08384,203
-----------------77,616
108,957-----------------
79,172-----------------
98,76277,048
-----------------80,897
-----------------82,21983,480
-----------------76,615
104,096
Avg by Employee

Plans and produces print and other advertising programs. Develops and implements promotional, publicity and marketing programs. Represents the organization to the community, government and media to publicize its programs and needs. Seeks and develops opportunities to enhance the image of the organization within the community. Develops public relations budget and controls costs in approved budgets.
915Volunteer, Membership & Marketing
© 2014 Third Sector New England & Nonprofit Compensation Associates
Public Relations Manager
Page 150
Number of Orgs Emps
All Organizations:
By Budget Size: $1,000,000 - $2,499,999 $2,500,000 - $9,999,999By Geographic Location: Western Massachusetts Region Central Massachusetts Region Greater Boston RegionBy Field of Service: Srvcs & Adv: Elderly, developmentally disabled Arts, culture, recreationBy Number of Employees: 11 - 25 26 - 50 101 - 250By Years of Experience Required: 2 - 3 Years 4 - 6 YearsBy Level of Education Required: Bachelor's DegreeBy Gender of Employee: FemaleBy Race/Ethnicity of Employee: WhiteBy Number of Years in Position: Up to 5 Years
26
-----------------5
14-----------------
686
-----------------58
-----------------685
-----------------7
12-----------------
17-----------------
21-----------------
23-----------------
15
26
-----------------5
14-----------------
686
-----------------58
-----------------685
-----------------7
12-----------------
17-----------------
21-----------------
23-----------------
15
$42,827
-------------------
42,202-------------------
-------------------
-------------------
-------------------
42,314-------------------
42,315-------------------
42,515-------------------
42,640-------------------
45,160
$49,551
-----------------
50,692-----------------
-----------------
-----------------
-----------------
52,078-----------------
50,669-----------------
48,693-----------------
49,982-----------------
50,128
$57,138
-----------------49,98258,999
-----------------58,57352,03162,182
-----------------57,13850,055
-----------------52,03156,01557,138
-----------------54,08060,008
-----------------57,990
-----------------57,616
-----------------57,616
-----------------57,138
$60,351
-----------------
63,133-----------------
-----------------
-----------------
-----------------
66,108-----------------
63,315-----------------
63,315-----------------
61,318-----------------
65,312
$70,182
-----------------
77,761-----------------
-----------------
-----------------
-----------------
72,320-----------------
69,647-----------------
72,854-----------------
71,785-----------------
76,993
$56,266
-----------------48,70158,121
-----------------56,28851,12964,245
-----------------54,28951,685
-----------------52,60759,06454,500
-----------------53,90558,883
-----------------57,185
-----------------57,049
-----------------56,783
-----------------58,360
25th %ile
Median (50%)
Avg by Org
75th %ile
Annual Base Salaries10th %ile
90th %ile
$56,266
-----------------48,70158,121
-----------------56,28851,12964,245
-----------------54,28951,685
-----------------52,60759,06454,500
-----------------53,90558,883
-----------------57,185
-----------------57,049
-----------------56,783
-----------------58,360
Avg by Employee

917Volunteer, Membership & Marketing
Marketing CoordinatorPerforms a variety of marketing-related tasks under general supervision, including development of advertising materials, direct mail campaigns and events. Prepares proposals, presentations and reports.
Valuing our Nonprofit Workforce 2014 Page 151
Number of Orgs Emps
All Organizations:
By Budget Size: $250,000 - $999,999 $2,500,000 - $9,999,999By Geographic Location: Western Massachusetts Region Greater Boston Region Southeastern Massachusetts/Rhode Island RegionBy Field of Service: Srvcs & Adv: Children and youth Arts, culture, recreationBy Number of Employees: 11 - 25 101 - 250By Years of Experience Required: 2 - 3 YearsBy Level of Education Required: Bachelor's DegreeBy Gender of Employee: Male FemaleBy Race/Ethnicity of Employee: WhiteBy Number of Years in Position: Up to 5 Years
28
-----------------8
12-----------------
876
-----------------5
11-----------------
79
-----------------12
-----------------15
-----------------7
17-----------------
19-----------------
21
28
-----------------8
12-----------------
876
-----------------5
11-----------------
79
-----------------12
-----------------15
-----------------7
17-----------------
19-----------------
21
$33,103
-------------------
32,698-------------------
-------------------
-------------------
-------------------35,572
-------------------32,947
-------------------
32,852-------------------
33,280-------------------
32,614
$35,568
-----------------
36,259-----------------
-----------------
-----------------
-----------------37,112
-----------------35,547
-----------------
36,431-----------------
35,630-----------------
35,277
$40,779
-----------------37,15944,356
-----------------39,23941,99539,520
-----------------35,00641,600
-----------------37,00342,001
-----------------41,600
-----------------40,019
-----------------37,00341,600
-----------------40,394
-----------------40,019
$45,037
-----------------
51,168-----------------
-----------------
-----------------
-----------------45,037
-----------------47,778
-----------------
43,860-----------------
45,718-----------------
41,998
$52,104
-----------------
54,049-----------------
-----------------
-----------------
-----------------48,404
-----------------52,416
-----------------
52,208-----------------
52,000-----------------
50,744
$40,933
-----------------36,67043,953
-----------------40,14443,10240,945
-----------------36,69640,679
-----------------38,03143,768
-----------------41,333
-----------------41,298
-----------------40,40841,020
-----------------41,148
-----------------39,612
25th %ile
Median (50%)
Avg by Org
75th %ile
Annual Base Salaries10th %ile
90th %ile
$40,933
-----------------36,67043,953
-----------------40,14443,10240,945
-----------------36,69640,679
-----------------38,03143,768
-----------------41,333
-----------------41,298
-----------------40,40841,020
-----------------41,148
-----------------39,612
Avg by Employee

Uses desktop publishing and related software/hardware to design and develop attractive formats supportive of the organization's mission for all printed materials including stationery, marketing brochures, fundraising materials, grant applications, annual reports, newsletters, posters, advertisements, packaging, etc. May coordinate production of finished products with printers/publishers. May also develop and illustrate materials with other media (e.g. drawings, photographs, paintings).
920Volunteer, Membership & Marketing
© 2014 Third Sector New England & Nonprofit Compensation Associates
Graphic Artist
Page 152
Number of Orgs Emps
All Organizations:
By Budget Size: $2,500,000 - $9,999,999By Field of Service: Arts, culture, recreationBy Years of Experience Required: 2 - 3 YearsBy Level of Education Required: Bachelor's DegreeBy Gender of Employee: FemaleBy Race/Ethnicity of Employee: WhiteBy Number of Years in Position: Up to 5 Years
12
-----------------8
-----------------5
-----------------9
-----------------9
-----------------8
-----------------11
-----------------11
12
-----------------8
-----------------5
-----------------9
-----------------9
-----------------8
-----------------11
-----------------11
$34,697
-------------------
-------------------
-------------------
-------------------
-------------------
-------------------
-------------------
$40,305
-----------------
-----------------
-----------------
-----------------
-----------------
-----------------
-----------------
$49,379
-----------------50,991
-----------------42,661
-----------------49,816
-----------------50,544
-----------------50,180
-----------------49,816
-----------------48,942
$54,730
-----------------
-----------------
-----------------
-----------------
-----------------
-----------------
-----------------
$60,393
-----------------
-----------------
-----------------
-----------------
-----------------
-----------------
-----------------
$48,231
-----------------50,509
-----------------42,676
-----------------47,533
-----------------49,049
-----------------49,771
-----------------49,023
-----------------47,541
25th %ile
Median (50%)
Avg by Org
75th %ile
Annual Base Salaries10th %ile
90th %ile
$48,231
-----------------50,509
-----------------42,676
-----------------47,533
-----------------49,049
-----------------49,771
-----------------49,023
-----------------47,541
Avg by Employee
Writes and edits internal and external materials, including printed and web materials, speeches, opinion pieces, essays, issue papers, background documents, conference materials, and other publications. For grant writers, please see positions #215 and #216 in Development section.
921
Number of Orgs Emps
Writer/Editor
All Organizations:
By Budget Size: $2,500,000 - $9,999,999By Gender of Employee: FemaleBy Race/Ethnicity of Employee: White
7
-----------------6
-----------------6
-----------------6
11
-----------------10
-----------------7
-----------------6
-------------------
-------------------
-------------------
-----------------
-----------------
-----------------
$61,797
-----------------62,037
-----------------61,797
-----------------58,885
-----------------
-----------------
-----------------
-----------------
-----------------
-----------------
$59,335
-----------------59,671
-----------------61,042
-----------------60,469
25th %ile
Median (50%)
Avg by Org
75th %ile
Annual Base Salaries10th %ile
90th %ile
$58,395
-----------------58,798
-----------------58,736
-----------------60,469
Avg by Employee

925Volunteer, Membership & Marketing
Membership Director or ManagerDevelops and implements programs to attract and retain members of the organization; manages the database; oversees regular communications to members including newsletter, invitations to events and activities, and solicitations; ensures members’ inquiries and problems are responded to promptly; researches and develops new methods to increase membership.
Valuing our Nonprofit Workforce 2014 Page 153
Number of Orgs Emps
All Organizations:
By Budget Size: $2,500,000 - $9,999,999By Field of Service: Arts, culture, recreationBy Years of Experience Required: 2 - 3 YearsBy Level of Education Required: Bachelor's DegreeBy Gender of Employee: FemaleBy Race/Ethnicity of Employee: WhiteBy Number of Years in Position: Up to 5 YearsBy Number of Employees Managed: 1 to 3
14
-----------------7
-----------------7
-----------------8
-----------------8
-----------------14
-----------------12
-----------------9
-----------------7
17
-----------------9
-----------------8
-----------------8
-----------------10
-----------------16
-----------------15
-----------------11
-----------------7
$38,817
-------------------
-------------------
-------------------
-------------------
-------------------38,466
-------------------38,114
-------------------
-------------------
$42,016
-----------------
-----------------
-----------------
-----------------
-----------------41,808
-----------------42,432
-----------------
-----------------
$51,563
-----------------60,320
-----------------44,148
-----------------48,464
-----------------52,822
-----------------48,714
-----------------51,563
-----------------51,563
-----------------54,080
$64,740
-----------------
-----------------
-----------------
-----------------
-----------------65,390
-----------------62,400
-----------------
-----------------
$79,302
-----------------
-----------------
-----------------
-----------------
-----------------79,433
-----------------79,564
-----------------
-----------------
$53,813
-----------------59,689
-----------------49,704
-----------------51,706
-----------------54,550
-----------------53,277
-----------------53,743
-----------------55,530
-----------------56,858
25th %ile
Median (50%)
Avg by Org
75th %ile
Annual Base Salaries10th %ile
90th %ile
$53,064
-----------------59,001
-----------------49,985
-----------------51,706
-----------------52,663
-----------------52,767
-----------------52,851
-----------------54,071
-----------------56,858
Avg by Employee
Performs a variety of skilled administrative and clerical duties directly related to membership activities. These include maintaining databases, preparing routine correspondence, developing/sending mass mailings, assisting and participating in special events for members, developing effective working relationships with members to nurture their connection to the organization.
930Membership Assistant/Coordinator
Number of Orgs Emps
All Organizations:
By Budget Size: $1,000,000 - $2,499,999 $2,500,000 - $9,999,999By Field of Service: Arts, culture, recreationBy Years of Experience Required: 2 - 3 YearsBy Level of Education Required: Bachelor's DegreeBy Gender of Employee: FemaleBy Race/Ethnicity of Employee: WhiteBy Number of Years in Position: Up to 5 Years
14
-----------------75
-----------------6
-----------------8
-----------------10
-----------------13
-----------------13
-----------------13
32
-----------------1116
-----------------6
-----------------20
-----------------21
-----------------30
-----------------26
-----------------27
$20,072
-------------------
-------------------
-------------------27,132
-------------------27,681
-------------------19,864
-------------------19,760
-------------------19,760
$27,706
-----------------
-----------------
-----------------30,940
-----------------32,635
-----------------27,955
-----------------28,112
-----------------27,082
$34,278
-----------------28,080
-----------------31,075
-----------------34,642
-----------------35,006
-----------------34,278
-----------------34,278
-----------------33,509
$39,380
-----------------
-----------------
-----------------40,862
-----------------41,642
-----------------39,099
-----------------39,099
-----------------38,418
$44,065
-----------------
-----------------
-----------------44,710
-----------------45,032
-----------------44,708
-----------------45,032
-----------------42,453
$33,298
-----------------27,257
-----------------33,692
-----------------35,591
-----------------36,202
-----------------33,431
-----------------33,429
-----------------32,315
25th %ile
Median (50%)
Avg by Org
75th %ile
Annual Base Salaries10th %ile
90th %ile
$34,424
-----------------31,30440,443
-----------------33,692
-----------------36,719
-----------------36,060
-----------------33,844
-----------------33,971
-----------------33,524
Avg by Employee

Creates and updates content media for website and online social media outlets. Assists with preparing and disseminating accurate, timely information for website(s) and assists with administering content management for all internet/intranet sites. Works closely with internal and external partners to drive social media initiatives. Incorporates new media into organizational communications. Identifies trends and insights on social platforms and devises and manages strategies. Supports organizational social communication strategies and engages prospects in a meaningful way. Identifies, creates, and executes new content strategies for social media and beyond.
935Volunteer, Membership & Marketing
© 2014 Third Sector New England & Nonprofit Compensation Associates
Social Media Specialist
Page 154
Number of Orgs Emps
All Organizations:
By Budget Size: $2,500,000 - $9,999,999By Geographic Location: Greater Boston RegionBy Level of Education Required: Bachelor's DegreeBy Gender of Employee: Male FemaleBy Race/Ethnicity of Employee: WhiteBy Number of Years in Position: Up to 5 Years
11
-----------------5
-----------------5
-----------------9
-----------------58
-----------------8
-----------------11
15
-----------------6
-----------------5
-----------------9
-----------------59
-----------------11
-----------------15
$33,696
-------------------
-------------------
-------------------
-------------------
-------------------
-------------------33,696
$38,397
-----------------
-----------------
-----------------
-----------------
-----------------
-----------------38,397
$44,096
-----------------50,253
-----------------44,096
-----------------43,451
-----------------50,58643,992
-----------------43,992
-----------------44,096
$54,995
-----------------
-----------------
-----------------
-----------------
-----------------
-----------------54,995
$69,826
-----------------
-----------------
-----------------
-----------------
-----------------
-----------------69,826
$48,585
-----------------51,359
-----------------44,574
-----------------42,966
-----------------49,47547,942
-----------------48,757
-----------------48,585
25th %ile
Median (50%)
Avg by Org
75th %ile
Annual Base Salaries10th %ile
90th %ile
$45,858
-----------------49,982
-----------------44,574
-----------------42,966
-----------------49,47546,821
-----------------46,280
-----------------45,858
Avg by Employee

950Other Program or Issues-Based Campaign Positions
Program or Campaign DirectorProvides overall management and direction to one or more large programs including management of staff, developing/controlling the budget, developing/ implementing policies and procedures, participating in obtaining funds/grants, coordinating/integrating program with others in the organization. Typically, this position reports to the Executive Director/Chief Executive Officer, is a member of the senior executive team and directly or indirectly manages a minimum of ten staff. Smaller programs are reported in (955).
Valuing our Nonprofit Workforce 2014 Page 155
Number of Orgs Emps
All Organizations:
By Budget Size: $2,500,000 - $9,999,999By Geographic Location: Greater Boston RegionBy Field of Service: Arts, culture, recreationBy Number of Employees: 11 - 25By Years of Experience Required: 4 - 6 YearsBy Level of Education Required: Bachelor's Degree Master's DegreeBy Gender of Employee: Male FemaleBy Race/Ethnicity of Employee: WhiteBy Number of Years in Position: Up to 5 Years 5 - 10 Years 11 - 20 YearsBy Number of Employees Managed: 1 to 3 4 to 8
17
-----------------11
-----------------7
-----------------5
-----------------6
-----------------8
-----------------10
7-----------------
1013
-----------------14
-----------------11
56
-----------------77
35
-----------------24
-----------------18
-----------------8
-----------------11
-----------------12
-----------------1412
-----------------1520
-----------------29
-----------------17
69
-----------------98
$63,831
-------------------62,109
-------------------64,033
-------------------
-------------------
-------------------60,414
-------------------60,68466,990
-------------------64,33063,020
-------------------62,858
-------------------62,288
-------------------
$69,701
-----------------69,493
-----------------69,139
-----------------
-----------------
-----------------63,264
-----------------64,07578,744
-----------------69,99268,859
-----------------69,847
-----------------67,444
-----------------
$79,414
-----------------80,143
-----------------81,640
-----------------72,330
-----------------70,304
-----------------71,885
-----------------70,14892,852
-----------------85,28075,920
-----------------85,280
-----------------73,63271,88589,669
-----------------73,46677,917
$99,070
-----------------102,991
-----------------101,114
-----------------
-----------------
-----------------85,608
-----------------80,881
106,278-----------------
103,37689,097
-----------------100,454
-----------------87,693
-----------------
$110,352
-----------------116,990
-----------------119,683
-----------------
-----------------
-----------------87,818
-----------------96,325
112,324-----------------
110,352118,179
-----------------114,296
-----------------109,038
-----------------
$83,841
-----------------85,549
-----------------84,896
-----------------75,875
-----------------74,797
-----------------73,374
-----------------73,45492,004
-----------------86,41781,908
-----------------84,451
-----------------79,73479,34593,441
-----------------79,75981,336
25th %ile
Median (50%)
Avg by Org
75th %ile
Annual Base Salaries10th %ile
90th %ile
$80,413
-----------------81,193
-----------------80,988
-----------------75,809
-----------------72,901
-----------------73,133
-----------------75,44891,181
-----------------83,08177,128
-----------------81,923
-----------------77,55880,83789,011
-----------------81,58182,016
Avg by Employee

Provides overall management and supervision to one or two program(s) including supervision of staff, developing/controlling the budget, developing/implementing policies and procedures, participating in obtaining funds/grants, coordinating/integrating program with others in the organization. Typically, this position directly or indirectly manages fewer than ten staff. Larger programs are reported in (950).
955Other Program or Issues-Based Campaign Positions
© 2014 Third Sector New England & Nonprofit Compensation Associates
Program or Campaign Manager
Page 156
Number of Orgs Emps
All Organizations:
By Budget Size: $250,000 - $999,999 $1,000,000 - $2,499,999 $2,500,000 - $9,999,999By Geographic Location: Western Massachusetts Region Greater Boston Region Northeastern Massachusetts RegionBy Field of Service: Srvcs & Adv: Children and youth Arts, culture, recreationBy Number of Employees: 11 - 25By Years of Experience Required: 2 - 3 Years 4 - 6 YearsBy Level of Education Required: Bachelor's Degree Master's DegreeBy Gender of Employee: Male FemaleBy Race/Ethnicity of Employee: WhiteBy Number of Years in Position: Up to 5 Years 5 - 10 Years 11 - 20 YearsBy Number of Employees Managed: 1 to 3 4 to 8
31
-----------------86
10-----------------
711
5-----------------
69
-----------------12
-----------------9
11-----------------
206
-----------------1324
-----------------25
-----------------2111
5-----------------
1010
62
-----------------12
930
-----------------1124
6-----------------
1121
-----------------18
-----------------2217
-----------------3211
-----------------2240
-----------------46
-----------------3318
8-----------------
1315
$42,659
-------------------41,997
42,744-------------------
44,990
-------------------
40,066-------------------
42,465-------------------
41,84842,178
-------------------44,073
-------------------43,20240,906
-------------------40,594
-------------------43,09340,635
-------------------43,05638,288
$49,629
-----------------50,378
47,252-----------------
49,234
-----------------
43,160-----------------
49,899-----------------
45,66147,840
-----------------49,234
-----------------50,83548,256
-----------------49,899
-----------------48,50648,849
-----------------45,43844,990
$53,019
-----------------55,58853,04051,210
-----------------58,80257,08647,861
-----------------51,00250,586
-----------------52,718
-----------------50,79455,931
-----------------52,00066,810
-----------------55,53652,219
-----------------54,496
-----------------53,04053,74865,208
-----------------52,99850,586
$62,681
-----------------67,137
59,135-----------------
69,654
-----------------
52,219-----------------
58,308-----------------
58,58865,458
-----------------58,729
-----------------67,60661,537
-----------------64,189
-----------------62,32859,909
-----------------63,91858,802
$77,530
-----------------79,551
74,780-----------------
81,619
-----------------
59,293-----------------
67,385-----------------
66,40481,053
-----------------64,126
-----------------82,77068,501
-----------------80,556
-----------------69,45168,068
-----------------75,95771,710
$56,375
-----------------58,84857,90554,316
-----------------60,93159,83548,107
-----------------52,17950,005
-----------------53,570
-----------------52,36558,502
-----------------53,72069,576
-----------------59,07154,892
-----------------57,133
-----------------55,66854,74065,216
-----------------56,14152,480
25th %ile
Median (50%)
Avg by Org
75th %ile
Annual Base Salaries10th %ile
90th %ile
$56,568
-----------------55,86255,06158,896
-----------------60,27359,68448,156
-----------------54,08151,044
-----------------52,547
-----------------55,72857,000
-----------------53,98567,451
-----------------61,69455,875
-----------------56,496
-----------------56,95656,72969,247
-----------------58,30555,023
Avg by Employee

960Other Program or Issues-Based Campaign Positions
Program or Campaign CoordinatorAssumes responsibility for the implementation of a single program ensuring compliance with the stated objectives of the project. Coordinates the work of others within the program or project; works with other departments as necessary.
Valuing our Nonprofit Workforce 2014 Page 157
Number of Orgs Emps
All Organizations:
By Budget Size: $250,000 - $999,999 $1,000,000 - $2,499,999 $2,500,000 - $9,999,999By Geographic Location: Western Massachusetts Region Greater Boston Region Southeastern Massachusetts/Rhode Island RegionBy Field of Service: Arts, culture, recreation Environment, conservation, animal welfareBy Number of Employees: 6 - 10 11 - 25 26 - 50By Years of Experience Required: 2 - 3 Years 4 - 6 YearsBy Level of Education Required: Associate's Degree Bachelor's Degree Master's DegreeBy Gender of Employee: Male FemaleBy Race/Ethnicity of Employee: WhiteBy Number of Years in Position: Up to 5 Years 5 - 10 Years 11 - 20 YearsBy Number of Employees Managed: 1 to 3 4 to 8
31
-----------------75
11-----------------
786
-----------------67
-----------------5
106
-----------------17
5-----------------
520
6-----------------
927
-----------------28
-----------------2212
6-----------------
65
76
-----------------11
929
-----------------201918
-----------------1412
-----------------9
2217
-----------------35
6-----------------
751
8-----------------
1260
-----------------65
-----------------4515
7-----------------
610
$35,403
-------------------
35,318-------------------
35,47837,710
-------------------33,37131,604
-------------------
37,71034,291
-------------------35,153
-------------------
35,372
-------------------38,03535,366
-------------------35,759
-------------------35,38035,178
-------------------
$39,728
-----------------
37,805-----------------
38,75041,600
-----------------38,72537,710
-----------------
39,93636,046
-----------------37,900
-----------------
39,375
-----------------40,88839,260
-----------------40,092
-----------------38,47038,251
-----------------
$44,036
-----------------42,20350,44042,744
-----------------44,97044,990
-----------------42,65141,600
-----------------50,44043,59742,744
-----------------43,41043,597
-----------------40,24844,12143,921
-----------------44,86643,680
-----------------44,121
-----------------43,95042,93144,533
-----------------46,84244,327
$50,992
-----------------
45,552-----------------
51,77152,832
-----------------43,58849,405
-----------------
45,90645,552
-----------------50,440
-----------------
50,960
-----------------50,56051,579
-----------------50,981
-----------------50,79451,771
-----------------
$55,447
-----------------
56,160-----------------
55,72157,699
-----------------45,95856,932
-----------------
54,89857,728
-----------------55,549
-----------------
52,720
-----------------55,04756,058
-----------------55,549
-----------------55,75758,165
-----------------
$44,941
-----------------41,64249,17143,388
-----------------45,74147,318
-----------------41,10443,051
-----------------47,92644,18142,869
-----------------44,00343,978
-----------------43,07144,55644,005
-----------------45,54045,150
-----------------45,105
-----------------44,80945,64144,667
-----------------47,36543,096
25th %ile
Median (50%)
Avg by Org
75th %ile
Annual Base Salaries10th %ile
90th %ile
$45,595
-----------------42,35947,72346,023
-----------------47,50749,21643,467
-----------------42,09742,817
-----------------46,58144,68548,143
-----------------44,63944,535
-----------------41,25744,53843,880
-----------------44,71246,014
-----------------45,374
-----------------46,04745,52344,958
-----------------47,36542,624
Avg by Employee

Performs a variety of skilled administrative and clerical duties directly related to program management activities. These include maintaining databases, preparing routine correspondence, providing customer service to clients; and assisting and participating in program events.
965Other Program or Issues-Based Campaign Positions
© 2014 Third Sector New England & Nonprofit Compensation Associates
Program or Campaign Assistant
Page 158
Number of Orgs Emps
All Organizations:
By Budget Size: $1,000,000 - $2,499,999By Geographic Location: Western Massachusetts RegionBy Number of Employees: 11 - 25By Years of Experience Required: 2 - 3 YearsBy Level of Education Required: High School Diploma Bachelor's DegreeBy Gender of Employee: Male FemaleBy Race/Ethnicity of Employee: WhiteBy Number of Years in Position: Up to 5 Years
15
-----------------5
-----------------5
-----------------7
-----------------9
-----------------77
-----------------7
12-----------------
14-----------------
12
34
-----------------8
-----------------13
-----------------8
-----------------20
-----------------1110
-----------------7
27-----------------
26-----------------
26
$24,960
-------------------
-------------------
-------------------
-------------------24,960
-------------------
-------------------
24,128-------------------
26,416-------------------
26,416
$27,758
-----------------
-----------------
-----------------
-----------------27,040
-----------------
-----------------
29,411-----------------
29,058-----------------
27,758
$35,912
-----------------39,978
-----------------
-----------------38,085
-----------------33,187
-----------------36,31737,409
-----------------36,31735,818
-----------------35,672
-----------------36,161
$41,476
-----------------
-----------------
-----------------
-----------------40,779
-----------------
-----------------
41,600-----------------
41,476-----------------
41,860
$44,366
-----------------
-----------------
-----------------
-----------------44,568
-----------------
-----------------
45,464-----------------
45,806-----------------
45,806
$35,306
-----------------36,996
-----------------
-----------------34,965
-----------------33,969
-----------------38,02036,255
-----------------34,54635,503
-----------------35,638
-----------------35,602
25th %ile
Median (50%)
Avg by Org
75th %ile
Annual Base Salaries10th %ile
90th %ile
$33,906
-----------------37,821
-----------------31,091
-----------------34,344
-----------------33,379
-----------------35,51837,445
-----------------34,54632,928
-----------------33,492
-----------------33,999
Avg by Employee
Works with management and constituent organizations to determine specific training needs and learning objectives for constituents, consistent with the organizational mission. May research and develop training content. Designs field training programs (traditional and web-based) and learning initiatives. Creates and updates training materials. Solicits feedback on program content and effectiveness to identify opportunities to improve course design.
970
Number of Orgs Emps
Trainer, Outside Consultants
All Organizations:
By Number of Employees: 251+By Gender of Employee: FemaleBy Race/Ethnicity of Employee: White
6
-----------------5
-----------------5
-----------------6
13
-----------------12
-----------------10
-----------------13
$45,956
-------------------45,943
-------------------
-------------------45,956
$46,270
-----------------46,234
-----------------
-----------------46,270
$52,000
-----------------52,000
-----------------52,000
-----------------52,000
$68,900
-----------------61,750
-----------------
-----------------68,900
$79,323
-----------------77,838
-----------------
-----------------79,323
$56,616
-----------------54,808
-----------------59,744
-----------------56,616
25th %ile
Median (50%)
Avg by Org
75th %ile
Annual Base Salaries10th %ile
90th %ile
$62,015
-----------------58,756
-----------------65,227
-----------------62,015
Avg by Employee

VI. Appendices
Valuing Our Nonprofit Workforce 2014 Page 159
Appendix A: Participating Survey Organizations Organization City Advocates, Inc. Framingham Alzheimer's Association Watertown American Antiquarian Society Worcester The Arc of Greater Haverhill-Newburyport Haverhill The Arc of Opportunity in North Central Massachusetts, Inc. Fitchburg The Association For Community Living Springfield The Bridge of Central Massachusetts, Inc. Worcester ArtsWorcester Worcester Associated Grant Makers Boston Associates for Human Services Taunton Associates of the Boston Public Library Boston Audible Local Ledger, Inc. Mashpee Ballet Theatre of Boston, Inc Cambridge Behavioral Health Network, Inc. Springfield Berkshire Botanical Garden Stockbridge Berkshire Taconic Community Foundation Sheffield Berkshire United Way Pittsfield Better Community Living, Inc. Dartmouth Beverly Historical Society Beverly Berkshire Family And Individual Resources North Adams Bidwell House Museum Monterey Big Brothers Big Sisters of Massachusetts Bay Boston Birth to Three Family Center Ipswich BOAT CAMP Nature School Newburyport Boston Debate League Boston Boston Psychoanalytic Society & Institute Newton Centre Boston Society of Architects Boston Bottom Line Jamaica Plain Boys & Girls Club of Greater Lowell Lowell Bridgewell Lynnfield The Brien Center Pittsfield Bristol Elder Services, Inc. Fall River Brookline Education Foundation Brookline Cambridge Community Center Cambridge Cancer Connection, Inc. Northampton Cantata Singers Boston Cape & Islands Self-Reliance Corporation Cataumet Cape Cod Children's Museum Mashpee Cape Cod Commercial Fishermen's Alliance Chatham

Appendix A: Survey Participants
Page 160 © 2014 Third Sector New England & Nonprofit Compensation Associates
Organization City Castle Square Tenants Organization, Inc. Boston Center for Human Development Springfield Charles River Center Needham Child & Family Services of Newport County, Inc. Middletown, RI Child Care of the Berkshires, Inc. North Adams The Children's Study Home Springfield City Mission Society Boston CLAMS, Inc. Hyannis Communities for People Boston Community Action of the Franklin, Hampshire, and North Quabbin Regions Greenfield Community Action, Inc. Haverhill Community Development Partnership Eastham Community Enterprises, Inc. Northampton Community Foundation for Nantucket Nantucket Community Harvest Project North Grafton Community Health Programs Great Barrington Community Involved in Sustaining Agriculture South Deerfield Community Legal Aid, Inc. Worcester Community MusicWorks Providence, RI Community Servings Jamaica Plain Consumer Assistance Council, Inc. Hyannis Council of Social Concern Woburn Country Dance And Song Society, Inc. Easthampton Crittenton Women's Union Boston Dakin Pioneer Valley Humane Society Springfield Danforth Art Framingham Delta Projects, Inc. North Weymouth Devereux Massachusetts Rutland Dorcas International Institute of Rhode Island Providence, RI Dudley Street Neighborhood Initiative Boston East Boston Social Centers East Boston East Quabbin Land Trust, Inc. Hardwick Easter Seals Massachusetts Worcester Educators for Social Responsibility, Inc. Cambridge Elder Services of Berkshire County, Inc. Pittsfield Elder Services of Merrimack Valley Lawrence Elder Services of Worcester Area, Inc. Worcester Elizabeth Freeman Center Pittsfield Ellis Memorial Boston Elms College Chicopee Employment Options, Inc. Marlborough Energy Consumers Alliance of New England Boston Essex County Greenbelt Association Essex

Appendix A: Survey Participants
Valuing Our Nonprofit Workforce 2014 Page 161
Organization City Exeter Fine Crafts Exeter, NH Falmouth Housing Trust Falmouth Families First Parenting Programs Cambridge Family Nurturing Center of Massachusetts Dorchester The Family Pantry of Cape Cod Harwich Family Service of Rhode Island Providence, RI Family Services of the Merrimack Valley Lawrence Fitchburg Art Museum Fitchburg Five Colleges Incorporated Amherst Flying Cloud Institute New Marlborough For Kids Only Afterschool, Inc. Salem Free Press Florence Gaining Ground Concord Gateway Healthcare, Inc. Pawtucket, RI Gay & Lesbian Advocates & Defenders Boston Gedakina, Inc. Amherst Genesis Spiritual Life Center Westfield Girl Scouts of Central & Western Massachusetts Holyoke Girls Inc. of Holyoke Holyoke Girls Inc. of Worcester Worcester Greater Lynn Senior Services Lynn Greater Springfield Habitat for Humanity West Springfield Greater Waltham Arc Waltham Groundwork Lawrence Lawrence Guidewire, Inc. Springfield The Guild for Human Services Waltham H.C. Nevins Nursing and Rehabilitation Centre Methuen Habitat for Humanity Metrowest/Greater Worcester Worcester Hampshire Regional YMCA Northampton Handel and Haydn Society Boston HAP Housing Springfield Haven from Hunger Peabody The Helen Berube Teen Parent Program Pittsfield Helping Our Women Provincetown Highfield Hall & Gardens Falmouth Highland Valley Elder Services, Inc. Florence Hillcrest Educational Centers Pittsfield Holyoke/Chicopee/Springfield Head Start, Inc. Springfield Home City Housing Development LLC Springfield Hoosic River Watershed Association Williamstown House of Hope Lowell Human Resources Unlimited Springfield Immaculate Conception Shelter and Housing Corporation Hartford, CT
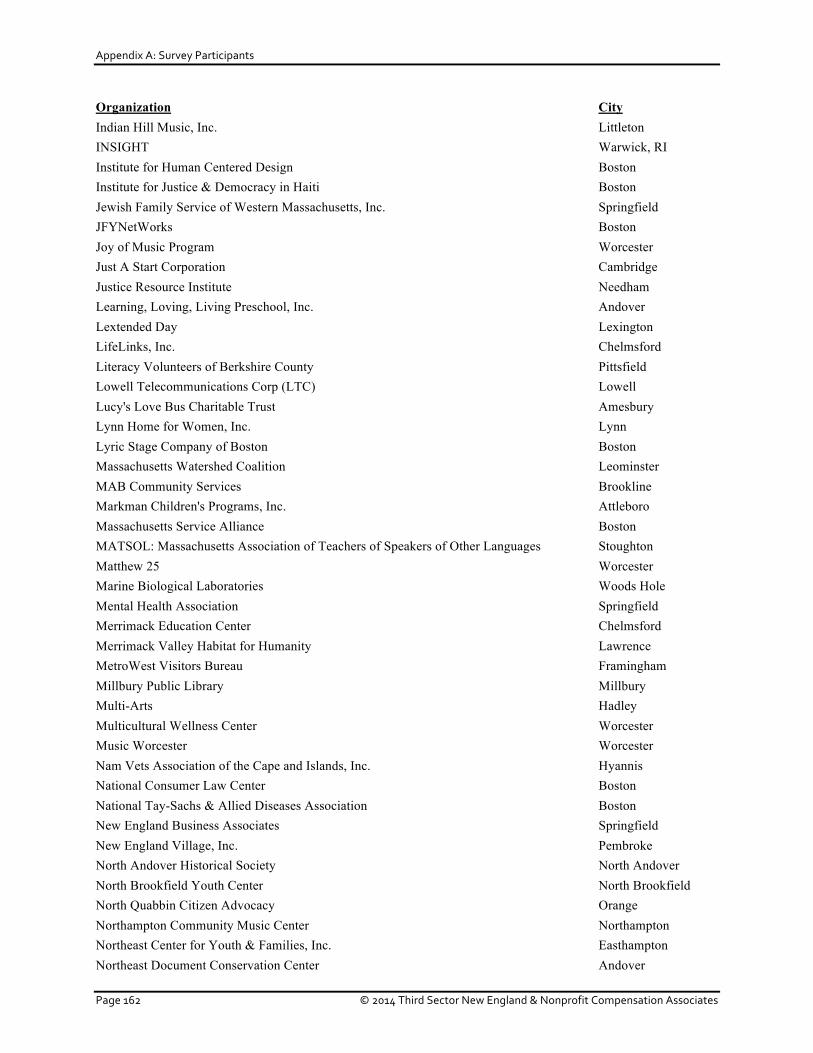
Appendix A: Survey Participants
Page 162 © 2014 Third Sector New England & Nonprofit Compensation Associates
Organization City Indian Hill Music, Inc. Littleton INSIGHT Warwick, RI Institute for Human Centered Design Boston Institute for Justice & Democracy in Haiti Boston Jewish Family Service of Western Massachusetts, Inc. Springfield JFYNetWorks Boston Joy of Music Program Worcester Just A Start Corporation Cambridge Justice Resource Institute Needham Learning, Loving, Living Preschool, Inc. Andover Lextended Day Lexington LifeLinks, Inc. Chelmsford Literacy Volunteers of Berkshire County Pittsfield Lowell Telecommunications Corp (LTC) Lowell Lucy's Love Bus Charitable Trust Amesbury Lynn Home for Women, Inc. Lynn Lyric Stage Company of Boston Boston Massachusetts Watershed Coalition Leominster MAB Community Services Brookline Markman Children's Programs, Inc. Attleboro Massachusetts Service Alliance Boston MATSOL: Massachusetts Association of Teachers of Speakers of Other Languages Stoughton Matthew 25 Worcester Marine Biological Laboratories Woods Hole Mental Health Association Springfield Merrimack Education Center Chelmsford Merrimack Valley Habitat for Humanity Lawrence MetroWest Visitors Bureau Framingham Millbury Public Library Millbury Multi-Arts Hadley Multicultural Wellness Center Worcester Music Worcester Worcester Nam Vets Association of the Cape and Islands, Inc. Hyannis National Consumer Law Center Boston National Tay-Sachs & Allied Diseases Association Boston New England Business Associates Springfield New England Village, Inc. Pembroke North Andover Historical Society North Andover North Brookfield Youth Center North Brookfield North Quabbin Citizen Advocacy Orange Northampton Community Music Center Northampton Northeast Center for Youth & Families, Inc. Easthampton Northeast Document Conservation Center Andover

Appendix A: Survey Participants
Valuing Our Nonprofit Workforce 2014 Page 163
Organization City Northeast Sustainable Energy Assoc., Inc. Greenfield Northeast Waste Management Officials' Association (NEWMOA) Boston Northern Berkshire Community Coalition North Adams OARS: For the Assabet, Sudbury and Concord Rivers Concord Old Colony Elder Services Brockton Old Colony Y Brockton Old Sturbridge Village Sturbridge On The Rise, Inc. Cambridge The Open Door Gloucester Partners for Youth with Disabilities Boston Partnerships for a Skilled Workforce, Inc. Marlborough Pathways for Children, Inc. Gloucester Pediatric Development Center Pittsfield People Making a Difference (PMD) Randolph Pernet Family Health Service Worcester Phoenix House Providence, RI Plimoth Plantation Plymouth The Possible Project Cambridge Providence Ministries Holyoke Railroad Street Youth Project Great Barrington Rainbow Child Development Center Worcester Raw Art Works Lynn RCAP Solutions Gardner REACH Beyond Domestic Violence Waltham Rehabilitative Resources Inc. Sturbridge Rhode Island Land Trust Council Saunderstown, RI Rhode Island Mentoring Partnership Warwick, RI River Valley Counseling Center Holyoke Robert F. Kennedy Children's Action Corps, Inc. Boston Roxbury Youthworks Inc. Roxbury Crossing Samaritans on Cape Cod and the Islands Falmouth Sanger Center for Compassion Quincy School One Providence, RI Seven Hills Foundation Worcester Sheffield Historical Society Sheffield Sight Loss Services, Inc. West Dennis Smith College Museum of Art Northampton Somerville Homeless Coalition Somerville South Africa Partners Boston South Shore Conservatory Hingham Southeast Asian Coalition Worcester Southwest Boston Senior Services (Ethos) Jamaica Plain Spanish American Center, Inc. Leominster

Appendix A: Survey Participants
Page 164 © 2014 Third Sector New England & Nonprofit Compensation Associates
Organization City Springfield Housing Authority Springfield Springfield Partners for Community Action Springfield Springfield Symphony Orchestra, Inc Springfield Square One Springfield Steppingstone Foundation, Inc. Boston Strategies for Children, Inc. Boston Sunshine Village Chicopee The Theater Offensive Boston Third Sector New England Boston Trauma Institute & Child Trauma Institute Inc Northampton Tri-Town Community Action Agency Johnston, RI Truro Center for the Arts at Castle Hill Truro Trustees of the Berkshire Museum Pittsfield Twin Cities CDC Fitchburg Unitarian Universalist Service Committee (UUSC) Cambridge United Methodist Foundation of New England Hampstead, NH United South End Settlements Boston United Way of Hampshire County Northampton United Way of Rhode Island Providence, RI Urban Edge Housing Roxbury Valley Community Development Corporation Northampton Valley Educational Associates Hatfield Valuing Our Children Athol Walker Needham Wayside Youth & Family Support Network Framingham Work, Community, Independence Waltham West Springfield Boys & Girls Club West Springfield Western Mass. Training Consortium Holyoke WestMass ElderCare Holyoke William J. Gould & Associates, Inc Monterey Williamstown Rural Lands Foundation Williamstown Worcester Art Museum Worcester Worcester County Food Bank Shrewsbury Worcester Natural History Society (EcoTarium) Worcester WORK Inc. Dorchester YMCA of Central Massachusetts Worcester YWCA Boston Boston YWCA Greater Newburyport Newburyport YWCA of Central Massachusetts Worcester

Appendix B: Third Sector New England and Survey Partners
Valuing Our Nonprofit Workforce 2014 Page 165
Appendix B: Third Sector New England and Our Survey Partners Third Sector New England Third Sector New England provides management and leadership resources to help nonprofits support healthy, just communities. With a staff of dedicated nonprofit professionals, TSNE is an effective fiscal sponsor, convener, consultant and grant maker, offering a unique blend of capacity-building programs and services focused on strengthening nonprofits for a deeper impact on the communities they serve. Founded in 1959 as the Massachusetts Health Research Institute, Third Sector New England has expanded our programs over the past half century to serve nonprofits throughout New England and across the country. Today, we are using new tools and strategies in our work to support our clients and partners, foundations, colleagues working in nonprofit capacity building, and the many others committed to social change. We also help build collaboration within the sector in efforts such as the Valuing Our Nonprofit Workforce 2014 compensation and benefits report. As a partner, we meet nonprofits where they are, in order to help them succeed in making a positive community impact. Boston, Mass. www.tsne.org Survey Partners Associated Grant Makers is a vibrant community of Massachusetts’ and the surrounding region’s most highly-engaged philanthropic organizations, connecting new and established foundation donors, trustees and staff to each other and to their communities. AGM provides leadership and access to knowledge and it creates the bridge between funders and fund applicants for better understanding, efficiency and philanthropic impact. Boston, Mass. www.agmconnect.org Barr Foundation is guided by a vision for a vibrant, just and sustainable world with hopeful futures for children. Its grant making is focused on enhancing educational and economic opportunities, achieving environmental sustainability and creating rich cultural experiences - all with particular attention to children and families living in poverty. Boston, Mass. www.barrfoundation.org Berkshire Chamber of Commerce is a membership organization of the business community in Berkshire County, MA, that aims to lead and advance economic development and support the civic and social welfare of Berkshire County through the advocacy and support of our members, and the Berkshire Community. The Chamber is not a charitable corporation or financed by the county, city, state, or federal government. We are a private, nonprofit, self-supporting corporation funded by member investments. The Berkshire Chamber unites more than one thousand businesses, professional firms, and organizations, creating a unique central agency working to improve business and build a better community. Berkshire County, Mass. www.berkshirechamber.com Berkshire Health Systems (BHS) is the Berkshire region's leading provider of comprehensive healthcare services. With award-winning programs, nationally-recognized physicians, world-class technology and a sincere commitment to the community, BHS is delivering the kind of advanced healthcare most commonly found in large metropolitan centers. A private, not-for-profit organization, BHS serves the region through a network of affiliates which include Berkshire Medical Center, the BMC Hillcrest Campus, Fairview Hospital, Berkshire Visiting Nurse Association, BHS physician practices, and long-term care associate Berkshire Healthcare Systems. Pittsfield, Mass. www.berkshirehealthsystems.org

Appendix B: Third Sector New England and Survey Partners
Page 166 © 2014 Third Sector New England & Nonprofit Compensation Associates
Berkshire Taconic Community Foundation builds stronger communities and improves the quality of life for all residents of Berkshire County, MA; Columbia County and northeast Dutchess County, NY; and northwest Litchfield County, CT. Since 1987, the foundation has helped thousands of donors achieve their philanthropic goals, and hundreds of nonprofits to carry on their good work. Sheffield, Mass. www.berkshiretaconic.org Berkshire United Way (BUW) was founded as the Pittsfield Community Chest in 1924 and aims to improve the quality of life in Berkshire County by mobilizing resources to address community priorities and create sustainable change. BUW advances the common good by focusing on early childhood literacy, positive youth development and financial stability – the building blocks for a good quality of life – with over $2 million a year in community investments impacting nearly 19,000 lives in the 26 communities of Central and Southern Berkshire County. Pittsfield, Mass. www.berkshireunitedway.org Cape Cod Foundation is a community foundation whose mission is to build permanent charitable resources for community betterment through informed grant making and civic leadership. Since its inception in 1989, the Foundation has distributed more than $50 million back to the community in the form of grants and scholarships to support all that is good about Cape Cod. Yarmouth, Mass. www.capecodfoundation.org Casner & Edwards, LLP is a prominent Boston law firm. The firm emphasizes a hands-on approach to managing business issues and problem solving. It maintains an extensive practice with nonprofit organizations. Boston, Mass. www.casneredwards.com Community Foundation of Western Massachusetts seeks to enrich the quality of life of the people of Hampshire, Hampden and Franklin counties in western Massachusetts, by encouraging philanthropy, developing a permanent, flexible endowment, assessing and responding to emerging and changing needs, serving as a resource, catalyst and coordinator for charitable activities, and promoting efficiency in the management of charitable funds. Springfield, Mass. www.communityfoundation.org Essex County Community Foundation manages charitable funds for donors, and provides grants, services and education to nonprofit leaders to improve the effectiveness and capacity of nonprofit organizations serving Essex County. Danvers, Mass. www.eccf.org Greater Worcester Community Foundation is one of the largest funders for Worcester County. Its knowledge of community needs in health and human services, education and the arts makes it a reliable and trusted resource for donors. Its Nonprofit Support Center offers free and low cost seminars for nonprofits of all types. Worcester, Mass. www.greaterworcester.org Hillcrest Educational Centers, Inc., a top employer in Berkshire County, is a local, private not-for-profit organization providing treatment and special education to children and adolescents with unique emotional and developmental needs. Serving youth from Berkshire County and the region, our campuses include four residential programs and a therapeutic day school. Our recently expanded ASD (Autism Spectrum Disorders) services offers specialized instruction and intensive residential treatment for children and adolescents with all forms of ASD. Our Hillcrest Dental Care, Inc. division is a complete general family dentistry practice and is the largest provider in Western Massachusetts of oral healthcare services to MassHealth recipients and special needs patients. Pittsfield, Mass. www.hillcrestec.org Human Service Forum, founded in 1986, is an association of nonprofit and public agencies and individual professionals providing human services in western Massachusetts. Human Service Forum offers programs for leadership development, staff training and networking meetings, where regional and national experts address cutting edge issues. Holyoke, Mass. www.humanserviceforum.org

Appendix B: Third Sector New England and Survey Partners
Valuing Our Nonprofit Workforce 2014 Page 167
Massachusetts Council of Human Service Providers is the largest statewide association of nonprofit, community-based care giving organizations in Massachusetts. The association’s members provide human services, health, educational and vocational supports. The Council offers high-quality public policy research and advocacy, education, training and business partnership services to benefit its members. Boston, Mass. www.providers.org Massachusetts Cultural Council (MCC) is a Massachusetts State agency that supports the arts, humanities, and sciences to improve the quality of life in Massachusetts. MCC pursues this mission through grants, services and advocacy for nonprofit cultural organizations, schools, communities and artists. Boston, Mass. www.massculturalcouncil.org Massachusetts Nonprofit Network In 2007, hundreds of nonprofits began to find their voice when the Massachusetts Nonprofit Network (MNN) launched as the sector’s unifying statewide association. MNN’s mission is to unite and strengthen the nonprofit sector in the Commonwealth through advocacy, public awareness and capacity-building services. Boston, Mass. www.massnonprofitnet.org United Way of Pioneer Valley mobilizes people and resources to strengthen our communities. Our partners include government, public and private investors, business leaders, community-based organizations and trade associations. UWPV envisions a thriving, caring region where individuals have opportunities to realize their human potential, are economically self-sufficient and contribute collectively to improve the quality of life in their communities. Springfield, Mass. www.uwpv.org United Way of Rhode Island works collaboratively with individuals and organizations to ensure that all Rhode Islanders have the opportunity for a high-quality educational experience, can earn and manage money, can live in stable and affordable housing, and can rely on a safety net in a crisis, enabling them to be contributors in our community. We are a local, independent 501(c) (3) organization, run by a diverse and qualified board of directors that oversee our community initiatives, strategic planning, annual campaign and financial operations. Providence, R.I. www.uwri.org

Appendix C: Wage Conversion Formulas and Tables
Page 168 © 2014 Third Sector New England & Nonprofit Compensation Associates
Appendix C: Wage Conversion Formulas and Tables These tables are based on the following:
Hourly Monthly Annual Hourly Monthly Annual
$ 8.00 $ 1,387 $ 16,640 $ 17.50 $ 3,033 $ 36,400
$ 8.25 $ 1,430 $ 17,160 $ 17.75 $ 3,077 $ 36,920
$ 8.50 $ 1,473 $ 17,680 $ 18.00 $ 3,120 $ 37,440
$ 8.75 $ 1,517 $ 18,200 $ 18.25 $ 3,163 $ 37,960
$ 9.00 $ 1,560 $ 18,720 $ 18.50 $ 3,207 $ 38,480
$ 9.25 $ 1,603 $ 19,240 $ 18.75 $ 3,250 $ 39,000
$ 9.50 $ 1,647 $ 19,760 $ 19.00 $ 3,293 $ 39,520
$ 9.75 $ 1,690 $ 20,280 $ 19.25 $ 3,337 $ 40,040
$ 10.00 $ 1,733 $ 20,800 $ 19.50 $ 3,380 $ 40,560
$ 10.25 $ 1,777 $ 21,320 $ 19.75 $ 3,423 $ 41,080
$ 10.50 $ 1,820 $ 21,840 $ 20.00 $ 3,467 $ 41,600
$ 10.75 $ 1,863 $ 22,360 $ 20.25 $ 3,510 $ 42,120
$ 11.00 $ 1,907 $ 22,880 $ 20.50 $ 3,553 $ 42,640
$ 11.25 $ 1,950 $ 23,400 $ 20.75 $ 3,597 $ 43,160
$ 11.50 $ 1,993 $ 23,920 $ 21.00 $ 3,640 $ 43,680
$ 11.75 $ 2,037 $ 24,440 $ 21.25 $ 3,683 $ 44,200
$ 12.00 $ 2,080 $ 24,960 $ 21.50 $ 3,727 $ 44,720
$ 12.25 $ 2,123 $ 25,480 $ 21.75 $ 3,770 $ 45,240
$ 12.50 $ 2,167 $ 26,000 $ 22.00 $ 3,813 $ 45,760
$ 12.75 $ 2,210 $ 26,520 $ 22.25 $ 3,857 $ 46,280
$ 13.00 $ 2,253 $ 27,040 $ 22.50 $ 3,900 $ 46,800
$ 13.25 $ 2,297 $ 27,560 $ 22.75 $ 3,943 $ 47,320
$ 13.50 $ 2,340 $ 28,080 $ 23.00 $ 3,987 $ 47,840
$ 13.75 $ 2,383 $ 28,600 $ 23.25 $ 4,030 $ 48,360
$ 14.00 $ 2,427 $ 29,120 $ 23.50 $ 4,073 $ 48,880
$ 14.25 $ 2,470 $ 29,640 $ 23.75 $ 4,117 $ 49,400
$ 14.50 $ 2,513 $ 30,160 $ 24.00 $ 4,160 $ 49,920
$ 14.75 $ 2,557 $ 30,680 $ 24.25 $ 4,203 $ 50,440
$ 15.00 $ 2,600 $ 31,200 $ 24.50 $ 4,247 $ 50,960
$ 15.25 $ 2,643 $ 31,720 $ 24.75 $ 4,290 $ 51,480
$ 15.50 $ 2,687 $ 32,240 $ 25.00 $ 4,333 $ 52,000
$ 15.75 $ 2,730 $ 32,760 $ 25.25 $ 4,377 $ 52,520
$ 16.00 $ 2,773 $ 33,280 $ 25.50 $ 4,420 $ 53,040
$ 16.25 $ 2,817 $ 33,800 $ 25.75 $ 4,463 $ 53,560
$ 16.50 $ 2,860 $ 34,320 $ 26.00 $ 4,507 $ 54,080
$ 16.75 $ 2,903 $ 34,840 $ 26.25 $ 4,550 $ 54,600
$ 17.00 $ 2,947 $ 35,360 $ 26.50 $ 4,593 $ 55,120
$ 17.25 $ 2,990 $ 35,880 $ 26.75 $ 4,637 $ 55,640
8 hours in a workday 52 weeks in a year 21.67 days in a month 40 hours in a week 4.33 weeks in a month 2080 hours in a year
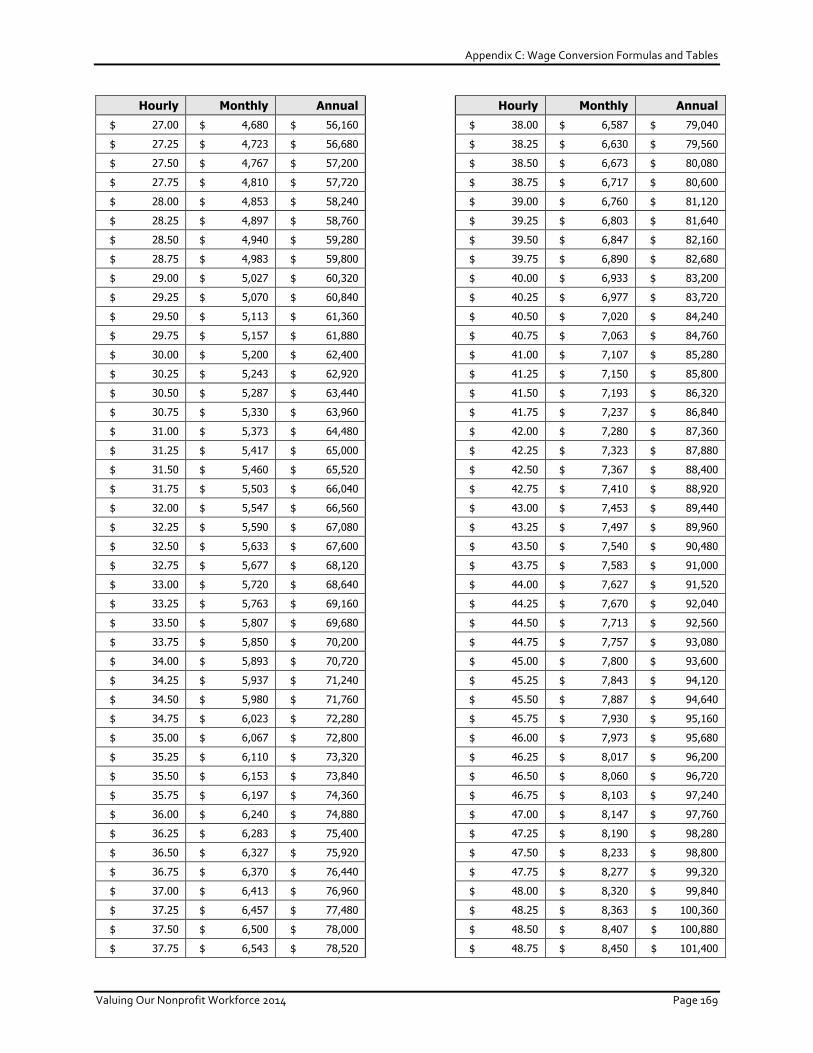
Appendix C: Wage Conversion Formulas and Tables
Valuing Our Nonprofit Workforce 2014 Page 169
Hourly Monthly Annual Hourly Monthly Annual $ 27.00 $ 4,680 $ 56,160 $ 38.00 $ 6,587 $ 79,040
$ 27.25 $ 4,723 $ 56,680 $ 38.25 $ 6,630 $ 79,560
$ 27.50 $ 4,767 $ 57,200 $ 38.50 $ 6,673 $ 80,080
$ 27.75 $ 4,810 $ 57,720 $ 38.75 $ 6,717 $ 80,600
$ 28.00 $ 4,853 $ 58,240 $ 39.00 $ 6,760 $ 81,120
$ 28.25 $ 4,897 $ 58,760 $ 39.25 $ 6,803 $ 81,640
$ 28.50 $ 4,940 $ 59,280 $ 39.50 $ 6,847 $ 82,160
$ 28.75 $ 4,983 $ 59,800 $ 39.75 $ 6,890 $ 82,680
$ 29.00 $ 5,027 $ 60,320 $ 40.00 $ 6,933 $ 83,200
$ 29.25 $ 5,070 $ 60,840 $ 40.25 $ 6,977 $ 83,720
$ 29.50 $ 5,113 $ 61,360 $ 40.50 $ 7,020 $ 84,240
$ 29.75 $ 5,157 $ 61,880 $ 40.75 $ 7,063 $ 84,760
$ 30.00 $ 5,200 $ 62,400 $ 41.00 $ 7,107 $ 85,280
$ 30.25 $ 5,243 $ 62,920 $ 41.25 $ 7,150 $ 85,800
$ 30.50 $ 5,287 $ 63,440 $ 41.50 $ 7,193 $ 86,320
$ 30.75 $ 5,330 $ 63,960 $ 41.75 $ 7,237 $ 86,840
$ 31.00 $ 5,373 $ 64,480 $ 42.00 $ 7,280 $ 87,360
$ 31.25 $ 5,417 $ 65,000 $ 42.25 $ 7,323 $ 87,880
$ 31.50 $ 5,460 $ 65,520 $ 42.50 $ 7,367 $ 88,400
$ 31.75 $ 5,503 $ 66,040 $ 42.75 $ 7,410 $ 88,920
$ 32.00 $ 5,547 $ 66,560 $ 43.00 $ 7,453 $ 89,440
$ 32.25 $ 5,590 $ 67,080 $ 43.25 $ 7,497 $ 89,960
$ 32.50 $ 5,633 $ 67,600 $ 43.50 $ 7,540 $ 90,480
$ 32.75 $ 5,677 $ 68,120 $ 43.75 $ 7,583 $ 91,000
$ 33.00 $ 5,720 $ 68,640 $ 44.00 $ 7,627 $ 91,520
$ 33.25 $ 5,763 $ 69,160 $ 44.25 $ 7,670 $ 92,040
$ 33.50 $ 5,807 $ 69,680 $ 44.50 $ 7,713 $ 92,560
$ 33.75 $ 5,850 $ 70,200 $ 44.75 $ 7,757 $ 93,080
$ 34.00 $ 5,893 $ 70,720 $ 45.00 $ 7,800 $ 93,600
$ 34.25 $ 5,937 $ 71,240 $ 45.25 $ 7,843 $ 94,120
$ 34.50 $ 5,980 $ 71,760 $ 45.50 $ 7,887 $ 94,640
$ 34.75 $ 6,023 $ 72,280 $ 45.75 $ 7,930 $ 95,160
$ 35.00 $ 6,067 $ 72,800 $ 46.00 $ 7,973 $ 95,680
$ 35.25 $ 6,110 $ 73,320 $ 46.25 $ 8,017 $ 96,200
$ 35.50 $ 6,153 $ 73,840 $ 46.50 $ 8,060 $ 96,720
$ 35.75 $ 6,197 $ 74,360 $ 46.75 $ 8,103 $ 97,240
$ 36.00 $ 6,240 $ 74,880 $ 47.00 $ 8,147 $ 97,760
$ 36.25 $ 6,283 $ 75,400 $ 47.25 $ 8,190 $ 98,280
$ 36.50 $ 6,327 $ 75,920 $ 47.50 $ 8,233 $ 98,800
$ 36.75 $ 6,370 $ 76,440 $ 47.75 $ 8,277 $ 99,320
$ 37.00 $ 6,413 $ 76,960 $ 48.00 $ 8,320 $ 99,840
$ 37.25 $ 6,457 $ 77,480 $ 48.25 $ 8,363 $ 100,360
$ 37.50 $ 6,500 $ 78,000 $ 48.50 $ 8,407 $ 100,880
$ 37.75 $ 6,543 $ 78,520 $ 48.75 $ 8,450 $ 101,400

Appendix C: Wage Conversion Formulas and Tables
Page 170 © 2014 Third Sector New England & Nonprofit Compensation Associates
Hourly Monthly Annual Hourly Monthly Annual $ 49.00 $ 8,493 $ 101,920 $ 60.00 $ 10,400 $ 124,800
$ 49.25 $ 8,537 $ 102,440 $ 60.25 $ 10,443 $ 125,320
$ 49.50 $ 8,580 $ 102,960 $ 60.50 $ 10,487 $ 125,840
$ 49.75 $ 8,623 $ 103,480 $ 60.75 $ 10,530 $ 126,360
$ 50.00 $ 8,667 $ 104,000 $ 61.00 $ 10,573 $ 126,880
$ 50.25 $ 8,710 $ 104,520 $ 61.25 $ 10,617 $ 127,400
$ 50.50 $ 8,753 $ 105,040 $ 61.50 $ 10,660 $ 127,920
$ 50.75 $ 8,797 $ 105,560 $ 61.75 $ 10,703 $ 128,440
$ 51.00 $ 8,840 $ 106,080 $ 62.00 $ 10,747 $ 128,960
$ 51.25 $ 8,883 $ 106,600 $ 62.25 $ 10,790 $ 129,480
$ 51.50 $ 8,927 $ 107,120 $ 62.50 $ 10,833 $ 130,000
$ 51.75 $ 8,970 $ 107,640 $ 62.75 $ 10,877 $ 130,520
$ 52.00 $ 9,013 $ 108,160 $ 63.00 $ 10,920 $ 131,040
$ 52.25 $ 9,057 $ 108,680 $ 63.25 $ 10,963 $ 131,560
$ 52.50 $ 9,100 $ 109,200 $ 63.50 $ 11,007 $ 132,080
$ 52.75 $ 9,143 $ 109,720 $ 63.75 $ 11,050 $ 132,600
$ 53.00 $ 9,187 $ 110,240 $ 64.00 $ 11,093 $ 133,120
$ 53.25 $ 9,230 $ 110,760 $ 64.25 $ 11,137 $ 133,640
$ 53.50 $ 9,273 $ 111,280 $ 64.50 $ 11,180 $ 134,160
$ 53.75 $ 9,317 $ 111,800 $ 64.75 $ 11,223 $ 134,680
$ 54.00 $ 9,360 $ 112,320 $ 65.00 $ 11,267 $ 135,200
$ 54.25 $ 9,403 $ 112,840 $ 65.25 $ 11,310 $ 135,720
$ 54.50 $ 9,447 $ 113,360 $ 65.50 $ 11,353 $ 136,240
$ 54.75 $ 9,490 $ 113,880 $ 65.75 $ 11,397 $ 137,760
$ 55.00 $ 9,533 $ 114,400 $ 66.00 $ 11,440 $ 137,280
$ 55.25 $ 9,577 $ 114,920 $ 66.25 $ 11,483 $ 137,800
$ 55.50 $ 9,620 $ 115,440 $ 66.50 $ 11,527 $ 138,320
$ 55.75 $ 9,663 $ 115,960 $ 66.75 $ 11,570 $ 138,840
$ 56.00 $ 9,707 $ 116,480 $ 67.00 $ 11,613 $ 139,360
$ 56.25 $ 9,750 $ 117,000 $ 67.25 $ 11,657 $ 139,880
$ 56.50 $ 9,793 $ 117,520 $ 67.50 $ 11,700 $ 140,400
$ 56.75 $ 9,837 $ 118,040 $ 67.75 $ 11,743 $ 140,920
$ 57.00 $ 9,880 $ 118,560 $ 68.00 $ 11,787 $ 141,440
$ 57.25 $ 9,923 $ 119,080 $ 68.25 $ 11,830 $ 141,960
$ 57.50 $ 9,967 $ 119,600 $ 68.50 $ 11,873 $ 142,480
$ 57.75 $ 10,010 $ 120,120 $ 68.75 $ 11,917 $ 143,000
$ 58.00 $ 10,053 $ 120,640 $ 69.00 $ 11,960 $ 143,520
$ 58.25 $ 10,097 $ 121,160 $ 69.25 $ 12,003 $ 144,040
$ 58.50 $ 10,140 $ 121,680 $ 69.50 $ 12,047 $ 144,560
$ 58.75 $ 10,183 $ 122,200 $ 69.75 $ 12,090 $ 145,080
$ 59.00 $ 10,227 $ 122,720 $ 70.00 $ 12,133 $ 145,600
$ 59.25 $ 10,270 $ 123,240 $ 70.25 $ 12,177 $ 146,120
$ 59.50 $ 10,313 $ 123,760 $ 70.50 $ 12,220 $ 146,640
$ 59.75 $ 10,357 $ 124,280 $ 70.75 $ 12,263 $ 147,160
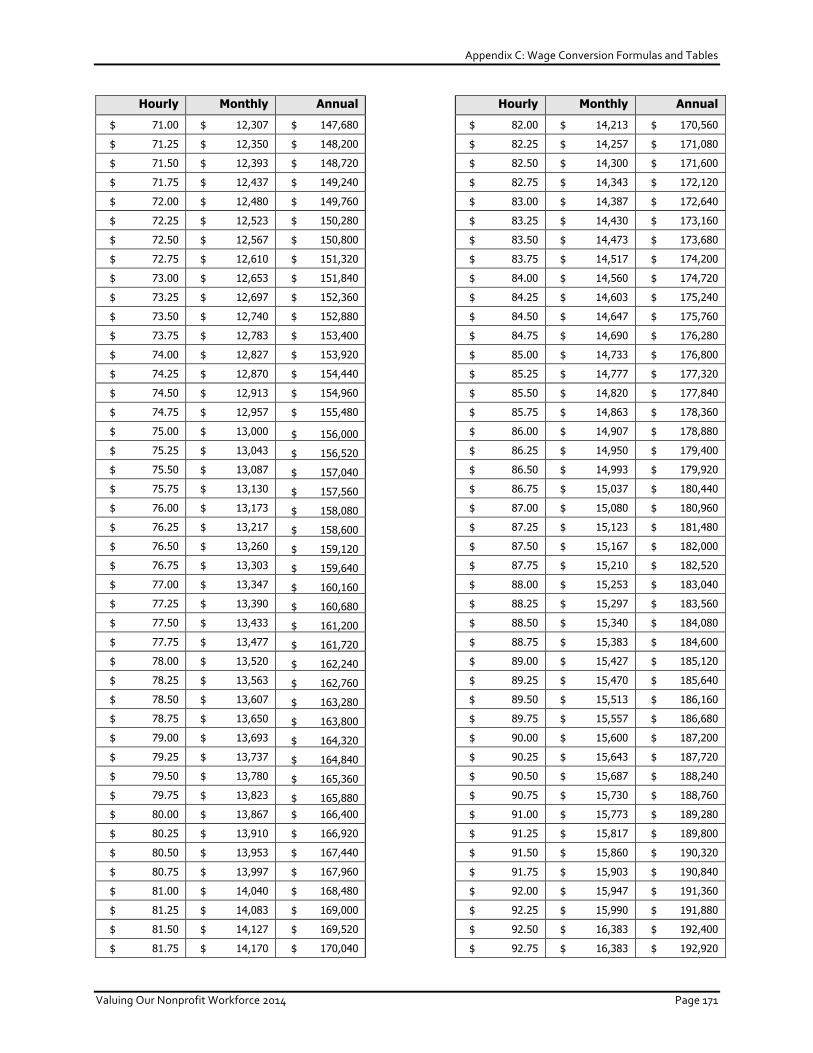
Appendix C: Wage Conversion Formulas and Tables
Valuing Our Nonprofit Workforce 2014 Page 171
Hourly Monthly Annual Hourly Monthly Annual
$ 71.00 $ 12,307 $ 147,680 $ 82.00 $ 14,213 $ 170,560
$ 71.25 $ 12,350 $ 148,200 $ 82.25 $ 14,257 $ 171,080
$ 71.50 $ 12,393 $ 148,720 $ 82.50 $ 14,300 $ 171,600
$ 71.75 $ 12,437 $ 149,240 $ 82.75 $ 14,343 $ 172,120
$ 72.00 $ 12,480 $ 149,760 $ 83.00 $ 14,387 $ 172,640
$ 72.25 $ 12,523 $ 150,280 $ 83.25 $ 14,430 $ 173,160
$ 72.50 $ 12,567 $ 150,800 $ 83.50 $ 14,473 $ 173,680
$ 72.75 $ 12,610 $ 151,320 $ 83.75 $ 14,517 $ 174,200
$ 73.00 $ 12,653 $ 151,840 $ 84.00 $ 14,560 $ 174,720
$ 73.25 $ 12,697 $ 152,360 $ 84.25 $ 14,603 $ 175,240
$ 73.50 $ 12,740 $ 152,880 $ 84.50 $ 14,647 $ 175,760
$ 73.75 $ 12,783 $ 153,400 $ 84.75 $ 14,690 $ 176,280
$ 74.00 $ 12,827 $ 153,920 $ 85.00 $ 14,733 $ 176,800
$ 74.25 $ 12,870 $ 154,440 $ 85.25 $ 14,777 $ 177,320
$ 74.50 $ 12,913 $ 154,960 $ 85.50 $ 14,820 $ 177,840
$ 74.75 $ 12,957 $ 155,480 $ 85.75 $ 14,863 $ 178,360
$ 75.00 $ 13,000 $ 156,000 $ 86.00 $ 14,907 $ 178,880
$ 75.25 $ 13,043 $ 156,520 $ 86.25 $ 14,950 $ 179,400
$ 75.50 $ 13,087 $ 157,040 $ 86.50 $ 14,993 $ 179,920
$ 75.75 $ 13,130 $ 157,560 $ 86.75 $ 15,037 $ 180,440
$ 76.00 $ 13,173 $ 158,080 $ 87.00 $ 15,080 $ 180,960
$ 76.25 $ 13,217 $ 158,600 $ 87.25 $ 15,123 $ 181,480
$ 76.50 $ 13,260 $ 159,120 $ 87.50 $ 15,167 $ 182,000
$ 76.75 $ 13,303 $ 159,640 $ 87.75 $ 15,210 $ 182,520
$ 77.00 $ 13,347 $ 160,160 $ 88.00 $ 15,253 $ 183,040
$ 77.25 $ 13,390 $ 160,680 $ 88.25 $ 15,297 $ 183,560
$ 77.50 $ 13,433 $ 161,200 $ 88.50 $ 15,340 $ 184,080
$ 77.75 $ 13,477 $ 161,720 $ 88.75 $ 15,383 $ 184,600
$ 78.00 $ 13,520 $ 162,240 $ 89.00 $ 15,427 $ 185,120
$ 78.25 $ 13,563 $ 162,760 $ 89.25 $ 15,470 $ 185,640
$ 78.50 $ 13,607 $ 163,280 $ 89.50 $ 15,513 $ 186,160
$ 78.75 $ 13,650 $ 163,800 $ 89.75 $ 15,557 $ 186,680
$ 79.00 $ 13,693 $ 164,320 $ 90.00 $ 15,600 $ 187,200
$ 79.25 $ 13,737 $ 164,840 $ 90.25 $ 15,643 $ 187,720
$ 79.50 $ 13,780 $ 165,360 $ 90.50 $ 15,687 $ 188,240
$ 79.75 $ 13,823 $ 165,880 $ 90.75 $ 15,730 $ 188,760
$ 80.00 $ 13,867 $ 166,400 $ 91.00 $ 15,773 $ 189,280
$ 80.25 $ 13,910 $ 166,920 $ 91.25 $ 15,817 $ 189,800
$ 80.50 $ 13,953 $ 167,440 $ 91.50 $ 15,860 $ 190,320
$ 80.75 $ 13,997 $ 167,960 $ 91.75 $ 15,903 $ 190,840
$ 81.00 $ 14,040 $ 168,480 $ 92.00 $ 15,947 $ 191,360
$ 81.25 $ 14,083 $ 169,000 $ 92.25 $ 15,990 $ 191,880
$ 81.50 $ 14,127 $ 169,520 $ 92.50 $ 16,383 $ 192,400
$ 81.75 $ 14,170 $ 170,040 $ 92.75 $ 16,383 $ 192,920

For more information, contact:Third Sector New EnglandNonProfit Center89 South Street, Suite 700Boston, MA 02111-2670tel 617.523.6565fax [email protected]