A comparison of the standard barbell bench press and …clok.uclan.ac.uk/10110/2/Staniforth Ben...
138
1 A comparison of the standard barbell bench press and novel Bandbell bench press by Ben Staniforth A thesis submitted in partial fulfilment of the requirements for the degree of MSc (by Research) at the University of Central Lancashire June 2014
Transcript of A comparison of the standard barbell bench press and …clok.uclan.ac.uk/10110/2/Staniforth Ben...

1
A comparison of the standard barbell bench press and novel
Bandbell bench press
by
Ben Staniforth
A thesis submitted in partial fulfilment of the requirements for the degree of MSc (by
Research) at the University of Central Lancashire
June 2014

2
STUDENT DECLARATION FORM
Concurrent registration for two or more academic awards
I declare that while registered as a candidate for the research degree, I have not been a
registered candidate or enrolled student for another award of the University or other
academic or professional institution
Material submitted for another award
I declare that no material contained in the thesis has been used in any other submission for
an academic award and is solely my own work
Collaboration
Where a candidate’s research programme is part of a collaborative project, the thesis must
indicate in addition clearly the candidate’s individual contribution and the extent of the
collaboration. Please state below:
Signature of Candidate ______________________________________________________
Type of Award ______________________________________________________
School ______________________________________________________

3
Abstract
The purpose of this study was to compare the kinematics and whole body sEMG of the
barbell with the Bandbell bench press. Twelve subjects with at least five years of resistance
training experience volunteered to take part in the study (height, 190 ± 7 cm; bodyweight,
107 ± 16kg). All subjects were familiar with the bench press exercise and had trained it
consistently during the four weeks prior to the study at approximately 75% 1RM. Subjects’
10RM bench press was tested (115kg ± 21kg) followed by a 4-7 day rest period. A within-
subjects design was used and during experimental testing subjects completed eight bench
press trials of increasing intensity, and with a variety of loading conditions. Distance
travelled of the bar in the sagittal and transverse plane was measured to assess for instability
and to examine any resulting effect of the instability sEMG of the biceps brachii, triceps
brachii, pectoralis major, anterior deltoid, external oblique, latisimus dorsii, vastus lateralis
and gastrocnemius were recorded. It was found that the distance travelled in the sagittal and
transverse planes and mean activation of the biceps brachii and external oblique was
significantly greater with the Bandbell at all intensities. Distance travelled in the sagittal and
transverse planes and mean activation of the biceps brachii were significantly greater for the
Bandbell condition. Therefore, this study shows that the Bandbell is successful at inducing
instability during the bench press and produces greater mean activation in stabilising
musculature.

4
Acknowledgements
I would like to take this opportunity to thank my supervisors. First and foremost to Dr. Chris
Edmundson who has been a great aid to me whilst undertaking this thesis. Not only by
supplying topical knowledge and a much valued opinion but also for being an aid in all other
areas which were encompassed within the MSc. Also, to Dr. Darrell Brooks and Dr. Stephen
Atkins for their specialist input. A special thank you to Dr. Jonnie Sinclair who has always
been generous with his time and more than helpful at every stage. Finally, I would like to
thank the members of Ironman Bodybuilding Centre, and especially Martin Brown, without
whose participation I would not have a study.

5
Table of Contents Abstract ...................................................................................................................................... 3
Acknowledgements .................................................................................................................... 4
Chapter 1 - Introduction ............................................................................................................. 8
Aims of the Study .................................................................................................................. 9
Chapter 2 - Literature Review .................................................................................................. 10
Bench Press .......................................................................................................................... 10
Instability Training............................................................................................................... 11
Electromyography (EMG) ................................................................................................... 18
BandBell .............................................................................................................................. 22
Chapter 3 - Pilot Testing .......................................................................................................... 23
Chapter 4 – Method ................................................................................................................. 26
Experimental Approach to the Problem ............................................................................... 26
Subjects ................................................................................................................................ 26
Instrumentation .................................................................................................................... 27
Procedures ............................................................................................................................ 27
10RM Testing .................................................................................................................. 27
Experimental Testing ........................................................................................................... 28
Loading ............................................................................................................................ 29
Kinematics ....................................................................................................................... 30
Electromyography ............................................................................................................ 31
Intensity............................................................................................................................ 33

6
Condition.......................................................................................................................... 33
Statistical Analysis ............................................................................................................... 33
Chapter 5 - Results ................................................................................................................... 34
Intensity................................................................................................................................ 34
Kinematics ....................................................................................................................... 34
Sagittal Plane ............................................................................................................... 34
Transverse Plane .......................................................................................................... 35
sEMG ............................................................................................................................... 36
Biceps Brachii .............................................................................................................. 36
Triceps Brachii ............................................................................................................. 37
Pectoralis Major ........................................................................................................... 37
Anterior Deltoid ........................................................................................................... 38
Latisimus Dorsii ........................................................................................................... 39
External Oblique .......................................................................................................... 39
Vastus Lateralis ............................................................................................................ 40
Gastrocnemius.............................................................................................................. 41
Condition.............................................................................................................................. 42
Kinematic Data ................................................................................................................ 42
Sagittal Plane ............................................................................................................... 42
Transverse Plane .......................................................................................................... 43
sEMG ............................................................................................................................... 44

7
Biceps Brachii .............................................................................................................. 44
Triceps Brachii ............................................................................................................. 45
Pectoralis Major ........................................................................................................... 45
Anterior Deltoid ........................................................................................................... 46
Latisimus Dorsii ........................................................................................................... 47
External Oblique .......................................................................................................... 48
Vastus Lateralis ............................................................................................................ 49
Gastrocnemius.............................................................................................................. 50
Chapter 6 - Discussion ............................................................................................................. 51
Conclusion ............................................................................................................................... 58
References ................................................................................................................................ 59

8
Chapter 1 - Introduction
The barbell bench press is a popular strength training exercise that is one of the most
common and arguably, the most effective tools for developing upper-body strength. There are
few gyms in the world that do not have a pressing bench and for good reason: since the
1950s, with the advent of powerlifting, and the ‘golden era’ of bodybuilding, the bench press
has become, possibly, the most widely-recognized resistance training movement in the world
(Rippetoe and Kilgore, 2009). The roots of the bench press stem from the decline in
popularity of weightlifting in 1950s America. The bench press used to be considered one of
the many ‘odd lifts’ and eventually rose to prominence in the mid-1960s as one of the, now,
three lifts that constitute the sport of modern Powerlifting, along with the squat and deadlift.
These lifts are performed for one repetition maximums to ascertain maximal upper-body
strength. In powerlifting, the loads lifted in the bench press sometimes exceed bodyweight by
three times (Keogh, Hume and Pearson, 2006). The National Strength and Conditioning
Association recommend the one repetition maximum bench press for measuring upper-body
maximum muscular strength in athletic populations (Baechle and Earle, 2008). The bench
press is also used as a hypertrophy exercise in bodybuilding and general weight training,
involving higher repetitions (Ogasawara et al., 2013).
Resistance training involving balls, platforms and other devices to induce varying degrees of
instability has recently enjoyed a surge in popularity. Proponents of instability resistance
training deduce that the greater instability and human body interface will stress the
neuromuscular system to a greater extent than traditional resistance training methods using
more stable surfaces and loads. The advantage of an unstable training environment would be

9
based on the importance of neuromuscular adaptations with increases in strength (Behm and
Anderson, 2006). Rutherford and Jones (1986) suggested that specific neural adaptation
occurring with training was not increased recruitment or activation of motor units but an
improved coordination of agonist, antagonists, synergists and stabilizers. Thus, the inherently
greater instability of an unstable platform and body interface should challenge the
neuromuscular system to a greater extent than under stable conditions, possibly enhancing
strength gains attributed to neural adaptations.
The Bandbell is a length of fibreglass coated bamboo from which kettlebells or weight plates
are suspended at either end with rubber resistance bands. The bar has been championed by
Louie Simmons of Westside Barbell who states: “We have experimented with the kettlebell
and band pressing for over a year. It works. While lowering the bar to the chest, you of
course must stop the bar from accelerating, but now you must not stop only the bar but also
the kettlebells. This is not easy, as the bands’ elasticity causes the kettlebells to lower further
even as the bar stops. The kettlebells continue to move not only downward, but in all
directions, as an oscillating pendulum, creating a chaotic state. After reaching lock-out, the
kettlebells continue to move upward. All the pressing muscles must work together, as they
seldom do, to provide stability.”
Aims of the Study
Aim 1: Ascertain if the Bandbell bench press elicits a greater amount of instability at a given
intensity when compared to the barbell bench press.
Aim 2: Ascertain if the Bandbell bench press elicits a greater muscle activation at a given
intensity when compared to the barbell bench press.

10
Chapter 2 - Literature Review
Bench Press
The bench press actively works the muscles of the anterior shoulder girdle and the triceps, as
well as the forearm muscles isometrically. The prime movers are the pectoralis major and the
anterior deltoid, which drive the bar up off the chest, and the triceps which drive the elbow to
full extension. The pectoralis minor and posterior rotator cuff muscles act to stabilise and
prevent the rotation of the humerus during the movement. The other posterior muscles – the
trapezius, the rhomboids and other smaller muscles along the cervical and thoracic spine – act
isometrically to adduct the shoulder blades and keep the upper back stable against the bench.
The latisimus dorsii muscles act to rotate the ribcage up, arched relative to the lower back,
decreasing the distance the bar has to travel and adding to the stability of the position. They
also act as a counter to the deltoids, preventing the elbows from adducting, or rising up
towards the head, while the humerus is driving up out of the bottom, thus preventing the
angle between the upper arm and torso from changing during the lift. The muscles of the
lower back, hips and legs act as a bridge between the upper body and the ground, anchoring
and stabilising the chest and arms as they do the work of handling the bar (Rippetoe and
Kilgore, 2009).
Competitive lifting rules and general safety guidelines state that the bar should be kept
horizontal at all times during the bench press. As a result, the path of the long axis of the bar
has typically been described as a para-sagittal plane movement. Madsen and McLaughlin
(1984) describe typical sagittal plane bar paths for both recreational and competitive lifters.
For both groups, the path during the descent phase is nearly linear with a slight inferior

11
deviation as the bar travels from the top to the bottom of the lift. During the lift phase,
recreational lifters display a bar path that remains inferior (caudal) to the downward path
while competitive and elite lifters move the bar closer to the head. In fact, elite lifters display
a noticeable, early superior excursion of the bar as compared with the competitive lifters. The
authors theorize that this pattern leads to greater lifting success by decreasing the moment
created by the bar weight about the shoulder joint during the lift phase. The skilled lifter
group also started and finished the exercise with the bar at a lower height than the unskilled
lifters. The authors analysed high-speed video of the skilled lifters performing during national
and world competitions and did not have direct access to the skilled lifters, therefore, they
were not able to measure upper limb length. They were able to estimate upper body length
from the video however, and found no significant difference between the skilled and novice
groups. With this evidence, the authors suggested that the difference in bar height at the start
of the lift was likely due to a wider grip rather than shorter arms for the skilled lifters
(Madsen and McLaughlin, 1984).
Instability Training
Instability resistance training is frequently used for performance enhancement, rehabilitation
and overall musculoskeletal health. It can involve unstable conditions with body mass or
external loads (e.g. dumbbells, barbells) as resistance (Behm and Anderson, 2006). In a
recently published review, Behm and Sanchez (2013) state that greater core and limb muscle
activation with moderate degrees of instability ensures increased slow- and fast-twitch
muscle fibre activation, even when relatively lower forces or power are employed.
Coordination of the core muscles may be as or more important than the degree of trunk
muscle activation for health and performance. Deep trunk stabilizers (e.g., transversus

12
abdominis and multifidus) respond with anticipatory postural adjustments to movements of
the upper or lower limbs. The activation of stabilizing muscles precedes force application
when unstable. A delayed reflex response of trunk muscles is a risk factor for low back
injuries in athletes. The sensitivity of afferent feedback pathways can be improved with
balance and motor skill training, resulting in quicker activation of stabilizing muscles.
Instability training may promote co-contractions with shorter latency periods that allow more
rapid stiffening and protection of joints. Co-contractile (antagonist) activity increases on
unstable surfaces. The role of the antagonist is to control limb position, increase joint
stiffness, and provide stability.
Verhagen et al. (2004) reported the successful application of balance training to reduce the
incidence of ankle sprains in volleyball players. Behm and Anderson (2006) state that the
decrease in ankle injury incidence may be due to the improved discrimination of ankle
inversion movements found with wobble board training. This improved discrimination
indicates a greater stability of the ankle derived from instability training. When extrapolated
to the shoulder girdle and the causes of injury in powerlifters (anterior shoulder instability), it
may be an indication that specific instability training of the shoulder girdle may also improve
stability and decrease injury incidence.
Welsch, Bird and Mayhew (2005) compared barbell and dumbbell bench press (6RM loads)
and reported no difference in the neuromuscular activity of the pectoralis major and anterior
deltoid. The EMG activity was maintained despite the dumbbell load being only
approximately 63% of the barbell load. This suggests that increased neural drive was required
to stabilise the dumbbell. However, the authors did not record EMG activity of the
agonist/synergist triceps brachii and antagonist biceps brachii muscles. Thus, it is unclear

13
how the increased stability requirement and the reduced absolute load that can be lifted with
dumbbells compared with barbell bench press influence the neuromuscular activity of the
biceps brachii and triceps brachii. This study does however demonstrate the trend for
decreased absolute maximal load that can be lifted when similar movements are performed
under stable (barbell bench press) and unstable (dumbbell bench press) conditions.
Marshall and Murphy (2006) investigated muscle activity using surface EMG of upper-body
and abdominal muscles during the isolated concentric and eccentric phases of the dumbbell
bench press on a flat bench and a Swiss ball. Fourteen resistance trained subjects performed
isolated eccentric and concentric bench press repetitions using the two surfaces with a two
second cadence at a load equivalent to 60% maximum force output. This was calculated as
60% of each subject’s 1RM concentric barbell bench press and for the dumbbell condition the
1RM was obtained using force transducers for each arm, then calculating 60% from this. The
results of the study showed that deltoid and abdominal muscle activity was increased for
repetitions performed using the Swiss ball. Significant effects of the surface were observed
on Rectus Abdominis, Transversus Abdominis/Internal Obliques and Anterior Deltoids.
Pectoralis Major and Triceps Brachii showed no significant difference for the surface
condition. Biceps Brachii, however, did show a strong tendency towards significance (p =
0.07). Despite this study being very well structured in that it investigated unstable loads and
unstable surfaces, separate 1RMs were determined for the different exercises. Also, the
separation of the eccentric and concentric phases of the lift is not a normal procedure. No
details are given of the time between eccentric and concentric efforts.
Norwood et al. (2007) investigated the effectiveness of instability training in the recruitment
of core stabilising musculature during a fixed load (9.1 kg) barbell bench press. Surface EMG
was measured for six muscles – latisimus dorsii, rectus abdominis, internal oblique, erector

14
spinae and soleus. Four conditions were used: stable flat bench, upper body instability (Swiss
ball), lower body instability (flat bench and BOSU ball) and dual instability (Swiss and
BOSU ball). The results showed increases in EMG with increasing instability. Specifically,
the dual instability condition resulted in the greatest mean muscle activation of the three
stability conditions. However, Goodman et al. (2008) stated that in order to make an
appropriate comparison of muscle activation during a given movement under different
conditions, it is important to use the same relative loading. With a fixed load barbell being
used between conditions it is likely that the load would have been at very different
percentages of subjects 1RM for each specific condition.
In contrast to Norwood et al. (2007), Goodman et al. (2008) used relative loading for each
subject and condition and compared 1RM strength and EMG activity of pectoralis major,
anterior deltoid, latisimus dorsii, triceps brachii, biceps brachii and external oblique during
the barbell bench press on a stable (flat bench) and unstable surface (Swiss ball). Thirteen
subjects underwent testing for 1RM strength for the barbell chest press on both a stable bench
and a Swiss ball, each separated by at least 7 days. The results showed there was no
difference in 1RM strength or muscle EMG activity for the stable and unstable conditions.
However, this lack of observed difference may have been because both efforts were 1RM
lifts and therefore maximally engaged the musculature of the whole body, negating any
difference between surfaces. If an absolute load was used between conditions as in Norwood
et al. (2007) an effect of the unstable surface would likely have been seen.
More recently, Uribe et al. (2010) examined the effects of a stable surface (flat bench) and an
unstable surface (Swiss ball) on muscle activation during the dumbbell bench press (and
shoulder press). 16 healthy men performed 1RM tests for the chest press and shoulder press

15
on a stable surface. A minimum of 48 hours post 1RM, subjects returned to perform 3
consecutive repetitions each of the chest press and shoulder press at 80% 1RM under four
different randomized conditions (chest press on bench, chest press on Swiss ball, shoulder
press on bench, shoulder press on Swiss ball). EMG was recorded for anterior deltoid,
pectoralis major and rectus abdominis. The results revealed no significant difference in
muscle activation between surface types. In complete contrast to Goodman et al. (2008),
Uribe et al. (2010) used a sensible intensity for loading parameters, however the exercise was
submaximal and these results are likely due to the fact that 80% 1RM intensity was used for
testing, which should elicit concentric muscular failure at around 8-10 repetitions. With only
three repetitions being performed per set in this study, it is likely that subjects were not
subjected to the 80% 1RM intensity for long enough to elicit a difference in EMG outputs
between conditions. Similarly, McCaw and Friday (1994) found the difference in muscle
activation of the medial and anterior deltoids between machine and free weight bench press
was greater at a lower (60% 1RM) load than it was at a higher (80% 1RM) load. They
suggested that while working against lighter loads, the lowered muscle activity decreases
joint stiffness and subsequently emphasises the role of the medial and anterior deltoid as
stabilizers of the humeral head in the glenoid cavity. However, Schick et al. (2010) did not
have similar findings when using 70% 1RM in the bench press and smith machine bench
press. The authors state that 70% 1RM may have been sufficiently heavy to elicit enough
muscle activity to increase the joint stiffness and limit the stabilizing role of the medial and
anterior deltoid.
Schick et al. (2010) recorded muscle activation of the anterior deltoid, medial deltoid and
pectoralis major, during smith machine and free weight bench press. 70% and 90% 1RM
intensities were used for each exercise and two repetitions were performed at both whilst

16
EMG data was recorded. The main finding was that the activation of the medial deltoid was
significantly higher (approximately 160%) during the free weight bench press. They
concluded that the instability caused by the free weight bench press necessitates a greater
response by the medial deltoid as both a force producer and perhaps more importantly as a
stabiliser. This corroborated the findings of McCaw and Friday (1994) and confirmed the
important stabilising role of the medial deltoid in the glenoid cavity during the concentric
phase of the bench press.
Kohler, Flanagan and Whiting (2010) evaluated the EMG of the anterior deltoid, medial
deltoid, triceps brachii, rectus abdominis, external obliques, upper erector spinae and lower
erector spinae while lifting stable and unstable loads on stable and unstable surfaces during
the seated overhead shoulder press exercise. Thirty resistance trained subjects performed
three sets of three repetitions under two load (barbell and dumbbell) and two surface
(exercise bench and Swiss ball) conditions at a 10RM relative intensity. Results showed that
as the instability of the exercise condition increased, the external load decreased. So, for
example, the dumbbell press on the Swiss ball was the least stable and the lightest load was
used. Triceps Brachii activation increased with external resistance, where the barbell/bench
condition had the greatest EMG activation and dumbbell/Swiss ball condition had the least.
The authors correctly state that physical activity is rarely performed with a stable load on an
unstable surface; usually the surface is stable and the external resistance is not. The free
weight bench press offers instability in all three planes of motion forcing the lifter to contract
the muscles in a more natural fashion, to balance in all three planes of motion while exerting
force at a velocity that is not constant. This is important to the lifter that wants to increase
maximal muscular strength of the prime movers, while engaging the stabilising effect of the
prime movers and stabiliser muscles (Schick et al., 2010).

17
Saeterbakken, Van Der Tillaar and Fimland (2011) compared 1RM and muscle activity in
three “chest-press” exercises with different stability requirements – smith machine bench
press, barbell bench press and dumbbell bench press. EMG activity of the pectoralis major,
anterior deltoid, biceps brachii and triceps brachii were recorded. The dumbbell load was
14% less than for the smith machine and 17% less than that for the barbell bench press. The
barbell bench press load was approximately 3% higher than the smith machine. EMG activity
of the pectoralis major and anterior deltoid did not differ between conditions. Biceps brachii
activation increased with increasing stability requirements (dumbbell bench press>barbell
bench press>smith machine bench press). Triceps brachii activity was reduced using
dumbbells when compared to barbell and smith machine bench press. This shows how much
stability requirements can affect loading of a certain movement. The increased degree of
freedom with the dumbbell bench press resulted in 14-17% less loading than for smith or
barbell bench press. Saeterbakken, Van Der Tillaar and Fimland (2011) concluded that during
rehabilitation it may in some cases be beneficial to achieve high levels of muscle activation
while lifting a lighter external load. However, strength trainers/coaches should be aware that
the dumbbell chest press does not activate the triceps brachii to the same extent as the
conventional bench press. This is why a bench press specific form of instability training is of
paramount importance when trying to improve stability in the bench press. A dumbbell press
deviates too much from the bench press activation patterns. Neuromuscular adaptations and
strength are developed through experience in a given exercise such as the bench press,
improving capability in that exercise.

18
Electromyography (EMG)
Electromyography is the study of the electrical activity in muscle. In humans, it is
traditionally performed either by inserting a wire into the muscle (fine wire or indwelling
EMG) or by placing electrodes on the skin superficial to the muscle (superficial or surface
EMG). The electrodes or wires detect electric current, caused by motor unit action potentials,
as it passes through the muscle. The electrical signal, through an electro-chemical pathway,
initiates the contraction of the muscle. While it is possible to examine the electrical activity of
a single motor unit when using indwelling electrodes, surface EMG will record the activity of
multiple motor units. Thus the recording seen in surface EMG represents a sample of the
summation of the nearby motor unit action potentials (MUAP). In general, as the frequency
of MUAPs increases and more motor units are recruited, the magnitude of the signal recorded
will increase. Frequently, to analyse the magnitude of the signal, the raw EMG signal is full
wave rectified, and then a low pass filter is employed to create a linear envelope. The area
enclosed by this envelope can then be determined and used as a measure of EMG amplitude.
Other options for assessment include taking a mean or a peak value over a period of time.
Along with the amplitude, frequency content of the signal is often examined and used as an
assessment of muscle contraction, particularly fatigue in muscles as well as the type of
muscle fibre contracting. The rationale and the physiologic representation of both of these
measures will be discussed in later sections.
There are many factors that can alter the relationship between the EMG signal and the force
production of a muscle. Some of these factors include: type of EMG electrode (surface versus
indwelling), size of the muscle, distance from the electrodes to the muscle fibres, amount of
tissue (especially fat) between electrodes and the muscle fibres, contact between the skin and
the electrode, and position and orientation of the electrode on or in the muscle (De Luca,
19
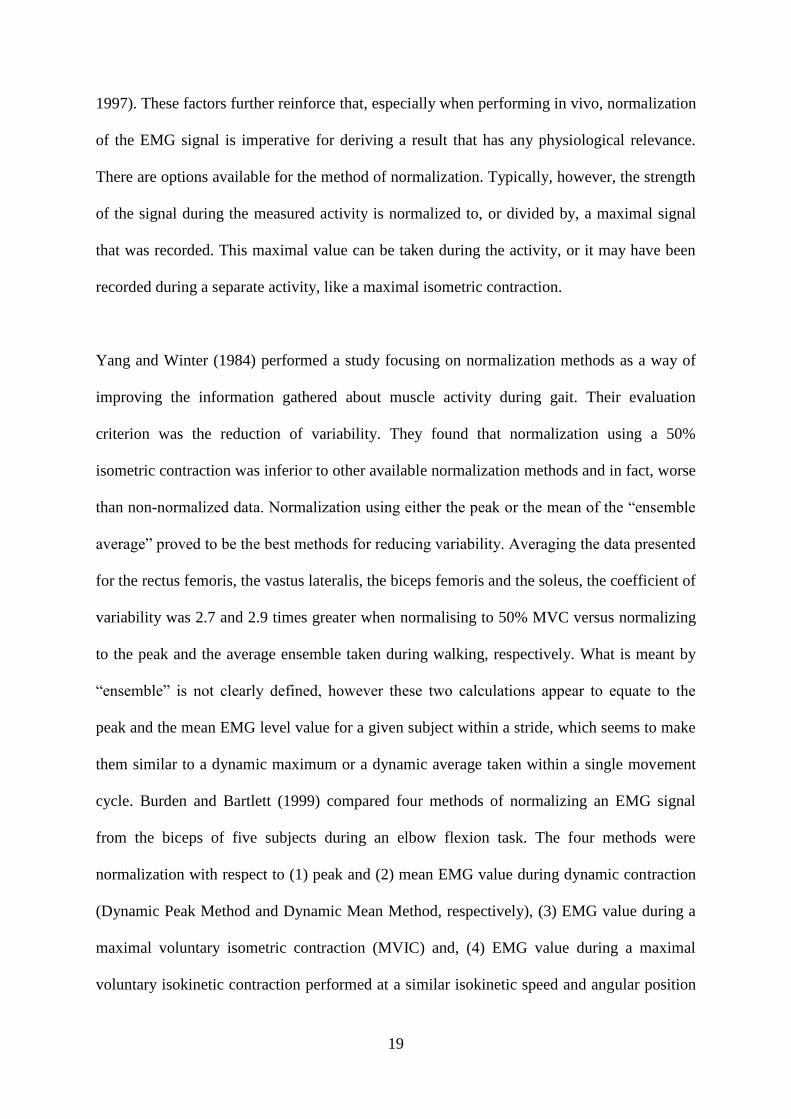
1997). These factors further reinforce that, especially when performing in vivo, normalization
of the EMG signal is imperative for deriving a result that has any physiological relevance.
There are options available for the method of normalization. Typically, however, the strength
of the signal during the measured activity is normalized to, or divided by, a maximal signal
that was recorded. This maximal value can be taken during the activity, or it may have been
recorded during a separate activity, like a maximal isometric contraction.
Yang and Winter (1984) performed a study focusing on normalization methods as a way of
improving the information gathered about muscle activity during gait. Their evaluation
criterion was the reduction of variability. They found that normalization using a 50%
isometric contraction was inferior to other available normalization methods and in fact, worse
than non-normalized data. Normalization using either the peak or the mean of the “ensemble
average” proved to be the best methods for reducing variability. Averaging the data presented
for the rectus femoris, the vastus lateralis, the biceps femoris and the soleus, the coefficient of
variability was 2.7 and 2.9 times greater when normalising to 50% MVC versus normalizing
to the peak and the average ensemble taken during walking, respectively. What is meant by
“ensemble” is not clearly defined, however these two calculations appear to equate to the
peak and the mean EMG level value for a given subject within a stride, which seems to make
them similar to a dynamic maximum or a dynamic average taken within a single movement
cycle. Burden and Bartlett (1999) compared four methods of normalizing an EMG signal
from the biceps of five subjects during an elbow flexion task. The four methods were
normalization with respect to (1) peak and (2) mean EMG value during dynamic contraction
(Dynamic Peak Method and Dynamic Mean Method, respectively), (3) EMG value during a
maximal voluntary isometric contraction (MVIC) and, (4) EMG value during a maximal
voluntary isokinetic contraction performed at a similar isokinetic speed and angular position

20
as the activity of interest. The mean EMG value was obtained for each subject during each
phase (concentric and eccentric). As there is no “gold standard” for comparison, the authors
used a root mean square difference method for evaluation of the difference between each of
the first three methods and the fourth normalization method. Their results indicated that either
isometric or isokinetic MVC data should be used for normalization.
The ability to use EMG as a method of assessing muscle force is a topic of much debate in
the literature. It seems clear that there is some relationship; in general, as the intensity of the
motor neuron signal to a muscle increases, the electrical activity in the muscle increases, and
the force produced increases as well (Lippold, 1952). Because it is much easier, at least in
living humans, to assess the electrical activity of a muscle than it is to measure the force
output of a muscle, the EMG-recorded signal has been used to estimate force output of the
muscle. Laboratory experiments have done this with reasonable success. In vivo, the
relationship is less strong, and holds up better with isometric contractions than dynamic ones.
Early research seemed to indicate a nearly linear relationship between force and EMG signal
(Lippold, 1952; Bigland and Lippold, 1954) especially in isometric conditions, while later
publications provide evidence for a more curvilinear relationship (Clamann and Broecker,
1979; Komi and Buskirk, 1972) especially in dynamic conditions. Bigland-Ritchie suggests
that the relationship may be either, and partially depends on the muscle being investigated
(Bigland-Ritchie, Kukulka and Woods, 1980) and may actually be a result of the fibre type
within the muscle.
To further complicate the matter, many factors affect the maximal force output of a muscle in
vivo, including: cross sectional area of the muscle, the ratio of fibre types, muscle velocity,
and muscle length, among others. Furthermore, many factors can affect the EMG signal

21
recorded on a given muscle, including: electrode attachment and impedance, size of muscle,
distance from muscle to the electrode, fatty tissue, muscle velocity, and electrode movement
(De Luca, 1997). Finally, in vivo it is very difficult to measure the force output of a single
muscle. More often a torque produced by a group of muscles working together, as well as the
contribution of antagonist muscles, is recorded. There are so many factors that can alter the
absolute force output of a muscle and also the signal recorded, that estimation of absolute
muscle force from EMG signal can be problematic. As a result, the relative level of
contraction of a muscle rather than its absolute force output is more often assessed.
The first description of the relationship between EMG signal and muscle fatigue was in
1912. Specifically, Piper described that muscle fatigue can be observed in surface EMG
signal as a reduction in EMG signal frequency (Piper, 1912). In addition, Cobb and Forbes
(1923) found that muscular fatigue was indicated by an increase in the amplitude of surface
EMG signal without a concurrent increase in force. Since that time, research on the topic has
progressed to establish two general relationships between EMG signal and fatigue: as fatigue
occurs, force output decreases but EMG amplitude remains the same or increases, and there is
a shift in the EMG signal toward a lower mean and median frequency (De Luca, 1997). The
underlying physiologic reason for this shift is that fatigue creates a change in the muscle fibre
membrane permeability, thereby decreasing the conduction velocity of the fibre (Kamen and
Caldwell, 1996). Commonly, in sustained submaximal activity, there will also be an increase
in the amplitude of the signal without an increase in force production. This is likely caused by
an increase in the number of recruited muscle fibres (Kamen and Caldwell, 1996) or an
increase in the time duration of the MUAP, which at least in part is due to a decrease in
conduction velocity of the action potential, which may be the result of a pH change in the
muscle (De Luca, 1997).

22
Saeterbakken, Van Den Tillaar and Fimland (2011) followed the SENIAM (surface EMG for
the non-invasive assessment of muscles) guidelines as laid out by Hermens et al. (2000) and
placed the electrodes on the dominant side of the body as in Marshall and Murphy (2006).
The electrodes (11-mm contact diameter) were placed on the belly of the muscle in the
presumed direction of the underlying muscle fibre, with a centre to centre distance of 2cm.
Self-adhesive electrodes were positioned at the pectoralis major, anterior deltoid, triceps
brachii and biceps brachii. To minimize noise from external sources, the raw EMG signal was
amplified and filtered using a preamplifier located as near to the pickup point as possible.
Signals were low pass filtered with a maximum cut-off frequency of 8 Hz and high pass
filtered with a minimum cut off frequency of 600 Hz, rectified and integrated. The raw EMG
signal was root-mean square (RMS) converted to and RMS signal using a hardware circuit
network (frequency response 450 kHz, with a mean constant of 12ms, total error ± 0.5%).
The RMS converted signal was sampled at a rate of 100 Hz using a 16 bit analogue to digital
converter with a common mode rejection rate of 100 dB. The overall mean RMS EMG was
calculated for the entire movement as well as separately for the eccentric and concentric
phases.
BandBell
The Bandbell Bar is 193cm long and weighs just 2kg. It is made of red oak and a specially-
designed fiberglass. It can be safely loaded up to 90kg. It is purported to help avoid surgery
in many cases and prevent injury to healthy joints by increasing stability.

23
Chapter 3 - Pilot Testing
Preceding all experimentation a number of preliminary tests were undertaken, these were
essential to the unique nature of the testing for this field. This allowed clearer outlines of
what methods to utilise, where no details were obtainable from previous research. The
essence of this testing involved the practice of initial beliefs for sensor positioning.
Initial pilot testing took place at a local gym (Ironman Bodybuilding Centre), where many of
the participants were regular trainees. A standard 20kg Olympic barbell was set up, on the
bench press, with 10kg plates suspended from doubled mini bands at either end (total load =
40kg). Several participants with 10RM bench presses in the range of 100-160kg then took
turns to complete sets of ten reps. This load was moderately easy for all participants to press,
however there was some kinaesthetic perception of instability by the participants with lower
10RM. This instability was also noted by those observing. More load was added to the bands,
however, it was found that with loads above 15kg per band, the load would touch the floor at
the bottom of some participants reps. Participants with lower 10RMs were observed to
struggle with stabilising the increased loads and kinaesthetic feedback confirmed this
instability. It was brought up by one of the participants to try and add load to the bar itself.
This was found to result in increased stability. It was therefore hypothesised that there was an
inverse relationship between bar mass and perceived stability, relative to the suspended load.
Virtually all subjects commented that they felt they could press the load, but were unable to
stabilise effectively and that this was an odd sensation unlike any other exercise training
mode they had ever used before.

24
The next stage of pilot testing involved testing the same participants with the BandBell bar. It
was found that similar loads to those used with the 20kg barbell could not be emulated with
the bandbell. Again, this added to the theory that the mass of/on the bar relative to the load
suspended from the bar would greatly influence instability. It was found that loading in the
range of 20-40% of 10RM (approximately 15-30% of 1RM) induced instability. With those
pilot testing subjects giving feedback that 20% was easy, 30% was moderately difficult and
40% was difficult or very difficult.
Sensor placement was decided by referring to the literature (Soderberg and Knutson, 2000) as
well as anecdotal recommendations from strength coaches such as Louie Simmons. It was
therefore decided to monitor whole body EMG, with an emphasis on stabilising musculature.
EMG sites were then decided based upon the literature (Saeterbakken, Van Der Tillaar and
Fimland, 2011) as well as where subjects felt muscles were working harder than usual in the
standard bench press. Multiple sites were then tried on different subjects and examined
during pressing with both the barbell and bandbell. It was decided that the pectoralis major,
anterior deltoid, biceps brachii, triceps brachii (lateral head), latissiumus dorsii, external
obliques, vastus lateralis and gastrocnemius (lateral head) were to be used. It was decided to
use Root Mean Square (RMS) to process the raw signal.
Initially, loading parameters were determined by using bands in conjunction with a standard
barbell. It was observed that subjects could use less load suspended from the bands, than
loaded directly onto the bar. This was observed to be due to the fact subjects were noticeably
more unstable with the suspended load. It was then decided to add additional load to the
barbell with the weight still suspended from bands. This was observed to increase stability. It
was therefore hypothesised that the larger the mass of the barbell in relation to the suspended

25
weight, the higher the stability. It was therefore also hypothesised that the lower the load of
the barbell, the better to induce instability and therefore higher activation with lesser
suspended loads.
A 10RM was chosen as the Bandbell can only be loaded with upto 90kg (three bands with
15kg per side) and is purported to be used for high quality, non-exhaustive, repetition work.
Also, for safety reasons, as such a novel and unstable load could be quite dangerous at higher
intensities, whereas at lower intensities and higher repetitions, it is much easier to make a
subjective decision to end the set.
To extrapolate the findings on the standard barbell with bands to the bandbell. Loading
parameters were determined using only suspended load. It was found that the maximum that
could be loaded onto a band, without likely making contact with the floor at the bottom of the
lift, was 15kg or less. This was therefore set as the maximum load per band. To determine if
the mass of the barbell, rather than solely the function, attributed to the increased instability,
ankle weights were tried in several different configurations attached around the bandbell.
This resulted in the bandbell’s mass being increased to 20kg, the same as a standard Olympic
barbell.

26
Chapter 4 – Method
Experimental Approach to the Problem
A within-subjects design was used to measure the effect of the standard barbell and bandbell
on muscle activation during the bench press exercise. Muscle activation was measured using
surface EMG (sEMG). Whereas other studies have examined the effect of unstable surfaces
(Norwood et al., 2007; Goodman et al.,2008) on muscle activation, to our knowledge none
have used the bandbell or any similar form of unfamiliar chaotic load instability device. The
independent variables included eight different exercise conditions: 20% Bar, 20% Bandbell,
30% Bar, 30% Bar and Bands, 30% Bandbell and Weight, 30% Bandbell, 40% Bar, 40%
Bandbell. The independent variables were the EMG measures of the prime movers (triceps
brachii, pectoralis major, anterior deltoid) and stabilizers (biceps brachii, latisimus dorsii,
external oblique, vastus lateralis, gastrocnemius) associated with performance of the bench
press. The root mean squared (RMS) of the EMG amplitude for each muscle, under each
condition, was recorded and calculated.
Subjects
Twelve subjects with at least five years of resistance training experience volunteered to take
part in the study (height, 180 ± 7 cm; bodyweight, 107 ± 16 kg). All subjects were familiar
with the bench press exercise and had trained it consistently during the four weeks prior to
the study at 75% 1RM. Subjects’ mean 10RM bench press was 115 ± 21 kg. All subjects
fulfilled the “advanced” criteria for predicted 1RM bench press to body weight ratio, detailed
by Rippetoe and Kilgore (2009). Only men participated because of confounding issues in

27
locating the pectoral muscle beneath adipose and breast tissue in women. Informed consent
was obtained from each subject and ethical approval was obtained from the University of
Central Lancashire’s Ethics committee.
Instrumentation
Height and weight were recorded using a Seca 799 Column Scale (Seca, Birmingham, UK),
fitted with the Seca 220 Telescopic Height Measure (Seca, Birmingham, UK). An Eleiko PL
Competition Bar (Eleiko Sport AB, Halmstad, Sweden) and various Jordan Olympic Cast
Discs (Jordan Fitness, Wisbech, Cambridgeshire, UK) were used.
Procedures
10RM Testing
Upon subjects’ arrival at the laboratory, they were briefed on the procedures and the possible
risks of the experimental protocol. Height and weight were then recorded. Subjects then
performed their usual general warm-up. Once the general warm-up was complete the protocol
for establishing 10RM, detailed by Beachle and Earle (2008), was used. Subjects were
instructed to use a grip width of 32 inches for all testing (little fingers on marker rings). This
was standardised between subjects as placement of weights around the bandbell during the
bandbell and weights condition may be prohibitive of subjects utilising their normal grip
width. Once this was complete, subjects were advised to complete a series of static stretches
and rest before leaving the laboratory.

28
Experimental Testing
After a minimum of four days and a maximum of seven days after the initial 10RM testing
session, subjects were asked to attend the main testing session in the laboratory. Subjects
were asked to complete their habitual general warm-up. The testing protocol detailed in table
1 was then performed. Three to five minutes was allowed for the subject to recover between
sets and to prepare for the next set. EMG was recorded for each individual set. Once subjects
had completed the testing protocol, they were advised to complete a series of static stretching
and rest before leaving the laboratory.
Table 1: Experimental testing protocol (X = equipment used during set).
Set % of 10RM Equipment Used
PL Bar Bandbell Bands Bar Weights
1 20 X
2 20 X X
3 30 X
4 30 X X
5 30 X X X
6 30 X X
7 40 X
8 40 X X
Order of testing was not randomised as such a novel, and potentially dangerous condition,
even at low intensities, requires a thorough warm-up and to prevent injury. Subjects were
given a significant length of time between sets to recuperate and largely negate any order
effect.

29
Loading
A number of different loading methods were used in conjunction with the two bars. With the
standard PL bar, weight plates were loaded onto either end for sets one, three and seven. The
weight plates were secured using a spring clip. For set four, the weight plates were suspended
using a doubled-up mini band looped over the sleeve of the bar and secured in place using a
spring clip. With the BandBell bar, weight plates were suspended from doubled-up mini
bands secured in the slots at either end of the bar. For set five, four 4.5kg ankle weights were
secured around the BandBell at evenly spaced intervals and so as not to interfere with range
of motion or hand placement (see Figure 1 and 2). This was to bring the mass of the bar upto
that of a standard barbell to ascertain whether it is the function of the bar (i.e.: the flex) or the
small mass of the bar that creates the instability.
Figure 1: Bandbell with ankle weights attached.

30
Figure 2: Bandbell with ankle weights in use.
Kinematics
An eight camera (Qualysis Medical AB, Esperantoplasten 7-9, 411 19 Gothenburg, Sweden)
motion analysis system, sampling at 240Hz was used to record the three-dimensional position
of a retroreflective marker that had been placed centrally on the bars. The kinematic data
were passed through a Butterworth low pass filter with a cut off frequency of 5Hz. This
frequency was again chosen based on previous research (Wilson, Elliott, and Kerr, 1989;
Wilson, Elliott, and Wood, 1991). First order finite difference equations were used to
determine vertical velocity of the bar, which in turn was used to determine the start and finish
times for the set. The start of the set was defined as the point where continuous downward
(negative) velocity began and the end of the set was defined as the time when the velocity of
the bar once again returned to zero.

31
Electromyography
Surface electromyography (EMG) was used to measure muscle activity for eight muscles.
The muscles included the prime movers (triceps brachii, anterior deltoid and pectoralis
major) and stabilizers (biceps brachii, external oblique, vastus lateralis and gastrocnemius).
Muscle activity was recorded unilaterally on the right hand side. Each EMG site was shaved
if necessary and cleansed with alcohol before single differential bipolar electrodes (SX230,
Biometrics Ltd, Cwmfelinfach, Gwent, UK) were applied to the skin surface. The sensor
contacts were made from 99.9% pure silver bars measuring 10mm in diameter, 0.85mm in
depth and spaced 20mm apart (see Figure 3). The EMG sensors were positioned on the centre
of the muscle belly, away from the tendons and edge of the muscle and positioned parallel to
the orientation of the muscle fibres being measured. One reference electrode was attached to
the right wrist using an adjustable wristband (R206, Biometrics Ltd, Cwmfelinfach, Gwent,
UK). The EMG recording software was calibrated with the subject resting supine on the
bench with hands placed on the top of the thighs and feet flat on the floor (see Figure 4).
Figure 3: Electrode.
32
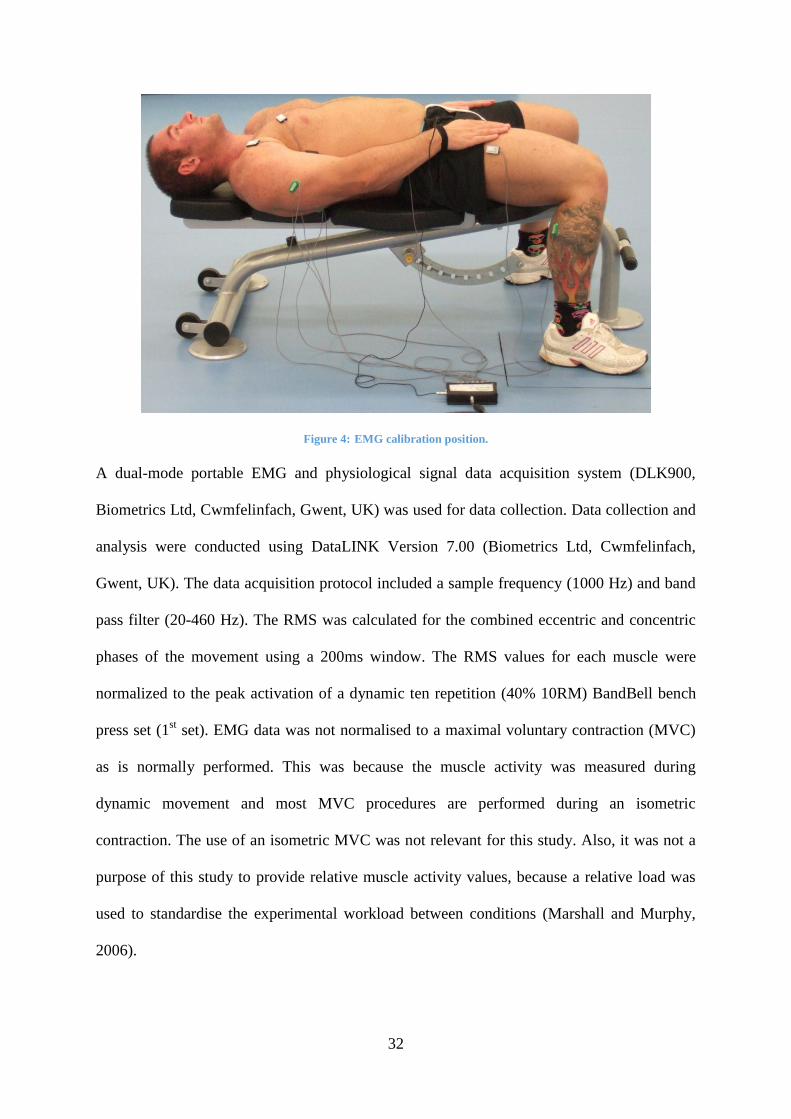
Figure 4: EMG calibration position.
A dual-mode portable EMG and physiological signal data acquisition system (DLK900,
Biometrics Ltd, Cwmfelinfach, Gwent, UK) was used for data collection. Data collection and
analysis were conducted using DataLINK Version 7.00 (Biometrics Ltd, Cwmfelinfach,
Gwent, UK). The data acquisition protocol included a sample frequency (1000 Hz) and band
pass filter (20-460 Hz). The RMS was calculated for the combined eccentric and concentric
phases of the movement using a 200ms window. The RMS values for each muscle were
normalized to the peak activation of a dynamic ten repetition (40% 10RM) BandBell bench
press set (1st set). EMG data was not normalised to a maximal voluntary contraction (MVC)
as is normally performed. This was because the muscle activity was measured during
dynamic movement and most MVC procedures are performed during an isometric
contraction. The use of an isometric MVC was not relevant for this study. Also, it was not a
purpose of this study to provide relative muscle activity values, because a relative load was
used to standardise the experimental workload between conditions (Marshall and Murphy,
2006).

33
Intensity
Intensity analysis compared the bar and BandBell sets at 20, 30 and 40% 10RM.
Condition
Condition analysis compared all four sets at 30% 10RM with the bar, barbell and bands,
BandBell and weights and BandBell.
Statistical Analysis
Paired samples t-tests were used to examine intensity. One way repeated measures ANOVA
were used and post-hoc t-tests with Bonferroni correction were used to examine condition.
(SPSS version 19.0; SPSS, Inc., Chicago, IL). All results are presented as means ± standard
deviations. Statistical significance was set as P ≤ 0.05.
The calculation of sample size was carried out with a α = 0.05 (5% chance of type I error)
and 1 – β = 0.80 (power 80%) and using the results provided from Saeterbakken, Van Der
Tillaar and Fimland (2011) who found significant difference in muscle activity under stable
and unstable conditions. This provided a sample size of n = 12 for this study.

34
Chapter 5 - Results
Intensity
Kinematics
Sagittal Plane
Figure 5: Mean (± SD) sagittal plane distance travelled during intensity trials (* = p ≤ .05)
Paired samples t-tests determined that distance travelled in the sagittal plane was significantly
greater with the BandBell than the bar at 20% (t(11) = -11.15, p = .000), 30% (t(11) = - 4.08,
p = .002) and 40%( t(11) = -7.13, p = .000) 10RM intensities.
0
2000
4000
6000
8000
10000
12000
14000
16000
18000
20% Bar 20%Bandbell
30% Bar 30%Bandbell
40% Bar 40%Bandbell
Dis
tan
ce T
rave
lled
(m
m)
Intensity
*
*
*

35
Transverse Plane
Figure 6: Mean (± SD) transverse plane distance travelled (mm) during intensity trials (* = p ≤ .05)
Paired samples t-tests determined that distance travelled in the transverse plane was
significantly greater with the BandBell than the bar at 20% (t(11) = -8.45, p = .000), 30%
(t(11) = -5.39, p = .000) 40% (t(11) = -4.86, p = .001) 10RM intensities.
0
1000
2000
3000
4000
5000
6000
20% Bar 20%Bandbell
30% Bar 30%Bandbell
40% Bar 40%Bandbell
Dis
tan
ce T
rave
lled
(m
m)
Intensity
*
*
*

36
sEMG
Biceps Brachii
Figure 7: Mean (± SD) biceps brachii mean activation during intensity trials (* = p ≤ .05)
Paired samples t-tests determined that biceps brachii mean activation was significantly
greater with the BandBell than the bar at 20% (t(11) = -4.48, p = .001), 30% (t(11) = - 3.30, p
= .008) and 40% (t(11) = -2.99, p = .014) 10RM intensities.
0
5
10
15
20
25
30
35
40
45
50
20%Bar 20%Bandbell
30% Bar 30%Bandbell
40% Bar 40%Bandbell
Mea
n A
ctiv
atio
n (
%)
Intensity
*
*
*

37
Triceps Brachii
Figure 8: Mean (± SD) triceps brachii mean activation during intensity trials
Paired samples t-tests determined that triceps brachii mean activation did not significantly
differ between the BandBell and bar at 20% (t(11) = .774, p = .457), 30% (t(11) = .880, p =
.400) and 40% (t(11) = -.022, p = .983) 10RM intensities.
Pectoralis Major
Figure 9: Mean (± SD) pectoralis major mean activation during intensity trials (* = p ≤ .05, # = p ≤ .10)
0
5
10
15
20
25
30
35
40
45
50
55
20%Bar 20%Bandbell
30% Bar 30%Bandbell
40% Bar 40%Bandbell
Mea
n A
ctiv
atio
n (
%)
Intensity
0
5
10
15
20
25
30
35
40
45
50
20%Bar 20%Bandbell
30% Bar 30%Bandbell
40% Bar 40%Bandbell
Mea
n A
ctiv
atio
n (
%)
Intensity
#
*
#

38
Paired samples t-tests determined that pectoralis major mean activation was significantly
lower with the BandBell than the bar at 30% (t(11) = 3.46, p = .006) and was approaching
significance at 20% (t(11) = 2.05, p = .067) and 40% (t(11) = 2.10, p = .063) 10RM
intensities.
Anterior Deltoid
Figure 10: Mean (± SD) anterior deltoid mean activation during intensity trials (* = p ≤ .05, # = p ≤ .10)
Paired samples t-tests determined that anterior deltoid mean activation was significantly
lower with the BandBell than the bar at 20% (t(11) = 4.59, p = .001), 30% (t(11) = 3.49, p =
.006) and was approaching significance at 40% (t(11) = 2.14, p = .058) 10RM intensities.
0
5
10
15
20
25
30
35
40
45
50
20%Bar 20%Bandbell
30% Bar 30%Bandbell
40% Bar 40%Bandbell
Mea
n A
ctiv
atio
n (
%)
Intensity
*
*
#

39
Latisimus Dorsii
Figure 11: Mean (± SD) latisimus dorsii mean activation during intensity trials (* = p ≤ .05)
Paired samples t-tests determined that latisimus dorsii mean activation was significantly
greater with the BandBell than the bar at 20% (t(11) = -2.18, p = .054) and 40% (t(11) = -
3.17, p = .010) 10RM intensities, however, there was no significant difference at 30% (t(11)
= -1.28, p = .228) 10RM intensity.
External Oblique
Figure 12: Mean (± SD) external oblique mean activation during intensity trials (* = p ≤ .05)
0
5
10
15
20
25
30
35
40
45
50
20%Bar 20%Bandbell
30% Bar 30%Bandbell
40% Bar 40%Bandbell
Mea
n A
ctiv
atio
n (
%)
Intensity
*
*
0
5
10
15
20
25
30
35
40
45
50
20%Bar 20%Bandbell
30% Bar 30%Bandbell
40% Bar 40%Bandbell
Mea
n A
ctiv
atio
n (
%)
Intensity
*
* *

40
Paired samples t-tests determined that external oblique mean activation was significantly
greater with the BandBell than the bar at 20% (t(11) = -2.19, p = .054), 30% (t(11) = -2.32, p
= .043) and 40% (t(11) = -6.26, p = .000) 10RM intensities.
Vastus Lateralis
Figure 13: Mean (± SD) vastus lateralis mean activation during intensity trials
Paired samples t-tests determined that vastus lateralis mean activation did not significantly
differ between the BandBell and bar at 20% (t(11) = -.14, p = .892), 30% (t(11) = -1.71, p =
.117) and 40% (t(11) = -1.025., p = .329) 10RM intensities.
0
5
10
15
20
25
30
35
40
45
50
55
60
20%Bar 20%Bandbell
30% Bar 30%Bandbell
40% Bar 40%Bandbell
Mea
n A
ctiv
atio
n (
%)
Intensity
41
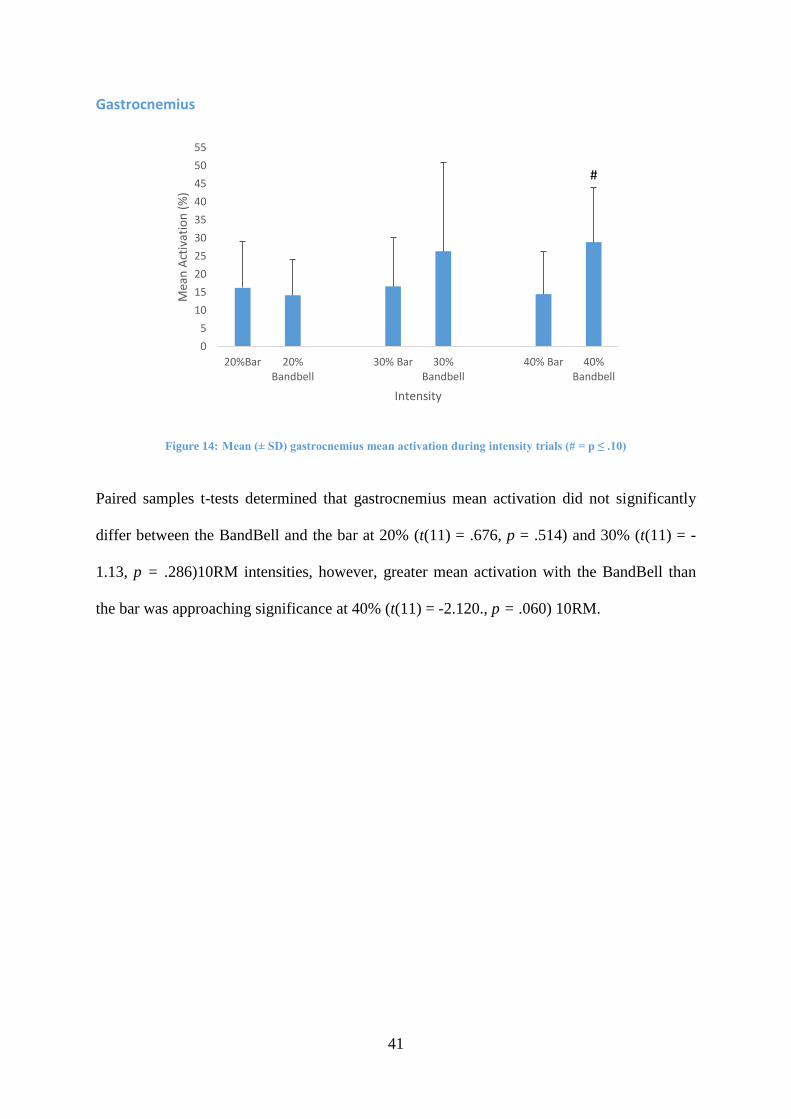
Gastrocnemius
Figure 14: Mean (± SD) gastrocnemius mean activation during intensity trials (# = p ≤ .10)
Paired samples t-tests determined that gastrocnemius mean activation did not significantly
differ between the BandBell and the bar at 20% (t(11) = .676, p = .514) and 30% (t(11) = -
1.13, p = .286)10RM intensities, however, greater mean activation with the BandBell than
the bar was approaching significance at 40% (t(11) = -2.120., p = .060) 10RM.
0
5
10
15
20
25
30
35
40
45
50
55
20%Bar 20%Bandbell
30% Bar 30%Bandbell
40% Bar 40%Bandbell
Mea
n A
ctiv
atio
n (
%)
Intensity
#

42
Condition
Kinematic Data
Sagittal Plane
Figure 15: Mean (± SD) sagittal plane distance travelled during condition trials (* = p ≤ .05)
A repeated measures ANOVA with a Greenhouse-Geisser correction determined that distance
travelled in the sagittal plane differed significantly between loading conditions (F(1.06,
11.63) = 15.90, P = .000). Post hoc tests using the Bonferroni correction revealed that
distance travelled during the 30% BandBell trial was significantly greater than any of the
other conditions (p ≤ .05).
0
2000
4000
6000
8000
10000
12000
14000
30% Bar 30% Bar + Bands 30% Bandbell +Weights
30% Bandbell
Dis
tan
ce T
rave
lled
(m
m)
Condition
*

43
Transverse Plane
Figure 16: Mean (± SD) transverse plane distance travelled during condition trials (* = p ≤ .05)
A repeated measures ANOVA with a Greenhouse-Geisser correction determined that distance
travelled in the transverse plane differed significantly between loading conditions (F(1.16,
12.73) = 23.85, P = .000). Post hoc tests using the Bonferroni correction revealed that
distance travelled during the 30% Bandbell trial was significantly greater than any of the
other conditions (p ≤ .05).
0
500
1000
1500
2000
2500
3000
3500
4000
30% Bar 30% Bar + Bands 30% Bandbell +Weights
30% Bandbell
Dis
tan
ce T
rave
lled
(m
m)
Condition
*

44
sEMG
Biceps Brachii
Figure 17: Mean (± SD) biceps brachii mean activation during condition trials (* = p ≤ .05)
A repeated measures ANOVA determined that biceps brachii mean activation differed
significantly between loading conditions (F(3, 33) = 7.83, P = .001). Post hoc tests using the
Bonferroni correction revealed that mean activation during the 30% Bandbell trial was
significantly greater than any of the other conditions (p ≤ .05).
0
5
10
15
20
25
30
35
30% Bar 30% Bar + Bands 30% Bandbell +Weights
30% Bandbell
Mea
n A
ctiv
atio
n (
%)
Condition
*

45
Triceps Brachii
Figure 18: Mean (± SD) triceps brachii mean activation during condition trials
A repeated measures ANOVA determined that triceps brachii mean activation did not differ
significantly between loading conditions (F(3, 30) = 9.43, P = .385).
Pectoralis Major
Figure 19: Mean (± SD) pectoralis major mean activation during condition trials (* = p ≤ .05)
0
5
10
15
20
25
30
35
40
45
50
55
30% Bar 30% Bar + Bands 30% Bandbell +Weights
30% Bandbell
Mea
n A
ctiv
atio
n (
%)
Condition
0
5
10
15
20
25
30
35
40
45
30% Bar 30% Bar + Bands 30% Bandbell +Weights
30% Bandbell
Mea
n A
ctiv
atio
n (
%)
Condition
* *

46
A repeated measures ANOVA determined that pectoralis major mean activation differed
significantly between loading conditions (F(3, 30) = 7.08, P = .001). Post hoc tests using the
Bonferroni correction revealed that pectoralis major mean activation during the 30% Bar trial
was significantly greater than both the 30% Bar and Bands and 30% Bandbell trials (p ≤ .05).
Also, mean activation during the 30% Bandbell and Weights trial was significantly greater
than during the 30% Bar and Bands trial (p ≤ .05).
Anterior Deltoid
Figure 20: Mean (± SD) anterior deltoid mean activation during different condition trials (* = p ≤ .05)
A repeated measures ANOVA with a Greenhouse-Geisser correction determined that anterior
deltoid mean activation differed significantly between loading conditions (F(1.67, 16.68) =
7.44, P = .007). Post hoc tests using the Bonferroni correction revealed that anterior deltoid
mean activation was significantly greater during the 30% Bar trial than the 30% Bandbell and
Weights and 30% Bandbell trials (p ≤ .05).
0
5
10
15
20
25
30
35
40
45
30% Bar 30% Bar + Bands 30% Bandbell +Weights
30% Bandbell
Mea
n A
ctiv
atio
n (
%)
Condition
*

47
Latisimus Dorsii
Figure 21: Mean (± SD) latisimus dorsii mean activation during condition trials (* = p ≤ .05)
A repeated measures ANOVA determined that latisimus dorsii mean activation differed
significantly between loading conditions (F(3, 30) = 2.983, P = .047). Post hoc tests using
the Bonferroni correction revealed that latisimus dorsii mean activation during the 30%
Bandbell trial was significantly greater than the 30% Bar and Bands trial (p ≤ .05).
0
5
10
15
20
25
30
35
40
30% Bar 30% Bar + Bands 30% Bandbell +Weights
30% Bandbell
Mea
n A
ctiv
atio
n (
%)
Condition
*

48
External Oblique
Figure 22: Mean (± SD) external oblique mean activation during condition trials (* = p ≤ .05)
A repeated measures ANOVA with a Greenhouse-Geisser correction determined that external
oblique mean activation differed significantly between loading conditions (F(1.83, 18.30) =
6.47, P = .009). Post hoc tests using the Bonferroni correction revealed that external oblique
mean activation was significantly greater during the 30% Bandbell trial than the 30% Bar and
Bands and 30% Bandbell and Weights trials (p ≤ .05).
0
5
10
15
20
25
30
35
40
45
50
30% Bar 30% Bar + Bands 30% Bandbell +Weights
30% Bandbell
Mea
n A
ctiv
atio
n (
%)
Condition
*

49
Vastus Lateralis
Figure 23: Mean (± SD) vastus lateralis mean activation during condition trials (# = p ≤ .10)
A repeated measures ANOVA with a Greenhouse-Geisser correction determined that vastus
lateralis mean activation differed significantly between loading conditions (F(1.61, 16.12) =
5.16, P = .024). Post hoc tests using the Bonferroni correction revealed that vastus lateralis
mean activation between the 30% Bandbell and Weights and 30% Bandbell conditions was
approaching significance (p = .073).
0
5
10
15
20
25
30
35
40
45
50
55
30% Bar 30% Bar + Bands 30% Bandbell +Weights
30% Bandbell
Mea
n A
ctiv
atio
n (
%)
Condition
#

50
Gastrocnemius
Figure 24: Mean (± SD) gastrocnemius mean activation during condition trials
A repeated measures ANOVA with a Greenhouse-Geisser correction determined that
gastrocnemius mean activation did not differ significantly between loading conditions
(F(1.58, 15.78) = 2.54, P = .119).
0
5
10
15
20
25
30
35
40
45
50
55
30% Bar 30% Bar + Bands 30% Bandbell +Weights
30% Bandbell
Mea
n A
ctiv
atio
n (
%)
Condition
51
Chapter 6 - Discussion
Proponents of instability resistance training claim that unstable training modalities stress the
neuromuscular system to a greater extent than more stable strength training exercises (Behm
and Anderson, 2006). To the authors knowledge this is the first study to investigate the
BandBell, with the aim of determining if the BandBell bench press elicited a greater muscle
activation than the standard bench press at a given relative load.
It was found that the distance travelled in the sagittal and transverse planes was significantly
greater with the Bandbell at all intensities. This indicates the Bandbell produced more
instability than the bar and resulted in greater mean activation of the biceps brachii and
external obliques. Distance travelled in the sagittal and transverse planes and mean activation
of the biceps brachii were significantly greater for the Bandbell condition and therefore it is
likely that the mass and function of the Bandbell (30% Bandbell > 30% Bar, 30% Bar and
Bands, 30% Bandbell and Weight) was causative of this.
These findings are in agreement with those of Schick et al. (2010) and Saeterbakken, Van
Der Tillaar and Fimland (2011). Schick et al. (2010) recorded muscle activation of the
anterior deltoid, medial deltoid and pectoralis major, during smith machine and free weight
bench press. 70% and 90% 1RM intensities were used for each exercise and two repetitions
were performed at both whilst EMG data was recorded. The main finding was that the
activation of the medial deltoid was significantly higher (approximately 160%) during the
free weight bench press. They concluded that the instability caused by the free weight bench
press necessitates a greater response by the medial deltoid as both a force producer and

52
perhaps more importantly as a stabiliser. However, there was no significant difference
between stability conditions in the activation of the anterior deltoid or pectoralis major. This
is likely due to the fact that they are prime movers as opposed to stabilisers and therefore are
mostly unaffected by instability. Saeterbakken, Van Der Tillaar and Fimland (2011)
compared 1RM and muscle activity in three “chest-press” exercises with different stability
requirements – smith machine bench press, barbell bench press and dumbbell bench press.
EMG activity of the PM, AD, BB and TB were recorded. The dumbbell load was 14% less
than for the smith machine and 17% less than that for the barbell bench press. The barbell
bench press load was approximately 3% higher than the smith machine. EMG activity of the
PM and AD did not differ between conditions. BB activation increased with increasing
stability requirements (dumbbell bench press>barbell bench press>smith machine bench
press). TB activity was reduced using dumbbells when compared to barbell and smith
machine bench press. These findings are similar to those of the current study in that
increasing biceps brachii activation was found with increasing instability and again, just as in
Schick et al. (2010), the prime movers: pectoralis major and anterior deltoid did not differ
significantly between stability conditions. However, with regards to triceps brachii activity,
the use of dumbbells to elicit instability appears to significantly reduce activation, however,
in the current study this was not observed. This may have been due to maintaining the same
degrees of freedom and movement pattern as in the bench press, but with instability applied
to that specific movement. Consequently triceps brachii activity was maintained. The finding
that the EMG activity of the anterior deltoid was relatively consistent across conditions may
be explained by the fact that it also functions as a glenohumeral stabiliser (Kohler, Flanagan
and Whiting, 2010). Increased muscle activity may be necessary to stabilise the glenohumeral
joint. The increase in activity required for stabilization may have offset the decrease in

53
activity that would be expected with a decreased load, resulting in the same level of
activation between conditions.
Neither Schick et al. (2010) or Saeterbakken, Van Der Tillaar and Fimland (2011) examined
any of the “core” musculature beyond the shoulder girdle. This may have been because of the
assumption that if using a bench, nothing beyond the shoulder girdle is active. This could not
be further from the truth if the bench press is being performed correctly as a lift for
developing maximal strength as in powerlifting. The whole body should be rigid and the core
and lower limbs tensed. The external obliques play an important role in stabilising the spine.
The abdominal muscles work together to increase spinal stability and the rectus abdominis
transmits the lateral force from the obliques to form a continuous loop of tension around the
abdomen. Studies using unstable surfaces, such as Norwood et al. (2007) tend to concentrate
more on this musculature (exclusively in this case), however, as evidenced in this current
study the “core” is still very active when an unstable load is used on a stable surface.
Activation of the external obliques was higher with the BandBell, when compared to both
BandBell and ankle weights and barbell and bands at 30% 10RM, however it was not
significantly different to the barbell condition.
Applications of the current study may be in injury prevention and rehabilitation. Despite the
popularity of the bench press, it has been demonised somewhat and reputed to cause injury of
the shoulder girdle and the muscles that surround it. Durrall, Manske and Davies (2001) state
that injuries to the shoulder are relatively common among weight trainers and can be career-
threatening to those at the competitive level. Fortunately, most shoulder injuries from
resistance training are minor musculo-tendonous strains or ligamentous-capsular sprains.
However, when improper exercises or exercise techniques are utilized, resistance training
54
may exacerbate or contribute to the development of glenohumeral joint hyperlaxity,
instability or impingement. When the static glenohumeral ligamentous-capsular restraints are
excessively lax or unstable, the dynamic rotator cuff muscles are thought to exert greater
force to stabilize the humeral head. This dynamic compensation often results in fatigue
followed by rotator cuff tendonitis and pain.
The bench press presents several problems for the lifter; the musculoskeletal system of the
shoulder girdle has to provide a base of support for the motion of the barbell from and to the
chest. Elbow flexors and horizontal flexors in the shoulder act alternately in concentric and
eccentric contractions. Thus despite the bench press being a very popular exercise, due to
incorrect technique, individuals are at risk from acute shoulder injuries involving a sudden
traumatic episode, such as ruptures of the pectoralis major (Wolfe, Wickiewicz and
Cavanaugh,1992; Green and Comfort, 2007). The musculoskeletal system of the
glenohumeral joint has to provide a base of support for the motion of the barbell during the
bench press. The bench press action may place the glenohumeral joint in a position
approaching ninety degrees of abduction and the position may include some external rotation.
Ninety degrees of abduction, combined with end-range external rotation has been defined as
the “at-risk position” that may increase the risk of shoulder injuries (Green and Comfort,
2007). It has been reported that a hand spacing of ≥ 2 biacromial width (shoulder width as
defined by the distance between the acromion processes) increases shoulder abduction above
seventy five degrees, wheras hand spacing ≤1.5 biacromial width maintains shoulder
abduction below forty five degrees (Green and Comfort, 2007).
As powerlifters regularly train using the bench press exercise, they are an ideal population to
investigate for associated injury incidence. Keogh, Hume and Pearson (2006) stated that

55
powerlifting is a sport in which the stresses applied to the musculoskeletal system of the body
when the lifter is performing the squat, bench press and deadlift exercises can be immense.
Some members of the public, sporting, medical and scientific communities often state that
powerliftng is an inherently dangerous sport that would result in numerous serious or long
term injuries. Powerlifters suffer a relatively low number of injuries during the course of a
year and the majority of these injuries are of minor or moderate severity in terms of their
effect on subsequent training. One consideration is that in order to lift such immense loads,
powerlifters must generate exceedingly large musculoskeletal forces and torques and may
therefore be susceptible to a range of musculoskeletal injuries (Keogh, Hume and Pearson,
2006). The authors found that on average, each powerlifter obtained just over one injury per
year (4 injuries per 1000 hours of training), with the most frequently injured body regions
being the shoulder (36%) and lower back (24%). The proportionally higher rate of shoulder
injuries may be a result of the higher stresses the bench press applies to the shoulder,
particularly the rotator cuff, acromioclavicular joint and shoulder capsule. The authors found
that the majority of the injuries were caused by the three power lifts (52%) or assistance
exercises (20%). These results indicate that the injuries suffered by powerlifters cannot all be
attributed to one particular exercise, such as the bench press. Raske and Norlin (2002) also
found no significant difference in the incidence of shoulder injuries in power lifters based on
the upper body exercises they routinely performed in training (such as the bench press).
Raske and Norlin (2002) hypothesised that the bench press is a critical event for the shoulder
among the powerlifting events because the shoulder girdle must provide a stable base of
support for the lifting motion of the barbell. The shoulder muscles have to alternate between
maximal concentric and eccentric contraction when stabilizing, lifting or lowering the
barbell. Proper technique, including muscle stretching and a throughout warm-up together

56
with a training schedule that will spread out exercises that stress one muscle group over the
week, seems to be important for competitive lifters to prevent injury.
It is interesting however that national level competitors had significantly more chest and
shoulder injuries than international competitors. This seems consistent with the finding that
the bench press was responsible for a greater proportion of injuries and was more frequently
affected by injury in national than in the international lifters. These results indicate that in
order to reduce their proportionally higher rates of shoulder and chest injuries, national lifters
may need to alter the manner in which they train the upper-body. They may need to pay more
attention to bench press technique, bench press training program variables (e.g.: warm-up
procedures, training volume and intensity) and address upper body muscular and range-of-
motion imbalances and deficits. Shoulder injury was the most common injury amongst
powerlifters. The rate of shoulder injuries per 1000 hours of powerlifting activity was found
to be 0.61. The average number of hours training per week was 8.94, which equates to 465
hours of training per year. Therefore an injury is likely to occur on average every 3.53 years
(Raske and Norlin, 2002).
One drawback with instability training is that several studies have found decreases in force
production such as Koshida et al. (2008), who found significant decreases (reduction rates) in
power (9.9% ± 11.5), force (5.9% ± 5.7) and velocity (9.1% ± 10) when comparing single
bench press repetitions (50% 1RM) performed on a Swiss ball to a bench. Integrating a
balance factor into a strength training program may not provide an adequate overload
necessary for muscle hypertrophy and strength gains. Consequently, the effectiveness of
instability training is contingent on the specific training goal. If an athlete’s aim is to
increased strength outside the core, such as in the competitive bench press, then it has been

57
demonstrated that performing resistance training exercises solely in an unstable environment
would be detrimental to strength gains. The inclusion of resistance training with more stable
surfaces would be necessary to reach training intensities required to develop maximal
strength (≥85% 1RM) (Anderson and Behm, 2004). Thus, maximal effort work should be
maintained as normal and instability training should be used during assistance repeated effort
work.
Some of the possible limitations of the current study are mainly surrounding the small sample
size and the nature of the exercise. The sample size was likely too small to provide clear data.
This combined with the “chaotic” nature of the exercise and participants varying degrees of
pre-existing stability resulted in non-normally distributed data. With a slightly larger sample
size, many of the tendencies that are present in the data would likely show significance. It is
acknowledged there may have been an order effect of the trials.
For future work the inclusion of kinematic analysis would be beneficial for monitoring the
bar path as well as the joint angles of the subject. Another area to consider may be the body
mass and composition of participants relative to their bench press strength. It has been noted
anecdotally that the lower the relative strength then the more inherently stable a participant
will be because of the favourable ratio of body mass to bench press mass. A training study
may also be advisable to monitor whether the relatively low loads (20-40% 10RM) elicit any
favourable training effect.

58
Conclusion
In conclusion, this study shows that the Bandbell is successful at inducing instability during
the bench press and produces greater mean activation in stabilising musculature.
59
References
Anderson, K.G., Behm, D.G. (2004) Maintenance of EMG activity and loss of force output
with instability. Journal of Strength and Conditioning Research, 18: 637-640.
Baechle, T.R., Earle, R.W. (2008) Essentials of Strength Training and Conditioning. 3rd
ed.
Human Kinetics: Champaign, IL, USA.
Behm, D.G., Anderson, K.G. (2006) The Role of Instability With Resistance Training.
Journal of Strength and Conditioning Research, 20 (3): 716-722.
Behm, D.G., Sanchez, J.C.C. (2013) Instability Resistance Training Across the Exercise
Continuum. Sports Health: A Multidisciplinary Approach, 5 (6): 500-503
Bigland-Ritchie, B., Kukulka, C.G., Woods, J.J. (1980) Surface EMG/force relation in human
muscle of different fibre composition. Journal of Physiology, 308: 103-4
Bigland-Ritchie, B., Lippold, O.C. (1954) The relation between force, velocity and integrated
electrical activity in human muscles. Journal of Physiology, 123(1): 214-24
Burden, A., Bartlett, R. (1999) Normalisation of EMG amplitude: an evaluation and
comparison of old and new methods. Medical Engineering and Physics, 21: 247-257
Cobb, S., Forbes, A. (1923) Electromyographic studies of muscle fatigue in man. American
Journal of Physiology, 65: 234-251

60
Clamann, H.P., Broeker, K.T. (1979) Relation between force and fatigability of red and pale
skeletal muscles in man. American Journal of Physical Medicine, 58: 70-85
Clarys, J.P. (2000) Electromyography in sports and occupational settings: an update of its
limits and possibilities. Ergonomics, 43 (10): 1750-62.
De Luca, C.J. (1997) The use of electromyography in biomechanics. Journal of Applied
Biomechanics, 13: 135-163
Durall, C.J., Manske, R.C., Davies, G.J. (2001) Avoiding Shoulder Injury From Resistance
Training. Strength and Conditioning Journal, 23 (5): 10-18.
Goodman, C.A., Pearce, A.J., Nicholes, C.J., Gatt, B.M., Fairweather, I.H. (2008) No
Difference in 1RM Strength and Muscle Activation During the Barbell Chest Press on a
Stable and Unstable Surface. Journal of Strength and Conditioning Research, 22 (1): 88-94.
Green, C.M., Comfort, P. (2007) The Affect of Grip Width on Bench Press Performance and
Risk of Injury. Strength and Conditioning Journal, 29 (5): 10-14.
Hermens, H.J., Freriks, B., Disselhorst-Klug, C., Rau, G. (2000) Development of
recommendations for SEMG sensors and sensor placement procedures. Journal of
Electromyography and Kinesiology, 10: 361-374.

61
Kamen, G., Caldwell, G.E. (1996) Physiology and Interpretation of the electromyogram.
Journal of Clinical Neurophysiology, 13(5): 366-384
Keogh, J., Hume, P.A., Pearson, S. (2006) Retrospective Injury Epidemiology of One
Hundred One Competitive Oceania Power Lifters: The Effects of Age, Body Mass,
Competitive Standard and Gender. Journal of Strength and Conditioning Research, 20 (3):
672-681.
Kohler, J.M., Flanagan, S.P., Whiting, W.C. (2010) Muscle Activation Patterns While Lifting
Stable and Unstable Loads on Stable and Unstable Surfaces. Journal of Strength and
Conditioning Research, 24 (2): 313-321.
Komi, P.V., Buskirk, E.R. (1972) Effects of eccentric and concentric muscle conditioning on
tension and electrical activity of human muscle. Ergonomics, 15: 417-434
Koshida, S., Urabe, Y., Miyashita, K., Iwai, K., Kagimori, A. (2008) Muscular Outputs
During Dynamic Bench Press Under Stable Versus Unstable Conditions. Journal of Strength
and Conditioning Research, 22 (5): 1584-1588.
Lippold, O.C. (1952) The relation between integrated action potentials in a human muscle
and its isometric tension. Journal of Physiology, 117 (4): 492-9
Madsen, N., McLaughlin, T (1984) Kinematic factors influencing performance and injury
risk in the bench press exercise. Medicine and Science in Sports and Exercise, 16(4): 376-381

62
McCaw, S.T., Friday, J.J. (1994) A comparison of muscle activity between free weight and
machine bench press. Journal of Strength and Conditioning Research, 8: 259-264.
Marshall, P.W.M., Murphy, B.A. (2006) Increased Deltoid and Abdominal Muscle Activity
During Swiss Ball Bench Press. Journal of Strength and Conditioning Research, 20 (4): 745-
750.
Norwood, J., Anderson, G.S., Gaetz, M, Twist, P. (2007) Electromyographic Activity of the
Trunk Stabilisers During Stable and Unstable Bench Press. Journal of Strength and
Conditioning Research, 21 (2): 343-347.
Osgawara, R., Loenneke, J.P., Thiebaud, R.S., Abe, T. (2013) Low-Load Bench Press
Training to Fatigue Results in Muscle Hypertrophy Similar to High-Load Bench Press
Training. International Journal of Clinical Medicine, 4: 114-121.
Piper, H.E. (1912) Electrophysiologie Menschlichen Muskeln Springer. Berlin, Germany
Raske, A., Norlin, R. (2002) Injury Incidence and Prevalence among Elite Weight and Power
Lifters. The American Journal of Sports Medicine, 30 (2): 248-256.
Rippetoe, C.M., Kilgore, J.L. (2009) Practical Programming for Strength Training. 2nd
ed.
The Aasgaard Company Publishers: Wichita Falls, TX, USA.

63
Rutherford, O.M., Jones, D.A. (1986) The role of learning and coordination in strength
training. European Journal of Applied Physiology, 55: 100-105.
Saeterbakken, A.H., Van Den Tillaar, R.V., Fimland, M.S. (2011) A comparison of muscle
activity and 1-RM strength of three chest-press exercises with different stability
requirements. Journal of Sports Sciences, 29 (5): 533-538.
Schick, E.E., Coburn, J.W., Brown, L.E., Judelson, D.A., Khamoui, A.V., Tran, T.T., Uribe,
B.P. (2010) A Comparison of Muscle Activation Between a Smith Machine and Free Weight
Bench Press. Journal of Strength and Conditioning Research, 24 (3): 779-784.
Sharma, R., Singh Viij, J. (2005) Occurance of Bicipital Tendonitis/Rotator Cuff Tendonitis
in the Subjects involved in Bench Press Activities in the Gymnasium. Journal of Exercise
Science and Physiotherapy, 1(1&2):85-88.
Sodberg, G.L., Knutson, L.M. (2000) A Guide for the Use and Interpretation of Kinesiologic
Electromyographic Data. Physical Therapy, 80(5): 485-498.
Uribe, B.P., Coburn, J.W., Brown, L.E., Judelson, D.A., Khamoui, A.V., Nguyen, D. (2010)
Muscle Activation When Performing the Chest Press and Shoulder Press on a Stable Bench
vs. a Swiss Ball. Journal of Strength and Conditioning Research, 24 (4): 1028-1033.
Verhagen, E.A.L.M., van Tulder, M., van der Beek, A.J., van Mechelen, W. (2004) An
economic evaluation of a proprioceptive balance board training programme for the
prevention of ankle sprains in volleyball. British Journal of Sports Medicine, 39: 111-115.

64
Welsch, E.A., Bird, M., Mayhew, J.L. (2005) Electromyographic activity of the pectoralis
major and anterior deltoid muscles during three upper-body lifts. Journal of Strength and
Conditioning Research, 19: 449-452.
Wilson, G.J., Elliott, B.C., Kerr, G.K. (1989) Bar path and force profile characteristics for
maximal and submaximal loads in the bench press. International Journal of Sport
Biomechanics, 5: 391-402
Wilson, G.J., Elliott, B.C., Wood, G.A. (1991) The effect on performance of imposing a
delay during a stretch-shorten cycle movement. Medicine and Science in Sport and Exercise,
23(3): 364-369
Wolfe, S.W., Wickiewicz, T.L., Cavanaugh, J.T. (1992) Ruptures of the pectoralis major
muscle. An anatomic and clinical analysis. American Journal of Sports Medicine, 20: 587-
593.
Yang, Winter, D. (1984) Electromyographic amplitude normalization methods: Improving
their sensitivity as diagnostic tools in gait analysis. Archives of Physical Medical
Rehabilitation, 65(9): 517-52

65
School of Psychology RISK ASSESSMENT FORM (Medium & High Risk, Student Version)
Use this form to risk-assess:
Off-campus student activities (research, fieldwork, educational visits etc) in medium/high risk environments such as factories, farms, prisons, remote areas or participants’ homes.
All student activities involving medium/high risk procedures or use of specialist equipment.
For low risk locations and activities, use the appropriate low risk form. This form should be completed by the staff member responsible for the activity (e.g. the project supervisor), in consultation with the student and a qualified or otherwise competent person (normally a technician or Faculty HSE officer). Completed forms must be countersigned by the Head of School or the Chair of the School Health & Safety Committee.
Student: Assessment Undertaken
By:
(Staff member)
Assessment Verified By:
(Technician or other
competent person)
Name: Ben Staniforth Name: Dr. Chris Edmundson Name:
Signed: Signed:
Signed:
Date: Date:
Date*:
*Note: Risk Assessment is valid for one year from the date given above. Risk Assessments for activities lasting
longer than one year should be reviewed annually.
Countersigned by Head of School or Chair of H&S Committee:

66
Date:
Risk Assessment For:
Activity: Barbell/Bandbell Bench Press
Location of Activity: Biomechanics Laboratory
Page 1 of 2

67
List significant
hazards here:
List groups of
people who are
at risk:
List existing
controls, or
refer to safety
procedures etc:
For risks which
are not
adequately
controlled, list
the action
needed:
Remaining level
of risk (high,
medium or low):
Injury
Bar Flipping
Out of Rack
whilst Loading
Loss of
Consciousness
during 10RM
test
Previously
Injured/Poor
Technique
Loaders/Spotters
PAR-
Q/Technique
Coaching
Awareness of
how to load the
bandbell

68

69
Continue on another sheet if necessary.
Page 2 of 2

70
Participant Information
A Comparison of the standard Barbell and
novel Bandbell Bench Press
What is the purpose of this study?
The purpose of this study is to compare the novel bandbell bench press to the standard bench
press. The bandbell is thought to increase shoulder stability and bench press technique with
continued use. It is thought to do this through the instability it generates, causing more of the
body’s musculature to activate to stabilise the bar. The activation of the musculature can be
measured using sensors placed on the skin through a system known as Electromyography
(EMG). Force plates mounted in the floor will also measure forces applied through the feet to
approximate how hard you are working to stabilise. Therefore, with your help the aim of this
study is to determine if the bandbell bench press results in higher muscle activation and body
bracing for a given load, when compared to the standard barbell bench.
What do I have to do?
If you would like to volunteer for the study all we ask is that you attend three sessions, each
spaced one week apart, in the biomechanics laboratory in Darwin Building at UCLan. Each

71
visit will last approximately one hour. During the initial session your height and weight will
be measured and you will be familiarised with the testing equipment, you will then be taken
through an incremental protocol to establish your standard bench press 10 repetition
maximum.
The second and third visit to the labs will involve you undertaking an incremental protocol
with either a standard barbell or novel bandbell using fixed loads ranging from 22.5kg up to a
maximum of 92.5kg for 10 repetitions.
Throughout the exercise your muscular activation will be monitored using multiple sensors
attached to the skin above different muscles. There may be a requirement to shave some areas
to allow the sensors to maintain good contact with the skin. Also the forces you exert through
your feet will be measured.
What will I gain from participating in the study?
There will be no financial reward from taking part in this study, however, you will have
access to the end group results of the study.
As a participant in this study, it is important that you are aware that your results are strictly
confidential. Individual data will not be presented and results will be anonymous when used
for published work.
You are free to withdraw from the study at any time up to 24 hours after laboratory testing.
After this it will be impossible to remove individual data as it will have been made
anonymous. If you wish to withdraw please contact myself or Chris.

72
If you have any further questions, please feel free to contact either myself or Chris:
Researcher
Ben Staniforth
CASES,
DB255, Darwin Building,
UCLan,
Preston,
Lancashire,
PR1 2HE
07505 104363
Director of Studies
Dr. Chris Edmundson
CASES,
DB204, Darwin Building,
UCLan,
Preston,
Lancashire,
PR1 2HE
01772 893317

73
University of Central Lancashire
School of Psychology
Informed Consent Form
Investigation:
Investigator:
Participant No.
Name ________________________________________________
I have read the attached information sheet and discussed the project with the investigator. The nature, demands and the risks
associated with the project have been explained to me. I knowingly accept the risks involved and feel confident that I can
undertake the requirements of the test without undue strain. As such I agree to participate in the above named study. I
understand that I may withdraw my consent and discontinue participation at any time without having to give an explanation.
Participant’s signature:
______________________________________________
I certify that I have explained to the above individual the nature, purpose and possible risks associated with participation in this
research study, have answered any questions that have been raised, and have witnessed the above signature
Signature of investigator :
____________________________________________
Date ______________

74
Biceps T-Test
Notes
Output Created 28-OCT-2013 19:14:02
Comments
Input Active Dataset DataSet0
Filter <none>
Weight <none>
Split File <none>
N of Rows in Working Data File
11
Missing Value Handling Definition of Missing User defined missing values are treated as missing.
Cases Used Statistics for each analysis are based on the cases with no missing or out-of-range data for any variable in the analysis.
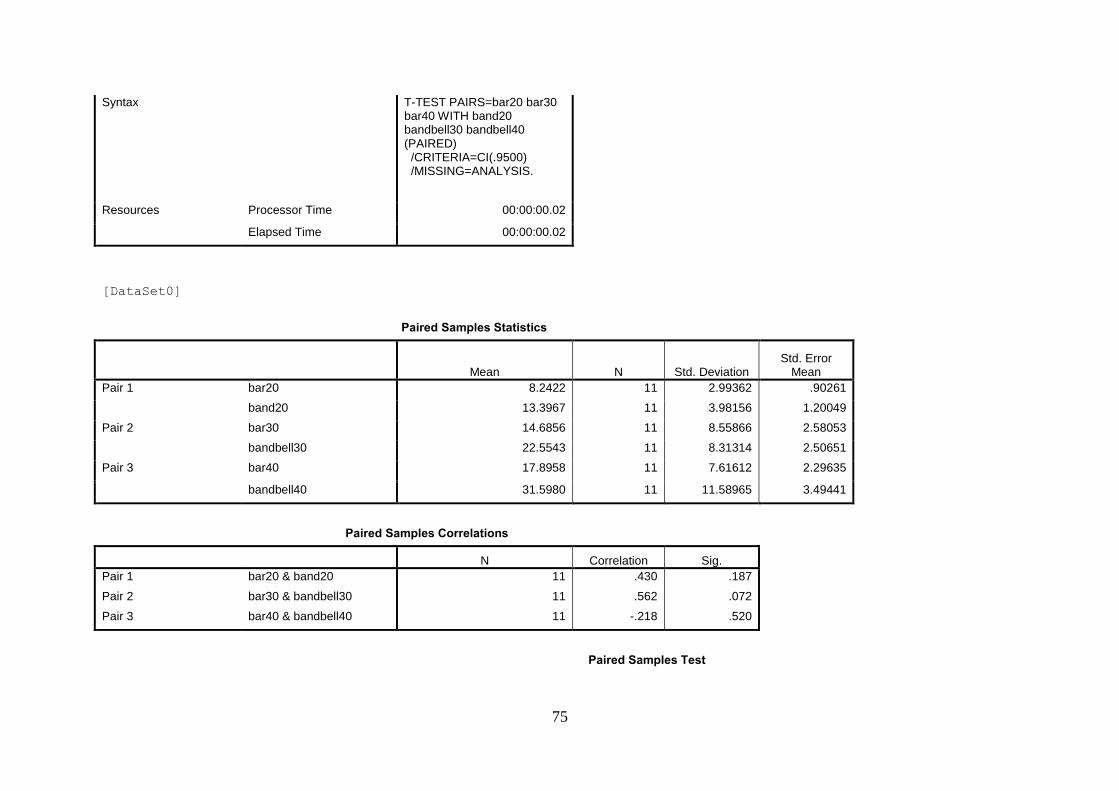
75
Syntax T-TEST PAIRS=bar20 bar30 bar40 WITH band20 bandbell30 bandbell40 (PAIRED) /CRITERIA=CI(.9500) /MISSING=ANALYSIS.
Resources Processor Time 00:00:00.02
Elapsed Time 00:00:00.02
[DataSet0]
Paired Samples Statistics
Mean N Std. Deviation Std. Error
Mean
Pair 1 bar20 8.2422 11 2.99362 .90261
band20 13.3967 11 3.98156 1.20049
Pair 2 bar30 14.6856 11 8.55866 2.58053
bandbell30 22.5543 11 8.31314 2.50651
Pair 3 bar40 17.8958 11 7.61612 2.29635
bandbell40 31.5980 11 11.58965 3.49441
Paired Samples Correlations
N Correlation Sig.
Pair 1 bar20 & band20 11 .430 .187
Pair 2 bar30 & bandbell30 11 .562 .072
Pair 3 bar40 & bandbell40 11 -.218 .520
Paired Samples Test
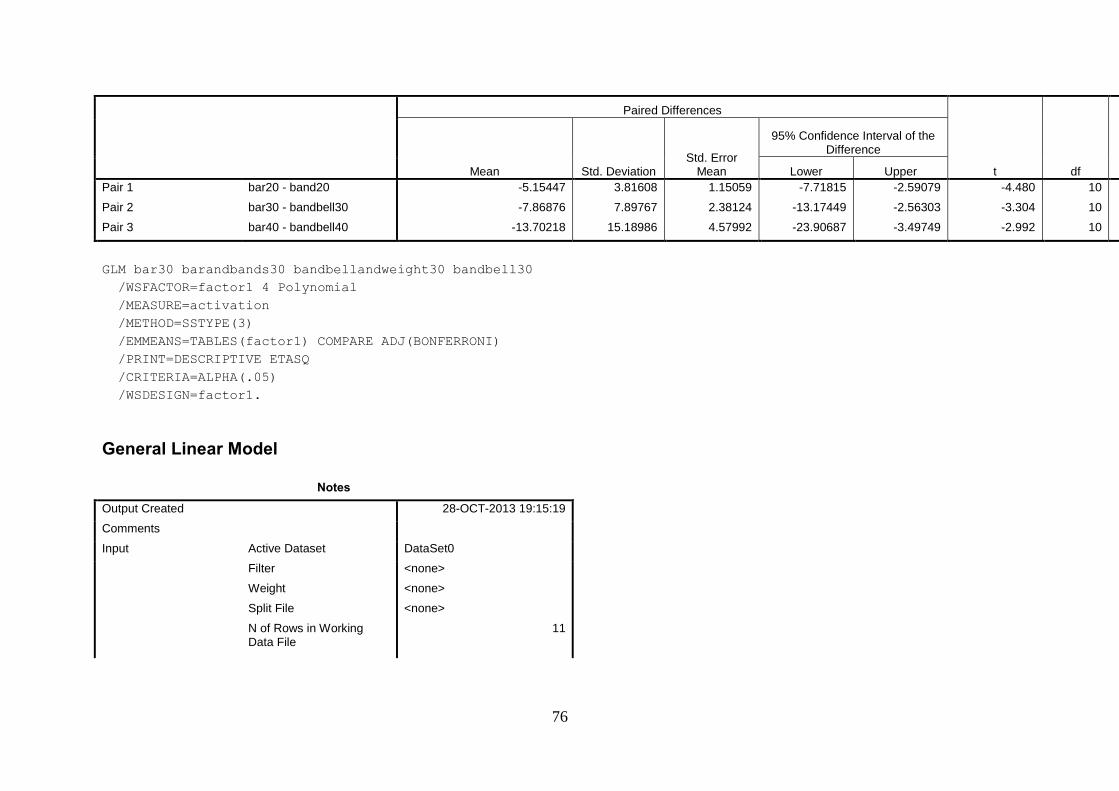
76
Paired Differences
t df Sig. (2-tailed) Mean Std. Deviation Std. Error
Mean
95% Confidence Interval of the Difference
Lower Upper
Pair 1 bar20 - band20 -5.15447 3.81608 1.15059 -7.71815 -2.59079 -4.480 10 .001
Pair 2 bar30 - bandbell30 -7.86876 7.89767 2.38124 -13.17449 -2.56303 -3.304 10 .008
Pair 3 bar40 - bandbell40 -13.70218 15.18986 4.57992 -23.90687 -3.49749 -2.992 10 .014
GLM bar30 barandbands30 bandbellandweight30 bandbell30
/WSFACTOR=factor1 4 Polynomial
/MEASURE=activation
/METHOD=SSTYPE(3)
/EMMEANS=TABLES(factor1) COMPARE ADJ(BONFERRONI)
/PRINT=DESCRIPTIVE ETASQ
/CRITERIA=ALPHA(.05)
/WSDESIGN=factor1.
General Linear Model
Notes
Output Created 28-OCT-2013 19:15:19
Comments
Input Active Dataset DataSet0
Filter <none>
Weight <none>
Split File <none>
N of Rows in Working Data File
11

77
Missing Value Handling Definition of Missing User-defined missing values are treated as missing.
Cases Used Statistics are based on all cases with valid data for all variables in the model.
Syntax GLM bar30 barandbands30 bandbellandweight30 bandbell30 /WSFACTOR=factor1 4 Polynomial /MEASURE=activation /METHOD=SSTYPE(3) /EMMEANS=TABLES(factor1) COMPARE ADJ(BONFERRONI) /PRINT=DESCRIPTIVE ETASQ /CRITERIA=ALPHA(.05) /WSDESIGN=factor1.
Resources Processor Time 00:00:00.05
Elapsed Time 00:00:00.06
[DataSet0]
Within-Subjects Factors
Measure: activation
factor1 Dependent Variable

78
1 bar30
2 barandbands30
3 bandbellandweight30
4 bandbell30
Descriptive Statistics
Mean Std. Deviation N
bar30 14.6856 8.55866 11
barandbands30 13.2445 3.62360 11
bandbellandweight30 13.3030 5.12593 11
bandbell30 22.5543 8.31314 11
Multivariate Testsa
Effect Value F Hypothesis df Error df Sig. Partial Eta Squared
factor1 Pillai's Trace .593 3.879b 3.000 8.000 .056 .593
Wilks' Lambda .407 3.879b 3.000 8.000 .056 .593
Hotelling's Trace 1.455 3.879b 3.000 8.000 .056 .593
Roy's Largest Root 1.455 3.879b 3.000 8.000 .056 .593
a. Design: Intercept Within Subjects Design: factor1
b. Exact statistic
Mauchly's Test of Sphericitya
Measure: activation
Within Subjects Effect Mauchly's W Approx. Chi-Square df Sig. Epsilon
b

79
Greenhouse-Geisser Huynh-Feldt Lower-bound
factor1 .386 8.293 5 .143 .702 .894 .333
Tests the null hypothesis that the error covariance matrix of the orthonormalized transformed dependent variables is proportional to an identity matrix.
a. Design: Intercept Within Subjects Design: factor1
b. May be used to adjust the degrees of freedom for the averaged tests of significance. Corrected tests are displayed in the Tests of Within-Subjects Effects table.
Tests of Within-Subjects Effects
Measure: activation
Source Type III Sum of Squares df Mean Square F Sig. Partial Eta Squared
factor1 Sphericity Assumed 654.961 3 218.320 7.829 .001 .439
Greenhouse-Geisser 654.961 2.106 310.993 7.829 .003 .439
Huynh-Feldt 654.961 2.681 244.267 7.829 .001 .439
Lower-bound 654.961 1.000 654.961 7.829 .019 .439
Error(factor1) Sphericity Assumed 836.616 30 27.887
Greenhouse-Geisser 836.616 21.060 39.725
Huynh-Feldt 836.616 26.813 31.201
Lower-bound 836.616 10.000 83.662
Tests of Within-Subjects Contrasts
Measure: activation
Source Type III Sum of Squares df Mean Square F Sig. Partial Eta Squared
factor1 Linear 308.011 1 308.011 10.819 .008 .520
Quadratic 314.397 1 314.397 6.805 .026 .405

80
Cubic 32.553 1 32.553 3.620 .086 .266
Error(factor1) Linear 284.699 10 28.470
Quadratic 461.983 10 46.198
Cubic 89.934 10 8.993
Tests of Between-Subjects Effects
Measure: activation Transformed Variable: Average
Source Type III Sum of Squares df Mean Square F Sig. Partial Eta Squared
Intercept 11189.322 1 11189.322 114.057 .000 .919
Error 981.031 10 98.103
Estimated Marginal Means
factor1
Estimates
Measure: activation
factor1 Mean Std. Error
95% Confidence Interval
Lower Bound Upper Bound
1 14.686 2.581 8.936 20.435
2 13.245 1.093 10.810 15.679
3 13.303 1.546 9.859 16.747
4 22.554 2.507 16.969 28.139
Pairwise Comparisons

81
Measure: activation
(I) factor1 Mean Difference (I-J) Std. Error Sig.b
95% Confidence Interval for Difference
b
Lower Bound Upper Bound
1 2 1.441 2.117 1.000 -5.497 8.379
3 1.383 2.229 1.000 -5.922 8.687
4 -7.869* 2.381 .048 -15.672 -.066
2 1 -1.441 2.117 1.000 -8.379 5.497
3 -.058 1.068 1.000 -3.559 3.442
4 -9.310* 2.602 .030 -17.835 -.785
3 1 -1.383 2.229 1.000 -8.687 5.922
2 .058 1.068 1.000 -3.442 3.559
4 -9.251* 2.719 .040 -18.160 -.343
4 1 7.869* 2.381 .048 .066 15.672
2 9.310* 2.602 .030 .785 17.835
3 9.251* 2.719 .040 .343 18.160
Based on estimated marginal means
*. The mean difference is significant at the .05 level.
b. Adjustment for multiple comparisons: Bonferroni.
Multivariate Tests
Value F Hypothesis df Error df Sig. Partial Eta Squared
Pillai's trace .593 3.879a 3.000 8.000 .056 .593
Wilks' lambda .407 3.879a 3.000 8.000 .056 .593
Hotelling's trace 1.455 3.879a 3.000 8.000 .056 .593
Roy's largest root 1.455 3.879a 3.000 8.000 .056 .593
Each F tests the multivariate effect of factor1. These tests are based on the linearly independent pairwise comparisons among the estimated marginal means.

82
a. Exact statistic
T-TEST PAIRS=bar20 bar30 bar40 WITH band20 bandbell30 bandbell40 (PAIRED)
/CRITERIA=CI(.9500)
/MISSING=ANALYSIS.
Triceps T-Test
Notes
Output Created 28-OCT-2013 19:19:42
Comments
Input Active Dataset DataSet0
Filter <none>
Weight <none>
Split File <none>
N of Rows in Working Data File
11
Missing Value Handling Definition of Missing User defined missing values are treated as missing.
Cases Used Statistics for each analysis are based on the cases with no missing or out-of-range data for any variable in the analysis.

83
Syntax T-TEST PAIRS=bar20 bar30 bar40 WITH band20 bandbell30 bandbell40 (PAIRED) /CRITERIA=CI(.9500) /MISSING=ANALYSIS.
Resources Processor Time 00:00:00.02
Elapsed Time 00:00:00.01
[DataSet0]
Paired Samples Statistics
Mean N Std. Deviation Std. Error
Mean
Pair 1 bar20 28.3090 11 10.49796 3.16525
band20 27.3285 11 10.35386 3.12181
Pair 2 bar30 37.3579 11 11.62503 3.50508
bandbell30 36.1771 11 11.89364 3.58607
Pair 3 bar40 41.8872 11 8.44410 2.54599
bandbell40 41.9288 11 6.42507 1.93723
Paired Samples Correlations
N Correlation Sig.
Pair 1 bar20 & band20 11 .919 .000
Pair 2 bar30 & bandbell30 11 .929 .000
Pair 3 bar40 & bandbell40 11 .677 .022
Paired Samples Test

84
Paired Differences
t df Sig. (2-tailed) Mean Std. Deviation Std. Error
Mean
95% Confidence Interval of the Difference
Lower Upper
Pair 1 bar20 - band20 .98046 4.20365 1.26745 -1.84359 3.80451 .774 10 .457
Pair 2 bar30 - bandbell30 1.18082 4.45108 1.34205 -1.80945 4.17109 .880 10 .400
Pair 3 bar40 - bandbell40 -.04158 6.25245 1.88518 -4.24204 4.15887 -.022 10 .983
GLM bar30 barandbands30 bandbellandweight30 bandbell30
/WSFACTOR=factor1 4 Polynomial
/MEASURE=activation
/METHOD=SSTYPE(3)
/EMMEANS=TABLES(factor1) COMPARE ADJ(BONFERRONI)
/PRINT=DESCRIPTIVE ETASQ
/CRITERIA=ALPHA(.05)
/WSDESIGN=factor1.
General Linear Model
Notes
Output Created 28-OCT-2013 19:20:23
Comments
Input Active Dataset DataSet0
Filter <none>
Weight <none>
Split File <none>
N of Rows in Working Data File
11

85
Missing Value Handling Definition of Missing User-defined missing values are treated as missing.
Cases Used Statistics are based on all cases with valid data for all variables in the model.
Syntax GLM bar30 barandbands30 bandbellandweight30 bandbell30 /WSFACTOR=factor1 4 Polynomial /MEASURE=activation /METHOD=SSTYPE(3) /EMMEANS=TABLES(factor1) COMPARE ADJ(BONFERRONI) /PRINT=DESCRIPTIVE ETASQ /CRITERIA=ALPHA(.05) /WSDESIGN=factor1.
Resources Processor Time 00:00:00.03
Elapsed Time 00:00:00.10
[DataSet0]
Within-Subjects Factors
Measure: activation
factor1 Dependent Variable
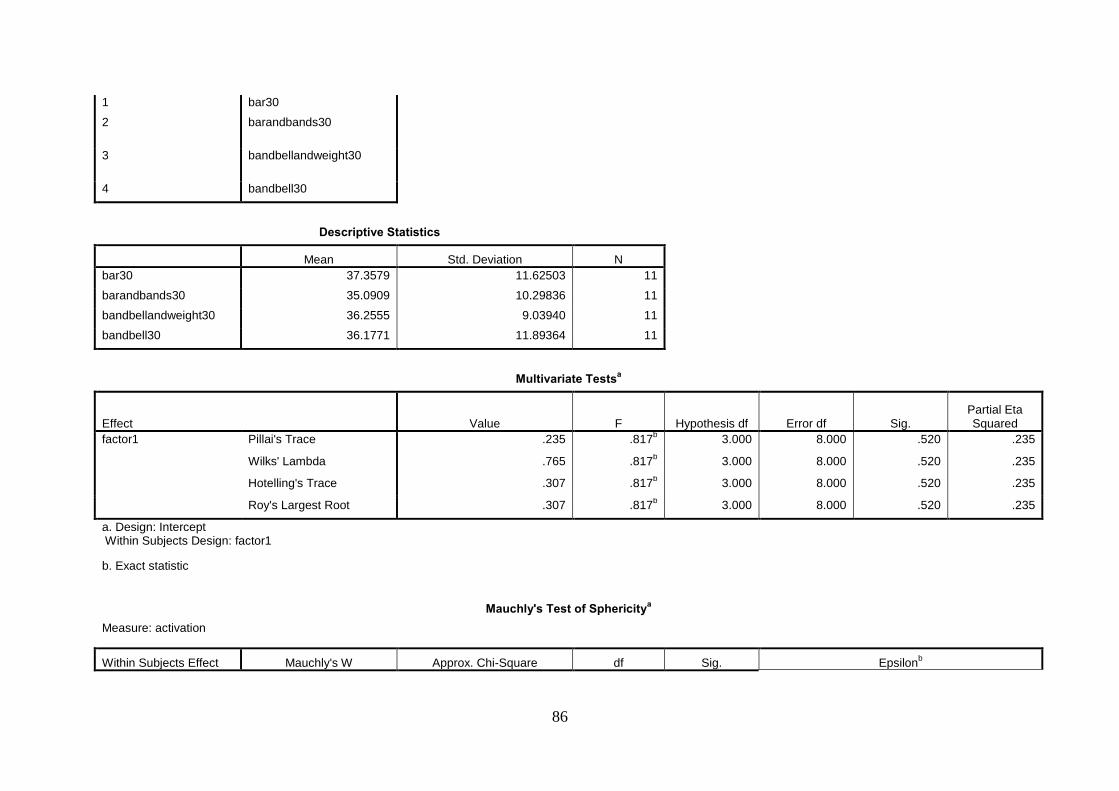
86
1 bar30
2 barandbands30
3 bandbellandweight30
4 bandbell30
Descriptive Statistics
Mean Std. Deviation N
bar30 37.3579 11.62503 11
barandbands30 35.0909 10.29836 11
bandbellandweight30 36.2555 9.03940 11
bandbell30 36.1771 11.89364 11
Multivariate Testsa
Effect Value F Hypothesis df Error df Sig. Partial Eta Squared
factor1 Pillai's Trace .235 .817b 3.000 8.000 .520 .235
Wilks' Lambda .765 .817b 3.000 8.000 .520 .235
Hotelling's Trace .307 .817b 3.000 8.000 .520 .235
Roy's Largest Root .307 .817b 3.000 8.000 .520 .235
a. Design: Intercept Within Subjects Design: factor1
b. Exact statistic
Mauchly's Test of Sphericitya
Measure: activation
Within Subjects Effect Mauchly's W Approx. Chi-Square df Sig. Epsilon
b

87
Greenhouse-Geisser Huynh-Feldt Lower-bound
factor1 .923 .700 5 .983 .955 1.000 .333
Tests the null hypothesis that the error covariance matrix of the orthonormalized transformed dependent variables is proportional to an identity matrix.
a. Design: Intercept Within Subjects Design: factor1
b. May be used to adjust the degrees of freedom for the averaged tests of significance. Corrected tests are displayed in the Tests of Within-Subjects Effects table.
Tests of Within-Subjects Effects
Measure: activation
Source Type III Sum of Squares df Mean Square F Sig. Partial Eta Squared
factor1 Sphericity Assumed 28.301 3 9.434 1.049 .385 .095
Greenhouse-Geisser 28.301 2.864 9.880 1.049 .384 .095
Huynh-Feldt 28.301 3.000 9.434 1.049 .385 .095
Lower-bound 28.301 1.000 28.301 1.049 .330 .095
Error(factor1) Sphericity Assumed 269.832 30 8.994
Greenhouse-Geisser 269.832 28.644 9.420
Huynh-Feldt 269.832 30.000 8.994
Lower-bound 269.832 10.000 26.983
Tests of Within-Subjects Contrasts
Measure: activation
Source Type III Sum of Squares df Mean Square F Sig. Partial Eta Squared
factor1 Linear 3.110 1 3.110 .351 .567 .034
Quadratic 13.174 1 13.174 1.411 .262 .124

88
Cubic 12.018 1 12.018 1.368 .269 .120
Error(factor1) Linear 88.627 10 8.863
Quadratic 93.361 10 9.336
Cubic 87.844 10 8.784
Tests of Between-Subjects Effects
Measure: activation Transformed Variable: Average
Source Type III Sum of Squares df Mean Square F Sig. Partial Eta Squared
Intercept 57724.219 1 57724.219 131.976 .000 .930
Error 4373.840 10 437.384
Estimated Marginal Means
factor1
Estimates
Measure: activation
factor1 Mean Std. Error
95% Confidence Interval
Lower Bound Upper Bound
1 37.358 3.505 29.548 45.168
2 35.091 3.105 28.172 42.009
3 36.255 2.725 30.183 42.328
4 36.177 3.586 28.187 44.167
Pairwise Comparisons
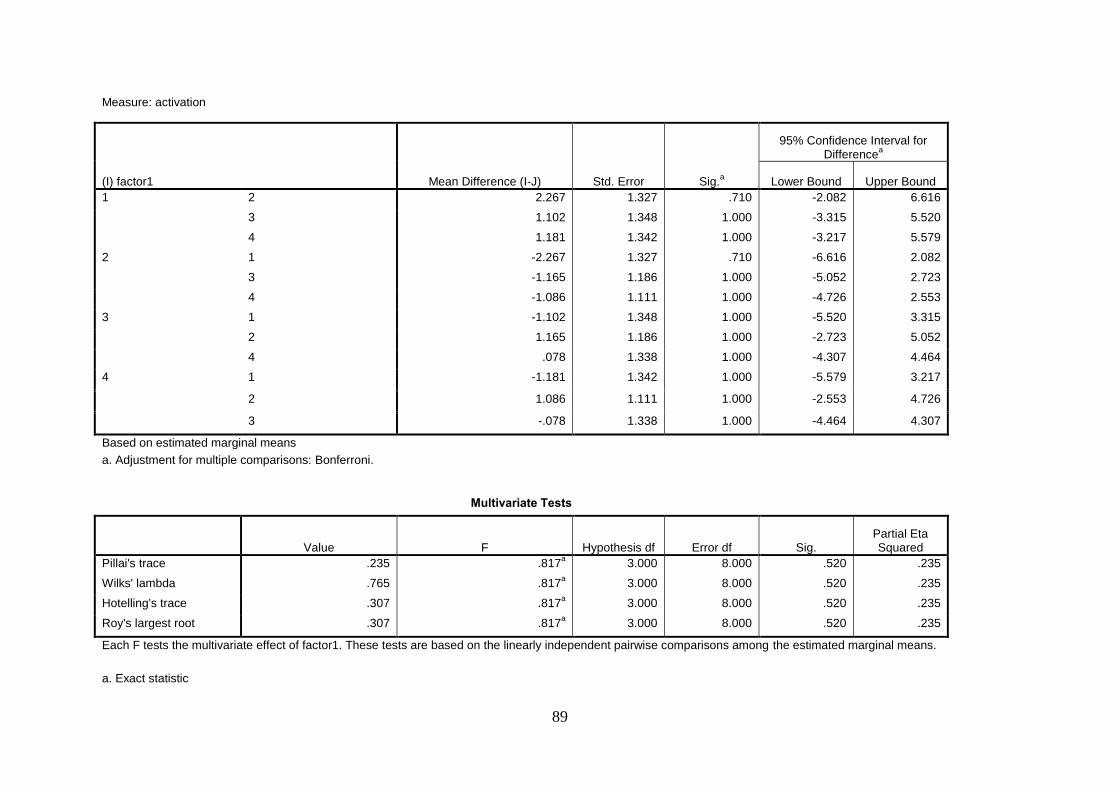
89
Measure: activation
(I) factor1 Mean Difference (I-J) Std. Error Sig.a
95% Confidence Interval for Difference
a
Lower Bound Upper Bound
1 2 2.267 1.327 .710 -2.082 6.616
3 1.102 1.348 1.000 -3.315 5.520
4 1.181 1.342 1.000 -3.217 5.579
2 1 -2.267 1.327 .710 -6.616 2.082
3 -1.165 1.186 1.000 -5.052 2.723
4 -1.086 1.111 1.000 -4.726 2.553
3 1 -1.102 1.348 1.000 -5.520 3.315
2 1.165 1.186 1.000 -2.723 5.052
4 .078 1.338 1.000 -4.307 4.464
4 1 -1.181 1.342 1.000 -5.579 3.217
2 1.086 1.111 1.000 -2.553 4.726
3 -.078 1.338 1.000 -4.464 4.307
Based on estimated marginal means
a. Adjustment for multiple comparisons: Bonferroni.
Multivariate Tests
Value F Hypothesis df Error df Sig. Partial Eta Squared
Pillai's trace .235 .817a 3.000 8.000 .520 .235
Wilks' lambda .765 .817a 3.000 8.000 .520 .235
Hotelling's trace .307 .817a 3.000 8.000 .520 .235
Roy's largest root .307 .817a 3.000 8.000 .520 .235
Each F tests the multivariate effect of factor1. These tests are based on the linearly independent pairwise comparisons among the estimated marginal means.
a. Exact statistic

90
T-TEST PAIRS=bar20 bar30 bar40 WITH band20 bandbell30 bandbell40 (PAIRED)
/CRITERIA=CI(.9500)
/MISSING=ANALYSIS.
Pecs T-Test
Notes
Output Created 28-OCT-2013 19:21:11
Comments
Input Active Dataset DataSet0
Filter <none>
Weight <none>
Split File <none>
N of Rows in Working Data File
11
Missing Value Handling Definition of Missing User defined missing values are treated as missing.
Cases Used Statistics for each analysis are based on the cases with no missing or out-of-range data for any variable in the analysis.

91
Syntax T-TEST PAIRS=bar20 bar30 bar40 WITH band20 bandbell30 bandbell40 (PAIRED) /CRITERIA=CI(.9500) /MISSING=ANALYSIS.
Resources Processor Time 00:00:00.02
Elapsed Time 00:00:00.02
[DataSet0]
Paired Samples Statistics
Mean N Std. Deviation Std. Error
Mean
Pair 1 bar20 25.0617 11 5.90503 1.78043
band20 22.1466 11 5.84197 1.76142
Pair 2 bar30 33.7651 11 5.55752 1.67566
bandbell30 29.7177 11 5.22012 1.57392
Pair 3 bar40 41.0036 11 5.75860 1.73628
bandbell40 38.0667 11 3.88629 1.17176
Paired Samples Correlations
N Correlation Sig.
Pair 1 bar20 & band20 11 .679 .022
Pair 2 bar30 & bandbell30 11 .742 .009
Pair 3 bar40 & bandbell40 11 .595 .053
Paired Samples Test
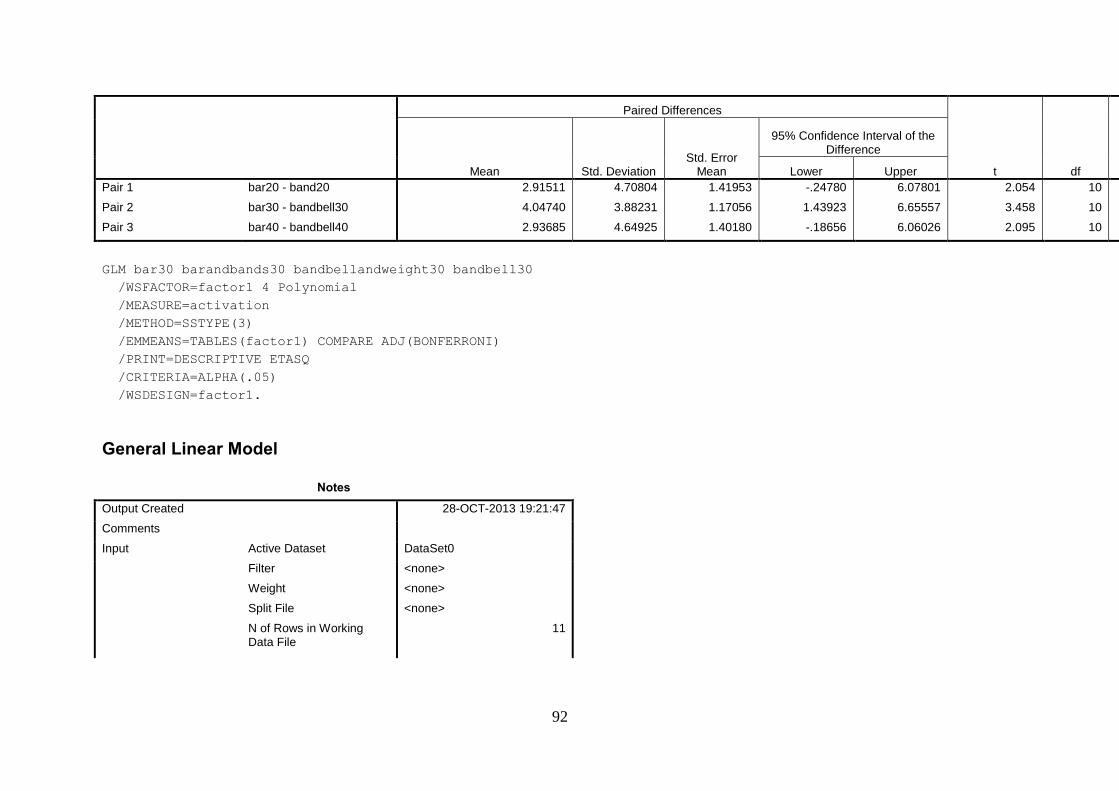
92
Paired Differences
t df Sig. (2-tailed) Mean Std. Deviation Std. Error
Mean
95% Confidence Interval of the Difference
Lower Upper
Pair 1 bar20 - band20 2.91511 4.70804 1.41953 -.24780 6.07801 2.054 10 .067
Pair 2 bar30 - bandbell30 4.04740 3.88231 1.17056 1.43923 6.65557 3.458 10 .006
Pair 3 bar40 - bandbell40 2.93685 4.64925 1.40180 -.18656 6.06026 2.095 10 .063
GLM bar30 barandbands30 bandbellandweight30 bandbell30
/WSFACTOR=factor1 4 Polynomial
/MEASURE=activation
/METHOD=SSTYPE(3)
/EMMEANS=TABLES(factor1) COMPARE ADJ(BONFERRONI)
/PRINT=DESCRIPTIVE ETASQ
/CRITERIA=ALPHA(.05)
/WSDESIGN=factor1.
General Linear Model
Notes
Output Created 28-OCT-2013 19:21:47
Comments
Input Active Dataset DataSet0
Filter <none>
Weight <none>
Split File <none>
N of Rows in Working Data File
11

93
Missing Value Handling Definition of Missing User-defined missing values are treated as missing.
Cases Used Statistics are based on all cases with valid data for all variables in the model.
Syntax GLM bar30 barandbands30 bandbellandweight30 bandbell30 /WSFACTOR=factor1 4 Polynomial /MEASURE=activation /METHOD=SSTYPE(3) /EMMEANS=TABLES(factor1) COMPARE ADJ(BONFERRONI) /PRINT=DESCRIPTIVE ETASQ /CRITERIA=ALPHA(.05) /WSDESIGN=factor1.
Resources Processor Time 00:00:00.03
Elapsed Time 00:00:00.06
[DataSet0]
Within-Subjects Factors
Measure: activation
factor1 Dependent Variable

94
1 bar30
2 barandbands30
3 bandbellandweight30
4 bandbell30
Descriptive Statistics
Mean Std. Deviation N
bar30 33.7651 5.55752 11
barandbands30 30.4090 5.30790 11
bandbellandweight30 33.9284 6.83209 11
bandbell30 29.7177 5.22012 11
Multivariate Testsa
Effect Value F Hypothesis df Error df Sig. Partial Eta Squared
factor1 Pillai's Trace .694 6.051b 3.000 8.000 .019 .694
Wilks' Lambda .306 6.051b 3.000 8.000 .019 .694
Hotelling's Trace 2.269 6.051b 3.000 8.000 .019 .694
Roy's Largest Root 2.269 6.051b 3.000 8.000 .019 .694
a. Design: Intercept Within Subjects Design: factor1
b. Exact statistic
Mauchly's Test of Sphericitya
Measure: activation
Within Subjects Effect Mauchly's W Approx. Chi-Square df Sig. Epsilon
b

95
Greenhouse-Geisser Huynh-Feldt Lower-bound
factor1 .543 5.332 5 .379 .693 .878 .333
Tests the null hypothesis that the error covariance matrix of the orthonormalized transformed dependent variables is proportional to an identity matrix.
a. Design: Intercept Within Subjects Design: factor1
b. May be used to adjust the degrees of freedom for the averaged tests of significance. Corrected tests are displayed in the Tests of Within-Subjects Effects table.
Tests of Within-Subjects Effects
Measure: activation
Source Type III Sum of Squares df Mean Square F Sig. Partial Eta Squared
factor1 Sphericity Assumed 160.232 3 53.411 7.084 .001 .415
Greenhouse-Geisser 160.232 2.078 77.106 7.084 .004 .415
Huynh-Feldt 160.232 2.633 60.854 7.084 .002 .415
Lower-bound 160.232 1.000 160.232 7.084 .024 .415
Error(factor1) Sphericity Assumed 226.200 30 7.540
Greenhouse-Geisser 226.200 20.781 10.885
Huynh-Feldt 226.200 26.331 8.591
Lower-bound 226.200 10.000 22.620
Tests of Within-Subjects Contrasts
Measure: activation
Source Type III Sum of Squares df Mean Square F Sig. Partial Eta Squared
factor1 Linear 40.894 1 40.894 6.944 .025 .410
Quadratic 2.008 1 2.008 .209 .657 .020

96
Cubic 117.330 1 117.330 16.455 .002 .622
Error(factor1) Linear 58.889 10 5.889
Quadratic 96.006 10 9.601
Cubic 71.305 10 7.131
Tests of Between-Subjects Effects
Measure: activation Transformed Variable: Average
Source Type III Sum of Squares df Mean Square F Sig. Partial Eta Squared
Intercept 44929.546 1 44929.546 407.093 .000 .976
Error 1103.669 10 110.367
Estimated Marginal Means
factor1
Estimates
Measure: activation
factor1 Mean Std. Error
95% Confidence Interval
Lower Bound Upper Bound
1 33.765 1.676 30.032 37.499
2 30.409 1.600 26.843 33.975
3 33.928 2.060 29.339 38.518
4 29.718 1.574 26.211 33.225
Pairwise Comparisons

97
Measure: activation
(I) factor1 Mean Difference (I-J) Std. Error Sig.b
95% Confidence Interval for Difference
b
Lower Bound Upper Bound
1 2 3.356* .868 .019 .513 6.199
3 -.163 1.007 1.000 -3.462 3.136
4 4.047* 1.171 .037 .212 7.883
2 1 -3.356* .868 .019 -6.199 -.513
3 -3.519* .998 .033 -6.791 -.248
4 .691 1.216 1.000 -3.293 4.676
3 1 .163 1.007 1.000 -3.136 3.462
2 3.519* .998 .033 .248 6.791
4 4.211 1.617 .158 -1.087 9.508
4 1 -4.047* 1.171 .037 -7.883 -.212
2 -.691 1.216 1.000 -4.676 3.293
3 -4.211 1.617 .158 -9.508 1.087
Based on estimated marginal means
*. The mean difference is significant at the .05 level.
b. Adjustment for multiple comparisons: Bonferroni.
Multivariate Tests
Value F Hypothesis df Error df Sig. Partial Eta Squared
Pillai's trace .694 6.051a 3.000 8.000 .019 .694
Wilks' lambda .306 6.051a 3.000 8.000 .019 .694
Hotelling's trace 2.269 6.051a 3.000 8.000 .019 .694
Roy's largest root 2.269 6.051a 3.000 8.000 .019 .694
Each F tests the multivariate effect of factor1. These tests are based on the linearly independent pairwise comparisons among the estimated marginal means.

98
a. Exact statistic
T-TEST PAIRS=bar20 bar30 bar40 WITH band20 bandbell30 bandbell40 (PAIRED)
/CRITERIA=CI(.9500)
/MISSING=ANALYSIS.
Delts T-Test
Notes
Output Created 28-OCT-2013 19:22:51
Comments
Input Active Dataset DataSet0
Filter <none>
Weight <none>
Split File <none>
N of Rows in Working Data File
11
Missing Value Handling Definition of Missing User defined missing values are treated as missing.
Cases Used Statistics for each analysis are based on the cases with no missing or out-of-range data for any variable in the analysis.

99
Syntax T-TEST PAIRS=bar20 bar30 bar40 WITH band20 bandbell30 bandbell40 (PAIRED) /CRITERIA=CI(.9500) /MISSING=ANALYSIS.
Resources Processor Time 00:00:00.02
Elapsed Time 00:00:00.01
[DataSet0]
Paired Samples Statistics
Mean N Std. Deviation Std. Error
Mean
Pair 1 bar20 23.9931 11 5.02207 1.51421
band20 21.4268 11 5.25315 1.58388
Pair 2 bar30 34.1737 11 5.23501 1.57841
bandbell30 26.7725 11 6.75590 2.03698
Pair 3 bar40 38.9138 11 6.36149 1.91806
bandbell40 33.9183 11 7.00028 2.11066
Paired Samples Correlations
N Correlation Sig.
Pair 1 bar20 & band20 11 .936 .000
Pair 2 bar30 & bandbell30 11 .334 .315
Pair 3 bar40 & bandbell40 11 .330 .322
Paired Samples Test

100
Paired Differences
t df Sig. (2-tailed) Mean Std. Deviation Std. Error
Mean
95% Confidence Interval of the Difference
Lower Upper
Pair 1 bar20 - band20 2.56638 1.85317 .55875 1.32141 3.81136 4.593 10 .001
Pair 2 bar30 - bandbell30 7.40120 7.02996 2.11961 2.67841 12.12400 3.492 10 .006
Pair 3 bar40 - bandbell40 4.99546 7.75404 2.33793 -.21377 10.20469 2.137 10 .058
GLM bar30 barandbands30 bandbellandweight30 bandbell30
/WSFACTOR=factor1 4 Polynomial
/MEASURE=activation
/METHOD=SSTYPE(3)
/EMMEANS=TABLES(factor1) COMPARE ADJ(BONFERRONI)
/PRINT=DESCRIPTIVE ETASQ
/CRITERIA=ALPHA(.05)
/WSDESIGN=factor1.
General Linear Model
Notes
Output Created 28-OCT-2013 19:24:02
Comments
Input Active Dataset DataSet0
Filter <none>
Weight <none>
Split File <none>
N of Rows in Working Data File
11

101
Missing Value Handling Definition of Missing User-defined missing values are treated as missing.
Cases Used Statistics are based on all cases with valid data for all variables in the model.
Syntax GLM bar30 barandbands30 bandbellandweight30 bandbell30 /WSFACTOR=factor1 4 Polynomial /MEASURE=activation /METHOD=SSTYPE(3) /EMMEANS=TABLES(factor1) COMPARE ADJ(BONFERRONI) /PRINT=DESCRIPTIVE ETASQ /CRITERIA=ALPHA(.05) /WSDESIGN=factor1.
Resources Processor Time 00:00:00.02
Elapsed Time 00:00:00.03
[DataSet0]
Within-Subjects Factors
Measure: activation
factor1 Dependent Variable

102
1 bar30
2 barandbands30
3 bandbellandweight30
4 bandbell30
Descriptive Statistics
Mean Std. Deviation N
bar30 34.1737 5.23501 11
barandbands30 30.6929 5.36106 11
bandbellandweight30 29.4294 4.87567 11
bandbell30 26.7725 6.75590 11
Multivariate Testsa
Effect Value F Hypothesis df Error df Sig. Partial Eta Squared
factor1 Pillai's Trace .611 4.191b 3.000 8.000 .047 .611
Wilks' Lambda .389 4.191b 3.000 8.000 .047 .611
Hotelling's Trace 1.572 4.191b 3.000 8.000 .047 .611
Roy's Largest Root 1.572 4.191b 3.000 8.000 .047 .611
a. Design: Intercept Within Subjects Design: factor1
b. Exact statistic
Mauchly's Test of Sphericitya
Measure: activation
Within Subjects Effect Mauchly's W Approx. Chi-Square df Sig. Epsilon
b

103
Greenhouse-Geisser Huynh-Feldt Lower-bound
factor1 .119 18.601 5 .002 .556 .654 .333
Tests the null hypothesis that the error covariance matrix of the orthonormalized transformed dependent variables is proportional to an identity matrix.
a. Design: Intercept Within Subjects Design: factor1
b. May be used to adjust the degrees of freedom for the averaged tests of significance. Corrected tests are displayed in the Tests of Within-Subjects Effects table.
Tests of Within-Subjects Effects
Measure: activation
Source Type III Sum of Squares df Mean Square F Sig. Partial Eta Squared
factor1 Sphericity Assumed 311.925 3 103.975 7.436 .001 .426
Greenhouse-Geisser 311.925 1.668 186.999 7.436 .007 .426
Huynh-Feldt 311.925 1.962 158.970 7.436 .004 .426
Lower-bound 311.925 1.000 311.925 7.436 .021 .426
Error(factor1) Sphericity Assumed 419.493 30 13.983
Greenhouse-Geisser 419.493 16.681 25.149
Huynh-Feldt 419.493 19.622 21.379
Lower-bound 419.493 10.000 41.949
Tests of Within-Subjects Contrasts
Measure: activation
Source Type III Sum of Squares df Mean Square F Sig. Partial Eta Squared
factor1 Linear 302.887 1 302.887 11.072 .008 .525
Quadratic 1.867 1 1.867 .163 .695 .016

104
Cubic 7.171 1 7.171 2.301 .160 .187
Error(factor1) Linear 273.558 10 27.356
Quadratic 114.776 10 11.478
Cubic 31.159 10 3.116
Tests of Between-Subjects Effects
Measure: activation Transformed Variable: Average
Source Type III Sum of Squares df Mean Square F Sig. Partial Eta Squared
Intercept 40308.334 1 40308.334 482.092 .000 .980
Error 836.113 10 83.611
Estimated Marginal Means
factor1
Estimates
Measure: activation
factor1 Mean Std. Error
95% Confidence Interval
Lower Bound Upper Bound
1 34.174 1.578 30.657 37.691
2 30.693 1.616 27.091 34.294
3 29.429 1.470 26.154 32.705
4 26.772 2.037 22.234 31.311
Pairwise Comparisons

105
Measure: activation
(I) factor1 Mean Difference (I-J) Std. Error Sig.b
95% Confidence Interval for Difference
b
Lower Bound Upper Bound
1 2 3.481 1.327 .153 -.869 7.830
3 4.744* 1.211 .017 .777 8.711
4 7.401* 2.120 .035 .456 14.347
2 1 -3.481 1.327 .153 -7.830 .869
3 1.263 1.023 1.000 -2.090 4.617
4 3.920 2.183 .617 -3.234 11.075
3 1 -4.744* 1.211 .017 -8.711 -.777
2 -1.263 1.023 1.000 -4.617 2.090
4 2.657 1.311 .421 -1.640 6.953
4 1 -7.401* 2.120 .035 -14.347 -.456
2 -3.920 2.183 .617 -11.075 3.234
3 -2.657 1.311 .421 -6.953 1.640
Based on estimated marginal means
*. The mean difference is significant at the .05 level.
b. Adjustment for multiple comparisons: Bonferroni.
Multivariate Tests
Value F Hypothesis df Error df Sig. Partial Eta Squared
Pillai's trace .611 4.191a 3.000 8.000 .047 .611
Wilks' lambda .389 4.191a 3.000 8.000 .047 .611
Hotelling's trace 1.572 4.191a 3.000 8.000 .047 .611
Roy's largest root 1.572 4.191a 3.000 8.000 .047 .611
Each F tests the multivariate effect of factor1. These tests are based on the linearly independent pairwise comparisons among the estimated marginal means.

106
a. Exact statistic
T-TEST PAIRS=bar20 bar30 bar40 WITH band20 bandbell30 bandbell40 (PAIRED)
/CRITERIA=CI(.9500)
/MISSING=ANALYSIS.
Lats T-Test
Notes
Output Created 28-OCT-2013 19:25:12
Comments
Input Active Dataset DataSet0
Filter <none>
Weight <none>
Split File <none>
N of Rows in Working Data File
11
Missing Value Handling Definition of Missing User defined missing values are treated as missing.
Cases Used Statistics for each analysis are based on the cases with no missing or out-of-range data for any variable in the analysis.

107
Syntax T-TEST PAIRS=bar20 bar30 bar40 WITH band20 bandbell30 bandbell40 (PAIRED) /CRITERIA=CI(.9500) /MISSING=ANALYSIS.
Resources Processor Time 00:00:00.02
Elapsed Time 00:00:00.02
[DataSet0]
Paired Samples Statistics
Mean N Std. Deviation Std. Error
Mean
Pair 1 bar20 16.9203 11 6.06241 1.82789
band20 19.5939 11 6.90269 2.08124
Pair 2 bar30 24.6148 11 10.30178 3.10610
bandbell30 27.6669 11 7.55797 2.27881
Pair 3 bar40 28.5480 11 10.57559 3.18866
bandbell40 37.5182 11 8.34278 2.51544
Paired Samples Correlations
N Correlation Sig.
Pair 1 bar20 & band20 11 .811 .002
Pair 2 bar30 & bandbell30 11 .649 .031
Pair 3 bar40 & bandbell40 11 .528 .095
Paired Samples Test

108
Paired Differences
t df Sig. (2-tailed) Mean Std. Deviation Std. Error
Mean
95% Confidence Interval of the Difference
Lower Upper
Pair 1 bar20 - band20 -2.67356 4.06608 1.22597 -5.40519 .05807 -2.181 10 .054
Pair 2 bar30 - bandbell30 -3.05210 7.88527 2.37750 -8.34950 2.24529 -1.284 10 .228
Pair 3 bar40 - bandbell40 -8.97020 9.39811 2.83364 -15.28393 -2.65646 -3.166 10 .010
GLM bar30 barandbands30 bandbellandweight30 bandbell30
/WSFACTOR=factor1 4 Polynomial
/MEASURE=activation
/METHOD=SSTYPE(3)
/EMMEANS=TABLES(factor1) COMPARE ADJ(BONFERRONI)
/PRINT=DESCRIPTIVE ETASQ
/CRITERIA=ALPHA(.05)
/WSDESIGN=factor1.
General Linear Model
Notes
Output Created 28-OCT-2013 19:25:47
Comments
Input Active Dataset DataSet0
Filter <none>
Weight <none>
Split File <none>
N of Rows in Working Data File
11
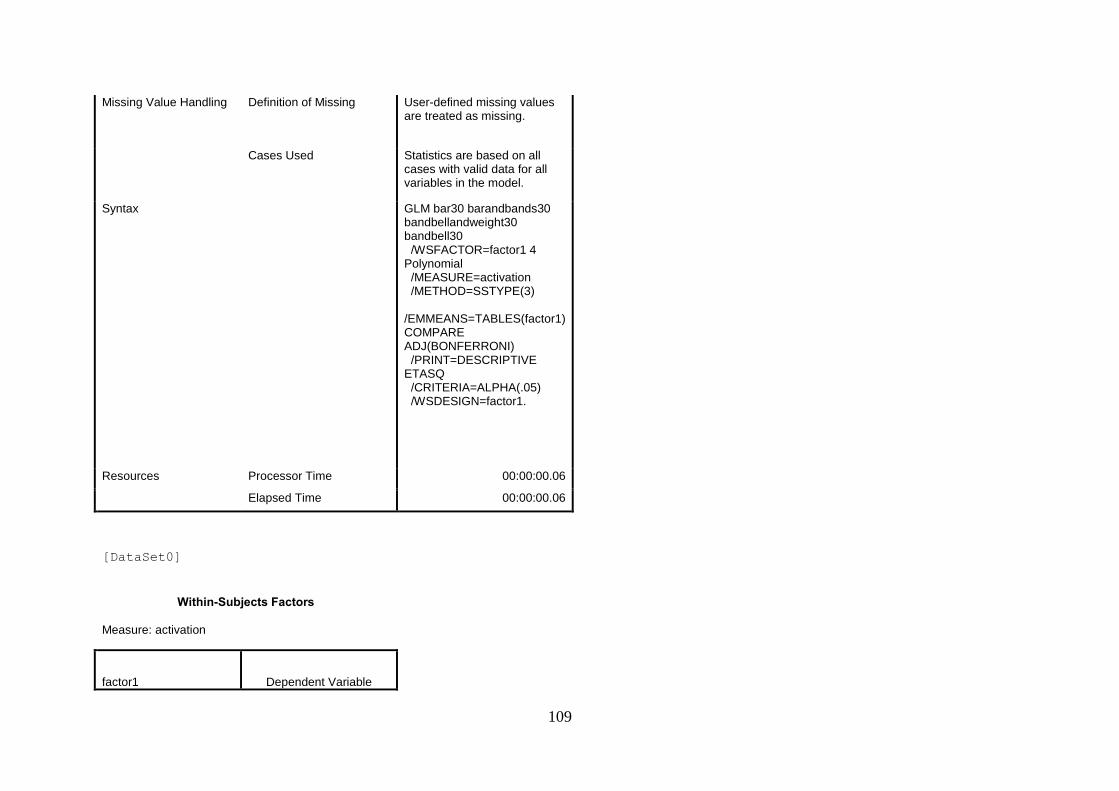
109
Missing Value Handling Definition of Missing User-defined missing values are treated as missing.
Cases Used Statistics are based on all cases with valid data for all variables in the model.
Syntax GLM bar30 barandbands30 bandbellandweight30 bandbell30 /WSFACTOR=factor1 4 Polynomial /MEASURE=activation /METHOD=SSTYPE(3) /EMMEANS=TABLES(factor1) COMPARE ADJ(BONFERRONI) /PRINT=DESCRIPTIVE ETASQ /CRITERIA=ALPHA(.05) /WSDESIGN=factor1.
Resources Processor Time 00:00:00.06
Elapsed Time 00:00:00.06
[DataSet0]
Within-Subjects Factors
Measure: activation
factor1 Dependent Variable

110
1 bar30
2 barandbands30
3 bandbellandweight30
4 bandbell30
Descriptive Statistics
Mean Std. Deviation N
bar30 24.6148 10.30178 11
barandbands30 20.1581 7.53896 11
bandbellandweight30 21.9051 10.69847 11
bandbell30 27.6669 7.55797 11
Multivariate Testsa
Effect Value F Hypothesis df Error df Sig. Partial Eta Squared
factor1 Pillai's Trace .588 3.801b 3.000 8.000 .058 .588
Wilks' Lambda .412 3.801b 3.000 8.000 .058 .588
Hotelling's Trace 1.425 3.801b 3.000 8.000 .058 .588
Roy's Largest Root 1.425 3.801b 3.000 8.000 .058 .588
a. Design: Intercept Within Subjects Design: factor1
b. Exact statistic
Mauchly's Test of Sphericitya
Measure: activation
Within Subjects Effect Mauchly's W Approx. Chi-Square df Sig. Epsilon
b
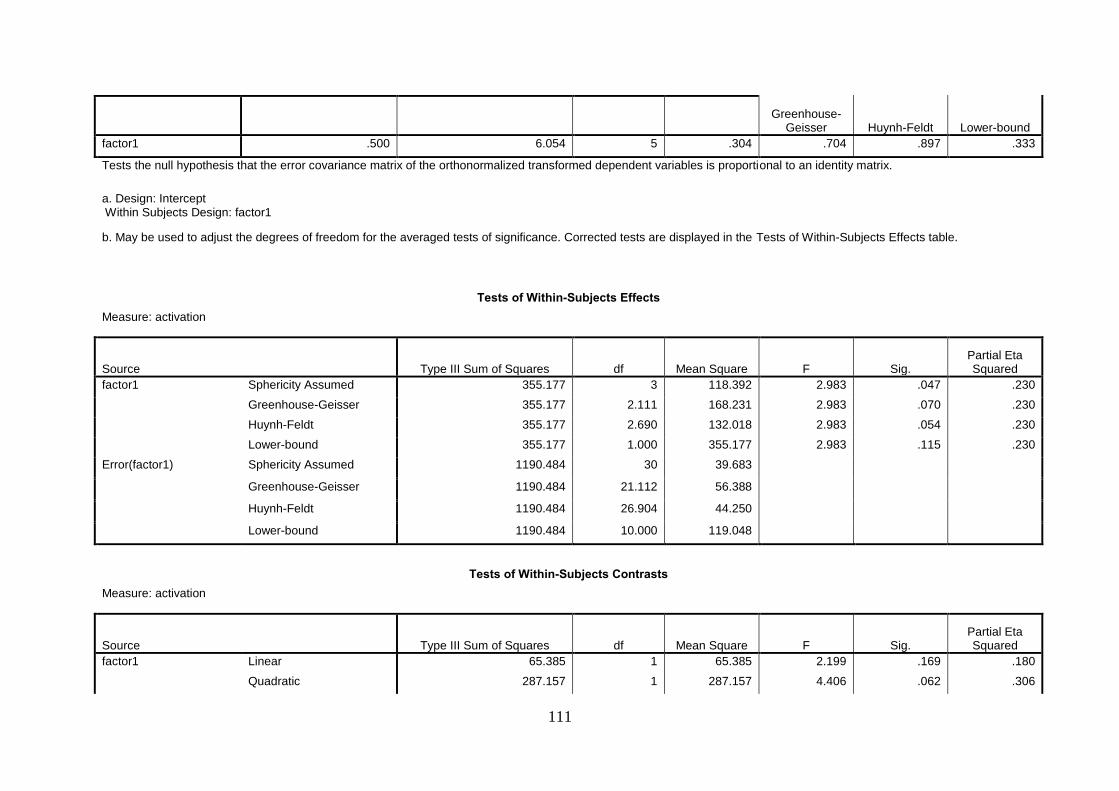
111
Greenhouse-Geisser Huynh-Feldt Lower-bound
factor1 .500 6.054 5 .304 .704 .897 .333
Tests the null hypothesis that the error covariance matrix of the orthonormalized transformed dependent variables is proportional to an identity matrix.
a. Design: Intercept Within Subjects Design: factor1
b. May be used to adjust the degrees of freedom for the averaged tests of significance. Corrected tests are displayed in the Tests of Within-Subjects Effects table.
Tests of Within-Subjects Effects
Measure: activation
Source Type III Sum of Squares df Mean Square F Sig. Partial Eta Squared
factor1 Sphericity Assumed 355.177 3 118.392 2.983 .047 .230
Greenhouse-Geisser 355.177 2.111 168.231 2.983 .070 .230
Huynh-Feldt 355.177 2.690 132.018 2.983 .054 .230
Lower-bound 355.177 1.000 355.177 2.983 .115 .230
Error(factor1) Sphericity Assumed 1190.484 30 39.683
Greenhouse-Geisser 1190.484 21.112 56.388
Huynh-Feldt 1190.484 26.904 44.250
Lower-bound 1190.484 10.000 119.048
Tests of Within-Subjects Contrasts
Measure: activation
Source Type III Sum of Squares df Mean Square F Sig. Partial Eta Squared
factor1 Linear 65.385 1 65.385 2.199 .169 .180
Quadratic 287.157 1 287.157 4.406 .062 .306
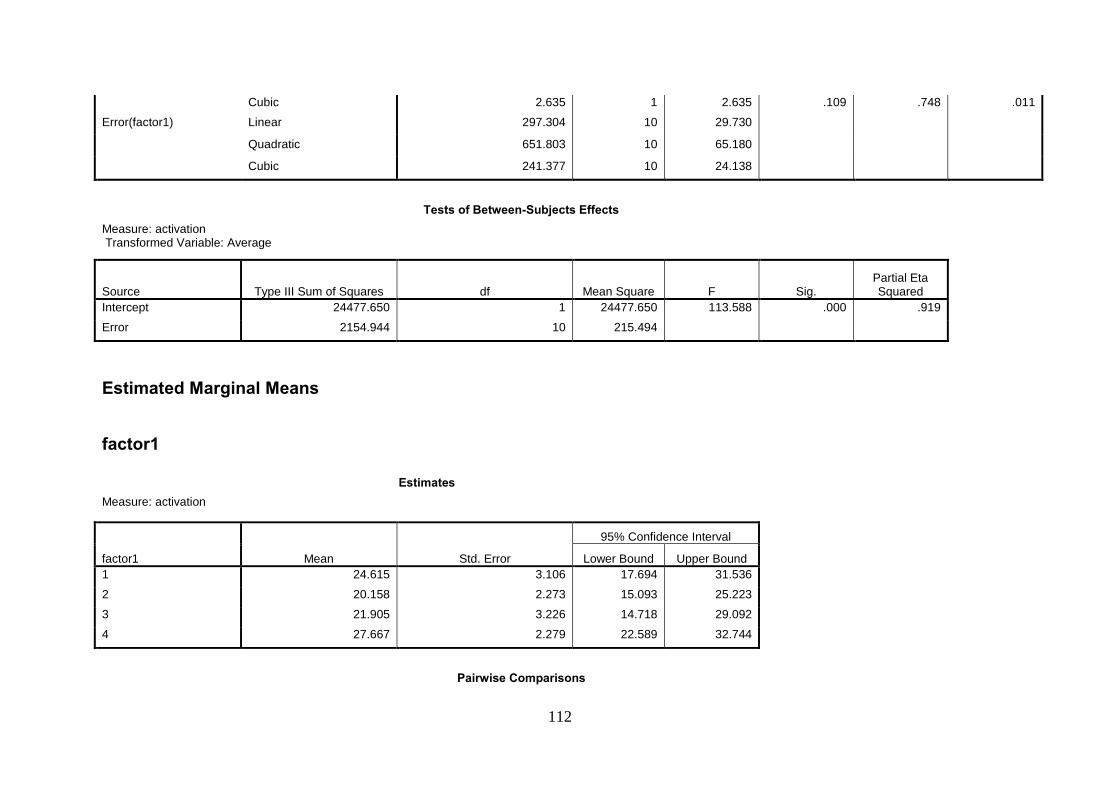
112
Cubic 2.635 1 2.635 .109 .748 .011
Error(factor1) Linear 297.304 10 29.730
Quadratic 651.803 10 65.180
Cubic 241.377 10 24.138
Tests of Between-Subjects Effects
Measure: activation Transformed Variable: Average
Source Type III Sum of Squares df Mean Square F Sig. Partial Eta Squared
Intercept 24477.650 1 24477.650 113.588 .000 .919
Error 2154.944 10 215.494
Estimated Marginal Means
factor1
Estimates
Measure: activation
factor1 Mean Std. Error
95% Confidence Interval
Lower Bound Upper Bound
1 24.615 3.106 17.694 31.536
2 20.158 2.273 15.093 25.223
3 21.905 3.226 14.718 29.092
4 27.667 2.279 22.589 32.744
Pairwise Comparisons

113
Measure: activation
(I) factor1 Mean Difference (I-J) Std. Error Sig.b
95% Confidence Interval for Difference
b
Lower Bound Upper Bound
1 2 4.457 2.633 .728 -4.170 13.084
3 2.710 3.466 1.000 -8.648 14.068
4 -3.052 2.377 1.000 -10.843 4.739
2 1 -4.457 2.633 .728 -13.084 4.170
3 -1.747 2.035 1.000 -8.416 4.922
4 -7.509* 2.139 .034 -14.517 -.500
3 1 -2.710 3.466 1.000 -14.068 8.648
2 1.747 2.035 1.000 -4.922 8.416
4 -5.762 3.159 .589 -16.112 4.588
4 1 3.052 2.377 1.000 -4.739 10.843
2 7.509* 2.139 .034 .500 14.517
3 5.762 3.159 .589 -4.588 16.112
Based on estimated marginal means
*. The mean difference is significant at the .05 level.
b. Adjustment for multiple comparisons: Bonferroni.
Multivariate Tests
Value F Hypothesis df Error df Sig. Partial Eta Squared
Pillai's trace .588 3.801a 3.000 8.000 .058 .588
Wilks' lambda .412 3.801a 3.000 8.000 .058 .588
Hotelling's trace 1.425 3.801a 3.000 8.000 .058 .588
Roy's largest root 1.425 3.801a 3.000 8.000 .058 .588
Each F tests the multivariate effect of factor1. These tests are based on the linearly independent pairwise comparisons among the estimated marginal means.

114
a. Exact statistic
T-TEST PAIRS=bar20 bar30 bar40 WITH band20 bandbell30 bandbell40 (PAIRED)
/CRITERIA=CI(.9500)
/MISSING=ANALYSIS.
Obliques T-Test
Notes
Output Created 28-OCT-2013 19:26:55
Comments
Input Active Dataset DataSet0
Filter <none>
Weight <none>
Split File <none>
N of Rows in Working Data File
11
Missing Value Handling Definition of Missing User defined missing values are treated as missing.
Cases Used Statistics for each analysis are based on the cases with no missing or out-of-range data for any variable in the analysis.

115
Syntax T-TEST PAIRS=bar20 bar30 bar40 WITH band20 bandbell30 bandbell40 (PAIRED) /CRITERIA=CI(.9500) /MISSING=ANALYSIS.
Resources Processor Time 00:00:00.02
Elapsed Time 00:00:00.01
[DataSet0]
Paired Samples Statistics
Mean N Std. Deviation Std. Error
Mean
Pair 1 bar20 18.5635 11 6.18516 1.86489
band20 22.8453 11 9.23352 2.78401
Pair 2 bar30 25.7062 11 9.17960 2.76775
bandbell30 33.6637 11 13.72108 4.13706
Pair 3 bar40 27.8529 11 9.04449 2.72702
bandbell40 38.1207 11 7.76340 2.34075
Paired Samples Correlations
N Correlation Sig.
Pair 1 bar20 & band20 11 .712 .014
Pair 2 bar30 & bandbell30 11 .567 .069
Pair 3 bar40 & bandbell40 11 .801 .003
Paired Samples Test

116
Paired Differences
t df Sig. (2-tailed) Mean Std. Deviation Std. Error
Mean
95% Confidence Interval of the Difference
Lower Upper
Pair 1 bar20 - band20 -4.28179 6.49161 1.95729 -8.64291 .07933 -2.188 10 .054
Pair 2 bar30 - bandbell30 -7.95750 11.39218 3.43487 -15.61087 -.30413 -2.317 10 .043
Pair 3 bar40 - bandbell40 -10.26779 5.44105 1.64054 -13.92313 -6.61244 -6.259 10 .000
GLM bar30 barandbands30 bandbellandweight30 bandbell30
/WSFACTOR=factor1 4 Polynomial
/MEASURE=activation
/METHOD=SSTYPE(3)
/EMMEANS=TABLES(factor1) COMPARE ADJ(BONFERRONI)
/PRINT=DESCRIPTIVE ETASQ
/CRITERIA=ALPHA(.05)
/WSDESIGN=factor1.
General Linear Model
Notes
Output Created 28-OCT-2013 19:27:37
Comments
Input Active Dataset DataSet0
Filter <none>
Weight <none>
Split File <none>
N of Rows in Working Data File
11

117
Missing Value Handling Definition of Missing User-defined missing values are treated as missing.
Cases Used Statistics are based on all cases with valid data for all variables in the model.
Syntax GLM bar30 barandbands30 bandbellandweight30 bandbell30 /WSFACTOR=factor1 4 Polynomial /MEASURE=activation /METHOD=SSTYPE(3) /EMMEANS=TABLES(factor1) COMPARE ADJ(BONFERRONI) /PRINT=DESCRIPTIVE ETASQ /CRITERIA=ALPHA(.05) /WSDESIGN=factor1.
Resources Processor Time 00:00:00.06
Elapsed Time 00:00:00.08
[DataSet0]
Within-Subjects Factors
Measure: activation
factor1 Dependent Variable

118
1 bar30
2 barandbands30
3 bandbellandweight30
4 bandbell30
Descriptive Statistics
Mean Std. Deviation N
bar30 25.7062 9.17960 11
barandbands30 23.8661 8.33111 11
bandbellandweight30 25.1382 10.54934 11
bandbell30 33.6637 13.72108 11
Multivariate Testsa
Effect Value F Hypothesis df Error df Sig. Partial Eta Squared
factor1 Pillai's Trace .670 5.403b 3.000 8.000 .025 .670
Wilks' Lambda .330 5.403b 3.000 8.000 .025 .670
Hotelling's Trace 2.026 5.403b 3.000 8.000 .025 .670
Roy's Largest Root 2.026 5.403b 3.000 8.000 .025 .670
a. Design: Intercept Within Subjects Design: factor1
b. Exact statistic
Mauchly's Test of Sphericitya
Measure: activation
Within Subjects Effect Mauchly's W Approx. Chi-Square df Sig. Epsilon
b

119
Greenhouse-Geisser Huynh-Feldt Lower-bound
factor1 .176 15.130 5 .010 .610 .740 .333
Tests the null hypothesis that the error covariance matrix of the orthonormalized transformed dependent variables is proportional to an identity matrix.
a. Design: Intercept Within Subjects Design: factor1
b. May be used to adjust the degrees of freedom for the averaged tests of significance. Corrected tests are displayed in the Tests of Within-Subjects Effects table.
Tests of Within-Subjects Effects
Measure: activation
Source Type III Sum of Squares df Mean Square F Sig. Partial Eta Squared
factor1 Sphericity Assumed 652.651 3 217.550 6.473 .002 .393
Greenhouse-Geisser 652.651 1.830 356.709 6.473 .009 .393
Huynh-Feldt 652.651 2.219 294.183 6.473 .005 .393
Lower-bound 652.651 1.000 652.651 6.473 .029 .393
Error(factor1) Sphericity Assumed 1008.313 30 33.610
Greenhouse-Geisser 1008.313 18.296 55.110
Huynh-Feldt 1008.313 22.185 45.450
Lower-bound 1008.313 10.000 100.831
Tests of Within-Subjects Contrasts
Measure: activation
Source Type III Sum of Squares df Mean Square F Sig. Partial Eta Squared
factor1 Linear 347.740 1 347.740 5.487 .041 .354
Quadratic 295.480 1 295.480 9.390 .012 .484

120
Cubic 9.431 1 9.431 1.574 .238 .136
Error(factor1) Linear 633.732 10 63.373
Quadratic 314.667 10 31.467
Cubic 59.914 10 5.991
Tests of Between-Subjects Effects
Measure: activation Transformed Variable: Average
Source Type III Sum of Squares df Mean Square F Sig. Partial Eta Squared
Intercept 32298.717 1 32298.717 91.654 .000 .902
Error 3523.978 10 352.398
Estimated Marginal Means
factor1
Estimates
Measure: activation
factor1 Mean Std. Error
95% Confidence Interval
Lower Bound Upper Bound
1 25.706 2.768 19.539 31.873
2 23.866 2.512 18.269 29.463
3 25.138 3.181 18.051 32.225
4 33.664 4.137 24.446 42.882
Pairwise Comparisons

121
Measure: activation
(I) factor1 Mean Difference (I-J) Std. Error Sig.b
95% Confidence Interval for Difference
b
Lower Bound Upper Bound
1 2 1.840 2.490 1.000 -6.318 9.998
3 .568 2.899 1.000 -8.933 10.069
4 -7.958 3.435 .258 -19.213 3.298
2 1 -1.840 2.490 1.000 -9.998 6.318
3 -1.272 .902 1.000 -4.228 1.683
4 -9.798* 2.234 .008 -17.119 -2.476
3 1 -.568 2.899 1.000 -10.069 8.933
2 1.272 .902 1.000 -1.683 4.228
4 -8.526* 2.112 .014 -15.445 -1.606
4 1 7.958 3.435 .258 -3.298 19.213
2 9.798* 2.234 .008 2.476 17.119
3 8.526* 2.112 .014 1.606 15.445
Based on estimated marginal means
*. The mean difference is significant at the .05 level.
b. Adjustment for multiple comparisons: Bonferroni.
Multivariate Tests
Value F Hypothesis df Error df Sig. Partial Eta Squared
Pillai's trace .670 5.403a 3.000 8.000 .025 .670
Wilks' lambda .330 5.403a 3.000 8.000 .025 .670
Hotelling's trace 2.026 5.403a 3.000 8.000 .025 .670
Roy's largest root 2.026 5.403a 3.000 8.000 .025 .670
Each F tests the multivariate effect of factor1. These tests are based on the linearly independent pairwise comparisons among the estimated marginal means.

122
a. Exact statistic
T-TEST PAIRS=bar20 bar30 bar40 WITH band20 bandbell30 bandbell40 (PAIRED)
/CRITERIA=CI(.9500)
/MISSING=ANALYSIS.
VastLat T-Test
Notes
Output Created 28-OCT-2013 19:28:38
Comments
Input Active Dataset DataSet0
Filter <none>
Weight <none>
Split File <none>
N of Rows in Working Data File
11
Missing Value Handling Definition of Missing User defined missing values are treated as missing.
Cases Used Statistics for each analysis are based on the cases with no missing or out-of-range data for any variable in the analysis.

123
Syntax T-TEST PAIRS=bar20 bar30 bar40 WITH band20 bandbell30 bandbell40 (PAIRED) /CRITERIA=CI(.9500) /MISSING=ANALYSIS.
Resources Processor Time 00:00:00.02
Elapsed Time 00:00:00.01
[DataSet0]
Paired Samples Statistics
Mean N Std. Deviation Std. Error
Mean
Pair 1 bar20 22.2710 11 21.89163 6.60057
band20 23.1551 11 11.80738 3.56006
Pair 2 bar30 19.6551 11 15.46612 4.66321
bandbell30 31.3235 11 19.10612 5.76071
Pair 3 bar40 31.0400 11 22.39934 6.75365
bandbell40 36.4191 11 12.76189 3.84786
Paired Samples Correlations
N Correlation Sig.
Pair 1 bar20 & band20 11 .345 .299
Pair 2 bar30 & bandbell30 11 .160 .639
Pair 3 bar40 & bandbell40 11 .633 .037
Paired Samples Test

124
Paired Differences
t df Sig. (2-tailed) Mean Std. Deviation Std. Error
Mean
95% Confidence Interval of the Difference
Lower Upper
Pair 1 bar20 - band20 -.88410 20.98434 6.32702 -14.98157 13.21337 -.140 10 .892
Pair 2 bar30 - bandbell30 -11.66848 22.57994 6.80811 -26.83789 3.50093 -1.714 10 .117
Pair 3 bar40 - bandbell40 -5.37909 17.40278 5.24714 -17.07044 6.31226 -1.025 10 .329
GLM bar30 barandbands30 bandbellandweight30 bandbell30
/WSFACTOR=factor1 4 Polynomial
/MEASURE=activation
/METHOD=SSTYPE(3)
/EMMEANS=TABLES(factor1) COMPARE ADJ(BONFERRONI)
/PRINT=DESCRIPTIVE ETASQ
/CRITERIA=ALPHA(.05)
/WSDESIGN=factor1.
General Linear Model
Notes
Output Created 28-OCT-2013 19:28:48
Comments
Input Active Dataset DataSet0
Filter <none>
Weight <none>
Split File <none>
N of Rows in Working Data File
11

125
Missing Value Handling Definition of Missing User-defined missing values are treated as missing.
Cases Used Statistics are based on all cases with valid data for all variables in the model.
Syntax GLM bar30 barandbands30 bandbellandweight30 bandbell30 /WSFACTOR=factor1 4 Polynomial /MEASURE=activation /METHOD=SSTYPE(3) /EMMEANS=TABLES(factor1) COMPARE ADJ(BONFERRONI) /PRINT=DESCRIPTIVE ETASQ /CRITERIA=ALPHA(.05) /WSDESIGN=factor1.
Resources Processor Time 00:00:00.02
Elapsed Time 00:00:00.15
[DataSet0]
Within-Subjects Factors
Measure: activation
factor1 Dependent Variable

126
1 bar30
2 barandbands30
3 bandbellandweight30
4 bandbell30
Descriptive Statistics
Mean Std. Deviation N
bar30 19.6551 15.46612 11
barandbands30 15.9721 9.21753 11
bandbellandweight30 14.0338 10.45328 11
bandbell30 31.3235 19.10612 11
Multivariate Testsa
Effect Value F Hypothesis df Error df Sig. Partial Eta Squared
factor1 Pillai's Trace .624 4.419b 3.000 8.000 .041 .624
Wilks' Lambda .376 4.419b 3.000 8.000 .041 .624
Hotelling's Trace 1.657 4.419b 3.000 8.000 .041 .624
Roy's Largest Root 1.657 4.419b 3.000 8.000 .041 .624
a. Design: Intercept Within Subjects Design: factor1
b. Exact statistic
Mauchly's Test of Sphericitya
Measure: activation
Within Subjects Effect Mauchly's W Approx. Chi-Square df Sig. Epsilon
b

127
Greenhouse-Geisser Huynh-Feldt Lower-bound
factor1 .116 18.820 5 .002 .537 .625 .333
Tests the null hypothesis that the error covariance matrix of the orthonormalized transformed dependent variables is proportional to an identity matrix.
a. Design: Intercept Within Subjects Design: factor1
b. May be used to adjust the degrees of freedom for the averaged tests of significance. Corrected tests are displayed in the Tests of Within-Subjects Effects table.
Tests of Within-Subjects Effects
Measure: activation
Source Type III Sum of Squares df Mean Square F Sig. Partial Eta Squared
factor1 Sphericity Assumed 1979.110 3 659.703 5.164 .005 .341
Greenhouse-Geisser 1979.110 1.612 1227.607 5.164 .024 .341
Huynh-Feldt 1979.110 1.876 1055.077 5.164 .018 .341
Lower-bound 1979.110 1.000 1979.110 5.164 .046 .341
Error(factor1) Sphericity Assumed 3832.369 30 127.746
Greenhouse-Geisser 3832.369 16.122 237.715
Huynh-Feldt 3832.369 18.758 204.306
Lower-bound 3832.369 10.000 383.237
Tests of Within-Subjects Contrasts
Measure: activation
Source Type III Sum of Squares df Mean Square F Sig. Partial Eta Squared
factor1 Linear 601.388 1 601.388 2.681 .133 .211
Quadratic 1209.602 1 1209.602 10.534 .009 .513

128
Cubic 168.120 1 168.120 3.814 .079 .276
Error(factor1) Linear 2243.286 10 224.329
Quadratic 1148.239 10 114.824
Cubic 440.844 10 44.084
Tests of Between-Subjects Effects
Measure: activation Transformed Variable: Average
Source Type III Sum of Squares df Mean Square F Sig. Partial Eta Squared
Intercept 18035.841 1 18035.841 43.435 .000 .813
Error 4152.416 10 415.242
Estimated Marginal Means
factor1
Estimates
Measure: activation
factor1 Mean Std. Error
95% Confidence Interval
Lower Bound Upper Bound
1 19.655 4.663 9.265 30.045
2 15.972 2.779 9.780 22.165
3 14.034 3.152 7.011 21.056
4 31.324 5.761 18.488 44.159
Pairwise Comparisons

129
Measure: activation
(I) factor1 Mean Difference (I-J) Std. Error Sig.a
95% Confidence Interval for Difference
a
Lower Bound Upper Bound
1 2 3.683 3.890 1.000 -9.063 16.429
3 5.621 3.170 .640 -4.766 16.009
4 -11.668 6.808 .704 -33.978 10.641
2 1 -3.683 3.890 1.000 -16.429 9.063
3 1.938 1.566 1.000 -3.193 7.070
4 -15.351 5.768 .143 -34.253 3.550
3 1 -5.621 3.170 .640 -16.009 4.766
2 -1.938 1.566 1.000 -7.070 3.193
4 -17.290 5.666 .073 -35.856 1.277
4 1 11.668 6.808 .704 -10.641 33.978
2 15.351 5.768 .143 -3.550 34.253
3 17.290 5.666 .073 -1.277 35.856
Based on estimated marginal means
a. Adjustment for multiple comparisons: Bonferroni.
Multivariate Tests
Value F Hypothesis df Error df Sig. Partial Eta Squared
Pillai's trace .624 4.419a 3.000 8.000 .041 .624
Wilks' lambda .376 4.419a 3.000 8.000 .041 .624
Hotelling's trace 1.657 4.419a 3.000 8.000 .041 .624
Roy's largest root 1.657 4.419a 3.000 8.000 .041 .624
Each F tests the multivariate effect of factor1. These tests are based on the linearly independent pairwise comparisons among the estimated marginal means.
a. Exact statistic

130
T-TEST PAIRS=bar20 bar30 bar40 WITH band20 bandbell30 bandbell40 (PAIRED)
/CRITERIA=CI(.9500)
/MISSING=ANALYSIS.
Gastroc T-Test
Notes
Output Created 28-OCT-2013 19:29:35
Comments
Input Active Dataset DataSet0
Filter <none>
Weight <none>
Split File <none>
N of Rows in Working Data File
11
Missing Value Handling Definition of Missing User defined missing values are treated as missing.
Cases Used Statistics for each analysis are based on the cases with no missing or out-of-range data for any variable in the analysis.

131
Syntax T-TEST PAIRS=bar20 bar30 bar40 WITH band20 bandbell30 bandbell40 (PAIRED) /CRITERIA=CI(.9500) /MISSING=ANALYSIS.
Resources Processor Time 00:00:00.02
Elapsed Time 00:00:00.01
[DataSet0]
Paired Samples Statistics
Mean N Std. Deviation Std. Error
Mean
Pair 1 bar20 16.2096 11 12.86459 3.87882
band20 14.1969 11 9.85732 2.97209
Pair 2 bar30 16.6553 11 13.43046 4.04944
bandbell30 26.3681 11 24.37283 7.34868
Pair 3 bar40 14.4761 11 11.86615 3.57778
bandbell40 28.8540 11 15.20889 4.58565
Paired Samples Correlations
N Correlation Sig.
Pair 1 bar20 & band20 11 .651 .030
Pair 2 bar30 & bandbell30 11 -.062 .856
Pair 3 bar40 & bandbell40 11 -.371 .261
Paired Samples Test

132
Paired Differences
t df Sig. (2-tailed) Mean Std. Deviation Std. Error
Mean
95% Confidence Interval of the Difference
Lower Upper
Pair 1 bar20 - band20 2.01272 9.87196 2.97651 -4.61935 8.64479 .676 10 .514
Pair 2 bar30 - bandbell30 -9.71280 28.55199 8.60875 -28.89429 9.46869 -1.128 10 .286
Pair 3 bar40 - bandbell40 -14.37784 22.49575 6.78272 -29.49069 .73501 -2.120 10 .060
GLM bar30 barandbands30 bandbellandweight30 bandbell30
/WSFACTOR=factor1 4 Polynomial
/MEASURE=activation
/METHOD=SSTYPE(3)
/EMMEANS=TABLES(factor1) COMPARE ADJ(BONFERRONI)
/PRINT=DESCRIPTIVE ETASQ
/CRITERIA=ALPHA(.05)
/WSDESIGN=factor1.
General Linear Model
Notes
Output Created 28-OCT-2013 19:30:18
Comments
Input Active Dataset DataSet0
Filter <none>
Weight <none>
Split File <none>
N of Rows in Working Data File
11

133
Missing Value Handling Definition of Missing User-defined missing values are treated as missing.
Cases Used Statistics are based on all cases with valid data for all variables in the model.
Syntax GLM bar30 barandbands30 bandbellandweight30 bandbell30 /WSFACTOR=factor1 4 Polynomial /MEASURE=activation /METHOD=SSTYPE(3) /EMMEANS=TABLES(factor1) COMPARE ADJ(BONFERRONI) /PRINT=DESCRIPTIVE ETASQ /CRITERIA=ALPHA(.05) /WSDESIGN=factor1.
Resources Processor Time 00:00:00.03
Elapsed Time 00:00:00.05
[DataSet0]
Within-Subjects Factors
Measure: activation
factor1 Dependent Variable

134
1 bar30
2 barandbands30
3 bandbellandweight30
4 bandbell30
Descriptive Statistics
Mean Std. Deviation N
bar30 16.6553 13.43046 11
barandbands30 13.4745 10.85095 11
bandbellandweight30 9.2645 7.34890 11
bandbell30 26.3681 24.37283 11
Multivariate Testsa
Effect Value F Hypothesis df Error df Sig. Partial Eta Squared
factor1 Pillai's Trace .685 5.791b 3.000 8.000 .021 .685
Wilks' Lambda .315 5.791b 3.000 8.000 .021 .685
Hotelling's Trace 2.172 5.791b 3.000 8.000 .021 .685
Roy's Largest Root 2.172 5.791b 3.000 8.000 .021 .685
a. Design: Intercept Within Subjects Design: factor1
b. Exact statistic
Mauchly's Test of Sphericitya
Measure: activation
Within Subjects Effect Mauchly's W Approx. Chi-Square df Sig. Epsilon
b

135
Greenhouse-Geisser Huynh-Feldt Lower-bound
factor1 .109 19.364 5 .002 .526 .607 .333
Tests the null hypothesis that the error covariance matrix of the orthonormalized transformed dependent variables is proportional to an identity matrix.
a. Design: Intercept Within Subjects Design: factor1
b. May be used to adjust the degrees of freedom for the averaged tests of significance. Corrected tests are displayed in the Tests of Within-Subjects Effects table.
Tests of Within-Subjects Effects
Measure: activation
Source Type III Sum of Squares df Mean Square F Sig. Partial Eta Squared
factor1 Sphericity Assumed 1747.849 3 582.616 2.544 .075 .203
Greenhouse-Geisser 1747.849 1.577 1108.330 2.544 .119 .203
Huynh-Feldt 1747.849 1.822 959.275 2.544 .110 .203
Lower-bound 1747.849 1.000 1747.849 2.544 .142 .203
Error(factor1) Sphericity Assumed 6869.229 30 228.974
Greenhouse-Geisser 6869.229 15.770 435.585
Huynh-Feldt 6869.229 18.221 377.005
Lower-bound 6869.229 10.000 686.923
Tests of Within-Subjects Contrasts
Measure: activation
Source Type III Sum of Squares df Mean Square F Sig. Partial Eta Squared
factor1 Linear 341.783 1 341.783 .924 .359 .085
Quadratic 1131.504 1 1131.504 4.836 .053 .326

136
Cubic 274.562 1 274.562 3.302 .099 .248
Error(factor1) Linear 3697.764 10 369.776
Quadratic 2339.976 10 233.998
Cubic 831.489 10 83.149
Tests of Between-Subjects Effects
Measure: activation Transformed Variable: Average
Source Type III Sum of Squares df Mean Square F Sig. Partial Eta Squared
Intercept 11892.884 1 11892.884 45.876 .000 .821
Error 2592.386 10 259.239
Estimated Marginal Means
factor1
Estimates
Measure: activation
factor1 Mean Std. Error
95% Confidence Interval
Lower Bound Upper Bound
1 16.655 4.049 7.633 25.678
2 13.475 3.272 6.185 20.764
3 9.264 2.216 4.327 14.202
4 26.368 7.349 9.994 42.742
Pairwise Comparisons

137
Measure: activation
(I) factor1 Mean Difference (I-J) Std. Error Sig.a
95% Confidence Interval for Difference
a
Lower Bound Upper Bound
1 2 3.181 5.064 1.000 -13.412 19.773
3 7.391 3.188 .257 -3.057 17.838
4 -9.713 8.609 1.000 -37.922 18.497
2 1 -3.181 5.064 1.000 -19.773 13.412
3 4.210 2.870 1.000 -5.196 13.616
4 -12.894 8.548 .974 -40.904 15.117
3 1 -7.391 3.188 .257 -17.838 3.057
2 -4.210 2.870 1.000 -13.616 5.196
4 -17.104 7.653 .297 -42.181 7.973
4 1 9.713 8.609 1.000 -18.497 37.922
2 12.894 8.548 .974 -15.117 40.904
3 17.104 7.653 .297 -7.973 42.181
Based on estimated marginal means
a. Adjustment for multiple comparisons: Bonferroni.
Multivariate Tests
Value F Hypothesis df Error df Sig. Partial Eta Squared
Pillai's trace .685 5.791a 3.000 8.000 .021 .685
Wilks' lambda .315 5.791a 3.000 8.000 .021 .685
Hotelling's trace 2.172 5.791a 3.000 8.000 .021 .685
Roy's largest root 2.172 5.791a 3.000 8.000 .021 .685
Each F tests the multivariate effect of factor1. These tests are based on the linearly independent pairwise comparisons among the estimated marginal means.
a. Exact statistic

138