A comparison of soundscape evaluation methods in a … Psychoacoustics, and Urban Environment: Paper...
12
Buenos Aires – 5 to 9 September, 2016 Acoustics for the 21 st Century… PROCEEDINGS of the 22 nd International Congress on Acoustics Soundscape, Psychoacoustics, and Urban Environment: Paper ICA2015-856 A comparison of soundscape evaluation methods in a large urban park in Montreal Daniel Steele (a) , Edda Bild (b) , Cynthia Tarlao (c) , Irene Luque Martín (d) , Jorge Izquierdo Cubero (e) , Catherine Guastavino (f) (a) CIRMMT and SIS, McGill University, Canada, [email protected] (b) INCAS 3 & GPIO, University of Amsterdam, the Netherlands, [email protected] (c) CIRMMT and SIS, McGill University, Canada, [email protected] (d) University of Amsterdam, the Netherlands & University of Sevilla, Spain, [email protected] (e) InfusionesUrbanas, Spain, [email protected] (f) CIRMMT and SIS, McGill University, Canada, [email protected] Abstract Combining surveys with other methods like observations can offer a more holistic understanding of participants’ experience, with respect to activity and the evaluation of acoustic environments. Reconciling data from multiple methods remains a challenge for soundscape research, even in well-studied park settings. We compare 3 methods (behavioral mapping (n=84), questionnaires (n=41), sound recordings) to research the interaction between park users and their soundscapes over 4 sessions in the summertime. We collected soundscape ratings (SSQP, restorativeness, appropriateness) and free-format verbal descriptions, together with demographics, activity data, and personality measures. Annotated sound recordings for each observation session were compared against source and activity descriptions and free format verbal descriptors were classified into emerging themes. Within categories of sound sources, we observed different valences (e.g. within bird sounds, ducks were positive, seagulls negative.) Soundscape chaoticness was observed to vary over a small location. Wide variations in sound source identification across activity zones and across participants and researchers reveal an influence of the data collection method. Importantly, this project serves as a baseline against which we can compare soundscape studies taking place in other contexts and will inform future methodological efforts. Keywords: soundscape, urban parks, mixed methods, observations, verbal descriptors
-
Upload
truongkhanh -
Category
Documents
-
view
215 -
download
1
Transcript of A comparison of soundscape evaluation methods in a … Psychoacoustics, and Urban Environment: Paper...
Buenos Aires – 5 to 9 September, 2016 Acoustics for the 21st Century…
PROCEEDINGS of the 22nd International Congress on Acoustics
Soundscape, Psychoacoustics, and Urban Environment: Paper ICA2015-856
A comparison of soundscape evaluation methods in a large urban park in Montreal
Daniel Steele(a), Edda Bild(b), Cynthia Tarlao(c), Irene Luque Martín(d), Jorge Izquierdo Cubero(e), Catherine Guastavino(f)
(a) CIRMMT and SIS, McGill University, Canada, [email protected] (b) INCAS3 & GPIO, University of Amsterdam, the Netherlands, [email protected]
(c) CIRMMT and SIS, McGill University, Canada, [email protected] (d) University of Amsterdam, the Netherlands & University of Sevilla, Spain, [email protected]
(e) InfusionesUrbanas, Spain, [email protected] (f) CIRMMT and SIS, McGill University, Canada, [email protected]
Abstract
Combining surveys with other methods like observations can offer a more holistic understanding of participants’ experience, with respect to activity and the evaluation of acoustic environments. Reconciling data from multiple methods remains a challenge for soundscape research, even in well-studied park settings. We compare 3 methods (behavioral mapping (n=84), questionnaires (n=41), sound recordings) to research the interaction between park users and their soundscapes over 4 sessions in the summertime. We collected soundscape ratings (SSQP, restorativeness, appropriateness) and free-format verbal descriptions, together with demographics, activity data, and personality measures. Annotated sound recordings for each observation session were compared against source and activity descriptions and free format verbal descriptors were classified into emerging themes. Within categories of sound sources, we observed different valences (e.g. within bird sounds, ducks were positive, seagulls negative.) Soundscape chaoticness was observed to vary over a small location. Wide variations in sound source identification across activity zones and across participants and researchers reveal an influence of the data collection method. Importantly, this project serves as a baseline against which we can compare soundscape studies taking place in other contexts and will inform future methodological efforts. Keywords: soundscape, urban parks, mixed methods, observations, verbal descriptors

22nd International Congress on Acoustics, ICA 2016 Buenos Aires – 5 to 9 September, 2016
Acoustics for the 21st Century…
2
A comparison of soundscape evaluation methods in a large urban park in Montreal
1 Introduction Extensive research on urban quiet areas has shown the benefits of combining qualitative and quantitative methods for a holistic understanding of users’ experience, with respect to activity and the evaluation of auditory environments ([1, 2], among others). Reconciling data from multiple methods remains a challenge in consideration of the fact that soundscape varies by person, culture, the context of the evaluation (see definition below), and other factors. Based on its planned function, we selected a large urban park in downtown Montreal and we tested the feasibility of combining various research methodologies to characterize such a park in terms of soundscape appropriateness for various activities. We combined the methodology proposed as part of the QUADMAP (QUiet Areas Definition and Management in Action Plans) project [2], that proposes mixing data collection methods to triangulate understanding of urban areas selected by function, with the Swedish-Soundscape Quality Protocol (SSQP) [3], and an app-based approach to behavioral mapping (viz. [4] for behavioral mapping) to offer a multi-layered characterization on an urban green space. Other previous approaches such as restorativeness [5], appropriateness [6] and psychological measurements are also considered. Lastly, some new scales were generated for the purposes of this and related studies, to augment a questionnaire in an (a priori) pleasant park, as determined by previous work by the authors.
This paper presents a comparative analysis of soundscape evaluation methods including a questionnaire survey and sound recordings, and reconciles that information with participant observations in a pleasant urban park. While many of the presented findings are analytic in nature, some descriptive findings are also presented in relation to their future potential for research directions.
2 Literature review Soundscape is defined as the acoustic environment as perceived or experienced and/or understood by a person or people, in context (ISO 12913-1:2014).
2.1 Soundscape evaluations Soundscape evaluations can be taken in a number of formats including free-response and scale ratings. An increasingly common set of scales called the Swedish Soundscape-Quality Protocol (SSQP) [3] has been developed as a practical tool for assessing soundscape quality in terms of a holistic scale (Good–Bad), and along a set of eight scales related to pleasant, unpleasant, eventful, uneventful, vibrant, monotonous, calm, chaotic [7]. Originally the SSQP was developed in Swedish, but it has been translated. The French translation, which was used for this study, has been elaborated and validated in as part of another project in Tarlao et al. [8].

22nd International Congress on Acoustics, ICA 2016 Buenos Aires – 5 to 9 September, 2016
Acoustics for the 21st Century…
3
Recent soundscape studies, both in laboratory settings [6] and everyday situations [9, 10] converge to show the need to additionally measure how appropriate the soundscape is to a location, particularly considering the activities envisaged [11]. Based on these findings, SSQP scales should be combined with appropriateness judgments. Alletta et al [12], in an extensive review of soundscape evaluations, confirm this need for appropriateness, but warn that it would not be sufficient on its own. These same authors also identify a need for cross-sectional soundscape studies that hone our understanding of which factors are the most relevant to a complete evaluation of a soundscape.
2.2 Restorativeness and social parks There is growing evidence that parks of different types serve different functions in terms of the qualities that they offer users [13]. In this study, participants were asked about their “level of stress”, “mental health” and “well-being” in the last 4 weeks, and restorativeness. The results indicate that for parks with a perceived social dimension (PSD) described by “social” and “culture” various aspects of restorativeness interact surprisingly positively with other collected evaluations; namely, compatibility (of the park to fulfill user expectations), being away, fascination, and preference. Social parks are described as having several seats and benches, plenty of people, feels safe, paths with hard surfaces, while parks have fountains, statues, ponds, and flowers. Additionally, culture and social often contained the descriptor “serene” supplied by participants, suggesting that strict quietness is not a requirement for these types of spaces.
A previous study by the authors [14] demonstrated that in the context of a busy social park with traffic noise, a soundscape installation was responsible for an increase in soundscape pleasantness without an associated impact on calmness, appropriateness or restorative properties. Meaning attributed to individual sound sources appears to play an important role in soundscape evaluation; in a study on auditory comfort in public spaces, Yang and Kang [15] showed that sound source type played a role in evaluations of comfort; introducing sounds to spaces that were considered pleasant (such as music and water), even rather loud ones, produced a considerable improvement in acoustic comfort.
2.3 Comparative soundscape studies Raimbault [16] compared open-ended questions with soundscape scale ratings. In an analysis of the open-ended question on soundscape (“What do you think about the surrounding soundscape?”), she identified five types of judgments (positive, negative, acceptable, usual, and resigned) that varied by location. Interestingly, judgments of the overall location were more positive than those of soundscape, which were acceptable, usual, or resigned. Locations at main thoroughfares (with traffic noise) were rated as negative. Raimbault further showed the benefit of collecting free responses alongside scale ratings as it served to clarify discrepancies in ratings between locations and people.
Brambilla et al. [17] compared physical parameters from field recordings with responses from human participants. As part of a laboratory study, participants were asked to name up to six sound sources in the recording and whether the sources 1) attracted attention, 2) were annoying, 3) pleasant – if so, they were asked to name the sound source that most represented that

22nd International Congress on Acoustics, ICA 2016 Buenos Aires – 5 to 9 September, 2016
Acoustics for the 21st Century…
4
description; these were reconciled with “ground truth” annotations presumably done by the researchers about the existing sound sources according to their type. Sound sources listed varied with location. Sounds were classified as road traffic, “anthropic” (produced by humans), water, animal, and other, and all but one location had a large number of respondents indicating that there was road traffic sound. Among the sounds considered pleasant, music and water were the most frequently mentioned. Annoying sounds always included road traffic. While this study was conducted in 6 urban squares with a typical Italian morphology, it remains to be seen if reponses would vary as a function of activities and park usage.
Besides the previously described study, there is no known work comparing and merging more than two types of soundscape evaluation at the same time in the same environment with the intent of examining the information available from each measure. This paper presents a mixed methods study of a pleasant, social urban park where multiple types of soundscape judgments are compared (SSQP, restorative aspects, sound sources, free description, annotated recordings).
3 Methods A small (6450m2), active, and central section of the popular Parc (park) La Fontaine of Montreal was chosen to be away from roads and consistently occupied on a typical summer day. Each user who filled out an anonymous questionnaire also had an (anonymous) participant observation code, excluding one data collection period with corrupted files. Data collection periods were preceded and proceeded by 30-60 second audio recordings. The observation area and the spatial distribution of observations and questionnaires are represented in Figures 1a and b.
3.1 Location The Parc La Fontaine is a large park with many distinct sections for activities like picnicking, promenading, and doing sports. In the hundred years that followed its creation, a dense, fashionable, and thriving neighborhood arose on all of its sides, making it an important resource in the urban fabric. One of its core features is a two-level pond with a fountain popular in the summer for relaxation on its banks and in the winter for ice skating. A small section on the bank of the upper pond and near to the fountain was selected for this study (see Figure 1a).
3.2 Questionnaires 41 questionnaires were collected over four sessions ranging from late August to early September, 2015 (N = 14 + 10 + 8 + 9). Each session lasted roughly one hour; two sessions were in the afternoon and two were in the evening. Data from three of four sessions is visualized in Figure 1. Participants were invited to participate entirely in French (N = 30) or entirely in English (N = 11). The questionnaire gathered responses four general areas of interest elaborated in the following sections: situational factors (including activity), soundscape evaluation, psychological factors, and demographics. All scales are 7-points (Likert) unless otherwise indicated.
Situational factors: Four questions were used to put the particular user’s park visit into context: activity (free response), reason for choosing this park (free response), main activities of this park (free response), and the frequency of visits (4 options).
22nd International Congress on Acoustics, ICA 2016 Buenos Aires – 5 to 9 September, 2016
Acoustics for the 21st Century…
5
Soundscape evaluation: The questionnaire included multiple types of soundscape evaluation: a free-response description of the soundscape; 7 of the 8 Swedish Soundscape Quality Protocol (SSQP) [3] scales (Pleasant, unpleasant, eventful, vibrant, monotonous, calm, chaotic). Uneventful was not included as there was no appropriate translation (see [8]); Appropriateness of the soundscape for the activity-at-hand; 3 of 5 soundscape restorativeness measures [5], selected for pertinence to urban parks (“I find these sounds fascinating”, “Spending time in this soundscape gives me a break from my day-to-day routine”, “It’s easy to do what I want while I’m in this soundscape”); perceived sound level (“the sound level of the park is: 1) Very Quiet; 2) Quiet; 3) Moderate 4) Loud; 5) Very loud”) and perceived sound level appropriateness (“I find that level to be: 1) Much too quiet; 2) Too quiet; 3) Appropriate; 4) Too loud; 5) Much too loud”); and a free response listing of soundscape sources that the participant identified given four categories (pleasant, unpleasant, neutral, and other). In these lists, participants were asked to circle what they considered to be the most predominant sources. Soundscape was described as “the word we are using to describe your sound/sonic environment as you perceive it. The soundscape includes all of the sounds around you”.
Psychological and demographic factors: Collected psychological factors were: mood (before and after), self-reported extraversion, and the 5-item Noise Sensitivity Scale (NSS) on a 6-point Likert scale – “I am sensitive to noise”, “I find it hard to relax in a place that’s noisy”, “I get mad at people who make noise that keeps me from falling asleep or getting work done”, “I get annoyed when my neighbours are noisy”, “I get used to most noises without much difficulty”. A number of demographic factors were taken: age, gender, companions, locale of residence (in the neighborhood, Montreal urban area, outside), years of residence in current location, and time of questionnaire completion.
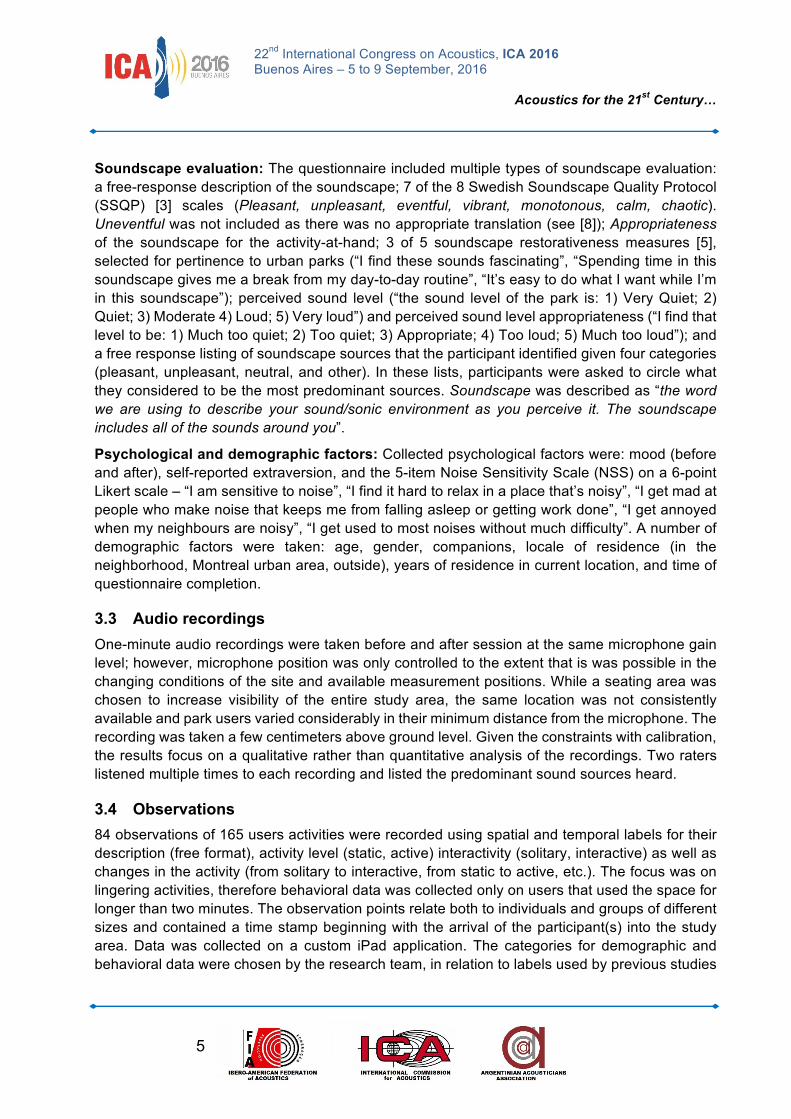
3.3 Audio recordings One-minute audio recordings were taken before and after session at the same microphone gain level; however, microphone position was only controlled to the extent that is was possible in the changing conditions of the site and available measurement positions. While a seating area was chosen to increase visibility of the entire study area, the same location was not consistently available and park users varied considerably in their minimum distance from the microphone. The recording was taken a few centimeters above ground level. Given the constraints with calibration, the results focus on a qualitative rather than quantitative analysis of the recordings. Two raters listened multiple times to each recording and listed the predominant sound sources heard.
3.4 Observations 84 observations of 165 users activities were recorded using spatial and temporal labels for their description (free format), activity level (static, active) interactivity (solitary, interactive) as well as changes in the activity (from solitary to interactive, from static to active, etc.). The focus was on lingering activities, therefore behavioral data was collected only on users that used the space for longer than two minutes. The observation points relate both to individuals and groups of different sizes and contained a time stamp beginning with the arrival of the participant(s) into the study area. Data was collected on a custom iPad application. The categories for demographic and behavioral data were chosen by the research team, in relation to labels used by previous studies

22nd International Congress on Acoustics, ICA 2016 Buenos Aires – 5 to 9 September, 2016
Acoustics for the 21st Century…
6
using a similar research method (e.g. [4]). 33 of these observations were linked by an anonymous participant code to questionnaires (Figure 1b). Two researchers were always present to simultaneously record observations, make recordings, and gather questionnaires.
Figure 1: a) Observation area in Parc la Fontaine (left) and b) the spatial distribution of observations (black) and questionnaires (red) (right).
4 Results 4.1 Soundscape evaluations from questionnaires As described in the Methods, a diversity of soundscape evaluations was collected, including ratings of the Swedish Soundscape Quality Protocol (SSQP), appropriateness, and three of five dimensions of restorativeness. Means are reported in Figure 2.
Figure 2: Left: Means of soundscape evaluation ratings with standard error (N = 41). Right: Table
of self-reported activities, categorized by the researchers
Sound level appropriateness: The participants rated the sound levels as: Very Quiet (0), Quiet (14), Moderate (26), and Loud (1), and Very Loud (0) for a mean of 2.68 of 5 (error: .08). For sound level appropriateness, they reported Much Too Quiet (0), Too Quiet (1), Appropriate (40), Too Loud (0), Much Too Loud (0), for a mean of 2.98 (error: .02). The one participant who rated
n Activity
28 Relaxing 19 Eating/
drinking 17 Time with
friends/family 5 Reading/writing 4 Observing 3 Passing by 1 Thinking 1 Work meeting
!
!
!
! !
!
!!!
!
!
!
!!
!!
!!
!
! !
!
!
!
!
!
!!
!
!
!
!
!
!
!!
!
!!!
!!!
!
!!
!
!
!
!
!
!!!
!!
!
!
!
!
!!! !
!
!
!!
!!
!!
!
!!
! ! !
!
! !!
!
!
!!! !
!
!
!
!!
!
!
!
!!
!
!!
!
!!2.6
2.3
2.4
2.22.5
2.1
24.724.6
24.4
24.2
24.124.3 24.5
23.9
23.8
23.1
23.623.423.5 23.2
23.3
ID9 ID8 ID7
ID6
ID5ID4
ID2
ID1
ID87 ID86
ID84
ID83
ID82ID81ID79
ID77
ID76ID75
ID74ID73
ID72
ID70
ID67
ID66ID65 ID64ID63
ID62
ID61
ID60
ID59
ID57ID55 ID54
ID53
ID52
ID51
ID50
ID49
ID48ID47
ID45ID44
ID43
ID42ID41
ID40
ID39ID38
ID37
ID36
ID32
ID31
ID30
ID29
ID28ID27
ID26
ID25
ID24
ID23
ID22
ID21
ID20ID18 ID17
ID15
ID14 ID13
ID12
ID11
ID10
Distribution of points and Interviews
! Interview
! Point

22nd International Congress on Acoustics, ICA 2016 Buenos Aires – 5 to 9 September, 2016
Acoustics for the 21st Century…
7
the park as being “Loud” also reported that they found that level to be “appropriate” for the space. In fact, all but one participant rated the park’s sound level as “appropriate”; this one participant had rated the park level as “quiet” and found that level to be “too quiet”.
4.1.1 Linear regressions within questionnaire scales A linear regression on pleasantness describing a significant portion of the data (R2 = .617, F(1, 26) = 2.26, p<.05) reveals itself to be predicted by unpleasant (b = -.392,t(26) = -2.42, p<.05) and chaotic (b = .360, t(26) = 2.13, p<.05). Interestingly, the beta for chaotic is positive, meaning it positively co-varies with pleasantness in the context of this space. A linear regression on appropriateness describing a significant portion of the data (R2 = .534, F(1, 34) = 5.40, p<.001) reveals itself to be predicted by unpleasant (b = -.159, t(34) = -2.35, p<.05), chaotic (b = -.175, t(34) = -3.21, p<.01), and “I find it hard to relax in noisy environments” (b = .156, t(34) = 2.88, p<.01). However, as the appropriateness data was entirely skewed toward 6s and 7s, the regression model is not very extensive. In the discussion, we will mix this data with data from other parks and environments to reveal stronger findings.
4.2 Soundscape analysis from free response questions 41 free-format soundscape descriptions were collected and categorized. Some responses contained multiple types of evaluation, but all were classified into 3 main types: 1) holistic descriptions of the soundscape itself. Holistic refers to a description of the soundscape independent of the observer (i.e. “the soundscape is…”). 26 total descriptions of this type included: relaxed/peaceful (16) and pleasant (9)). 6 said simply, “good”; 2) affective descriptions. Affective refers descriptions based on verbs or deverbal adjectives describing the effect of the soundscape on the observer. 23 total responses included: calming (10), pleasing (9), and others (4) and 3) descriptions of sources, where participants simply listed sources that were somehow significant, e.g. “birds”, “children”, “eau qui coule” (water that flows), using nominal groups. The most common source descriptions were natural/environmental, including birds and the fountain (9), and, interestingly, music (7).
4.2.1 Sources analysis 39 of 41 participants filled in at least one source in this section. Results are presented first by valence (positive, negative, neutral, other), then by source type. In total, 86 positive sound sources were listed and amounted to 28 unique sources (e.g. “children” and “laughs of children” were considered unique) that were further re-classified in a later step. By far, the most frequently listed source was “fountain” (19). Every participant who completed this section listed at least one positive source. 29 total negative sound sources were listed and amounted to 17 unique sources. 17 of 39 participants listed no negative sounds at all and 3 explicitly noted that they identified no negative sources. 42 total neutral sources were listed and amounted to 23 unique sources. 8 sources were listed as “other” (i.e. not positive, negative, or neutral), but none of the participants specified this valence. These sources were: water, waterfall, conversations, ducks, dogs barking, bicycles, strollers, and rustling of leaves. The unique sources gathered above were further classified into source type areas, namely: water, animal, human, music, mechanical, and natural.

22nd International Congress on Acoustics, ICA 2016 Buenos Aires – 5 to 9 September, 2016
Acoustics for the 21st Century…
8
Water: The two primary ways to refer to the sources were simply with the nouns water (N=7) and fountain (n=19), though some mentioned the flow of the water as the source (N=2). 29 mentions of water were positive and 3 were neutral; none were negative. Animal: When the bird species was specified, it was more likely to be given valence – ducks were almost uniformly positive (12 of 13), seagulls were more neutral (3 of 5). Crickets were identified as positive (1) and dogs were only either negative (3) or neutral (1). Human: Young children as sources appeared variously as positive (5), negative (2), and neutral (3), and for each valence, there were examples of just “children” as sources, as well as “cries of children”. Human sound sources listed as negative were always accompanied by extra or more specific words to clarify the evaluation (e.g. “teenagers being noisy”). Music: Musical sounds (17) were uniformly rated as positive. Mechanical sounds: were never rated as positive, however, they were sometimes rated as neutral. Negative sources (9) were car/cars (5), circulation noise (2), sirens (1), and a bicycle (1). Neutral mechanical sources (5) were bikes (3), distant cars (1) and airplane (1). Natural: Interestingly, tree sounds were more neutral (2) than positive (1), though they were not frequently listed. Wind noise was only mentioned twice, both times as neutral. One participant listed simply “nature” as a positive sound source.
Part of the sound source listing activity asked participants to identify (via circling) which sources they considered to be predominant. 11 participants completed this portion and the vast majority of sources identified as prominent were considered pleasant (14). The others where unpleasant (2, “seagull”, “car”), neutral (2, “(sound of) conversation”) and one “other” (“ducks” with unspecified valence). For the 14 positive sounds, the categories were fountain (4), nature/water/trees* (4), birds (2), music (2), and children (1).
4.3 Within-questionnaire findings For those who rated “I find these sounds fascinating” between 5 and 7 (N = 29), they reported on average, 4.53 sources, while those who rated fascinating between 1 and 3 (N = 8), they reported, on average 3 sources. Interestingly, they were also less likely to rate the sound sources as fascinating the longer they had lived in their city (which was Montreal for all but 8 participants) and if they considered themselves extraverted (r(41)=.38, p<.01). There was no relationship between eventful and the number of sources mentioned. However, for those who reported low eventfulness (3 and below), the only source mentioned with a negative character is traffic.
4.4 Observations and mapping 84 unique identifiers, referring to individuals and groups observed in the space total to 163 users of the park. Of the 84 observations, over half had users engaging in static, socially interactive activities, the rest mostly in static, solitary activities (including reading, looking around or lying on the grass / potentially sleeping or resting). A small number of users were themselves a prominent source of sound, irrespective of the level of social interaction of their activities, via the music they were either playing through their portable devices (speakers) or with a guitar. Figure 3 shows the distribution of space of users performing the three dominant (static) activities for solitary users (“looking around”, “reading”, “focused on the phone”) and for groups (including users in pairs: “talking”, “drinking” and “eating”).

22nd International Congress on Acoustics, ICA 2016 Buenos Aires – 5 to 9 September, 2016
Acoustics for the 21st Century…
9
Figure 3: left, Activity zones as observed. Blue: “looking around” activity zone; Yellow / Orange: “eating” activity zone; Pink: “reading” area. Right, soundscape chaoticness (rating) by location.
The design of the park clearly distinguishes between two homogenous use areas (HUA) [2]: (1) the waterfront area, including the concrete path and the benches installed along the waterfront (under the shade of trees), where users could stand or sit on benches, and (2) the grass area bordered by the aforementioned concrete path along the water and three other paths that cut through the park, with no benches, where users could only stand or sit/lay on the grass. Activity zones clearly coincide with the HUAs: first, the waterfront area, where there was a clear preference for users “looking around”, second, the left side of the grass area, where a high number of users were interactive users, and, third, the right side of the grass area, where a small number of solitary users were observed reading. An analysis of the level of social interaction indicates that, while there is a fairly balanced distribution between activities performed alone or accompanied by others, we can observe a clear preference of solitary users to use the “looking around” activity zone while users in pairs are distributed all throughout the space, particularly along the grass area, under the shade of trees.
The benches and trees seem to act as a barrier or buffer between the two HUAs, aiding users in their selection of on-site area of activity. Activities in the waterfront area are of a more contemplative nature (marked in Figure 3 as “looking around”), as also intended by the design of the space, which has a more “open” format i.e. benches oriented towards the lake and the passers-by, benches under the shade of trees. The grass area, where a relatively large number of trees offer shade or support, is dominated by other activity patterns (including eating, reading, but also talking), which, while not excluding a contemplative dimension, seems to allow users to focus on each other, their lunch or their reading, thus giving it a more “intimate” feeling.
4.5 Across methods The researchers also collected demographic information during the observation. For 33 participants with shared data between questionnaires and observations, the observed gender matched the reported gender in 31 cases (93%), observed age (binned by decade) matched reported age in 21 of 32 cases (65%) (1 participant did not report age). The average error for the 11 incorrect age bins was 7.3 years. All participants observed to be alone reported that they were alone in their questionnaires, suggesting that this variable is robust to self-report or observation. Furthermore, one side of the park (Figure 3, right) has only very low scores for chaos. Interestingly, at the same time, the activity type relaxing does not appear in the “low chaos” area.

22nd International Congress on Acoustics, ICA 2016 Buenos Aires – 5 to 9 September, 2016
Acoustics for the 21st Century…
10
Linking back to the reported scales and the relationship to activity, a Mann-Whitney test revealed significant differences (p<.05) for unpleasantness ratings based on the Solitary-Interactive distinction (Solitary (N = 7), Mean(unpleasant) = 1.14, Error = .14; Interactive (N = 31), Mean(unpleasant) = 1.77, Error = .23). No significant differences were observed on the other scales. We performed a chi-squared test to compare the distribution of free-format sound descriptor types (holistic, affective, and source descriptions) and found no effect: X2(2) = 2.0149, p > .05 of solitary versus interactive or static versus dynamic.
From the sound recordings, based on an interrater analysis from two of the authors, it was determined that there was some overlap between the sound sources audible in the recordings compared to what was also identified by participants in some capacity. Frequently identified sound sources through both methods were: fountain, birds, people in conversations, music, and, in one case, sirens. However, in multiple instances, distant traffic noise was audible in the recordings, but was not necessarily listed by participants who were completing their questionnaires at around the same time. Insects were also more commonly identified by the researchers than participants. Using the time stamps, it appears that traffic noise was identified by participants in the afternoon sessions but not in the evening sessions, while it was identified in all sessions (however, not very predominantly) by the researchers using the recordings.
5 Discussion and conclusion The soundscape of this section of La Fontaine park was indeed perceived as a very pleasant and appropriate for its activities. In addition, the particular section of the park is a place to see and be seen relaxing, so a limited set of activities dominates both observations and self reports. The results will serve as a point of comparison for future studies.
Regarding sound levels, a comparison of perceived sound level and sound level appropriateness results indicate, interestingly, that people do not come to this particular section of park expecting a quiet experience. Despite its social character, the sound level was unanimously rated as appropriate. Neither perceived sound level nor sound level appropriateness were related to soundscape appropriateness.
Our study deploys a mixed-methods approach in line with other literature (e.g. QUADMAP, [12]) and shows its ability to characterize a green public spaces that users consider appropriate for their overall relaxation or their socially interactive or individual activities. From this perspective, we also identified two homogenous urban areas (HUA) in our selected part of the park, which coincided with one or more activity zones and some significantly different evaluations, showing the added value of a mixed methods approach to characterizing a green public space.
The mixed approach also provided more clarity on the data collected and how it was used. While observed and reported interactivity were highly related, observed and reported activity differed more profoundly: participants reported more about their goals for the space rather than directly stating their activity. The area of the study section where people were relaxing had higher scores for chaos. Two possible explanations are that people were either not paying attention to the soundscape when they chose their seating or, more likely, that people who were relaxing were

22nd International Congress on Acoustics, ICA 2016 Buenos Aires – 5 to 9 September, 2016
Acoustics for the 21st Century…
11
more likely to find chaotic things to report as chaotic sounds were more likely to disrupt relaxing activities.
A comparison of the sound sources between methods, namely questionnaire and recording, allows us to pursue the question: must we ask participants about sound sources or can we rely on annotations done by researchers or computers? Using timestamps to confirm the same source, while the researchers both found an overhead airplane salient enough to warrant a mention and presumed perhaps that it would be a negative source, a participant listed “airplane” as a neutral source alongside “people chatter”, and specifically said there were no negative sources. Conversely, what the researchers had identified neutrally as “chatter” was perceived as negative by two different participants: “les gens qui crient” (people who are screaming) and “gens qui parlent trop fort” (people who are talking too loud). Tree sounds were generally not noted as sources by participants, despite being audible in the recordings. Potentially, while the researchers identified more tree and insect sounds than the participants, this result could be explained by the listening states of the researchers versus the participants. In the park, tree and insect sounds are so expected that they do not warrant attention, whereas in the offices of the researchers using headphones, they are more salient. Time of day also appeared to influence whether participants listed certain sound sources. In general, it is also interesting that there were more neutral sound sources than negative sources.
The approach described in this paper can be easily replicated in other urban contexts, be they “quiet”, “green”, “restorative” or not, as it attempts to show and visualize relationships between use and design of space and the evaluation and description of soundscapes in ways that could be meaningful both to researchers and practitioners aiming to characterize existing urban public spaces. By combining qualitative and quantitative data and relying on more (questionnaires) or less (observations, recordings) intrusive methods for data collection, we show the potential for describing different aspects of public spaces behaviorally, acoustically and perceptually. The interaction between sound recordings and observations remains to be explored.
Lastly, data indicate that live park music is well liked. This is consistent with Guastavino [18], who in a questionnaire study on memory representations for urban soundscapes showed that live music was generally positive while prerecorded music gave rise to negative judgment. These findings on music, first of all, require further study, but also have implications for urban planning in Montreal (and beyond), where public music is mostly illegal, whether or not authorities regularly intervene. Other implications for urban planning and design relate to our growing understanding of the relationships between geographical distribution of amenities (grass, benches, etc.), the way they are used, and how they play a role in soundscape evaluation
Acknowledgments The authors would like to thank Dr. Ate Poorthuis who developed the observation app for his thesis work and kindly offered it to use for the study.
References [1] European Environment Agency. Good practice guide on quiet areas, Technical report No 4/2014, 2014.

22nd International Congress on Acoustics, ICA 2016 Buenos Aires – 5 to 9 September, 2016
Acoustics for the 21st Century…
12
[2] Aspuru, I.; Garcia, I.; Bartalucci, C.; Borchi, F.; Carfagni, M.; Governi, L.; Bellomini, R.; Luzzi, S.; Wolfert, H.; Gaudibert, P. LIFE+ 2010 QUADMAP Project: a new methodology to select, analyze and manage Quiet Urban Areas defined by the European Directive 2002/49/EC. Noise Mapping. 3(1), 2016, 120-129.
[3] Axelsson, Ö.; Nilsson, ME,; Berglund, B. The Swedish soundscape-quality protocol. The Journal of the Acoustical Society of America, 131(4), 2012, 3476.
[4] Goličnik, B.; Thompson, C.W. Emerging relationships between design and use of urban park spaces. Landscape and Urban Planning. Vol. 94(1), 2010, pp 38-53.
[5] Payne, S. R. The production of a perceived restorativeness soundscape scale. Applied Acoustics, Vol. 74(2), 2013, pp 255-263.
[6] Nielbo, F. L.; Steele, D.; Guastavino, C. Investigating soundscape affordances through activity appropriateness. Proc. Meetings on Acoustics, ICA 2013, Montreal, Canada, June 2-7, 2013, vol. 19(1), p. 040059.
[7] Axelsson, Ö.; Nilsson, M. E.; Berglund, B. A principal components model of soundscape perception. J. Acoust. Soc. Am., Vol 128(5), 2010, pp 2836–2846.
[8] Tarlao, C.; Steele, D.; Fernandez, P.; Guastavino, C. Comparing soundscape evaluations in French and English across three studies in Montreal. Proc INTER-NOISE 16, Hamburg, Germany, August 21-24, 2016.
[9] Steffens, J.; Steele, D.; Guastavino, C. New insights into soundscape evaluations using the experience sampling method. Proceedings of Euronoise, Maastricht, Netherlands, May 31-June 3, 2015, pp 1496-1500.
[10] Brown, A.L.; Kang, J.; Gjestland, T. Towards standardization in soundscape preference assessment. Applied Acoustics, Vol. 72(6), 2011, pp 387–392.
[11] Hong, J.Y.; Jeon, J.Y. Influence of urban contexts on soundscape perceptions: A structural equation modeling approach. Landscape and Urban Planning, 9 (141), 2015, 78-87.
[12] Aletta, F.; Kang. J.; Astolfi, A.; Fuda, S. Differences in soundscape appreciation of walking sounds from different footpath materials in urban parks. Sustainable Cities and Society. 2016.
[13] Peschardt, K.; Stigsdotter, U.; Schipperrijn, J. Identifying features of pocket parks that may be related to health promoting use. Landscape Research 41 (1), 2016, 79-94.
[14] Steele, D.; Bild, E.; Tarlao, C.; Guastavino, C. Evaluation of an urban soundscape intervention with music: quantitative results from questionnaires. Proc INTER-NOISE 16, Hamburg, Germany, August 21-24, 2016.
[15] Yang, W.; Kang, J. Soundscape and sound preferences in urban squares: a case study in Sheffield. Journal of Urban Design. Vol 10(1), 2005, pp 61-80.
[16] Raimbault, M. Qualitative judgements of urban soundscapes: Questionning questionnaires and semantic scales. Acta acustica united with acustica. Vol. 92(6), 2006, pp. 929-37
[17] Brambilla, G.; Gallo, V.; Maffei, L.; Di Gabriele, M.; Kang, J. A further study on modeling some perceptual attributes of soundscape in urban squares. INTER-NOISE and NOISE-CON Congress and Conference Proceedings, 2012 (9), 2012, 2116-2137.
[18] Guastavino, C. The Ideal Urban Soundscape: Investigating the Sound Quality of French Cities. Acta Acustica united with Acustica, Vol. 92(6), 2006, pp 945–951.