A Comparison of some methods for analysing changes in...
20
/. mar. biol. Ass. U.K. (1991), 71, 225-244 225 Printed in Great Britain A COMPARISON OF SOME METHODS FOR ANALYSING CHANGES IN BENTHIC COMMUNITY STRUCTURE R.M. WARWICK AND K.R. CLARKE Plymouth Marine Laboratory, Prospect Place, The Hoe, Plymouth PL1 3DH Statistical methods for analysing changes in community structure fall under the three general headings of univariate, graphical/distributional and multivariate. These methods are applied to a variety of benthic community data (macrobenthos, meiobenthos, corals, demersal fish), from a variety of localities (intertidal/subtidal, temperate/tropical) and over both spatial and temporal scales. Four general conclusions emerge from this comparative study: (1) The similarity between sites or times based on their univariate or graphical/ distributional properties is usually different from their clustering in multivariate analyses. (2) Species dependent (multivariate) methods are much more sensitive than species independent (univariate and graphical/distributional) methods in discriminating between sites or times. (3) In examples where more than one component of the fauna has been studied, univariate and graphical/distributional methods may give different results for different components, whereas multivariate methods tend to give the same results. (4) By matching multivariate ordinations from subsets of environmental data to an ordination of faunistic data, the key environmental variables responsible for community change may be identified. INTRODUCTION Natural communities of animals and plants generally comprise a large number of species, and changes in community structure are determined by a suite of different environmental variables to which each of the species in the community may respond differently. The community ecologist is thus faced with a rather complex problem of characterising community attributes, analysing changes in them over spatial or temporal scales, and relating these changes to potentially causal environmental variables. A wide variety of different solutions to these problems has been developed, but broadly the available methods fall into three categories: (1) Univariate methods. Relative abundances of the different species at each site or time are reduced to a single index. (2) Graphical/distributional methods. Relative abundances or biomasses of different species are plotted as a curve, which retains more information about the distribution than a single index. (These two methods are not species specific, and two communities with a completely different taxonomic composition could have the same univariate or graphical/distribu- tional structure.)
Transcript of A Comparison of some methods for analysing changes in...

/. mar. biol. Ass. U.K. (1991), 71, 225-244 225Printed in Great Britain
A COMPARISON OF SOME METHODS FOR ANALYSINGCHANGES IN BENTHIC COMMUNITY STRUCTURE
R.M. WARWICK AND K.R. CLARKE
Plymouth Marine Laboratory, Prospect Place, The Hoe, Plymouth PL1 3DH
Statistical methods for analysing changes in community structure fall under the threegeneral headings of univariate, graphical/distributional and multivariate. These methodsare applied to a variety of benthic community data (macrobenthos, meiobenthos, corals,demersal fish), from a variety of localities (intertidal/subtidal, temperate/tropical) andover both spatial and temporal scales. Four general conclusions emerge from this comparativestudy:
(1) The similarity between sites or times based on their univariate or graphical/distributional properties is usually different from their clustering in multivariate analyses.
(2) Species dependent (multivariate) methods are much more sensitive than speciesindependent (univariate and graphical/distributional) methods in discriminating betweensites or times.
(3) In examples where more than one component of the fauna has been studied,univariate and graphical/distributional methods may give different results for differentcomponents, whereas multivariate methods tend to give the same results.
(4) By matching multivariate ordinations from subsets of environmental data to anordination of faunistic data, the key environmental variables responsible for communitychange may be identified.
INTRODUCTION
Natural communities of animals and plants generally comprise a large number ofspecies, and changes in community structure are determined by a suite of differentenvironmental variables to which each of the species in the community may responddifferently. The community ecologist is thus faced with a rather complex problem ofcharacterising community attributes, analysing changes in them over spatial or temporalscales, and relating these changes to potentially causal environmental variables. A widevariety of different solutions to these problems has been developed, but broadly theavailable methods fall into three categories:
(1) Univariate methods. Relative abundances of the different species at each site or timeare reduced to a single index.
(2) Graphical/distributional methods. Relative abundances or biomasses of differentspecies are plotted as a curve, which retains more information about the distribution thana single index.
(These two methods are not species specific, and two communities with a completelydifferent taxonomic composition could have the same univariate or graphical/distribu-tional structure.)
226 R.M. WARWICK AND K.R. CLARKE
(3) Multivariate methods of classification and ordination which compare communitieson the basis of the identity of the component species as well as their relative importancein terms of abundance or biomass.
For each of these classes of methods there are appropriate statistical tests to determinethe significance of differences between replicated community samples in either time orspace. For univariate indices, classical ANOVA is appropriate, and for graphical andmultivariate methods there are multivariate equivalents, including the simulation/permutation test ANOSIM (Clarke & Green, 1988; Clarke, 1990) which does not make theassumption of multivariate normality in the data.
This paper compares these classes of methods by applying them to a broad range ofstudies on various components of the marine benthos from a variety of localities in orderto address the questions of whether species dependent and species independent attributesof community structure behave the same or differently in response to environmentalchanges, and which are the most sensitive. Within each class of methods there is a verywide variety of different techniques employed, and to make this comparative exercisemore tractable we have chosen to examine only one method for each class; the ShannonWiener diversity index H'=-S.p.(loge p.) (Shannon & Weaver, 1949), fc-dominance curves(Lambshead et ah, 1983) and non-metric Multi-dimensional Scaling Ordination (MDS)(Kruskal & Wish, 1978) on a Bray-Curtis similarity matrix of appropriately transformedspecies abundance or biomass data. All of these methods are now very commonlyemployed in community studies. The example studies referred to will only be describedbriefly, as more detail can be found in the relevant publications, which are referenced.
SENSITIVITY
The first four examples compare the relative sensitivities of these methods in detectingcommunity change.
Ekofisk oil-field macrobenthos
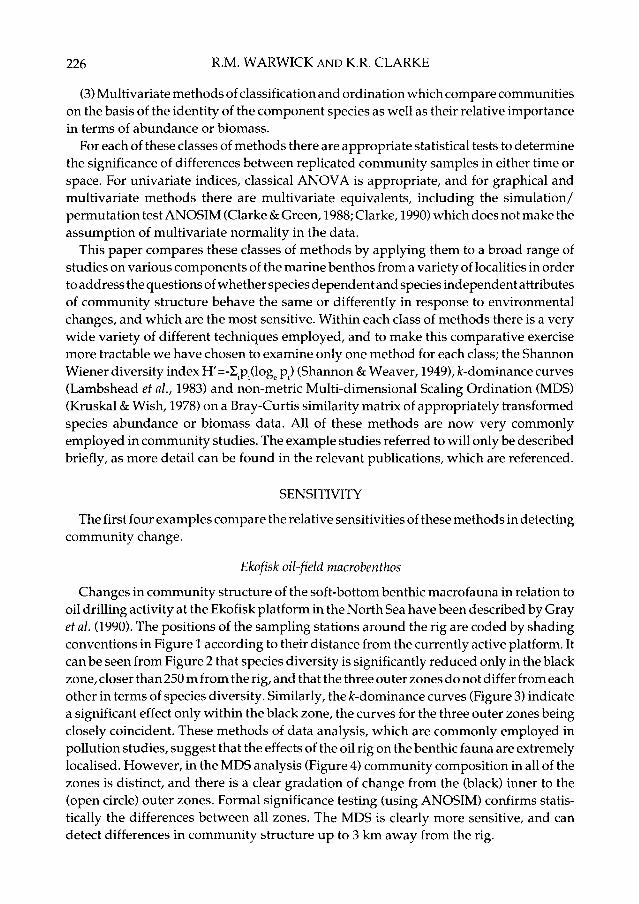
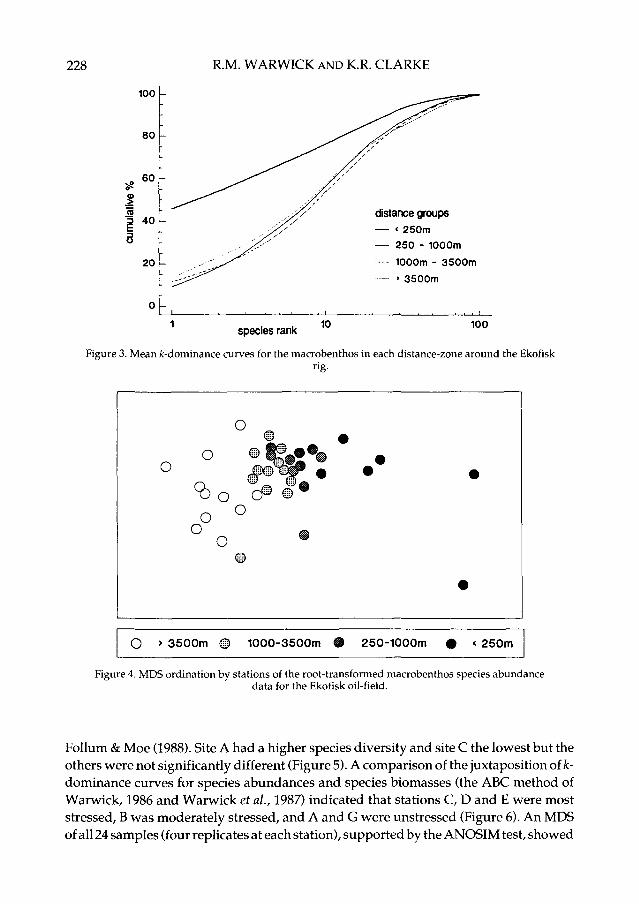
Changes in community structure of the soft-bottom benthic macrofauna in relation tooil drilling activity at the Ekofisk platform in the North Sea have been described by Grayet al. (1990). The positions of the sampling stations around the rig are coded by shadingconventions in Figure 1 according to their distance from the currently active platform. Itcan be seen from Figure 2 that species diversity is significantly reduced only in the blackzone, closer than 250 m from the rig, and that the three outer zones do not differ from eachother in terms of species diversity. Similarly, the ̂ -dominance curves (Figure 3) indicatea significant effect only within the black zone, the curves for the three outer zones beingclosely coincident. These methods of data analysis, which are commonly employed inpollution studies, suggest that the effects of the oil rig on the benthic fauna are extremelylocalised. However, in the MDS analysis (Figure 4) community composition in all of thezones is distinct, and there is a clear gradation of change from the (black) inner to the(open circle) outer zones. Formal significance testing (using ANOSIM) confirms statis-tically the differences between all zones. The MDS is clearly more sensitive, and candetect differences in community structure up to 3 km away from the rig.

METHODS OF ANALYSING BENTHIC COMMUNITIES 227
Figure 1. Map of sampling stations around the Ekof isk oil rig. Stations are represented by circles shadedaccording to their distance from the rig, which is situated at the centre of the black circles.
3.6 -
3.2
H"
2.8
2.4
2.0
• ® © odistance groups from oil-field
• < 250m ® 250 - 1000m © 1000m - 3500m O > 3500m
Figure 2. Shannon diversity of the macrobenthos (mean and 95% confidence limits) in eachdistance-zone around the Ekofisk rig.
Frierfjord macrobenthos
As part of the GEEP/IOC Oslo Workshop on the biological effects of pollutants (Grayet al., 1988), macrobenthos samples were collected at a series of six stations in Frierfjord/Langesundf jord, station A being the outermost and station G the innermost (station Fwas not sampled for macrobenthos). For a map of the sampling locations see figure 2 in
228 R.M. WARWICK AND K.R. CLARKE
100 -
80
60
40
20
distance groups
— < 250m— 250 - 1000m— 1000m - 3500m
> 3500m
species rank10 100
Figure 3. Mean fc-dominance curves for the macrobenthos in each distance-zone around the Ekofisk
O > 3500m © 1000-3500m 250-1000m < 250m
Figure 4. MDS ordination by stations of the root-transformed macrobenthos species abundancedata for the Ekofisk oil-field.
Folium & Moe (1988). Site A had a higher species diversity and site C the lowest but theothers were not significantly different (Figure 5). A comparison of the juxtaposition of k-dominance curves for species abundances and species biomasses (the ABC method ofWarwick, 1986 and Warwick et al., 1987) indicated that stations C, D and E were moststressed, B was moderately stressed, and A and G were unstressed (Figure 6). An MDSof all 24 samples (four replicates at each station), supported by the ANOSIM test, showed

METHODS OF ANALYSING BENTHIC COMMUNITIES 229
H1
3.5
3.0
2.5
2.0
1.5
1.0
-
-
(1
1 (
(11
<
1
1 I 1
A B C D E Gfield site
Figure 5. Shannon diversity of the macrobenthos (mean and 95% confidence limits) for stations inFrierfjord /Langesundfjord.
100
80
60
40
20
! 0 SITE A SITE B SITE C
100
8 0
60
40
20
0
" AV
\B
SITE D
A/ /
B
SITE E
B. \
/\
A
SITE G
10 1 10species rank
10
Figure 6. ABC curves for the macrobenthos species data at each station in Frierfjord /Langesundfjord. Solid lines, abundance; broken lines, biomass.
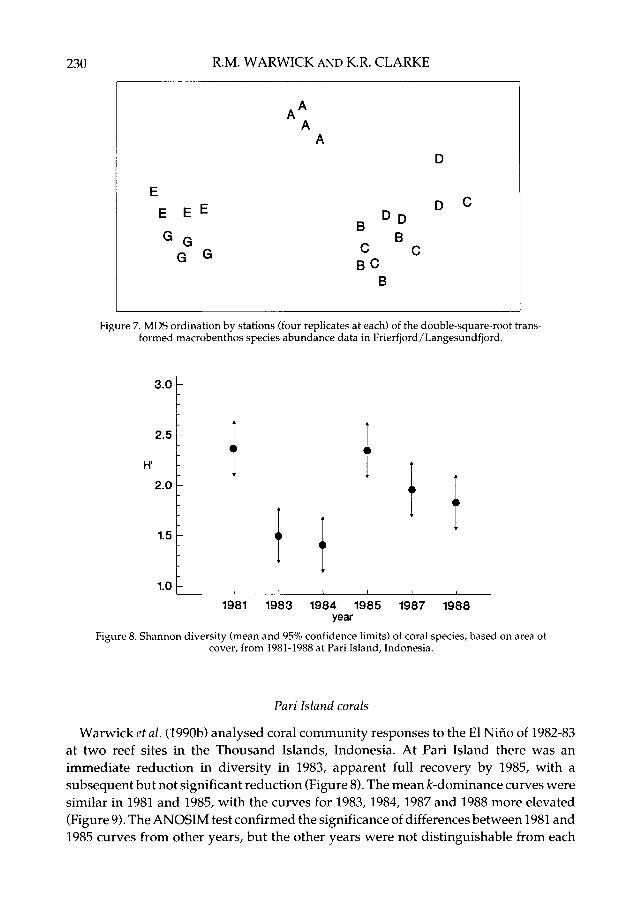
that only stations B and C were not significantly different from each other (Figure 7).Thus, the MDS was much better at discriminating between stations than the diversitymeasure, but perhaps more importantly, sites with similar univariate or graphical/distributional community structure did not cluster together on the MDS. For example Eand G had different ABC plots but clustered together, and diversity at E was notsignificantly different from D although they are furthest apart on the MDS.
230 R.M. WARWICK AND K.R. CLARKE
Figure 7. MDS ordination by stations (four replicates at each) of the double-square-root trans-formed macrobenthos species abundance data in Frierfjord/Langesundfjord.
H'
3.0
2.5
2.0
1.5
1.0
-
• <
<»i
<><
t
•
i i i i i i
1981 1983 1984 1985 1987 1988year
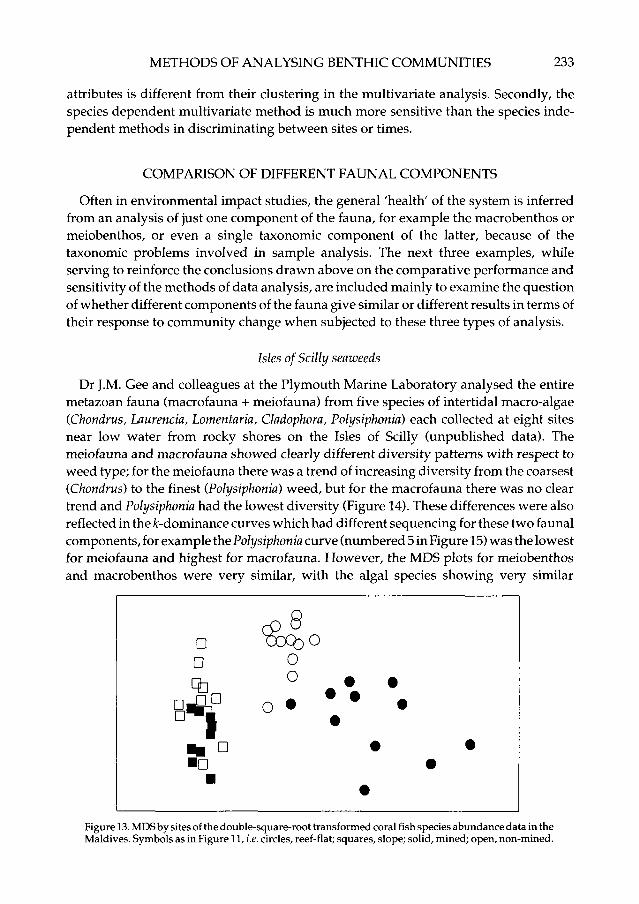
Figure 8. Shannon diversity (mean and 95% confidence limits) of coral species, based on area ofcover, from 1981-1988 at Pari Island, Indonesia.
Pari Island corals
Warwick et al. (1990b) analysed coral community responses to the El Nino of 1982-83at two reef sites in the Thousand Islands, Indonesia. At Pari Island there was animmediate reduction in diversity in 1983, apparent full recovery by 1985, with asubsequent but not significant reduction (Figure 8). The mean ̂ -dominance curves weresimilar in 1981 and 1985, with the curves for 1983,1984, 1987 and 1988 more elevated(Figure 9). The ANOSIM test confirmed the significance of differences between 1981 and1985 curves from other years, but the other years were not distinguishable from each

METHODS OF ANALYSING BENTHIC COMMUNITIES
100
80
231
13
60
40
20
1 10species rank
Figure 9. Average ^-dominance curves for coral species, based on area of cover, from 1981 (=1) to1988 (=8) at Pari Island, Indonesia.
5
57
5
!1 1
11
55
57
7 5 7 78 8
7
1
1
1
1
7
85
o 58
8 7
7
78
3 8
4
4
4
4
3
33
44
5
34
3
4
3
4
3
3
3
3
Figure 10. MDS by years (10 replicates each) of root transformed coral species cover data at Pariisland, Indonesia. 1=1981, 3=1983 etc.
other. The MDS showed an immediate location shift in community composition at the tenreplicate sites between 1981 and 1983, and ANOSIM indicated significant differencesbetween all pairs of years. Recovery proceeded in the pre-El Nino direction but was notcomplete by 1988 (Figure 10). Thus, although all the methods showed the immediate anddramatic post El Nino bleaching effect, the multivariate method was more sensitive inmonitoring the recovery phase.

232 R.M. WARWICK AND K.R. CLARKE
Maldives reef fish
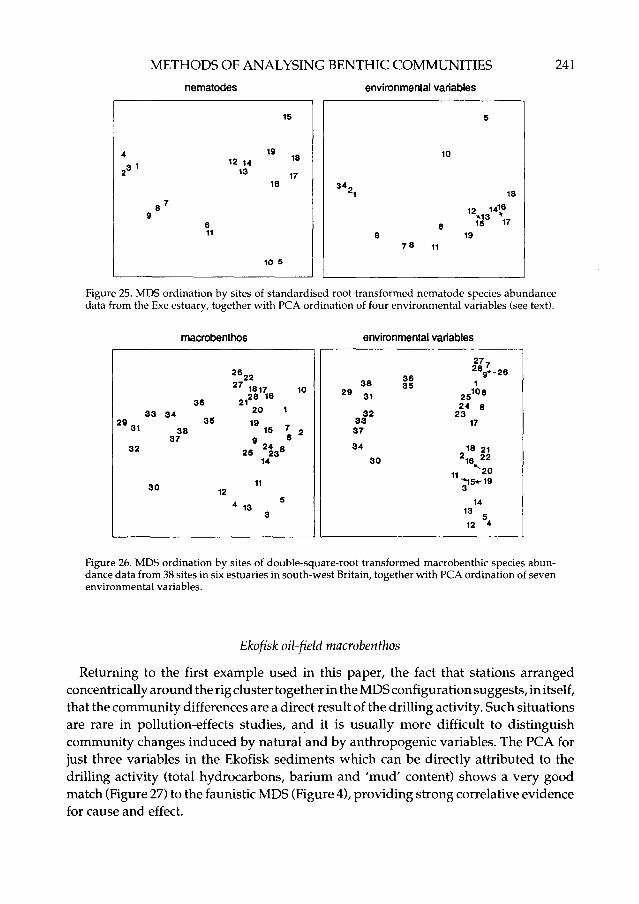
In the Maldive islands, Dawson Shepherd et al. (in press) compared reef-fish assem-blages at 23 coral reef-flat sites, 11 of which had been subjected to coral mining for theconstruction industry and 12 were non-mined. The reef-slopes adjacent to these flatswere also surveyed. No differences in diversity (Figure 11) or ^-dominance curves(Figure 12) between mined and non-mined sites could be detected. The MDS (Figure 13),however, clearly distinguished mined from non-mined sites on the reef-flats, and also toa lesser degree even on the slopes adjacent to these flats; ANOSIM confirmed thesignificance of this difference.
Conclusions
These examples share two common features. Firstly, the similarity in communitystructure between sites or times based on their univariate or graphical/distributional
3.5 -
H1
3.0
2.5
C)
flat slope
mined non-mined mined non-mined
Figure 11. Shannon diversity (mean and 95% confidence limits) of coral fish assemblages at minedand non-mined reef-flat and slope sites in the Maldives.
100
80
60
40
20
0
mined
: B
\ / \
10 100 1species rank
10 100
Figure 12. Average ^-dominance curves for abundance and biomass of coral fish assemblages atmined and non-mined reef-flat sites in the Maldives.
METHODS OF ANALYSING BENTHIC COMMUNITIES 233
attributes is different from their clustering in the multivariate analysis. Secondly, thespecies dependent multivariate method is much more sensitive than the species inde-pendent methods in discriminating between sites or times.
COMPARISON OF DIFFERENT FAUNAL COMPONENTS
Often in environmental impact studies, the general 'health' of the system is inferredfrom an analysis of just one component of the fauna, for example the macrobenthos ormeiobenthos, or even a single taxonomic component of the latter, because of thetaxonomic problems involved in sample analysis. The next three examples, whileserving to reinforce the conclusions drawn above on the comparative performance andsensitivity of the methods of data analysis, are included mainly to examine the questionof whether different components of the fauna give similar or different results in terms oftheir response to community change when subjected to these three types of analysis.
Isles of Stilly seaweeds
Dr J.M. Gee and colleagues at the Plymouth Marine Laboratory analysed the entiremetazoan fauna (macrofauna + meiofauna) from five species of intertidal macro-algae(Chondrus, Laurencia, Lomentaria, Cladophora, Polysiphonia) each collected at eight sitesnear low water from rocky shores on the Isles of Scilly (unpublished data). Themeiofauna and macrofauna showed clearly different diversity patterns with respect toweed type; for the meiofauna there was a trend of increasing diversity from the coarsest(Chondrus) to the finest (Polysiphonia) weed, but for the macrofauna there was no cleartrend and Polysiphonia had the lowest diversity (Figure 14). These differences were alsoreflected in the fc-dominance curves which had different sequencing for these two faunalcomponents, for example the Polysiphonia curve (numbered 5 in Figure 15) was the lowestfor meiofauna and highest for macrofauna. However, the MDS plots for meiobenthosand macrobenthos were very similar, with the algal species showing very similar
9
••
1
• •1
•
1•
1
rOXX
0
80
• • • \
• •
Figure 13. MDS by sites of the double-square-root transformed coral fish species abundance data in theMaldives. Symbols as in Figure 11, i.e. circles, reef-flat; squares, slope; solid, mined; open, non-mined.

234 R.M. WARWICK AND K.R. CLARKE
relationships to each other in terms of their meiofaunal and macrofaunal communitystructure (Figure 16).
Tamar estuary meiofauna
Austen & Warwick (1989) compared the structure of the two major taxonomiccomponents of the meiobenthos, nematodes and harpacticoid copepods, in the Tamarestuary for six replicate samples at a series of ten intertidal soft-sediment sites (site 1 atthe mouth of the estuary and site 10 at the head). The average fc-dominance curves showno clear sequencing of sites for the nematodes, for example the curve for site 1 is closelycoincident with that of site 10 (Figure 17). For the copepods, however, the curves becomeincreasingly elevated from the mouth to the head of the estuary. In the MDS, both
H1
2.8
2.5
r
2.2
1.9
1.6
1.3
meiofauna
o 0
omacrofauna
o
Ch La Lo Cl Po Ch La Lo Cl Po
Figure 14. Shannon diversity (mean and 95% confidence limits) for the meiofauna and macrofauna ofintertidal seaweeds on the Isles of Scilly. Ch, Chondrus; La, Laurencia; Lo, Lomentaria; Cl, Cladophora; Po,Polysiphonia.
100
80
® 60
I1 403
20
0 10 100 1species rank
macrofauna
10 100
Figure 15. Average ^-dominance curves for meiofauna and macrofauna species abundances in fivespecies of intertidal seaweeds on the Isles of Scilly.

METHODS OF ANALYSING BENTHIC COMMUNITIES 235
nematodes and copepods show a similar horse-shoe shaped sequencing of sites from themouth to the head of the estuary (Figure 18).
Eaglehawk neck meiofauna
Warwick etal. (1990a) studied the effect of disturbance by soldier-crabs on the structureof the nematode and copepod components of the meiobenthos at an intertidal sandflatat Eaglehawk Neck, on the Tasman Penninsula, Australia. The crabs disturbed thesediment in discrete patches, and samples were collected in a blocked design, the fourblocks having two samples inside and two outside a disturbed patch, as shownschematically in Figure 19. Two-way ANOVA showed a significant reduction in species
meiofauna
A1
^ ©© y
|©@"9
0©
i
i
G
©
0
6°0°0
0
o
0
macrofauna
©
•
©
0 o
> 0
0
0
# Chondrus ® Laurena'a ® Lomentaria © Cladophora O Polysiphonia
Figure 16. MDS by sites of the standardised double-square-root transformed meiofauna and macrofaunaspecies abundance data from the Isles of Scilly. The five seaweed species are indicated by differentshading conventions.
100
80
S? 60o
J 4020
nematodes
100
80
60
40
20
0
910 V^ ;
" ft/-/-A / 7K5
3
copepods
10 1species rank
10
Figure 17. Average /c-dominance curves for nematode and copepod species abundance data at tenstations in the Tamar estuary. For clarity of presentation, some sites have been omitted (see Austen &Warwick, 1989, for details).

236 R.M. WARWICK AND K.R. CLARKE
diversity in the disturbed areas for the nematodes, but not for the copepods. The k-dominance curves were also significantly elevated in disturbed blocks for the nematodes(Figure 20), as tested by two-way ANOSIM, but not for the copepods (Figure 21).However, the MDS configurations for nematodes and copepods both showed a similarpattern to that of the 'total meiofauna' (nematodes+copepods), with the disturbed sitesin each block positioned above the undisturbed sites (except for one copepod sample inthe block designated by diamond-shaped symbols) and the same left-right sequencingof blocks (Figure 22).
Conclusions
In these examples where more than one component of the fauna has been studied, ageneral feature is that the univariate and graphical methods gave different results fordifferent components, whereas the multivariate method gave the same results.
nematodes copepods
76 7 6
7 , 7
\ *
6 88
2 4 9O
a? i13 1010
3
£,\ 6 1° 102 2 10 10
2 10
10
Figure 18. MDS by sites (each with six replicates) of double-square-root transformed nematode andcopepod species abundance data from the Tamar estuary.
HHfc ;iVnA ^
0 0;::;;..; V - A ^ •'••• '^(M^^- -•/•'7:.--: •-.-. ^^m-'••••••••-•. ^ ^ ^ - : - r . •- • " -
"•• . " " • : > • • : .x1
.-: '1 • . • . • • ; • • " ".• - •
Figure 19. Schematic representation of blocked sampling design for meiofauna cores collected on thesandflat at Eaglehawk Neck, in relation to patches of sediment disturbed by soldier crabs (stippled).

METHODS OF ANALYSING BENTHIC COMMUNITIES 237
RELATING FAUNISTIC ORDINATIONS TO ENVIRONMENTAL VARIABLES
The above examples indicate that multivariate methods are not only more sensitive indetecting the responses of benthic communities to environmental change, but also givesimilar results regardless of the component of the fauna being analysed. The sensitivityand generality of multivariate methods make them particularly valuable tools in the
10 1species rank
Figure 20. ̂ -dominance curves for nematode species abundances in the four samples of each blockat Eaglehawk Neck. D, disturbed; U, undisturbed.
.13
100
80
60
40
20
100
10species rank
Figure 21. ̂ -dominance curves for harpacticoid copepod species abundances in the four samples ofeach block at Eaglehawk Neck. D, disturbed; U, undisturbed.

238 R.M. WARWICK AND K.R. CLARKE
nematodes copepods
Figure 22. MDS by core samples of root transformed meiofauna) species abundance data at EaglehawkNeck. Symbols as in Figure 19, i.e. solid, disturbed; open, undisturbed; shapes, four different blocks.
assessment of community change; however, there is a need to relate this communitychange to measured environmental change. The reason why MDS configurations fordifferent components of the fauna are similar must imply that the balance of specieswithin these communities is being affected in the same way by the same combination ofkey environmental variables. This too is a multivariate problem, and has been tackledformally in a number of ways, under the general heading of 'canonical' analyses {e.g.Redundancy Analysis and Canonical Correspondence Analysis, Jongman et ah, 1987).These techniques are associated with particular forms of multivariate ordination (e.g.Principal Components Analysis and Correspondence Analysis, respectively), and arenaturally suited to problems and data structures for which these ordination methods areappropriate. For example, they operate on linear combinations of environmental vari-ables directly related to the species abundances in the original data matrix, and thechosen ordination technique dictates the (implicit) definition of dissimilarity of twosamples (e.g. 'Euclidean' or 'chi-squared' distance).
Here, we have preferred the converse formulation: biological considerations suggestan appropriate transformation and choice of dissimilarity coefficient for the faunalanalysis (Field et al., 1982), and subsequent ordination is based only on the (rank)dissimilarity matrix. A relationship is therefore sought between the faunal MDS andpattern in the environmental variables. Informally, one might expect that, if the relevantenvironmental variables which determine community composition are correctly iden-tified, then an ordination of these variables should closely resemble the faunisticordination. Experimenting with these variables in different combinations might also

METHODS OF ANALYSING BENTHIC COMMUNITIES 239
•1
ARRAN
BUTE
CUMBRAE
DUMPSITE
• • •
12
0
AYRSHIRE
km
5
Figure 23. Map of macrobenthos sampling sites in relation to the Garroch Head sewage sludgedumping ground.
enable us to choose which of these combinations matches the faunistic ordination mostclosely, and hence to identify which are the most responsible for community differences.The omission of a key variable will lead to an inferior match, as will the inclusion ofvariables with a significantly different pattern across sites but which have no effect onspecies composition. The following four examples explore these ideas.
Macrobenthos of the Garroch Head sewage-sludge dumping ground
Figure 23 shows the positions of 12 stations across the Garroch Head sewage-sludgedumping ground in the Firth of Clyde which were sampled for macrobenthos in 1983(Pearson & Blackstock, unpublished SMBA Report, 1984). The MDS for macrobenthosspecies biomasses (Figure 24) shows a gradation of change in community structure fromstation 1 to station 7 (the dump-centre) and then back again to station 12, which iscompositionally close to station 1. A correlation-based Principal Components Analysis(PCA) on the measured environmental variables (carbon, nitrogen and eight metals) inthe sediment (Figure 24) closely resembles the structure of the faunistic MDS, suggestingthat these are the variables that 'explain' the changes in community structure across thedump-site. As might be expected, the PCA for C and N alone (Figure 24) is very onedimensional, whereas the PCA for metals (Cu, Mn, Co, Ni, Zn, Cd, Pb, Cr) more closelyreproduces the three dimensional structure of the faunistic MDS. This suggests that,although organic enrichment has been considered the main determinant of benthiccommunity structure at such sites, the toxic effects of heavy metals may also be ofimportance.

240 R.M. WARWICK AND K.R. CLARKE
macrobenthos all environmental variables
1
12
11 S 6
7
a
1
4
5 5 ft T
, ; -8.5
10
9
carbon and nitrogen metals
91 1 5 1 2 5 .5 6 8 7
1 0 8.5
1
4
12 5 711 6 8
8.510
9
Figure 24. MDS ordination by stations of double-square-root transformed macrobenthos speciesbiomass data for the Garroch Head transect, together with PCA ordinations for various combinationsof environmental variables measured in the sediments.
Exe estuary nematodes
Field etal. (1982) re-analysed the data of Warwick (1971) which described the distribu-tion of nematodes at 19 intertidal sediment sites in the Exe estuary. The PCA for just fourenvironmental variables (sediment grain size, interstitial salinity, organic content,blackened H2S depth) produced the most similar grouping of stations to the faunisticMDS (Figure 25), indicating that these are the most important in determining nematodedistributions. The only notable difference is in the positions of stations 5 and 10 relativeto the others.
Macrobenthos of estuaries in south-west Britain
Warwick et al. (in press) showed that a PCA for seven environmental variablesreproduced the main features of the faunistic MDS for intertidal macro-invertebratecommunities at 38 intertidal sediment sites from six estuaries in south-west Britain(Figure 26), although there were some differences in detail. A feature of both ordinationswas the clear separation of the Severn estuary sites (29-38) from the other five estuaries.The PCA for purely 'static' environmental variables such as grain size and organiccontent did not reproduce this separation, suggesting that dynamic features of theSevern estuary (current speed as indexed by tidal range and wave climate as indexed bywind-fetch distance) are responsible for its uniqueness.
METHODS OF ANALYSING BENTHIC COMMUNITIES
nematodes environmental variables
241
3 \
97 8
10
6
11
5
12 U»1315
19
18
17
Figure 25. MDS ordination by sites of standardised root transformed nematode species abundancedata from the Exe estuary, together with PCA ordination of four environmental variables (see text).
macrobenthos environmental variables
26222 7 1817 10
212 8 1 6
33 34 „ 20 129 35 1 9
31 38 15 ' 237 9 6
32 25 2Ua
14
12 "
« 1 3 5
3
36 2*^26
38 gf 12 9 31 25 1 0 6
24 832 23
33 1737
34 18 2130 2 1 6 22
11 ^2°
14
12 *
Figure 26. MDS ordination by sites of double-square-root transformed macrobenthic species abun-dance data from 38 sites in six estuaries in south-west Britain, together with PCA ordination of sevenenvironmental variables.
Ekofisk oil-field macrobenthos
Returning to the first example used in this paper, the fact that stations arrangedconcentrically around the rig cluster together in the MDS configuration suggests, in itself,that the community differences are a direct result of the drilling activity. Such situationsare rare in pollution-effects studies, and it is usually more difficult to distinguishcommunity changes induced by natural and by anthropogenic variables. The PCA forjust three variables in the Ekofisk sediments which can be directly attributed to thedrilling activity (total hydrocarbons, barium and 'mud' content) shows a very goodmatch (Figure 27) to the faunistic MDS (Figure 4), providing strong correlative evidencefor cause and effect.

242 R.M. WARWICK AND K.R. CLARKE
o
oo
o
> 3500m
©
c?
u
©
mo
1000-3500m i
.
#
1 250-1000m 1> < 250m
Figure 27. PCA ordination by sites of total hydrocarbons, barium and mud content of thesediments of the Ekofisk oil field. Compare with faunistic MDS in Figure 4.
Conclusions
These examples show the close correspondence between ordinations of sites withrespect to their faunistic attributes and to environmental data, and suggest one means bywhich the most important environmental variables responsible for community changemight be identified.
DISCUSSION
The species independent methods of community analysis, although less sensitive indetecting change than multivariate methods, do have the clear advantage that somevalue judgement can be attached to the changes observed. Thus, the reduction in speciesdiversity or the elevation of ^-dominance curves are usually regarded as detrimentalresponses. The fact that changes in community response of different components of thefauna may differ, indicating differential responses to stress, may in some instances beturned to advantage in that it may enable the cause of stress to be identified. For example,stress responses in the macrobenthos but not the meiobenthos have been used asevidence for physical disturbance as the cause, since the macrobenthos may dependmore on habitat stability to maintain high species diversity (Austen et al., 1989; Warwicketal., 1990c).
Multivariate methods have the advantages of great sensitivity and generality ofresponse, but in themselves are indicative only of community change which can bedifficult to interpret in terms either of value judgements (detrimental or otherwise) or ofthe possible cause. There is a clear future research requirement for the development ofcommunity level stress indices which retain the multivariate information which is lostin univariate or graphical measures, and which will be more sensitive than the latter.Also, there is a need to formalise the optimal linking of environmental and faunistic

METHODS OF ANALYSING BENTHIC COMMUNITIES 243
ordinations, in the framework of the non-metric multivariate methods adopted here;such work will be reported elsewhere.
This work was funded in part under contract to the UK Department of the Environment as partof its co-ordinated programme of research on the North Sea.
REFERENCES
Austen, M.C. & Warwick, R.M., 1989. Comparison of univariate and multivariate aspects ofestuarine meiobenthic community structure. Estuarine, Coastal and Shelf Science, 29, 23-42.
Austen, M.C, Warwick, R.M. & Rosado, M.C, 1989. Meiobenthic and macrobenthic communitystructure along a putative pollution gradient in southern Portugal. Marine Pollution Bulletin, 20,398-405.
Clarke, K.R., 1990. Comparisons of dominance curves, journal of Experimental Marine Biology andEcology, 138,143-157.
Clarke, K.R. & Green, R.H., 1988. Statistical design and analysis for a 'biological effects' study.Marine Ecology Progress Series, 46, 213-226.
Dawson Shepherd, A.R., Warwick, R.M., Clarke, K.R. & Brown, B.E., in press. An analysis of fishcommunity responses to coral mining in the Maldives. Environmental Biology of Fishes.
Field, J.G., Clarke, K.R. & Warwick, R.M., 1982. A practical strategy for analysing multispeciesdistribution patterns. Marine Ecology Progress Series, 8, 37-52.
Folium, O.A. & Moe, K.A., 1988. The GEEP Workshop: field sampling. Marine Ecology ProgressSeries, 46, 7-12.
Gray, J.S., Aschan, M., Carr, M.R., Clarke, K.R., Green, R.H., Pearson, T.H., Rosenberg, R. &Warwick, R.M. 1988. Analysis of community attributes of the benthic macrof auna of Frierf jord /Langesundfjord and in a mesocosm experiment. Marine Ecology Progress Series, 46,151-165.
Gray, J.S., Clarke, K.R., Warwick, R.M. & Hobbs, G., 1990. Detection of initial effects of pollutionon marine benthos: an example from the Ekofisk and Eldfisk oilfields, North Sea. MarineEcology Progress Series, 66,285-299.
Jongman, R.H.G., Ter Braak, C.J.F. & Tongeren, O.F.R. van, 1987. Data Analysis in Community andLandscape Ecology. Wageningen: Pudoc.
Kruskal, J.B. & Wish, M., 1978. Multidimensional Scaling. Beverley Hills, California: Sage Publica-tions.
Lambshead, P.J.D., Platt, H.M. & Shaw, K.M., 1983. The detection of differences among assemblagesof benthic species based on an assessment of dominance and diversity. Journal of NaturalHistory, 17,859-874.
Shannon, CE. & Weaver, W., 1949. The Mathematical Theory of Communication. Urbana: Universityof Illinois Press.
Warwick, R.M., 1971. Nematode associations in the Exe estuary. Journal of the Marine BiologicalAssociation of the United Kingdom, 51,439-454.
Warwick, R.M., 1986. A new method for detecting pollution effects on marine macrobenthiccommunities. Marine Biology, 92, 557-562.
Warwick, R.M., Pearson, T.H. & Ruswahyuni, 1987. Detection of pollution effects on marinemacrobenthos: further evaluation of the species abundance/biomass method. Marine Biology,95,193-200.
Warwick, R.M., Clarke, K.R. & Gee, J.M., 1990a. The effect of disturbance by soldier crabs Mictyrisplatycheles H. Milne Edwards on meiobenthic community structure. Journal of Experimental MarineBiology and Ecology, 135,19-33.
Warwick, R.M., Clarke, K.R. & Suharsono, 1990b. A statistical analysis of coral communityresponses to the 1982-83 El Nino in the Thousand Islands, Indonesia. Coral Reefs, 8,171-179.
Warwick, R.M., Goss-Custard, J.D., Kirby, R., George, C.L., Pope, N.D. & Rowden, A.A., in press.Static and dynamic factors determining the community structure of estuarine macrobenthos inSW Britain: why is the Severn estuary different? Journal of Applied Ecology.

244 R.M. WARWICK AND K.R. CLARKE
Warwick, R.M., Platt, K M , Clarke, K.R., Agard, J. & Gobin, ]., 1990c. Analysis of macrobenthic andmeiobenthic community structure in relation to pollution and disturbance in HamiltonHarbour, Bermuda. Journal of Experimental Marine Biology and Ecology, 138,119-142.
Submitted 9 July 1990. Accepted 14 November 1990.