A Comparison of Several Linear Genetic Programming...
29
A Comparison of Several Linear Genetic Programming Techniques Mihai Oltean Crina Gros ¸an Department of Computer Science, Faculty of Mathematics and Computer Science, Babes-Bolyai University, Kogalniceanu 1, Cluj-Napoca, 3400, Romania A comparison between four Genetic Programming techniques is presented in this paper. The compared methods are Multi-Expression Program- ming, Gene Expression Programming, Grammatical Evolution, and Lin- ear Genetic Programming. The comparison includes all aspects of the considered evolutionary algorithms: individual representation, fitness as- signment, genetic operators, and evolutionary scheme. Several numerical experiments using five benchmarking problems are carried out. Two test problems are taken from PROBEN1 and contain real-world data. The results reveal that Multi-Expression Programming has the best overall behavior for the considered test problems, closely followed by Linear Genetic Programming. 1. Introduction Genetic Programming (GP) [1, 2] is an evolutionary technique used for breeding a population of computer programs. GP individuals are repre- sented and manipulated as nonlinear entities, usually trees. A particular GP subdomain consists of evolving mathematical expressions. In that case the evolved program is a mathematical expression, program execu- tion means evaluating that expression, and the output of the program is usually the value of the expression. Several linear variants of GP have recently been proposed. Some of them are: Multi-Expression Programming (MEP) 1 [3, 4], Grammatical Evolution (GE) [5, 6], Gene Expression Programming (GEP) [7], Linear Genetic Programming (LGP) [8, 9], Cartesian Genetic Programming (CGP) [10], and Genetic Algorithm for Deriving Software (GADS) [11]. All mentioned GP variants make a clear distinction between the geno- type and the phenotype of an individual [12]. Thus, the individuals are Electronic mail address: [email protected]. Electronic mail address: [email protected]. 1 MEP source code is available at www.mep.cs.ubbcluj.ro. Complex Systems, 14 (2003) 285–313; 2003 Complex Systems Publications, Inc.
-
Upload
hoangkhuong -
Category
Documents
-
view
223 -
download
0
Transcript of A Comparison of Several Linear Genetic Programming...

A Comparison of Several Linear GeneticProgramming Techniques
Mihai Oltean!Crina Grosan!
Department of Computer Science,Faculty of Mathematics and Computer Science,Babes-Bolyai University, Kogalniceanu 1,Cluj-Napoca, 3400, Romania
A comparison between four Genetic Programming techniques is presentedin this paper. The compared methods are Multi-Expression Program-ming, Gene Expression Programming, Grammatical Evolution, and Lin-ear Genetic Programming. The comparison includes all aspects of theconsidered evolutionary algorithms: individual representation, fitness as-signment, genetic operators, and evolutionary scheme. Several numericalexperiments using five benchmarking problems are carried out. Two testproblems are taken from PROBEN1 and contain real-world data. Theresults reveal that Multi-Expression Programming has the best overallbehavior for the considered test problems, closely followed by LinearGenetic Programming.
1. Introduction
Genetic Programming (GP) [1, 2] is an evolutionary technique used forbreeding a population of computer programs. GP individuals are repre-sented and manipulated as nonlinear entities, usually trees. A particularGP subdomain consists of evolving mathematical expressions. In thatcase the evolved program is a mathematical expression, program execu-tion means evaluating that expression, and the output of the programis usually the value of the expression.
Several linear variants of GP have recently been proposed. Some ofthem are: Multi-Expression Programming (MEP)1 [3, 4], GrammaticalEvolution (GE) [5, 6], Gene Expression Programming (GEP) [7], LinearGenetic Programming (LGP) [8, 9], Cartesian Genetic Programming(CGP) [10], and Genetic Algorithm for Deriving Software (GADS) [11].
All mentioned GP variants make a clear distinction between the geno-type and the phenotype of an individual [12]. Thus, the individuals are
!Electronic mail address: [email protected].!Electronic mail address: [email protected] source code is available at www.mep.cs.ubbcluj.ro.
Complex Systems, 14 (2003) 285–313; " 2003 Complex Systems Publications, Inc.
286 M. Oltean and C. Grosan
represented as linear entities (strings) that are decoded and expressedlike nonlinear entities (trees).
In this paper, a systematic comparison of four GP techniques forsolving symbolic regression problems is provided. The compared meth-ods are MEP, GEP, GE, and LGP. The comparison includes all aspectsof the considered evolutionary techniques: individual representation,genetic operators, fitness assignment, exception handling, and evolu-tionary scheme.
Several numerical experiments using MEP, GEP, GE, and LGP are car-ried out. Five difficult test problems are used for comparing the methods.Three test problems are artificially constructed and two test problemscontain real-world data that have been taken from PROBEN1 [13].
The relationship between the success rate and the population size andthe number of generations is analyzed for the artificially constructedproblems.
For the real-world problems the mean of the absolute differencesbetween the expected output value and the value obtained by the bestindividual over 100 runs is reported.
The results obtained reveal that MEP has the best overall behavioron the considered test problems, closely followed by LGP.
The paper is organized as follows. The representation of MEP, LGP,GE, and GEP individuals is described in section 2. Advantages andshortcomings of each representation are described in detail in this sec-tion. Section 3 discusses the selection strategies used in conjunction withthe considered algorithms. Genetic operators employed by each algo-rithm are presented in section 4. Section 5 describes the evolutionaryschemes used by each algorithm. The formulae used for computing thefitness of each individual are presented in section 6. The mechanismsused for handling the exceptions are presented in section 7. Severalnumerical experiments are performed in section 8.
2. Individual representation
In this section, individual representations are compared. GEP, GE, andLGP encode a single solution, while MEP encodes multiple solutions ina chromosome.
GEP, MEP, and LGP use integer and real numbers for individualencoding while GE uses binary strings for encoding rules of a Backus–Naur form grammar.
A GEP chromosome consists of several genes linked by the symbols# or !. A GEP gene has the same functionality as a MEP, LGP, or GEchromosome.
2.1 Multi-Expression Programming
MEP representation [3, 4] is similar to the way in which C and Pascalcompilers translate mathematical expressions into machine code [14].
Complex Systems, 14 (2003) 285–313
A Comparison of Several Linear Genetic Programming Techniques 287
MEP genes are substrings of a variable length. The chromosome lengthis constant and equal to the number of genes in that chromosome.Each gene encodes a terminal or a function symbol. A gene encodinga function includes pointers towards the function arguments. Functionparameters always have indices of lower values than the position of thatfunction in the chromosome.
According to this representation scheme, the first symbol of the chro-mosome must be a terminal symbol.
ExampleAn example of a CMEP chromosome is given below. Numbers to the leftstand for gene labels, or memory addresses. Labels do not belong to thechromosome. They are provided only for explanatory purposes.
1 $ a2 $ b3 $ #1, 24 $ c5 $ d6 $ #4, 5
When MEP individuals are translated into computer programs (ex-pressions) they are read top-down starting with the first position. Aterminal symbol specifies a simple expression. A function symbol spec-ifies a complex expression (made up by linking the operands specifiedby the argument positions with the current function symbol).
For instance, genes 1, 2, 4, and 5 in the previous example encode sim-ple expressions composed of a single terminal symbol. The expressionsassociated with genes 1, 2, 4, and 5 are:
E1 % aE2 % bE4 % cE5 % d.
Gene 3 indicates the operation # on the operands located in positions1 and 2 of the chromosome. Therefore gene 3 encodes the expression:
E3 % a # b.
Gene 6 indicates the operation # on the operands located in positions4 and 5. Therefore gene 6 encodes the expression:
E6 % c # d.
There is neither practical nor theoretical evidence that one of theseexpressions is better than the others. Moreover, Wolpert and Macready
Complex Systems, 14 (2003) 285–313

288 M. Oltean and C. Grosan
[15] proved that we cannot use the search algorithm’s behavior so far, fora particular test function, to predict its future behavior on that function.This is why each MEP chromosome is allowed to encode a number ofexpressions equal to the chromosome length (number of genes).
The expression associated with each position is obtained by readingthe chromosome bottom-up from the current position and following thelinks provided by the function pointers.
The maximum number of symbols in a MEP chromosome is givenby the formula:
Number of Symbols % (N # 1)Number of Genes &N,
where N is the number of arguments of the function symbol with thegreatest number of arguments.
2.1.1 Multi-Expression Programming strengthsA GP chromosome generally encodes a single expression (computerprogram). By contrast, a MEP chromosome encodes several expressions(it allows representing multiple solutions). The best of the encodedexpressions is chosen to represent the chromosome (by supplying thefitness of the individual). When more than one gene shares the bestfitness, the first detected is chosen to represent the chromosome.
When solving symbolic regression problems, the MEP chromosomedecoding process has the same complexity as other techniques such asGE and GEP (see [3] and section 6.5 this paper).
The Multi-Expression chromosome has some advantages over theSingle-Expression chromosome especially when the complexity of thetarget expression is not known (see the numerical experiments). Thisfeature also acts as a provider of variable-length expressions. Othertechniques (such as GE or LGP) employ special genetic operators (whichinsert or remove chromosome parts) to achieve such a complex func-tionality.
The expression encoded in a MEP chromosome may have exponentiallength when the chromosome has polynomial length. For instance theexpression:
E % a ! a !! ! a"###########$###########%2n
,
can be encoded by the following chromosome (it is assumed that theterminal set is T % 'a( and the function set is F % '#,&, !, /():
1 $ a2 $ !1, 13 $ !2, 2!n $ !n & 1, n & 1.
Complex Systems, 14 (2003) 285–313
A Comparison of Several Linear Genetic Programming Techniques 289
Thus, an expression of exponential length (2n symbols) is encoded ina chromosome of polynomial length (3n & 2 symbols). This is possibleby repeatedly using the same subexpression in a larger (sub)expression(code-reuse).
The code-reuse ability is not employed by the GEP technique but it isused by LGP. The code-reuse ability is similar to Automatically DefinedFunctions (ADFs) [1, 2], a mechanism of GP.
2.1.2 Multi-Expression Programming weaknessesIf code-reuse ability is not utilized, the number of symbols in a MEPchromosome is usually three times greater than the number of symbolsin a GEP or GE chromosome encoding the same expression.
There are problems where the complexity of the MEP decoding pro-cess is higher than the complexity of the GE, GEP, and LGP decodingprocesses. This situation usually arises when the set of training data isnot a priori known (e.g., when game strategies are evolved).
2.2 Gene Expression Programming
GEP [7] uses linear chromosomes that store expressions in breadth-first form. A GEP gene is a string of terminal and function symbols.GEP genes are composed of a head and a tail. The head contains bothfunction and terminal symbols. The tail may contain terminal symbolsonly.
For each problem the head length (denoted h) is chosen by the user.The tail length (denoted by t) is evaluated by:
t % (n & 1)h # 1,
where n is the number of arguments of the function with more argu-ments.
Let us consider a gene made up of symbols in the sets F and T:
F % '!, /,#,&(.T % 'a, b(.
In this case n % 2. If we choose h % 10, then we get t % 11, and thelength of the gene is 10 # 11 % 21. Such a gene is given below:
CGEP % # ! ab & #aab # ababbbababb.
The expression encoded by the gene CGEP is:
E % a # b ! ((a # b) & a).
GEP genes may be linked by a function symbol in order to obtain afully functional chromosome. In the current version of GEP the linkingfunctions for algebraic expressions are addition and multiplication. Asingle type of function is used for linking multiple genes.
Complex Systems, 14 (2003) 285–313

290 M. Oltean and C. Grosan
2.2.1 Gene Expression Programming strengthsThe separation of the GEP chromosome in two parts (head and tail),each of them containing specific symbols, provides an original and veryefficient way of encoding syntactically correct computer programs.
2.2.2 Gene Expression Programming weaknessesThere are some problems regarding multigenic chromosomes. Gener-ally, it is not a good idea to assume that the genes may be linked eitherby addition or by multiplication. Providing a particular linking op-erator means providing partial information to the expression which isdiscovered. But, if all the operators '#,&, !, /( are used as linking opera-tors, then the complexity of the problem substantially grows (since theproblem of determining how to mix these operators with the genes is asdifficult as the initial problem).
Furthermore, the number of genes in the GEP multigenic chromo-some raises a problem. As can be seen in [7], the success rate of GEPincreases with the number of genes in the chromosome. But, after acertain value, the success rate decreases if the number of genes in thechromosome is increased. This happens because we cannot force acomplex chromosome to encode a less complex expression.
A large part of the chromosome is unused if the target expression isshort and the head length is large. Note that this problem arises usuallyin systems that employ chromosomes with a fixed length.
2.3 Grammatical Evolution
GE [5, 6] uses the Backus–Naur form (BNF) to express computer pro-grams. BNF is a notation that allows a computer program to be ex-pressed as a grammar.
A BNF grammar consists of terminal and nonterminal symbols.Grammar symbols may be rewritten in other terminal and nontermi-nal symbols.
Each GE individual is a variable-length binary string that containsthe necessary information for selecting a production rule from a BNFgrammar in its codons (groups of eight bits).
An example from a BNF grammar is given by the following produc-tion rules:
S $$% expr) (0)if-stmt) (1)loop. (2)
These production rules state that the start symbol S can be replaced (re-written) either by one of the nonterminals (expr or if-stmt), or by loop.
The grammar is used in a generative process to construct a programby applying production rules, selected by the genome, beginning withthe start symbol of the grammar.
Complex Systems, 14 (2003) 285–313

A Comparison of Several Linear Genetic Programming Techniques 291
In order to select a GE production rule, the next codon value on thegenome is generated and placed in the following formula:
Rule % Codon Value MOD Num Rules.
If the next Codon integer value is four, knowing that we have threerules to select from, as in the example above, we get 4 MOD 3 % 1.
Therefore, S will be replaced with the nonterminal if-stmt, corre-sponding to the second production rule.
Beginning from the left side of the genome codon, integer values aregenerated and used for selecting rules from the BNF grammar, until oneof the following situations arises.
1. A complete program is generated. This occurs when all the nonterminalsin the expression being mapped are turned into elements from the terminalset of the BNF grammar.
2. The end of the genome is reached, in which case the wrapping operatoris invoked. This results in the return of the genome reading frame to theleft side of the genome once again. The reading of the codons will thencontinue unless a higher threshold representing the maximum number ofwrapping events has occurred during this individual mapping process.
In the case that a threshold on the number of wrapping events isexceeded and the individual is still incompletely mapped, the mappingprocess is halted, and the individual is assigned the lowest possiblefitness value.
ExampleConsider the grammar:
G % 'N, T, S, P(,
where the terminal set is:
T % '#,&, !, /, sin, exp, (, )(,
and the nonterminal symbols are:
N % 'expr, op, pre op(.
The start symbol is:
S % <expr>.
The production rules P are:
<expr> $$% <expr><op><expr>) (0)(<expr><op><expr>)) (1)<pre op>(<expr>)) (2)<var>. (3)
Complex Systems, 14 (2003) 285–313
292 M. Oltean and C. Grosan
<op> $$% #) (0)&) (1)!) (2)/. (3)
<pre op> $$% sin ) (0)exp . (1)
Here is an example of a GE chromosome:
CGE % 000000000000001000000001000000110000001000000011.
Translated into GE codons, the chromosome is:
CGE % 0, 2, 1, 3, 2, 3.
This chromosome is translated into the expression:
E % exp(x) ! x.
2.3.1 Grammatical Evolution strengthsUsing the BNF grammars for specifying a chromosome provides a natu-ral way of evolving programs written in programming languages whoseinstructions may be expressed as BNF rules.
The wrapping operator provides a very original way of translatingshort chromosomes into very long expressions. Wrapping also providesan efficient way of avoiding invalid expressions.
2.3.2 Grammatical Evolution weaknessesThe GE mapping process also has some disadvantages. Wrapping maynever end in some situations. For instance, consider the GGE grammardefined earlier. In these conditions the chromosome
C*GE % 0, 0, 0, 0, 0
cannot be translated into a valid expression because it does not containoperands. To prevent infinite cycling, a fixed number of wrappingoccurrences is allowed. If this threshold is exceeded the expressionobtained is incorrect and the corresponding individual is considered tobe invalid.
Since the debate regarding the supremacy of binary encoding overinteger encoding has not finished yet, we cannot say which one is better.However, as the translation from binary representations to integer/realrepresentations takes some time we suspect that the GE system is a littleslower than other GP techniques that use integer representation.
2.4 Linear Genetic Programming
LGP [8, 9] uses a specific linear representation of computer programs.Instead of the tree-based GP expressions of a functional programming
Complex Systems, 14 (2003) 285–313
A Comparison of Several Linear Genetic Programming Techniques 293
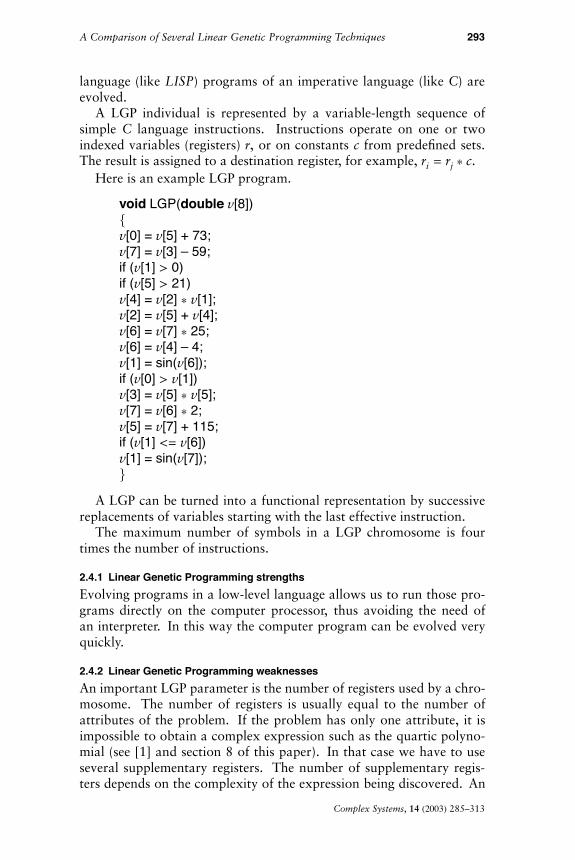
language (like LISP) programs of an imperative language (like C) areevolved.
A LGP individual is represented by a variable-length sequence ofsimple C language instructions. Instructions operate on one or twoindexed variables (registers) r, or on constants c from predefined sets.The result is assigned to a destination register, for example, ri % rj ! c.
Here is an example LGP program.
void LGP(double v[8]){v[0] = v[5] + 73;v[7] = v[3] – 59;if (v[1] > 0)if (v[5] > 21)v[4] = v[2] ! v[1];v[2] = v[5] + v[4];v[6] = v[7] ! 25;v[6] = v[4] – 4;v[1] = sin(v[6]);if (v[0] > v[1])v[3] = v[5] ! v[5];v[7] = v[6] ! 2;v[5] = v[7] + 115;if (v[1] <% v[6])v[1] = sin(v[7]);}
A LGP can be turned into a functional representation by successivereplacements of variables starting with the last effective instruction.
The maximum number of symbols in a LGP chromosome is fourtimes the number of instructions.
2.4.1 Linear Genetic Programming strengthsEvolving programs in a low-level language allows us to run those pro-grams directly on the computer processor, thus avoiding the need ofan interpreter. In this way the computer program can be evolved veryquickly.
2.4.2 Linear Genetic Programming weaknessesAn important LGP parameter is the number of registers used by a chro-mosome. The number of registers is usually equal to the number ofattributes of the problem. If the problem has only one attribute, it isimpossible to obtain a complex expression such as the quartic polyno-mial (see [1] and section 8 of this paper). In that case we have to useseveral supplementary registers. The number of supplementary regis-ters depends on the complexity of the expression being discovered. An
Complex Systems, 14 (2003) 285–313
294 M. Oltean and C. Grosan
inappropriate choice can have disastrous effects on the program beingevolved.
2.5 Discussion on individual representation
One of the most common problems that arises in a GP system is “bloat”[16], that is, the tendency of GP individuals to grow in size withoutincreasing in quality [17]. Bloat slows down the evolutionary searchand takes a lot of memory, making unprotected GP systems useless afteronly a few generations. Several mechanisms for preventing bloat havebeen proposed. Two of them are: maximal depth restriction [1] andparsimony pressure [17].
To avoid bloat, MEP and GEP use fixed-length chromosomes. LGPuses variable-size chromosomes that are limited to a maximum numberof instructions (genes). Standard GE does not use any mechanism toprevent bloat. However, in order to provide a fair comparison, in all ofthe experiments performed in this paper, the size of the GE chromosomeshas been limited to the same number of symbols employed by the MEP,GEP, and LGP techniques.
3. Selection
Several selection strategies (e.g., binary tournament or roulette wheel)have been tested with the considered techniques. GEP has been tested[7] with a special selection strategy that reduces the selection range asthe search process advances.
However, in order to provide a fair comparison, in all experimentsperformed in this paper MEP, GE, LGP, and GEP use the same binarytournament selection strategy.
4. Genetic operators
In this section, genetic operators used with MEP, GEP, GE, and LGPare described. By applying specific genetic operators MEP, GEP, andLGP offspring are always syntactically correct expressions (computerprograms). GE offspring may sometimes encode invalid individualsthat are generated by an incomplete mapping process.
4.1 Multi-Expression Programming
The search operators used within the MEP algorithm are recombina-tion and mutation. These search operators preserve the chromosomestructure. All of the offspring are syntactically correct expressions.
4.1.1 RecombinationBy recombination, two parents exchange genetic materials in order toobtain two offspring. Several variants of recombination have been
Complex Systems, 14 (2003) 285–313

A Comparison of Several Linear Genetic Programming Techniques 295
considered and tested within our MEP implementation: one-point re-combination, two-point recombination, and uniform recombination.One-point recombination is used in the experiments performed in thispaper. By applying the recombination operator, one crossover pointis randomly chosen and the parents exchange the sequences after thecrossover point.
4.1.2 MutationEvery MEP gene may be subject to mutation. The first gene of a chro-mosome must encode a terminal symbol in order to preserve the consis-tency of the chromosome. There is no restriction in symbols changingfor other genes.
If the current gene encodes a terminal symbol it may be changed intoanother terminal symbol or into a function symbol. In the latter case,the positions indicating the function arguments are also generated bymutation.
If the current gene encodes a function, the former may be mutatedinto a terminal symbol or into another function (function symbol andpointers towards arguments).
4.2 Gene Expression Programming
Chromosomes are modified by mutation, transposition, root transposi-tion, gene transposition, gene recombination, one-point recombination,and two-point recombination. A detailed description of the GEP geneticoperators can be found in [7]. The one-point recombination and pointmutation operators are the only ones used and described in this paper.
4.2.1 RecombinationThe one-point recombination operator in the GEP representation isanalogous to the corresponding binary representation operator. Twoparents and one cut-point are chosen. Two offspring are obtained fromthe parents, by exchanging genetic material according to the cut-point.
4.2.2 MutationAny symbol may be changed with any other symbol in the head ofthe chromosome. Terminal symbols may only be changed into otherterminal symbols in the chromosome’s tail.
4.3 Grammatical Evolution
Standard binary genetic operators (point mutation and two-point cross-over) are used with GE [5]. GE also makes use of a duplication operatorthat duplicates a random number of codons and inserts them into thepenultimate codon position on the genome.
Complex Systems, 14 (2003) 285–313
296 M. Oltean and C. Grosan
4.4 Linear Genetic Programming
The variation operators are crossover and mutation.
4.4.1 RecombinationLGP uses two-point string crossover [8]. A segment of random positionand random length is selected in both parents and exchanged betweenthem. If one of the resulting offspring would exceed the maximumlength, crossover is abandoned and restarted by exchanging equally-sized segments.
4.4.2 MutationAn operand or an operator of an instruction is changed by mutationinto another symbol over the same set.
LGP also employs a special kind of mutation (called macro mutation)which deletes or inserts an entire instruction.
5. Evolutionary scheme
In this section, the evolutionary algorithms employed by MEP, GEP,GE, and LGP are described. All the considered algorithms start witha randomly chosen population of individuals. Each individual in thecurrent population is evaluated by using a fitness function that dependson the problem being solved.
5.1 Multi-Expression Programming
MEP uses a steady-state [18] evolutionary scheme. The initial popu-lation is randomly generated. The following steps are repeated until atermination criterion is reached: two parents are selected (out of fourindividuals) using binary tournament and are recombined in order toobtain two offspring. The offspring are considered for mutation. Thebest offspring replaces the worst individual in the current population ifthe offspring is better than the latter.
5.2 Gene Expression Programming
GEP uses a generational algorithm. The initial population is randomlygenerated. The following steps are repeated until a termination criterionis reached: A fixed number of the best individuals enter the next gen-eration (elitism). The mating pool is filled by using binary tournamentselection. The individuals from the mating pool are randomly pairedand recombined. Two offspring are obtained by recombining two par-ents. The offspring are mutated and they enter the next generation.
5.3 Grammatical Evolution
GE uses a steady-state [18] algorithm (similar to the MEP algorithm).
Complex Systems, 14 (2003) 285–313

A Comparison of Several Linear Genetic Programming Techniques 297
5.4 Linear Genetic Programming
LGP uses a modified steady-state algorithm. The initial populationis randomly generated. The following steps are repeated until a ter-mination criterion is reached: Four individuals are randomly selectedfrom the current population. The best two of them are considered thewinners of the tournament and will act as parents. The parents arerecombined and the offspring are mutated and then replace the losersof the tournament.
6. Fitness assignment
The fitness assignment strategies employed by MEP, GEP, GE, and LGPare described in this section.
6.1 Multi-Expression Programming
MEP uses a special kind of fitness assignment. The value of each ex-pression encoded in a chromosome is computed during the individualevaluation (in concordance to the description given in section 2, a MEPindividual encodes a number of expressions equal to the number of itsgenes). This evaluation is performed by reading the chromosome onlyonce and storing partial results by using dynamic programming [19].The best expression is chosen to represent the chromosome (i.e., toassign the fitness of the chromosome).
Thus, the fitness of a MEP chromosome may be computed by usingthe formula:
f % mink%1,L
+,,,-,,,.
N!j%1
)Ej &Okj )/,,,0,,,1
,
where N is the number of fitness cases, Okj is the value returned (for
the jth fitness case) by the kth expression encoded in the current chro-mosome, L is the number of chromosome genes, and Ej is the expectedvalue for the fitness case j.
6.2 Gene Expression Programming
In [7] the fitness of a GEP chromosome was expressed by the equation:
f %N!
j%1
(M & )Oj & Ej)),
where M is the selection range (see [7] for more information), Oj is thevalue returned by a chromosome for the fitness case j, and Ej is theexpected value for the fitness case j.
Complex Systems, 14 (2003) 285–313

298 M. Oltean and C. Grosan
6.3 Grammatical Evolution
The fitness of a GE individual may be computed using the equation:
f %N!
j%1
()Oj & Ej)),
with the same parameters as above.
6.4 Linear Genetic Programming
The fitness of a LGP individual may be computed by using the equation:
f %N!
j%1
()Oj & Ej)),
with the same parameters as above.
6.5 The complexity of the fitness assignment process
The complexity of the MEP, GEP, GE, and LGP fitness assignment pro-cess for solving symbolic regression problems is O(NG), where NG isthe number of genes in a chromosome.
When solving symbolic regression problems, the MEP algorigthmdoes not have a higher complexity than the other GP techniques thatencode a single expression in each chromosome [3]. This is due to itsspecial mechanism used for expression evaluation.
7. Exceptions handling
Exceptions are conditions that require special handling. They can in-clude errors such as division by zero, overflow and underflow (that arisewhen variable storage capacity is exceeded), invalid arguments, and soon. Exception handling is a mechanism that recognizes and fixes errors.
The exception handling techniques employed by the compared evo-lutionary algorithms are described in this section.
7.1 Multi-Expression Programming
When a gene generates an exception, that gene is automatically changed(mutated) into a randomly chosen terminal symbol. In this way noinfertile individual may enter the next generation. This exception han-dling mechanism allows changing the chromosome structure during theevaluation process. In this way the value of the currently evaluated geneis the only one which needs to be recomputed.
When the training examples are divided into three subsets (training,validation, and test sets [13]) the described exception handling mecha-nism is used only for the training stage. When applied for the validation
Complex Systems, 14 (2003) 285–313
A Comparison of Several Linear Genetic Programming Techniques 299
and test sets the expression may not be changed. If an exception oc-curs during the evaluation of these subsets it is recommended as thecorresponding gene to return a predefined value (e.g., 1.0).
7.2 Gene Expression Programming
If an instruction contained in a chromosome generates an exception,that chromosome will be considered invalid and it will receive the lowestfitness possible.
7.3 Grammatical Evolution
GE uses a protected exception handling mechanism [1]; that is, if asubexpression generates an exception, the result of that subexpressionwill be a predefined (symbolic) value (e.g., for division by zero thepredefined result may be 1.0).
7.4 Linear Genetic Programming
LGP uses a protected exception handling mechanism like that usedby GE.
8. Numerical experiments
Several numerical experiments with MEP, GEP, GE, and LGP are carriedout in this section. Five test problems are chosen for these experiments.Three of them are artificially constructed. The other two problems con-tain real-world data and have been taken from PROBEN1 [13] (whichhave been adapted from UCI Machine Learning Repository [20]).
Each problem taken from PROBEN1 has three versions. The first onereflects the task formulation as it was provided by the collectors, andthe other two are random permutations of the examples, simplifying theproblem to one of interpolation.
8.1 Test problems
In this section, five test problems used in the numerical experiments aredescribed.
T1. Find a function that best satisfies a set of fitness cases generatedby the quartic polynomial [1] function
f1(x) % x4 # x3 # x2 # x.
T2. Find a function that best satisfies a set of fitness cases generatedby the function
f2(x) % sin(x4 # x2).
Complex Systems, 14 (2003) 285–313

300 M. Oltean and C. Grosan
T3. Find a function that best satisfies a set of fitness cases generatedby the function
f3(x) % sin(exp(sin(exp(sin(x))))).
The set of fitness cases for these problems was generated using (forthe variable x) 20 randomly chosen values in the interval [0, 10].
T4. Building. The purpose of this problem is to predict the electricpower consumption in a building. The problem was originally designedfor predicting the hourly consumption of hot and cold water and electri-cal energy based on the date, time of day, outdoor temperature, outdoorair, humidity, solar radiation, and wind speed. In this paper, the originalproblem was split into three subproblems (predicting the consumptionof electrical power, hot water, and cold water) because not all GP tech-niques are designed for handling multiple outputs of a problem. Theprediction of cold water consumption is the only one considered here.The other two problems (the prediction of hot water and power con-sumption) may be handled in a similar manner.
The “Building” problem has 14 inputs restricted to the interval [0, 1].The data set contains 4208 examples [13].
In PROBEN1 three different variants of each dataset are given con-cerning the order of the examples. This increases the confidence thatresults do not depend on a certain distribution of the data into training,validation, and test sets. The original problem is called Building1 andthe other two versions are called Building2 and Building3.
T5. Heartac. The purpose of this problem is to predict heart disease.More specifically we have to compute how many vessels (out of four)are reduced in diameter by more than 50%. The decision is made basedon personal data such as age, sex, smoking or nonsmoking habits, thesubjective pain descriptions provided by the patient, and the results ofvarious medical examinations such as blood pressure and electrocardio-gram results.
The dataset has 35 inputs and contains 303 examples. The data wereprovided by the V. A. Medical Center, Long Beach and Cleveland ClinicFoundation: Robert Detrano, M.D., Ph.D.
The original problem is called Heartac1 and the other two versionsare called Heartac2 and Heartac3.
8.2 General parameter settings
In all the experiments performed in this paper MEP, GEP, and LGP usethe same set of function symbols. The set of function symbols is:
F % '#,&, !, /, sin, exp(.
For the first three test problems the set of terminal symbols is:
T % 'x(.
Complex Systems, 14 (2003) 285–313
A Comparison of Several Linear Genetic Programming Techniques 301
and for the real-world problems the terminal set consists of the probleminputs.
The grammar used by GE is:
GGE % 'N, T, S, P(,
where the terminal set is:
T % '#,&, !, /, sin, exp, (, )(,
and the nonterminal symbols are:
N % 'expr, op, pre op(.
The start symbol is:
S % <expr>.
The production rules P are:
<expr> $$% <expr><op><expr>)(<expr><op><expr>))<pre op>(<expr>))<var>.
<op> $$% #) & ) ! )/.<pre op> $$% sin)exp.
Binary tournament selection is used in all of the experiments by thecompared techniques.
One-point crossover is used by GEP, MEP, and GE with a probabilityof pcross % 0.9. A LGP-specific crossover operator is also applied witha probability of pcross % 0.9. The mutation probability was set to twomutations per chromosome. Four supplementary registers were used inall of the LGP experiments. 100 runs were carried out for all the testproblems.
Since MEP, GEP, GE, and LGP use different chromosome representa-tions we cannot make a direct comparison based on chromosome length.Instead we provide a comparison based on the number of symbols in achromosome.
The first position of a MEP chromosome is always a terminal symbol.Thus, the maximum number of symbols in a MEP chromosome is givenby the formula:
Number of Symbols % 3 !Number of Genes & 2.
A GEP chromosome consists of a single gene with head length h.Thus, the overall number of symbols in a GEP chromosome is (2h # 1).
The GE chromosomes are binary strings. The groups made up ofeight consecutive bits are called codons. The number of symbols in
Complex Systems, 14 (2003) 285–313

302 M. Oltean and C. Grosan
Parameter ValuePopulation size 100Number of symbols inchromosome
58 (20 MEP genes, 29 GEP chromosome headlength, 58 GE codons, 15 LGP instructions).
Table 1. Parameters for Experiment 1.
the GE chromosomes is considered to be the number of codons. Themaximum number of symbols in a LGP chromosome is four times thenumber of instructions.
Since the GE and LGP individuals have variable length we shall startwith shorter individuals whose length will increase as the search processadvances. The maximum initial number of the GE and LGP symbolsis set to be about 2/3 of the maximum permitted number of symbolsin the GE and LGP chromosomes. The length of the LGP and GEchromosomes may increase as an effect of the crossover operator [5, 8].The GEP selection range (see [7] and section 6 this paper) is 100%. Tenwrappings are allowed for the GE chromosomes.
8.3 Experiment 1
In this experiment, the relationship between the success rate of MEP,GEP, GE, and LGP algorithms and the number of generations is ana-lyzed.
The success rate is computed as:
Success rate %Number of successful runs
Total number of runs.
The algorithm parameters for MEP, GEP, GE, and LGP are given inTable 1. The success rate of the MEP, GEP, GE, and LGP algorithmsdepending on the number of generations is depicted in Figure 1.
As can be seen in Figure 1, MEP and LGP have the best overallbehavior. For the test problems T1 and T2 MEP has the best success.LGP has the best behavior for the third test problem and is followed byMEP. GE and GEP have equally good behaviors for all considered testproblems.
8.4 Experiment 2
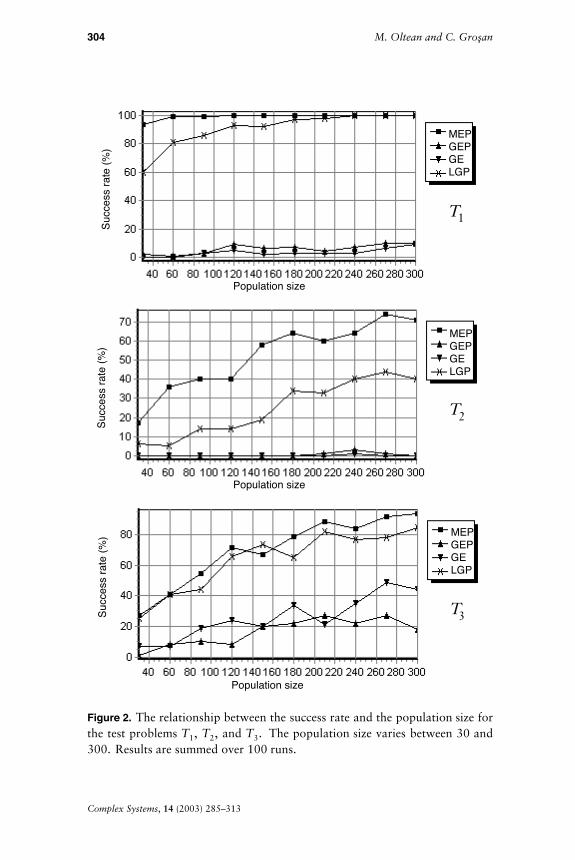
In this experiment the relationship between the success rate and the pop-ulation size is analyzed. The algorithm parameters for this experimentare given in Table 2. Experiment results are depicted in Figure 2.
MEP and LGP perform better than GE and GEP for all test problemsand for all considered population sizes. For test problem T1 the MEPsuccess rate is 100% (for all populations larger than 60 individuals).MEP has the best success rate for the second test problem. GEP and
Complex Systems, 14 (2003) 285–313

A Comparison of Several Linear Genetic Programming Techniques 303
Figure 1. The relationship between the success rate and the number of genera-tions for the test problems T1, T2, and T3. The number of generations variesbetween 50 and 500. Results are summed over 100 runs.
Complex Systems, 14 (2003) 285–313
304 M. Oltean and C. Grosan
Figure 2. The relationship between the success rate and the population size forthe test problems T1, T2, and T3. The population size varies between 30 and300. Results are summed over 100 runs.
Complex Systems, 14 (2003) 285–313

A Comparison of Several Linear Genetic Programming Techniques 305
Parameter ValueNumber of generations 100Number of symbols inchromosome
58 symbols (20 MEP genes, 29 GEP chromo-some head length, 58 GE codons, 15 LGP in-structions)
Table 2. Parameters for Experiment 2.
GE are not able to solve this problem in a satisfactory manner, having asuccess rate of less than 10%. For test problem T3 LGP and MEP havesimilar success rates followed by GE.
8.5 Experiment 3
The test problems considered in this experiment are the problems Build-ing and Heartac taken from PROBEN1 [13]. Each dataset is dividedinto three subsets (training set, 50%; validation set, 25%; and test set,25%) [13].
A method called early stopping is used to avoid overfitting of thepopulation individuals to the particular training examples used [13].This method consists of computing the test set performance for thatchromosome having the smallest validation error during the search pro-cess. The generalization performance will be increased by using earlystopping.
The error function reported in this experiment is:
E % 1001N
N!i%1
""""ei & oi"""",
where ei is the expected output value (the value that must be predicted),oi is the obtained value (the value obtained by the best individual) forthe ith example, and N is the number of examples.
The standard deviation of the obtained values (over 100 runs) is alsocomputed in conjunction with the error. Minimal and maximal errorvalues of the best individual over all runs are also reported.
Each algorithm uses a population of 100 individuals with 100 sym-bols (100 GE codons, 34 MEP genes, 49 GEP chromosome head length,and 25 LGP instructions). 100 runs of 100 generations were carried outfor each algorithm and for each test problem.
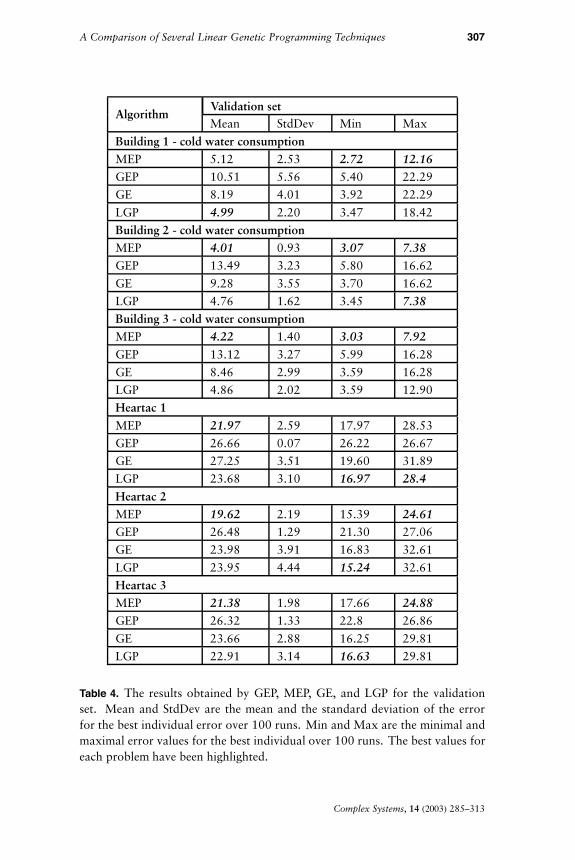
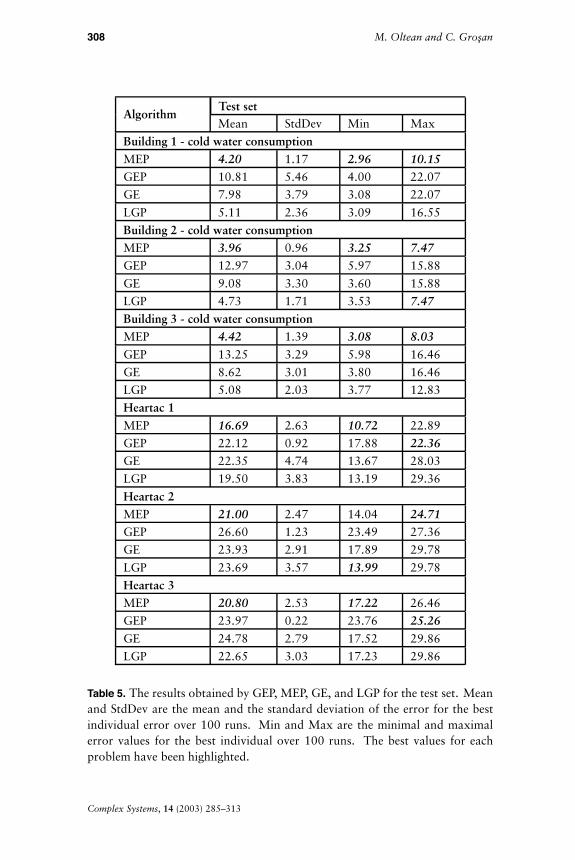
The results obtained by MEP, GEP, GE, and LGP are presented inTables 3 (for the training set), 4 (for the validation set), and 5 (for thetest set).
MEP and LGP have the best mean values for the training, validation,and test sets. However, MEP has the best mean error for the test setthus providing the best generalization ability. The lowest maximal and
Complex Systems, 14 (2003) 285–313

306 M. Oltean and C. Grosan
AlgorithmTraining setMean StdDev Min Max
Building 1 - cold water consumptionMEP 3.81 0.70 3.19 5.62GEP 12.59 3.39 6.98 17.98GE 9.00 3.88 3.57 17.98LGP 4.53 1.86 2.79 15.24Building 2 - cold water consumptionMEP 4.00 0.96 3.06 7.56GEP 13.34 3.14 6.01 16.32GE 9.26 3.41 3.65 16.32LGP 4.77 1.70 3.54 7.56Building 3 - cold water consumptionMEP 4.18 1.28 3.11 7.74GEP 13.06 3.28 5.91 16.20GE 8.31 3.02 3.61 16.20LGP 4.77 1.92 3.57 12.97Heartac 1MEP 19.31 1.91 15.47 23.14GEP 25.12 0.68 22.15 25.30GE 23.87 2.60 17.51 26.83LGP 21.50 3.05 16.02 28.22Heartac 2MEP 20.01 2.30 15.66 23.57GEP 23.94 0.19 23.18 24.03GE 23.21 2.05 18.10 26.30LGP 22.32 2.83 15.28 26.30Heartac 3MEP 18.97 2.42 14.15 23.14GEP 23.97 0.83 20.90 24.28GE 22.56 2.74 15.80 28.01LGP 20.15 3.89 12.96 28.01
Table 3. Results obtained by GEP, MEP, GE, and LGP for the training set. Meanand StdDev are the mean and the standard deviation of the error for the bestindividual error over 100 runs. Min and Max are the minimal and maximalerror values for the best individual over 100 runs. The best values for eachproblem have been highlighted.
Complex Systems, 14 (2003) 285–313
A Comparison of Several Linear Genetic Programming Techniques 307
AlgorithmValidation setMean StdDev Min Max
Building 1 - cold water consumptionMEP 5.12 2.53 2.72 12.16GEP 10.51 5.56 5.40 22.29GE 8.19 4.01 3.92 22.29LGP 4.99 2.20 3.47 18.42Building 2 - cold water consumptionMEP 4.01 0.93 3.07 7.38GEP 13.49 3.23 5.80 16.62GE 9.28 3.55 3.70 16.62LGP 4.76 1.62 3.45 7.38Building 3 - cold water consumptionMEP 4.22 1.40 3.03 7.92GEP 13.12 3.27 5.99 16.28GE 8.46 2.99 3.59 16.28LGP 4.86 2.02 3.59 12.90Heartac 1MEP 21.97 2.59 17.97 28.53GEP 26.66 0.07 26.22 26.67GE 27.25 3.51 19.60 31.89LGP 23.68 3.10 16.97 28.4Heartac 2MEP 19.62 2.19 15.39 24.61GEP 26.48 1.29 21.30 27.06GE 23.98 3.91 16.83 32.61LGP 23.95 4.44 15.24 32.61Heartac 3MEP 21.38 1.98 17.66 24.88GEP 26.32 1.33 22.8 26.86GE 23.66 2.88 16.25 29.81LGP 22.91 3.14 16.63 29.81
Table 4. The results obtained by GEP, MEP, GE, and LGP for the validationset. Mean and StdDev are the mean and the standard deviation of the errorfor the best individual error over 100 runs. Min and Max are the minimal andmaximal error values for the best individual over 100 runs. The best values foreach problem have been highlighted.
Complex Systems, 14 (2003) 285–313
308 M. Oltean and C. Grosan
AlgorithmTest setMean StdDev Min Max
Building 1 - cold water consumptionMEP 4.20 1.17 2.96 10.15GEP 10.81 5.46 4.00 22.07GE 7.98 3.79 3.08 22.07LGP 5.11 2.36 3.09 16.55Building 2 - cold water consumptionMEP 3.96 0.96 3.25 7.47GEP 12.97 3.04 5.97 15.88GE 9.08 3.30 3.60 15.88LGP 4.73 1.71 3.53 7.47Building 3 - cold water consumptionMEP 4.42 1.39 3.08 8.03GEP 13.25 3.29 5.98 16.46GE 8.62 3.01 3.80 16.46LGP 5.08 2.03 3.77 12.83Heartac 1MEP 16.69 2.63 10.72 22.89GEP 22.12 0.92 17.88 22.36GE 22.35 4.74 13.67 28.03LGP 19.50 3.83 13.19 29.36Heartac 2MEP 21.00 2.47 14.04 24.71GEP 26.60 1.23 23.49 27.36GE 23.93 2.91 17.89 29.78LGP 23.69 3.57 13.99 29.78Heartac 3MEP 20.80 2.53 17.22 26.46GEP 23.97 0.22 23.76 25.26GE 24.78 2.79 17.52 29.86LGP 22.65 3.03 17.23 29.86
Table 5. The results obtained by GEP, MEP, GE, and LGP for the test set. Meanand StdDev are the mean and the standard deviation of the error for the bestindividual error over 100 runs. Min and Max are the minimal and maximalerror values for the best individual over 100 runs. The best values for eachproblem have been highlighted.
Complex Systems, 14 (2003) 285–313
A Comparison of Several Linear Genetic Programming Techniques 309
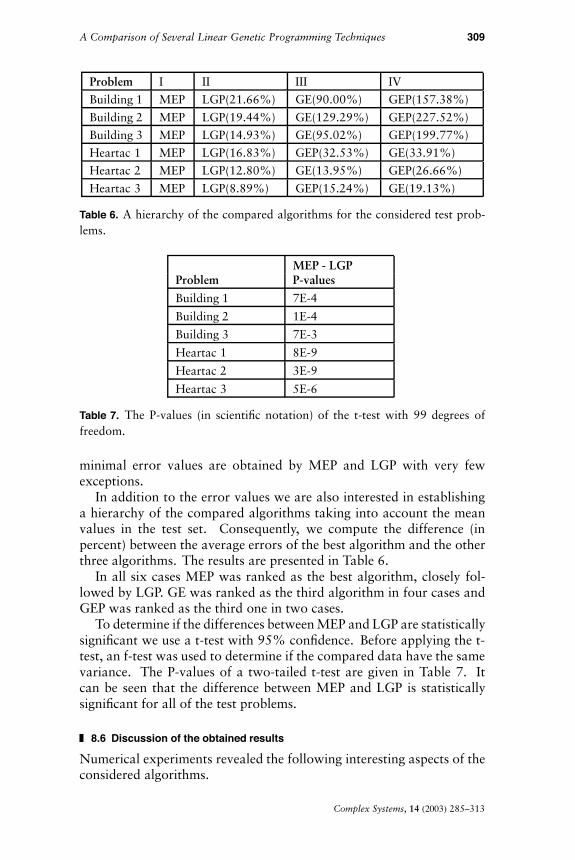
Problem I II III IVBuilding 1 MEP LGP(21.66%) GE(90.00%) GEP(157.38%)Building 2 MEP LGP(19.44%) GE(129.29%) GEP(227.52%)Building 3 MEP LGP(14.93%) GE(95.02%) GEP(199.77%)Heartac 1 MEP LGP(16.83%) GEP(32.53%) GE(33.91%)Heartac 2 MEP LGP(12.80%) GE(13.95%) GEP(26.66%)Heartac 3 MEP LGP(8.89%) GEP(15.24%) GE(19.13%)
Table 6. A hierarchy of the compared algorithms for the considered test prob-lems.
MEP - LGPProblem P-valuesBuilding 1 7E-4Building 2 1E-4Building 3 7E-3Heartac 1 8E-9Heartac 2 3E-9Heartac 3 5E-6
Table 7. The P-values (in scientific notation) of the t-test with 99 degrees offreedom.
minimal error values are obtained by MEP and LGP with very fewexceptions.
In addition to the error values we are also interested in establishinga hierarchy of the compared algorithms taking into account the meanvalues in the test set. Consequently, we compute the difference (inpercent) between the average errors of the best algorithm and the otherthree algorithms. The results are presented in Table 6.
In all six cases MEP was ranked as the best algorithm, closely fol-lowed by LGP. GE was ranked as the third algorithm in four cases andGEP was ranked as the third one in two cases.
To determine if the differences between MEP and LGP are statisticallysignificant we use a t-test with 95% confidence. Before applying the t-test, an f-test was used to determine if the compared data have the samevariance. The P-values of a two-tailed t-test are given in Table 7. Itcan be seen that the difference between MEP and LGP is statisticallysignificant for all of the test problems.
8.6 Discussion of the obtained results
Numerical experiments revealed the following interesting aspects of theconsidered algorithms.
Complex Systems, 14 (2003) 285–313

310 M. Oltean and C. Grosan
1. MEP has the best overall behavior on the considered test problems. How-ever, MEP cannot be the best for all test problems. According to the“no free lunch theorems for search and optimization” [15, 21], severalsituations where the other algorithms are better than MEP have beenidentified.
2. The systems that use chromosomes of variable length (such as LGP, GE,and MEP) seem to perform better than the systems that use fixed-lengthchromosomes (such as GEP). MEP uses fixed-length chromosomes, butits ability to store multiple solutions in a single chromosome works as aprovider of variable-length chromosomes.
3. Test problem T2 is the most difficult. For this problem GE and GEPyield many 0% success rates. We made another numerical experimentwith only GE and GEP. We removed the sin function from the problemdefinition and also removed the operators sin and exp from the GEPfunction set and from the GE productions. In this case the GEP andGE performance improved substantially, yielding many success rates over90%. It seems that adding the sin and exp operators greatly reshaped thesearch space. The same very good results have been obtained by GE andGEP (using the modified set of functions) for the test problem T1.
4. For the real-world problems (Building and Heartac), MEP has the bestresults, in terms of mean error, seconded by LGP.
In order to provide a fair comparison several adjustments have beenmade to each algorithm, which could lead to some poor behavior. How-ever, we have to keep in mind that each minor factor (such as themutation and crossover probability) could affect the quality of the com-parison presented in this paper.
There are some modifications that can be made in order to improvethe quality of the considered algorithms. For instance, GE performancecould be improved if we allow chromosomes of any length to appear inthe system. However, this feature could lead to bloat [16]. Another im-provement to GE can be made by increasing the number of mutations perchromosome. We increased this number to 20 mutations/chromosomeand obtained, for test problem T1 (using the parameters given in sec-tion 8.5), a success rate of 21% using a population of 30 individualsand a success rate of 35% using a population of 60 individuals.
GEP performance could be improved by using the multigenic system.However, as indicated in section 2.2.2, this system has some weaknessesand requires multiple trials to find the optimal number of genes in achromosome. Another improvement to GEP can be made by settingthe number of symbols in a chromosome to an optimal value. Wereduced this number to eight symbols in the GEP chromosome head andobtained, for test problem T1 (using the parameters given in section 8.5),a success rate of 42% using a population of 30 individuals and a successrate of 49% using a population of 60 individuals. We could not use this
Complex Systems, 14 (2003) 285–313
A Comparison of Several Linear Genetic Programming Techniques 311
number of symbols in a chromosome (17) because the correspondingLGP chromosome would be too short to encode a solution for theconsidered test problems.
The performance of the considered algorithms could be improved bychoosing other parameters for the numerical experiments. This couldinclude the fine tuning of all algorithm parameters for a given problem.An example is GEP, which has been proved to be quite sensitive tochromosome length [7]. Other changes could affect the function set (byextending it with other functions or by reducing it to an optimal subsetof function symbols). As mentioned before, GEP and GE perform verywell for the test problem T1 if we remove the unary operators (sin andexp) from the function set, respectively from the GE production rules.
Implementation of the algorithm-specific features to other algorithmswould also be of interest. For instance, the multi-expression paradigmcould be implemented and tested within other evolutionary techniquessuch GEP, GE, and LGP.
Another reason that MEP and LGP perform better than GE and GEPcould be due to their code-reuse ability. Standard Genetic Program-ming employs this feature by using the Automatically Defined Functions(ADFs) mechanism [2].
9. Conclusions and future work
A systematic comparison of four evolutionary techniques for solvingsymbolic regression problems has been presented in this paper. All as-pects of the compared techniques have been analyzed. Several numericalexperiments have been performed using five test problems.
Further efforts will focus on comparing the considered techniques onthe basis of more optimization problems.
Acknowledgments
The authors are grateful to anonymous referees for their constructivecomments and criticism of earlier versions of this paper.
References
[1] J. R. Koza, Genetic Programming: On the Programming of Computersby Means of Natural Selection (MIT Press, Cambridge, MA, 1992).
[2] J. R. Koza, Genetic Programming II: Automatic Discovery of ReusableSubprograms (MIT Press, Cambridge, MA, 1994).
[3] M. Oltean and D. Dumitrescu, “Multi Expression Programming,” Tech-nical Report UBB-01 (available from www.mep.cs.ubbcluj.ro, 2002).
Complex Systems, 14 (2003) 285–313
312 M. Oltean and C. Grosan
[4] M. Oltean and C. Grosan, “Evolving Evolutionary Algorithms by usingMulti Expression Programming,” in The Seventh European Conference onArtificial Life, edited by W. Banzhaf (et. al), LNAI 2801 (Springer-Verlag,Berlin, 2003).
[5] C. Ryan, J. J. Collins, and M. O’Neill, “Grammatical Evolution: EvolvingPrograms for an Arbitrary Language,” in Proceedings of the First Euro-pean Workshop on Genetic Programming, edited by W. Banzhaf, R. Poli,M. Schoenauer, and T. C. Fogarty (Springer-Verlag, Berlin, 1998).
[6] C. Ryan and M. O’Neill, “Grammatical Evolution: A Steady StateApproach,” in Late Breaking Papers, Genetic Programming, edited byJ. R. Koza (University of Wisconsin, Madison, Wisconsin, 1998).
[7] C. Ferreira, “Gene Expression Programming: A New Adaptive Algorithmfor Solving Problems,” Complex Systems, 13 (2001) 87–129.
[8] M. Brameier and W. Banzhaf, “A Comparison of Linear Genetic Program-ming and Neural Networks in Medical Data Mining,” IEEE Transactionson Evolutionary Computation, 5 (2001) 17–26.
[9] M. Brameier and W. Banzhaf, “Explicit Control of Diversity and EffectiveVariation Distance in Linear Genetic Programming,” in Proceedings ofthe Fourth European Conference on Genetic Programming, edited byE. Lutton, J. Foster, J. Miller, C. Ryan, and A. Tettamanzi (Springer-Verlag, Berlin, 2002).
[10] J. Miller and P. Thomson, “Cartesian Genetic Programming,” in Proceed-ings of the Third European Conference on Genetic Programming, editedby Riccardo Poli, Wolfgang Banzhaf, Bill Langdon, Julian Miller, PeterNordin, and Terence C. Fogarty (Springer-Verlag, Berlin, 2002).
[11] N. Patterson, Genetic Programming with Context-Sensitive Grammars,Ph.D. Thesis, School of Computer Science, University of Scotland (2002).
[12] W. Banzhaf, “Genotype-Phenotype-Mapping and Neutral Variation: ACase Study in Genetic Programming,” in Proceedings of the Third In-ternational Conference on Parallel Problem Solving from Nature, editedby Y. Davidor, H.-P. Schwefel, and R. Manner (Springer-Verlag, Berlin,1994).
[13] L. Prechelt, “PROBEN1: A Set of Neural Network Problemsand Benchmarking Rules,” Technical Report 21, (1994), Univer-sity of Karlsruhe, (available from ftp://ftp.cs.cmu.edu/afs/cs/project/connect/bench/contrib/prechelt/proben1.tar.gz).
[14] A. Aho, R. Sethi, and J. Ullman, Compilers: Principles, Techniques, andTools (Addison-Wesley, Reading, MA, 1986).
[15] D. H. Wolpert and W. G. Macready, “No Free Lunch Theorems forSearch,” Technical Report SFI-TR-05-010, Santa Fe Institute, 1995 (avail-able from ftp://ftp.santafe.edu/pub/dhwftp/nfl.search.TR.ps.Z).
Complex Systems, 14 (2003) 285–313
A Comparison of Several Linear Genetic Programming Techniques 313
[16] W. Banzhaf and W. B. Langdon, “Some Considerations on the Reason forBloat,” Genetic Programming and Evolvable Machines, 3 (2002) 81–91.
[17] S. Luke and L. Panait, “Fighting Bloat with Nonparametric ParsimonyPressure,” in Proceedings of the Seventh International Conference onParallel Problem Solving from Nature, edited by J. J. Merelo Guer-vos, P. Adamidis, H-G. Beyer, J. L. Fernandez-Villacanas Martin, andH-P. Schwefel (Springer-Verlag, Berlin, 2002).
[18] G. Syswerda, “Uniform Crossover in Genetic Algorithms,” in Proceedingsof the Third International Conference on Genetic Algorithms, edited byJ. D. Schaffer (Morgan Kaufmann Publishers, San Mateo, CA, 1989).
[19] R. Bellman, Dynamic Programming (Princeton University Press, New Jer-sey, 1957).
[20] UCI Machine Learning Repository (available fromwww.ics.uci.edu/2mlearn/MLRepository.html)
[21] D. H. Wolpert and W. G. Macready, “No Free Lunch Theorems for Op-timization,” IEEE Transaction on Evolutionary Computation, 1 (1997)67–82.
Complex Systems, 14 (2003) 285–313


![A COMPARISON OF GENETIC ALGORITHMS, PARTI ... › PIERB › pierb13 › 09.09011308.pdfalgorithms include Genetic Algorithms (GA) [1{5], Particle Swarm Optimization (PSO) [11{13],](https://static.fdocuments.in/doc/165x107/5f0d0b167e708231d4386595/a-comparison-of-genetic-algorithms-parti-a-pierb-a-pierb13-a-09-algorithms.jpg)