
A Comparison of Physical and Chemical Properties of...
16
ABSTRACT: Milk fat fractions from supercritical carbon diox- ide (SC-CO 2 ) extraction were compared with commercial melt crystallization (MC) fractions for their physical and chemical properties. The fractions were analyzed for fatty acids, triacyl- glycerols, cholesterol, total carotenoid content, and volatile compounds. The fractions were also evaluated for solid fat con- tent (SFC) by pulsed nuclear magnetic resonance and thermal profiles by differential scanning calorimeter (DSC). The distrib- ution of fatty acids and triacylglycerols in the fractions de- pended on the fractionation technique used. SC-CO 2 separated fractions based on molecular weight rather than on melting point, which is the driving force for the MC process. The differ- ences among the fractions were quantified from their SFC and DSC curves. Triacylglycerol profiles by high-performance liq- uid chromatography showed that the SC-CO 2 fractions were distinctly different from each other and from MC fractions. The SC-CO 2 solid fraction (super stearin) was the most unique. It had a high concentration of long-chain, unsaturated fatty acid- containing triacylglycerols in a narrow range of high molecular weight, indicating a homogeneity of this fraction that has not been attainable by other techniques. It was also enriched in β- carotene and was devoid of volatile compounds. As compared to liquid MC fractions, the liquid SC-CO 2 fraction had a high concentration of low-melting triacylglycerols and was enriched in volatile compounds. With SC-CO 2 , it is thus possible to si- multaneously fractionate and produce a flavor-rich concentrate at no extra processing cost. JAOCS 75, 1249–1264 (1998). KEY WORDS: Cholesterol, DSC, fatty acids, flavor, fractiona- tion, melt crystallization, milk fat, solid fat content, supercriti- cal CO 2 , triacylglycerol. New food products are being developed at a rapid rate and place high demands for more specialized fats and oils, cus- tomized to fit specific applications. Optimal fats, however, cannot always be obtained from nature. Milk fat can be sin- gled out from most other fats in that it has a broad molecular weight range of triacylglycerols (TAG), low (17 wt%), medium (50 wt%) and high (33 wt%), coupled with a pleas- ing aroma and taste (1). But, when these TAG are viewed as a single entity, they can and do limit the use of milk fat. Price and functionality are important factors that affect usage of milk fat: milk fat has the disadvantage of both high price and limited functionality compared to tailored vegetable fats and oils. Its flavor and its reputation as a natural product are the biggest advantages of milk fat. Moreover, milk fat is required for flavor in certain applications and high-quality foods, e.g., premium cookies and bakery products. Given milk fat’s limited functional and nutritional value, its enhanced utilization hinges on providing unique functionality through fractionation. The most common method of milk fat fractionation is by crystallization at different temperatures (melt crystallization, or MC), with or without solvents (2–5). The fractions obtained by dry fractionation, however, show dif- ferences in melt characteristics but relatively small variations in chemical composition (1). The use of solvents or surfactants improves separation by reducing entrainment, but these tech- niques are not environmentally friendly owing to problems re- lated to solvent removal and disposal. The fractions obtained have to be deodorized, which results in the loss of natural fla- vor compounds. To maximize milk fat utilization, the econom- ics of the process dictate that the fractions must differ markedly from one another in both chemical composition and physical characteristics. This approach calls for advanced separation technologies for new product and process development, aimed at the needs of existing and new markets. Supercritical carbon dioxide (SC-CO 2 ) fractionation holds promise as a means to turn milk fat into a value-added ingre- dient (6–8). So far, no comparative evaluation of physical and chemical properties of the milk fat fractions from these two techniques (MC and SC-CO 2 ) has been undertaken. This paper compares data from these two techniques. METHODS Fractionation by MC. Four different kinds of commercial MC fractions (AMF45, AMF30, AMF20, and AMF10) were ob- tained directly from S.A.N. Corman, Goé, Belgium. The frac- tions varied in their melting points from 45 to 10°C. The de- tails of the process conditions and yields of the fractions were not available. Further, each fraction could have been prepared from an individual batch. Fractionation by SC-CO 2 . The SC-CO 2 fractions were prepared in an in-house designed and built continuous pilot- Copyright © 1998 by AOCS Press 1249 JAOCS, Vol. 75, no. 10 (1998) *To whom correspondence should be addressed. E-mail: [email protected] A Comparison of Physical and Chemical Properties of Milk Fat Fractions Obtained by Two Processing Technologies A.R. Bhaskar a , S.S.H. Rizvi a, *, C. Bertoli b , L.B. Fay b , and B. Hug b a Institute of Food Science, Cornell University, Ithaca, New York 14853, and b Nestlé Research Centre, 1000 Lausanne 26, Switzerland
Transcript of A Comparison of Physical and Chemical Properties of...

ABSTRACT: Milk fat fractions from supercritical carbon diox-ide (SC-CO2) extraction were compared with commercial meltcrystallization (MC) fractions for their physical and chemicalproperties. The fractions were analyzed for fatty acids, triacyl-glycerols, cholesterol, total carotenoid content, and volatilecompounds. The fractions were also evaluated for solid fat con-tent (SFC) by pulsed nuclear magnetic resonance and thermalprofiles by differential scanning calorimeter (DSC). The distrib-ution of fatty acids and triacylglycerols in the fractions de-pended on the fractionation technique used. SC-CO2 separatedfractions based on molecular weight rather than on meltingpoint, which is the driving force for the MC process. The differ-ences among the fractions were quantified from their SFC andDSC curves. Triacylglycerol profiles by high-performance liq-uid chromatography showed that the SC-CO2 fractions weredistinctly different from each other and from MC fractions. TheSC-CO2 solid fraction (super stearin) was the most unique. Ithad a high concentration of long-chain, unsaturated fatty acid-containing triacylglycerols in a narrow range of high molecularweight, indicating a homogeneity of this fraction that has notbeen attainable by other techniques. It was also enriched in β-carotene and was devoid of volatile compounds. As comparedto liquid MC fractions, the liquid SC-CO2 fraction had a highconcentration of low-melting triacylglycerols and was enrichedin volatile compounds. With SC-CO2, it is thus possible to si-multaneously fractionate and produce a flavor-rich concentrateat no extra processing cost.JAOCS 75, 1249–1264 (1998).
KEY WORDS: Cholesterol, DSC, fatty acids, flavor, fractiona-tion, melt crystallization, milk fat, solid fat content, supercriti-cal CO2, triacylglycerol.
New food products are being developed at a rapid rate andplace high demands for more specialized fats and oils, cus-tomized to fit specific applications. Optimal fats, however,cannot always be obtained from nature. Milk fat can be sin-gled out from most other fats in that it has a broad molecularweight range of triacylglycerols (TAG), low (17 wt%),medium (50 wt%) and high (33 wt%), coupled with a pleas-ing aroma and taste (1). But, when these TAG are viewed as asingle entity, they can and do limit the use of milk fat. Price
and functionality are important factors that affect usage ofmilk fat: milk fat has the disadvantage of both high price andlimited functionality compared to tailored vegetable fats andoils. Its flavor and its reputation as a natural product are thebiggest advantages of milk fat. Moreover, milk fat is requiredfor flavor in certain applications and high-quality foods, e.g.,premium cookies and bakery products.
Given milk fat’s limited functional and nutritional value, itsenhanced utilization hinges on providing unique functionalitythrough fractionation. The most common method of milk fatfractionation is by crystallization at different temperatures(melt crystallization, or MC), with or without solvents (2–5).The fractions obtained by dry fractionation, however, show dif-ferences in melt characteristics but relatively small variationsin chemical composition (1). The use of solvents or surfactantsimproves separation by reducing entrainment, but these tech-niques are not environmentally friendly owing to problems re-lated to solvent removal and disposal. The fractions obtainedhave to be deodorized, which results in the loss of natural fla-vor compounds. To maximize milk fat utilization, the econom-ics of the process dictate that the fractions must differ markedlyfrom one another in both chemical composition and physicalcharacteristics. This approach calls for advanced separationtechnologies for new product and process development, aimedat the needs of existing and new markets.
Supercritical carbon dioxide (SC-CO2) fractionation holdspromise as a means to turn milk fat into a value-added ingre-dient (6–8). So far, no comparative evaluation of physical andchemical properties of the milk fat fractions from these twotechniques (MC and SC-CO2) has been undertaken. Thispaper compares data from these two techniques.
METHODS
Fractionation by MC. Four different kinds of commercial MCfractions (AMF45, AMF30, AMF20, and AMF10) were ob-tained directly from S.A.N. Corman, Goé, Belgium. The frac-tions varied in their melting points from 45 to 10°C. The de-tails of the process conditions and yields of the fractions werenot available. Further, each fraction could have been preparedfrom an individual batch.
Fractionation by SC-CO2. The SC-CO2 fractions wereprepared in an in-house designed and built continuous pilot-
Copyright © 1998 by AOCS Press 1249 JAOCS, Vol. 75, no. 10 (1998)
*To whom correspondence should be addressed.E-mail: [email protected]
A Comparison of Physical and Chemical Propertiesof Milk Fat Fractions Obtained by Two Processing Technologies
A.R. Bhaskara, S.S.H. Rizvia,*, C. Bertolib, L.B. Fayb, and B. Hugb
aInstitute of Food Science, Cornell University, Ithaca, New York 14853,and bNestlé Research Centre, 1000 Lausanne 26, Switzerland

scale SC-CO2 system. The extraction was done at 24.1MPa/40°C, and fractionation pressures and temperaturesranged from 17.2 to 6.9 MPa and 40 to 60°C, respectively.Table 1 shows the details of the fractionation conditions,along with the yields for the fractions. More details about thesystem have been published elsewhere (9).
Analyses. TAG spectra of the milk fat fractions were ana-lyzed by both gas–liquid chromatography (GLC) and reversed-phase high-performance liquid chromatography (HPLC). TheGLC analysis was done on a GC 8000 series chromatograph(Fisons Instruments, Rodano, Italy), equipped with flame-ion-ization detector (FID) (held at 380°C) and on-column injector.A fused-silica capillary column Permabond OV-1-DF-0.10, 10m × 0.32 mm i.d., film thickness 0.12 µm (Macherey-Nagel,Düren, Germany), was used. Data acquisition was carried outwith a Spectra Physics SP4100 integrator (Allschwil, Switzer-land). About 15 mg fat was dissolved in 100 mL hexane (cat.no 9262, J.T. Baker B.V., Deventer, Netherlands). The follow-ing program allowed separation of the TAG: 80°C iso 2 min,5°C/min to 200°C, 1 min iso, 5°C/min to 310°C, and 17 miniso. Carrier gas: hydrogen at 60 kPa.
The reversed-phase HPLC analysis was done with a Wa-ters system (625 LC system, 600 E system controller, 715ultra wisp sample processor; Waters, Le Mont-sur-Lausanne,Switzerland), combined with an evaporative light scatteringdetector model ACS 750/14 from Ercatech AG, Bern,Switzerland. Data acquisition and integration were performedwith the Maxima 825 software from Dynamic Solutions (Ven-tura, CA). About 200 mg of sample was dissolved in 10 mLof a 1:1 (vol/vol) blend of diethyl ether/toluene; injection vol-ume was 10 µL. Separation was performed at ambient tem-perature with two columns of LiChrospher 100RP-18, 4 × 250mm, 5 mm (E. Merck, Darmstadt, Germany) in series and abinary gradient of (i) acetonitrile/ethanol/hexane (2:2:1,vol/vol/vol) and (ii) acetonitrile. The linear gradient (1mL/min) was 50% A/50% B to 100% B in 120 min. All sol-vents were of HPLC grade and were supplied by E. Merckand Fluka AG (Buchs, Switzerland).
Fatty acids were converted to fatty acid methyl esters(FAME) and analyzed by GLC on an HR5160 Mega Seriesgas chromatograph (Carlo Erba Instruments, Rodano, Italy),equipped with FID (held at 320°C) and on-column injector.Separation was achieved on a fused-silica capillary columnDB-Wax (J&W Scientific, Folsom, CA), 30 m × 0.32 mm i.d.,film thickness 0.25 µm. FAME were prepared as follows: add
1 mL methanolic HCl 3 N (Supelco, Buchs, Switzerland), 1mL methanol p.a. (E. Merck) and 0.5 mL hexane (cat. no9262, J.T. Baker B.V.) to about 10 mg fat, heat for 1 h at100°C in a tightly closed glass vial, cool to ambient tempera-ture, add 2 mL distilled water and 2 mL hexane per mg fat.Inject 1 µL of the supernatant (hexane phase) into the gaschromatograph. The following program allowed separationof the FAME: 40°C iso 2 min, 15°C/min to 145°C, 1 min iso,3°C/min to 195°C, 5°C/min to 220°C, and 20–30 min iso.Carrier gas: hydrogen at 60 kPa.
Cholesterol was analyzed by following the method of Dieffenbacher et al. (10) with epicoprostanol (Sigma, Buchs,Switzerland) as an internal standard. GLC analyses were per-formed on a HRGC 4160 (Carlo Erba), equipped with on-col-umn injector.
Total carotenoid content, calculated as β-carotene, was an-alyzed spectrophotometrically by the British Standards Insti-tute method (11) (BS 684, section 2.20, 1977) for determina-tion of carotene in vegetable oils.
The milk fat fractions from both techniques were analyzedfor flavor volatiles, which were isolated by simultaneous dis-tillation/extraction (SDE) according to Nickerson and Likens(12), with diethyl ether as solvent. About 10 g of each sample(except cold trap sample, which was 5 g) was mixed with 100mL distilled water and boiled for 2 h. The solvent extractedwas dried over anhydrous sodium sulfate and concentrated to0.2 mL.
The volatiles were characterized in a Finnigan MAT (SanJose, CA) 8430 mass spectrometer coupled to a GLC(Hewlett-Packard 5890; Avondale, PA). A DB-1701 capillarycolumn (J&W Scientic, Folsom, CA) was employed (30 m ×0.32 mm i.d., 0.25 µm film thickness) to separate thevolatiles. The samples were introduced by cold on-columntechnique. The oven temperature was held at 35°C for 2 min,increased to 50°C at 40°C/min and held for 1 min, increasedto 180°C at 6°C/min, and finally to 240°C at 10°C/min, andthen held for 20 min.
The solid fat contents (SFC) of the fractions were measuredby low-resolution pulsed nuclear magnetic resonance (NMR)spectroscopy in a minispec pc20 (Bruker Physik AG, Karl-sruhe-Forchheim, Germany). The measurements were per-formed by the direct method with relaxation delay and en-hancement values set at 2. The following thermal pretreatmentwas used for all milk fat fractions: samples in special NMRtubes were completely melted by heating to 90°C, and were
1250 A.R. BHASKAR ET AL.
JAOCS, Vol. 75, no. 10 (1998)
TABLE 1Operating Conditions for Milk Fat Fractionation with Supercritical CO2 (SC-CO2)
Solubility (wt%): 1.56–1.58Solvent-to-feed ratio (g/g): 57–60
Feed Column Separator 1 Separator 2 Separator 3Parameters milk fat super stearin stearin olein super olein Cold trap
Pressure (MPa) 24.1 24.1 17.2 10.3 6.9 0.03Temperature (°C) 40 40 50 40 60 4Yield (wt%) 100 12 33 35 19 1

then cooled to 65°C. After 30 min, the samples were trans-ferred to a 0°C water bath and held for 16 h. The SFC was thenmeasured at 5°C intervals until complete melting. Sampleswere held for 30 min at each temperature. To study the effectof pretreatment on SFC content, data were also collected forsamples after holding them at 0°C for 1, 2, 3, 16, and 24 h. Forthe 2-h holding time, the SFC was measured only at 0°C.
The melting profiles of the fractions were determined bydifferential scanning calorimetry (DSC) in a DSC-7 (Perkin-Elmer, Rotkreuz, Switzerland). The following temperatureprogram was used: about 10 mg sample was melted at 60°Cand held for 5 min before cooling to −50°C at the rate of5°C/min. The samples were again held at this temperature for5 min before heating to 60°C at the rate of 5°C/min.
RESULTS AND DISCUSSION
Physical and chemical properties of milk fat fractions. Tables2 and 3 show the fatty acid distribution of milk fat fractionsobtained by SC-CO2 and MC. No data were available on thecomposition of milk fat used to obtain the MC fractions. Theshort- (C4:0–C8:0) and medium-chain (C10:0–C12:0) fatty acidconcentration increased, and the long-chain (C14:0– C20:0)fatty acid concentration decreased from solid to liquid frac-tions (super stearin to super olein for SC-CO2 and AMF45 toAMF10 for MC) for both techniques. However, when thefatty acids were separated as unsaturated and saturated, sig-nificant differences were seen in the two techniques. The totalsaturated fatty acid concentration increased, and the unsatu-
rated fatty acid concentration decreased from solid to liquidfor the SC-CO2 fractions. This was the opposite of the MCfractions, where the liquid fractions (AMF20, AMF10) had ahigher concentration of unsaturated fatty acids and lower con-centration of saturated fatty acids. This was also seen in theunsaturated/saturated fatty acid ratio, which followed an op-posite trend for the two techniques. The ratio decreased fromsolid to liquid for the SC-CO2 fractions and increased for theMC fractions.
The TAG concentration (Tables 4 and 5), as determined byGLC, was also different for the fractions obtained by the twotechniques. Compared to MC fractions, the SC-CO2 liquidfractions had a higher concentration of low-molecular weightTAG (C24–C34) and medium-molecular weight TAG(C36–C40) and a lower concentration of the high-molecularweight TAG (C42–C54). Similarly, the super stearin SC-CO2fraction had a high concentration of high-molecular weightTAG, and little low-molecular weight TAG and medium-mol-ecular weight TAG, as compared to the MC AMF45 fraction.
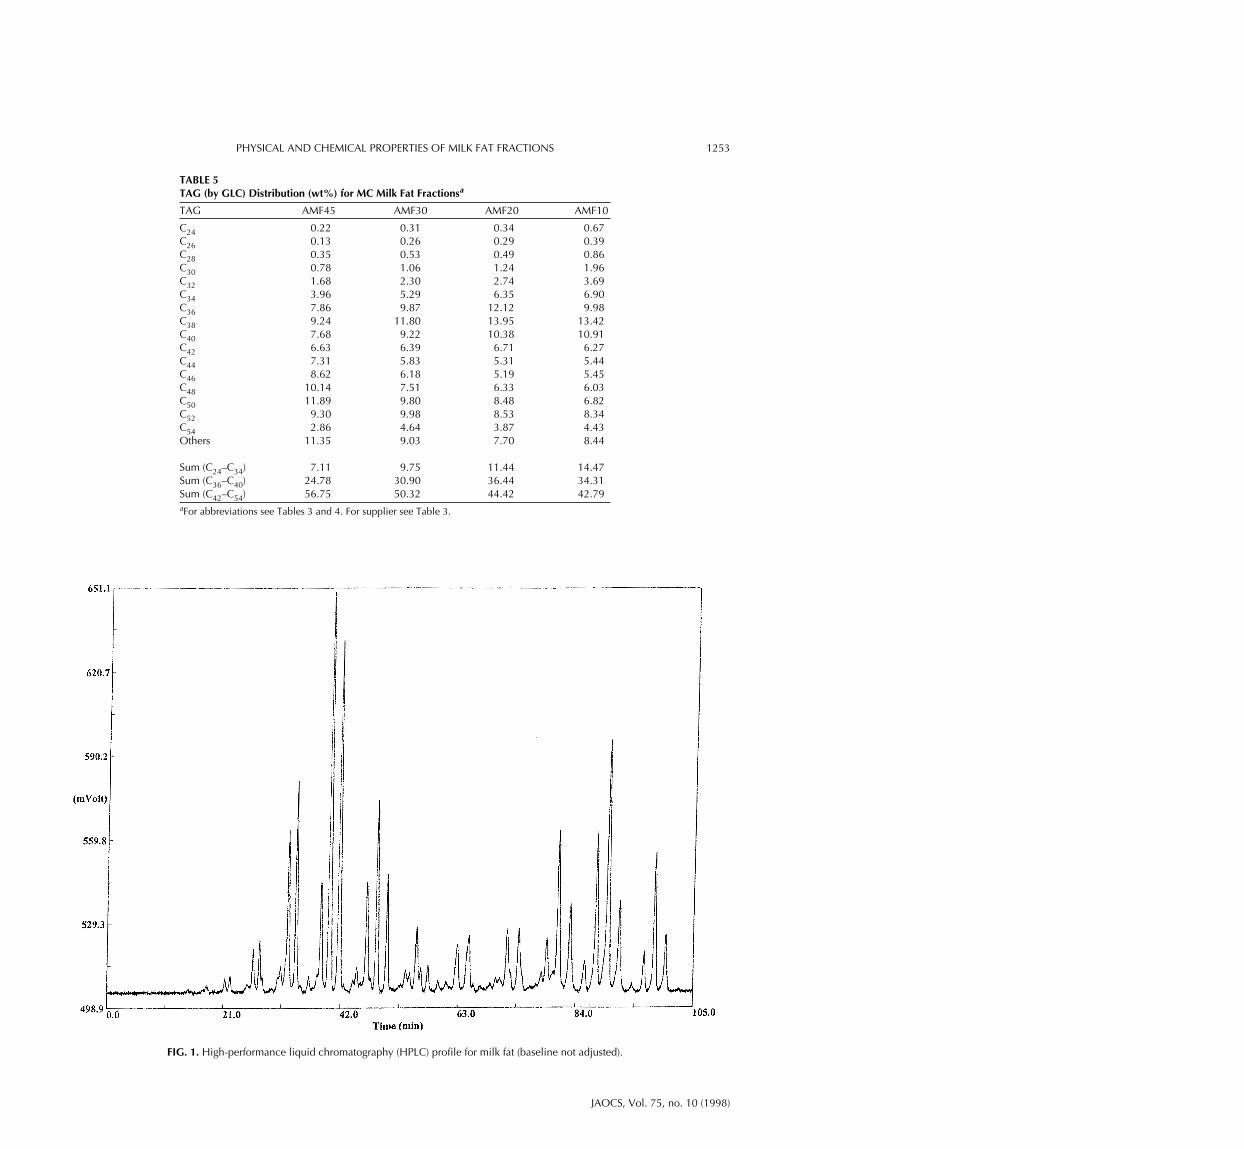
Figures 1–5 show the HPLC traces for milk fat and a fewfractions. Milk fat was separated into 87 peaks, ranging from0.1 to 8.1wt%. However, the equivalent carbon number (ECN—total number of carbon atoms of the three fatty acid moi-eties minus two times the number of double bonds) and fattyacid composition of the peaks were not determined. The re-tention times of the corresponding peaks fluctuated within a30-s interval because the HPLC columns were not tempera-ture-controlled. The two fractionation techniques did notmodify the peak pattern as such. Major peaks in AMF (Fig.
PHYSICAL AND CHEMICAL PROPERTIES OF MILK FAT FRACTIONS 1251
JAOCS, Vol. 75, no. 10 (1998)
TABLE 2Fatty Acid Composition Percentage (area %) for SC-CO2 Milk Fat Fractions by GLC
FAMEa Milk fat Super stearin Stearin Olein Super olein
C4:0 3.39 0.45 2.86 4.64 5.95C6:0 2.11 0.22 1.88 2.73 3.28C8:0 1.28 0.20 1.17 1.53 1.91C10:0 2.85 0.70 2.72 3.25 3.90C12:0 3.20 1.23 3.08 3.52 4.14C14:0 10.43 6.37 10.29 11.12 12.18C14:1 0.91 0.54 0.91 0.97 1.00C15:0 0.94 0.69 0.93 0.98 1.03C16:0 28.73 24.99 28.94 29.48 29.55C16:1 1.41 1.25 1.46 1.41 1.37C17:0 0.55 0.63 0.56 0.50 0.50C18:0 10.34 15.64 10.51 9.20 8.16C18:1 cis 20.91 29.80 21.53 18.74 16.47C18:1 trans 2.13 3.09 2.17 1.89 1.64C18:2 2.64 3.30 2.76 2.47 2.16C18:3 α 0.46 0.74 0.51 0.41 0.40C20:0 0.12 0.31 0.11 0.08 0.06C20:1 n-9 0.11 0.23 0.15 0.10 0.08Others 7.49 9.63 7.46 6.99 6.21C4–C8 6.78 0.86 5.91 8.89 11.13C10–C12 6.05 1.93 5.81 6.77 8.04C14–C20 79.68 87.58 80.82 77.35 74.61
Saturated 63.94 51.41 63.06 67.02 70.66Unsaturated 28.58 38.96 29.48 25.99 23.13Unsat/sat 0.45 0.76 0.47 0.39 0.33aAbbreviations: GLC, gas–liquid chromatography; FAME, fatty acid methyl ester; unsat/sat, saturated total area % unsatu-rated fatty acids)/(total area % saturated fatty acids). For other abbreviations see Table 1.

1) were also major peaks in the fractions. The most apparentdifference in peak distribution was between the two hardstearins (AMF45 and super stearin). Their peak patterns werecompletely different. AMF45 (Fig. 2) was composed of peaksthat eluted over the whole time range, whereas super stearin(Fig. 3) only showed peaks with retention times above 53min. The liquid fractions (Figs. 3 and 5) showed only minor
differences in their HPLC profiles. Only 10 peaks accountedfor ≥ 3 wt% each and had a total of 50.2 wt% in milk fat. Al-most half of all peaks were present in amounts below 0.5wt%, indicating that the majority of TAG were present in onlytrace amounts. One peak does not represent one single TAGbut rather a group with the same ECN (13).
The 10 most predominant peaks of milk fat and the four
1252 A.R. BHASKAR ET AL.
JAOCS, Vol. 75, no. 10 (1998)
TABLE 3Fatty Acid Composition Percentage (area %) for Melt Crystallization(MC) Milk Fat Fractions by GLC
FAME AMF45a AMF30a AMF20a AMF10a
C4:0 3.08 3.44 4.45 4.67C6:0 1.80 2.20 2.65 2.89C8:0 1.11 1.37 1.50 1.76C10:0 2.74 3.07 3.21 3.83C12:0 3.88 3.76 3.89 4.81C14:0 11.88 11.04 10.72 10.87C14:1 0.75 0.98 0.54 1.32C15:0 1.16 1.13 1.03 0.94C16:0 34.38 29.43 29.63 22.27C16:1 1.19 1.53 1.68 2.21C17:0 0.64 0.62 0.56 0.42C18:0 11.81 9.86 8.60 6.08C18:1 n-9 cis 15.05 19.46 20.17 25.27C18:1 n-9 trans 1.75 2.40 1.69 1.88C18:2 n-6 1.04 1.19 1.48 1.90C18:3 n-3 α 0.30 0.57 0.49 0.59C20:0 0.19 0.15 0.10 0.06C20:1 n-9 0.14 0.16 0.16 0.17Others 7.11 7.66 7.44 8.08C4–C8 5.99 7.00 8.61 9.31C10–C12 6.62 6.83 7.10 8.64C14–C20 80.28 78.52 76.86 73.98
Saturated 72.67 66.06 66.35 58.59Unsaturated 20.22 26.29 26.21 33.34Unsat/sat 0.28 0.40 0.40 0.57aMC fractions supplied by S.A.N. Corman, Groé, Belgium. For abbreviations see Table 2.
TABLE 4Percentage (area %) Triacylglycerol (TAG) Composition for SC-CO2 Milk Fat Fractions by GLCa
TAG Milk fat Super stearin Stearin Olein Super olein
C24 0.27 0.07 0.16 0.33 0.64C26 0.26 0.00 0.00 0.12 0.68C28 0.47 0.00 0.16 0.42 1.60C30 0.44 0.00 0.43 1.12 2.72C32 2.05 0.00 1.08 2.49 4.59C34 4.60 0.13 3.05 5.90 8.75C36 9.02 0.53 7.09 11.68 14.53C38 11.73 0.86 10.53 15.06 16.34C40 9.51 1.14 9.90 12.02 11.92C42 6.17 1.46 6.95 7.44 6.63C44 5.65 2.46 6.76 6.31 5.00C46 6.16 5.07 7.55 6.16 4.77C48 7.89 10.58 9.41 6.63 5.13C50 10.70 21.46 11.48 7.50 5.86C52 11.85 31.01 11.41 6.66 4.87C54 5.57 18.54 4.88 2.80 1.89Others 7.66 6.70 9.15 7.36 4.09
Sum (C24–C34) 8.08 0.20 4.89 10.38 18.97Sum (C36–C40) 30.26 2.53 27.52 38.75 42.79Sum (C42–C54) 53.99 90.58 58.44 43.51 34.15aFor abbreviations see Tables 1 and 2.
PHYSICAL AND CHEMICAL PROPERTIES OF MILK FAT FRACTIONS 1253
JAOCS, Vol. 75, no. 10 (1998)
TABLE 5TAG (by GLC) Distribution (wt%) for MC Milk Fat Fractionsa
TAG AMF45 AMF30 AMF20 AMF10
C24 0.22 0.31 0.34 0.67C26 0.13 0.26 0.29 0.39C28 0.35 0.53 0.49 0.86C30 0.78 1.06 1.24 1.96C32 1.68 2.30 2.74 3.69C34 3.96 5.29 6.35 6.90C36 7.86 9.87 12.12 9.98C38 9.24 11.80 13.95 13.42C40 7.68 9.22 10.38 10.91C42 6.63 6.39 6.71 6.27C44 7.31 5.83 5.31 5.44C46 8.62 6.18 5.19 5.45C48 10.14 7.51 6.33 6.03C50 11.89 9.80 8.48 6.82C52 9.30 9.98 8.53 8.34C54 2.86 4.64 3.87 4.43Others 11.35 9.03 7.70 8.44
Sum (C24–C34) 7.11 9.75 11.44 14.47Sum (C36–C40) 24.78 30.90 36.44 34.31Sum (C42–C54) 56.75 50.32 44.42 42.79aFor abbreviations see Tables 3 and 4. For supplier see Table 3.
FIG. 1. High-performance liquid chromatography (HPLC) profile for milk fat (baseline not adjusted).

SC-CO2 fractions accounted for 50–60 wt% in total, exceptfor super stearin in which they amounted to 80 wt%. The MCfractions were even more similar; the 10 most abundant peaksrepresented 55–57 wt% of all peaks. Peaks were detected be-tween 17.5 and 96.0 min, except for super stearin, whichshowed no peaks before 53.0 min. The distinct separation ca-pacity of SC-CO2 was well illustrated by this peak distribu-tion. Forty-three peaks, which accounted for 47.9 wt% of totalTAG, were detected before 53 min in AMF. Peaks of highconcentration occurred in two retention time intervals: be-tween 15 and 45 min and after 73 min. In between, the biggestpeaks did not exceed 1.7 wt% (only six out of 32 peaks above0.8 wt%). This intermediate time interval represented morethan one-third of all peaks (32 out of 87), but in terms of con-centration only one-fifth (20.1 wt%). Enrichment factors(concentration of peak α in fraction x compared with the cor-responding peak α in AMF) were calculated for the 10 mostabundant peaks. Highest peak enrichment was achieved insuper stearin (five peaks were three- to fourfold enriched),whereas in the other SC-CO2 fractions, enrichment was notabove two. In the four olein fractions, half of the peaks elutedbefore 45 min, and these summed up to more than half of thetotal peak concentration for those particular fractions. Thiswas more pronounced for the SC-CO2 than the MC samples
(olein: 65.6 wt% α = 28 and super olein: 72.9 wt% α = 47 vs.AMF20: 56.9 wt% α = 39 and AMF10: 60.4 wt% α = 41).
Fractionation by SC-CO2 is based on molecular weight anddielectric properties of the solute rather than on melting point,which forms the basis of the MC process. The TAG that con-tain unsaturated fatty acids have lower melting points thanTAG that contain saturated fatty acids. Hence, the unsaturatedfatty acid concentration increased in the MC liquid fractions.However, TAG with unsaturated fatty acids may not have lowmolecular weights. Therefore, the SC-CO2 liquid fractions hadless unsaturated fatty acids or TAG with unsaturated fatty acids.
Further, the fractions obtained with SC-CO2 were continu-ously extracted (single-pass) whereas MC is a batch process.McCarthy et al. (14) have studied milk fat fractionation bymolecular distillation in a batch process. The fatty acid andTAG distribution trend is similar to that after SC-CO2. Theirresidue, obtained after two passes, had a composition similarto SC-CO2 super stearin. The authors also redistilled the 10%most volatile fraction (D-1) to obtain four more fractions,which may not be comparable with results from single-passdistillations. In another study on distillation, Arul et al. (15)fractionated milk fat into four fractions by short-path distilla-tion (SPD). Their liquid fractions had higher concentrationsof short- and medium-chain fatty acids and short- and
1254 A.R. BHASKAR ET AL.
JAOCS, Vol. 75, no. 10 (1998)
FIG. 2. HPLC profile for melt crystallization AMF45 (supplied by S.A.N. Corman, Groé, Belgium). For abbreviation see Figure 1.

medium-chain TAG, compared to SC-CO2 fractions. Thecombined liquid SPD fraction yield was 11.6%. The solidSPD fraction was different from SC-CO2 super stearin.
Table 6 shows the cholesterol and β-carotene distributionamong the milk fat fractions. The cholesterol concentrationin the fractions followed a similar trend for the two tech-niques; as expected, it increased from solid to liquid fractions.The cholesterol concentration was reduced by more than 50%for the super stearin SC-CO2 fraction. Further, the increase incholesterol concentration was higher for the liquid MC frac-tions, compared to the liquid SC-CO2 fractions. Cholesteroltends to concentrate in the more soluble fractions (liquid),which may be the result of a higher affinity of cholesterol forthe short- and medium-chain fatty acids (4).
The β-carotene concentrations in the MC fractions werealmost the same, whereas the SC-CO2 fractions showed a dis-tribution. The super stearin SC-CO2 fraction had four timesthe β-carotene concentration of normal milk fat, whereas theliquid fractions had low concentrations.
Similar distribution trends for fatty acids, TAG, and cho-lesterol have been observed by other researchers (4,6,9,16).
Figures 6–11 show profiles for volatile compounds de-tected in milk fat and the solid and liquid fractions from thetwo techniques. Because the analysis was qualitative, the con-centrations of the different volatiles could not be calculated.
The fractions from both techniques show a distribution in lac-tone concentration. Lactones are important constituents of theunique butter flavor (17). The milk fat had only smallamounts of different lactones, indicated by the small peakson the chromatograms (Fig. 6). For the MC fractions, all frac-tions showed a presence of lactones, with the solid fraction(AMF45, Fig. 7) having the lowest and the liquid fraction(AMF10, Fig. 8) the highest concentrations, as seen by thepeak heights. The concentration distribution of the lactoneswas different for the SC-CO2 fractions. The super stearinfraction (Fig. 9) had no lactones, while the stearin and oleinfractions had only low concentrations. However, the concen-tration increased in the super olein fraction (Fig. 10) and evenmore significantly in the flavor concentrate fraction (coldtrap, Fig. 11). The flavor profile of the flavor concentrate hadmore than five times the concentration of lactones, comparedto normal milk fat.
Figures 12A and B show the DSC curves for the milk fatfractions. All curves have three distinct peaks, which corre-sponded to low-melting (LMT), medium-melting (MMT),and high-melting (HMT) TAG. The SC-CO2 super stearinfraction had a more distinct shoulder plateau, compared toAMF45, which agrees with the compositional differences forthese fractions. This shoulder plateau decreased for the liquidfractions in both techniques. Both AMF20 and AMF10 frac-
PHYSICAL AND CHEMICAL PROPERTIES OF MILK FAT FRACTIONS 1255
JAOCS, Vol. 75, no. 10 (1998)
FIG. 3. HPLC profile for supercritical CO2 (SC-CO2) super stearin. See Figure 1 for abbreviation.

tions, however, showed no peak for HMT, even though theircompositions showed the presence of HMT. This peak wassmall for the liquid SC-CO2 fractions.
Figures 13A and B show the SFC profiles for milk fat frac-tions tempered at 0°C for 16 h. The profiles were again simi-lar for the two techniques, but all SC-CO2 fractions were dif-ferent from milk fat. The AMF30 fraction had a profile simi-lar to milk fat, and AMF10 had the lowest melting point ofall fractions (SC-CO2 and MC).
Table 7 shows the SFC data measured by pulsed NMR fordifferent pretreatment conditions at 0°C. The SFC values atthe same temperature were dependent on the holding time at0°C. The values increased with holding time at 0°C, and thisincrease was different for different milk fat fractions. TheSFC values were similar for 16- and 24-h holding times. After15°C, the SFC values for different holding times were similarfor all fractions.
Milk fat, like most other fats, exhibits polymorphism,which results from a change in crystal structure of the TAG.Crystals of γ, α, β′ and β forms have been identified in milkfat (18–22). The γ form is unstable and has been only ob-served during photomicrographic studies (19). The α formhas little spatial arrangement and a low melting point; β′ crys-tals have a tighter arrangement and higher melting point; and
β crystals have a dense arrangement and the highest meltingpoint (20). The β′ form is generally the most stable form formilk fat crystals (21). The crystallization process is the keyforce employed for fractionation by MC with or without sol-vents. Crystal morphology data have been reported in the lit-erature for milk fat fractions. Crystals from MC milk fat frac-tions exist in β form, whereas crystals from SC-CO2 fractionsexist in β or β′ form (1).
Rapid and deep cooling promotes the formation of thelow-melting unstable crystal forms γ and α, but raising thetemperature and reducing the cooling rate promote the forma-tion of more stable (β′) crystal forms (19,23–25).
Because the inherent process of milk fat crystallization isrelatively slow, the time period allotted for crystallizationcan affect crystal size and yield. Keogh and Higgins (26) re-ported an increase in solid fraction yield when crystalliza-tion time was increased from 0 to 3 h. Black (27) employedeither 16- or 21-h crystallization periods and reported no sig-nificant difference in crystal size. Longer crystallizationtimes, though, resulted in increased liquid fat content at sep-aration. Antila (28) noted that 15 h was usually sufficient forcrystallization. Many investigators have employed a 24-hcrystallization period to ensure that the crystallizationprocess was complete (1). This can also be seen in the data
1256 A.R. BHASKAR ET AL.
JAOCS, Vol. 75, no. 10 (1998)
FIG. 4. HPLC profile for melt crystallization AMF10. See Figure 1 for abbreviation.

from Table 7 where a holding time of 16 h gave constant SFCvalues for the fractions.
Because the milk fat fractions have different compositions,a relationship can be seen in NMR data with individual com-positions. For example, the AMF10 and super stearin frac-tions required longer holding times, and both fractions hadhigher concentrations of unsaturated fatty acids.
At present, there is no commercial plant for SC-CO2 frac-
tionation of milk fat, whereas MC fractions are available com-mercially in some European countries. Singh and Rizvi (29)did a detailed economic analysis for continuous SC-CO2 pro-cessing of milk fat, and their results show that SC-CO2 is eco-nomically viable for fractionating milk fat, contrary to whatmay be the generally held belief. The estimated conversion costfor a 10,000 T/yr SC-CO2 processing plant was 10–15cents/kg, compared to 2–5 cents/kg for the MC process. A brief
PHYSICAL AND CHEMICAL PROPERTIES OF MILK FAT FRACTIONS 1257
JAOCS, Vol. 75, no. 10 (1998)
FIG. 5. HPLC profile for SC-CO2 super olein. See Figures 1 and 3 for abbreviations.
TABLE 6Cholesterol and β-Carotene Distribution for Milk Fat Fractions
Total carotenoidsa CholesterolFraction (µg/100 g) (mg/100 g)
Milk fat 215 273Supercritical CO2Super stearin 874 110Stearin 106 252Olein 52 307Super olein 48 345
Melt crystallizationb
AMF45 381 217AMF30 486 302AMF20 396 443AMF10 444 454
aMeasured as β-carotene.bFor supplier see Table 3.

1258 A.R. BHASKAR ET AL.
JAOCS, Vol. 75, no. 10 (1998)
FIG. 6. Volatiles extracted from milk fat.
FIG. 7. Volatiles extracted from melt crystallization AMF45. For supplier see Figure 2.

PHYSICAL AND CHEMICAL PROPERTIES OF MILK FAT FRACTIONS 1259
JAOCS, Vol. 75, no. 10 (1998)
FIG. 8. Volatiles extracted from melt crystallization AMF10.
FIG. 9. Volatiles extracted from SC-CO2 super stearin. See Figure 3 for abbreviation.

1260 A.R. BHASKAR ET AL.
JAOCS, Vol. 75, no. 10 (1998)
FIG. 10. Volatiles extracted from SC-CO2 super olein. See Figure 3 for abbreviation.
FIG. 11. Volatiles extracted from SC-CO2 cold trap. See Figure 3 for abbreviation.

PHYSICAL AND CHEMICAL PROPERTIES OF MILK FAT FRACTIONS 1261
JAOCS, Vol. 75, no. 10 (1998)
FIG. 12. Differential scanning calorimetry curves for (A) SC-CO2 milk fat fractions, and (B) melt crystallization milk fat fractions. See Figure 3 forabbreviation.

1262 A.R. BHASKAR ET AL.
JAOCS, Vol. 75, no. 10 (1998)
FIG. 13. Solid fat content (SFC) curves for (A) SC-CO2 milk fat fractions and (B) melt crystallization milk fat fractions. (A) Milk fat (—■—), superstearin (◆), stearin (--■--), olein (▲), super olein (●). (B) milk fat (—■—), AMF45 (◆), AMF30 (--■--), AMF20 (▲), AMF10 (●).

summary of the advantages and disadvantages of milk fat frac-tionation methods is presented in Table 8.
In conclusion, it is evident that milk fat fractions offer po-tential for increasing its utilization. SC-CO2 and MC producefractions with different physical properties. However, compo-sition differences are more distinct in the SC-CO2 fractions. Inapplications where composition of the fractions is important,SC-CO2 fractions would have an advantage over MC fractions.With SC-CO2, the flavor compounds can be simultaneouslyconcentrated with fractionation, i.e., more bland milk fat frac-tions can be obtained, which could be of interest for special ap-plications, e.g., flavor carriers, filler fats, etc. The solid SC-CO2fractions had lower cholesterol and higher β-carotene concen-trations, whereas the liquid SC-CO2 fractions had higher short-and medium-chain fatty acid concentrations. These added ad-vantages in the fractions can help offset some of the higher con-version costs of SC-CO2 processing.
Applications of other techniques (e.g., interesterification)in combination with fractionation or a combination of MCand SC-CO2 may further help in targeting the properties ofthe fractions.
ACKNOWLEDGMENTS
The authors thank the following people at the Nestlé ResearchCentre: Dr. I. Blank and P.A. Golay for helpful discussions,and S. Devaud and S. Metairon for their expert technical as-
sistance. The melt crystallization milk fat fractions used inthis study were generously provided by S.A.N. Corman(Groé, Belgium).
REFERENCES
1. Kaylegian, K.E., and R.C. Lindsay, Handbook of Milk Fat Frac-tionation Technology and Applications, AOCS Press, Cham-paign, 1995.
2. deMan, J.M., Modification of Milk Fat by Removal of a High-Melting Triglyceride Fraction, Can. Inst. Food Technol. J.1:90–93 (1968).
3. Fjaervoll, A., Anhydrous Milk Fat Fractionation, Dairy Ind.35:502–505 (1970).
4. Norris, R., I.K. Gray, and A.K. McDowell, The Chemical Com-position and Physical Properties of Fractions of Milk Fat Ob-tained by a Commercial Fractionation Process, J. Dairy Res.38:179–191 (1971).
5. Larsen, N.E., and E.G. Samuelsson, Some Technological As-pects on Fractionation of Milk Fat, Milschwissenschaft34:663–665 (1979).
6. Arul, J., A. Bourdeau, J. Makhlouf, R. Tardif, and M.R. Sa-hasrabudhe, Fractionation of Anhydrous Milk Fat by Supercriti-cal Carbon Dioxide, J. Food Sci. 52:1231–1236 (1987).
7. Shishikura, A., K. Fujimoto, T. Kanedo, K. Arai, and S. Saito,Modification of Butter Oil by Extraction with Supercritical CO2,Agric. Biol. Chem. 50:1209–1215 (1986).
8. Rizvi, S.S.H., Supercritical Fluid Processing of Milk Fat,Newsletter of the Northeast Dairy Foods Research Center3(11):1–5 (1991).
9. Bhaskar, A.R., S.S.H. Rizvi, and J.W. Sherbon, Anhydrous MilkFat Fractionation Using a Continuous Countercurrent Pilot-
PHYSICAL AND CHEMICAL PROPERTIES OF MILK FAT FRACTIONS 1263
JAOCS, Vol. 75, no. 10 (1998)
TABLE 7Solid Fat Content Data Measured by Pulsed Nuclear Magnetic Resonance (NMR)for Different Holding Times at 0°C
Sample 1 h 2 h 3 h 16 h 24 h
Supercritical CO2Milk fat 56.1 58.7 60.4 61.1 61.9Super stearin 71.0 74.8 76.4 79.8 80.8Stearin 60.8 63.2 64.0 65.9 65.6Olein 53.4 56.2 56.9 58.3 58.2Super olein 47.3 51.0 51.3 51.7 52.4
Melt crystallizationa
AMF45 72.5 75.9 76.8 78.5 78.9AMF30 58.5 61.2 61.5 62.4 60.8AMF20 52.8 55.5 55.4 57.1 56.9AMF10 10.2 10.1 18.5 29.7 30.8
aFor supplier see Table 3.
TABLE 8Summary of Melt Crystallization and Supercritical CO2 Fractionation Techniques
Supercritical CO2 Melt crystallization
Process Continuous MultistageCO2 is nontoxic and low-cost Simple physical processSeveral fractions per run Two fractions per run
Fractions Chemically discrete fractions Minor differences in compositionHigh-melting High unsaturated fatty acids and β-carotene High saturated fatty acidsLow-melting High C4–C10 fatty acids High C18:1–C18:3 fatty acids
Flavor concentrate Yes —Processing cost 10–15 cents/kg 2–5 cents/kgDisadvantages High initial capital investment Limited temperature range

Scale Supercritical Carbon Dioxide System, J. Food Sci.58:748–752 (1993).
10. Dieffenbacher, A., P.-A. Golay, and L.B. Fay, Einige Be-merkungen zur Anwendung der offiziellen Methoden des # 35des Deutschen Lebensmittelgesetzes zur Bestimmung des Cho-lesteringehaltes in Eiersatzprodukten, Dtsch. Lebensm. Rund-sch. 90:74–77 (1994).
11. British Standards Institute, London, British Standards InstituteMethod BS 684: section 2.20 (1977).
12. Nickerson, G.B., and S.T. Likens, J. Chromatogr. (21):1–5(1966).
13. Gresti, J., M. Bugaut, C. Maniongui, and J. Bezard, Composi-tion of Molecular Species of Triacylglycerols in Bovine MilkFat, J. Dairy Sci. 76:1850–1869 (1993).
14. McCarthy, M.J., A. Kuksis, and J.M.R. Beveridge, Gas–LiquidChromatographic Analysis of the Triglyceride Composition ofMolecular Distillates of Butter Oil, Can. J. Biochem. Physiol.40:1693–1703 (1962).
15. Arul, J., A. Bourdeau, J. Makhlouf, R. Tardif, and T. Bellavia,Fractionation of Anhydrous Milk Fat by Short-Path Distillation,J. Am. Oil Chem. Soc. 65:1642–1646 (1988).
16. Deffense, E., Multi-Step Butteroil Fractionation and SpreadableButter, Fett Wiss. Technol. 89:502 (1987).
17. Banks, W., Chemical and Physical Properties of Milk Fat, in Uti-lization of Milk Fat, Bull. No. 260, Int. Dairy Fed., 1991, p. 4.
18. Belousov, A.P., and V.M. Vergelesov, Polymorphism in Butter-fat, in Proceedings 16th International Dairy Congress, Copen-hagen, Sec.III:1, p.122 (1962).
19. Deffense, E., Fractionated Milk Fat Products in Bakery Prod-ucts, in Proceedings New Uses for Milk Fat, Dairy Sciences Re-search Center, Laval University, Quebec, 1989, p. 79.
20. deMan, J.M., Polymorphism in Milk Fat, Dairy Sci. Abst.25:219 (1963).
21. Foley, J., and J.P. Brady, Temperature-Induced Effects on Crys-tallization Behavior, Solid Fat Content and Firmness Values ofMilk Fat, J. Dairy Res. 51:579 (1984).
22. Mortensen, B.K., Physical Properties and Modification of MilkFat, in Developments in Dairy Chemistry 2: Lipids, edited by P.Fox, Applied Science Publishers, 1983, p.159.
23. Mulder, H., and P. Walstra, The Milk Fat Globule Emulsion Sci-ence as Applied to Milk Products and Comparable Foods, Com-monwealth Agriculture Bureaux, Farnham Royal, Bucks., Eng-land, and Center for Agriculture Publishing and Documentation,Wageningen, The Netherlands, 1974.
24. deMan, J.M., Physical Properties of Milk Fat, J. Dairy Res.28:81–86 (1961).
25. Sherbon, J.W., and R.M. Dolby, Preparation and Fractionationof the High Melting Glyceride Fractions of Milk Fat, Ibid. 56:52(1973).
26. Keogh, M.K., and A.C. Higgins, Anhydrous Milk Fat 3. Frac-tionation Aspects, Irish J. Food Sci. Technol. 10:35 (1986).
27. Black, R.G., Pilot-Scale Studies of Milk Fat Fractionation, J.Dairy Technol. 28:116 (1973).
28. Antila, V., The Fractionation of Milk Fat, Milk Ind. 81:7 (1979).29. Singh, B., and S.S.H. Rizvi, Design and Economic Analysis for
Continuous Countercurrent Processing of Milk Fat with SC-CO2, J. Dairy Sci. 77(6):1731–1745 (1994).
[Received August 15, 1997; accepted April 14, 1998]
1264 A.R. BHASKAR ET AL.
JAOCS, Vol. 75, no. 10 (1998)
![Index [lib3.dss.go.th]lib3.dss.go.th/fulltext/index/620-629/620.193mor.pdf · mercury manometer or barometer, 424 ... Index . Antistatic finish, ... CNG storage cylinders, usc of](https://static.fdocuments.in/doc/165x107/5abac72b7f8b9a321b8c122a/index-lib3dssgothlib3dssgothfulltextindex620-629620-manometer-or-barometer.jpg)

![Index [lib3.dss.go.th]lib3.dss.go.th/fulltext/index/540-549/547.7org.pdf · Index The following index ... of enolates, 1,2-asymmetric. ... 568 Organic Synthesis via Examination of](https://static.fdocuments.in/doc/165x107/5acc64a37f8b9a93268c6ce6/index-lib3dssgothlib3dssgothfulltextindex540-5495477orgpdfindex-the.jpg)
![INDEX [lib3.dss.go.th]lib3.dss.go.th/fulltext/index/000-499/363.72876lag.pdf · · 2013-04-03use in remedial objectives, 1010 access: audits, 321 acclimation, 569 ... INDEX. landfill](https://static.fdocuments.in/doc/165x107/5abddfa57f8b9a7e418c30eb/index-lib3dssgothlib3dssgothfulltextindex000-499363-in-remedial-objectives.jpg)

![Index [lib3.dss.go.th]lib3.dss.go.th/fulltext/index/663-665/664.117non.pdfIndex. A AAS. See Atomic-absorption spectroscopy Acoustic impedance, 50-51 Acoustic spectrometer, low frequency,](https://static.fdocuments.in/doc/165x107/5afb657a7f8b9a2d5d8f8c54/index-lib3dssgothlib3dssgothfulltextindex663-665664-a-aas-see-atomic-absorption.jpg)

![Index [lib3.dss.go.th]lib3.dss.go.th/fulltext/index/620-629/621.381hanm.pdf · 2010-12-02 · charge transport models 18-27. conduction mechanism 305 electrical transport properties,](https://static.fdocuments.in/doc/165x107/5e551e3f922b7540656f42df/index-lib3dssgothlib3dssgothfulltextindex620-629621-2010-12-02.jpg)


![Index [lib3.dss.go.th]lib3.dss.go.th/fulltext/index/668/668.4pla6thedref.pdf · Abrilube: see trade names, ... antifog agents 1054, 1130 antifogging additives 637,641,643 ... Atmer:](https://static.fdocuments.in/doc/165x107/5b1cefed7f8b9aad5d8bb06a/index-lib3dssgothlib3dssgothfulltextindex668668-abrilube-see.jpg)

![Index [lib3.dss.go.th]lib3.dss.go.th/fulltext/index/620-629/621.312136man2nded.pdf · Control design issues, 388. Index . ... procedure, 312 standards. ... Flyball governor, 14 Forecasting,](https://static.fdocuments.in/doc/165x107/5b3199167f8b9adf6c8b5c24/index-lib3dssgothlib3dssgothfulltextindex620-629621-control-design.jpg)

![Index [lib3.dss.go.th]lib3.dss.go.th/fulltext/index/666-667/667.90287welreved.pdfalkaline conditions see salts alkaline hydrolysis see saponification alkali-silica reactivity (ASR)](https://static.fdocuments.in/doc/165x107/5e76851994307b09ce5b10fe/index-lib3dssgothlib3dssgothfulltextindex666-667667-alkaline-conditions.jpg)