A comparison of emissions from ethanol and petrol fuelled cars€¦ · A comparison of emissions...
46
REPORT A comparison of emissions from ethanol and petrol fuelled cars Health risk assessment for Västra Götaland * IVL Swedish Environmental Research Institute + Umeå University, Occupational and Environmental Medicine This report approved 2011-03-16 John Munthe Scientific Director Erik Fridell* Marie Haeger-Eugensson* Jana Moldanova* Lin Tang* Karin Sjöberg* Bertil Forsberg + B1962 September 2010
Transcript of A comparison of emissions from ethanol and petrol fuelled cars€¦ · A comparison of emissions...
REPORT
A comparison of emissions from ethanol and petrol fuelled cars
Health risk assessment for Vaumlstra Goumltaland
IVL Swedish Environmental Research Institute +Umearing University Occupational and Environmental Medicine
This report approved
2011-03-16
John Munthe Scientific Director
Erik Fridell Marie Haeger-Eugensson Jana Moldanova Lin Tang Karin Sjoumlberg Bertil Forsberg+
B1962 September 2010
Organization
IVL Swedish Environmental Research Institute Ltd
Report Summary
Project title Emissions from ethanol cars - dispersion and impact Address
PO Box 5302 SE-400 14 Goumlteborg
Project sponsors Saab Automobile The Swedish Transport Administration and The Foundation for the Swedish Environmental Research Institute
Telephone
+46 (0)31-725 62 00
Author
Erik Fridell Marie Haeger Eugensson Jana Moldanova Lin Tang Karin Sjoumlberg Bertil Forsberg
Title and subtitle of the report
A comparison of emissions from ethanol and petrol fuelled cars Health risk assessment for Vaumlstra Goumltaland Summary
See below Keyword
emissions dispersion modelling health risks E85 ethanol petrol
Bibliographic data
IVL Report B1962
The report can be ordered via Homepage wwwivlse e-mail publicationserviceivlse fax+46 (0)8-598 563 90 or via IVL PO Box 21060 SE-100 31 Stockholm Sweden
A comparison of emissions from ethanol and petrol fuelled cars IVL report B1962 Health risk assessment for Vaumlstra Goumltaland
1
Abstract
Facing the problems with global warming and the diminishing supplies of oil alternative fuels are becoming more and more important for road traffic One fuel that has been used for several years is ethanol (E85) The main discussion points regarding the environmental performance for ethanol as a fuel are related to the production However there are also some notable differences in the emissions between E85 and petrol fuelled vehicles This relates to some extent to the emissions of nitrogen oxides (NOX) and particulate matter (PM) but mainly to the composition of the emitted organic compounds
These differences in emissions will potentially give different impacts on health and on the environment This can be both through risks linked to the primary emissions and to secondary products formed in the atmosphere In order to assess the health risks it is necessary to calculate the emissions in space and time describe the dispersion and chemical reactions taking place in the atmosphere and to calculate the exposure to humans
In the present study two fuel scenarios for passenger cars are studied one where the cars with Otto engines run on petrol and one where they run on E85 Two emission scenarios for 2020 are constructed and dispersion modelling is applied to obtain the human exposure to key pollutants The dispersion modelling is performed with the EMEP model for extended Europe and the data obtained are used as boundary conditions for the model for the Vaumlstra Goumltaland Region In the latter detailed traffic and emissions scenarios are used together with the TAPM model to obtain concentration levels and population exposure The differences in health impacts are then assessed
The differences in emission factors reflect in differences in emissions The emission calculations for all Swedish road traffic show a decrease for the E85 scenario relative to the petrol scenario of 65 for NOX 34 for PM25 67 for benzene For acetaldehyde there is an increase of 770
The differences obtained from the TAPM modelling show decreased levels of NOX ozone and benzene with E85 and increased levels of acetaldehyde For the latter the increase may be up to 80 while NOX and ozone show decreases of up to a few per cent and a few tenths of per cent respectively
The health risk assessment shows decreased health risks in the E85 scenario relative the all-petrol scenario due to the decreased NOX exposure correlated with both preterm deaths and asthma However NOX may be mainly an indicator of unmeasured causal exhaust components in the epidemiological studies and thus the exposure-response functions for NOX may not be applicable in the present case where there is a difference in NOX exposure but not necessarily a difference in exposure to other exhaust components normally associated with NOX Smaller effects are expected from the changes in ozone acetaldehyde PM25 and benzene exposure The overall difference is about 16 preterm deaths per year for the Vaumlstra Goumltaland Region with lower values for the E85 scenario when the uncertain differences due to the differences in NOX exposure are not considered
A comparison of emissions from ethanol and petrol fuelled cars IVL report B1962 Health risk assessment for Vaumlstra Goumltaland
2
Content
Abstract 1 1 Introduction 3 2 Methods 4
21 Overview 4 22 Emission factors 4 23 Traffic data 5 24 Emissions 6 25 Dispersion modelling 7
251 Local scale modelling 7 252 EMEP modelling 8
26 Exposure 9 27 Health effects and risk assumptions 10
271 NOX and NO2 10 272 Ozone 10 273 Acetaldehyde 10 274 Benzene 10 275 Formaldehyde 10 276 PM 11 277 Health Impact Assessment 11
3 Results 11 31 Emission factors 11 32 Emissions 14 33 Dispersion modelling 17 34 Exposure 20 35 Impact on health in Vaumlstra Goumltaland 22
351 NO2 and NOX 22 352 Ozone 22 353 Acetaldehyde 23 354 Benzene 23 355 PM25 23
4 Discussion 23 5 Conclusions 24 6 Acknowledgements 25 7 References 26 Appendix 1 Evaporate emissions of NMHC 28 Appendix 2 Description of the model system 29 Appendix 3 Emission results 33 Appendix 4 Dispersion modelling results 35 Appendix 5 Detailed Exposure data 40
A comparison of emissions from ethanol and petrol fuelled cars IVL report B1962 Health risk assessment for Vaumlstra Goumltaland
3
1 Introduction
Facing the problems with global warming and the diminishing supplies of oil alternative fuels are becoming more and more important for road traffic Several alternative fuels are being tested such as biogas alcohols and dimethyl ether (DME) One fuel that has been used for several years in Brazil and has become popular in eg Sweden and the USA during the last ten years is ethanol It is used both as a component (about 5 vol) in regular petrol and as E85 (85 vol ethanol 15 vol petrol)
The main discussion points regarding the environmental performance for ethanol as a fuel are related to the production In this study the production of ethanol fuel is not in focus but rather the impact from emissions stemming from E85 fuelled cars Although the emissions from E85 cars are not as well characterised as the emissions from petrol cars there are some notable differences in the emissions This relates to some extent to the emissions of nitrogen oxides (NOX) and particulate matter (PM) but mainly to the composition of the emitted organic compounds The main differences here are that petrol generates relatively higher emissions of benzene while E85 generates relatively higher emissions of acetaldehyde and ethanol
Ethanol has a reaction lifetime of several days and the major product of its OH-initiated degradation is acetaldehyde The OH-initiated degradation of acetaldehyde gives upon further reaction with NO2 peroxy-acetyl nitrate (PAN) Other reactions of acetaldehyde give mainly formaldehyde and CO2 All of acetaldehyde formaldehyde and PAN have negative effects on human health
These differences in emissions will potentially give different impacts on health and the environment This can be both through risks linked to the primary emissions and to the mentioned secondary products formed in the atmosphere In order to assess the health risks it is necessary to calculate the emissions in space and time describe the dispersion and chemical reactions taking place in the atmosphere and to calculate the exposure to humans
Jacobson (2007) studied the impact on health risks of a change from petrol to E85 in a scenario analysis for the US in 2020 A greater risk was found for the E85 scenario compared to an all-petrol scenario due to the effects on the ozone concentration However the differences found were small and the conclusion made is that it is unlikely that the use of E85 fuel would improve air quality relative to petrol
In the present study the change in impact on health risks between a scenario with all petrol and one with all E85 is studied for 2020 The fuel switch is applied to all positive ignition injection cars for the EMEP-model domain (covers Europe and surrounding parts of North Africa and Asia) and the health impact is studied for the region of Vaumlstra Goumltaland in Sweden Two emission scenarios for 2020 are constructed and dispersion modelling is applied to obtain the human exposure to key pollutants in the region The dispersion modelling is performed with the EMEP model for extended Europe and the data obtained are used as boundary conditions for the model for the Vaumlstra Goumltaland region In the latter detailed traffic and emissions scenarios are used together with the TAPM model to obtain concentration levels and population exposure The differences in health impacts are then assessed The setup of the scenarios is similar to what is presented by Jacobson but of course applied to a different region with different climate as well as traffic and population density
A comparison of emissions from ethanol and petrol fuelled cars IVL report B1962 Health risk assessment for Vaumlstra Goumltaland
4
2 Methods
21 Overview
The overall objective of the present study is to compare the health impacts in the Vaumlstra Goumltaland region of emissions from petrol fuelled cars (ie cars with Otto engines and spark ignition) in two scenarios for 2020 one with all petrol and one with all E85 Thus in one scenario all these cars are assumed to be fuelled by petrol and in the second all these cars are assumed to be fuelled by E85 The lsquoall-petrolrsquo scenario is called S1 the lsquoE85rsquo scenario S2 The study comprises
emission calculations dispersion modelling population exposure analysis health impact assessment
Two dispersion model runs for the Vaumlstra Goumltaland region (see Figure 1b) are performed with the TAPM model In order to calculate the pollutants entering this region the larger scale EMEP (see Figure 1a) model is applied to the extended European region a) b)
Figure 1 The model area for a) the EMEP model and b) the TAPM model For the TAPM modelling the indicated square in b) is the model domain and the defined map is the Vaumlstra Goumltaland region
22 Emission factors
The study starts with establishing emission factors for petrol- and E85-fuelled cars This basically gives two sets of emission factors that can be applied to the projected traffic volumes For the Vaumlstra Goumltaland region the emission factors used with the exception of E85 cars are taken from
A comparison of emissions from ethanol and petrol fuelled cars IVL report B1962 Health risk assessment for Vaumlstra Goumltaland
5
the Artemis model (Andre 2005) This is a detailed emission model used also in the Swedish reporting of emissions from road traffic and must be considered as the source with the most accurate emission factors for road traffic for Swedish conditions Artemis contains emission factors for the year 2020 which are used in this study Speciation of NMVOC emissions (except for E85 fuelled cars) come from Passant (2002)
The emission scenarios used for Europe are built on EMEPrsquos lsquoCurrent Policyrsquo (CP) scenario for the year 2020 (Vestreng et al 2004) This scenario contains emissions and fuel consumption divided into different source sectors where one is road traffic In order to calculate the emissions for the two scenarios the relative change in emission factors for positive ignition injection cars between petrol and E85 are used
The data available in the EMEP emission database are however not detailed enough for the purpose of this study For example detailed information on the emissions from different vehicle categories is needed Further division of emissions of hydrocarbons on exhaust emission and evaporative emissions are needed as well as a breakdown of PM emissions on exhaust particles and wear particles Therefore a detailed partition of the traffic emissions in the gridded EMEP emission database is done for all countries in the EMEP model domain with help of the data on national emissions in the GAINS model (GAINS 2010) which includes a detailed breakdown of emissions to vehicle categories fuels used etc An exception is made for Sweden where the partition of emissions is calculated with the Artemis model (with the exception of the wear particles that are not covered by Artemis and are taken from GAINS) The GAINS model is an instrument used for policy scenario development and optimisation and contains data of activities (eg fuel and energy consumption) emission factors and emissions from different sources specified for detailed categories This model has a two-way connection to EMEP program in general and to the EMEP model in particular as the transport chemical conversion and deposition matrix for the pollutants emitted from individual countries in GAINS are pre-calculated by EMEP and the future policy scenarios in EMEP are generally consistent with GAINS scenarios as both tools are used for the LRTAP convention and the EU legislation work In the scope of this project it is found that EMEP and GAINS emissions are not fully consistent while the EMEP emission database is based on expert-assessed data reported by the member states the GAINS emissions are based on model calculations The continental scale modelling was based on the EMEP emissions database since this is a gridded database commonly used in EMEP modelling which has its historical scenarios validated within the EMEP monitoring program
While emission factors for petrol cars are relatively well established the data for E85 are much scarcer The Artemis model does not contain detailed emission factors for E85 cars and the situation is similar for the EMEP model The GAINS model considers only zero emissions of CO2 while all other emissions are the same as for petrol To obtain the emission factors for E85 cars data were sought in the open literature (see further below)
23 Traffic data
In order to calculate emissions the emission factors must be applied to data on traffic volumes of the different vehicle categories For Europe the mentioned EMEP policy scenario is used Since the traffic volumes are not available in the EMEP database the relative volumes of traffic in different vehicle categories relative to the total traffic volume are recalculated on national basis using the GAINS model
A comparison of emissions from ethanol and petrol fuelled cars IVL report B1962 Health risk assessment for Vaumlstra Goumltaland
6
For the whole Sweden the traffic prognosis and emissions obtained from the Artemis model are used The results here are very similar to what can be found in the EMEP database which is to be expected since Artemis is used in the Swedish reporting Figure 2 shows the fleet composition in Sweden 2020 from the Artemis model
Figure 2 Contribution of vehicles and fuel categories to the total transport work (vehicle-kilometersyear)
in 2020 in the Artemis model S1-scenario all categories with blue or green colour except the E85 busses use petrol S2-scenario all categories with blue or green colour use E85
For the Vaumlstra Goumltaland region the traffic data for 2005 come from two sources For the city of Gothenburg detailed traffic data are obtained from the local environmental agency For the remaining Vaumlstra Goumltaland region traffic data from the Swedish Transport Administration are used
The changes in all national Swedish emission sources in the EMEP model from year 2005 to 2020 are applied to the emission sources in the inventory for Vaumlstra Goumltaland to produce the 2020 emission scenario
24 Emissions
The emission factors and traffic data are used to obtain emissions in two emissions scenarios S1 where all ignition injection cars are assumed to use petrol and S2 where these cars all use E85 Note that all other road traffic sources such as diesel cars heavy duty vehicles etc are treated in the same way in both scenarios The emissions for Vaumlstra Goumltaland are also calculated for two base-scenarios for 2005 and 2020 where the actual traffic and fuel composition (for 2005) and a prognosis on traffic and fuel composition (for 2020) from the Swedish Transport Administration are used In the impact assessment however only the scenarios with all petrol or all E85 are used
The input of emission data required by the EMEP model consists of annual national emissions The species considered are sulphur dioxide (SO2) nitrogen oxides (NOX = NO+NO2) ammonia (NH3) non-methane volatile organic compounds (NMVOC) carbon monoxide (CO) and
busses dieselampCNG
busses E85
HGV diesel
HGV petrol
LCV diesel
LCV petrol
pass cars dieselCNG LPG hybridpass cars petrol
pass cars E‐85
A comparison of emissions from ethanol and petrol fuelled cars IVL report B1962 Health risk assessment for Vaumlstra Goumltaland
7
particulate matter (PM25 PM10) These emissions are provided for ten anthropogenic source sectors of which only emissions in the road traffic sector changes between the emissions scenarios calculated in this study The emissions are also distributed to vary between months weekdays and over the hours of the day Distribution of the NMVOC emissions between different compounds which are specific to each emission sector and country are used In this study this speciation will vary for road traffic between the scenarios as is described below
For the Vaumlstra Goumltaland region the emissions from traffic and non-road machinery are distributed as 500 m x 500 m grids while emissions from industry and heating plants are treated as point sources (including all physical processes usually connected to that type of sources) Emissions from ships are described as line sources The data are time resolved hourly over the day over the days of the week for each month
25 Dispersion modelling
Effects of the Europe-wide use of the E85 fuel on air pollution in Sweden are studied with two models on two different geographical scales To capture the large-scale changes especially those concerning ozone and other secondary air pollutants the European-scale chemistry transport model EMEP is used (Simpson et al 2003) The effects on exposure of people to air pollutants and consequent health effects are studied using air pollutant concentrations calculated with the small scale dispersion model TAPM which is nudged into EMEP air pollution fields (See Appendix 2 for details) In this way the large scale effects such as formation of ozone secondary PM and secondary aldehydes are accounted for also on the local scale In the case of benzene only the road traffic contribution is calculated due to lack of information on emissions from sources other than traffic
251 Local scale modelling
The TAPM model (Hurley 2008) is used to calculate the local contribution to air pollutants in the Vaumlstra Goumltaland region in the two scenarios The geographically distributed pollutants are then used for the exposure calculations and eventually the health risk assessment TAPM is a three dimensional meteorological and chemical model for air pollution studies that includes topography as well as land-use On the basis of this the model generates the meteorological parameters required for the dispersion modelling such as temperature layering (inversions) and three dimensional wind field all based on daily synoptic input data (large scale meteorological re-analyse data ndashcalled GASP (Global AnalysiS and Prediction) from Australian Government Bureau of Meteorology (wwwbomgovau) TAPM also includes chemistry such as NONO2 ozone SO2 and particle transformation Acetaldehyde and benzene are however not included in the chemical scheme of TAPM and these species are therefore simulated as reactive tracers in this study (see below)
In order to perform the calculations with TAPM a number of input data are required Emission data for the Vaumlstra Goumltaland region as described above Meteorological data Levels of the relevant pollutants on the model domain boundaries for the two scenarios
obtained from the EMEP model A model describing the decay of benzene and acetaldehyde emitted from traffic
A comparison of emissions from ethanol and petrol fuelled cars IVL report B1962 Health risk assessment for Vaumlstra Goumltaland
8
Since acetaldehyde and benzene are not included in the chemical scheme of TAPM their chemical lifetimes are set to be their rate constant with respect to the reaction with OH radicals multiplied by the OH mean concentrations obtained from the EMEP simulations (see below) Four different rates for the four seasons are used according to Table 1
Table 1 Rate constant for reaction with OH and chemical lifetimes for acetaldehyde and benzene used in the TAPM simulations
k(OH) Chemical lifetime (days)
mol-1 cm3s-1
Mar Apr May Jun Jul Aug Sep Oct Nov Dec Jan Feb
Acetaldehyde 15 10-11 12 04 13 155
Benzene 12 10-12 148 49 159 1937
252 EMEP modelling
Several EMEP models are developed and used for air quality policy work in Europe mainly for the Convention on Long-range Trans boundary Air Pollution The Unified EMEP model used in this study is designed to calculate concentrations in air and deposition patterns for major acidifying and eutrophying pollutants photo-oxidants and particulate matter In its standard version it has a 50 km x 50 km resolution in the horizontal direction and 20 layers distributed from the ground up to the pressure level of 100 hPa (ca 16 km) in the vertical direction A detailed description is given in Simpson et al (2003) The meteorological data used for the simulations obtained from wwwemepint are for the year 2005 and are of the same spatial resolution with a time resolution of three hours
As already mentioned the concentration fields generated by the EMEP model are used as an input to the TAPM model Boundary concentration fields for TAPM are calculated from hourly concentrations in the grid cells surrounding the Vaumlstra Goumltaland region that are weighted together with wind field vectors on corresponding boundaries of the Vaumlstra Goumltaland grid cells Since the chemistry of the organic compounds differs between the two models all organic compounds in EMEP are used and recalculated to the reactivity of organic compounds as used by TAPM
While the role of NOX NMVOC and primary PM can be investigated directly by simulations of emission in scenarios S1 and S2 effects of E85 fuelled cars on concentrations of acetaldehyde benzene and secondary PM are obtained from additional sensitivity runs The contribution of the emissions from the use of E85 fuel on acetaldehyde concentrations can be modelled directly in the EMEP model which includes also the formation and consumption of acetaldehyde in atmospheric reactions However TAPM does not include these processes and therefore the role of acetaldehyde formation is investigated further Two additional EMEP simulations are run one excluding primary acetaldehyde emissions and one excluding all NMVOC emissions from petrol and E85 fuelled vehicles By relating the results of these runs to the results of S1 and S2 the contribution of primary and secondary acetaldehydes respectively can be deduced The results from this analysis can be found in Appendix A23 The conclusion is that on the scale of the Vaumlstra Goumltaland region the formation of acetaldehydes in the atmosphere is not important and therefore the acetaldehyde concentration in TAPM can be described using the lifetimes given in Table 1 Further also the impact of the NMHC emissions on the ozone levels is studied (Appendix 23) and found to be small
Benzene is not included explicitly in the EMEP model The benzene concentrations are therefore studied in sensitivity runs with benzene from road traffic added to the S1 and S2 scenarios as
A comparison of emissions from ethanol and petrol fuelled cars IVL report B1962 Health risk assessment for Vaumlstra Goumltaland
9
methanol which has similar atmospheric lifetime as benzene The benzene concentration is then obtained by comparing the methanol concentration from the different runs
The contribution of primary and secondary PM respectively is investigated by excluding the primary PM from petrol and E85 fuelled vehicles in separate runs of the EMEP model The PM boundary values for the TAPM modelling are not separated into secondary and primary PM The results from this analysis are used to draw general conclusions about the difference in secondary PM formation between the two scenarios
26 Exposure
The human exposure of the annual mean concentrations of NOX NO2 O3 acetaldehyde and benzene are calculated based on the dispersion calculations of the Vaumlstra Goumltaland area in combination with the population density The population density distribution for the region is obtained from EEA (EEA 2009) and shown in Figure 3 The total population in the investigated area is 1 078 400
Figure 3 Population density distribution (number of people in a 1 km x 1 km grid for 2006) for the investigated area (according to Figure 1)
A comparison of emissions from ethanol and petrol fuelled cars IVL report B1962 Health risk assessment for Vaumlstra Goumltaland
10
27 Health effects and risk assumptions
271 NOX and NO2
Using modelled levels of NOX in the residential area as a vehicle exhaust marker a Norwegian study of 16 000 men from Oslo of whom 25 died during the follow up found a strong association (Nafstad et al 2004) This cohort with people of between 40-49 years of age at the start of the study was followed from 197273 through 1998 NOX was estimated in a model with 1000 m grids and a street contribution added for the largest streets When the median concentration of NOX for 1974-78 was used (mean 107 μgm3) the relative risk for total non-violent mortality was 8 per 10 μgm3 Nitrogen oxides do not have to be important as causal components behind this association
272 Ozone
Short-term effects of ozone on the respiratory system and on daily number of deaths have been reported from a large number of studies especially for summer concentrations why a threshold has sometimes been assumed in impact assessments Only recently has an effect of long-term exposure on mortality been reported from the very large American Cancer Society (ACS) Cohort Study (Jerret et al 2009)
Jacobson (2007) reported that E85 would cause an increase in mortality but assumed an effect of short-term exposure only The estimated impact was explained by the calculated ozone formation
273 Acetaldehyde
An increased incidence of nasal tumours in rats and laryngeal tumours in hamsters were observed after inhalation of high concentrations of acetaldehyde (HEI 2007) A few epidemiological studies of occupational exposure found associations but with a complex mixture of chemicals and have not been used in the cancer risk assessment for acetaldehyde Acetaldehyde is classified by the National Institute of Occupational Safety and Health as ldquoa potential human carcinogenrdquo by the US EPA (1999) as ldquoa probable human carcinogenrdquo and by the IARC as ldquopossibly carcinogenic to humansrdquo (OEHHA 1999 HEI 2007)
274 Benzene
There is clear and widely accepted evidence from a variety of epidemiologic studies of occupational exposure that benzene increase the risks of acute myeloid leukaemia (HEI 2007) but there is more uncertainty about other lymph hematopoietic cancers Studies on traffic exposure and childhood leukaemia have produced mixed results with regard to associations
275 Formaldehyde
IARCrsquos Monograph 88 says that the evidence is sufficient to conclude that formaldehyde causes cancer in humans (IARC 2006) This was because of evidence of nasopharyngeal cancer at concentrations historically encountered in industrial settings However this conclusion by IARC was largely based on the results from one occupational exposure site and the results and conclusions have not been supportive in other reviews and more recent studies (Bosetti et al 2006 Beane Freeman et al 2009 Bachand et al 2010) OEHHA (1999) uses a lifetime risk for cancer of 0000006 per microgm3 for formaldehyde and US EPA (1999) a lifetime risk of 0000013 per microgm3
A comparison of emissions from ethanol and petrol fuelled cars IVL report B1962 Health risk assessment for Vaumlstra Goumltaland
11
For non-cancer effects the eye is the organ most sensitive to formaldehyde subjective irritation has been reported at 300-500 microgm3 which is above the odour thresholds (Wolkoff amp Nielsen 2010) Effects in the eyes and in airways occur around 600ndash1000 μgm3 Effects on lung function have not been found in controlled human exposure studies below 1 mgm3 In epidemiological studies of associations between formaldehyde and exacerbation of asthma several co-pollutants make the findings difficult to interpret An indoor air quality guideline of 100 μgm3 has been considered protective against both acute and chronic sensory irritation in the airways in the general population assuming a lognormal distribution of nasal sensory irritation (Wolkoff amp Nielsen 2010)
276 PM
In the studies of long-term exposure to PM25 and mortality like the American Cancer Society (ACS) Cohort the exposure contrast were mainly related to secondary PM why the reported relative risk approx 6 increase in all-cause mortality (in adults) per 10 μgm3 is most relevant for background secondary PM concentrations (Pope et al 1995)
277 Health Impact Assessment
To summarize the types of pollutants that are found possible to include in the health impact assessment are NOX and NO2 benzene acetaldehyde formaldehyde secondary PM and ozone The assessment is restricted to the most important and well established effects of these pollutants This means that not all types of potential health impacts are included Results should however do for a comparison of the scenarios
The impact on formaldehyde levels are not calculated why it is not included in the current assessment Relative risks from epidemiological studies of vehicle exhaust using NOX and NO2 as exposure variables may be influenced from effects of their co-pollutants mainly ultrafine particles (elemental carbon soot) CO and HCs such as formaldehyde Exhaust particles are often introduced in a relatively high background of particles from other sources Thus exhaust particles were not measured directly in the important studies of long-term exposure and effects on mortality
3 Results
31 Emission factors
The emission factors are selected from available published data both for the exhaust and the evaporative emissions In both cases values relative to petrol are used The majority of the studies have been done with both E85 and petrol making this comparison more robust
Westerholm et al (2008) tested two flexi-fuel cars with E5 E70 and E85 in the European driving cycle NEDC and in the Artemis driving cycles The former is used at two temperatures (22degC and -7degC) They report the regulated emissions greenhouse gases a number of organic compounds and particle number Graham et al (2008) present measurement results for regulated emissions greenhouse gases and a number of organic compounds from four cars with E85 and regular petrol in the FTP cycle They also made a compilation of literature data for ethanol cars Yanowitz and McCormick (2009) present an analysis of US certification testing data in order to compare emissions for E85 and petrol
A comparison of emissions from ethanol and petrol fuelled cars IVL report B1962 Health risk assessment for Vaumlstra Goumltaland
12
The results from the three studies (for flexi fuel cars) and in addition the values used by Jacobson (2007) are given in Table 2
Table 2 Emissions factors for E85 fuelled cars relative to the emission factors for petrol fuelled cars
Relative change E85 vs petrol ()
Yanowitz and McCormick (2009) (95 conf)
Graham et al (2008) (sd )
Westerlund et al (2008) (average for NEDC)
Jacobson (2007)
NOX -14 (-23 - -5) -42 (15) -38 -30 NMOG 26 (17 - 37) 12 (39) NMHC -43 (-52 - -32) -45 (24) THC -14 (-24 - -4) 2 TOG 22 CO -19 (-25 - -12) -5 (51) 1 5 PM 25 0 Formaldehyde 59 (32 - 91) 80 (44) 184 60 Acetaldehyde 2855 (1189) 1031 2000 13 Butadiene -64 (31) -74 -10 Benzene -72 (15) -71 -79 Ethanol 3950 from TOG Methane 50 43
Table 2 shows lower emissions of NOX for E85 fuelled cars relative to petrol fuelled cars from test cycles generally including cold starts The emissions of hydrocarbons are higher for petrol while the emissions of organic gases are somewhat higher for E85 The emissions of aldehydes especially acetaldehyde are much higher for E85 as are the emissions of ethanol and methane The emissions of benzene and 13-butadiene are higher with petrol It should be noted that the data in Table 2 are in general for tests performed at ambient temperatures of around 20 degC Westerlund et al (2008) report that for ambient temperatures of -7 degC the emissions of CO and NMHC may be significantly higher with E85 compared with petrol For one vehicle they also report very high NOX emissions with petrol at this lower temperature
As seen in Table 2 there are a number of different quantities when it comes to the emission of organic compounds or unburnt fuel From a chemistry point of view HC is no molecule but a notation for the sum of all compounds that are hydrocarbons thus are of the form HxCy and not containing any elements but carbon and hydrogen Total organic gases (TOG) include organic compounds containing oxygen such as alcohols and aldehydes (but not CO or CO2) Volatile organic compounds (VOC) means carbon containing organic compounds present in the gaseous state at ambient temperature Non-methane hydrocarbons (NMHC) means HC minus the methane mass NMTOG and NMVOC are defined in the corresponding way1
1 When it comes to exhaust gas regulations the definitions differ somewhat In the US THC is defined as the signal obtained from a FID (Flame Ionisation Detector) instrument calibrated on propane This means that alcohols and aldehydes contribute to THC but to a lower extent since their responses in a FID instrument are lower than for hydrocarbons TOG is defined in the US regulations as THC + the mass of alcohols (eg methanol) and carbonyls (eg formaldehyde) measured separately NMHC is equal to THC ndash rCH4CH4 ndashralcAlc where the CH4-concentration is measured by gas chromatography and a FID calibrated with methane Alc is the alcohol concentration and rCH4curren and rAlc are the respective FIDresponse functions NMOG means TOG - CH4 and VOC is TOG - CH4 - C2H6 In the regulations it is stated that also a number of other non-ozone forming organic compounds eg acetone should be subtracted but these are present in very low concentrations in engine exhaust Note that there is actually a double counting of aldehydes in NMOG since they contribute to a certain extent to the NMHC value and then are added using values from separate measurements
A comparison of emissions from ethanol and petrol fuelled cars IVL report B1962 Health risk assessment for Vaumlstra Goumltaland
13
There will be emission limits for both THC and NMHC in also the future For petrol cars with low methane emissions the challenge will be to meet the limit for NMHC For E85 cars with higher methane emissions the challenge will be to meet the THC limit Thus it is reasonable that the emissions of NMHC from E85 cars will be lower than for petrol cars
In the modelling presented here the emission factors from Graham et al (2008) are used with some exceptions as will be discussed The reason is that that study comprises a compilation of a relatively large number of tests For CO the emission factor is set to the same value for E85 and petrol since the differences are small and within the uncertainty For particle emissions the studies cited in Table 2 give little information Instead data from Ericsson et al (2008) are used indicating that the primary PM emission using E85 is about 65 of that when using petrol For NOX the emission for E85 is set to 58 of that for petrol
The emission factors for NMHC (physical emission in gkm) including ethanol are in this study set to the same value for E85 as for petrol This is in line with the data for NMOG reported by Graham showing only small differences It is also reasonable considering that the car producers optimize emissions to meet the future emission legislation in Europe for NMHC and THC i e the Euro 6 standards that apply from September 2014 For petrol with low CH4 emissions the NMHC value will be limiting and this is on 68 mgkm For E85 with higher CH4 emissions the THC value of 100 mgkm will be limiting When considering the FID response as a measure of emission instead of physical emission about 50 of the THC comes from NMHC for E85 cars However the FID response is low for ethanol which means that the physical NMHC emission is about 25 higher Considering these factors the emissions of NMHC (physical) for E85 can be expected to be around 50 mgkm 125 = 625 mgkm which is about the same as for petrol The methane emission for E85 is set to 142 times the value for petrol following Lipman and Delucchi (2002) Further also the differences in the evaporate emissions are considered as is described in Appendix 1
The emissions factors for petrol cars are taken from the Artemis model (Andreacute 2005) The distribution of NMHC for petrol cars is from Passant (2002) The resulting emission factors used to obtain the emissions scenarios are presented in Table 3
In Europe THC is defined as the signal from a propane calibrated FID and thus contains oxygen containing compounds although the response factors for the latter are lower The FID instrument gives the number of molecules and in order to calculate the mass the EU regulations use the densities obtained from assuming the molecular formulas C1H274O0385 (209 gmole) for E85 and C1H189O0016 (1415 gmole) for petrol This thus compensates for the lower response factor for ethanol and acetaldehyde NMHC is obtained by subtracting the concentration of CH4 (times the FID response factor) measured separately
A comparison of emissions from ethanol and petrol fuelled cars IVL report B1962 Health risk assessment for Vaumlstra Goumltaland
14
Table 3 Emission factors (gkm) for 2020 for passenger cars (including evaporative emissions but excluding wear particle emissions) used in the modelling
Petrol E85 NOX 0112 0065 CO 179 174 PM 00013 00008 CH4 0013 0018 NMHC 033 028
division of NMHC Ethanol 00000 01898 Acetaldehyde 00025 00299 Ethene 00244 00237 Ethyne 00094 00011 Formaldehyde 00057 00072 Benzene 00187 00045 13 Butadiene 00030 00009 Ethane 00107 00009 Alkanes C3+ 00928 00076 Alkenes C3+ 00301 00025 Aromatics C7+ 01297 00106 Aldehydesketones C3+ 00051 00004
sum NMHC 03321 02792
32 Emissions
The emissions from road traffic vary between the two scenarios due to the differences in the emission factors From the EMEP modelling the total emissions from road traffic in the different scenarios are calculated for the countries included In Figure 4 emissions of NOX NMVOC and PM in the S2 (E-85) scenario relative to the S1 (all-petrol) scenario are shown for these countries The relative change is larger for countries with a high fraction of petrol cars relative to diesel cars (since the latter are the same in the two scenarios) such as Russia and Ukraine The relative change is smallest for PM emissions due to the very small contribution of the exhaust particles from petrol fuelled cars compared to the contribution from diesel vehicles and wear particles
A comparison of emissions from ethanol and petrol fuelled cars IVL report B1962 Health risk assessment for Vaumlstra Goumltaland
15
Figure 4 National emissions of NOX NMVOC and PM from the road traffic sector in E85 scenario (S2)
relative to lsquoall-petrolrsquo scenario (S1)
An important difference in the emissions between the scenarios lies in the speciation of the NMVOC emissions Figure 5 shows this speciation of NMVOCs for all road traffic emission categories used in this study The two rightmost bars in Figure 5 show the NMVOC speciation for Swedish road traffic emissions for the two scenarios S1 and S2 Comparison with Figure4 shows that the relative changes between the two scenarios are much larger for some individual NMVOC species that for the total NMVOC emissions Since the NMVOC emissions from traffic in Sweden are dominated by the emissions from petrol cars (about 85 of the road traffic emissions of NMVOC comes from petrol cars) the variations in NMVOC speciation between petrol and E85
0
02
04
06
08
1
NOx
0
02
04
06
08
1
NMVOC
0
02
04
06
08
1
Aus
tria
Bel
arus
Bel
gium
Bos
-Her
cB
ulga
riaC
roat
iaC
ypru
sC
zech
Rep
Den
mar
kE
ston
iaFi
nlan
dFr
ance
Ger
man
yG
reec
eH
unga
ryIr
elan
dIt
aly
Lat
via
Lith
uani
aL
uxem
bour
gM
alta
Net
herla
nds
Nor
way
Pola
ndPo
rtug
alR
oman
iaR
ussi
a_E
uro
Slov
ak R
epSl
oven
iaSp
ain
Swed
enSw
itzer
land
Tur
key
Ukr
aine
UK
PM
A comparison of emissions from ethanol and petrol fuelled cars IVL report B1962 Health risk assessment for Vaumlstra Goumltaland
16
will have a significant impact on the total road traffic NMVOC speciation As can be seen in Figure 5 scenario S1 is dominated by alkanes and aromatics while scenario S2 is dominated by ethanol It can also be noted that S1 contains a significant emission of benzene which is much lower in S2 while the opposite is true for acetaldehyde
Figure 5 Distribution of hydrocarbon species in NMVOC emissions from individual road traffic emission
categories as defined in emission scenarios in this study and from the whole road traffic emission sector in Sweden for scenarios S1 (All petrol) and S2 (All E85)
Figure 6 shows a map of the EMEP domain with emissions of acetaldehyde for the two studied scenarios as an example of the geographical distribution of emissions
Figure 6 Gridded emissions of acetaldehyde for the year 2020 (in tonnes per grid cell (50 km x 50 km)
and year) a ndash lsquoAll petrol scenario b ndash lsquoAll E85 scenariorsquo
As mentioned the emissions from road traffic in the Vaumlstra Goumltaland region are calculated in a 500 m x 500 m grid Figure 7 shows the emissions of NOX for 2005 as obtained from the database and the projected emissions for 2020 with a mixed use of E85 and petrol This can be considered as the base case for the emissions in 2020 It can be seen that the emissions decrease over the period which is due to reduction in NOX emissions factors as older vehicles are replaced by newer models (the traffic actually increases from a total of 754x109 vehicle-kilometres in 2005 to 937x109
0
20
40
60
80
100
Pet
rol e
xh
Pet
rol e
vap
E-8
5 ex
h
E-8
5 ev
ap
Pet
rol M
C
Die
sel L
DV
Die
sel H
DV
Roa
d Sw
eden
S1
Roa
d Sw
eden
S2
m
ass
Ethane
Alkanes C3+
Ethene
13 Butadiene
Alkenes C3+
Ethyne
Benzene
Aromatics C7+
Formaldehyde
Acetaldehyde
Aldket C3+
Ethanol
A comparison of emissions from ethanol and petrol fuelled cars IVL report B1962 Health risk assessment for Vaumlstra Goumltaland
17
vehicle-kilometres in 2020) The major roads in the region are clearly visible as well as the larger cities (especially Gothenburg)
Figure 7 Emissions of NOX (kgyear for a 500 m x 500 m grid cell) in the Vaumlstra Goumltaland region for 2005
and for 2020 for the base case
In Table 4 the traffic emissions for NOX benzene acetaldehyde ethanol and PM10 for the Vaumlstra Goumltaland region are shown for the four different emissions scenarios The emissions of NOX and benzene are reduced between 2005 and 2020 for the base case while the emissions of ethanol and acetaldehyde increase due to an expected increase in the use of ethanol fuel The NOX emissions for S1 are somewhat higher than for S2 due to the higher NOX emissions factor for petrol compared with E85
Table 4 Emissions from traffic for the Vaumlstra Goumltaland region in four different emission scenarios (in tonnesyear)
Substance base 2005 base 2020 S1 S2 NOX 13 243 4 843 4 954 4 631 Benzene 2 833 927 1 201 386 Acetaldehyde 628 1 074 305 2 595 Ethanol 192 5 192 0 15 400 PM10 1 324 486 483 476
33 Dispersion modelling
Resulting concentrations from calculations of the S1 and S2 scenarios with the EMEP model are used to provide input of primary and secondary air pollutants for the calculations with the TAPM model for the Vaumlstra Goumltaland region Concentrations of NOX NMVOC PM25 PM10 acetaldehyde ethanol and benzene are therefore calculated as boundary conditions for the Vaumlstra Goumltaland region In addition sensitivity studies are performed to investigate the role of formation of secondary acetaldehyde and secondary particulate matter (see Appendix 2) Time series analysis of the TAPM and EMEP model results of the S1 and S2 scenarios are presented in Figure 8
A comparison of emissions from ethanol and petrol fuelled cars IVL report B1962 Health risk assessment for Vaumlstra Goumltaland
18
a)
b)
Figure 8 Time series analyses of S1 and S2 scenarios for the EMEP and TAPM modelled concentrations of NOX and ozone at an urban background site in Gothenburg (TAPM) and in EMEP model grid cells including Gothenburg city (50 km x 50 km)
Concentrations of NOX and ozone at an urban background site in Gothenburg (TAPM) and in the 50 km x 50 km EMEP grid cells including Gothenburg are compared for one summer and one winter month Due to the well-known process of ozone titration by freshly emitted nitrogen monoxide (Seinfeld and Pandis 1998) the concentration of ozone often decreases in urban areas This phenomenon is expected to be captured by the fine-gridded TAPM model but not necessarily by the courser scale of the EMEP model Figure 8 shows the generally higher NOX levels in the small grid cell of the TAPM model in urban background location comparing to those in the large EMEP grid cell while the opposite is observed for the ozone concentrations (Remember that the boundary concentrations for TAPM are obtained from the EMEP model and they are thus the same in both cases) This indeed shows that local scale emissions and processes contribute to locally increased levels of NOX in urban areas both for the summer and the winter cases For ozone where there of course are no primary emissions the situation is the opposite where instead the result is decreased concentration levels at urban sites on a local scale The influence of the
A comparison of emissions from ethanol and petrol fuelled cars IVL report B1962 Health risk assessment for Vaumlstra Goumltaland
19
NMHC emissions from the passenger cars is studied in a sensitivity analysis (see Appendix 23) and it is found to have only a small influence on the ozone levels
To illustrate the results of the different scenario calculations the geographically distributed concentrations are presented as the difference in yearly average concentrations between the all E85 (S2) and all petrol (S1) scenarios both as microgm3 and sometimes as percentage of the difference to scenario S1 (see Appendix 3)
The difference in yearly average concentrations between scenario S1 and S2 for acetaldehyde and benzene can be seen in Figures 9 and 10 respectively The increase in acetaldehyde concentration resulting from a switch from petrol to E85 is up to about 05 gm3 or 80 in the central parts of the largest urban area of the region Gothenburg Outside this area the relative increase is about 10 for the other urban areas and less than that for the rural areas This large relative increase (see map in Appendix 4) is a result of the relatively high emissions of acetaldehyde from E85 fuelled cars For benzene the situation is opposite In the scenarios for 2020 the concentration of benzene decreases by up to a few tenths of gm3 as a result of a switch from petrol to E85 For benzene the relative change is not calculated
Figure 9 The difference in yearly average concentrations of acetaldehyde for 2020 between the all E85 (S2) and all petrol (S1) scenarios (microgm3)
A comparison of emissions from ethanol and petrol fuelled cars IVL report B1962 Health risk assessment for Vaumlstra Goumltaland
20
Figure 10 The difference in yearly average concentrations (gm3) of benzene for 2020 between the all E85 (S2) and all petrol (S1) scenarios
The difference in the calculated NOX NO2 and ozone concentrations between the two scenarios are shown in Appendix 4 The change in NOX concentration between the two scenarios only represents a small fraction of the total NOX concentration This is because the emissions of NOX from petrol cars are relatively low compared with the contribution from diesel engines and other sources Thus the resulting decrease in the NOX concentration with E85 is only up to 3 For ozone there is a small increase of about 01 microgm3 of E85 in the central areas of Gothenburg where there is relatively high traffic intensity (see Appendix 4 Figure A9) In the rest of the region there is a small decrease in the ozone concentration in the E85 scenario
34 Exposure
The resulting concentrations from the dispersion modelling together with the population density distribution are used to assess the exposure to acetaldehyde benzene NO2 NOX and ozone for the two scenarios S1 and S2 The exposure to PM25 is very similar for the two scenarios (the difference in concentration between scenarios S2 and S1 is only about -002 gm3 Table 5 shows the population weighted mean exposure both as total concentrations and as the difference between the two scenarios Detailed exposure results can be found in Appendix 5 It can be seen that the exposure to all the pollutants in Table 5 with the exception of acetaldehyde are somewhat lower for the all E85 scenario (S2) than for the all petrol scenario (S1) However the effect on health also
A comparison of emissions from ethanol and petrol fuelled cars IVL report B1962 Health risk assessment for Vaumlstra Goumltaland
21
depends on the level of the dose-response functions For example if the level of concentration is low in a populated area but the dose-response function is high the effect of even a low concentration increase can become important The increase in exposure from S1 to S2 (S2-S1) calculated as percentage of the population exposed to increased mean concentrations of pollutants is presented in Figure 11
Table 5 Populated weighted mean exposure (gm3)
S1 S2 S2-S1 Acetaldehyde 065 077 014 Benzene 01 005 -007 NOX 85 84 -012 Ozone 570 569 -012 PM25 270 268 -002
Increased concentrations Decreased concentrations Both increased and
decreased conc
Figure 11 The relative exposure (S2-S1) calculated as percentage of the population
In Figure 11 it is clear that the only pollutant that does not show an improvement regarding air quality and thus the health risks when modelling a switch from petrol to E85 is acetaldehyde For all pollutants except for ozone the changes of concentration levels observed between the scenarios are within the urban areas but for ozone there are also differences in rural areas
According to the data in Figure 11 about 14 of the population in the Vaumlstra Goumltaland region will be exposed to 03-08 microgm3 higher concentration levels of acetaldehyde in scenario S2 relative to S1 From Figure 9 it can be seen that the majority of these people live within the Gothenburg area Further about 28 of the population will be exposed to increased levels of between 01 to 03 microgm3 mainly in the suburban areas and rural surroundings of Gothenburg but also in some of the smaller cities in the region Outside the urban areas the concentration difference is lower than 01 microgm3
In the S2 scenario relative to the S1 scenario the population is exposed to decreased concentration levels of benzene and NOX This is mainly true also for O3 but with an exception for the central
A comparison of emissions from ethanol and petrol fuelled cars IVL report B1962 Health risk assessment for Vaumlstra Goumltaland
22
parts of Gothenburg where the concentration actually increases (see Appendix 4 Figure 7A) resulting in that 3 (blue area in Figure 11 for O3) of the population will be exposed to higher concentrations of O3 For the rest of the area there are decreased concentrations of ozone upon a switch to E85
The largest differences are again in the central parts of Gothenburg where about 20 of the population is being exposed to a lower benzene concentration of 01-03 microgm3 This also means that concerning benzene the majority (78) of the population have none or very low influence from a change to ethanol fuel
The largest effect on exposure difference is seen for NOX where just over 20 of the population has its exposure decreased with 03-05 microgm3 (in the central parts of Gothenburg) In the suburbs the decrease is between 01-02 microgm3 lower Along the largest roads there is a small but visible improvement on a yearly basis of 01 microgm3
For PM25 there is a difference in the populated weighted mean exposure of 002 gm3 between the scenarios with a lower value for the all-E85 case (see also Appendix 5)
35 Impact on health in Vaumlstra Goumltaland
351 NO2 and NOX
The impact of long-term exposure on mortality was estimated using the relative risk from the Norwegian cohort study (Nafstad et al 2004) reporting a relative risk of 08 increase per microgm3 increase in NOX however without adjustment for particle concentrations Assuming this effect on the total mortality and a typical baseline mortality of 1000 deaths per 100 000 person years a decrease in the population mean exposure of 012 microgm3 would correspond to approximately 104 less preterm deaths per year However for the present case this number is highly uncertain since the exposure to substances normally associated with changes in NOX exposure may here change in different ways since the relation between different exhaust components varies between the scenarios
The impact of long-term exposure on asthma incidence (new cases) in adults has been estimated using results from the Swedish RHINE Study Cohorts (Modig et al 2009) with very similar results in the ECRHS Study corresponding to approx 4 increase per microgm3 increase in NO2 From the RHINE Study the incidence can be estimated to 03 per year (proportion of adults developing the disease) with children and elderly excluded this means around 1500 adult cases per year A reduction of 009 microgm3 corresponds to 54 avoided new cases of adult asthma per year However also NO2 in the asthma study may have been mainly an indicator of vehicle exhaust
352 Ozone
The impact of long-term exposure on respiratory mortality has been reported to be approx 02 per microgm3 increase in the summer concentration when studied in the large ACS Cohort (Jerret et al 2009) Assuming this effect on the total population and a typical baseline respiratory mortality of 100 deaths per 100 000 person years a decrease in the population mean exposure of 012 microgm3 corresponds to approximately 03 less preterm deaths per year
A comparison of emissions from ethanol and petrol fuelled cars IVL report B1962 Health risk assessment for Vaumlstra Goumltaland
23
353 Acetaldehyde
According to US EPA (1999) a lifetime risk for cancer of 0000002 per microgm3 is to be assumed for this potential human carcinogen An increase in the population mean exposure of 012 microgm3 corresponds to 026 cases more per year in the current population
354 Benzene
According to US EPA (1999) a lifetime risk for cancer (leukaemia) of 00000022-00000078 per microgm3 is to be assumed for this human carcinogen A decrease in the population mean exposure of 0074 microgm3 corresponds to approximately 03 cases less per year in the current population (assuming 0000004 per microgm3)
355 PM25
In CAFEacute and other impact assessments a relative risk of 6 increase in all-cause mortality per 10 microgm3 has usually been assumed Assuming this effect on the total mortality and a typical baseline mortality of 1000 deaths per 100 000 person years a decrease in the population mean exposure of 002 microgm3 corresponds to approximately 13 less preterm deaths per year
4 Discussion
In this study the health risks from a large introduction of E85 to replace petrol is analysed in scenario studies for 2020 for the Vaumlstra Goumltaland region It is found that the change in pollutant concentration exposure and health risks are small between the two scenarios It should be emphasized that the study only considers vehicle emissions and does not take into account effects from the fuel production
The emissions of NOX in the model are somewhat lower from E85 fuelled cars than from petrol fuelled cars This is in line with the emission factors used by Jacobson (2007) The nitrogen oxides are key substances in the atmospheric reactions determining the concentrations of ozone in air NOX is involved in the formation of ozone but close to the NO source the ozone concentration is lowered due to the rapid reactions between NO and O3 forming NO2 If NO is released in an environment with already high NO concentration it may result in lowering of ozone levels on the regional scale In the present study the ozone concentrations calculated are somewhat lower for the E85 scenario than for the petrol scenario
The health risk analysis shows that the main difference between the scenarios is due to the lower concentration of NOX However it may have been other exhaust components than NOX such as exhaust particles that were behind the reported association with mortality In cases when NOX is not a good indicator of exhaust particle emissions and their toxicity our results may be misleading This should be studied further Neglecting the effects of the changes in NOX exposure the total difference between the scenarios sums up to 16 preterm deaths per year with lower values for the E85 scenario while it would sum up to 12 less preterm deaths for the E85 scenario if the effect related to NOX were included Since there are no similar studier for the effect on mortality among those younger than 30-50 years of age we assume the same relative effect on mortality in all ages This makes only a small difference since the large majority of deaths occur in older groups
A comparison of emissions from ethanol and petrol fuelled cars IVL report B1962 Health risk assessment for Vaumlstra Goumltaland
24
The opposite result for the ozone concentration was obtained by Jacobson The reason for this discrepancy is that the Jacobson study concerns Los Angeles a region with high concentrations of pollutants while the study here concerns the Vaumlstra Goumltaland region with much less dense traffic and also lower concentrations of pollutants importantly NOX It is not unlikely that the effect that Jacobson report also would be found for large parts of Europe with higher traffic densities than in the Vaumlstra Goumltaland region
It is worth to emphasize that the major negative health effect in the Jacobson (2007) study is attributed to the increase in ozone concentration that is a result of the decrease of the NO emissions from E85 cars Directly after the emission NO reacts with ozone resulting in drop of the ozone concentration the so-called ozone titration commonly observed in many cities This NO does however form even higher quantities of ozone further downwind contributing to the general increase in the background ozone levels It is also precursor of NO2 secondary PM and other toxic species as eg PAN and hence reductions in NO emissions are never regarded as disbeneficial from the environmental viewpoint
There are of course several sources of uncertainties that influence the results of this study Since the main results concern differences between the two scenarios several of these factors loose on importance for the conclusions This comprises uncertainties in meteorology in future traffic volumes and in the population density distribution However there are some uncertainties that remain important The emission factors for E85 fuelled cars are much less characterised than what they are for petrol cars The emission of particles from E85 fuelled cars is especially uncertain with only very few published results Also the emissions of NMHC are somewhat uncertain and may be higher for E85 at lower ambient temperatures However the sensitivity analysis performed shows that for the studied region the NMHC emissions only have a small influence on the ozone concentrations
5 Conclusions
In this study the impact of tailpipe and evaporative emissions from E85 fuelled cars on air pollution and health risks are calculated and compared with petrol fuelled cars The scenario calculations for the Vaumlstra Goumltaland Region give data on emissions pollutant concentrations exposure and a health risk evaluation
The differences in emission factors between E85 and petrol lies in the emissions of PM and NOX which are about 65 and 58 for E85 relative petrol respectively Also the speciation of the emitted hydrocarbons is significantly different with large emissions of acetaldehyde and ethanol from E85 and large emissions of benzene higher aromatics alkanes and alkenes from petrol
These differences in emission factors reflect in differences in emissions The emission calculations for all Swedish road traffic show a decrease for the E85 scenario relative to the petrol scenario of 65 for NOX 34 for PM25 67 for benzene For acetaldehyde there is an increase of 770
The differences obtained from the TAPM modelling show decreased levels of NOX ozone and benzene with E85 and increased levels of acetaldehyde For the latter the increase may be up to 80 while NOX and ozone show decreases of up to a few per cent and a few tenths of per cent respectively
A comparison of emissions from ethanol and petrol fuelled cars IVL report B1962 Health risk assessment for Vaumlstra Goumltaland
25
The health risk assessment shows decreased health risks in the E85 scenario relative the all-petrol scenario due to the increased NOX exposure correlated with both preterm deaths and asthma However NOX may be mainly an exhaust indicator Smaller effects are expected from the changes in ozone acetaldehyde and benzene exposure The overall difference considering the exposure to PM acetaldehyde benzene and ozone is 16 preterm deaths with lower values for the E85 scenario
6 Acknowledgements
Saab Automobile The Swedish Transport Administration and The Foundation for the Swedish Environmental Research Institute are gratefully acknowledged for financial contribution
Magnus Ekstroumlm and Maria Holmstroumlm at Saab and Martin Juneholm at the Swedish Transport Administration are acknowledged for their most valuable input to the study
David Simpson Norwegian Meteorological Institute EMEP MSC-W Norway and Dept Radio amp Space Science Chalmers Univ Technol Sweden is gratefully acknowledged for help with implementation of the Unified EMEP model
A comparison of emissions from ethanol and petrol fuelled cars IVL report B1962 Health risk assessment for Vaumlstra Goumltaland
26
7 References
Altenstedt J Pleijel K 2000 An alternative approach to photochemical ozone creation potentials under European conditions J Air amp Waste Manage Assoc 50 1023 ndash 1036
Andre J-M (2005) Vehicle emission measurement collection of the ARTEMIS datatbase Artemis 3312 report Available from httpwwwinretsfrurltepublicationspublications-pdfJoumardA3312reportJMALTE0504pdf
Bachand A MMundt K A Mundt D JMontgomery R R Epidemiological studies of formaldehyde exposure and risk of leukemia and nasopharyngeal cancer A meta-analysis Critical Reviews in Toxicology 2010 40(2) 85ndash100
Beane Freeman L E Blair A Lubin J H Stewart P A Hayes R B Hoover R N Hauptmann M Mortality from lymphohematopoietic malignancies among workers in formaldehyde industries The National Cancer Institute Cohort J Natl Cancer Inst 2009101751ndash761
Bosetti C McLaughlin J K Tarone R E Pira E LaVecchia C Formaldehyde and cancer risk A quantitative review of cohort studies through 2006 Ann Oncol 20081929ndash43
ConcaweJRC Well-to-wheel studies httpiesjrceceuropaeuwtwhtml
Derwent R G Jenkin M E Saunders S M 1996 Photchemical ozone creation potentials for a large number of reactive hydrocarbons under European conditions Atmos Environ 30 181 ndash 199
Derwent RG Jenkin ME Passant NR Pilling MJ 2007 Photochemical ozone creation potentials (POCPs) for different emission sources of organic compounds under European conditions estimated with a Master Chemical Mechanism Atmos Env 41 2570ndash2579
EEA Copenhagen 2009 wwweeaeuropaeudata-and-mapsdatapopulation-density-disaggregated-with-corine-land-cover-2000-2
Ericsson P Holmstroumlm M Amberntsson-Carlsson A Ohlson C Skoglundh M Andersson B Carlsson P-A 2008 Characterization of particulate emissions and methodologhy for oxidation of particulates from non-diesel combustion ystems SAE Technical Paper Series 2008-01-1746
GAINS 2010 httpgainsiiasaacatindexphpgains-europe
Graham LA Belisle SL Baas C-L Emissions from light duty gasoline vehicles operating on low blend ethanol gasoline and E85 Atmospheric Environment 42 4498 (2008)
Haskew H M Thomas P E Liberty F 2006 Fuel Permeation From Automotive Systems E0 E6 E10 E20 And E85 Final Report CRC Project No E-65-3 Coordinating Research Council Inc 3650 Mansell RoadSuite 140Alpharetta GA 30022
HEI Air Toxics Review Panel (2007) Mobile-Source Air Toxics A Critical Review of the Literature on Exposure and Health Effects HEI Special Report 16 Health Effects Institute Boston USA
Hurley P TAPM v 4 User Manual 2008 CSIRO ISBN 978-1-921424-73-1
IARC (2006) IARC Monographs on the Evaluation of Carcinogenic Risks to Humans Wood Dusts and Formaldehyde Lyon World Health Organization International Agency for Research on Cancer Lyon France 8837ndash325
Jacobson M Z Effects of Ethanol (E85) versus Gasoline Vehicles on Cancer and Mortality in the United States Environ Sci Technol 2007414150-4157
A comparison of emissions from ethanol and petrol fuelled cars IVL report B1962 Health risk assessment for Vaumlstra Goumltaland
27
Jerret M Burnett R T Pope C A Ito K Thurston G Krewski D Shi Y Calle E Thun M Long-Term Ozone Exposure and Mortality N Engl J Med 20093601085-95
Lipman T E Delucchi M A 2002 Emissions of nitrous oxide and methane from conventional and alternative fuel motor vehicles Climate Change 53 477
Modig L Toreacuten K Janson C Jarvholm B Forsberg B Vehicle exhaust outside the home and onset of asthma among adults Eur Respir J 2009 Jun33(6)1261-7
Nafstad P Haheim L L Wisloff T Gram F Oftedal B Holme I Hjermann I Leren P Urban air pollution and mortality in a cohort of Norwegian men Environ Health Perspect 2004112(5)610-5
OEHHA (1999) Air Toxics Hot Spots Program Risk Assessment Guidelines Part II Technical Support Document for Describing Available Cancer Potency Factors Prepared by the Air Toxicology and Epidemiology Section Office of Environmental Health Hazard Assessment April 1999
Passant NR (2002) Speciation of UK emissions of non-methane volatile organic compounds AEAT report AEATENVR0545 Issue 1 Culham UK
Pope CA III Thun MJ Namboodiri MM Dockery DW Evans JS Speizer FE Heath CJ Particulate air pollution as a predictor of mortality in a prospective study of US adults Am J Resp Crit Care Med 1995 151 669-674
Seinfeld J H and Pandis SN (1998) Atmospheric Chemistry and Physics From Air Pollution to Climate Change John Wiley amp Sons New YorkSimpson D Fagerli H Jonson JE Tsyro S Wind P Tuovinen J -P 2003 Transboundary acidification and eutrophication and ground level ozone in Europe Unified EMEP Model Description EMEP Status Report 12003 Part I EMEPMSC-W Report The Norwegian Meteorological Institute Oslo Norway
US EPA (1999) httpwwwepagovttnatwnata1999nsata1999
Vestreng V et al 2004 Inventory Review 2004 Emission data reported to CLRTAP and the NEC Directive EMEPEEA Joint Review Report EMEPMSC-W Note 1
Westerholm R Ahlvik P Karlsson HL An exhaust characterisation study based on regulated and unregulated emissions from bi-fuel and flexi-fuel light-duty passanger cars fuelled by petrol (E5) bioethanol (E70 E75) and biogas tested at ambient temperatures of +22degC and -7degC 2008
Wolkoff P Nielsen G D Non-cancer effects of formaldehyde and relevance for setting an indoor air guideline Environment International 201036788ndash799
Yanowitz J McCormick RL Effect of E85 on tailpipe emissions from light-duty vehicles J Air amp Waste Manage Assoc 59 172 (2009)
A comparison of emissions from ethanol and petrol fuelled cars IVL report B1962 Health risk assessment for Vaumlstra Goumltaland
28
Appendix 1 Evaporate emissions of NMHC
The following assumptions are done for evaporative emissions The NMHC emissions from E85 are reduced relative to petrol by 45 Methane emissions are zero and the split of NMHC species is 68 ethanol and the remaining 32 is divided in the same way as evaporative emissions for petrol The estimates by Graham et al (2008) are missing evaporative emission data however these assumptions agrees very well with measurements of evaporative emissions due to fuel permeation reported by Haskew et al (2006) where NMHC emissions are reported to be reduced by 50 for E85 fuel compared to petrol Haskew et al also presents the NMHC split to species with 60 ethanol This number agrees quite well with our assumption of 68 NMHC being ethanol NMHC in exhaust and evaporative emissions are thus divided as in Table A1
Table A1 Division of NMHC in the exhaust and evaporative emissions for E85 and petrol respectively (wt)
E85 Petrol E85 Petrol exhaust exhaust evaporative evaporative
Ethanol 680 0 680 0 Acetaldehyde 131 08 02 0 Ethene 99 73 24 0 Ethyne 03 28 09 0 Formaldehyde 31 17 06 0 Benzene 16 56 18 10 13 Butadiene 03 09 03 0 sum 963 191 741 10
The remaining NMHC emissions are divided as for petrol (ref) and listed in Table A2
Table A2 Division of NMHC in the exhaust and evaporative emissions for E85 and petrol respectively (wt)
E85 Petrol E85 Petrol exhaust exhaust evaporative evaporative
Ethane 02 32 10 0 Alkanes (C3+) 13 278 89 880 Alkenes (C3+) 04 90 29 95 Aromatics (C7+) 18 388 125 15 Aldehydesketones (C3+)
01 15 05 0
A comparison of emissions from ethanol and petrol fuelled cars IVL report B1962 Health risk assessment for Vaumlstra Goumltaland
29
Appendix 2 Description of the model system
A21 Atmospheric lifetimes
Table A3 gives tropospheric lifetimes with regard to reaction of ethanol formaldehyde acetaldehyde and benzene (C6H6) with OH nitrate radical (NO3) and photolysis The studied organic species are listed together with three species common in the gasoline exhaust (benzene ethene and toluene) for comparison Table 11 shows also photochemical ozone creation potential (POCP) of these species POCP is a measure of amount of ozone that is formed from a certain VOC emission relatively to other emission source which has been established to the same emission mass of ethene (Derwent et al 1996 Altenstedt et al 2000) The range represents different scenarios for VOC and NOX background concentrations Derwent et al (2007) used similar methodology to calculate POCP of different VOC sources and calculated POCP of mean road emission exhaust to be 69
Table A3 Atmospheric lifetimes of studies NMVOC species with respect to the OH- and NO3- initiated
degradation τ(OH) and τ(NO3) and with respect to the photolysis (The lifetime of a chemical species which decays in a first-order process is the time needed for a concentration of this species to decrease to 1e of its original value Statistically it represents the mean life expectancy of an excited species) The OH concentration of 1times106 moleculescm3 typical for summer troposphere was used for the lifetime calculation The NO3 concentrations of 5 and 100 ppt(V) were used for lifetime calculations as representative of rural and urban night-time 12 hrs mean concentration The studied organic species are listed together with 3 species common in the gasoline exhaust for comparison The rates of photolysis were calculated with radiation transfer model for July 58ordm latitude and integrated over 24 hours
τ(OH) τ(NO3) urbanrural τ (photolysis) POCP
hr hr hr
Ethanol 85 56 1times103 - 44 - 63
Acetaldehyde 15 47 1times103 86 68 - 80
Formaldehyde 30 194 4times103 10 18 - 55
Benzene 214 - - 23 - 47
Ethene 34 - - 100
Toluene 50 - - 30 - 67
A22 Defining of boundary concentrations for TAPM from EMEP fields
Calculation of initial concentration field for TAPM from EMEP concentration field of NO2 (as example) and EMEP mean wind vector components u_mid and v_mid Two EMEP model gridcells (i=56 j=60 and i=56 j=61) represent the TAPM model domain and concentrations from the surrounding EMEP gridcells SE-S SE-N NW-S NW-N NE NW (Figure A1) are used for calculation of boundary concentration NO2(bc) according to the following code if u_mid lt= 0 then ( isite = SE-S and jsite = SE-N) else isite = NW-S and jsite = NW-N) endif
A comparison of emissions from ethanol and petrol fuelled cars IVL report B1962 Health risk assessment for Vaumlstra Goumltaland
30
if v_mid lt= 0 then ( ksite = NE) else ksite = SW endif NO2(bc) = [(NO2(isite)u_mid(isite) + NO2(jsite)u_mid(jsite))2 + NO2(ksite)v_mid(ksite)] [(u_mid(isite) + u_mid(jsite))2 + v_mid(ksite)]
Figure A1 Gridcells covering Gothenburg domain and its boundary in EMEP model plotted on latitude-
longitude coordinates The red square represents centre of Gothenburg and the blue line the coastline EMEP i and j coordinates for the boundary gridcells are SE-S = 57-60 SE-N = 57-61 NW-S = 55-60 NW-N = 55-61 NE = 56-62 NW = 56-59 and for Gothenburg grid cells are Gbg-NE = 56-61 Gbg-SW = 56-60
A23 Atmospheric chemistry
The role of secondary chemistry in for the concentration of acetaldehyde are studied by first excluding the primary acetaldehyde emissions from the EMEP model simulations of scenarios S1 and S2 and then by excluding all NMVOC emissions from the car category with spark ignition engines The contribution from the primary acetaldehyde emissions as well as the contribution of secondary acetaldehyde formed from other NMVOC to the total acetaldehyde concentration is then obtained However the secondary chemistry is highly nonlinear due to the interactions of NMVOCs with ozone and OH and thus the results for the contribution of secondary acetaldehyde are somewhat uncertain Differences in acetaldehyde concentrations between S1 and S2 scenarios are studied with respect to contribution of primary and secondary acetaldehyde It is observed that in summer background air the monthly mean contribution of the secondary acetaldehyde is of the same magnitude as the contribution of the primary acetaldehyde to the difference between S1 and
565
57
575
58
585
105 115 125 135 145
Long
Lat
Gbg-SW
Gbg-NE
SE-S
NW-N
NW-S
SE-N
SW
NE
55-59
57-59
55-62
A comparison of emissions from ethanol and petrol fuelled cars IVL report B1962 Health risk assessment for Vaumlstra Goumltaland
31
S2 In the winter and in more polluted atmosphere (Gothenburg grid cells) the contribution from secondary acetaldehyde to the concentration difference appears to be negative due to the chemistry feedback ie the E-85 scenario has less secondary acetaldehyde than the all-petrol scenario
A comparison of S2-S1 differences in primary and secondary acetaldehyde concentrations in the background (=upwind) and Gothenburg grid cells show no increase in the secondary acetaldehyde from upwind to the Gothenburg grid cell It can thus be concluded that there is no significant contribution from secondary aldehydes on the small scale (tenths of km) Conclusion from this sensitivity study is that the secondary formaldehyde can be of importance under summer in the clean background air but that formation on the local scale is unimportant Using EMEP simulated boundary concentrations of acetaldehyde in the local scale model and simulating the primary acetaldehyde emissions will capture the most important features of acetaldehyde dispersion and chemistry in Vaumlstra Goumltaland
In the EMEP model the tail-pipe PM emissions are specified as primary particles Emissions of NOX and VOCs (and NH3 SO2) are oxidised in the atmosphere and a part is then transferred through the gas-to-particle transport to the PM as secondary PM The petrol fuelled cars emit both more primary PM and more NOX compared to the E85 cars If we compare differences in primary and secondary PM between the S1 and S2 scenarios simulated by EMEP we can directly see what part of the difference is from the tail-pipe emissions of the primary particles and what part is from the formation of the secondary PM in atmosphere (mostly from higher emissions of NOX) Table A4 shows the differences between S1 and S2 (S1-S2) of monthly PM averages for January and June (two months with low and high photochemical activities respectively) It can be seen that the higher formation of secondary PM in the S1 (all-petrol) scenario is more important than the higher tail-pipe emission of primary PM by factor 10 - 20
When we compare simulated PM differences between S1-S2 for the background air (=upwind) grid cells and for grid cells including Gothenburg (50 km x 50 km scale) we can see significant increase in primary PM in the S1 scenario from the upwind grid cells to Gothenburg (746 in winter 132 in summer) while no systematic increase can be seen for the secondary PM (-42 in winter +24 in summer) From this comparison it can be concluded that no systematic increase in secondary PM can be seen (in difference from the primary PM) on the scale of 50-100 km and we can neglect this process on the small scale However the overall change in PM concentrations due to the switch of the fuel is very small both on the large scale and on the small scale as can be seen when the differences in PM concentrations between S1 and S2 are compared to absolute PM concentrations in S1 presented in the last column of Table A4
Table A4 Differences in primary and secondary PM concentrations between the lsquoAll-petrolrsquo (S1) and lsquoE-85rsquo (S2) scenarios simulated in gridcells upwind Gothenburg and in gridcells including Gothenburg (2 50 km x 50 km gridcells)
S1-S2 Background
S1-S2 Gothenburg
Increase S1-S2 Gothenburg
S1 Background
μgm3 μgm3 μgm3 bkgnd μgm3
Prim PM10 Jan 00008 00014 00006 746 084
Jun 00008 00018 00010 1319 084
Sec PM10 Jan 00155 00148 -00006
-42 157
Jun 00080 00081 00002 24 213
The sensitivity of the used emission factors for NMHC with respect to the ozone formation in the region of the Swedish West Coast can be analysed with the help of results from studying the
A comparison of emissions from ethanol and petrol fuelled cars IVL report B1962 Health risk assessment for Vaumlstra Goumltaland
32
formation of secondary acetaldehyde In this study first all primary acetaldehyde emitted by the E85 fleet are omitted in a model simulation (S2_nopAA) and secondly all NMHC emissions from the E-85 fleet are switched off (S2_noVOC) Acetaldehyde has a somewhat higher though still comparable photochemical ozone creation potential compared to ethanol (ethanol 44-63 acetaldehyde 68-80 Altenstedt and Pleijel 2000) and this simulation will thus also give information on the sensitivity of the calculations to uncertainties in the ethanol emissions Setting the emission factor for NMHC to zero gives the sensitivity to the emission factor of total NMHC Figure A2 shows the differences in ozone concentration as a result of acetaldehyde only and the total NMHC from the E85 car fleet (S2 scenario) We can see that the effect on ozone formation is very small for the Swedish West coast The reason is that the ozone formation in this area is controlled by the availability of NOX while NMHC or rather their degradation products the peroxy radicals that serve as a lsquofuelrsquo to ozone formation are usually in excess here and further VOC emissions do not increase ozone concentrations significantly The situation looks different in areas that are more heavily polluted with NOX andor which is limited in the availability of peroxy radicals The results from this sensitivity study are fully consistent with the observed increase in ozone concentrations as a result of lower NO emissions (the so-called ozone titration) only very close to the major roads but no larger-scale decrease in ozone concentrations in the Gothenburg area or in any other communities
Figure A2 Sensitivity of the ozone formation in the 2 EMEP model grid cells covering Gothenburg (blue) and in the 6 surrounding grid cells (red see Fig A1) to changes in NMHC emission factor of the E85 fuelled cars lsquobasersquo is simulation S2 with EF for NMHC as in Table 3 lsquonoVOCrsquo is S2 with EF for all NMHC = 0 lsquonopAArsquo is S2 with EF for acetaldehyde = 0 a ndash Mean sensitivity in January absolute difference in ozone formation in ppb(V) as a result of NMHC (base-noVOC) and acetaldehyde (base-nopAA) emissions b ndash Sensitivity relative to ozone concentration in the S2-base simulation January c ndash same as a) but June d ndash same as b) but June
‐002
‐001
0
001
base‐noVOC base‐nopAA
ΔO3(ppb)
a)
0
001
002
base‐noVOC base‐nopAA
ΔO
3(ppb)
c)
‐010
‐005
000
005
base‐noVOC base‐nopAA
ΔO
3
b)
000
002
004
006
base‐noVOC base‐nopAA
ΔO
3
d)
A comparison of emissions from ethanol and petrol fuelled cars IVL report B1962 Health risk assessment for Vaumlstra Goumltaland
33
Appendix 3 Emission results
The geographically distributed NOX and acetaldehyde emissions for the Vaumlstra Goumltaland region are presented in Figures A3 and A4 respectively
Figure A3 NOX emissions for the Vaumlstra Goumltaland region for the All Petrol scenario
A comparison of emissions from ethanol and petrol fuelled cars IVL report B1962 Health risk assessment for Vaumlstra Goumltaland
34
Figure A4 Acetaldehyde emissions for the Vaumlstra Goumltaland region for the All Ethanol scenario
A comparison of emissions from ethanol and petrol fuelled cars IVL report B1962 Health risk assessment for Vaumlstra Goumltaland
35
Appendix 4 Dispersion modelling results
The difference in yearly average concentration between scenario S1 and S2 for acetaldehyde and benzene can be seen in Figure A5 and Figure A6 respectively a)
b)
Figure A5 The difference in yearly average concentrations of acetaldehyde for 2020 between the all E85 (S2) and all petrol (S1) scenarios presented as a) microgm3 and as b) percentage for the Gothenburg area
A comparison of emissions from ethanol and petrol fuelled cars IVL report B1962 Health risk assessment for Vaumlstra Goumltaland
36
a)
b) all E85 c) all petrol
Figure A6 a) the difference in yearly average concentrations (gm3) of benzene for 2020 between the all E85 (S2) and all petrol (S1) scenarios yearly means for b) all E85 and c) all petrol (note the different scales)
The difference in the calculated NOX NO2 and ozone concentrations between the two scenarios are shown in Figures A7 A8 and A9
A comparison of emissions from ethanol and petrol fuelled cars IVL report B1962 Health risk assessment for Vaumlstra Goumltaland
37
a)
b)
Figure A7 The difference in yearly average concentrations of NOX for 2020 between the all E85 (S2) and all petrol (S1) scenarios presented as a) microgm3 and as b) percentage for the Gothenburg area
A comparison of emissions from ethanol and petrol fuelled cars IVL report B1962 Health risk assessment for Vaumlstra Goumltaland
38
a)
Figure A8 The difference in yearly average concentrations of NO2 for 2020 between the all E85 (S2) and all petrol (S1) scenarios presented as a) microgm3 and as b) percentage for the Gothenburg area
A comparison of emissions from ethanol and petrol fuelled cars IVL report B1962 Health risk assessment for Vaumlstra Goumltaland
39
a)
b)
Figure A9 The difference in yearly average concentrations of ozone for 2020 between the all E85 (S2) and all petrol (S1) scenarios presented as a) microgm3 and as b) percentage for mainly the Gothenburg area
A comparison of emissions from ethanol and petrol fuelled cars IVL report B1962 Health risk assessment for Vaumlstra Goumltaland
40
Appendix 5 Detailed Exposure data
Detailed exposure data for the difference between the all E85 (S2) and the all petrol (S1) scenarios can be found in Table A5
Table A5 Exposure data for the difference between the all E85 (S2) and the all petrol (S1) scenarios
Acetaldehyde diff E-P (microgm3)
Populated weighted mean
Number of people Percentage of population
0 - 01 627198 582 01 - 02 163394 152 02 - 03 134879 125 03 - 04 88099 82 04 - 05 38686 36 05 - 06 16880 16 06 - 07 7983 07 07 - 08 1248 01 Tot 014 1078367 Benzene diff E-P (microgm3)
Populated weighted mean
Number of people Percentage of population
-03 - -02 26680 25 -02 - -01 205757 191 -01 - -0 845930 784 Tot -0074 1078367 NO2 diff E-P (microgm3) Populated weighted
mean Number of people Percentage of
population -04 - -03 7698 07 -03 - -02 50131 46 -02 - -01 296288 275 -01 - -0 724250 672 Tot -009 1078367 NOX diff E-P (microgm3) Populated weighted
mean Number of people Percentage of
population -06 - -05 7698 -05 - -04 19639 18 -04 - -03 36626 34 -03 - -02 161685 150 -02 - -01 186500 173 -01 - -0 666219 618 Tot -012 1078367 O3 diff E-P (microgm3) Populated weighted
mean Number of people Percentage of
population -02 - -01 779132 723 -01 - -0 266417 247 0 - 01 32818 30 Tot -012 1078367
Exposure data for the total levels in the two scenarios can be found in Table A6
A comparison of emissions from ethanol and petrol fuelled cars IVL report B1962 Health risk assessment for Vaumlstra Goumltaland
41
Table A6 Exposure data for the total levels in the two scenarios
Acetaldehyde tot All ethanol (microgm3)
Populated weighted mean
Number of people Percentage of population
06 - 07 568825 527 07 - 08 171845 159 08 - 09 124551 115 09 - 10 100946 94 10 - 11 59235 55 11 - 12 30559 28 12 - 13 13175 12 13 - 14 7983 07 14 - 15 1248 01 Tot 077 1078367 Acetaldehyde tot All petrol (microgm3)
Populated weighted mean
Number of people Percentage of population
05 - 06 45111 42 06 - 07 1032008 957 07 - 08 1248 01 Tot 065 1078367 Benzene tot All ethanol (microgm3)
Populated weighted mean
Number of people Percentage of population
0 - 01 1055961 98 01 - 02 22406 2 Tot 005 1078367 Benzene tot All petrol (microgm3)
Populated weighted mean
Number of people Percentage of population
0 - 01 729093 676 01 - 02 232961 216 02 - 03 94042 87 03 - 04 21023 19 04 - 05 1248 01 Tot 010 1078367 NOX tot All ethanol (microgm3)
Populated weighted mean
Number of people Percentage of population
0-10 779108 722 10-20 254658 236 20-30 28683 27 30-40 11070 10 40-50 3426 03 50-60 0 00 60-70 0 00 70-80 639 01 80-90 0 00 90-100 0 00 100-110 783 01 Tot 84 1078367 NOX tot All petrol (microgm3)
Populated weighted mean
Number of people Percentage of population
0-10 769557 714 10-20 264209 245 20-30 28683 27 30-40 11070 10 40-50 3426 03 50-60 0 00
A comparison of emissions from ethanol and petrol fuelled cars IVL report B1962 Health risk assessment for Vaumlstra Goumltaland
42
60-70 0 00 70-80 639 01 80-90 0 00 90-100 0 00 100-110 783 01 Tot 85 1078367 O3 tot All ethanol (microgm3)
Populated weighted mean
Number of people Percentage of population
40-45 1422 01 45-50 26487 25 50-55 176636 164 55-60 770370 714 60-65 103452 96 Tot 569 1078367 O3 tot All petrol (microgm3)
Populated weighted mean
Number of people Percentage of population
40-45 1422 01 45-50 20229 19 50-55 181876 169 55-60 763361 708 60-65 111479 103 Tot 570 1078367 PM25 tot All ethanol (microgm3)
Populated weighted mean
Number of people Percentage of population
1-2 0 00 2-3 885325 821 3-4 192259 178 4-5 783 01 Tot 268 1078367 PM25 tot All petrol (microgm3)
Populated weighted mean
Number of people Percentage of population
1-2 0 00 2-3 868773 806 3-4 208811 194 4-5 783 01 Tot 270 1078367
A comparison of emissions from ethanol and petrol fuelled cars IVL report B1962 Health risk assessment for Vaumlstra Goumltaland
1
Abstract
Facing the problems with global warming and the diminishing supplies of oil alternative fuels are becoming more and more important for road traffic One fuel that has been used for several years is ethanol (E85) The main discussion points regarding the environmental performance for ethanol as a fuel are related to the production However there are also some notable differences in the emissions between E85 and petrol fuelled vehicles This relates to some extent to the emissions of nitrogen oxides (NOX) and particulate matter (PM) but mainly to the composition of the emitted organic compounds
These differences in emissions will potentially give different impacts on health and on the environment This can be both through risks linked to the primary emissions and to secondary products formed in the atmosphere In order to assess the health risks it is necessary to calculate the emissions in space and time describe the dispersion and chemical reactions taking place in the atmosphere and to calculate the exposure to humans
In the present study two fuel scenarios for passenger cars are studied one where the cars with Otto engines run on petrol and one where they run on E85 Two emission scenarios for 2020 are constructed and dispersion modelling is applied to obtain the human exposure to key pollutants The dispersion modelling is performed with the EMEP model for extended Europe and the data obtained are used as boundary conditions for the model for the Vaumlstra Goumltaland Region In the latter detailed traffic and emissions scenarios are used together with the TAPM model to obtain concentration levels and population exposure The differences in health impacts are then assessed
The differences in emission factors reflect in differences in emissions The emission calculations for all Swedish road traffic show a decrease for the E85 scenario relative to the petrol scenario of 65 for NOX 34 for PM25 67 for benzene For acetaldehyde there is an increase of 770
The differences obtained from the TAPM modelling show decreased levels of NOX ozone and benzene with E85 and increased levels of acetaldehyde For the latter the increase may be up to 80 while NOX and ozone show decreases of up to a few per cent and a few tenths of per cent respectively
The health risk assessment shows decreased health risks in the E85 scenario relative the all-petrol scenario due to the decreased NOX exposure correlated with both preterm deaths and asthma However NOX may be mainly an indicator of unmeasured causal exhaust components in the epidemiological studies and thus the exposure-response functions for NOX may not be applicable in the present case where there is a difference in NOX exposure but not necessarily a difference in exposure to other exhaust components normally associated with NOX Smaller effects are expected from the changes in ozone acetaldehyde PM25 and benzene exposure The overall difference is about 16 preterm deaths per year for the Vaumlstra Goumltaland Region with lower values for the E85 scenario when the uncertain differences due to the differences in NOX exposure are not considered
A comparison of emissions from ethanol and petrol fuelled cars IVL report B1962 Health risk assessment for Vaumlstra Goumltaland
2
Content
Abstract 1 1 Introduction 3 2 Methods 4
21 Overview 4 22 Emission factors 4 23 Traffic data 5 24 Emissions 6 25 Dispersion modelling 7
251 Local scale modelling 7 252 EMEP modelling 8
26 Exposure 9 27 Health effects and risk assumptions 10
271 NOX and NO2 10 272 Ozone 10 273 Acetaldehyde 10 274 Benzene 10 275 Formaldehyde 10 276 PM 11 277 Health Impact Assessment 11
3 Results 11 31 Emission factors 11 32 Emissions 14 33 Dispersion modelling 17 34 Exposure 20 35 Impact on health in Vaumlstra Goumltaland 22
351 NO2 and NOX 22 352 Ozone 22 353 Acetaldehyde 23 354 Benzene 23 355 PM25 23
4 Discussion 23 5 Conclusions 24 6 Acknowledgements 25 7 References 26 Appendix 1 Evaporate emissions of NMHC 28 Appendix 2 Description of the model system 29 Appendix 3 Emission results 33 Appendix 4 Dispersion modelling results 35 Appendix 5 Detailed Exposure data 40
A comparison of emissions from ethanol and petrol fuelled cars IVL report B1962 Health risk assessment for Vaumlstra Goumltaland
3
1 Introduction
Facing the problems with global warming and the diminishing supplies of oil alternative fuels are becoming more and more important for road traffic Several alternative fuels are being tested such as biogas alcohols and dimethyl ether (DME) One fuel that has been used for several years in Brazil and has become popular in eg Sweden and the USA during the last ten years is ethanol It is used both as a component (about 5 vol) in regular petrol and as E85 (85 vol ethanol 15 vol petrol)
The main discussion points regarding the environmental performance for ethanol as a fuel are related to the production In this study the production of ethanol fuel is not in focus but rather the impact from emissions stemming from E85 fuelled cars Although the emissions from E85 cars are not as well characterised as the emissions from petrol cars there are some notable differences in the emissions This relates to some extent to the emissions of nitrogen oxides (NOX) and particulate matter (PM) but mainly to the composition of the emitted organic compounds The main differences here are that petrol generates relatively higher emissions of benzene while E85 generates relatively higher emissions of acetaldehyde and ethanol
Ethanol has a reaction lifetime of several days and the major product of its OH-initiated degradation is acetaldehyde The OH-initiated degradation of acetaldehyde gives upon further reaction with NO2 peroxy-acetyl nitrate (PAN) Other reactions of acetaldehyde give mainly formaldehyde and CO2 All of acetaldehyde formaldehyde and PAN have negative effects on human health
These differences in emissions will potentially give different impacts on health and the environment This can be both through risks linked to the primary emissions and to the mentioned secondary products formed in the atmosphere In order to assess the health risks it is necessary to calculate the emissions in space and time describe the dispersion and chemical reactions taking place in the atmosphere and to calculate the exposure to humans
Jacobson (2007) studied the impact on health risks of a change from petrol to E85 in a scenario analysis for the US in 2020 A greater risk was found for the E85 scenario compared to an all-petrol scenario due to the effects on the ozone concentration However the differences found were small and the conclusion made is that it is unlikely that the use of E85 fuel would improve air quality relative to petrol
In the present study the change in impact on health risks between a scenario with all petrol and one with all E85 is studied for 2020 The fuel switch is applied to all positive ignition injection cars for the EMEP-model domain (covers Europe and surrounding parts of North Africa and Asia) and the health impact is studied for the region of Vaumlstra Goumltaland in Sweden Two emission scenarios for 2020 are constructed and dispersion modelling is applied to obtain the human exposure to key pollutants in the region The dispersion modelling is performed with the EMEP model for extended Europe and the data obtained are used as boundary conditions for the model for the Vaumlstra Goumltaland region In the latter detailed traffic and emissions scenarios are used together with the TAPM model to obtain concentration levels and population exposure The differences in health impacts are then assessed The setup of the scenarios is similar to what is presented by Jacobson but of course applied to a different region with different climate as well as traffic and population density
A comparison of emissions from ethanol and petrol fuelled cars IVL report B1962 Health risk assessment for Vaumlstra Goumltaland
4
2 Methods
21 Overview
The overall objective of the present study is to compare the health impacts in the Vaumlstra Goumltaland region of emissions from petrol fuelled cars (ie cars with Otto engines and spark ignition) in two scenarios for 2020 one with all petrol and one with all E85 Thus in one scenario all these cars are assumed to be fuelled by petrol and in the second all these cars are assumed to be fuelled by E85 The lsquoall-petrolrsquo scenario is called S1 the lsquoE85rsquo scenario S2 The study comprises
emission calculations dispersion modelling population exposure analysis health impact assessment
Two dispersion model runs for the Vaumlstra Goumltaland region (see Figure 1b) are performed with the TAPM model In order to calculate the pollutants entering this region the larger scale EMEP (see Figure 1a) model is applied to the extended European region a) b)
Figure 1 The model area for a) the EMEP model and b) the TAPM model For the TAPM modelling the indicated square in b) is the model domain and the defined map is the Vaumlstra Goumltaland region
22 Emission factors
The study starts with establishing emission factors for petrol- and E85-fuelled cars This basically gives two sets of emission factors that can be applied to the projected traffic volumes For the Vaumlstra Goumltaland region the emission factors used with the exception of E85 cars are taken from
A comparison of emissions from ethanol and petrol fuelled cars IVL report B1962 Health risk assessment for Vaumlstra Goumltaland
5
the Artemis model (Andre 2005) This is a detailed emission model used also in the Swedish reporting of emissions from road traffic and must be considered as the source with the most accurate emission factors for road traffic for Swedish conditions Artemis contains emission factors for the year 2020 which are used in this study Speciation of NMVOC emissions (except for E85 fuelled cars) come from Passant (2002)
The emission scenarios used for Europe are built on EMEPrsquos lsquoCurrent Policyrsquo (CP) scenario for the year 2020 (Vestreng et al 2004) This scenario contains emissions and fuel consumption divided into different source sectors where one is road traffic In order to calculate the emissions for the two scenarios the relative change in emission factors for positive ignition injection cars between petrol and E85 are used
The data available in the EMEP emission database are however not detailed enough for the purpose of this study For example detailed information on the emissions from different vehicle categories is needed Further division of emissions of hydrocarbons on exhaust emission and evaporative emissions are needed as well as a breakdown of PM emissions on exhaust particles and wear particles Therefore a detailed partition of the traffic emissions in the gridded EMEP emission database is done for all countries in the EMEP model domain with help of the data on national emissions in the GAINS model (GAINS 2010) which includes a detailed breakdown of emissions to vehicle categories fuels used etc An exception is made for Sweden where the partition of emissions is calculated with the Artemis model (with the exception of the wear particles that are not covered by Artemis and are taken from GAINS) The GAINS model is an instrument used for policy scenario development and optimisation and contains data of activities (eg fuel and energy consumption) emission factors and emissions from different sources specified for detailed categories This model has a two-way connection to EMEP program in general and to the EMEP model in particular as the transport chemical conversion and deposition matrix for the pollutants emitted from individual countries in GAINS are pre-calculated by EMEP and the future policy scenarios in EMEP are generally consistent with GAINS scenarios as both tools are used for the LRTAP convention and the EU legislation work In the scope of this project it is found that EMEP and GAINS emissions are not fully consistent while the EMEP emission database is based on expert-assessed data reported by the member states the GAINS emissions are based on model calculations The continental scale modelling was based on the EMEP emissions database since this is a gridded database commonly used in EMEP modelling which has its historical scenarios validated within the EMEP monitoring program
While emission factors for petrol cars are relatively well established the data for E85 are much scarcer The Artemis model does not contain detailed emission factors for E85 cars and the situation is similar for the EMEP model The GAINS model considers only zero emissions of CO2 while all other emissions are the same as for petrol To obtain the emission factors for E85 cars data were sought in the open literature (see further below)
23 Traffic data
In order to calculate emissions the emission factors must be applied to data on traffic volumes of the different vehicle categories For Europe the mentioned EMEP policy scenario is used Since the traffic volumes are not available in the EMEP database the relative volumes of traffic in different vehicle categories relative to the total traffic volume are recalculated on national basis using the GAINS model
A comparison of emissions from ethanol and petrol fuelled cars IVL report B1962 Health risk assessment for Vaumlstra Goumltaland
6
For the whole Sweden the traffic prognosis and emissions obtained from the Artemis model are used The results here are very similar to what can be found in the EMEP database which is to be expected since Artemis is used in the Swedish reporting Figure 2 shows the fleet composition in Sweden 2020 from the Artemis model
Figure 2 Contribution of vehicles and fuel categories to the total transport work (vehicle-kilometersyear)
in 2020 in the Artemis model S1-scenario all categories with blue or green colour except the E85 busses use petrol S2-scenario all categories with blue or green colour use E85
For the Vaumlstra Goumltaland region the traffic data for 2005 come from two sources For the city of Gothenburg detailed traffic data are obtained from the local environmental agency For the remaining Vaumlstra Goumltaland region traffic data from the Swedish Transport Administration are used
The changes in all national Swedish emission sources in the EMEP model from year 2005 to 2020 are applied to the emission sources in the inventory for Vaumlstra Goumltaland to produce the 2020 emission scenario
24 Emissions
The emission factors and traffic data are used to obtain emissions in two emissions scenarios S1 where all ignition injection cars are assumed to use petrol and S2 where these cars all use E85 Note that all other road traffic sources such as diesel cars heavy duty vehicles etc are treated in the same way in both scenarios The emissions for Vaumlstra Goumltaland are also calculated for two base-scenarios for 2005 and 2020 where the actual traffic and fuel composition (for 2005) and a prognosis on traffic and fuel composition (for 2020) from the Swedish Transport Administration are used In the impact assessment however only the scenarios with all petrol or all E85 are used
The input of emission data required by the EMEP model consists of annual national emissions The species considered are sulphur dioxide (SO2) nitrogen oxides (NOX = NO+NO2) ammonia (NH3) non-methane volatile organic compounds (NMVOC) carbon monoxide (CO) and
busses dieselampCNG
busses E85
HGV diesel
HGV petrol
LCV diesel
LCV petrol
pass cars dieselCNG LPG hybridpass cars petrol
pass cars E‐85
A comparison of emissions from ethanol and petrol fuelled cars IVL report B1962 Health risk assessment for Vaumlstra Goumltaland
7
particulate matter (PM25 PM10) These emissions are provided for ten anthropogenic source sectors of which only emissions in the road traffic sector changes between the emissions scenarios calculated in this study The emissions are also distributed to vary between months weekdays and over the hours of the day Distribution of the NMVOC emissions between different compounds which are specific to each emission sector and country are used In this study this speciation will vary for road traffic between the scenarios as is described below
For the Vaumlstra Goumltaland region the emissions from traffic and non-road machinery are distributed as 500 m x 500 m grids while emissions from industry and heating plants are treated as point sources (including all physical processes usually connected to that type of sources) Emissions from ships are described as line sources The data are time resolved hourly over the day over the days of the week for each month
25 Dispersion modelling
Effects of the Europe-wide use of the E85 fuel on air pollution in Sweden are studied with two models on two different geographical scales To capture the large-scale changes especially those concerning ozone and other secondary air pollutants the European-scale chemistry transport model EMEP is used (Simpson et al 2003) The effects on exposure of people to air pollutants and consequent health effects are studied using air pollutant concentrations calculated with the small scale dispersion model TAPM which is nudged into EMEP air pollution fields (See Appendix 2 for details) In this way the large scale effects such as formation of ozone secondary PM and secondary aldehydes are accounted for also on the local scale In the case of benzene only the road traffic contribution is calculated due to lack of information on emissions from sources other than traffic
251 Local scale modelling
The TAPM model (Hurley 2008) is used to calculate the local contribution to air pollutants in the Vaumlstra Goumltaland region in the two scenarios The geographically distributed pollutants are then used for the exposure calculations and eventually the health risk assessment TAPM is a three dimensional meteorological and chemical model for air pollution studies that includes topography as well as land-use On the basis of this the model generates the meteorological parameters required for the dispersion modelling such as temperature layering (inversions) and three dimensional wind field all based on daily synoptic input data (large scale meteorological re-analyse data ndashcalled GASP (Global AnalysiS and Prediction) from Australian Government Bureau of Meteorology (wwwbomgovau) TAPM also includes chemistry such as NONO2 ozone SO2 and particle transformation Acetaldehyde and benzene are however not included in the chemical scheme of TAPM and these species are therefore simulated as reactive tracers in this study (see below)
In order to perform the calculations with TAPM a number of input data are required Emission data for the Vaumlstra Goumltaland region as described above Meteorological data Levels of the relevant pollutants on the model domain boundaries for the two scenarios
obtained from the EMEP model A model describing the decay of benzene and acetaldehyde emitted from traffic
A comparison of emissions from ethanol and petrol fuelled cars IVL report B1962 Health risk assessment for Vaumlstra Goumltaland
8
Since acetaldehyde and benzene are not included in the chemical scheme of TAPM their chemical lifetimes are set to be their rate constant with respect to the reaction with OH radicals multiplied by the OH mean concentrations obtained from the EMEP simulations (see below) Four different rates for the four seasons are used according to Table 1
Table 1 Rate constant for reaction with OH and chemical lifetimes for acetaldehyde and benzene used in the TAPM simulations
k(OH) Chemical lifetime (days)
mol-1 cm3s-1
Mar Apr May Jun Jul Aug Sep Oct Nov Dec Jan Feb
Acetaldehyde 15 10-11 12 04 13 155
Benzene 12 10-12 148 49 159 1937
252 EMEP modelling
Several EMEP models are developed and used for air quality policy work in Europe mainly for the Convention on Long-range Trans boundary Air Pollution The Unified EMEP model used in this study is designed to calculate concentrations in air and deposition patterns for major acidifying and eutrophying pollutants photo-oxidants and particulate matter In its standard version it has a 50 km x 50 km resolution in the horizontal direction and 20 layers distributed from the ground up to the pressure level of 100 hPa (ca 16 km) in the vertical direction A detailed description is given in Simpson et al (2003) The meteorological data used for the simulations obtained from wwwemepint are for the year 2005 and are of the same spatial resolution with a time resolution of three hours
As already mentioned the concentration fields generated by the EMEP model are used as an input to the TAPM model Boundary concentration fields for TAPM are calculated from hourly concentrations in the grid cells surrounding the Vaumlstra Goumltaland region that are weighted together with wind field vectors on corresponding boundaries of the Vaumlstra Goumltaland grid cells Since the chemistry of the organic compounds differs between the two models all organic compounds in EMEP are used and recalculated to the reactivity of organic compounds as used by TAPM
While the role of NOX NMVOC and primary PM can be investigated directly by simulations of emission in scenarios S1 and S2 effects of E85 fuelled cars on concentrations of acetaldehyde benzene and secondary PM are obtained from additional sensitivity runs The contribution of the emissions from the use of E85 fuel on acetaldehyde concentrations can be modelled directly in the EMEP model which includes also the formation and consumption of acetaldehyde in atmospheric reactions However TAPM does not include these processes and therefore the role of acetaldehyde formation is investigated further Two additional EMEP simulations are run one excluding primary acetaldehyde emissions and one excluding all NMVOC emissions from petrol and E85 fuelled vehicles By relating the results of these runs to the results of S1 and S2 the contribution of primary and secondary acetaldehydes respectively can be deduced The results from this analysis can be found in Appendix A23 The conclusion is that on the scale of the Vaumlstra Goumltaland region the formation of acetaldehydes in the atmosphere is not important and therefore the acetaldehyde concentration in TAPM can be described using the lifetimes given in Table 1 Further also the impact of the NMHC emissions on the ozone levels is studied (Appendix 23) and found to be small
Benzene is not included explicitly in the EMEP model The benzene concentrations are therefore studied in sensitivity runs with benzene from road traffic added to the S1 and S2 scenarios as
A comparison of emissions from ethanol and petrol fuelled cars IVL report B1962 Health risk assessment for Vaumlstra Goumltaland
9
methanol which has similar atmospheric lifetime as benzene The benzene concentration is then obtained by comparing the methanol concentration from the different runs
The contribution of primary and secondary PM respectively is investigated by excluding the primary PM from petrol and E85 fuelled vehicles in separate runs of the EMEP model The PM boundary values for the TAPM modelling are not separated into secondary and primary PM The results from this analysis are used to draw general conclusions about the difference in secondary PM formation between the two scenarios
26 Exposure
The human exposure of the annual mean concentrations of NOX NO2 O3 acetaldehyde and benzene are calculated based on the dispersion calculations of the Vaumlstra Goumltaland area in combination with the population density The population density distribution for the region is obtained from EEA (EEA 2009) and shown in Figure 3 The total population in the investigated area is 1 078 400
Figure 3 Population density distribution (number of people in a 1 km x 1 km grid for 2006) for the investigated area (according to Figure 1)
A comparison of emissions from ethanol and petrol fuelled cars IVL report B1962 Health risk assessment for Vaumlstra Goumltaland
10
27 Health effects and risk assumptions
271 NOX and NO2
Using modelled levels of NOX in the residential area as a vehicle exhaust marker a Norwegian study of 16 000 men from Oslo of whom 25 died during the follow up found a strong association (Nafstad et al 2004) This cohort with people of between 40-49 years of age at the start of the study was followed from 197273 through 1998 NOX was estimated in a model with 1000 m grids and a street contribution added for the largest streets When the median concentration of NOX for 1974-78 was used (mean 107 μgm3) the relative risk for total non-violent mortality was 8 per 10 μgm3 Nitrogen oxides do not have to be important as causal components behind this association
272 Ozone
Short-term effects of ozone on the respiratory system and on daily number of deaths have been reported from a large number of studies especially for summer concentrations why a threshold has sometimes been assumed in impact assessments Only recently has an effect of long-term exposure on mortality been reported from the very large American Cancer Society (ACS) Cohort Study (Jerret et al 2009)
Jacobson (2007) reported that E85 would cause an increase in mortality but assumed an effect of short-term exposure only The estimated impact was explained by the calculated ozone formation
273 Acetaldehyde
An increased incidence of nasal tumours in rats and laryngeal tumours in hamsters were observed after inhalation of high concentrations of acetaldehyde (HEI 2007) A few epidemiological studies of occupational exposure found associations but with a complex mixture of chemicals and have not been used in the cancer risk assessment for acetaldehyde Acetaldehyde is classified by the National Institute of Occupational Safety and Health as ldquoa potential human carcinogenrdquo by the US EPA (1999) as ldquoa probable human carcinogenrdquo and by the IARC as ldquopossibly carcinogenic to humansrdquo (OEHHA 1999 HEI 2007)
274 Benzene
There is clear and widely accepted evidence from a variety of epidemiologic studies of occupational exposure that benzene increase the risks of acute myeloid leukaemia (HEI 2007) but there is more uncertainty about other lymph hematopoietic cancers Studies on traffic exposure and childhood leukaemia have produced mixed results with regard to associations
275 Formaldehyde
IARCrsquos Monograph 88 says that the evidence is sufficient to conclude that formaldehyde causes cancer in humans (IARC 2006) This was because of evidence of nasopharyngeal cancer at concentrations historically encountered in industrial settings However this conclusion by IARC was largely based on the results from one occupational exposure site and the results and conclusions have not been supportive in other reviews and more recent studies (Bosetti et al 2006 Beane Freeman et al 2009 Bachand et al 2010) OEHHA (1999) uses a lifetime risk for cancer of 0000006 per microgm3 for formaldehyde and US EPA (1999) a lifetime risk of 0000013 per microgm3
A comparison of emissions from ethanol and petrol fuelled cars IVL report B1962 Health risk assessment for Vaumlstra Goumltaland
11
For non-cancer effects the eye is the organ most sensitive to formaldehyde subjective irritation has been reported at 300-500 microgm3 which is above the odour thresholds (Wolkoff amp Nielsen 2010) Effects in the eyes and in airways occur around 600ndash1000 μgm3 Effects on lung function have not been found in controlled human exposure studies below 1 mgm3 In epidemiological studies of associations between formaldehyde and exacerbation of asthma several co-pollutants make the findings difficult to interpret An indoor air quality guideline of 100 μgm3 has been considered protective against both acute and chronic sensory irritation in the airways in the general population assuming a lognormal distribution of nasal sensory irritation (Wolkoff amp Nielsen 2010)
276 PM
In the studies of long-term exposure to PM25 and mortality like the American Cancer Society (ACS) Cohort the exposure contrast were mainly related to secondary PM why the reported relative risk approx 6 increase in all-cause mortality (in adults) per 10 μgm3 is most relevant for background secondary PM concentrations (Pope et al 1995)
277 Health Impact Assessment
To summarize the types of pollutants that are found possible to include in the health impact assessment are NOX and NO2 benzene acetaldehyde formaldehyde secondary PM and ozone The assessment is restricted to the most important and well established effects of these pollutants This means that not all types of potential health impacts are included Results should however do for a comparison of the scenarios
The impact on formaldehyde levels are not calculated why it is not included in the current assessment Relative risks from epidemiological studies of vehicle exhaust using NOX and NO2 as exposure variables may be influenced from effects of their co-pollutants mainly ultrafine particles (elemental carbon soot) CO and HCs such as formaldehyde Exhaust particles are often introduced in a relatively high background of particles from other sources Thus exhaust particles were not measured directly in the important studies of long-term exposure and effects on mortality
3 Results
31 Emission factors
The emission factors are selected from available published data both for the exhaust and the evaporative emissions In both cases values relative to petrol are used The majority of the studies have been done with both E85 and petrol making this comparison more robust
Westerholm et al (2008) tested two flexi-fuel cars with E5 E70 and E85 in the European driving cycle NEDC and in the Artemis driving cycles The former is used at two temperatures (22degC and -7degC) They report the regulated emissions greenhouse gases a number of organic compounds and particle number Graham et al (2008) present measurement results for regulated emissions greenhouse gases and a number of organic compounds from four cars with E85 and regular petrol in the FTP cycle They also made a compilation of literature data for ethanol cars Yanowitz and McCormick (2009) present an analysis of US certification testing data in order to compare emissions for E85 and petrol
A comparison of emissions from ethanol and petrol fuelled cars IVL report B1962 Health risk assessment for Vaumlstra Goumltaland
12
The results from the three studies (for flexi fuel cars) and in addition the values used by Jacobson (2007) are given in Table 2
Table 2 Emissions factors for E85 fuelled cars relative to the emission factors for petrol fuelled cars
Relative change E85 vs petrol ()
Yanowitz and McCormick (2009) (95 conf)
Graham et al (2008) (sd )
Westerlund et al (2008) (average for NEDC)
Jacobson (2007)
NOX -14 (-23 - -5) -42 (15) -38 -30 NMOG 26 (17 - 37) 12 (39) NMHC -43 (-52 - -32) -45 (24) THC -14 (-24 - -4) 2 TOG 22 CO -19 (-25 - -12) -5 (51) 1 5 PM 25 0 Formaldehyde 59 (32 - 91) 80 (44) 184 60 Acetaldehyde 2855 (1189) 1031 2000 13 Butadiene -64 (31) -74 -10 Benzene -72 (15) -71 -79 Ethanol 3950 from TOG Methane 50 43
Table 2 shows lower emissions of NOX for E85 fuelled cars relative to petrol fuelled cars from test cycles generally including cold starts The emissions of hydrocarbons are higher for petrol while the emissions of organic gases are somewhat higher for E85 The emissions of aldehydes especially acetaldehyde are much higher for E85 as are the emissions of ethanol and methane The emissions of benzene and 13-butadiene are higher with petrol It should be noted that the data in Table 2 are in general for tests performed at ambient temperatures of around 20 degC Westerlund et al (2008) report that for ambient temperatures of -7 degC the emissions of CO and NMHC may be significantly higher with E85 compared with petrol For one vehicle they also report very high NOX emissions with petrol at this lower temperature
As seen in Table 2 there are a number of different quantities when it comes to the emission of organic compounds or unburnt fuel From a chemistry point of view HC is no molecule but a notation for the sum of all compounds that are hydrocarbons thus are of the form HxCy and not containing any elements but carbon and hydrogen Total organic gases (TOG) include organic compounds containing oxygen such as alcohols and aldehydes (but not CO or CO2) Volatile organic compounds (VOC) means carbon containing organic compounds present in the gaseous state at ambient temperature Non-methane hydrocarbons (NMHC) means HC minus the methane mass NMTOG and NMVOC are defined in the corresponding way1
1 When it comes to exhaust gas regulations the definitions differ somewhat In the US THC is defined as the signal obtained from a FID (Flame Ionisation Detector) instrument calibrated on propane This means that alcohols and aldehydes contribute to THC but to a lower extent since their responses in a FID instrument are lower than for hydrocarbons TOG is defined in the US regulations as THC + the mass of alcohols (eg methanol) and carbonyls (eg formaldehyde) measured separately NMHC is equal to THC ndash rCH4CH4 ndashralcAlc where the CH4-concentration is measured by gas chromatography and a FID calibrated with methane Alc is the alcohol concentration and rCH4curren and rAlc are the respective FIDresponse functions NMOG means TOG - CH4 and VOC is TOG - CH4 - C2H6 In the regulations it is stated that also a number of other non-ozone forming organic compounds eg acetone should be subtracted but these are present in very low concentrations in engine exhaust Note that there is actually a double counting of aldehydes in NMOG since they contribute to a certain extent to the NMHC value and then are added using values from separate measurements
A comparison of emissions from ethanol and petrol fuelled cars IVL report B1962 Health risk assessment for Vaumlstra Goumltaland
13
There will be emission limits for both THC and NMHC in also the future For petrol cars with low methane emissions the challenge will be to meet the limit for NMHC For E85 cars with higher methane emissions the challenge will be to meet the THC limit Thus it is reasonable that the emissions of NMHC from E85 cars will be lower than for petrol cars
In the modelling presented here the emission factors from Graham et al (2008) are used with some exceptions as will be discussed The reason is that that study comprises a compilation of a relatively large number of tests For CO the emission factor is set to the same value for E85 and petrol since the differences are small and within the uncertainty For particle emissions the studies cited in Table 2 give little information Instead data from Ericsson et al (2008) are used indicating that the primary PM emission using E85 is about 65 of that when using petrol For NOX the emission for E85 is set to 58 of that for petrol
The emission factors for NMHC (physical emission in gkm) including ethanol are in this study set to the same value for E85 as for petrol This is in line with the data for NMOG reported by Graham showing only small differences It is also reasonable considering that the car producers optimize emissions to meet the future emission legislation in Europe for NMHC and THC i e the Euro 6 standards that apply from September 2014 For petrol with low CH4 emissions the NMHC value will be limiting and this is on 68 mgkm For E85 with higher CH4 emissions the THC value of 100 mgkm will be limiting When considering the FID response as a measure of emission instead of physical emission about 50 of the THC comes from NMHC for E85 cars However the FID response is low for ethanol which means that the physical NMHC emission is about 25 higher Considering these factors the emissions of NMHC (physical) for E85 can be expected to be around 50 mgkm 125 = 625 mgkm which is about the same as for petrol The methane emission for E85 is set to 142 times the value for petrol following Lipman and Delucchi (2002) Further also the differences in the evaporate emissions are considered as is described in Appendix 1
The emissions factors for petrol cars are taken from the Artemis model (Andreacute 2005) The distribution of NMHC for petrol cars is from Passant (2002) The resulting emission factors used to obtain the emissions scenarios are presented in Table 3
In Europe THC is defined as the signal from a propane calibrated FID and thus contains oxygen containing compounds although the response factors for the latter are lower The FID instrument gives the number of molecules and in order to calculate the mass the EU regulations use the densities obtained from assuming the molecular formulas C1H274O0385 (209 gmole) for E85 and C1H189O0016 (1415 gmole) for petrol This thus compensates for the lower response factor for ethanol and acetaldehyde NMHC is obtained by subtracting the concentration of CH4 (times the FID response factor) measured separately
A comparison of emissions from ethanol and petrol fuelled cars IVL report B1962 Health risk assessment for Vaumlstra Goumltaland
14
Table 3 Emission factors (gkm) for 2020 for passenger cars (including evaporative emissions but excluding wear particle emissions) used in the modelling
Petrol E85 NOX 0112 0065 CO 179 174 PM 00013 00008 CH4 0013 0018 NMHC 033 028
division of NMHC Ethanol 00000 01898 Acetaldehyde 00025 00299 Ethene 00244 00237 Ethyne 00094 00011 Formaldehyde 00057 00072 Benzene 00187 00045 13 Butadiene 00030 00009 Ethane 00107 00009 Alkanes C3+ 00928 00076 Alkenes C3+ 00301 00025 Aromatics C7+ 01297 00106 Aldehydesketones C3+ 00051 00004
sum NMHC 03321 02792
32 Emissions
The emissions from road traffic vary between the two scenarios due to the differences in the emission factors From the EMEP modelling the total emissions from road traffic in the different scenarios are calculated for the countries included In Figure 4 emissions of NOX NMVOC and PM in the S2 (E-85) scenario relative to the S1 (all-petrol) scenario are shown for these countries The relative change is larger for countries with a high fraction of petrol cars relative to diesel cars (since the latter are the same in the two scenarios) such as Russia and Ukraine The relative change is smallest for PM emissions due to the very small contribution of the exhaust particles from petrol fuelled cars compared to the contribution from diesel vehicles and wear particles
A comparison of emissions from ethanol and petrol fuelled cars IVL report B1962 Health risk assessment for Vaumlstra Goumltaland
15
Figure 4 National emissions of NOX NMVOC and PM from the road traffic sector in E85 scenario (S2)
relative to lsquoall-petrolrsquo scenario (S1)
An important difference in the emissions between the scenarios lies in the speciation of the NMVOC emissions Figure 5 shows this speciation of NMVOCs for all road traffic emission categories used in this study The two rightmost bars in Figure 5 show the NMVOC speciation for Swedish road traffic emissions for the two scenarios S1 and S2 Comparison with Figure4 shows that the relative changes between the two scenarios are much larger for some individual NMVOC species that for the total NMVOC emissions Since the NMVOC emissions from traffic in Sweden are dominated by the emissions from petrol cars (about 85 of the road traffic emissions of NMVOC comes from petrol cars) the variations in NMVOC speciation between petrol and E85
0
02
04
06
08
1
NOx
0
02
04
06
08
1
NMVOC
0
02
04
06
08
1
Aus
tria
Bel
arus
Bel
gium
Bos
-Her
cB
ulga
riaC
roat
iaC
ypru
sC
zech
Rep
Den
mar
kE
ston
iaFi
nlan
dFr
ance
Ger
man
yG
reec
eH
unga
ryIr
elan
dIt
aly
Lat
via
Lith
uani
aL
uxem
bour
gM
alta
Net
herla
nds
Nor
way
Pola
ndPo
rtug
alR
oman
iaR
ussi
a_E
uro
Slov
ak R
epSl
oven
iaSp
ain
Swed
enSw
itzer
land
Tur
key
Ukr
aine
UK
PM
A comparison of emissions from ethanol and petrol fuelled cars IVL report B1962 Health risk assessment for Vaumlstra Goumltaland
16
will have a significant impact on the total road traffic NMVOC speciation As can be seen in Figure 5 scenario S1 is dominated by alkanes and aromatics while scenario S2 is dominated by ethanol It can also be noted that S1 contains a significant emission of benzene which is much lower in S2 while the opposite is true for acetaldehyde
Figure 5 Distribution of hydrocarbon species in NMVOC emissions from individual road traffic emission
categories as defined in emission scenarios in this study and from the whole road traffic emission sector in Sweden for scenarios S1 (All petrol) and S2 (All E85)
Figure 6 shows a map of the EMEP domain with emissions of acetaldehyde for the two studied scenarios as an example of the geographical distribution of emissions
Figure 6 Gridded emissions of acetaldehyde for the year 2020 (in tonnes per grid cell (50 km x 50 km)
and year) a ndash lsquoAll petrol scenario b ndash lsquoAll E85 scenariorsquo
As mentioned the emissions from road traffic in the Vaumlstra Goumltaland region are calculated in a 500 m x 500 m grid Figure 7 shows the emissions of NOX for 2005 as obtained from the database and the projected emissions for 2020 with a mixed use of E85 and petrol This can be considered as the base case for the emissions in 2020 It can be seen that the emissions decrease over the period which is due to reduction in NOX emissions factors as older vehicles are replaced by newer models (the traffic actually increases from a total of 754x109 vehicle-kilometres in 2005 to 937x109
0
20
40
60
80
100
Pet
rol e
xh
Pet
rol e
vap
E-8
5 ex
h
E-8
5 ev
ap
Pet
rol M
C
Die
sel L
DV
Die
sel H
DV
Roa
d Sw
eden
S1
Roa
d Sw
eden
S2
m
ass
Ethane
Alkanes C3+
Ethene
13 Butadiene
Alkenes C3+
Ethyne
Benzene
Aromatics C7+
Formaldehyde
Acetaldehyde
Aldket C3+
Ethanol
A comparison of emissions from ethanol and petrol fuelled cars IVL report B1962 Health risk assessment for Vaumlstra Goumltaland
17
vehicle-kilometres in 2020) The major roads in the region are clearly visible as well as the larger cities (especially Gothenburg)
Figure 7 Emissions of NOX (kgyear for a 500 m x 500 m grid cell) in the Vaumlstra Goumltaland region for 2005
and for 2020 for the base case
In Table 4 the traffic emissions for NOX benzene acetaldehyde ethanol and PM10 for the Vaumlstra Goumltaland region are shown for the four different emissions scenarios The emissions of NOX and benzene are reduced between 2005 and 2020 for the base case while the emissions of ethanol and acetaldehyde increase due to an expected increase in the use of ethanol fuel The NOX emissions for S1 are somewhat higher than for S2 due to the higher NOX emissions factor for petrol compared with E85
Table 4 Emissions from traffic for the Vaumlstra Goumltaland region in four different emission scenarios (in tonnesyear)
Substance base 2005 base 2020 S1 S2 NOX 13 243 4 843 4 954 4 631 Benzene 2 833 927 1 201 386 Acetaldehyde 628 1 074 305 2 595 Ethanol 192 5 192 0 15 400 PM10 1 324 486 483 476
33 Dispersion modelling
Resulting concentrations from calculations of the S1 and S2 scenarios with the EMEP model are used to provide input of primary and secondary air pollutants for the calculations with the TAPM model for the Vaumlstra Goumltaland region Concentrations of NOX NMVOC PM25 PM10 acetaldehyde ethanol and benzene are therefore calculated as boundary conditions for the Vaumlstra Goumltaland region In addition sensitivity studies are performed to investigate the role of formation of secondary acetaldehyde and secondary particulate matter (see Appendix 2) Time series analysis of the TAPM and EMEP model results of the S1 and S2 scenarios are presented in Figure 8
A comparison of emissions from ethanol and petrol fuelled cars IVL report B1962 Health risk assessment for Vaumlstra Goumltaland
18
a)
b)
Figure 8 Time series analyses of S1 and S2 scenarios for the EMEP and TAPM modelled concentrations of NOX and ozone at an urban background site in Gothenburg (TAPM) and in EMEP model grid cells including Gothenburg city (50 km x 50 km)
Concentrations of NOX and ozone at an urban background site in Gothenburg (TAPM) and in the 50 km x 50 km EMEP grid cells including Gothenburg are compared for one summer and one winter month Due to the well-known process of ozone titration by freshly emitted nitrogen monoxide (Seinfeld and Pandis 1998) the concentration of ozone often decreases in urban areas This phenomenon is expected to be captured by the fine-gridded TAPM model but not necessarily by the courser scale of the EMEP model Figure 8 shows the generally higher NOX levels in the small grid cell of the TAPM model in urban background location comparing to those in the large EMEP grid cell while the opposite is observed for the ozone concentrations (Remember that the boundary concentrations for TAPM are obtained from the EMEP model and they are thus the same in both cases) This indeed shows that local scale emissions and processes contribute to locally increased levels of NOX in urban areas both for the summer and the winter cases For ozone where there of course are no primary emissions the situation is the opposite where instead the result is decreased concentration levels at urban sites on a local scale The influence of the
A comparison of emissions from ethanol and petrol fuelled cars IVL report B1962 Health risk assessment for Vaumlstra Goumltaland
19
NMHC emissions from the passenger cars is studied in a sensitivity analysis (see Appendix 23) and it is found to have only a small influence on the ozone levels
To illustrate the results of the different scenario calculations the geographically distributed concentrations are presented as the difference in yearly average concentrations between the all E85 (S2) and all petrol (S1) scenarios both as microgm3 and sometimes as percentage of the difference to scenario S1 (see Appendix 3)
The difference in yearly average concentrations between scenario S1 and S2 for acetaldehyde and benzene can be seen in Figures 9 and 10 respectively The increase in acetaldehyde concentration resulting from a switch from petrol to E85 is up to about 05 gm3 or 80 in the central parts of the largest urban area of the region Gothenburg Outside this area the relative increase is about 10 for the other urban areas and less than that for the rural areas This large relative increase (see map in Appendix 4) is a result of the relatively high emissions of acetaldehyde from E85 fuelled cars For benzene the situation is opposite In the scenarios for 2020 the concentration of benzene decreases by up to a few tenths of gm3 as a result of a switch from petrol to E85 For benzene the relative change is not calculated
Figure 9 The difference in yearly average concentrations of acetaldehyde for 2020 between the all E85 (S2) and all petrol (S1) scenarios (microgm3)
A comparison of emissions from ethanol and petrol fuelled cars IVL report B1962 Health risk assessment for Vaumlstra Goumltaland
20
Figure 10 The difference in yearly average concentrations (gm3) of benzene for 2020 between the all E85 (S2) and all petrol (S1) scenarios
The difference in the calculated NOX NO2 and ozone concentrations between the two scenarios are shown in Appendix 4 The change in NOX concentration between the two scenarios only represents a small fraction of the total NOX concentration This is because the emissions of NOX from petrol cars are relatively low compared with the contribution from diesel engines and other sources Thus the resulting decrease in the NOX concentration with E85 is only up to 3 For ozone there is a small increase of about 01 microgm3 of E85 in the central areas of Gothenburg where there is relatively high traffic intensity (see Appendix 4 Figure A9) In the rest of the region there is a small decrease in the ozone concentration in the E85 scenario
34 Exposure
The resulting concentrations from the dispersion modelling together with the population density distribution are used to assess the exposure to acetaldehyde benzene NO2 NOX and ozone for the two scenarios S1 and S2 The exposure to PM25 is very similar for the two scenarios (the difference in concentration between scenarios S2 and S1 is only about -002 gm3 Table 5 shows the population weighted mean exposure both as total concentrations and as the difference between the two scenarios Detailed exposure results can be found in Appendix 5 It can be seen that the exposure to all the pollutants in Table 5 with the exception of acetaldehyde are somewhat lower for the all E85 scenario (S2) than for the all petrol scenario (S1) However the effect on health also
A comparison of emissions from ethanol and petrol fuelled cars IVL report B1962 Health risk assessment for Vaumlstra Goumltaland
21
depends on the level of the dose-response functions For example if the level of concentration is low in a populated area but the dose-response function is high the effect of even a low concentration increase can become important The increase in exposure from S1 to S2 (S2-S1) calculated as percentage of the population exposed to increased mean concentrations of pollutants is presented in Figure 11
Table 5 Populated weighted mean exposure (gm3)
S1 S2 S2-S1 Acetaldehyde 065 077 014 Benzene 01 005 -007 NOX 85 84 -012 Ozone 570 569 -012 PM25 270 268 -002
Increased concentrations Decreased concentrations Both increased and
decreased conc
Figure 11 The relative exposure (S2-S1) calculated as percentage of the population
In Figure 11 it is clear that the only pollutant that does not show an improvement regarding air quality and thus the health risks when modelling a switch from petrol to E85 is acetaldehyde For all pollutants except for ozone the changes of concentration levels observed between the scenarios are within the urban areas but for ozone there are also differences in rural areas
According to the data in Figure 11 about 14 of the population in the Vaumlstra Goumltaland region will be exposed to 03-08 microgm3 higher concentration levels of acetaldehyde in scenario S2 relative to S1 From Figure 9 it can be seen that the majority of these people live within the Gothenburg area Further about 28 of the population will be exposed to increased levels of between 01 to 03 microgm3 mainly in the suburban areas and rural surroundings of Gothenburg but also in some of the smaller cities in the region Outside the urban areas the concentration difference is lower than 01 microgm3
In the S2 scenario relative to the S1 scenario the population is exposed to decreased concentration levels of benzene and NOX This is mainly true also for O3 but with an exception for the central
A comparison of emissions from ethanol and petrol fuelled cars IVL report B1962 Health risk assessment for Vaumlstra Goumltaland
22
parts of Gothenburg where the concentration actually increases (see Appendix 4 Figure 7A) resulting in that 3 (blue area in Figure 11 for O3) of the population will be exposed to higher concentrations of O3 For the rest of the area there are decreased concentrations of ozone upon a switch to E85
The largest differences are again in the central parts of Gothenburg where about 20 of the population is being exposed to a lower benzene concentration of 01-03 microgm3 This also means that concerning benzene the majority (78) of the population have none or very low influence from a change to ethanol fuel
The largest effect on exposure difference is seen for NOX where just over 20 of the population has its exposure decreased with 03-05 microgm3 (in the central parts of Gothenburg) In the suburbs the decrease is between 01-02 microgm3 lower Along the largest roads there is a small but visible improvement on a yearly basis of 01 microgm3
For PM25 there is a difference in the populated weighted mean exposure of 002 gm3 between the scenarios with a lower value for the all-E85 case (see also Appendix 5)
35 Impact on health in Vaumlstra Goumltaland
351 NO2 and NOX
The impact of long-term exposure on mortality was estimated using the relative risk from the Norwegian cohort study (Nafstad et al 2004) reporting a relative risk of 08 increase per microgm3 increase in NOX however without adjustment for particle concentrations Assuming this effect on the total mortality and a typical baseline mortality of 1000 deaths per 100 000 person years a decrease in the population mean exposure of 012 microgm3 would correspond to approximately 104 less preterm deaths per year However for the present case this number is highly uncertain since the exposure to substances normally associated with changes in NOX exposure may here change in different ways since the relation between different exhaust components varies between the scenarios
The impact of long-term exposure on asthma incidence (new cases) in adults has been estimated using results from the Swedish RHINE Study Cohorts (Modig et al 2009) with very similar results in the ECRHS Study corresponding to approx 4 increase per microgm3 increase in NO2 From the RHINE Study the incidence can be estimated to 03 per year (proportion of adults developing the disease) with children and elderly excluded this means around 1500 adult cases per year A reduction of 009 microgm3 corresponds to 54 avoided new cases of adult asthma per year However also NO2 in the asthma study may have been mainly an indicator of vehicle exhaust
352 Ozone
The impact of long-term exposure on respiratory mortality has been reported to be approx 02 per microgm3 increase in the summer concentration when studied in the large ACS Cohort (Jerret et al 2009) Assuming this effect on the total population and a typical baseline respiratory mortality of 100 deaths per 100 000 person years a decrease in the population mean exposure of 012 microgm3 corresponds to approximately 03 less preterm deaths per year
A comparison of emissions from ethanol and petrol fuelled cars IVL report B1962 Health risk assessment for Vaumlstra Goumltaland
23
353 Acetaldehyde
According to US EPA (1999) a lifetime risk for cancer of 0000002 per microgm3 is to be assumed for this potential human carcinogen An increase in the population mean exposure of 012 microgm3 corresponds to 026 cases more per year in the current population
354 Benzene
According to US EPA (1999) a lifetime risk for cancer (leukaemia) of 00000022-00000078 per microgm3 is to be assumed for this human carcinogen A decrease in the population mean exposure of 0074 microgm3 corresponds to approximately 03 cases less per year in the current population (assuming 0000004 per microgm3)
355 PM25
In CAFEacute and other impact assessments a relative risk of 6 increase in all-cause mortality per 10 microgm3 has usually been assumed Assuming this effect on the total mortality and a typical baseline mortality of 1000 deaths per 100 000 person years a decrease in the population mean exposure of 002 microgm3 corresponds to approximately 13 less preterm deaths per year
4 Discussion
In this study the health risks from a large introduction of E85 to replace petrol is analysed in scenario studies for 2020 for the Vaumlstra Goumltaland region It is found that the change in pollutant concentration exposure and health risks are small between the two scenarios It should be emphasized that the study only considers vehicle emissions and does not take into account effects from the fuel production
The emissions of NOX in the model are somewhat lower from E85 fuelled cars than from petrol fuelled cars This is in line with the emission factors used by Jacobson (2007) The nitrogen oxides are key substances in the atmospheric reactions determining the concentrations of ozone in air NOX is involved in the formation of ozone but close to the NO source the ozone concentration is lowered due to the rapid reactions between NO and O3 forming NO2 If NO is released in an environment with already high NO concentration it may result in lowering of ozone levels on the regional scale In the present study the ozone concentrations calculated are somewhat lower for the E85 scenario than for the petrol scenario
The health risk analysis shows that the main difference between the scenarios is due to the lower concentration of NOX However it may have been other exhaust components than NOX such as exhaust particles that were behind the reported association with mortality In cases when NOX is not a good indicator of exhaust particle emissions and their toxicity our results may be misleading This should be studied further Neglecting the effects of the changes in NOX exposure the total difference between the scenarios sums up to 16 preterm deaths per year with lower values for the E85 scenario while it would sum up to 12 less preterm deaths for the E85 scenario if the effect related to NOX were included Since there are no similar studier for the effect on mortality among those younger than 30-50 years of age we assume the same relative effect on mortality in all ages This makes only a small difference since the large majority of deaths occur in older groups
A comparison of emissions from ethanol and petrol fuelled cars IVL report B1962 Health risk assessment for Vaumlstra Goumltaland
24
The opposite result for the ozone concentration was obtained by Jacobson The reason for this discrepancy is that the Jacobson study concerns Los Angeles a region with high concentrations of pollutants while the study here concerns the Vaumlstra Goumltaland region with much less dense traffic and also lower concentrations of pollutants importantly NOX It is not unlikely that the effect that Jacobson report also would be found for large parts of Europe with higher traffic densities than in the Vaumlstra Goumltaland region
It is worth to emphasize that the major negative health effect in the Jacobson (2007) study is attributed to the increase in ozone concentration that is a result of the decrease of the NO emissions from E85 cars Directly after the emission NO reacts with ozone resulting in drop of the ozone concentration the so-called ozone titration commonly observed in many cities This NO does however form even higher quantities of ozone further downwind contributing to the general increase in the background ozone levels It is also precursor of NO2 secondary PM and other toxic species as eg PAN and hence reductions in NO emissions are never regarded as disbeneficial from the environmental viewpoint
There are of course several sources of uncertainties that influence the results of this study Since the main results concern differences between the two scenarios several of these factors loose on importance for the conclusions This comprises uncertainties in meteorology in future traffic volumes and in the population density distribution However there are some uncertainties that remain important The emission factors for E85 fuelled cars are much less characterised than what they are for petrol cars The emission of particles from E85 fuelled cars is especially uncertain with only very few published results Also the emissions of NMHC are somewhat uncertain and may be higher for E85 at lower ambient temperatures However the sensitivity analysis performed shows that for the studied region the NMHC emissions only have a small influence on the ozone concentrations
5 Conclusions
In this study the impact of tailpipe and evaporative emissions from E85 fuelled cars on air pollution and health risks are calculated and compared with petrol fuelled cars The scenario calculations for the Vaumlstra Goumltaland Region give data on emissions pollutant concentrations exposure and a health risk evaluation
The differences in emission factors between E85 and petrol lies in the emissions of PM and NOX which are about 65 and 58 for E85 relative petrol respectively Also the speciation of the emitted hydrocarbons is significantly different with large emissions of acetaldehyde and ethanol from E85 and large emissions of benzene higher aromatics alkanes and alkenes from petrol
These differences in emission factors reflect in differences in emissions The emission calculations for all Swedish road traffic show a decrease for the E85 scenario relative to the petrol scenario of 65 for NOX 34 for PM25 67 for benzene For acetaldehyde there is an increase of 770
The differences obtained from the TAPM modelling show decreased levels of NOX ozone and benzene with E85 and increased levels of acetaldehyde For the latter the increase may be up to 80 while NOX and ozone show decreases of up to a few per cent and a few tenths of per cent respectively
A comparison of emissions from ethanol and petrol fuelled cars IVL report B1962 Health risk assessment for Vaumlstra Goumltaland
25
The health risk assessment shows decreased health risks in the E85 scenario relative the all-petrol scenario due to the increased NOX exposure correlated with both preterm deaths and asthma However NOX may be mainly an exhaust indicator Smaller effects are expected from the changes in ozone acetaldehyde and benzene exposure The overall difference considering the exposure to PM acetaldehyde benzene and ozone is 16 preterm deaths with lower values for the E85 scenario
6 Acknowledgements
Saab Automobile The Swedish Transport Administration and The Foundation for the Swedish Environmental Research Institute are gratefully acknowledged for financial contribution
Magnus Ekstroumlm and Maria Holmstroumlm at Saab and Martin Juneholm at the Swedish Transport Administration are acknowledged for their most valuable input to the study
David Simpson Norwegian Meteorological Institute EMEP MSC-W Norway and Dept Radio amp Space Science Chalmers Univ Technol Sweden is gratefully acknowledged for help with implementation of the Unified EMEP model
A comparison of emissions from ethanol and petrol fuelled cars IVL report B1962 Health risk assessment for Vaumlstra Goumltaland
26
7 References
Altenstedt J Pleijel K 2000 An alternative approach to photochemical ozone creation potentials under European conditions J Air amp Waste Manage Assoc 50 1023 ndash 1036
Andre J-M (2005) Vehicle emission measurement collection of the ARTEMIS datatbase Artemis 3312 report Available from httpwwwinretsfrurltepublicationspublications-pdfJoumardA3312reportJMALTE0504pdf
Bachand A MMundt K A Mundt D JMontgomery R R Epidemiological studies of formaldehyde exposure and risk of leukemia and nasopharyngeal cancer A meta-analysis Critical Reviews in Toxicology 2010 40(2) 85ndash100
Beane Freeman L E Blair A Lubin J H Stewart P A Hayes R B Hoover R N Hauptmann M Mortality from lymphohematopoietic malignancies among workers in formaldehyde industries The National Cancer Institute Cohort J Natl Cancer Inst 2009101751ndash761
Bosetti C McLaughlin J K Tarone R E Pira E LaVecchia C Formaldehyde and cancer risk A quantitative review of cohort studies through 2006 Ann Oncol 20081929ndash43
ConcaweJRC Well-to-wheel studies httpiesjrceceuropaeuwtwhtml
Derwent R G Jenkin M E Saunders S M 1996 Photchemical ozone creation potentials for a large number of reactive hydrocarbons under European conditions Atmos Environ 30 181 ndash 199
Derwent RG Jenkin ME Passant NR Pilling MJ 2007 Photochemical ozone creation potentials (POCPs) for different emission sources of organic compounds under European conditions estimated with a Master Chemical Mechanism Atmos Env 41 2570ndash2579
EEA Copenhagen 2009 wwweeaeuropaeudata-and-mapsdatapopulation-density-disaggregated-with-corine-land-cover-2000-2
Ericsson P Holmstroumlm M Amberntsson-Carlsson A Ohlson C Skoglundh M Andersson B Carlsson P-A 2008 Characterization of particulate emissions and methodologhy for oxidation of particulates from non-diesel combustion ystems SAE Technical Paper Series 2008-01-1746
GAINS 2010 httpgainsiiasaacatindexphpgains-europe
Graham LA Belisle SL Baas C-L Emissions from light duty gasoline vehicles operating on low blend ethanol gasoline and E85 Atmospheric Environment 42 4498 (2008)
Haskew H M Thomas P E Liberty F 2006 Fuel Permeation From Automotive Systems E0 E6 E10 E20 And E85 Final Report CRC Project No E-65-3 Coordinating Research Council Inc 3650 Mansell RoadSuite 140Alpharetta GA 30022
HEI Air Toxics Review Panel (2007) Mobile-Source Air Toxics A Critical Review of the Literature on Exposure and Health Effects HEI Special Report 16 Health Effects Institute Boston USA
Hurley P TAPM v 4 User Manual 2008 CSIRO ISBN 978-1-921424-73-1
IARC (2006) IARC Monographs on the Evaluation of Carcinogenic Risks to Humans Wood Dusts and Formaldehyde Lyon World Health Organization International Agency for Research on Cancer Lyon France 8837ndash325
Jacobson M Z Effects of Ethanol (E85) versus Gasoline Vehicles on Cancer and Mortality in the United States Environ Sci Technol 2007414150-4157
A comparison of emissions from ethanol and petrol fuelled cars IVL report B1962 Health risk assessment for Vaumlstra Goumltaland
27
Jerret M Burnett R T Pope C A Ito K Thurston G Krewski D Shi Y Calle E Thun M Long-Term Ozone Exposure and Mortality N Engl J Med 20093601085-95
Lipman T E Delucchi M A 2002 Emissions of nitrous oxide and methane from conventional and alternative fuel motor vehicles Climate Change 53 477
Modig L Toreacuten K Janson C Jarvholm B Forsberg B Vehicle exhaust outside the home and onset of asthma among adults Eur Respir J 2009 Jun33(6)1261-7
Nafstad P Haheim L L Wisloff T Gram F Oftedal B Holme I Hjermann I Leren P Urban air pollution and mortality in a cohort of Norwegian men Environ Health Perspect 2004112(5)610-5
OEHHA (1999) Air Toxics Hot Spots Program Risk Assessment Guidelines Part II Technical Support Document for Describing Available Cancer Potency Factors Prepared by the Air Toxicology and Epidemiology Section Office of Environmental Health Hazard Assessment April 1999
Passant NR (2002) Speciation of UK emissions of non-methane volatile organic compounds AEAT report AEATENVR0545 Issue 1 Culham UK
Pope CA III Thun MJ Namboodiri MM Dockery DW Evans JS Speizer FE Heath CJ Particulate air pollution as a predictor of mortality in a prospective study of US adults Am J Resp Crit Care Med 1995 151 669-674
Seinfeld J H and Pandis SN (1998) Atmospheric Chemistry and Physics From Air Pollution to Climate Change John Wiley amp Sons New YorkSimpson D Fagerli H Jonson JE Tsyro S Wind P Tuovinen J -P 2003 Transboundary acidification and eutrophication and ground level ozone in Europe Unified EMEP Model Description EMEP Status Report 12003 Part I EMEPMSC-W Report The Norwegian Meteorological Institute Oslo Norway
US EPA (1999) httpwwwepagovttnatwnata1999nsata1999
Vestreng V et al 2004 Inventory Review 2004 Emission data reported to CLRTAP and the NEC Directive EMEPEEA Joint Review Report EMEPMSC-W Note 1
Westerholm R Ahlvik P Karlsson HL An exhaust characterisation study based on regulated and unregulated emissions from bi-fuel and flexi-fuel light-duty passanger cars fuelled by petrol (E5) bioethanol (E70 E75) and biogas tested at ambient temperatures of +22degC and -7degC 2008
Wolkoff P Nielsen G D Non-cancer effects of formaldehyde and relevance for setting an indoor air guideline Environment International 201036788ndash799
Yanowitz J McCormick RL Effect of E85 on tailpipe emissions from light-duty vehicles J Air amp Waste Manage Assoc 59 172 (2009)
A comparison of emissions from ethanol and petrol fuelled cars IVL report B1962 Health risk assessment for Vaumlstra Goumltaland
28
Appendix 1 Evaporate emissions of NMHC
The following assumptions are done for evaporative emissions The NMHC emissions from E85 are reduced relative to petrol by 45 Methane emissions are zero and the split of NMHC species is 68 ethanol and the remaining 32 is divided in the same way as evaporative emissions for petrol The estimates by Graham et al (2008) are missing evaporative emission data however these assumptions agrees very well with measurements of evaporative emissions due to fuel permeation reported by Haskew et al (2006) where NMHC emissions are reported to be reduced by 50 for E85 fuel compared to petrol Haskew et al also presents the NMHC split to species with 60 ethanol This number agrees quite well with our assumption of 68 NMHC being ethanol NMHC in exhaust and evaporative emissions are thus divided as in Table A1
Table A1 Division of NMHC in the exhaust and evaporative emissions for E85 and petrol respectively (wt)
E85 Petrol E85 Petrol exhaust exhaust evaporative evaporative
Ethanol 680 0 680 0 Acetaldehyde 131 08 02 0 Ethene 99 73 24 0 Ethyne 03 28 09 0 Formaldehyde 31 17 06 0 Benzene 16 56 18 10 13 Butadiene 03 09 03 0 sum 963 191 741 10
The remaining NMHC emissions are divided as for petrol (ref) and listed in Table A2
Table A2 Division of NMHC in the exhaust and evaporative emissions for E85 and petrol respectively (wt)
E85 Petrol E85 Petrol exhaust exhaust evaporative evaporative
Ethane 02 32 10 0 Alkanes (C3+) 13 278 89 880 Alkenes (C3+) 04 90 29 95 Aromatics (C7+) 18 388 125 15 Aldehydesketones (C3+)
01 15 05 0
A comparison of emissions from ethanol and petrol fuelled cars IVL report B1962 Health risk assessment for Vaumlstra Goumltaland
29
Appendix 2 Description of the model system
A21 Atmospheric lifetimes
Table A3 gives tropospheric lifetimes with regard to reaction of ethanol formaldehyde acetaldehyde and benzene (C6H6) with OH nitrate radical (NO3) and photolysis The studied organic species are listed together with three species common in the gasoline exhaust (benzene ethene and toluene) for comparison Table 11 shows also photochemical ozone creation potential (POCP) of these species POCP is a measure of amount of ozone that is formed from a certain VOC emission relatively to other emission source which has been established to the same emission mass of ethene (Derwent et al 1996 Altenstedt et al 2000) The range represents different scenarios for VOC and NOX background concentrations Derwent et al (2007) used similar methodology to calculate POCP of different VOC sources and calculated POCP of mean road emission exhaust to be 69
Table A3 Atmospheric lifetimes of studies NMVOC species with respect to the OH- and NO3- initiated
degradation τ(OH) and τ(NO3) and with respect to the photolysis (The lifetime of a chemical species which decays in a first-order process is the time needed for a concentration of this species to decrease to 1e of its original value Statistically it represents the mean life expectancy of an excited species) The OH concentration of 1times106 moleculescm3 typical for summer troposphere was used for the lifetime calculation The NO3 concentrations of 5 and 100 ppt(V) were used for lifetime calculations as representative of rural and urban night-time 12 hrs mean concentration The studied organic species are listed together with 3 species common in the gasoline exhaust for comparison The rates of photolysis were calculated with radiation transfer model for July 58ordm latitude and integrated over 24 hours
τ(OH) τ(NO3) urbanrural τ (photolysis) POCP
hr hr hr
Ethanol 85 56 1times103 - 44 - 63
Acetaldehyde 15 47 1times103 86 68 - 80
Formaldehyde 30 194 4times103 10 18 - 55
Benzene 214 - - 23 - 47
Ethene 34 - - 100
Toluene 50 - - 30 - 67
A22 Defining of boundary concentrations for TAPM from EMEP fields
Calculation of initial concentration field for TAPM from EMEP concentration field of NO2 (as example) and EMEP mean wind vector components u_mid and v_mid Two EMEP model gridcells (i=56 j=60 and i=56 j=61) represent the TAPM model domain and concentrations from the surrounding EMEP gridcells SE-S SE-N NW-S NW-N NE NW (Figure A1) are used for calculation of boundary concentration NO2(bc) according to the following code if u_mid lt= 0 then ( isite = SE-S and jsite = SE-N) else isite = NW-S and jsite = NW-N) endif
A comparison of emissions from ethanol and petrol fuelled cars IVL report B1962 Health risk assessment for Vaumlstra Goumltaland
30
if v_mid lt= 0 then ( ksite = NE) else ksite = SW endif NO2(bc) = [(NO2(isite)u_mid(isite) + NO2(jsite)u_mid(jsite))2 + NO2(ksite)v_mid(ksite)] [(u_mid(isite) + u_mid(jsite))2 + v_mid(ksite)]
Figure A1 Gridcells covering Gothenburg domain and its boundary in EMEP model plotted on latitude-
longitude coordinates The red square represents centre of Gothenburg and the blue line the coastline EMEP i and j coordinates for the boundary gridcells are SE-S = 57-60 SE-N = 57-61 NW-S = 55-60 NW-N = 55-61 NE = 56-62 NW = 56-59 and for Gothenburg grid cells are Gbg-NE = 56-61 Gbg-SW = 56-60
A23 Atmospheric chemistry
The role of secondary chemistry in for the concentration of acetaldehyde are studied by first excluding the primary acetaldehyde emissions from the EMEP model simulations of scenarios S1 and S2 and then by excluding all NMVOC emissions from the car category with spark ignition engines The contribution from the primary acetaldehyde emissions as well as the contribution of secondary acetaldehyde formed from other NMVOC to the total acetaldehyde concentration is then obtained However the secondary chemistry is highly nonlinear due to the interactions of NMVOCs with ozone and OH and thus the results for the contribution of secondary acetaldehyde are somewhat uncertain Differences in acetaldehyde concentrations between S1 and S2 scenarios are studied with respect to contribution of primary and secondary acetaldehyde It is observed that in summer background air the monthly mean contribution of the secondary acetaldehyde is of the same magnitude as the contribution of the primary acetaldehyde to the difference between S1 and
565
57
575
58
585
105 115 125 135 145
Long
Lat
Gbg-SW
Gbg-NE
SE-S
NW-N
NW-S
SE-N
SW
NE
55-59
57-59
55-62
A comparison of emissions from ethanol and petrol fuelled cars IVL report B1962 Health risk assessment for Vaumlstra Goumltaland
31
S2 In the winter and in more polluted atmosphere (Gothenburg grid cells) the contribution from secondary acetaldehyde to the concentration difference appears to be negative due to the chemistry feedback ie the E-85 scenario has less secondary acetaldehyde than the all-petrol scenario
A comparison of S2-S1 differences in primary and secondary acetaldehyde concentrations in the background (=upwind) and Gothenburg grid cells show no increase in the secondary acetaldehyde from upwind to the Gothenburg grid cell It can thus be concluded that there is no significant contribution from secondary aldehydes on the small scale (tenths of km) Conclusion from this sensitivity study is that the secondary formaldehyde can be of importance under summer in the clean background air but that formation on the local scale is unimportant Using EMEP simulated boundary concentrations of acetaldehyde in the local scale model and simulating the primary acetaldehyde emissions will capture the most important features of acetaldehyde dispersion and chemistry in Vaumlstra Goumltaland
In the EMEP model the tail-pipe PM emissions are specified as primary particles Emissions of NOX and VOCs (and NH3 SO2) are oxidised in the atmosphere and a part is then transferred through the gas-to-particle transport to the PM as secondary PM The petrol fuelled cars emit both more primary PM and more NOX compared to the E85 cars If we compare differences in primary and secondary PM between the S1 and S2 scenarios simulated by EMEP we can directly see what part of the difference is from the tail-pipe emissions of the primary particles and what part is from the formation of the secondary PM in atmosphere (mostly from higher emissions of NOX) Table A4 shows the differences between S1 and S2 (S1-S2) of monthly PM averages for January and June (two months with low and high photochemical activities respectively) It can be seen that the higher formation of secondary PM in the S1 (all-petrol) scenario is more important than the higher tail-pipe emission of primary PM by factor 10 - 20
When we compare simulated PM differences between S1-S2 for the background air (=upwind) grid cells and for grid cells including Gothenburg (50 km x 50 km scale) we can see significant increase in primary PM in the S1 scenario from the upwind grid cells to Gothenburg (746 in winter 132 in summer) while no systematic increase can be seen for the secondary PM (-42 in winter +24 in summer) From this comparison it can be concluded that no systematic increase in secondary PM can be seen (in difference from the primary PM) on the scale of 50-100 km and we can neglect this process on the small scale However the overall change in PM concentrations due to the switch of the fuel is very small both on the large scale and on the small scale as can be seen when the differences in PM concentrations between S1 and S2 are compared to absolute PM concentrations in S1 presented in the last column of Table A4
Table A4 Differences in primary and secondary PM concentrations between the lsquoAll-petrolrsquo (S1) and lsquoE-85rsquo (S2) scenarios simulated in gridcells upwind Gothenburg and in gridcells including Gothenburg (2 50 km x 50 km gridcells)
S1-S2 Background
S1-S2 Gothenburg
Increase S1-S2 Gothenburg
S1 Background
μgm3 μgm3 μgm3 bkgnd μgm3
Prim PM10 Jan 00008 00014 00006 746 084
Jun 00008 00018 00010 1319 084
Sec PM10 Jan 00155 00148 -00006
-42 157
Jun 00080 00081 00002 24 213
The sensitivity of the used emission factors for NMHC with respect to the ozone formation in the region of the Swedish West Coast can be analysed with the help of results from studying the
A comparison of emissions from ethanol and petrol fuelled cars IVL report B1962 Health risk assessment for Vaumlstra Goumltaland
32
formation of secondary acetaldehyde In this study first all primary acetaldehyde emitted by the E85 fleet are omitted in a model simulation (S2_nopAA) and secondly all NMHC emissions from the E-85 fleet are switched off (S2_noVOC) Acetaldehyde has a somewhat higher though still comparable photochemical ozone creation potential compared to ethanol (ethanol 44-63 acetaldehyde 68-80 Altenstedt and Pleijel 2000) and this simulation will thus also give information on the sensitivity of the calculations to uncertainties in the ethanol emissions Setting the emission factor for NMHC to zero gives the sensitivity to the emission factor of total NMHC Figure A2 shows the differences in ozone concentration as a result of acetaldehyde only and the total NMHC from the E85 car fleet (S2 scenario) We can see that the effect on ozone formation is very small for the Swedish West coast The reason is that the ozone formation in this area is controlled by the availability of NOX while NMHC or rather their degradation products the peroxy radicals that serve as a lsquofuelrsquo to ozone formation are usually in excess here and further VOC emissions do not increase ozone concentrations significantly The situation looks different in areas that are more heavily polluted with NOX andor which is limited in the availability of peroxy radicals The results from this sensitivity study are fully consistent with the observed increase in ozone concentrations as a result of lower NO emissions (the so-called ozone titration) only very close to the major roads but no larger-scale decrease in ozone concentrations in the Gothenburg area or in any other communities
Figure A2 Sensitivity of the ozone formation in the 2 EMEP model grid cells covering Gothenburg (blue) and in the 6 surrounding grid cells (red see Fig A1) to changes in NMHC emission factor of the E85 fuelled cars lsquobasersquo is simulation S2 with EF for NMHC as in Table 3 lsquonoVOCrsquo is S2 with EF for all NMHC = 0 lsquonopAArsquo is S2 with EF for acetaldehyde = 0 a ndash Mean sensitivity in January absolute difference in ozone formation in ppb(V) as a result of NMHC (base-noVOC) and acetaldehyde (base-nopAA) emissions b ndash Sensitivity relative to ozone concentration in the S2-base simulation January c ndash same as a) but June d ndash same as b) but June
‐002
‐001
0
001
base‐noVOC base‐nopAA
ΔO3(ppb)
a)
0
001
002
base‐noVOC base‐nopAA
ΔO
3(ppb)
c)
‐010
‐005
000
005
base‐noVOC base‐nopAA
ΔO
3
b)
000
002
004
006
base‐noVOC base‐nopAA
ΔO
3
d)
A comparison of emissions from ethanol and petrol fuelled cars IVL report B1962 Health risk assessment for Vaumlstra Goumltaland
33
Appendix 3 Emission results
The geographically distributed NOX and acetaldehyde emissions for the Vaumlstra Goumltaland region are presented in Figures A3 and A4 respectively
Figure A3 NOX emissions for the Vaumlstra Goumltaland region for the All Petrol scenario
A comparison of emissions from ethanol and petrol fuelled cars IVL report B1962 Health risk assessment for Vaumlstra Goumltaland
34
Figure A4 Acetaldehyde emissions for the Vaumlstra Goumltaland region for the All Ethanol scenario
A comparison of emissions from ethanol and petrol fuelled cars IVL report B1962 Health risk assessment for Vaumlstra Goumltaland
35
Appendix 4 Dispersion modelling results
The difference in yearly average concentration between scenario S1 and S2 for acetaldehyde and benzene can be seen in Figure A5 and Figure A6 respectively a)
b)
Figure A5 The difference in yearly average concentrations of acetaldehyde for 2020 between the all E85 (S2) and all petrol (S1) scenarios presented as a) microgm3 and as b) percentage for the Gothenburg area
A comparison of emissions from ethanol and petrol fuelled cars IVL report B1962 Health risk assessment for Vaumlstra Goumltaland
36
a)
b) all E85 c) all petrol
Figure A6 a) the difference in yearly average concentrations (gm3) of benzene for 2020 between the all E85 (S2) and all petrol (S1) scenarios yearly means for b) all E85 and c) all petrol (note the different scales)
The difference in the calculated NOX NO2 and ozone concentrations between the two scenarios are shown in Figures A7 A8 and A9
A comparison of emissions from ethanol and petrol fuelled cars IVL report B1962 Health risk assessment for Vaumlstra Goumltaland
37
a)
b)
Figure A7 The difference in yearly average concentrations of NOX for 2020 between the all E85 (S2) and all petrol (S1) scenarios presented as a) microgm3 and as b) percentage for the Gothenburg area
A comparison of emissions from ethanol and petrol fuelled cars IVL report B1962 Health risk assessment for Vaumlstra Goumltaland
38
a)
Figure A8 The difference in yearly average concentrations of NO2 for 2020 between the all E85 (S2) and all petrol (S1) scenarios presented as a) microgm3 and as b) percentage for the Gothenburg area
A comparison of emissions from ethanol and petrol fuelled cars IVL report B1962 Health risk assessment for Vaumlstra Goumltaland
39
a)
b)
Figure A9 The difference in yearly average concentrations of ozone for 2020 between the all E85 (S2) and all petrol (S1) scenarios presented as a) microgm3 and as b) percentage for mainly the Gothenburg area
A comparison of emissions from ethanol and petrol fuelled cars IVL report B1962 Health risk assessment for Vaumlstra Goumltaland
40
Appendix 5 Detailed Exposure data
Detailed exposure data for the difference between the all E85 (S2) and the all petrol (S1) scenarios can be found in Table A5
Table A5 Exposure data for the difference between the all E85 (S2) and the all petrol (S1) scenarios
Acetaldehyde diff E-P (microgm3)
Populated weighted mean
Number of people Percentage of population
0 - 01 627198 582 01 - 02 163394 152 02 - 03 134879 125 03 - 04 88099 82 04 - 05 38686 36 05 - 06 16880 16 06 - 07 7983 07 07 - 08 1248 01 Tot 014 1078367 Benzene diff E-P (microgm3)
Populated weighted mean
Number of people Percentage of population
-03 - -02 26680 25 -02 - -01 205757 191 -01 - -0 845930 784 Tot -0074 1078367 NO2 diff E-P (microgm3) Populated weighted
mean Number of people Percentage of
population -04 - -03 7698 07 -03 - -02 50131 46 -02 - -01 296288 275 -01 - -0 724250 672 Tot -009 1078367 NOX diff E-P (microgm3) Populated weighted
mean Number of people Percentage of
population -06 - -05 7698 -05 - -04 19639 18 -04 - -03 36626 34 -03 - -02 161685 150 -02 - -01 186500 173 -01 - -0 666219 618 Tot -012 1078367 O3 diff E-P (microgm3) Populated weighted
mean Number of people Percentage of
population -02 - -01 779132 723 -01 - -0 266417 247 0 - 01 32818 30 Tot -012 1078367
Exposure data for the total levels in the two scenarios can be found in Table A6
A comparison of emissions from ethanol and petrol fuelled cars IVL report B1962 Health risk assessment for Vaumlstra Goumltaland
41
Table A6 Exposure data for the total levels in the two scenarios
Acetaldehyde tot All ethanol (microgm3)
Populated weighted mean
Number of people Percentage of population
06 - 07 568825 527 07 - 08 171845 159 08 - 09 124551 115 09 - 10 100946 94 10 - 11 59235 55 11 - 12 30559 28 12 - 13 13175 12 13 - 14 7983 07 14 - 15 1248 01 Tot 077 1078367 Acetaldehyde tot All petrol (microgm3)
Populated weighted mean
Number of people Percentage of population
05 - 06 45111 42 06 - 07 1032008 957 07 - 08 1248 01 Tot 065 1078367 Benzene tot All ethanol (microgm3)
Populated weighted mean
Number of people Percentage of population
0 - 01 1055961 98 01 - 02 22406 2 Tot 005 1078367 Benzene tot All petrol (microgm3)
Populated weighted mean
Number of people Percentage of population
0 - 01 729093 676 01 - 02 232961 216 02 - 03 94042 87 03 - 04 21023 19 04 - 05 1248 01 Tot 010 1078367 NOX tot All ethanol (microgm3)
Populated weighted mean
Number of people Percentage of population
0-10 779108 722 10-20 254658 236 20-30 28683 27 30-40 11070 10 40-50 3426 03 50-60 0 00 60-70 0 00 70-80 639 01 80-90 0 00 90-100 0 00 100-110 783 01 Tot 84 1078367 NOX tot All petrol (microgm3)
Populated weighted mean
Number of people Percentage of population
0-10 769557 714 10-20 264209 245 20-30 28683 27 30-40 11070 10 40-50 3426 03 50-60 0 00
A comparison of emissions from ethanol and petrol fuelled cars IVL report B1962 Health risk assessment for Vaumlstra Goumltaland
42
60-70 0 00 70-80 639 01 80-90 0 00 90-100 0 00 100-110 783 01 Tot 85 1078367 O3 tot All ethanol (microgm3)
Populated weighted mean
Number of people Percentage of population
40-45 1422 01 45-50 26487 25 50-55 176636 164 55-60 770370 714 60-65 103452 96 Tot 569 1078367 O3 tot All petrol (microgm3)
Populated weighted mean
Number of people Percentage of population
40-45 1422 01 45-50 20229 19 50-55 181876 169 55-60 763361 708 60-65 111479 103 Tot 570 1078367 PM25 tot All ethanol (microgm3)
Populated weighted mean
Number of people Percentage of population
1-2 0 00 2-3 885325 821 3-4 192259 178 4-5 783 01 Tot 268 1078367 PM25 tot All petrol (microgm3)
Populated weighted mean
Number of people Percentage of population
1-2 0 00 2-3 868773 806 3-4 208811 194 4-5 783 01 Tot 270 1078367

A comparison of emissions from ethanol and petrol fuelled cars IVL report B1962 Health risk assessment for Vaumlstra Goumltaland
2
Content
Abstract 1 1 Introduction 3 2 Methods 4
21 Overview 4 22 Emission factors 4 23 Traffic data 5 24 Emissions 6 25 Dispersion modelling 7
251 Local scale modelling 7 252 EMEP modelling 8
26 Exposure 9 27 Health effects and risk assumptions 10
271 NOX and NO2 10 272 Ozone 10 273 Acetaldehyde 10 274 Benzene 10 275 Formaldehyde 10 276 PM 11 277 Health Impact Assessment 11
3 Results 11 31 Emission factors 11 32 Emissions 14 33 Dispersion modelling 17 34 Exposure 20 35 Impact on health in Vaumlstra Goumltaland 22
351 NO2 and NOX 22 352 Ozone 22 353 Acetaldehyde 23 354 Benzene 23 355 PM25 23
4 Discussion 23 5 Conclusions 24 6 Acknowledgements 25 7 References 26 Appendix 1 Evaporate emissions of NMHC 28 Appendix 2 Description of the model system 29 Appendix 3 Emission results 33 Appendix 4 Dispersion modelling results 35 Appendix 5 Detailed Exposure data 40
A comparison of emissions from ethanol and petrol fuelled cars IVL report B1962 Health risk assessment for Vaumlstra Goumltaland
3
1 Introduction
Facing the problems with global warming and the diminishing supplies of oil alternative fuels are becoming more and more important for road traffic Several alternative fuels are being tested such as biogas alcohols and dimethyl ether (DME) One fuel that has been used for several years in Brazil and has become popular in eg Sweden and the USA during the last ten years is ethanol It is used both as a component (about 5 vol) in regular petrol and as E85 (85 vol ethanol 15 vol petrol)
The main discussion points regarding the environmental performance for ethanol as a fuel are related to the production In this study the production of ethanol fuel is not in focus but rather the impact from emissions stemming from E85 fuelled cars Although the emissions from E85 cars are not as well characterised as the emissions from petrol cars there are some notable differences in the emissions This relates to some extent to the emissions of nitrogen oxides (NOX) and particulate matter (PM) but mainly to the composition of the emitted organic compounds The main differences here are that petrol generates relatively higher emissions of benzene while E85 generates relatively higher emissions of acetaldehyde and ethanol
Ethanol has a reaction lifetime of several days and the major product of its OH-initiated degradation is acetaldehyde The OH-initiated degradation of acetaldehyde gives upon further reaction with NO2 peroxy-acetyl nitrate (PAN) Other reactions of acetaldehyde give mainly formaldehyde and CO2 All of acetaldehyde formaldehyde and PAN have negative effects on human health
These differences in emissions will potentially give different impacts on health and the environment This can be both through risks linked to the primary emissions and to the mentioned secondary products formed in the atmosphere In order to assess the health risks it is necessary to calculate the emissions in space and time describe the dispersion and chemical reactions taking place in the atmosphere and to calculate the exposure to humans
Jacobson (2007) studied the impact on health risks of a change from petrol to E85 in a scenario analysis for the US in 2020 A greater risk was found for the E85 scenario compared to an all-petrol scenario due to the effects on the ozone concentration However the differences found were small and the conclusion made is that it is unlikely that the use of E85 fuel would improve air quality relative to petrol
In the present study the change in impact on health risks between a scenario with all petrol and one with all E85 is studied for 2020 The fuel switch is applied to all positive ignition injection cars for the EMEP-model domain (covers Europe and surrounding parts of North Africa and Asia) and the health impact is studied for the region of Vaumlstra Goumltaland in Sweden Two emission scenarios for 2020 are constructed and dispersion modelling is applied to obtain the human exposure to key pollutants in the region The dispersion modelling is performed with the EMEP model for extended Europe and the data obtained are used as boundary conditions for the model for the Vaumlstra Goumltaland region In the latter detailed traffic and emissions scenarios are used together with the TAPM model to obtain concentration levels and population exposure The differences in health impacts are then assessed The setup of the scenarios is similar to what is presented by Jacobson but of course applied to a different region with different climate as well as traffic and population density
A comparison of emissions from ethanol and petrol fuelled cars IVL report B1962 Health risk assessment for Vaumlstra Goumltaland
4
2 Methods
21 Overview
The overall objective of the present study is to compare the health impacts in the Vaumlstra Goumltaland region of emissions from petrol fuelled cars (ie cars with Otto engines and spark ignition) in two scenarios for 2020 one with all petrol and one with all E85 Thus in one scenario all these cars are assumed to be fuelled by petrol and in the second all these cars are assumed to be fuelled by E85 The lsquoall-petrolrsquo scenario is called S1 the lsquoE85rsquo scenario S2 The study comprises
emission calculations dispersion modelling population exposure analysis health impact assessment
Two dispersion model runs for the Vaumlstra Goumltaland region (see Figure 1b) are performed with the TAPM model In order to calculate the pollutants entering this region the larger scale EMEP (see Figure 1a) model is applied to the extended European region a) b)
Figure 1 The model area for a) the EMEP model and b) the TAPM model For the TAPM modelling the indicated square in b) is the model domain and the defined map is the Vaumlstra Goumltaland region
22 Emission factors
The study starts with establishing emission factors for petrol- and E85-fuelled cars This basically gives two sets of emission factors that can be applied to the projected traffic volumes For the Vaumlstra Goumltaland region the emission factors used with the exception of E85 cars are taken from
A comparison of emissions from ethanol and petrol fuelled cars IVL report B1962 Health risk assessment for Vaumlstra Goumltaland
5
the Artemis model (Andre 2005) This is a detailed emission model used also in the Swedish reporting of emissions from road traffic and must be considered as the source with the most accurate emission factors for road traffic for Swedish conditions Artemis contains emission factors for the year 2020 which are used in this study Speciation of NMVOC emissions (except for E85 fuelled cars) come from Passant (2002)
The emission scenarios used for Europe are built on EMEPrsquos lsquoCurrent Policyrsquo (CP) scenario for the year 2020 (Vestreng et al 2004) This scenario contains emissions and fuel consumption divided into different source sectors where one is road traffic In order to calculate the emissions for the two scenarios the relative change in emission factors for positive ignition injection cars between petrol and E85 are used
The data available in the EMEP emission database are however not detailed enough for the purpose of this study For example detailed information on the emissions from different vehicle categories is needed Further division of emissions of hydrocarbons on exhaust emission and evaporative emissions are needed as well as a breakdown of PM emissions on exhaust particles and wear particles Therefore a detailed partition of the traffic emissions in the gridded EMEP emission database is done for all countries in the EMEP model domain with help of the data on national emissions in the GAINS model (GAINS 2010) which includes a detailed breakdown of emissions to vehicle categories fuels used etc An exception is made for Sweden where the partition of emissions is calculated with the Artemis model (with the exception of the wear particles that are not covered by Artemis and are taken from GAINS) The GAINS model is an instrument used for policy scenario development and optimisation and contains data of activities (eg fuel and energy consumption) emission factors and emissions from different sources specified for detailed categories This model has a two-way connection to EMEP program in general and to the EMEP model in particular as the transport chemical conversion and deposition matrix for the pollutants emitted from individual countries in GAINS are pre-calculated by EMEP and the future policy scenarios in EMEP are generally consistent with GAINS scenarios as both tools are used for the LRTAP convention and the EU legislation work In the scope of this project it is found that EMEP and GAINS emissions are not fully consistent while the EMEP emission database is based on expert-assessed data reported by the member states the GAINS emissions are based on model calculations The continental scale modelling was based on the EMEP emissions database since this is a gridded database commonly used in EMEP modelling which has its historical scenarios validated within the EMEP monitoring program
While emission factors for petrol cars are relatively well established the data for E85 are much scarcer The Artemis model does not contain detailed emission factors for E85 cars and the situation is similar for the EMEP model The GAINS model considers only zero emissions of CO2 while all other emissions are the same as for petrol To obtain the emission factors for E85 cars data were sought in the open literature (see further below)
23 Traffic data
In order to calculate emissions the emission factors must be applied to data on traffic volumes of the different vehicle categories For Europe the mentioned EMEP policy scenario is used Since the traffic volumes are not available in the EMEP database the relative volumes of traffic in different vehicle categories relative to the total traffic volume are recalculated on national basis using the GAINS model
A comparison of emissions from ethanol and petrol fuelled cars IVL report B1962 Health risk assessment for Vaumlstra Goumltaland
6
For the whole Sweden the traffic prognosis and emissions obtained from the Artemis model are used The results here are very similar to what can be found in the EMEP database which is to be expected since Artemis is used in the Swedish reporting Figure 2 shows the fleet composition in Sweden 2020 from the Artemis model
Figure 2 Contribution of vehicles and fuel categories to the total transport work (vehicle-kilometersyear)
in 2020 in the Artemis model S1-scenario all categories with blue or green colour except the E85 busses use petrol S2-scenario all categories with blue or green colour use E85
For the Vaumlstra Goumltaland region the traffic data for 2005 come from two sources For the city of Gothenburg detailed traffic data are obtained from the local environmental agency For the remaining Vaumlstra Goumltaland region traffic data from the Swedish Transport Administration are used
The changes in all national Swedish emission sources in the EMEP model from year 2005 to 2020 are applied to the emission sources in the inventory for Vaumlstra Goumltaland to produce the 2020 emission scenario
24 Emissions
The emission factors and traffic data are used to obtain emissions in two emissions scenarios S1 where all ignition injection cars are assumed to use petrol and S2 where these cars all use E85 Note that all other road traffic sources such as diesel cars heavy duty vehicles etc are treated in the same way in both scenarios The emissions for Vaumlstra Goumltaland are also calculated for two base-scenarios for 2005 and 2020 where the actual traffic and fuel composition (for 2005) and a prognosis on traffic and fuel composition (for 2020) from the Swedish Transport Administration are used In the impact assessment however only the scenarios with all petrol or all E85 are used
The input of emission data required by the EMEP model consists of annual national emissions The species considered are sulphur dioxide (SO2) nitrogen oxides (NOX = NO+NO2) ammonia (NH3) non-methane volatile organic compounds (NMVOC) carbon monoxide (CO) and
busses dieselampCNG
busses E85
HGV diesel
HGV petrol
LCV diesel
LCV petrol
pass cars dieselCNG LPG hybridpass cars petrol
pass cars E‐85
A comparison of emissions from ethanol and petrol fuelled cars IVL report B1962 Health risk assessment for Vaumlstra Goumltaland
7
particulate matter (PM25 PM10) These emissions are provided for ten anthropogenic source sectors of which only emissions in the road traffic sector changes between the emissions scenarios calculated in this study The emissions are also distributed to vary between months weekdays and over the hours of the day Distribution of the NMVOC emissions between different compounds which are specific to each emission sector and country are used In this study this speciation will vary for road traffic between the scenarios as is described below
For the Vaumlstra Goumltaland region the emissions from traffic and non-road machinery are distributed as 500 m x 500 m grids while emissions from industry and heating plants are treated as point sources (including all physical processes usually connected to that type of sources) Emissions from ships are described as line sources The data are time resolved hourly over the day over the days of the week for each month
25 Dispersion modelling
Effects of the Europe-wide use of the E85 fuel on air pollution in Sweden are studied with two models on two different geographical scales To capture the large-scale changes especially those concerning ozone and other secondary air pollutants the European-scale chemistry transport model EMEP is used (Simpson et al 2003) The effects on exposure of people to air pollutants and consequent health effects are studied using air pollutant concentrations calculated with the small scale dispersion model TAPM which is nudged into EMEP air pollution fields (See Appendix 2 for details) In this way the large scale effects such as formation of ozone secondary PM and secondary aldehydes are accounted for also on the local scale In the case of benzene only the road traffic contribution is calculated due to lack of information on emissions from sources other than traffic
251 Local scale modelling
The TAPM model (Hurley 2008) is used to calculate the local contribution to air pollutants in the Vaumlstra Goumltaland region in the two scenarios The geographically distributed pollutants are then used for the exposure calculations and eventually the health risk assessment TAPM is a three dimensional meteorological and chemical model for air pollution studies that includes topography as well as land-use On the basis of this the model generates the meteorological parameters required for the dispersion modelling such as temperature layering (inversions) and three dimensional wind field all based on daily synoptic input data (large scale meteorological re-analyse data ndashcalled GASP (Global AnalysiS and Prediction) from Australian Government Bureau of Meteorology (wwwbomgovau) TAPM also includes chemistry such as NONO2 ozone SO2 and particle transformation Acetaldehyde and benzene are however not included in the chemical scheme of TAPM and these species are therefore simulated as reactive tracers in this study (see below)
In order to perform the calculations with TAPM a number of input data are required Emission data for the Vaumlstra Goumltaland region as described above Meteorological data Levels of the relevant pollutants on the model domain boundaries for the two scenarios
obtained from the EMEP model A model describing the decay of benzene and acetaldehyde emitted from traffic
A comparison of emissions from ethanol and petrol fuelled cars IVL report B1962 Health risk assessment for Vaumlstra Goumltaland
8
Since acetaldehyde and benzene are not included in the chemical scheme of TAPM their chemical lifetimes are set to be their rate constant with respect to the reaction with OH radicals multiplied by the OH mean concentrations obtained from the EMEP simulations (see below) Four different rates for the four seasons are used according to Table 1
Table 1 Rate constant for reaction with OH and chemical lifetimes for acetaldehyde and benzene used in the TAPM simulations
k(OH) Chemical lifetime (days)
mol-1 cm3s-1
Mar Apr May Jun Jul Aug Sep Oct Nov Dec Jan Feb
Acetaldehyde 15 10-11 12 04 13 155
Benzene 12 10-12 148 49 159 1937
252 EMEP modelling
Several EMEP models are developed and used for air quality policy work in Europe mainly for the Convention on Long-range Trans boundary Air Pollution The Unified EMEP model used in this study is designed to calculate concentrations in air and deposition patterns for major acidifying and eutrophying pollutants photo-oxidants and particulate matter In its standard version it has a 50 km x 50 km resolution in the horizontal direction and 20 layers distributed from the ground up to the pressure level of 100 hPa (ca 16 km) in the vertical direction A detailed description is given in Simpson et al (2003) The meteorological data used for the simulations obtained from wwwemepint are for the year 2005 and are of the same spatial resolution with a time resolution of three hours
As already mentioned the concentration fields generated by the EMEP model are used as an input to the TAPM model Boundary concentration fields for TAPM are calculated from hourly concentrations in the grid cells surrounding the Vaumlstra Goumltaland region that are weighted together with wind field vectors on corresponding boundaries of the Vaumlstra Goumltaland grid cells Since the chemistry of the organic compounds differs between the two models all organic compounds in EMEP are used and recalculated to the reactivity of organic compounds as used by TAPM
While the role of NOX NMVOC and primary PM can be investigated directly by simulations of emission in scenarios S1 and S2 effects of E85 fuelled cars on concentrations of acetaldehyde benzene and secondary PM are obtained from additional sensitivity runs The contribution of the emissions from the use of E85 fuel on acetaldehyde concentrations can be modelled directly in the EMEP model which includes also the formation and consumption of acetaldehyde in atmospheric reactions However TAPM does not include these processes and therefore the role of acetaldehyde formation is investigated further Two additional EMEP simulations are run one excluding primary acetaldehyde emissions and one excluding all NMVOC emissions from petrol and E85 fuelled vehicles By relating the results of these runs to the results of S1 and S2 the contribution of primary and secondary acetaldehydes respectively can be deduced The results from this analysis can be found in Appendix A23 The conclusion is that on the scale of the Vaumlstra Goumltaland region the formation of acetaldehydes in the atmosphere is not important and therefore the acetaldehyde concentration in TAPM can be described using the lifetimes given in Table 1 Further also the impact of the NMHC emissions on the ozone levels is studied (Appendix 23) and found to be small
Benzene is not included explicitly in the EMEP model The benzene concentrations are therefore studied in sensitivity runs with benzene from road traffic added to the S1 and S2 scenarios as
A comparison of emissions from ethanol and petrol fuelled cars IVL report B1962 Health risk assessment for Vaumlstra Goumltaland
9
methanol which has similar atmospheric lifetime as benzene The benzene concentration is then obtained by comparing the methanol concentration from the different runs
The contribution of primary and secondary PM respectively is investigated by excluding the primary PM from petrol and E85 fuelled vehicles in separate runs of the EMEP model The PM boundary values for the TAPM modelling are not separated into secondary and primary PM The results from this analysis are used to draw general conclusions about the difference in secondary PM formation between the two scenarios
26 Exposure
The human exposure of the annual mean concentrations of NOX NO2 O3 acetaldehyde and benzene are calculated based on the dispersion calculations of the Vaumlstra Goumltaland area in combination with the population density The population density distribution for the region is obtained from EEA (EEA 2009) and shown in Figure 3 The total population in the investigated area is 1 078 400
Figure 3 Population density distribution (number of people in a 1 km x 1 km grid for 2006) for the investigated area (according to Figure 1)
A comparison of emissions from ethanol and petrol fuelled cars IVL report B1962 Health risk assessment for Vaumlstra Goumltaland
10
27 Health effects and risk assumptions
271 NOX and NO2
Using modelled levels of NOX in the residential area as a vehicle exhaust marker a Norwegian study of 16 000 men from Oslo of whom 25 died during the follow up found a strong association (Nafstad et al 2004) This cohort with people of between 40-49 years of age at the start of the study was followed from 197273 through 1998 NOX was estimated in a model with 1000 m grids and a street contribution added for the largest streets When the median concentration of NOX for 1974-78 was used (mean 107 μgm3) the relative risk for total non-violent mortality was 8 per 10 μgm3 Nitrogen oxides do not have to be important as causal components behind this association
272 Ozone
Short-term effects of ozone on the respiratory system and on daily number of deaths have been reported from a large number of studies especially for summer concentrations why a threshold has sometimes been assumed in impact assessments Only recently has an effect of long-term exposure on mortality been reported from the very large American Cancer Society (ACS) Cohort Study (Jerret et al 2009)
Jacobson (2007) reported that E85 would cause an increase in mortality but assumed an effect of short-term exposure only The estimated impact was explained by the calculated ozone formation
273 Acetaldehyde
An increased incidence of nasal tumours in rats and laryngeal tumours in hamsters were observed after inhalation of high concentrations of acetaldehyde (HEI 2007) A few epidemiological studies of occupational exposure found associations but with a complex mixture of chemicals and have not been used in the cancer risk assessment for acetaldehyde Acetaldehyde is classified by the National Institute of Occupational Safety and Health as ldquoa potential human carcinogenrdquo by the US EPA (1999) as ldquoa probable human carcinogenrdquo and by the IARC as ldquopossibly carcinogenic to humansrdquo (OEHHA 1999 HEI 2007)
274 Benzene
There is clear and widely accepted evidence from a variety of epidemiologic studies of occupational exposure that benzene increase the risks of acute myeloid leukaemia (HEI 2007) but there is more uncertainty about other lymph hematopoietic cancers Studies on traffic exposure and childhood leukaemia have produced mixed results with regard to associations
275 Formaldehyde
IARCrsquos Monograph 88 says that the evidence is sufficient to conclude that formaldehyde causes cancer in humans (IARC 2006) This was because of evidence of nasopharyngeal cancer at concentrations historically encountered in industrial settings However this conclusion by IARC was largely based on the results from one occupational exposure site and the results and conclusions have not been supportive in other reviews and more recent studies (Bosetti et al 2006 Beane Freeman et al 2009 Bachand et al 2010) OEHHA (1999) uses a lifetime risk for cancer of 0000006 per microgm3 for formaldehyde and US EPA (1999) a lifetime risk of 0000013 per microgm3
A comparison of emissions from ethanol and petrol fuelled cars IVL report B1962 Health risk assessment for Vaumlstra Goumltaland
11
For non-cancer effects the eye is the organ most sensitive to formaldehyde subjective irritation has been reported at 300-500 microgm3 which is above the odour thresholds (Wolkoff amp Nielsen 2010) Effects in the eyes and in airways occur around 600ndash1000 μgm3 Effects on lung function have not been found in controlled human exposure studies below 1 mgm3 In epidemiological studies of associations between formaldehyde and exacerbation of asthma several co-pollutants make the findings difficult to interpret An indoor air quality guideline of 100 μgm3 has been considered protective against both acute and chronic sensory irritation in the airways in the general population assuming a lognormal distribution of nasal sensory irritation (Wolkoff amp Nielsen 2010)
276 PM
In the studies of long-term exposure to PM25 and mortality like the American Cancer Society (ACS) Cohort the exposure contrast were mainly related to secondary PM why the reported relative risk approx 6 increase in all-cause mortality (in adults) per 10 μgm3 is most relevant for background secondary PM concentrations (Pope et al 1995)
277 Health Impact Assessment
To summarize the types of pollutants that are found possible to include in the health impact assessment are NOX and NO2 benzene acetaldehyde formaldehyde secondary PM and ozone The assessment is restricted to the most important and well established effects of these pollutants This means that not all types of potential health impacts are included Results should however do for a comparison of the scenarios
The impact on formaldehyde levels are not calculated why it is not included in the current assessment Relative risks from epidemiological studies of vehicle exhaust using NOX and NO2 as exposure variables may be influenced from effects of their co-pollutants mainly ultrafine particles (elemental carbon soot) CO and HCs such as formaldehyde Exhaust particles are often introduced in a relatively high background of particles from other sources Thus exhaust particles were not measured directly in the important studies of long-term exposure and effects on mortality
3 Results
31 Emission factors
The emission factors are selected from available published data both for the exhaust and the evaporative emissions In both cases values relative to petrol are used The majority of the studies have been done with both E85 and petrol making this comparison more robust
Westerholm et al (2008) tested two flexi-fuel cars with E5 E70 and E85 in the European driving cycle NEDC and in the Artemis driving cycles The former is used at two temperatures (22degC and -7degC) They report the regulated emissions greenhouse gases a number of organic compounds and particle number Graham et al (2008) present measurement results for regulated emissions greenhouse gases and a number of organic compounds from four cars with E85 and regular petrol in the FTP cycle They also made a compilation of literature data for ethanol cars Yanowitz and McCormick (2009) present an analysis of US certification testing data in order to compare emissions for E85 and petrol
A comparison of emissions from ethanol and petrol fuelled cars IVL report B1962 Health risk assessment for Vaumlstra Goumltaland
12
The results from the three studies (for flexi fuel cars) and in addition the values used by Jacobson (2007) are given in Table 2
Table 2 Emissions factors for E85 fuelled cars relative to the emission factors for petrol fuelled cars
Relative change E85 vs petrol ()
Yanowitz and McCormick (2009) (95 conf)
Graham et al (2008) (sd )
Westerlund et al (2008) (average for NEDC)
Jacobson (2007)
NOX -14 (-23 - -5) -42 (15) -38 -30 NMOG 26 (17 - 37) 12 (39) NMHC -43 (-52 - -32) -45 (24) THC -14 (-24 - -4) 2 TOG 22 CO -19 (-25 - -12) -5 (51) 1 5 PM 25 0 Formaldehyde 59 (32 - 91) 80 (44) 184 60 Acetaldehyde 2855 (1189) 1031 2000 13 Butadiene -64 (31) -74 -10 Benzene -72 (15) -71 -79 Ethanol 3950 from TOG Methane 50 43
Table 2 shows lower emissions of NOX for E85 fuelled cars relative to petrol fuelled cars from test cycles generally including cold starts The emissions of hydrocarbons are higher for petrol while the emissions of organic gases are somewhat higher for E85 The emissions of aldehydes especially acetaldehyde are much higher for E85 as are the emissions of ethanol and methane The emissions of benzene and 13-butadiene are higher with petrol It should be noted that the data in Table 2 are in general for tests performed at ambient temperatures of around 20 degC Westerlund et al (2008) report that for ambient temperatures of -7 degC the emissions of CO and NMHC may be significantly higher with E85 compared with petrol For one vehicle they also report very high NOX emissions with petrol at this lower temperature
As seen in Table 2 there are a number of different quantities when it comes to the emission of organic compounds or unburnt fuel From a chemistry point of view HC is no molecule but a notation for the sum of all compounds that are hydrocarbons thus are of the form HxCy and not containing any elements but carbon and hydrogen Total organic gases (TOG) include organic compounds containing oxygen such as alcohols and aldehydes (but not CO or CO2) Volatile organic compounds (VOC) means carbon containing organic compounds present in the gaseous state at ambient temperature Non-methane hydrocarbons (NMHC) means HC minus the methane mass NMTOG and NMVOC are defined in the corresponding way1
1 When it comes to exhaust gas regulations the definitions differ somewhat In the US THC is defined as the signal obtained from a FID (Flame Ionisation Detector) instrument calibrated on propane This means that alcohols and aldehydes contribute to THC but to a lower extent since their responses in a FID instrument are lower than for hydrocarbons TOG is defined in the US regulations as THC + the mass of alcohols (eg methanol) and carbonyls (eg formaldehyde) measured separately NMHC is equal to THC ndash rCH4CH4 ndashralcAlc where the CH4-concentration is measured by gas chromatography and a FID calibrated with methane Alc is the alcohol concentration and rCH4curren and rAlc are the respective FIDresponse functions NMOG means TOG - CH4 and VOC is TOG - CH4 - C2H6 In the regulations it is stated that also a number of other non-ozone forming organic compounds eg acetone should be subtracted but these are present in very low concentrations in engine exhaust Note that there is actually a double counting of aldehydes in NMOG since they contribute to a certain extent to the NMHC value and then are added using values from separate measurements
A comparison of emissions from ethanol and petrol fuelled cars IVL report B1962 Health risk assessment for Vaumlstra Goumltaland
13
There will be emission limits for both THC and NMHC in also the future For petrol cars with low methane emissions the challenge will be to meet the limit for NMHC For E85 cars with higher methane emissions the challenge will be to meet the THC limit Thus it is reasonable that the emissions of NMHC from E85 cars will be lower than for petrol cars
In the modelling presented here the emission factors from Graham et al (2008) are used with some exceptions as will be discussed The reason is that that study comprises a compilation of a relatively large number of tests For CO the emission factor is set to the same value for E85 and petrol since the differences are small and within the uncertainty For particle emissions the studies cited in Table 2 give little information Instead data from Ericsson et al (2008) are used indicating that the primary PM emission using E85 is about 65 of that when using petrol For NOX the emission for E85 is set to 58 of that for petrol
The emission factors for NMHC (physical emission in gkm) including ethanol are in this study set to the same value for E85 as for petrol This is in line with the data for NMOG reported by Graham showing only small differences It is also reasonable considering that the car producers optimize emissions to meet the future emission legislation in Europe for NMHC and THC i e the Euro 6 standards that apply from September 2014 For petrol with low CH4 emissions the NMHC value will be limiting and this is on 68 mgkm For E85 with higher CH4 emissions the THC value of 100 mgkm will be limiting When considering the FID response as a measure of emission instead of physical emission about 50 of the THC comes from NMHC for E85 cars However the FID response is low for ethanol which means that the physical NMHC emission is about 25 higher Considering these factors the emissions of NMHC (physical) for E85 can be expected to be around 50 mgkm 125 = 625 mgkm which is about the same as for petrol The methane emission for E85 is set to 142 times the value for petrol following Lipman and Delucchi (2002) Further also the differences in the evaporate emissions are considered as is described in Appendix 1
The emissions factors for petrol cars are taken from the Artemis model (Andreacute 2005) The distribution of NMHC for petrol cars is from Passant (2002) The resulting emission factors used to obtain the emissions scenarios are presented in Table 3
In Europe THC is defined as the signal from a propane calibrated FID and thus contains oxygen containing compounds although the response factors for the latter are lower The FID instrument gives the number of molecules and in order to calculate the mass the EU regulations use the densities obtained from assuming the molecular formulas C1H274O0385 (209 gmole) for E85 and C1H189O0016 (1415 gmole) for petrol This thus compensates for the lower response factor for ethanol and acetaldehyde NMHC is obtained by subtracting the concentration of CH4 (times the FID response factor) measured separately
A comparison of emissions from ethanol and petrol fuelled cars IVL report B1962 Health risk assessment for Vaumlstra Goumltaland
14
Table 3 Emission factors (gkm) for 2020 for passenger cars (including evaporative emissions but excluding wear particle emissions) used in the modelling
Petrol E85 NOX 0112 0065 CO 179 174 PM 00013 00008 CH4 0013 0018 NMHC 033 028
division of NMHC Ethanol 00000 01898 Acetaldehyde 00025 00299 Ethene 00244 00237 Ethyne 00094 00011 Formaldehyde 00057 00072 Benzene 00187 00045 13 Butadiene 00030 00009 Ethane 00107 00009 Alkanes C3+ 00928 00076 Alkenes C3+ 00301 00025 Aromatics C7+ 01297 00106 Aldehydesketones C3+ 00051 00004
sum NMHC 03321 02792
32 Emissions
The emissions from road traffic vary between the two scenarios due to the differences in the emission factors From the EMEP modelling the total emissions from road traffic in the different scenarios are calculated for the countries included In Figure 4 emissions of NOX NMVOC and PM in the S2 (E-85) scenario relative to the S1 (all-petrol) scenario are shown for these countries The relative change is larger for countries with a high fraction of petrol cars relative to diesel cars (since the latter are the same in the two scenarios) such as Russia and Ukraine The relative change is smallest for PM emissions due to the very small contribution of the exhaust particles from petrol fuelled cars compared to the contribution from diesel vehicles and wear particles
A comparison of emissions from ethanol and petrol fuelled cars IVL report B1962 Health risk assessment for Vaumlstra Goumltaland
15
Figure 4 National emissions of NOX NMVOC and PM from the road traffic sector in E85 scenario (S2)
relative to lsquoall-petrolrsquo scenario (S1)
An important difference in the emissions between the scenarios lies in the speciation of the NMVOC emissions Figure 5 shows this speciation of NMVOCs for all road traffic emission categories used in this study The two rightmost bars in Figure 5 show the NMVOC speciation for Swedish road traffic emissions for the two scenarios S1 and S2 Comparison with Figure4 shows that the relative changes between the two scenarios are much larger for some individual NMVOC species that for the total NMVOC emissions Since the NMVOC emissions from traffic in Sweden are dominated by the emissions from petrol cars (about 85 of the road traffic emissions of NMVOC comes from petrol cars) the variations in NMVOC speciation between petrol and E85
0
02
04
06
08
1
NOx
0
02
04
06
08
1
NMVOC
0
02
04
06
08
1
Aus
tria
Bel
arus
Bel
gium
Bos
-Her
cB
ulga
riaC
roat
iaC
ypru
sC
zech
Rep
Den
mar
kE
ston
iaFi
nlan
dFr
ance
Ger
man
yG
reec
eH
unga
ryIr
elan
dIt
aly
Lat
via
Lith
uani
aL
uxem
bour
gM
alta
Net
herla
nds
Nor
way
Pola
ndPo
rtug
alR
oman
iaR
ussi
a_E
uro
Slov
ak R
epSl
oven
iaSp
ain
Swed
enSw
itzer
land
Tur
key
Ukr
aine
UK
PM
A comparison of emissions from ethanol and petrol fuelled cars IVL report B1962 Health risk assessment for Vaumlstra Goumltaland
16
will have a significant impact on the total road traffic NMVOC speciation As can be seen in Figure 5 scenario S1 is dominated by alkanes and aromatics while scenario S2 is dominated by ethanol It can also be noted that S1 contains a significant emission of benzene which is much lower in S2 while the opposite is true for acetaldehyde
Figure 5 Distribution of hydrocarbon species in NMVOC emissions from individual road traffic emission
categories as defined in emission scenarios in this study and from the whole road traffic emission sector in Sweden for scenarios S1 (All petrol) and S2 (All E85)
Figure 6 shows a map of the EMEP domain with emissions of acetaldehyde for the two studied scenarios as an example of the geographical distribution of emissions
Figure 6 Gridded emissions of acetaldehyde for the year 2020 (in tonnes per grid cell (50 km x 50 km)
and year) a ndash lsquoAll petrol scenario b ndash lsquoAll E85 scenariorsquo
As mentioned the emissions from road traffic in the Vaumlstra Goumltaland region are calculated in a 500 m x 500 m grid Figure 7 shows the emissions of NOX for 2005 as obtained from the database and the projected emissions for 2020 with a mixed use of E85 and petrol This can be considered as the base case for the emissions in 2020 It can be seen that the emissions decrease over the period which is due to reduction in NOX emissions factors as older vehicles are replaced by newer models (the traffic actually increases from a total of 754x109 vehicle-kilometres in 2005 to 937x109
0
20
40
60
80
100
Pet
rol e
xh
Pet
rol e
vap
E-8
5 ex
h
E-8
5 ev
ap
Pet
rol M
C
Die
sel L
DV
Die
sel H
DV
Roa
d Sw
eden
S1
Roa
d Sw
eden
S2
m
ass
Ethane
Alkanes C3+
Ethene
13 Butadiene
Alkenes C3+
Ethyne
Benzene
Aromatics C7+
Formaldehyde
Acetaldehyde
Aldket C3+
Ethanol
A comparison of emissions from ethanol and petrol fuelled cars IVL report B1962 Health risk assessment for Vaumlstra Goumltaland
17
vehicle-kilometres in 2020) The major roads in the region are clearly visible as well as the larger cities (especially Gothenburg)
Figure 7 Emissions of NOX (kgyear for a 500 m x 500 m grid cell) in the Vaumlstra Goumltaland region for 2005
and for 2020 for the base case
In Table 4 the traffic emissions for NOX benzene acetaldehyde ethanol and PM10 for the Vaumlstra Goumltaland region are shown for the four different emissions scenarios The emissions of NOX and benzene are reduced between 2005 and 2020 for the base case while the emissions of ethanol and acetaldehyde increase due to an expected increase in the use of ethanol fuel The NOX emissions for S1 are somewhat higher than for S2 due to the higher NOX emissions factor for petrol compared with E85
Table 4 Emissions from traffic for the Vaumlstra Goumltaland region in four different emission scenarios (in tonnesyear)
Substance base 2005 base 2020 S1 S2 NOX 13 243 4 843 4 954 4 631 Benzene 2 833 927 1 201 386 Acetaldehyde 628 1 074 305 2 595 Ethanol 192 5 192 0 15 400 PM10 1 324 486 483 476
33 Dispersion modelling
Resulting concentrations from calculations of the S1 and S2 scenarios with the EMEP model are used to provide input of primary and secondary air pollutants for the calculations with the TAPM model for the Vaumlstra Goumltaland region Concentrations of NOX NMVOC PM25 PM10 acetaldehyde ethanol and benzene are therefore calculated as boundary conditions for the Vaumlstra Goumltaland region In addition sensitivity studies are performed to investigate the role of formation of secondary acetaldehyde and secondary particulate matter (see Appendix 2) Time series analysis of the TAPM and EMEP model results of the S1 and S2 scenarios are presented in Figure 8
A comparison of emissions from ethanol and petrol fuelled cars IVL report B1962 Health risk assessment for Vaumlstra Goumltaland
18
a)
b)
Figure 8 Time series analyses of S1 and S2 scenarios for the EMEP and TAPM modelled concentrations of NOX and ozone at an urban background site in Gothenburg (TAPM) and in EMEP model grid cells including Gothenburg city (50 km x 50 km)
Concentrations of NOX and ozone at an urban background site in Gothenburg (TAPM) and in the 50 km x 50 km EMEP grid cells including Gothenburg are compared for one summer and one winter month Due to the well-known process of ozone titration by freshly emitted nitrogen monoxide (Seinfeld and Pandis 1998) the concentration of ozone often decreases in urban areas This phenomenon is expected to be captured by the fine-gridded TAPM model but not necessarily by the courser scale of the EMEP model Figure 8 shows the generally higher NOX levels in the small grid cell of the TAPM model in urban background location comparing to those in the large EMEP grid cell while the opposite is observed for the ozone concentrations (Remember that the boundary concentrations for TAPM are obtained from the EMEP model and they are thus the same in both cases) This indeed shows that local scale emissions and processes contribute to locally increased levels of NOX in urban areas both for the summer and the winter cases For ozone where there of course are no primary emissions the situation is the opposite where instead the result is decreased concentration levels at urban sites on a local scale The influence of the
A comparison of emissions from ethanol and petrol fuelled cars IVL report B1962 Health risk assessment for Vaumlstra Goumltaland
19
NMHC emissions from the passenger cars is studied in a sensitivity analysis (see Appendix 23) and it is found to have only a small influence on the ozone levels
To illustrate the results of the different scenario calculations the geographically distributed concentrations are presented as the difference in yearly average concentrations between the all E85 (S2) and all petrol (S1) scenarios both as microgm3 and sometimes as percentage of the difference to scenario S1 (see Appendix 3)
The difference in yearly average concentrations between scenario S1 and S2 for acetaldehyde and benzene can be seen in Figures 9 and 10 respectively The increase in acetaldehyde concentration resulting from a switch from petrol to E85 is up to about 05 gm3 or 80 in the central parts of the largest urban area of the region Gothenburg Outside this area the relative increase is about 10 for the other urban areas and less than that for the rural areas This large relative increase (see map in Appendix 4) is a result of the relatively high emissions of acetaldehyde from E85 fuelled cars For benzene the situation is opposite In the scenarios for 2020 the concentration of benzene decreases by up to a few tenths of gm3 as a result of a switch from petrol to E85 For benzene the relative change is not calculated
Figure 9 The difference in yearly average concentrations of acetaldehyde for 2020 between the all E85 (S2) and all petrol (S1) scenarios (microgm3)
A comparison of emissions from ethanol and petrol fuelled cars IVL report B1962 Health risk assessment for Vaumlstra Goumltaland
20
Figure 10 The difference in yearly average concentrations (gm3) of benzene for 2020 between the all E85 (S2) and all petrol (S1) scenarios
The difference in the calculated NOX NO2 and ozone concentrations between the two scenarios are shown in Appendix 4 The change in NOX concentration between the two scenarios only represents a small fraction of the total NOX concentration This is because the emissions of NOX from petrol cars are relatively low compared with the contribution from diesel engines and other sources Thus the resulting decrease in the NOX concentration with E85 is only up to 3 For ozone there is a small increase of about 01 microgm3 of E85 in the central areas of Gothenburg where there is relatively high traffic intensity (see Appendix 4 Figure A9) In the rest of the region there is a small decrease in the ozone concentration in the E85 scenario
34 Exposure
The resulting concentrations from the dispersion modelling together with the population density distribution are used to assess the exposure to acetaldehyde benzene NO2 NOX and ozone for the two scenarios S1 and S2 The exposure to PM25 is very similar for the two scenarios (the difference in concentration between scenarios S2 and S1 is only about -002 gm3 Table 5 shows the population weighted mean exposure both as total concentrations and as the difference between the two scenarios Detailed exposure results can be found in Appendix 5 It can be seen that the exposure to all the pollutants in Table 5 with the exception of acetaldehyde are somewhat lower for the all E85 scenario (S2) than for the all petrol scenario (S1) However the effect on health also
A comparison of emissions from ethanol and petrol fuelled cars IVL report B1962 Health risk assessment for Vaumlstra Goumltaland
21
depends on the level of the dose-response functions For example if the level of concentration is low in a populated area but the dose-response function is high the effect of even a low concentration increase can become important The increase in exposure from S1 to S2 (S2-S1) calculated as percentage of the population exposed to increased mean concentrations of pollutants is presented in Figure 11
Table 5 Populated weighted mean exposure (gm3)
S1 S2 S2-S1 Acetaldehyde 065 077 014 Benzene 01 005 -007 NOX 85 84 -012 Ozone 570 569 -012 PM25 270 268 -002
Increased concentrations Decreased concentrations Both increased and
decreased conc
Figure 11 The relative exposure (S2-S1) calculated as percentage of the population
In Figure 11 it is clear that the only pollutant that does not show an improvement regarding air quality and thus the health risks when modelling a switch from petrol to E85 is acetaldehyde For all pollutants except for ozone the changes of concentration levels observed between the scenarios are within the urban areas but for ozone there are also differences in rural areas
According to the data in Figure 11 about 14 of the population in the Vaumlstra Goumltaland region will be exposed to 03-08 microgm3 higher concentration levels of acetaldehyde in scenario S2 relative to S1 From Figure 9 it can be seen that the majority of these people live within the Gothenburg area Further about 28 of the population will be exposed to increased levels of between 01 to 03 microgm3 mainly in the suburban areas and rural surroundings of Gothenburg but also in some of the smaller cities in the region Outside the urban areas the concentration difference is lower than 01 microgm3
In the S2 scenario relative to the S1 scenario the population is exposed to decreased concentration levels of benzene and NOX This is mainly true also for O3 but with an exception for the central
A comparison of emissions from ethanol and petrol fuelled cars IVL report B1962 Health risk assessment for Vaumlstra Goumltaland
22
parts of Gothenburg where the concentration actually increases (see Appendix 4 Figure 7A) resulting in that 3 (blue area in Figure 11 for O3) of the population will be exposed to higher concentrations of O3 For the rest of the area there are decreased concentrations of ozone upon a switch to E85
The largest differences are again in the central parts of Gothenburg where about 20 of the population is being exposed to a lower benzene concentration of 01-03 microgm3 This also means that concerning benzene the majority (78) of the population have none or very low influence from a change to ethanol fuel
The largest effect on exposure difference is seen for NOX where just over 20 of the population has its exposure decreased with 03-05 microgm3 (in the central parts of Gothenburg) In the suburbs the decrease is between 01-02 microgm3 lower Along the largest roads there is a small but visible improvement on a yearly basis of 01 microgm3
For PM25 there is a difference in the populated weighted mean exposure of 002 gm3 between the scenarios with a lower value for the all-E85 case (see also Appendix 5)
35 Impact on health in Vaumlstra Goumltaland
351 NO2 and NOX
The impact of long-term exposure on mortality was estimated using the relative risk from the Norwegian cohort study (Nafstad et al 2004) reporting a relative risk of 08 increase per microgm3 increase in NOX however without adjustment for particle concentrations Assuming this effect on the total mortality and a typical baseline mortality of 1000 deaths per 100 000 person years a decrease in the population mean exposure of 012 microgm3 would correspond to approximately 104 less preterm deaths per year However for the present case this number is highly uncertain since the exposure to substances normally associated with changes in NOX exposure may here change in different ways since the relation between different exhaust components varies between the scenarios
The impact of long-term exposure on asthma incidence (new cases) in adults has been estimated using results from the Swedish RHINE Study Cohorts (Modig et al 2009) with very similar results in the ECRHS Study corresponding to approx 4 increase per microgm3 increase in NO2 From the RHINE Study the incidence can be estimated to 03 per year (proportion of adults developing the disease) with children and elderly excluded this means around 1500 adult cases per year A reduction of 009 microgm3 corresponds to 54 avoided new cases of adult asthma per year However also NO2 in the asthma study may have been mainly an indicator of vehicle exhaust
352 Ozone
The impact of long-term exposure on respiratory mortality has been reported to be approx 02 per microgm3 increase in the summer concentration when studied in the large ACS Cohort (Jerret et al 2009) Assuming this effect on the total population and a typical baseline respiratory mortality of 100 deaths per 100 000 person years a decrease in the population mean exposure of 012 microgm3 corresponds to approximately 03 less preterm deaths per year
A comparison of emissions from ethanol and petrol fuelled cars IVL report B1962 Health risk assessment for Vaumlstra Goumltaland
23
353 Acetaldehyde
According to US EPA (1999) a lifetime risk for cancer of 0000002 per microgm3 is to be assumed for this potential human carcinogen An increase in the population mean exposure of 012 microgm3 corresponds to 026 cases more per year in the current population
354 Benzene
According to US EPA (1999) a lifetime risk for cancer (leukaemia) of 00000022-00000078 per microgm3 is to be assumed for this human carcinogen A decrease in the population mean exposure of 0074 microgm3 corresponds to approximately 03 cases less per year in the current population (assuming 0000004 per microgm3)
355 PM25
In CAFEacute and other impact assessments a relative risk of 6 increase in all-cause mortality per 10 microgm3 has usually been assumed Assuming this effect on the total mortality and a typical baseline mortality of 1000 deaths per 100 000 person years a decrease in the population mean exposure of 002 microgm3 corresponds to approximately 13 less preterm deaths per year
4 Discussion
In this study the health risks from a large introduction of E85 to replace petrol is analysed in scenario studies for 2020 for the Vaumlstra Goumltaland region It is found that the change in pollutant concentration exposure and health risks are small between the two scenarios It should be emphasized that the study only considers vehicle emissions and does not take into account effects from the fuel production
The emissions of NOX in the model are somewhat lower from E85 fuelled cars than from petrol fuelled cars This is in line with the emission factors used by Jacobson (2007) The nitrogen oxides are key substances in the atmospheric reactions determining the concentrations of ozone in air NOX is involved in the formation of ozone but close to the NO source the ozone concentration is lowered due to the rapid reactions between NO and O3 forming NO2 If NO is released in an environment with already high NO concentration it may result in lowering of ozone levels on the regional scale In the present study the ozone concentrations calculated are somewhat lower for the E85 scenario than for the petrol scenario
The health risk analysis shows that the main difference between the scenarios is due to the lower concentration of NOX However it may have been other exhaust components than NOX such as exhaust particles that were behind the reported association with mortality In cases when NOX is not a good indicator of exhaust particle emissions and their toxicity our results may be misleading This should be studied further Neglecting the effects of the changes in NOX exposure the total difference between the scenarios sums up to 16 preterm deaths per year with lower values for the E85 scenario while it would sum up to 12 less preterm deaths for the E85 scenario if the effect related to NOX were included Since there are no similar studier for the effect on mortality among those younger than 30-50 years of age we assume the same relative effect on mortality in all ages This makes only a small difference since the large majority of deaths occur in older groups
A comparison of emissions from ethanol and petrol fuelled cars IVL report B1962 Health risk assessment for Vaumlstra Goumltaland
24
The opposite result for the ozone concentration was obtained by Jacobson The reason for this discrepancy is that the Jacobson study concerns Los Angeles a region with high concentrations of pollutants while the study here concerns the Vaumlstra Goumltaland region with much less dense traffic and also lower concentrations of pollutants importantly NOX It is not unlikely that the effect that Jacobson report also would be found for large parts of Europe with higher traffic densities than in the Vaumlstra Goumltaland region
It is worth to emphasize that the major negative health effect in the Jacobson (2007) study is attributed to the increase in ozone concentration that is a result of the decrease of the NO emissions from E85 cars Directly after the emission NO reacts with ozone resulting in drop of the ozone concentration the so-called ozone titration commonly observed in many cities This NO does however form even higher quantities of ozone further downwind contributing to the general increase in the background ozone levels It is also precursor of NO2 secondary PM and other toxic species as eg PAN and hence reductions in NO emissions are never regarded as disbeneficial from the environmental viewpoint
There are of course several sources of uncertainties that influence the results of this study Since the main results concern differences between the two scenarios several of these factors loose on importance for the conclusions This comprises uncertainties in meteorology in future traffic volumes and in the population density distribution However there are some uncertainties that remain important The emission factors for E85 fuelled cars are much less characterised than what they are for petrol cars The emission of particles from E85 fuelled cars is especially uncertain with only very few published results Also the emissions of NMHC are somewhat uncertain and may be higher for E85 at lower ambient temperatures However the sensitivity analysis performed shows that for the studied region the NMHC emissions only have a small influence on the ozone concentrations
5 Conclusions
In this study the impact of tailpipe and evaporative emissions from E85 fuelled cars on air pollution and health risks are calculated and compared with petrol fuelled cars The scenario calculations for the Vaumlstra Goumltaland Region give data on emissions pollutant concentrations exposure and a health risk evaluation
The differences in emission factors between E85 and petrol lies in the emissions of PM and NOX which are about 65 and 58 for E85 relative petrol respectively Also the speciation of the emitted hydrocarbons is significantly different with large emissions of acetaldehyde and ethanol from E85 and large emissions of benzene higher aromatics alkanes and alkenes from petrol
These differences in emission factors reflect in differences in emissions The emission calculations for all Swedish road traffic show a decrease for the E85 scenario relative to the petrol scenario of 65 for NOX 34 for PM25 67 for benzene For acetaldehyde there is an increase of 770
The differences obtained from the TAPM modelling show decreased levels of NOX ozone and benzene with E85 and increased levels of acetaldehyde For the latter the increase may be up to 80 while NOX and ozone show decreases of up to a few per cent and a few tenths of per cent respectively
A comparison of emissions from ethanol and petrol fuelled cars IVL report B1962 Health risk assessment for Vaumlstra Goumltaland
25
The health risk assessment shows decreased health risks in the E85 scenario relative the all-petrol scenario due to the increased NOX exposure correlated with both preterm deaths and asthma However NOX may be mainly an exhaust indicator Smaller effects are expected from the changes in ozone acetaldehyde and benzene exposure The overall difference considering the exposure to PM acetaldehyde benzene and ozone is 16 preterm deaths with lower values for the E85 scenario
6 Acknowledgements
Saab Automobile The Swedish Transport Administration and The Foundation for the Swedish Environmental Research Institute are gratefully acknowledged for financial contribution
Magnus Ekstroumlm and Maria Holmstroumlm at Saab and Martin Juneholm at the Swedish Transport Administration are acknowledged for their most valuable input to the study
David Simpson Norwegian Meteorological Institute EMEP MSC-W Norway and Dept Radio amp Space Science Chalmers Univ Technol Sweden is gratefully acknowledged for help with implementation of the Unified EMEP model
A comparison of emissions from ethanol and petrol fuelled cars IVL report B1962 Health risk assessment for Vaumlstra Goumltaland
26
7 References
Altenstedt J Pleijel K 2000 An alternative approach to photochemical ozone creation potentials under European conditions J Air amp Waste Manage Assoc 50 1023 ndash 1036
Andre J-M (2005) Vehicle emission measurement collection of the ARTEMIS datatbase Artemis 3312 report Available from httpwwwinretsfrurltepublicationspublications-pdfJoumardA3312reportJMALTE0504pdf
Bachand A MMundt K A Mundt D JMontgomery R R Epidemiological studies of formaldehyde exposure and risk of leukemia and nasopharyngeal cancer A meta-analysis Critical Reviews in Toxicology 2010 40(2) 85ndash100
Beane Freeman L E Blair A Lubin J H Stewart P A Hayes R B Hoover R N Hauptmann M Mortality from lymphohematopoietic malignancies among workers in formaldehyde industries The National Cancer Institute Cohort J Natl Cancer Inst 2009101751ndash761
Bosetti C McLaughlin J K Tarone R E Pira E LaVecchia C Formaldehyde and cancer risk A quantitative review of cohort studies through 2006 Ann Oncol 20081929ndash43
ConcaweJRC Well-to-wheel studies httpiesjrceceuropaeuwtwhtml
Derwent R G Jenkin M E Saunders S M 1996 Photchemical ozone creation potentials for a large number of reactive hydrocarbons under European conditions Atmos Environ 30 181 ndash 199
Derwent RG Jenkin ME Passant NR Pilling MJ 2007 Photochemical ozone creation potentials (POCPs) for different emission sources of organic compounds under European conditions estimated with a Master Chemical Mechanism Atmos Env 41 2570ndash2579
EEA Copenhagen 2009 wwweeaeuropaeudata-and-mapsdatapopulation-density-disaggregated-with-corine-land-cover-2000-2
Ericsson P Holmstroumlm M Amberntsson-Carlsson A Ohlson C Skoglundh M Andersson B Carlsson P-A 2008 Characterization of particulate emissions and methodologhy for oxidation of particulates from non-diesel combustion ystems SAE Technical Paper Series 2008-01-1746
GAINS 2010 httpgainsiiasaacatindexphpgains-europe
Graham LA Belisle SL Baas C-L Emissions from light duty gasoline vehicles operating on low blend ethanol gasoline and E85 Atmospheric Environment 42 4498 (2008)
Haskew H M Thomas P E Liberty F 2006 Fuel Permeation From Automotive Systems E0 E6 E10 E20 And E85 Final Report CRC Project No E-65-3 Coordinating Research Council Inc 3650 Mansell RoadSuite 140Alpharetta GA 30022
HEI Air Toxics Review Panel (2007) Mobile-Source Air Toxics A Critical Review of the Literature on Exposure and Health Effects HEI Special Report 16 Health Effects Institute Boston USA
Hurley P TAPM v 4 User Manual 2008 CSIRO ISBN 978-1-921424-73-1
IARC (2006) IARC Monographs on the Evaluation of Carcinogenic Risks to Humans Wood Dusts and Formaldehyde Lyon World Health Organization International Agency for Research on Cancer Lyon France 8837ndash325
Jacobson M Z Effects of Ethanol (E85) versus Gasoline Vehicles on Cancer and Mortality in the United States Environ Sci Technol 2007414150-4157
A comparison of emissions from ethanol and petrol fuelled cars IVL report B1962 Health risk assessment for Vaumlstra Goumltaland
27
Jerret M Burnett R T Pope C A Ito K Thurston G Krewski D Shi Y Calle E Thun M Long-Term Ozone Exposure and Mortality N Engl J Med 20093601085-95
Lipman T E Delucchi M A 2002 Emissions of nitrous oxide and methane from conventional and alternative fuel motor vehicles Climate Change 53 477
Modig L Toreacuten K Janson C Jarvholm B Forsberg B Vehicle exhaust outside the home and onset of asthma among adults Eur Respir J 2009 Jun33(6)1261-7
Nafstad P Haheim L L Wisloff T Gram F Oftedal B Holme I Hjermann I Leren P Urban air pollution and mortality in a cohort of Norwegian men Environ Health Perspect 2004112(5)610-5
OEHHA (1999) Air Toxics Hot Spots Program Risk Assessment Guidelines Part II Technical Support Document for Describing Available Cancer Potency Factors Prepared by the Air Toxicology and Epidemiology Section Office of Environmental Health Hazard Assessment April 1999
Passant NR (2002) Speciation of UK emissions of non-methane volatile organic compounds AEAT report AEATENVR0545 Issue 1 Culham UK
Pope CA III Thun MJ Namboodiri MM Dockery DW Evans JS Speizer FE Heath CJ Particulate air pollution as a predictor of mortality in a prospective study of US adults Am J Resp Crit Care Med 1995 151 669-674
Seinfeld J H and Pandis SN (1998) Atmospheric Chemistry and Physics From Air Pollution to Climate Change John Wiley amp Sons New YorkSimpson D Fagerli H Jonson JE Tsyro S Wind P Tuovinen J -P 2003 Transboundary acidification and eutrophication and ground level ozone in Europe Unified EMEP Model Description EMEP Status Report 12003 Part I EMEPMSC-W Report The Norwegian Meteorological Institute Oslo Norway
US EPA (1999) httpwwwepagovttnatwnata1999nsata1999
Vestreng V et al 2004 Inventory Review 2004 Emission data reported to CLRTAP and the NEC Directive EMEPEEA Joint Review Report EMEPMSC-W Note 1
Westerholm R Ahlvik P Karlsson HL An exhaust characterisation study based on regulated and unregulated emissions from bi-fuel and flexi-fuel light-duty passanger cars fuelled by petrol (E5) bioethanol (E70 E75) and biogas tested at ambient temperatures of +22degC and -7degC 2008
Wolkoff P Nielsen G D Non-cancer effects of formaldehyde and relevance for setting an indoor air guideline Environment International 201036788ndash799
Yanowitz J McCormick RL Effect of E85 on tailpipe emissions from light-duty vehicles J Air amp Waste Manage Assoc 59 172 (2009)
A comparison of emissions from ethanol and petrol fuelled cars IVL report B1962 Health risk assessment for Vaumlstra Goumltaland
28
Appendix 1 Evaporate emissions of NMHC
The following assumptions are done for evaporative emissions The NMHC emissions from E85 are reduced relative to petrol by 45 Methane emissions are zero and the split of NMHC species is 68 ethanol and the remaining 32 is divided in the same way as evaporative emissions for petrol The estimates by Graham et al (2008) are missing evaporative emission data however these assumptions agrees very well with measurements of evaporative emissions due to fuel permeation reported by Haskew et al (2006) where NMHC emissions are reported to be reduced by 50 for E85 fuel compared to petrol Haskew et al also presents the NMHC split to species with 60 ethanol This number agrees quite well with our assumption of 68 NMHC being ethanol NMHC in exhaust and evaporative emissions are thus divided as in Table A1
Table A1 Division of NMHC in the exhaust and evaporative emissions for E85 and petrol respectively (wt)
E85 Petrol E85 Petrol exhaust exhaust evaporative evaporative
Ethanol 680 0 680 0 Acetaldehyde 131 08 02 0 Ethene 99 73 24 0 Ethyne 03 28 09 0 Formaldehyde 31 17 06 0 Benzene 16 56 18 10 13 Butadiene 03 09 03 0 sum 963 191 741 10
The remaining NMHC emissions are divided as for petrol (ref) and listed in Table A2
Table A2 Division of NMHC in the exhaust and evaporative emissions for E85 and petrol respectively (wt)
E85 Petrol E85 Petrol exhaust exhaust evaporative evaporative
Ethane 02 32 10 0 Alkanes (C3+) 13 278 89 880 Alkenes (C3+) 04 90 29 95 Aromatics (C7+) 18 388 125 15 Aldehydesketones (C3+)
01 15 05 0
A comparison of emissions from ethanol and petrol fuelled cars IVL report B1962 Health risk assessment for Vaumlstra Goumltaland
29
Appendix 2 Description of the model system
A21 Atmospheric lifetimes
Table A3 gives tropospheric lifetimes with regard to reaction of ethanol formaldehyde acetaldehyde and benzene (C6H6) with OH nitrate radical (NO3) and photolysis The studied organic species are listed together with three species common in the gasoline exhaust (benzene ethene and toluene) for comparison Table 11 shows also photochemical ozone creation potential (POCP) of these species POCP is a measure of amount of ozone that is formed from a certain VOC emission relatively to other emission source which has been established to the same emission mass of ethene (Derwent et al 1996 Altenstedt et al 2000) The range represents different scenarios for VOC and NOX background concentrations Derwent et al (2007) used similar methodology to calculate POCP of different VOC sources and calculated POCP of mean road emission exhaust to be 69
Table A3 Atmospheric lifetimes of studies NMVOC species with respect to the OH- and NO3- initiated
degradation τ(OH) and τ(NO3) and with respect to the photolysis (The lifetime of a chemical species which decays in a first-order process is the time needed for a concentration of this species to decrease to 1e of its original value Statistically it represents the mean life expectancy of an excited species) The OH concentration of 1times106 moleculescm3 typical for summer troposphere was used for the lifetime calculation The NO3 concentrations of 5 and 100 ppt(V) were used for lifetime calculations as representative of rural and urban night-time 12 hrs mean concentration The studied organic species are listed together with 3 species common in the gasoline exhaust for comparison The rates of photolysis were calculated with radiation transfer model for July 58ordm latitude and integrated over 24 hours
τ(OH) τ(NO3) urbanrural τ (photolysis) POCP
hr hr hr
Ethanol 85 56 1times103 - 44 - 63
Acetaldehyde 15 47 1times103 86 68 - 80
Formaldehyde 30 194 4times103 10 18 - 55
Benzene 214 - - 23 - 47
Ethene 34 - - 100
Toluene 50 - - 30 - 67
A22 Defining of boundary concentrations for TAPM from EMEP fields
Calculation of initial concentration field for TAPM from EMEP concentration field of NO2 (as example) and EMEP mean wind vector components u_mid and v_mid Two EMEP model gridcells (i=56 j=60 and i=56 j=61) represent the TAPM model domain and concentrations from the surrounding EMEP gridcells SE-S SE-N NW-S NW-N NE NW (Figure A1) are used for calculation of boundary concentration NO2(bc) according to the following code if u_mid lt= 0 then ( isite = SE-S and jsite = SE-N) else isite = NW-S and jsite = NW-N) endif
A comparison of emissions from ethanol and petrol fuelled cars IVL report B1962 Health risk assessment for Vaumlstra Goumltaland
30
if v_mid lt= 0 then ( ksite = NE) else ksite = SW endif NO2(bc) = [(NO2(isite)u_mid(isite) + NO2(jsite)u_mid(jsite))2 + NO2(ksite)v_mid(ksite)] [(u_mid(isite) + u_mid(jsite))2 + v_mid(ksite)]
Figure A1 Gridcells covering Gothenburg domain and its boundary in EMEP model plotted on latitude-
longitude coordinates The red square represents centre of Gothenburg and the blue line the coastline EMEP i and j coordinates for the boundary gridcells are SE-S = 57-60 SE-N = 57-61 NW-S = 55-60 NW-N = 55-61 NE = 56-62 NW = 56-59 and for Gothenburg grid cells are Gbg-NE = 56-61 Gbg-SW = 56-60
A23 Atmospheric chemistry
The role of secondary chemistry in for the concentration of acetaldehyde are studied by first excluding the primary acetaldehyde emissions from the EMEP model simulations of scenarios S1 and S2 and then by excluding all NMVOC emissions from the car category with spark ignition engines The contribution from the primary acetaldehyde emissions as well as the contribution of secondary acetaldehyde formed from other NMVOC to the total acetaldehyde concentration is then obtained However the secondary chemistry is highly nonlinear due to the interactions of NMVOCs with ozone and OH and thus the results for the contribution of secondary acetaldehyde are somewhat uncertain Differences in acetaldehyde concentrations between S1 and S2 scenarios are studied with respect to contribution of primary and secondary acetaldehyde It is observed that in summer background air the monthly mean contribution of the secondary acetaldehyde is of the same magnitude as the contribution of the primary acetaldehyde to the difference between S1 and
565
57
575
58
585
105 115 125 135 145
Long
Lat
Gbg-SW
Gbg-NE
SE-S
NW-N
NW-S
SE-N
SW
NE
55-59
57-59
55-62
A comparison of emissions from ethanol and petrol fuelled cars IVL report B1962 Health risk assessment for Vaumlstra Goumltaland
31
S2 In the winter and in more polluted atmosphere (Gothenburg grid cells) the contribution from secondary acetaldehyde to the concentration difference appears to be negative due to the chemistry feedback ie the E-85 scenario has less secondary acetaldehyde than the all-petrol scenario
A comparison of S2-S1 differences in primary and secondary acetaldehyde concentrations in the background (=upwind) and Gothenburg grid cells show no increase in the secondary acetaldehyde from upwind to the Gothenburg grid cell It can thus be concluded that there is no significant contribution from secondary aldehydes on the small scale (tenths of km) Conclusion from this sensitivity study is that the secondary formaldehyde can be of importance under summer in the clean background air but that formation on the local scale is unimportant Using EMEP simulated boundary concentrations of acetaldehyde in the local scale model and simulating the primary acetaldehyde emissions will capture the most important features of acetaldehyde dispersion and chemistry in Vaumlstra Goumltaland
In the EMEP model the tail-pipe PM emissions are specified as primary particles Emissions of NOX and VOCs (and NH3 SO2) are oxidised in the atmosphere and a part is then transferred through the gas-to-particle transport to the PM as secondary PM The petrol fuelled cars emit both more primary PM and more NOX compared to the E85 cars If we compare differences in primary and secondary PM between the S1 and S2 scenarios simulated by EMEP we can directly see what part of the difference is from the tail-pipe emissions of the primary particles and what part is from the formation of the secondary PM in atmosphere (mostly from higher emissions of NOX) Table A4 shows the differences between S1 and S2 (S1-S2) of monthly PM averages for January and June (two months with low and high photochemical activities respectively) It can be seen that the higher formation of secondary PM in the S1 (all-petrol) scenario is more important than the higher tail-pipe emission of primary PM by factor 10 - 20
When we compare simulated PM differences between S1-S2 for the background air (=upwind) grid cells and for grid cells including Gothenburg (50 km x 50 km scale) we can see significant increase in primary PM in the S1 scenario from the upwind grid cells to Gothenburg (746 in winter 132 in summer) while no systematic increase can be seen for the secondary PM (-42 in winter +24 in summer) From this comparison it can be concluded that no systematic increase in secondary PM can be seen (in difference from the primary PM) on the scale of 50-100 km and we can neglect this process on the small scale However the overall change in PM concentrations due to the switch of the fuel is very small both on the large scale and on the small scale as can be seen when the differences in PM concentrations between S1 and S2 are compared to absolute PM concentrations in S1 presented in the last column of Table A4
Table A4 Differences in primary and secondary PM concentrations between the lsquoAll-petrolrsquo (S1) and lsquoE-85rsquo (S2) scenarios simulated in gridcells upwind Gothenburg and in gridcells including Gothenburg (2 50 km x 50 km gridcells)
S1-S2 Background
S1-S2 Gothenburg
Increase S1-S2 Gothenburg
S1 Background
μgm3 μgm3 μgm3 bkgnd μgm3
Prim PM10 Jan 00008 00014 00006 746 084
Jun 00008 00018 00010 1319 084
Sec PM10 Jan 00155 00148 -00006
-42 157
Jun 00080 00081 00002 24 213
The sensitivity of the used emission factors for NMHC with respect to the ozone formation in the region of the Swedish West Coast can be analysed with the help of results from studying the
A comparison of emissions from ethanol and petrol fuelled cars IVL report B1962 Health risk assessment for Vaumlstra Goumltaland
32
formation of secondary acetaldehyde In this study first all primary acetaldehyde emitted by the E85 fleet are omitted in a model simulation (S2_nopAA) and secondly all NMHC emissions from the E-85 fleet are switched off (S2_noVOC) Acetaldehyde has a somewhat higher though still comparable photochemical ozone creation potential compared to ethanol (ethanol 44-63 acetaldehyde 68-80 Altenstedt and Pleijel 2000) and this simulation will thus also give information on the sensitivity of the calculations to uncertainties in the ethanol emissions Setting the emission factor for NMHC to zero gives the sensitivity to the emission factor of total NMHC Figure A2 shows the differences in ozone concentration as a result of acetaldehyde only and the total NMHC from the E85 car fleet (S2 scenario) We can see that the effect on ozone formation is very small for the Swedish West coast The reason is that the ozone formation in this area is controlled by the availability of NOX while NMHC or rather their degradation products the peroxy radicals that serve as a lsquofuelrsquo to ozone formation are usually in excess here and further VOC emissions do not increase ozone concentrations significantly The situation looks different in areas that are more heavily polluted with NOX andor which is limited in the availability of peroxy radicals The results from this sensitivity study are fully consistent with the observed increase in ozone concentrations as a result of lower NO emissions (the so-called ozone titration) only very close to the major roads but no larger-scale decrease in ozone concentrations in the Gothenburg area or in any other communities
Figure A2 Sensitivity of the ozone formation in the 2 EMEP model grid cells covering Gothenburg (blue) and in the 6 surrounding grid cells (red see Fig A1) to changes in NMHC emission factor of the E85 fuelled cars lsquobasersquo is simulation S2 with EF for NMHC as in Table 3 lsquonoVOCrsquo is S2 with EF for all NMHC = 0 lsquonopAArsquo is S2 with EF for acetaldehyde = 0 a ndash Mean sensitivity in January absolute difference in ozone formation in ppb(V) as a result of NMHC (base-noVOC) and acetaldehyde (base-nopAA) emissions b ndash Sensitivity relative to ozone concentration in the S2-base simulation January c ndash same as a) but June d ndash same as b) but June
‐002
‐001
0
001
base‐noVOC base‐nopAA
ΔO3(ppb)
a)
0
001
002
base‐noVOC base‐nopAA
ΔO
3(ppb)
c)
‐010
‐005
000
005
base‐noVOC base‐nopAA
ΔO
3
b)
000
002
004
006
base‐noVOC base‐nopAA
ΔO
3
d)
A comparison of emissions from ethanol and petrol fuelled cars IVL report B1962 Health risk assessment for Vaumlstra Goumltaland
33
Appendix 3 Emission results
The geographically distributed NOX and acetaldehyde emissions for the Vaumlstra Goumltaland region are presented in Figures A3 and A4 respectively
Figure A3 NOX emissions for the Vaumlstra Goumltaland region for the All Petrol scenario
A comparison of emissions from ethanol and petrol fuelled cars IVL report B1962 Health risk assessment for Vaumlstra Goumltaland
34
Figure A4 Acetaldehyde emissions for the Vaumlstra Goumltaland region for the All Ethanol scenario
A comparison of emissions from ethanol and petrol fuelled cars IVL report B1962 Health risk assessment for Vaumlstra Goumltaland
35
Appendix 4 Dispersion modelling results
The difference in yearly average concentration between scenario S1 and S2 for acetaldehyde and benzene can be seen in Figure A5 and Figure A6 respectively a)
b)
Figure A5 The difference in yearly average concentrations of acetaldehyde for 2020 between the all E85 (S2) and all petrol (S1) scenarios presented as a) microgm3 and as b) percentage for the Gothenburg area
A comparison of emissions from ethanol and petrol fuelled cars IVL report B1962 Health risk assessment for Vaumlstra Goumltaland
36
a)
b) all E85 c) all petrol
Figure A6 a) the difference in yearly average concentrations (gm3) of benzene for 2020 between the all E85 (S2) and all petrol (S1) scenarios yearly means for b) all E85 and c) all petrol (note the different scales)
The difference in the calculated NOX NO2 and ozone concentrations between the two scenarios are shown in Figures A7 A8 and A9
A comparison of emissions from ethanol and petrol fuelled cars IVL report B1962 Health risk assessment for Vaumlstra Goumltaland
37
a)
b)
Figure A7 The difference in yearly average concentrations of NOX for 2020 between the all E85 (S2) and all petrol (S1) scenarios presented as a) microgm3 and as b) percentage for the Gothenburg area
A comparison of emissions from ethanol and petrol fuelled cars IVL report B1962 Health risk assessment for Vaumlstra Goumltaland
38
a)
Figure A8 The difference in yearly average concentrations of NO2 for 2020 between the all E85 (S2) and all petrol (S1) scenarios presented as a) microgm3 and as b) percentage for the Gothenburg area
A comparison of emissions from ethanol and petrol fuelled cars IVL report B1962 Health risk assessment for Vaumlstra Goumltaland
39
a)
b)
Figure A9 The difference in yearly average concentrations of ozone for 2020 between the all E85 (S2) and all petrol (S1) scenarios presented as a) microgm3 and as b) percentage for mainly the Gothenburg area
A comparison of emissions from ethanol and petrol fuelled cars IVL report B1962 Health risk assessment for Vaumlstra Goumltaland
40
Appendix 5 Detailed Exposure data
Detailed exposure data for the difference between the all E85 (S2) and the all petrol (S1) scenarios can be found in Table A5
Table A5 Exposure data for the difference between the all E85 (S2) and the all petrol (S1) scenarios
Acetaldehyde diff E-P (microgm3)
Populated weighted mean
Number of people Percentage of population
0 - 01 627198 582 01 - 02 163394 152 02 - 03 134879 125 03 - 04 88099 82 04 - 05 38686 36 05 - 06 16880 16 06 - 07 7983 07 07 - 08 1248 01 Tot 014 1078367 Benzene diff E-P (microgm3)
Populated weighted mean
Number of people Percentage of population
-03 - -02 26680 25 -02 - -01 205757 191 -01 - -0 845930 784 Tot -0074 1078367 NO2 diff E-P (microgm3) Populated weighted
mean Number of people Percentage of
population -04 - -03 7698 07 -03 - -02 50131 46 -02 - -01 296288 275 -01 - -0 724250 672 Tot -009 1078367 NOX diff E-P (microgm3) Populated weighted
mean Number of people Percentage of
population -06 - -05 7698 -05 - -04 19639 18 -04 - -03 36626 34 -03 - -02 161685 150 -02 - -01 186500 173 -01 - -0 666219 618 Tot -012 1078367 O3 diff E-P (microgm3) Populated weighted
mean Number of people Percentage of
population -02 - -01 779132 723 -01 - -0 266417 247 0 - 01 32818 30 Tot -012 1078367
Exposure data for the total levels in the two scenarios can be found in Table A6
A comparison of emissions from ethanol and petrol fuelled cars IVL report B1962 Health risk assessment for Vaumlstra Goumltaland
41
Table A6 Exposure data for the total levels in the two scenarios
Acetaldehyde tot All ethanol (microgm3)
Populated weighted mean
Number of people Percentage of population
06 - 07 568825 527 07 - 08 171845 159 08 - 09 124551 115 09 - 10 100946 94 10 - 11 59235 55 11 - 12 30559 28 12 - 13 13175 12 13 - 14 7983 07 14 - 15 1248 01 Tot 077 1078367 Acetaldehyde tot All petrol (microgm3)
Populated weighted mean
Number of people Percentage of population
05 - 06 45111 42 06 - 07 1032008 957 07 - 08 1248 01 Tot 065 1078367 Benzene tot All ethanol (microgm3)
Populated weighted mean
Number of people Percentage of population
0 - 01 1055961 98 01 - 02 22406 2 Tot 005 1078367 Benzene tot All petrol (microgm3)
Populated weighted mean
Number of people Percentage of population
0 - 01 729093 676 01 - 02 232961 216 02 - 03 94042 87 03 - 04 21023 19 04 - 05 1248 01 Tot 010 1078367 NOX tot All ethanol (microgm3)
Populated weighted mean
Number of people Percentage of population
0-10 779108 722 10-20 254658 236 20-30 28683 27 30-40 11070 10 40-50 3426 03 50-60 0 00 60-70 0 00 70-80 639 01 80-90 0 00 90-100 0 00 100-110 783 01 Tot 84 1078367 NOX tot All petrol (microgm3)
Populated weighted mean
Number of people Percentage of population
0-10 769557 714 10-20 264209 245 20-30 28683 27 30-40 11070 10 40-50 3426 03 50-60 0 00
A comparison of emissions from ethanol and petrol fuelled cars IVL report B1962 Health risk assessment for Vaumlstra Goumltaland
42
60-70 0 00 70-80 639 01 80-90 0 00 90-100 0 00 100-110 783 01 Tot 85 1078367 O3 tot All ethanol (microgm3)
Populated weighted mean
Number of people Percentage of population
40-45 1422 01 45-50 26487 25 50-55 176636 164 55-60 770370 714 60-65 103452 96 Tot 569 1078367 O3 tot All petrol (microgm3)
Populated weighted mean
Number of people Percentage of population
40-45 1422 01 45-50 20229 19 50-55 181876 169 55-60 763361 708 60-65 111479 103 Tot 570 1078367 PM25 tot All ethanol (microgm3)
Populated weighted mean
Number of people Percentage of population
1-2 0 00 2-3 885325 821 3-4 192259 178 4-5 783 01 Tot 268 1078367 PM25 tot All petrol (microgm3)
Populated weighted mean
Number of people Percentage of population
1-2 0 00 2-3 868773 806 3-4 208811 194 4-5 783 01 Tot 270 1078367
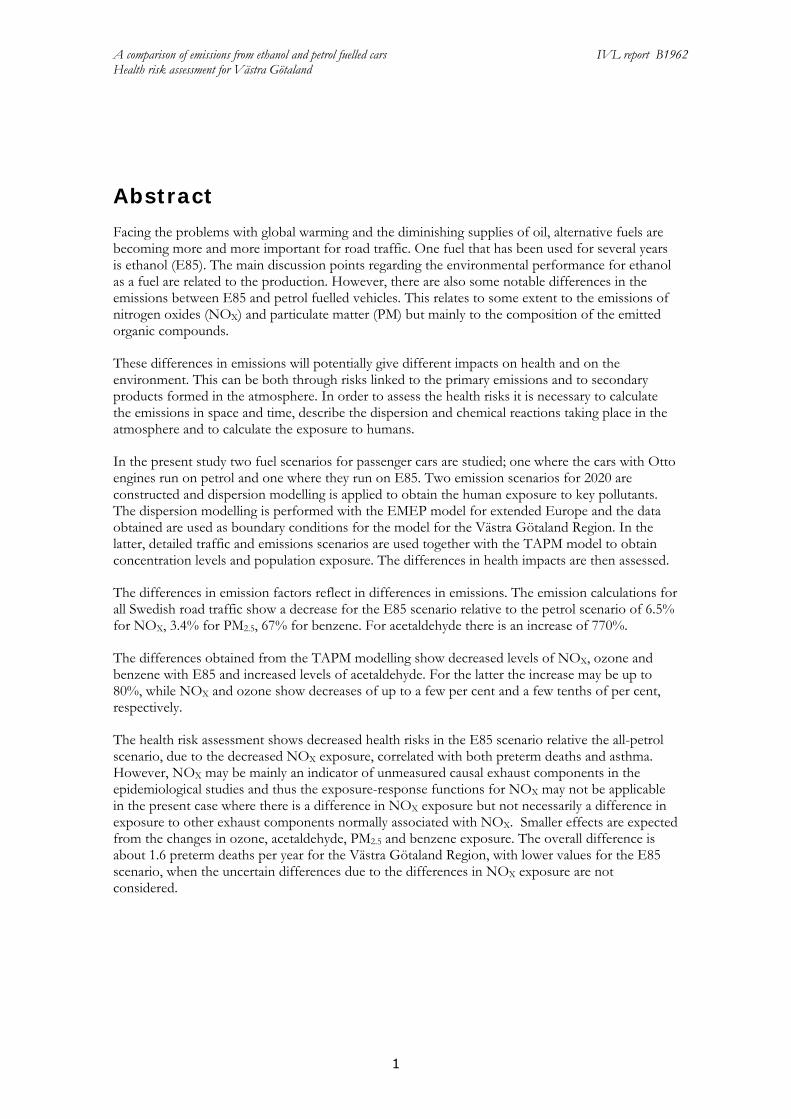
A comparison of emissions from ethanol and petrol fuelled cars IVL report B1962 Health risk assessment for Vaumlstra Goumltaland
3
1 Introduction
Facing the problems with global warming and the diminishing supplies of oil alternative fuels are becoming more and more important for road traffic Several alternative fuels are being tested such as biogas alcohols and dimethyl ether (DME) One fuel that has been used for several years in Brazil and has become popular in eg Sweden and the USA during the last ten years is ethanol It is used both as a component (about 5 vol) in regular petrol and as E85 (85 vol ethanol 15 vol petrol)
The main discussion points regarding the environmental performance for ethanol as a fuel are related to the production In this study the production of ethanol fuel is not in focus but rather the impact from emissions stemming from E85 fuelled cars Although the emissions from E85 cars are not as well characterised as the emissions from petrol cars there are some notable differences in the emissions This relates to some extent to the emissions of nitrogen oxides (NOX) and particulate matter (PM) but mainly to the composition of the emitted organic compounds The main differences here are that petrol generates relatively higher emissions of benzene while E85 generates relatively higher emissions of acetaldehyde and ethanol
Ethanol has a reaction lifetime of several days and the major product of its OH-initiated degradation is acetaldehyde The OH-initiated degradation of acetaldehyde gives upon further reaction with NO2 peroxy-acetyl nitrate (PAN) Other reactions of acetaldehyde give mainly formaldehyde and CO2 All of acetaldehyde formaldehyde and PAN have negative effects on human health
These differences in emissions will potentially give different impacts on health and the environment This can be both through risks linked to the primary emissions and to the mentioned secondary products formed in the atmosphere In order to assess the health risks it is necessary to calculate the emissions in space and time describe the dispersion and chemical reactions taking place in the atmosphere and to calculate the exposure to humans
Jacobson (2007) studied the impact on health risks of a change from petrol to E85 in a scenario analysis for the US in 2020 A greater risk was found for the E85 scenario compared to an all-petrol scenario due to the effects on the ozone concentration However the differences found were small and the conclusion made is that it is unlikely that the use of E85 fuel would improve air quality relative to petrol
In the present study the change in impact on health risks between a scenario with all petrol and one with all E85 is studied for 2020 The fuel switch is applied to all positive ignition injection cars for the EMEP-model domain (covers Europe and surrounding parts of North Africa and Asia) and the health impact is studied for the region of Vaumlstra Goumltaland in Sweden Two emission scenarios for 2020 are constructed and dispersion modelling is applied to obtain the human exposure to key pollutants in the region The dispersion modelling is performed with the EMEP model for extended Europe and the data obtained are used as boundary conditions for the model for the Vaumlstra Goumltaland region In the latter detailed traffic and emissions scenarios are used together with the TAPM model to obtain concentration levels and population exposure The differences in health impacts are then assessed The setup of the scenarios is similar to what is presented by Jacobson but of course applied to a different region with different climate as well as traffic and population density
A comparison of emissions from ethanol and petrol fuelled cars IVL report B1962 Health risk assessment for Vaumlstra Goumltaland
4
2 Methods
21 Overview
The overall objective of the present study is to compare the health impacts in the Vaumlstra Goumltaland region of emissions from petrol fuelled cars (ie cars with Otto engines and spark ignition) in two scenarios for 2020 one with all petrol and one with all E85 Thus in one scenario all these cars are assumed to be fuelled by petrol and in the second all these cars are assumed to be fuelled by E85 The lsquoall-petrolrsquo scenario is called S1 the lsquoE85rsquo scenario S2 The study comprises
emission calculations dispersion modelling population exposure analysis health impact assessment
Two dispersion model runs for the Vaumlstra Goumltaland region (see Figure 1b) are performed with the TAPM model In order to calculate the pollutants entering this region the larger scale EMEP (see Figure 1a) model is applied to the extended European region a) b)
Figure 1 The model area for a) the EMEP model and b) the TAPM model For the TAPM modelling the indicated square in b) is the model domain and the defined map is the Vaumlstra Goumltaland region
22 Emission factors
The study starts with establishing emission factors for petrol- and E85-fuelled cars This basically gives two sets of emission factors that can be applied to the projected traffic volumes For the Vaumlstra Goumltaland region the emission factors used with the exception of E85 cars are taken from
A comparison of emissions from ethanol and petrol fuelled cars IVL report B1962 Health risk assessment for Vaumlstra Goumltaland
5
the Artemis model (Andre 2005) This is a detailed emission model used also in the Swedish reporting of emissions from road traffic and must be considered as the source with the most accurate emission factors for road traffic for Swedish conditions Artemis contains emission factors for the year 2020 which are used in this study Speciation of NMVOC emissions (except for E85 fuelled cars) come from Passant (2002)
The emission scenarios used for Europe are built on EMEPrsquos lsquoCurrent Policyrsquo (CP) scenario for the year 2020 (Vestreng et al 2004) This scenario contains emissions and fuel consumption divided into different source sectors where one is road traffic In order to calculate the emissions for the two scenarios the relative change in emission factors for positive ignition injection cars between petrol and E85 are used
The data available in the EMEP emission database are however not detailed enough for the purpose of this study For example detailed information on the emissions from different vehicle categories is needed Further division of emissions of hydrocarbons on exhaust emission and evaporative emissions are needed as well as a breakdown of PM emissions on exhaust particles and wear particles Therefore a detailed partition of the traffic emissions in the gridded EMEP emission database is done for all countries in the EMEP model domain with help of the data on national emissions in the GAINS model (GAINS 2010) which includes a detailed breakdown of emissions to vehicle categories fuels used etc An exception is made for Sweden where the partition of emissions is calculated with the Artemis model (with the exception of the wear particles that are not covered by Artemis and are taken from GAINS) The GAINS model is an instrument used for policy scenario development and optimisation and contains data of activities (eg fuel and energy consumption) emission factors and emissions from different sources specified for detailed categories This model has a two-way connection to EMEP program in general and to the EMEP model in particular as the transport chemical conversion and deposition matrix for the pollutants emitted from individual countries in GAINS are pre-calculated by EMEP and the future policy scenarios in EMEP are generally consistent with GAINS scenarios as both tools are used for the LRTAP convention and the EU legislation work In the scope of this project it is found that EMEP and GAINS emissions are not fully consistent while the EMEP emission database is based on expert-assessed data reported by the member states the GAINS emissions are based on model calculations The continental scale modelling was based on the EMEP emissions database since this is a gridded database commonly used in EMEP modelling which has its historical scenarios validated within the EMEP monitoring program
While emission factors for petrol cars are relatively well established the data for E85 are much scarcer The Artemis model does not contain detailed emission factors for E85 cars and the situation is similar for the EMEP model The GAINS model considers only zero emissions of CO2 while all other emissions are the same as for petrol To obtain the emission factors for E85 cars data were sought in the open literature (see further below)
23 Traffic data
In order to calculate emissions the emission factors must be applied to data on traffic volumes of the different vehicle categories For Europe the mentioned EMEP policy scenario is used Since the traffic volumes are not available in the EMEP database the relative volumes of traffic in different vehicle categories relative to the total traffic volume are recalculated on national basis using the GAINS model
A comparison of emissions from ethanol and petrol fuelled cars IVL report B1962 Health risk assessment for Vaumlstra Goumltaland
6
For the whole Sweden the traffic prognosis and emissions obtained from the Artemis model are used The results here are very similar to what can be found in the EMEP database which is to be expected since Artemis is used in the Swedish reporting Figure 2 shows the fleet composition in Sweden 2020 from the Artemis model
Figure 2 Contribution of vehicles and fuel categories to the total transport work (vehicle-kilometersyear)
in 2020 in the Artemis model S1-scenario all categories with blue or green colour except the E85 busses use petrol S2-scenario all categories with blue or green colour use E85
For the Vaumlstra Goumltaland region the traffic data for 2005 come from two sources For the city of Gothenburg detailed traffic data are obtained from the local environmental agency For the remaining Vaumlstra Goumltaland region traffic data from the Swedish Transport Administration are used
The changes in all national Swedish emission sources in the EMEP model from year 2005 to 2020 are applied to the emission sources in the inventory for Vaumlstra Goumltaland to produce the 2020 emission scenario
24 Emissions
The emission factors and traffic data are used to obtain emissions in two emissions scenarios S1 where all ignition injection cars are assumed to use petrol and S2 where these cars all use E85 Note that all other road traffic sources such as diesel cars heavy duty vehicles etc are treated in the same way in both scenarios The emissions for Vaumlstra Goumltaland are also calculated for two base-scenarios for 2005 and 2020 where the actual traffic and fuel composition (for 2005) and a prognosis on traffic and fuel composition (for 2020) from the Swedish Transport Administration are used In the impact assessment however only the scenarios with all petrol or all E85 are used
The input of emission data required by the EMEP model consists of annual national emissions The species considered are sulphur dioxide (SO2) nitrogen oxides (NOX = NO+NO2) ammonia (NH3) non-methane volatile organic compounds (NMVOC) carbon monoxide (CO) and
busses dieselampCNG
busses E85
HGV diesel
HGV petrol
LCV diesel
LCV petrol
pass cars dieselCNG LPG hybridpass cars petrol
pass cars E‐85
A comparison of emissions from ethanol and petrol fuelled cars IVL report B1962 Health risk assessment for Vaumlstra Goumltaland
7
particulate matter (PM25 PM10) These emissions are provided for ten anthropogenic source sectors of which only emissions in the road traffic sector changes between the emissions scenarios calculated in this study The emissions are also distributed to vary between months weekdays and over the hours of the day Distribution of the NMVOC emissions between different compounds which are specific to each emission sector and country are used In this study this speciation will vary for road traffic between the scenarios as is described below
For the Vaumlstra Goumltaland region the emissions from traffic and non-road machinery are distributed as 500 m x 500 m grids while emissions from industry and heating plants are treated as point sources (including all physical processes usually connected to that type of sources) Emissions from ships are described as line sources The data are time resolved hourly over the day over the days of the week for each month
25 Dispersion modelling
Effects of the Europe-wide use of the E85 fuel on air pollution in Sweden are studied with two models on two different geographical scales To capture the large-scale changes especially those concerning ozone and other secondary air pollutants the European-scale chemistry transport model EMEP is used (Simpson et al 2003) The effects on exposure of people to air pollutants and consequent health effects are studied using air pollutant concentrations calculated with the small scale dispersion model TAPM which is nudged into EMEP air pollution fields (See Appendix 2 for details) In this way the large scale effects such as formation of ozone secondary PM and secondary aldehydes are accounted for also on the local scale In the case of benzene only the road traffic contribution is calculated due to lack of information on emissions from sources other than traffic
251 Local scale modelling
The TAPM model (Hurley 2008) is used to calculate the local contribution to air pollutants in the Vaumlstra Goumltaland region in the two scenarios The geographically distributed pollutants are then used for the exposure calculations and eventually the health risk assessment TAPM is a three dimensional meteorological and chemical model for air pollution studies that includes topography as well as land-use On the basis of this the model generates the meteorological parameters required for the dispersion modelling such as temperature layering (inversions) and three dimensional wind field all based on daily synoptic input data (large scale meteorological re-analyse data ndashcalled GASP (Global AnalysiS and Prediction) from Australian Government Bureau of Meteorology (wwwbomgovau) TAPM also includes chemistry such as NONO2 ozone SO2 and particle transformation Acetaldehyde and benzene are however not included in the chemical scheme of TAPM and these species are therefore simulated as reactive tracers in this study (see below)
In order to perform the calculations with TAPM a number of input data are required Emission data for the Vaumlstra Goumltaland region as described above Meteorological data Levels of the relevant pollutants on the model domain boundaries for the two scenarios
obtained from the EMEP model A model describing the decay of benzene and acetaldehyde emitted from traffic
A comparison of emissions from ethanol and petrol fuelled cars IVL report B1962 Health risk assessment for Vaumlstra Goumltaland
8
Since acetaldehyde and benzene are not included in the chemical scheme of TAPM their chemical lifetimes are set to be their rate constant with respect to the reaction with OH radicals multiplied by the OH mean concentrations obtained from the EMEP simulations (see below) Four different rates for the four seasons are used according to Table 1
Table 1 Rate constant for reaction with OH and chemical lifetimes for acetaldehyde and benzene used in the TAPM simulations
k(OH) Chemical lifetime (days)
mol-1 cm3s-1
Mar Apr May Jun Jul Aug Sep Oct Nov Dec Jan Feb
Acetaldehyde 15 10-11 12 04 13 155
Benzene 12 10-12 148 49 159 1937
252 EMEP modelling
Several EMEP models are developed and used for air quality policy work in Europe mainly for the Convention on Long-range Trans boundary Air Pollution The Unified EMEP model used in this study is designed to calculate concentrations in air and deposition patterns for major acidifying and eutrophying pollutants photo-oxidants and particulate matter In its standard version it has a 50 km x 50 km resolution in the horizontal direction and 20 layers distributed from the ground up to the pressure level of 100 hPa (ca 16 km) in the vertical direction A detailed description is given in Simpson et al (2003) The meteorological data used for the simulations obtained from wwwemepint are for the year 2005 and are of the same spatial resolution with a time resolution of three hours
As already mentioned the concentration fields generated by the EMEP model are used as an input to the TAPM model Boundary concentration fields for TAPM are calculated from hourly concentrations in the grid cells surrounding the Vaumlstra Goumltaland region that are weighted together with wind field vectors on corresponding boundaries of the Vaumlstra Goumltaland grid cells Since the chemistry of the organic compounds differs between the two models all organic compounds in EMEP are used and recalculated to the reactivity of organic compounds as used by TAPM
While the role of NOX NMVOC and primary PM can be investigated directly by simulations of emission in scenarios S1 and S2 effects of E85 fuelled cars on concentrations of acetaldehyde benzene and secondary PM are obtained from additional sensitivity runs The contribution of the emissions from the use of E85 fuel on acetaldehyde concentrations can be modelled directly in the EMEP model which includes also the formation and consumption of acetaldehyde in atmospheric reactions However TAPM does not include these processes and therefore the role of acetaldehyde formation is investigated further Two additional EMEP simulations are run one excluding primary acetaldehyde emissions and one excluding all NMVOC emissions from petrol and E85 fuelled vehicles By relating the results of these runs to the results of S1 and S2 the contribution of primary and secondary acetaldehydes respectively can be deduced The results from this analysis can be found in Appendix A23 The conclusion is that on the scale of the Vaumlstra Goumltaland region the formation of acetaldehydes in the atmosphere is not important and therefore the acetaldehyde concentration in TAPM can be described using the lifetimes given in Table 1 Further also the impact of the NMHC emissions on the ozone levels is studied (Appendix 23) and found to be small
Benzene is not included explicitly in the EMEP model The benzene concentrations are therefore studied in sensitivity runs with benzene from road traffic added to the S1 and S2 scenarios as
A comparison of emissions from ethanol and petrol fuelled cars IVL report B1962 Health risk assessment for Vaumlstra Goumltaland
9
methanol which has similar atmospheric lifetime as benzene The benzene concentration is then obtained by comparing the methanol concentration from the different runs
The contribution of primary and secondary PM respectively is investigated by excluding the primary PM from petrol and E85 fuelled vehicles in separate runs of the EMEP model The PM boundary values for the TAPM modelling are not separated into secondary and primary PM The results from this analysis are used to draw general conclusions about the difference in secondary PM formation between the two scenarios
26 Exposure
The human exposure of the annual mean concentrations of NOX NO2 O3 acetaldehyde and benzene are calculated based on the dispersion calculations of the Vaumlstra Goumltaland area in combination with the population density The population density distribution for the region is obtained from EEA (EEA 2009) and shown in Figure 3 The total population in the investigated area is 1 078 400
Figure 3 Population density distribution (number of people in a 1 km x 1 km grid for 2006) for the investigated area (according to Figure 1)
A comparison of emissions from ethanol and petrol fuelled cars IVL report B1962 Health risk assessment for Vaumlstra Goumltaland
10
27 Health effects and risk assumptions
271 NOX and NO2
Using modelled levels of NOX in the residential area as a vehicle exhaust marker a Norwegian study of 16 000 men from Oslo of whom 25 died during the follow up found a strong association (Nafstad et al 2004) This cohort with people of between 40-49 years of age at the start of the study was followed from 197273 through 1998 NOX was estimated in a model with 1000 m grids and a street contribution added for the largest streets When the median concentration of NOX for 1974-78 was used (mean 107 μgm3) the relative risk for total non-violent mortality was 8 per 10 μgm3 Nitrogen oxides do not have to be important as causal components behind this association
272 Ozone
Short-term effects of ozone on the respiratory system and on daily number of deaths have been reported from a large number of studies especially for summer concentrations why a threshold has sometimes been assumed in impact assessments Only recently has an effect of long-term exposure on mortality been reported from the very large American Cancer Society (ACS) Cohort Study (Jerret et al 2009)
Jacobson (2007) reported that E85 would cause an increase in mortality but assumed an effect of short-term exposure only The estimated impact was explained by the calculated ozone formation
273 Acetaldehyde
An increased incidence of nasal tumours in rats and laryngeal tumours in hamsters were observed after inhalation of high concentrations of acetaldehyde (HEI 2007) A few epidemiological studies of occupational exposure found associations but with a complex mixture of chemicals and have not been used in the cancer risk assessment for acetaldehyde Acetaldehyde is classified by the National Institute of Occupational Safety and Health as ldquoa potential human carcinogenrdquo by the US EPA (1999) as ldquoa probable human carcinogenrdquo and by the IARC as ldquopossibly carcinogenic to humansrdquo (OEHHA 1999 HEI 2007)
274 Benzene
There is clear and widely accepted evidence from a variety of epidemiologic studies of occupational exposure that benzene increase the risks of acute myeloid leukaemia (HEI 2007) but there is more uncertainty about other lymph hematopoietic cancers Studies on traffic exposure and childhood leukaemia have produced mixed results with regard to associations
275 Formaldehyde
IARCrsquos Monograph 88 says that the evidence is sufficient to conclude that formaldehyde causes cancer in humans (IARC 2006) This was because of evidence of nasopharyngeal cancer at concentrations historically encountered in industrial settings However this conclusion by IARC was largely based on the results from one occupational exposure site and the results and conclusions have not been supportive in other reviews and more recent studies (Bosetti et al 2006 Beane Freeman et al 2009 Bachand et al 2010) OEHHA (1999) uses a lifetime risk for cancer of 0000006 per microgm3 for formaldehyde and US EPA (1999) a lifetime risk of 0000013 per microgm3
A comparison of emissions from ethanol and petrol fuelled cars IVL report B1962 Health risk assessment for Vaumlstra Goumltaland
11
For non-cancer effects the eye is the organ most sensitive to formaldehyde subjective irritation has been reported at 300-500 microgm3 which is above the odour thresholds (Wolkoff amp Nielsen 2010) Effects in the eyes and in airways occur around 600ndash1000 μgm3 Effects on lung function have not been found in controlled human exposure studies below 1 mgm3 In epidemiological studies of associations between formaldehyde and exacerbation of asthma several co-pollutants make the findings difficult to interpret An indoor air quality guideline of 100 μgm3 has been considered protective against both acute and chronic sensory irritation in the airways in the general population assuming a lognormal distribution of nasal sensory irritation (Wolkoff amp Nielsen 2010)
276 PM
In the studies of long-term exposure to PM25 and mortality like the American Cancer Society (ACS) Cohort the exposure contrast were mainly related to secondary PM why the reported relative risk approx 6 increase in all-cause mortality (in adults) per 10 μgm3 is most relevant for background secondary PM concentrations (Pope et al 1995)
277 Health Impact Assessment
To summarize the types of pollutants that are found possible to include in the health impact assessment are NOX and NO2 benzene acetaldehyde formaldehyde secondary PM and ozone The assessment is restricted to the most important and well established effects of these pollutants This means that not all types of potential health impacts are included Results should however do for a comparison of the scenarios
The impact on formaldehyde levels are not calculated why it is not included in the current assessment Relative risks from epidemiological studies of vehicle exhaust using NOX and NO2 as exposure variables may be influenced from effects of their co-pollutants mainly ultrafine particles (elemental carbon soot) CO and HCs such as formaldehyde Exhaust particles are often introduced in a relatively high background of particles from other sources Thus exhaust particles were not measured directly in the important studies of long-term exposure and effects on mortality
3 Results
31 Emission factors
The emission factors are selected from available published data both for the exhaust and the evaporative emissions In both cases values relative to petrol are used The majority of the studies have been done with both E85 and petrol making this comparison more robust
Westerholm et al (2008) tested two flexi-fuel cars with E5 E70 and E85 in the European driving cycle NEDC and in the Artemis driving cycles The former is used at two temperatures (22degC and -7degC) They report the regulated emissions greenhouse gases a number of organic compounds and particle number Graham et al (2008) present measurement results for regulated emissions greenhouse gases and a number of organic compounds from four cars with E85 and regular petrol in the FTP cycle They also made a compilation of literature data for ethanol cars Yanowitz and McCormick (2009) present an analysis of US certification testing data in order to compare emissions for E85 and petrol
A comparison of emissions from ethanol and petrol fuelled cars IVL report B1962 Health risk assessment for Vaumlstra Goumltaland
12
The results from the three studies (for flexi fuel cars) and in addition the values used by Jacobson (2007) are given in Table 2
Table 2 Emissions factors for E85 fuelled cars relative to the emission factors for petrol fuelled cars
Relative change E85 vs petrol ()
Yanowitz and McCormick (2009) (95 conf)
Graham et al (2008) (sd )
Westerlund et al (2008) (average for NEDC)
Jacobson (2007)
NOX -14 (-23 - -5) -42 (15) -38 -30 NMOG 26 (17 - 37) 12 (39) NMHC -43 (-52 - -32) -45 (24) THC -14 (-24 - -4) 2 TOG 22 CO -19 (-25 - -12) -5 (51) 1 5 PM 25 0 Formaldehyde 59 (32 - 91) 80 (44) 184 60 Acetaldehyde 2855 (1189) 1031 2000 13 Butadiene -64 (31) -74 -10 Benzene -72 (15) -71 -79 Ethanol 3950 from TOG Methane 50 43
Table 2 shows lower emissions of NOX for E85 fuelled cars relative to petrol fuelled cars from test cycles generally including cold starts The emissions of hydrocarbons are higher for petrol while the emissions of organic gases are somewhat higher for E85 The emissions of aldehydes especially acetaldehyde are much higher for E85 as are the emissions of ethanol and methane The emissions of benzene and 13-butadiene are higher with petrol It should be noted that the data in Table 2 are in general for tests performed at ambient temperatures of around 20 degC Westerlund et al (2008) report that for ambient temperatures of -7 degC the emissions of CO and NMHC may be significantly higher with E85 compared with petrol For one vehicle they also report very high NOX emissions with petrol at this lower temperature
As seen in Table 2 there are a number of different quantities when it comes to the emission of organic compounds or unburnt fuel From a chemistry point of view HC is no molecule but a notation for the sum of all compounds that are hydrocarbons thus are of the form HxCy and not containing any elements but carbon and hydrogen Total organic gases (TOG) include organic compounds containing oxygen such as alcohols and aldehydes (but not CO or CO2) Volatile organic compounds (VOC) means carbon containing organic compounds present in the gaseous state at ambient temperature Non-methane hydrocarbons (NMHC) means HC minus the methane mass NMTOG and NMVOC are defined in the corresponding way1
1 When it comes to exhaust gas regulations the definitions differ somewhat In the US THC is defined as the signal obtained from a FID (Flame Ionisation Detector) instrument calibrated on propane This means that alcohols and aldehydes contribute to THC but to a lower extent since their responses in a FID instrument are lower than for hydrocarbons TOG is defined in the US regulations as THC + the mass of alcohols (eg methanol) and carbonyls (eg formaldehyde) measured separately NMHC is equal to THC ndash rCH4CH4 ndashralcAlc where the CH4-concentration is measured by gas chromatography and a FID calibrated with methane Alc is the alcohol concentration and rCH4curren and rAlc are the respective FIDresponse functions NMOG means TOG - CH4 and VOC is TOG - CH4 - C2H6 In the regulations it is stated that also a number of other non-ozone forming organic compounds eg acetone should be subtracted but these are present in very low concentrations in engine exhaust Note that there is actually a double counting of aldehydes in NMOG since they contribute to a certain extent to the NMHC value and then are added using values from separate measurements
A comparison of emissions from ethanol and petrol fuelled cars IVL report B1962 Health risk assessment for Vaumlstra Goumltaland
13
There will be emission limits for both THC and NMHC in also the future For petrol cars with low methane emissions the challenge will be to meet the limit for NMHC For E85 cars with higher methane emissions the challenge will be to meet the THC limit Thus it is reasonable that the emissions of NMHC from E85 cars will be lower than for petrol cars
In the modelling presented here the emission factors from Graham et al (2008) are used with some exceptions as will be discussed The reason is that that study comprises a compilation of a relatively large number of tests For CO the emission factor is set to the same value for E85 and petrol since the differences are small and within the uncertainty For particle emissions the studies cited in Table 2 give little information Instead data from Ericsson et al (2008) are used indicating that the primary PM emission using E85 is about 65 of that when using petrol For NOX the emission for E85 is set to 58 of that for petrol
The emission factors for NMHC (physical emission in gkm) including ethanol are in this study set to the same value for E85 as for petrol This is in line with the data for NMOG reported by Graham showing only small differences It is also reasonable considering that the car producers optimize emissions to meet the future emission legislation in Europe for NMHC and THC i e the Euro 6 standards that apply from September 2014 For petrol with low CH4 emissions the NMHC value will be limiting and this is on 68 mgkm For E85 with higher CH4 emissions the THC value of 100 mgkm will be limiting When considering the FID response as a measure of emission instead of physical emission about 50 of the THC comes from NMHC for E85 cars However the FID response is low for ethanol which means that the physical NMHC emission is about 25 higher Considering these factors the emissions of NMHC (physical) for E85 can be expected to be around 50 mgkm 125 = 625 mgkm which is about the same as for petrol The methane emission for E85 is set to 142 times the value for petrol following Lipman and Delucchi (2002) Further also the differences in the evaporate emissions are considered as is described in Appendix 1
The emissions factors for petrol cars are taken from the Artemis model (Andreacute 2005) The distribution of NMHC for petrol cars is from Passant (2002) The resulting emission factors used to obtain the emissions scenarios are presented in Table 3
In Europe THC is defined as the signal from a propane calibrated FID and thus contains oxygen containing compounds although the response factors for the latter are lower The FID instrument gives the number of molecules and in order to calculate the mass the EU regulations use the densities obtained from assuming the molecular formulas C1H274O0385 (209 gmole) for E85 and C1H189O0016 (1415 gmole) for petrol This thus compensates for the lower response factor for ethanol and acetaldehyde NMHC is obtained by subtracting the concentration of CH4 (times the FID response factor) measured separately
A comparison of emissions from ethanol and petrol fuelled cars IVL report B1962 Health risk assessment for Vaumlstra Goumltaland
14
Table 3 Emission factors (gkm) for 2020 for passenger cars (including evaporative emissions but excluding wear particle emissions) used in the modelling
Petrol E85 NOX 0112 0065 CO 179 174 PM 00013 00008 CH4 0013 0018 NMHC 033 028
division of NMHC Ethanol 00000 01898 Acetaldehyde 00025 00299 Ethene 00244 00237 Ethyne 00094 00011 Formaldehyde 00057 00072 Benzene 00187 00045 13 Butadiene 00030 00009 Ethane 00107 00009 Alkanes C3+ 00928 00076 Alkenes C3+ 00301 00025 Aromatics C7+ 01297 00106 Aldehydesketones C3+ 00051 00004
sum NMHC 03321 02792
32 Emissions
The emissions from road traffic vary between the two scenarios due to the differences in the emission factors From the EMEP modelling the total emissions from road traffic in the different scenarios are calculated for the countries included In Figure 4 emissions of NOX NMVOC and PM in the S2 (E-85) scenario relative to the S1 (all-petrol) scenario are shown for these countries The relative change is larger for countries with a high fraction of petrol cars relative to diesel cars (since the latter are the same in the two scenarios) such as Russia and Ukraine The relative change is smallest for PM emissions due to the very small contribution of the exhaust particles from petrol fuelled cars compared to the contribution from diesel vehicles and wear particles
A comparison of emissions from ethanol and petrol fuelled cars IVL report B1962 Health risk assessment for Vaumlstra Goumltaland
15
Figure 4 National emissions of NOX NMVOC and PM from the road traffic sector in E85 scenario (S2)
relative to lsquoall-petrolrsquo scenario (S1)
An important difference in the emissions between the scenarios lies in the speciation of the NMVOC emissions Figure 5 shows this speciation of NMVOCs for all road traffic emission categories used in this study The two rightmost bars in Figure 5 show the NMVOC speciation for Swedish road traffic emissions for the two scenarios S1 and S2 Comparison with Figure4 shows that the relative changes between the two scenarios are much larger for some individual NMVOC species that for the total NMVOC emissions Since the NMVOC emissions from traffic in Sweden are dominated by the emissions from petrol cars (about 85 of the road traffic emissions of NMVOC comes from petrol cars) the variations in NMVOC speciation between petrol and E85
0
02
04
06
08
1
NOx
0
02
04
06
08
1
NMVOC
0
02
04
06
08
1
Aus
tria
Bel
arus
Bel
gium
Bos
-Her
cB
ulga
riaC
roat
iaC
ypru
sC
zech
Rep
Den
mar
kE
ston
iaFi
nlan
dFr
ance
Ger
man
yG
reec
eH
unga
ryIr
elan
dIt
aly
Lat
via
Lith
uani
aL
uxem
bour
gM
alta
Net
herla
nds
Nor
way
Pola
ndPo
rtug
alR
oman
iaR
ussi
a_E
uro
Slov
ak R
epSl
oven
iaSp
ain
Swed
enSw
itzer
land
Tur
key
Ukr
aine
UK
PM
A comparison of emissions from ethanol and petrol fuelled cars IVL report B1962 Health risk assessment for Vaumlstra Goumltaland
16
will have a significant impact on the total road traffic NMVOC speciation As can be seen in Figure 5 scenario S1 is dominated by alkanes and aromatics while scenario S2 is dominated by ethanol It can also be noted that S1 contains a significant emission of benzene which is much lower in S2 while the opposite is true for acetaldehyde
Figure 5 Distribution of hydrocarbon species in NMVOC emissions from individual road traffic emission
categories as defined in emission scenarios in this study and from the whole road traffic emission sector in Sweden for scenarios S1 (All petrol) and S2 (All E85)
Figure 6 shows a map of the EMEP domain with emissions of acetaldehyde for the two studied scenarios as an example of the geographical distribution of emissions
Figure 6 Gridded emissions of acetaldehyde for the year 2020 (in tonnes per grid cell (50 km x 50 km)
and year) a ndash lsquoAll petrol scenario b ndash lsquoAll E85 scenariorsquo
As mentioned the emissions from road traffic in the Vaumlstra Goumltaland region are calculated in a 500 m x 500 m grid Figure 7 shows the emissions of NOX for 2005 as obtained from the database and the projected emissions for 2020 with a mixed use of E85 and petrol This can be considered as the base case for the emissions in 2020 It can be seen that the emissions decrease over the period which is due to reduction in NOX emissions factors as older vehicles are replaced by newer models (the traffic actually increases from a total of 754x109 vehicle-kilometres in 2005 to 937x109
0
20
40
60
80
100
Pet
rol e
xh
Pet
rol e
vap
E-8
5 ex
h
E-8
5 ev
ap
Pet
rol M
C
Die
sel L
DV
Die
sel H
DV
Roa
d Sw
eden
S1
Roa
d Sw
eden
S2
m
ass
Ethane
Alkanes C3+
Ethene
13 Butadiene
Alkenes C3+
Ethyne
Benzene
Aromatics C7+
Formaldehyde
Acetaldehyde
Aldket C3+
Ethanol
A comparison of emissions from ethanol and petrol fuelled cars IVL report B1962 Health risk assessment for Vaumlstra Goumltaland
17
vehicle-kilometres in 2020) The major roads in the region are clearly visible as well as the larger cities (especially Gothenburg)
Figure 7 Emissions of NOX (kgyear for a 500 m x 500 m grid cell) in the Vaumlstra Goumltaland region for 2005
and for 2020 for the base case
In Table 4 the traffic emissions for NOX benzene acetaldehyde ethanol and PM10 for the Vaumlstra Goumltaland region are shown for the four different emissions scenarios The emissions of NOX and benzene are reduced between 2005 and 2020 for the base case while the emissions of ethanol and acetaldehyde increase due to an expected increase in the use of ethanol fuel The NOX emissions for S1 are somewhat higher than for S2 due to the higher NOX emissions factor for petrol compared with E85
Table 4 Emissions from traffic for the Vaumlstra Goumltaland region in four different emission scenarios (in tonnesyear)
Substance base 2005 base 2020 S1 S2 NOX 13 243 4 843 4 954 4 631 Benzene 2 833 927 1 201 386 Acetaldehyde 628 1 074 305 2 595 Ethanol 192 5 192 0 15 400 PM10 1 324 486 483 476
33 Dispersion modelling
Resulting concentrations from calculations of the S1 and S2 scenarios with the EMEP model are used to provide input of primary and secondary air pollutants for the calculations with the TAPM model for the Vaumlstra Goumltaland region Concentrations of NOX NMVOC PM25 PM10 acetaldehyde ethanol and benzene are therefore calculated as boundary conditions for the Vaumlstra Goumltaland region In addition sensitivity studies are performed to investigate the role of formation of secondary acetaldehyde and secondary particulate matter (see Appendix 2) Time series analysis of the TAPM and EMEP model results of the S1 and S2 scenarios are presented in Figure 8
A comparison of emissions from ethanol and petrol fuelled cars IVL report B1962 Health risk assessment for Vaumlstra Goumltaland
18
a)
b)
Figure 8 Time series analyses of S1 and S2 scenarios for the EMEP and TAPM modelled concentrations of NOX and ozone at an urban background site in Gothenburg (TAPM) and in EMEP model grid cells including Gothenburg city (50 km x 50 km)
Concentrations of NOX and ozone at an urban background site in Gothenburg (TAPM) and in the 50 km x 50 km EMEP grid cells including Gothenburg are compared for one summer and one winter month Due to the well-known process of ozone titration by freshly emitted nitrogen monoxide (Seinfeld and Pandis 1998) the concentration of ozone often decreases in urban areas This phenomenon is expected to be captured by the fine-gridded TAPM model but not necessarily by the courser scale of the EMEP model Figure 8 shows the generally higher NOX levels in the small grid cell of the TAPM model in urban background location comparing to those in the large EMEP grid cell while the opposite is observed for the ozone concentrations (Remember that the boundary concentrations for TAPM are obtained from the EMEP model and they are thus the same in both cases) This indeed shows that local scale emissions and processes contribute to locally increased levels of NOX in urban areas both for the summer and the winter cases For ozone where there of course are no primary emissions the situation is the opposite where instead the result is decreased concentration levels at urban sites on a local scale The influence of the
A comparison of emissions from ethanol and petrol fuelled cars IVL report B1962 Health risk assessment for Vaumlstra Goumltaland
19
NMHC emissions from the passenger cars is studied in a sensitivity analysis (see Appendix 23) and it is found to have only a small influence on the ozone levels
To illustrate the results of the different scenario calculations the geographically distributed concentrations are presented as the difference in yearly average concentrations between the all E85 (S2) and all petrol (S1) scenarios both as microgm3 and sometimes as percentage of the difference to scenario S1 (see Appendix 3)
The difference in yearly average concentrations between scenario S1 and S2 for acetaldehyde and benzene can be seen in Figures 9 and 10 respectively The increase in acetaldehyde concentration resulting from a switch from petrol to E85 is up to about 05 gm3 or 80 in the central parts of the largest urban area of the region Gothenburg Outside this area the relative increase is about 10 for the other urban areas and less than that for the rural areas This large relative increase (see map in Appendix 4) is a result of the relatively high emissions of acetaldehyde from E85 fuelled cars For benzene the situation is opposite In the scenarios for 2020 the concentration of benzene decreases by up to a few tenths of gm3 as a result of a switch from petrol to E85 For benzene the relative change is not calculated
Figure 9 The difference in yearly average concentrations of acetaldehyde for 2020 between the all E85 (S2) and all petrol (S1) scenarios (microgm3)
A comparison of emissions from ethanol and petrol fuelled cars IVL report B1962 Health risk assessment for Vaumlstra Goumltaland
20
Figure 10 The difference in yearly average concentrations (gm3) of benzene for 2020 between the all E85 (S2) and all petrol (S1) scenarios
The difference in the calculated NOX NO2 and ozone concentrations between the two scenarios are shown in Appendix 4 The change in NOX concentration between the two scenarios only represents a small fraction of the total NOX concentration This is because the emissions of NOX from petrol cars are relatively low compared with the contribution from diesel engines and other sources Thus the resulting decrease in the NOX concentration with E85 is only up to 3 For ozone there is a small increase of about 01 microgm3 of E85 in the central areas of Gothenburg where there is relatively high traffic intensity (see Appendix 4 Figure A9) In the rest of the region there is a small decrease in the ozone concentration in the E85 scenario
34 Exposure
The resulting concentrations from the dispersion modelling together with the population density distribution are used to assess the exposure to acetaldehyde benzene NO2 NOX and ozone for the two scenarios S1 and S2 The exposure to PM25 is very similar for the two scenarios (the difference in concentration between scenarios S2 and S1 is only about -002 gm3 Table 5 shows the population weighted mean exposure both as total concentrations and as the difference between the two scenarios Detailed exposure results can be found in Appendix 5 It can be seen that the exposure to all the pollutants in Table 5 with the exception of acetaldehyde are somewhat lower for the all E85 scenario (S2) than for the all petrol scenario (S1) However the effect on health also
A comparison of emissions from ethanol and petrol fuelled cars IVL report B1962 Health risk assessment for Vaumlstra Goumltaland
21
depends on the level of the dose-response functions For example if the level of concentration is low in a populated area but the dose-response function is high the effect of even a low concentration increase can become important The increase in exposure from S1 to S2 (S2-S1) calculated as percentage of the population exposed to increased mean concentrations of pollutants is presented in Figure 11
Table 5 Populated weighted mean exposure (gm3)
S1 S2 S2-S1 Acetaldehyde 065 077 014 Benzene 01 005 -007 NOX 85 84 -012 Ozone 570 569 -012 PM25 270 268 -002
Increased concentrations Decreased concentrations Both increased and
decreased conc
Figure 11 The relative exposure (S2-S1) calculated as percentage of the population
In Figure 11 it is clear that the only pollutant that does not show an improvement regarding air quality and thus the health risks when modelling a switch from petrol to E85 is acetaldehyde For all pollutants except for ozone the changes of concentration levels observed between the scenarios are within the urban areas but for ozone there are also differences in rural areas
According to the data in Figure 11 about 14 of the population in the Vaumlstra Goumltaland region will be exposed to 03-08 microgm3 higher concentration levels of acetaldehyde in scenario S2 relative to S1 From Figure 9 it can be seen that the majority of these people live within the Gothenburg area Further about 28 of the population will be exposed to increased levels of between 01 to 03 microgm3 mainly in the suburban areas and rural surroundings of Gothenburg but also in some of the smaller cities in the region Outside the urban areas the concentration difference is lower than 01 microgm3
In the S2 scenario relative to the S1 scenario the population is exposed to decreased concentration levels of benzene and NOX This is mainly true also for O3 but with an exception for the central
A comparison of emissions from ethanol and petrol fuelled cars IVL report B1962 Health risk assessment for Vaumlstra Goumltaland
22
parts of Gothenburg where the concentration actually increases (see Appendix 4 Figure 7A) resulting in that 3 (blue area in Figure 11 for O3) of the population will be exposed to higher concentrations of O3 For the rest of the area there are decreased concentrations of ozone upon a switch to E85
The largest differences are again in the central parts of Gothenburg where about 20 of the population is being exposed to a lower benzene concentration of 01-03 microgm3 This also means that concerning benzene the majority (78) of the population have none or very low influence from a change to ethanol fuel
The largest effect on exposure difference is seen for NOX where just over 20 of the population has its exposure decreased with 03-05 microgm3 (in the central parts of Gothenburg) In the suburbs the decrease is between 01-02 microgm3 lower Along the largest roads there is a small but visible improvement on a yearly basis of 01 microgm3
For PM25 there is a difference in the populated weighted mean exposure of 002 gm3 between the scenarios with a lower value for the all-E85 case (see also Appendix 5)
35 Impact on health in Vaumlstra Goumltaland
351 NO2 and NOX
The impact of long-term exposure on mortality was estimated using the relative risk from the Norwegian cohort study (Nafstad et al 2004) reporting a relative risk of 08 increase per microgm3 increase in NOX however without adjustment for particle concentrations Assuming this effect on the total mortality and a typical baseline mortality of 1000 deaths per 100 000 person years a decrease in the population mean exposure of 012 microgm3 would correspond to approximately 104 less preterm deaths per year However for the present case this number is highly uncertain since the exposure to substances normally associated with changes in NOX exposure may here change in different ways since the relation between different exhaust components varies between the scenarios
The impact of long-term exposure on asthma incidence (new cases) in adults has been estimated using results from the Swedish RHINE Study Cohorts (Modig et al 2009) with very similar results in the ECRHS Study corresponding to approx 4 increase per microgm3 increase in NO2 From the RHINE Study the incidence can be estimated to 03 per year (proportion of adults developing the disease) with children and elderly excluded this means around 1500 adult cases per year A reduction of 009 microgm3 corresponds to 54 avoided new cases of adult asthma per year However also NO2 in the asthma study may have been mainly an indicator of vehicle exhaust
352 Ozone
The impact of long-term exposure on respiratory mortality has been reported to be approx 02 per microgm3 increase in the summer concentration when studied in the large ACS Cohort (Jerret et al 2009) Assuming this effect on the total population and a typical baseline respiratory mortality of 100 deaths per 100 000 person years a decrease in the population mean exposure of 012 microgm3 corresponds to approximately 03 less preterm deaths per year
A comparison of emissions from ethanol and petrol fuelled cars IVL report B1962 Health risk assessment for Vaumlstra Goumltaland
23
353 Acetaldehyde
According to US EPA (1999) a lifetime risk for cancer of 0000002 per microgm3 is to be assumed for this potential human carcinogen An increase in the population mean exposure of 012 microgm3 corresponds to 026 cases more per year in the current population
354 Benzene
According to US EPA (1999) a lifetime risk for cancer (leukaemia) of 00000022-00000078 per microgm3 is to be assumed for this human carcinogen A decrease in the population mean exposure of 0074 microgm3 corresponds to approximately 03 cases less per year in the current population (assuming 0000004 per microgm3)
355 PM25
In CAFEacute and other impact assessments a relative risk of 6 increase in all-cause mortality per 10 microgm3 has usually been assumed Assuming this effect on the total mortality and a typical baseline mortality of 1000 deaths per 100 000 person years a decrease in the population mean exposure of 002 microgm3 corresponds to approximately 13 less preterm deaths per year
4 Discussion
In this study the health risks from a large introduction of E85 to replace petrol is analysed in scenario studies for 2020 for the Vaumlstra Goumltaland region It is found that the change in pollutant concentration exposure and health risks are small between the two scenarios It should be emphasized that the study only considers vehicle emissions and does not take into account effects from the fuel production
The emissions of NOX in the model are somewhat lower from E85 fuelled cars than from petrol fuelled cars This is in line with the emission factors used by Jacobson (2007) The nitrogen oxides are key substances in the atmospheric reactions determining the concentrations of ozone in air NOX is involved in the formation of ozone but close to the NO source the ozone concentration is lowered due to the rapid reactions between NO and O3 forming NO2 If NO is released in an environment with already high NO concentration it may result in lowering of ozone levels on the regional scale In the present study the ozone concentrations calculated are somewhat lower for the E85 scenario than for the petrol scenario
The health risk analysis shows that the main difference between the scenarios is due to the lower concentration of NOX However it may have been other exhaust components than NOX such as exhaust particles that were behind the reported association with mortality In cases when NOX is not a good indicator of exhaust particle emissions and their toxicity our results may be misleading This should be studied further Neglecting the effects of the changes in NOX exposure the total difference between the scenarios sums up to 16 preterm deaths per year with lower values for the E85 scenario while it would sum up to 12 less preterm deaths for the E85 scenario if the effect related to NOX were included Since there are no similar studier for the effect on mortality among those younger than 30-50 years of age we assume the same relative effect on mortality in all ages This makes only a small difference since the large majority of deaths occur in older groups
A comparison of emissions from ethanol and petrol fuelled cars IVL report B1962 Health risk assessment for Vaumlstra Goumltaland
24
The opposite result for the ozone concentration was obtained by Jacobson The reason for this discrepancy is that the Jacobson study concerns Los Angeles a region with high concentrations of pollutants while the study here concerns the Vaumlstra Goumltaland region with much less dense traffic and also lower concentrations of pollutants importantly NOX It is not unlikely that the effect that Jacobson report also would be found for large parts of Europe with higher traffic densities than in the Vaumlstra Goumltaland region
It is worth to emphasize that the major negative health effect in the Jacobson (2007) study is attributed to the increase in ozone concentration that is a result of the decrease of the NO emissions from E85 cars Directly after the emission NO reacts with ozone resulting in drop of the ozone concentration the so-called ozone titration commonly observed in many cities This NO does however form even higher quantities of ozone further downwind contributing to the general increase in the background ozone levels It is also precursor of NO2 secondary PM and other toxic species as eg PAN and hence reductions in NO emissions are never regarded as disbeneficial from the environmental viewpoint
There are of course several sources of uncertainties that influence the results of this study Since the main results concern differences between the two scenarios several of these factors loose on importance for the conclusions This comprises uncertainties in meteorology in future traffic volumes and in the population density distribution However there are some uncertainties that remain important The emission factors for E85 fuelled cars are much less characterised than what they are for petrol cars The emission of particles from E85 fuelled cars is especially uncertain with only very few published results Also the emissions of NMHC are somewhat uncertain and may be higher for E85 at lower ambient temperatures However the sensitivity analysis performed shows that for the studied region the NMHC emissions only have a small influence on the ozone concentrations
5 Conclusions
In this study the impact of tailpipe and evaporative emissions from E85 fuelled cars on air pollution and health risks are calculated and compared with petrol fuelled cars The scenario calculations for the Vaumlstra Goumltaland Region give data on emissions pollutant concentrations exposure and a health risk evaluation
The differences in emission factors between E85 and petrol lies in the emissions of PM and NOX which are about 65 and 58 for E85 relative petrol respectively Also the speciation of the emitted hydrocarbons is significantly different with large emissions of acetaldehyde and ethanol from E85 and large emissions of benzene higher aromatics alkanes and alkenes from petrol
These differences in emission factors reflect in differences in emissions The emission calculations for all Swedish road traffic show a decrease for the E85 scenario relative to the petrol scenario of 65 for NOX 34 for PM25 67 for benzene For acetaldehyde there is an increase of 770
The differences obtained from the TAPM modelling show decreased levels of NOX ozone and benzene with E85 and increased levels of acetaldehyde For the latter the increase may be up to 80 while NOX and ozone show decreases of up to a few per cent and a few tenths of per cent respectively
A comparison of emissions from ethanol and petrol fuelled cars IVL report B1962 Health risk assessment for Vaumlstra Goumltaland
25
The health risk assessment shows decreased health risks in the E85 scenario relative the all-petrol scenario due to the increased NOX exposure correlated with both preterm deaths and asthma However NOX may be mainly an exhaust indicator Smaller effects are expected from the changes in ozone acetaldehyde and benzene exposure The overall difference considering the exposure to PM acetaldehyde benzene and ozone is 16 preterm deaths with lower values for the E85 scenario
6 Acknowledgements
Saab Automobile The Swedish Transport Administration and The Foundation for the Swedish Environmental Research Institute are gratefully acknowledged for financial contribution
Magnus Ekstroumlm and Maria Holmstroumlm at Saab and Martin Juneholm at the Swedish Transport Administration are acknowledged for their most valuable input to the study
David Simpson Norwegian Meteorological Institute EMEP MSC-W Norway and Dept Radio amp Space Science Chalmers Univ Technol Sweden is gratefully acknowledged for help with implementation of the Unified EMEP model
A comparison of emissions from ethanol and petrol fuelled cars IVL report B1962 Health risk assessment for Vaumlstra Goumltaland
26
7 References
Altenstedt J Pleijel K 2000 An alternative approach to photochemical ozone creation potentials under European conditions J Air amp Waste Manage Assoc 50 1023 ndash 1036
Andre J-M (2005) Vehicle emission measurement collection of the ARTEMIS datatbase Artemis 3312 report Available from httpwwwinretsfrurltepublicationspublications-pdfJoumardA3312reportJMALTE0504pdf
Bachand A MMundt K A Mundt D JMontgomery R R Epidemiological studies of formaldehyde exposure and risk of leukemia and nasopharyngeal cancer A meta-analysis Critical Reviews in Toxicology 2010 40(2) 85ndash100
Beane Freeman L E Blair A Lubin J H Stewart P A Hayes R B Hoover R N Hauptmann M Mortality from lymphohematopoietic malignancies among workers in formaldehyde industries The National Cancer Institute Cohort J Natl Cancer Inst 2009101751ndash761
Bosetti C McLaughlin J K Tarone R E Pira E LaVecchia C Formaldehyde and cancer risk A quantitative review of cohort studies through 2006 Ann Oncol 20081929ndash43
ConcaweJRC Well-to-wheel studies httpiesjrceceuropaeuwtwhtml
Derwent R G Jenkin M E Saunders S M 1996 Photchemical ozone creation potentials for a large number of reactive hydrocarbons under European conditions Atmos Environ 30 181 ndash 199
Derwent RG Jenkin ME Passant NR Pilling MJ 2007 Photochemical ozone creation potentials (POCPs) for different emission sources of organic compounds under European conditions estimated with a Master Chemical Mechanism Atmos Env 41 2570ndash2579
EEA Copenhagen 2009 wwweeaeuropaeudata-and-mapsdatapopulation-density-disaggregated-with-corine-land-cover-2000-2
Ericsson P Holmstroumlm M Amberntsson-Carlsson A Ohlson C Skoglundh M Andersson B Carlsson P-A 2008 Characterization of particulate emissions and methodologhy for oxidation of particulates from non-diesel combustion ystems SAE Technical Paper Series 2008-01-1746
GAINS 2010 httpgainsiiasaacatindexphpgains-europe
Graham LA Belisle SL Baas C-L Emissions from light duty gasoline vehicles operating on low blend ethanol gasoline and E85 Atmospheric Environment 42 4498 (2008)
Haskew H M Thomas P E Liberty F 2006 Fuel Permeation From Automotive Systems E0 E6 E10 E20 And E85 Final Report CRC Project No E-65-3 Coordinating Research Council Inc 3650 Mansell RoadSuite 140Alpharetta GA 30022
HEI Air Toxics Review Panel (2007) Mobile-Source Air Toxics A Critical Review of the Literature on Exposure and Health Effects HEI Special Report 16 Health Effects Institute Boston USA
Hurley P TAPM v 4 User Manual 2008 CSIRO ISBN 978-1-921424-73-1
IARC (2006) IARC Monographs on the Evaluation of Carcinogenic Risks to Humans Wood Dusts and Formaldehyde Lyon World Health Organization International Agency for Research on Cancer Lyon France 8837ndash325
Jacobson M Z Effects of Ethanol (E85) versus Gasoline Vehicles on Cancer and Mortality in the United States Environ Sci Technol 2007414150-4157
A comparison of emissions from ethanol and petrol fuelled cars IVL report B1962 Health risk assessment for Vaumlstra Goumltaland
27
Jerret M Burnett R T Pope C A Ito K Thurston G Krewski D Shi Y Calle E Thun M Long-Term Ozone Exposure and Mortality N Engl J Med 20093601085-95
Lipman T E Delucchi M A 2002 Emissions of nitrous oxide and methane from conventional and alternative fuel motor vehicles Climate Change 53 477
Modig L Toreacuten K Janson C Jarvholm B Forsberg B Vehicle exhaust outside the home and onset of asthma among adults Eur Respir J 2009 Jun33(6)1261-7
Nafstad P Haheim L L Wisloff T Gram F Oftedal B Holme I Hjermann I Leren P Urban air pollution and mortality in a cohort of Norwegian men Environ Health Perspect 2004112(5)610-5
OEHHA (1999) Air Toxics Hot Spots Program Risk Assessment Guidelines Part II Technical Support Document for Describing Available Cancer Potency Factors Prepared by the Air Toxicology and Epidemiology Section Office of Environmental Health Hazard Assessment April 1999
Passant NR (2002) Speciation of UK emissions of non-methane volatile organic compounds AEAT report AEATENVR0545 Issue 1 Culham UK
Pope CA III Thun MJ Namboodiri MM Dockery DW Evans JS Speizer FE Heath CJ Particulate air pollution as a predictor of mortality in a prospective study of US adults Am J Resp Crit Care Med 1995 151 669-674
Seinfeld J H and Pandis SN (1998) Atmospheric Chemistry and Physics From Air Pollution to Climate Change John Wiley amp Sons New YorkSimpson D Fagerli H Jonson JE Tsyro S Wind P Tuovinen J -P 2003 Transboundary acidification and eutrophication and ground level ozone in Europe Unified EMEP Model Description EMEP Status Report 12003 Part I EMEPMSC-W Report The Norwegian Meteorological Institute Oslo Norway
US EPA (1999) httpwwwepagovttnatwnata1999nsata1999
Vestreng V et al 2004 Inventory Review 2004 Emission data reported to CLRTAP and the NEC Directive EMEPEEA Joint Review Report EMEPMSC-W Note 1
Westerholm R Ahlvik P Karlsson HL An exhaust characterisation study based on regulated and unregulated emissions from bi-fuel and flexi-fuel light-duty passanger cars fuelled by petrol (E5) bioethanol (E70 E75) and biogas tested at ambient temperatures of +22degC and -7degC 2008
Wolkoff P Nielsen G D Non-cancer effects of formaldehyde and relevance for setting an indoor air guideline Environment International 201036788ndash799
Yanowitz J McCormick RL Effect of E85 on tailpipe emissions from light-duty vehicles J Air amp Waste Manage Assoc 59 172 (2009)
A comparison of emissions from ethanol and petrol fuelled cars IVL report B1962 Health risk assessment for Vaumlstra Goumltaland
28
Appendix 1 Evaporate emissions of NMHC
The following assumptions are done for evaporative emissions The NMHC emissions from E85 are reduced relative to petrol by 45 Methane emissions are zero and the split of NMHC species is 68 ethanol and the remaining 32 is divided in the same way as evaporative emissions for petrol The estimates by Graham et al (2008) are missing evaporative emission data however these assumptions agrees very well with measurements of evaporative emissions due to fuel permeation reported by Haskew et al (2006) where NMHC emissions are reported to be reduced by 50 for E85 fuel compared to petrol Haskew et al also presents the NMHC split to species with 60 ethanol This number agrees quite well with our assumption of 68 NMHC being ethanol NMHC in exhaust and evaporative emissions are thus divided as in Table A1
Table A1 Division of NMHC in the exhaust and evaporative emissions for E85 and petrol respectively (wt)
E85 Petrol E85 Petrol exhaust exhaust evaporative evaporative
Ethanol 680 0 680 0 Acetaldehyde 131 08 02 0 Ethene 99 73 24 0 Ethyne 03 28 09 0 Formaldehyde 31 17 06 0 Benzene 16 56 18 10 13 Butadiene 03 09 03 0 sum 963 191 741 10
The remaining NMHC emissions are divided as for petrol (ref) and listed in Table A2
Table A2 Division of NMHC in the exhaust and evaporative emissions for E85 and petrol respectively (wt)
E85 Petrol E85 Petrol exhaust exhaust evaporative evaporative
Ethane 02 32 10 0 Alkanes (C3+) 13 278 89 880 Alkenes (C3+) 04 90 29 95 Aromatics (C7+) 18 388 125 15 Aldehydesketones (C3+)
01 15 05 0
A comparison of emissions from ethanol and petrol fuelled cars IVL report B1962 Health risk assessment for Vaumlstra Goumltaland
29
Appendix 2 Description of the model system
A21 Atmospheric lifetimes
Table A3 gives tropospheric lifetimes with regard to reaction of ethanol formaldehyde acetaldehyde and benzene (C6H6) with OH nitrate radical (NO3) and photolysis The studied organic species are listed together with three species common in the gasoline exhaust (benzene ethene and toluene) for comparison Table 11 shows also photochemical ozone creation potential (POCP) of these species POCP is a measure of amount of ozone that is formed from a certain VOC emission relatively to other emission source which has been established to the same emission mass of ethene (Derwent et al 1996 Altenstedt et al 2000) The range represents different scenarios for VOC and NOX background concentrations Derwent et al (2007) used similar methodology to calculate POCP of different VOC sources and calculated POCP of mean road emission exhaust to be 69
Table A3 Atmospheric lifetimes of studies NMVOC species with respect to the OH- and NO3- initiated
degradation τ(OH) and τ(NO3) and with respect to the photolysis (The lifetime of a chemical species which decays in a first-order process is the time needed for a concentration of this species to decrease to 1e of its original value Statistically it represents the mean life expectancy of an excited species) The OH concentration of 1times106 moleculescm3 typical for summer troposphere was used for the lifetime calculation The NO3 concentrations of 5 and 100 ppt(V) were used for lifetime calculations as representative of rural and urban night-time 12 hrs mean concentration The studied organic species are listed together with 3 species common in the gasoline exhaust for comparison The rates of photolysis were calculated with radiation transfer model for July 58ordm latitude and integrated over 24 hours
τ(OH) τ(NO3) urbanrural τ (photolysis) POCP
hr hr hr
Ethanol 85 56 1times103 - 44 - 63
Acetaldehyde 15 47 1times103 86 68 - 80
Formaldehyde 30 194 4times103 10 18 - 55
Benzene 214 - - 23 - 47
Ethene 34 - - 100
Toluene 50 - - 30 - 67
A22 Defining of boundary concentrations for TAPM from EMEP fields
Calculation of initial concentration field for TAPM from EMEP concentration field of NO2 (as example) and EMEP mean wind vector components u_mid and v_mid Two EMEP model gridcells (i=56 j=60 and i=56 j=61) represent the TAPM model domain and concentrations from the surrounding EMEP gridcells SE-S SE-N NW-S NW-N NE NW (Figure A1) are used for calculation of boundary concentration NO2(bc) according to the following code if u_mid lt= 0 then ( isite = SE-S and jsite = SE-N) else isite = NW-S and jsite = NW-N) endif
A comparison of emissions from ethanol and petrol fuelled cars IVL report B1962 Health risk assessment for Vaumlstra Goumltaland
30
if v_mid lt= 0 then ( ksite = NE) else ksite = SW endif NO2(bc) = [(NO2(isite)u_mid(isite) + NO2(jsite)u_mid(jsite))2 + NO2(ksite)v_mid(ksite)] [(u_mid(isite) + u_mid(jsite))2 + v_mid(ksite)]
Figure A1 Gridcells covering Gothenburg domain and its boundary in EMEP model plotted on latitude-
longitude coordinates The red square represents centre of Gothenburg and the blue line the coastline EMEP i and j coordinates for the boundary gridcells are SE-S = 57-60 SE-N = 57-61 NW-S = 55-60 NW-N = 55-61 NE = 56-62 NW = 56-59 and for Gothenburg grid cells are Gbg-NE = 56-61 Gbg-SW = 56-60
A23 Atmospheric chemistry
The role of secondary chemistry in for the concentration of acetaldehyde are studied by first excluding the primary acetaldehyde emissions from the EMEP model simulations of scenarios S1 and S2 and then by excluding all NMVOC emissions from the car category with spark ignition engines The contribution from the primary acetaldehyde emissions as well as the contribution of secondary acetaldehyde formed from other NMVOC to the total acetaldehyde concentration is then obtained However the secondary chemistry is highly nonlinear due to the interactions of NMVOCs with ozone and OH and thus the results for the contribution of secondary acetaldehyde are somewhat uncertain Differences in acetaldehyde concentrations between S1 and S2 scenarios are studied with respect to contribution of primary and secondary acetaldehyde It is observed that in summer background air the monthly mean contribution of the secondary acetaldehyde is of the same magnitude as the contribution of the primary acetaldehyde to the difference between S1 and
565
57
575
58
585
105 115 125 135 145
Long
Lat
Gbg-SW
Gbg-NE
SE-S
NW-N
NW-S
SE-N
SW
NE
55-59
57-59
55-62
A comparison of emissions from ethanol and petrol fuelled cars IVL report B1962 Health risk assessment for Vaumlstra Goumltaland
31
S2 In the winter and in more polluted atmosphere (Gothenburg grid cells) the contribution from secondary acetaldehyde to the concentration difference appears to be negative due to the chemistry feedback ie the E-85 scenario has less secondary acetaldehyde than the all-petrol scenario
A comparison of S2-S1 differences in primary and secondary acetaldehyde concentrations in the background (=upwind) and Gothenburg grid cells show no increase in the secondary acetaldehyde from upwind to the Gothenburg grid cell It can thus be concluded that there is no significant contribution from secondary aldehydes on the small scale (tenths of km) Conclusion from this sensitivity study is that the secondary formaldehyde can be of importance under summer in the clean background air but that formation on the local scale is unimportant Using EMEP simulated boundary concentrations of acetaldehyde in the local scale model and simulating the primary acetaldehyde emissions will capture the most important features of acetaldehyde dispersion and chemistry in Vaumlstra Goumltaland
In the EMEP model the tail-pipe PM emissions are specified as primary particles Emissions of NOX and VOCs (and NH3 SO2) are oxidised in the atmosphere and a part is then transferred through the gas-to-particle transport to the PM as secondary PM The petrol fuelled cars emit both more primary PM and more NOX compared to the E85 cars If we compare differences in primary and secondary PM between the S1 and S2 scenarios simulated by EMEP we can directly see what part of the difference is from the tail-pipe emissions of the primary particles and what part is from the formation of the secondary PM in atmosphere (mostly from higher emissions of NOX) Table A4 shows the differences between S1 and S2 (S1-S2) of monthly PM averages for January and June (two months with low and high photochemical activities respectively) It can be seen that the higher formation of secondary PM in the S1 (all-petrol) scenario is more important than the higher tail-pipe emission of primary PM by factor 10 - 20
When we compare simulated PM differences between S1-S2 for the background air (=upwind) grid cells and for grid cells including Gothenburg (50 km x 50 km scale) we can see significant increase in primary PM in the S1 scenario from the upwind grid cells to Gothenburg (746 in winter 132 in summer) while no systematic increase can be seen for the secondary PM (-42 in winter +24 in summer) From this comparison it can be concluded that no systematic increase in secondary PM can be seen (in difference from the primary PM) on the scale of 50-100 km and we can neglect this process on the small scale However the overall change in PM concentrations due to the switch of the fuel is very small both on the large scale and on the small scale as can be seen when the differences in PM concentrations between S1 and S2 are compared to absolute PM concentrations in S1 presented in the last column of Table A4
Table A4 Differences in primary and secondary PM concentrations between the lsquoAll-petrolrsquo (S1) and lsquoE-85rsquo (S2) scenarios simulated in gridcells upwind Gothenburg and in gridcells including Gothenburg (2 50 km x 50 km gridcells)
S1-S2 Background
S1-S2 Gothenburg
Increase S1-S2 Gothenburg
S1 Background
μgm3 μgm3 μgm3 bkgnd μgm3
Prim PM10 Jan 00008 00014 00006 746 084
Jun 00008 00018 00010 1319 084
Sec PM10 Jan 00155 00148 -00006
-42 157
Jun 00080 00081 00002 24 213
The sensitivity of the used emission factors for NMHC with respect to the ozone formation in the region of the Swedish West Coast can be analysed with the help of results from studying the
A comparison of emissions from ethanol and petrol fuelled cars IVL report B1962 Health risk assessment for Vaumlstra Goumltaland
32
formation of secondary acetaldehyde In this study first all primary acetaldehyde emitted by the E85 fleet are omitted in a model simulation (S2_nopAA) and secondly all NMHC emissions from the E-85 fleet are switched off (S2_noVOC) Acetaldehyde has a somewhat higher though still comparable photochemical ozone creation potential compared to ethanol (ethanol 44-63 acetaldehyde 68-80 Altenstedt and Pleijel 2000) and this simulation will thus also give information on the sensitivity of the calculations to uncertainties in the ethanol emissions Setting the emission factor for NMHC to zero gives the sensitivity to the emission factor of total NMHC Figure A2 shows the differences in ozone concentration as a result of acetaldehyde only and the total NMHC from the E85 car fleet (S2 scenario) We can see that the effect on ozone formation is very small for the Swedish West coast The reason is that the ozone formation in this area is controlled by the availability of NOX while NMHC or rather their degradation products the peroxy radicals that serve as a lsquofuelrsquo to ozone formation are usually in excess here and further VOC emissions do not increase ozone concentrations significantly The situation looks different in areas that are more heavily polluted with NOX andor which is limited in the availability of peroxy radicals The results from this sensitivity study are fully consistent with the observed increase in ozone concentrations as a result of lower NO emissions (the so-called ozone titration) only very close to the major roads but no larger-scale decrease in ozone concentrations in the Gothenburg area or in any other communities
Figure A2 Sensitivity of the ozone formation in the 2 EMEP model grid cells covering Gothenburg (blue) and in the 6 surrounding grid cells (red see Fig A1) to changes in NMHC emission factor of the E85 fuelled cars lsquobasersquo is simulation S2 with EF for NMHC as in Table 3 lsquonoVOCrsquo is S2 with EF for all NMHC = 0 lsquonopAArsquo is S2 with EF for acetaldehyde = 0 a ndash Mean sensitivity in January absolute difference in ozone formation in ppb(V) as a result of NMHC (base-noVOC) and acetaldehyde (base-nopAA) emissions b ndash Sensitivity relative to ozone concentration in the S2-base simulation January c ndash same as a) but June d ndash same as b) but June
‐002
‐001
0
001
base‐noVOC base‐nopAA
ΔO3(ppb)
a)
0
001
002
base‐noVOC base‐nopAA
ΔO
3(ppb)
c)
‐010
‐005
000
005
base‐noVOC base‐nopAA
ΔO
3
b)
000
002
004
006
base‐noVOC base‐nopAA
ΔO
3
d)
A comparison of emissions from ethanol and petrol fuelled cars IVL report B1962 Health risk assessment for Vaumlstra Goumltaland
33
Appendix 3 Emission results
The geographically distributed NOX and acetaldehyde emissions for the Vaumlstra Goumltaland region are presented in Figures A3 and A4 respectively
Figure A3 NOX emissions for the Vaumlstra Goumltaland region for the All Petrol scenario
A comparison of emissions from ethanol and petrol fuelled cars IVL report B1962 Health risk assessment for Vaumlstra Goumltaland
34
Figure A4 Acetaldehyde emissions for the Vaumlstra Goumltaland region for the All Ethanol scenario
A comparison of emissions from ethanol and petrol fuelled cars IVL report B1962 Health risk assessment for Vaumlstra Goumltaland
35
Appendix 4 Dispersion modelling results
The difference in yearly average concentration between scenario S1 and S2 for acetaldehyde and benzene can be seen in Figure A5 and Figure A6 respectively a)
b)
Figure A5 The difference in yearly average concentrations of acetaldehyde for 2020 between the all E85 (S2) and all petrol (S1) scenarios presented as a) microgm3 and as b) percentage for the Gothenburg area
A comparison of emissions from ethanol and petrol fuelled cars IVL report B1962 Health risk assessment for Vaumlstra Goumltaland
36
a)
b) all E85 c) all petrol
Figure A6 a) the difference in yearly average concentrations (gm3) of benzene for 2020 between the all E85 (S2) and all petrol (S1) scenarios yearly means for b) all E85 and c) all petrol (note the different scales)
The difference in the calculated NOX NO2 and ozone concentrations between the two scenarios are shown in Figures A7 A8 and A9
A comparison of emissions from ethanol and petrol fuelled cars IVL report B1962 Health risk assessment for Vaumlstra Goumltaland
37
a)
b)
Figure A7 The difference in yearly average concentrations of NOX for 2020 between the all E85 (S2) and all petrol (S1) scenarios presented as a) microgm3 and as b) percentage for the Gothenburg area
A comparison of emissions from ethanol and petrol fuelled cars IVL report B1962 Health risk assessment for Vaumlstra Goumltaland
38
a)
Figure A8 The difference in yearly average concentrations of NO2 for 2020 between the all E85 (S2) and all petrol (S1) scenarios presented as a) microgm3 and as b) percentage for the Gothenburg area
A comparison of emissions from ethanol and petrol fuelled cars IVL report B1962 Health risk assessment for Vaumlstra Goumltaland
39
a)
b)
Figure A9 The difference in yearly average concentrations of ozone for 2020 between the all E85 (S2) and all petrol (S1) scenarios presented as a) microgm3 and as b) percentage for mainly the Gothenburg area
A comparison of emissions from ethanol and petrol fuelled cars IVL report B1962 Health risk assessment for Vaumlstra Goumltaland
40
Appendix 5 Detailed Exposure data
Detailed exposure data for the difference between the all E85 (S2) and the all petrol (S1) scenarios can be found in Table A5
Table A5 Exposure data for the difference between the all E85 (S2) and the all petrol (S1) scenarios
Acetaldehyde diff E-P (microgm3)
Populated weighted mean
Number of people Percentage of population
0 - 01 627198 582 01 - 02 163394 152 02 - 03 134879 125 03 - 04 88099 82 04 - 05 38686 36 05 - 06 16880 16 06 - 07 7983 07 07 - 08 1248 01 Tot 014 1078367 Benzene diff E-P (microgm3)
Populated weighted mean
Number of people Percentage of population
-03 - -02 26680 25 -02 - -01 205757 191 -01 - -0 845930 784 Tot -0074 1078367 NO2 diff E-P (microgm3) Populated weighted
mean Number of people Percentage of
population -04 - -03 7698 07 -03 - -02 50131 46 -02 - -01 296288 275 -01 - -0 724250 672 Tot -009 1078367 NOX diff E-P (microgm3) Populated weighted
mean Number of people Percentage of
population -06 - -05 7698 -05 - -04 19639 18 -04 - -03 36626 34 -03 - -02 161685 150 -02 - -01 186500 173 -01 - -0 666219 618 Tot -012 1078367 O3 diff E-P (microgm3) Populated weighted
mean Number of people Percentage of
population -02 - -01 779132 723 -01 - -0 266417 247 0 - 01 32818 30 Tot -012 1078367
Exposure data for the total levels in the two scenarios can be found in Table A6
A comparison of emissions from ethanol and petrol fuelled cars IVL report B1962 Health risk assessment for Vaumlstra Goumltaland
41
Table A6 Exposure data for the total levels in the two scenarios
Acetaldehyde tot All ethanol (microgm3)
Populated weighted mean
Number of people Percentage of population
06 - 07 568825 527 07 - 08 171845 159 08 - 09 124551 115 09 - 10 100946 94 10 - 11 59235 55 11 - 12 30559 28 12 - 13 13175 12 13 - 14 7983 07 14 - 15 1248 01 Tot 077 1078367 Acetaldehyde tot All petrol (microgm3)
Populated weighted mean
Number of people Percentage of population
05 - 06 45111 42 06 - 07 1032008 957 07 - 08 1248 01 Tot 065 1078367 Benzene tot All ethanol (microgm3)
Populated weighted mean
Number of people Percentage of population
0 - 01 1055961 98 01 - 02 22406 2 Tot 005 1078367 Benzene tot All petrol (microgm3)
Populated weighted mean
Number of people Percentage of population
0 - 01 729093 676 01 - 02 232961 216 02 - 03 94042 87 03 - 04 21023 19 04 - 05 1248 01 Tot 010 1078367 NOX tot All ethanol (microgm3)
Populated weighted mean
Number of people Percentage of population
0-10 779108 722 10-20 254658 236 20-30 28683 27 30-40 11070 10 40-50 3426 03 50-60 0 00 60-70 0 00 70-80 639 01 80-90 0 00 90-100 0 00 100-110 783 01 Tot 84 1078367 NOX tot All petrol (microgm3)
Populated weighted mean
Number of people Percentage of population
0-10 769557 714 10-20 264209 245 20-30 28683 27 30-40 11070 10 40-50 3426 03 50-60 0 00
A comparison of emissions from ethanol and petrol fuelled cars IVL report B1962 Health risk assessment for Vaumlstra Goumltaland
42
60-70 0 00 70-80 639 01 80-90 0 00 90-100 0 00 100-110 783 01 Tot 85 1078367 O3 tot All ethanol (microgm3)
Populated weighted mean
Number of people Percentage of population
40-45 1422 01 45-50 26487 25 50-55 176636 164 55-60 770370 714 60-65 103452 96 Tot 569 1078367 O3 tot All petrol (microgm3)
Populated weighted mean
Number of people Percentage of population
40-45 1422 01 45-50 20229 19 50-55 181876 169 55-60 763361 708 60-65 111479 103 Tot 570 1078367 PM25 tot All ethanol (microgm3)
Populated weighted mean
Number of people Percentage of population
1-2 0 00 2-3 885325 821 3-4 192259 178 4-5 783 01 Tot 268 1078367 PM25 tot All petrol (microgm3)
Populated weighted mean
Number of people Percentage of population
1-2 0 00 2-3 868773 806 3-4 208811 194 4-5 783 01 Tot 270 1078367
A comparison of emissions from ethanol and petrol fuelled cars IVL report B1962 Health risk assessment for Vaumlstra Goumltaland
5
the Artemis model (Andre 2005) This is a detailed emission model used also in the Swedish reporting of emissions from road traffic and must be considered as the source with the most accurate emission factors for road traffic for Swedish conditions Artemis contains emission factors for the year 2020 which are used in this study Speciation of NMVOC emissions (except for E85 fuelled cars) come from Passant (2002)
The emission scenarios used for Europe are built on EMEPrsquos lsquoCurrent Policyrsquo (CP) scenario for the year 2020 (Vestreng et al 2004) This scenario contains emissions and fuel consumption divided into different source sectors where one is road traffic In order to calculate the emissions for the two scenarios the relative change in emission factors for positive ignition injection cars between petrol and E85 are used
The data available in the EMEP emission database are however not detailed enough for the purpose of this study For example detailed information on the emissions from different vehicle categories is needed Further division of emissions of hydrocarbons on exhaust emission and evaporative emissions are needed as well as a breakdown of PM emissions on exhaust particles and wear particles Therefore a detailed partition of the traffic emissions in the gridded EMEP emission database is done for all countries in the EMEP model domain with help of the data on national emissions in the GAINS model (GAINS 2010) which includes a detailed breakdown of emissions to vehicle categories fuels used etc An exception is made for Sweden where the partition of emissions is calculated with the Artemis model (with the exception of the wear particles that are not covered by Artemis and are taken from GAINS) The GAINS model is an instrument used for policy scenario development and optimisation and contains data of activities (eg fuel and energy consumption) emission factors and emissions from different sources specified for detailed categories This model has a two-way connection to EMEP program in general and to the EMEP model in particular as the transport chemical conversion and deposition matrix for the pollutants emitted from individual countries in GAINS are pre-calculated by EMEP and the future policy scenarios in EMEP are generally consistent with GAINS scenarios as both tools are used for the LRTAP convention and the EU legislation work In the scope of this project it is found that EMEP and GAINS emissions are not fully consistent while the EMEP emission database is based on expert-assessed data reported by the member states the GAINS emissions are based on model calculations The continental scale modelling was based on the EMEP emissions database since this is a gridded database commonly used in EMEP modelling which has its historical scenarios validated within the EMEP monitoring program
While emission factors for petrol cars are relatively well established the data for E85 are much scarcer The Artemis model does not contain detailed emission factors for E85 cars and the situation is similar for the EMEP model The GAINS model considers only zero emissions of CO2 while all other emissions are the same as for petrol To obtain the emission factors for E85 cars data were sought in the open literature (see further below)
23 Traffic data
In order to calculate emissions the emission factors must be applied to data on traffic volumes of the different vehicle categories For Europe the mentioned EMEP policy scenario is used Since the traffic volumes are not available in the EMEP database the relative volumes of traffic in different vehicle categories relative to the total traffic volume are recalculated on national basis using the GAINS model
A comparison of emissions from ethanol and petrol fuelled cars IVL report B1962 Health risk assessment for Vaumlstra Goumltaland
6
For the whole Sweden the traffic prognosis and emissions obtained from the Artemis model are used The results here are very similar to what can be found in the EMEP database which is to be expected since Artemis is used in the Swedish reporting Figure 2 shows the fleet composition in Sweden 2020 from the Artemis model
Figure 2 Contribution of vehicles and fuel categories to the total transport work (vehicle-kilometersyear)
in 2020 in the Artemis model S1-scenario all categories with blue or green colour except the E85 busses use petrol S2-scenario all categories with blue or green colour use E85
For the Vaumlstra Goumltaland region the traffic data for 2005 come from two sources For the city of Gothenburg detailed traffic data are obtained from the local environmental agency For the remaining Vaumlstra Goumltaland region traffic data from the Swedish Transport Administration are used
The changes in all national Swedish emission sources in the EMEP model from year 2005 to 2020 are applied to the emission sources in the inventory for Vaumlstra Goumltaland to produce the 2020 emission scenario
24 Emissions
The emission factors and traffic data are used to obtain emissions in two emissions scenarios S1 where all ignition injection cars are assumed to use petrol and S2 where these cars all use E85 Note that all other road traffic sources such as diesel cars heavy duty vehicles etc are treated in the same way in both scenarios The emissions for Vaumlstra Goumltaland are also calculated for two base-scenarios for 2005 and 2020 where the actual traffic and fuel composition (for 2005) and a prognosis on traffic and fuel composition (for 2020) from the Swedish Transport Administration are used In the impact assessment however only the scenarios with all petrol or all E85 are used
The input of emission data required by the EMEP model consists of annual national emissions The species considered are sulphur dioxide (SO2) nitrogen oxides (NOX = NO+NO2) ammonia (NH3) non-methane volatile organic compounds (NMVOC) carbon monoxide (CO) and
busses dieselampCNG
busses E85
HGV diesel
HGV petrol
LCV diesel
LCV petrol
pass cars dieselCNG LPG hybridpass cars petrol
pass cars E‐85
A comparison of emissions from ethanol and petrol fuelled cars IVL report B1962 Health risk assessment for Vaumlstra Goumltaland
7
particulate matter (PM25 PM10) These emissions are provided for ten anthropogenic source sectors of which only emissions in the road traffic sector changes between the emissions scenarios calculated in this study The emissions are also distributed to vary between months weekdays and over the hours of the day Distribution of the NMVOC emissions between different compounds which are specific to each emission sector and country are used In this study this speciation will vary for road traffic between the scenarios as is described below
For the Vaumlstra Goumltaland region the emissions from traffic and non-road machinery are distributed as 500 m x 500 m grids while emissions from industry and heating plants are treated as point sources (including all physical processes usually connected to that type of sources) Emissions from ships are described as line sources The data are time resolved hourly over the day over the days of the week for each month
25 Dispersion modelling
Effects of the Europe-wide use of the E85 fuel on air pollution in Sweden are studied with two models on two different geographical scales To capture the large-scale changes especially those concerning ozone and other secondary air pollutants the European-scale chemistry transport model EMEP is used (Simpson et al 2003) The effects on exposure of people to air pollutants and consequent health effects are studied using air pollutant concentrations calculated with the small scale dispersion model TAPM which is nudged into EMEP air pollution fields (See Appendix 2 for details) In this way the large scale effects such as formation of ozone secondary PM and secondary aldehydes are accounted for also on the local scale In the case of benzene only the road traffic contribution is calculated due to lack of information on emissions from sources other than traffic
251 Local scale modelling
The TAPM model (Hurley 2008) is used to calculate the local contribution to air pollutants in the Vaumlstra Goumltaland region in the two scenarios The geographically distributed pollutants are then used for the exposure calculations and eventually the health risk assessment TAPM is a three dimensional meteorological and chemical model for air pollution studies that includes topography as well as land-use On the basis of this the model generates the meteorological parameters required for the dispersion modelling such as temperature layering (inversions) and three dimensional wind field all based on daily synoptic input data (large scale meteorological re-analyse data ndashcalled GASP (Global AnalysiS and Prediction) from Australian Government Bureau of Meteorology (wwwbomgovau) TAPM also includes chemistry such as NONO2 ozone SO2 and particle transformation Acetaldehyde and benzene are however not included in the chemical scheme of TAPM and these species are therefore simulated as reactive tracers in this study (see below)
In order to perform the calculations with TAPM a number of input data are required Emission data for the Vaumlstra Goumltaland region as described above Meteorological data Levels of the relevant pollutants on the model domain boundaries for the two scenarios
obtained from the EMEP model A model describing the decay of benzene and acetaldehyde emitted from traffic
A comparison of emissions from ethanol and petrol fuelled cars IVL report B1962 Health risk assessment for Vaumlstra Goumltaland
8
Since acetaldehyde and benzene are not included in the chemical scheme of TAPM their chemical lifetimes are set to be their rate constant with respect to the reaction with OH radicals multiplied by the OH mean concentrations obtained from the EMEP simulations (see below) Four different rates for the four seasons are used according to Table 1
Table 1 Rate constant for reaction with OH and chemical lifetimes for acetaldehyde and benzene used in the TAPM simulations
k(OH) Chemical lifetime (days)
mol-1 cm3s-1
Mar Apr May Jun Jul Aug Sep Oct Nov Dec Jan Feb
Acetaldehyde 15 10-11 12 04 13 155
Benzene 12 10-12 148 49 159 1937
252 EMEP modelling
Several EMEP models are developed and used for air quality policy work in Europe mainly for the Convention on Long-range Trans boundary Air Pollution The Unified EMEP model used in this study is designed to calculate concentrations in air and deposition patterns for major acidifying and eutrophying pollutants photo-oxidants and particulate matter In its standard version it has a 50 km x 50 km resolution in the horizontal direction and 20 layers distributed from the ground up to the pressure level of 100 hPa (ca 16 km) in the vertical direction A detailed description is given in Simpson et al (2003) The meteorological data used for the simulations obtained from wwwemepint are for the year 2005 and are of the same spatial resolution with a time resolution of three hours
As already mentioned the concentration fields generated by the EMEP model are used as an input to the TAPM model Boundary concentration fields for TAPM are calculated from hourly concentrations in the grid cells surrounding the Vaumlstra Goumltaland region that are weighted together with wind field vectors on corresponding boundaries of the Vaumlstra Goumltaland grid cells Since the chemistry of the organic compounds differs between the two models all organic compounds in EMEP are used and recalculated to the reactivity of organic compounds as used by TAPM
While the role of NOX NMVOC and primary PM can be investigated directly by simulations of emission in scenarios S1 and S2 effects of E85 fuelled cars on concentrations of acetaldehyde benzene and secondary PM are obtained from additional sensitivity runs The contribution of the emissions from the use of E85 fuel on acetaldehyde concentrations can be modelled directly in the EMEP model which includes also the formation and consumption of acetaldehyde in atmospheric reactions However TAPM does not include these processes and therefore the role of acetaldehyde formation is investigated further Two additional EMEP simulations are run one excluding primary acetaldehyde emissions and one excluding all NMVOC emissions from petrol and E85 fuelled vehicles By relating the results of these runs to the results of S1 and S2 the contribution of primary and secondary acetaldehydes respectively can be deduced The results from this analysis can be found in Appendix A23 The conclusion is that on the scale of the Vaumlstra Goumltaland region the formation of acetaldehydes in the atmosphere is not important and therefore the acetaldehyde concentration in TAPM can be described using the lifetimes given in Table 1 Further also the impact of the NMHC emissions on the ozone levels is studied (Appendix 23) and found to be small
Benzene is not included explicitly in the EMEP model The benzene concentrations are therefore studied in sensitivity runs with benzene from road traffic added to the S1 and S2 scenarios as
A comparison of emissions from ethanol and petrol fuelled cars IVL report B1962 Health risk assessment for Vaumlstra Goumltaland
9
methanol which has similar atmospheric lifetime as benzene The benzene concentration is then obtained by comparing the methanol concentration from the different runs
The contribution of primary and secondary PM respectively is investigated by excluding the primary PM from petrol and E85 fuelled vehicles in separate runs of the EMEP model The PM boundary values for the TAPM modelling are not separated into secondary and primary PM The results from this analysis are used to draw general conclusions about the difference in secondary PM formation between the two scenarios
26 Exposure
The human exposure of the annual mean concentrations of NOX NO2 O3 acetaldehyde and benzene are calculated based on the dispersion calculations of the Vaumlstra Goumltaland area in combination with the population density The population density distribution for the region is obtained from EEA (EEA 2009) and shown in Figure 3 The total population in the investigated area is 1 078 400
Figure 3 Population density distribution (number of people in a 1 km x 1 km grid for 2006) for the investigated area (according to Figure 1)
A comparison of emissions from ethanol and petrol fuelled cars IVL report B1962 Health risk assessment for Vaumlstra Goumltaland
10
27 Health effects and risk assumptions
271 NOX and NO2
Using modelled levels of NOX in the residential area as a vehicle exhaust marker a Norwegian study of 16 000 men from Oslo of whom 25 died during the follow up found a strong association (Nafstad et al 2004) This cohort with people of between 40-49 years of age at the start of the study was followed from 197273 through 1998 NOX was estimated in a model with 1000 m grids and a street contribution added for the largest streets When the median concentration of NOX for 1974-78 was used (mean 107 μgm3) the relative risk for total non-violent mortality was 8 per 10 μgm3 Nitrogen oxides do not have to be important as causal components behind this association
272 Ozone
Short-term effects of ozone on the respiratory system and on daily number of deaths have been reported from a large number of studies especially for summer concentrations why a threshold has sometimes been assumed in impact assessments Only recently has an effect of long-term exposure on mortality been reported from the very large American Cancer Society (ACS) Cohort Study (Jerret et al 2009)
Jacobson (2007) reported that E85 would cause an increase in mortality but assumed an effect of short-term exposure only The estimated impact was explained by the calculated ozone formation
273 Acetaldehyde
An increased incidence of nasal tumours in rats and laryngeal tumours in hamsters were observed after inhalation of high concentrations of acetaldehyde (HEI 2007) A few epidemiological studies of occupational exposure found associations but with a complex mixture of chemicals and have not been used in the cancer risk assessment for acetaldehyde Acetaldehyde is classified by the National Institute of Occupational Safety and Health as ldquoa potential human carcinogenrdquo by the US EPA (1999) as ldquoa probable human carcinogenrdquo and by the IARC as ldquopossibly carcinogenic to humansrdquo (OEHHA 1999 HEI 2007)
274 Benzene
There is clear and widely accepted evidence from a variety of epidemiologic studies of occupational exposure that benzene increase the risks of acute myeloid leukaemia (HEI 2007) but there is more uncertainty about other lymph hematopoietic cancers Studies on traffic exposure and childhood leukaemia have produced mixed results with regard to associations
275 Formaldehyde
IARCrsquos Monograph 88 says that the evidence is sufficient to conclude that formaldehyde causes cancer in humans (IARC 2006) This was because of evidence of nasopharyngeal cancer at concentrations historically encountered in industrial settings However this conclusion by IARC was largely based on the results from one occupational exposure site and the results and conclusions have not been supportive in other reviews and more recent studies (Bosetti et al 2006 Beane Freeman et al 2009 Bachand et al 2010) OEHHA (1999) uses a lifetime risk for cancer of 0000006 per microgm3 for formaldehyde and US EPA (1999) a lifetime risk of 0000013 per microgm3
A comparison of emissions from ethanol and petrol fuelled cars IVL report B1962 Health risk assessment for Vaumlstra Goumltaland
11
For non-cancer effects the eye is the organ most sensitive to formaldehyde subjective irritation has been reported at 300-500 microgm3 which is above the odour thresholds (Wolkoff amp Nielsen 2010) Effects in the eyes and in airways occur around 600ndash1000 μgm3 Effects on lung function have not been found in controlled human exposure studies below 1 mgm3 In epidemiological studies of associations between formaldehyde and exacerbation of asthma several co-pollutants make the findings difficult to interpret An indoor air quality guideline of 100 μgm3 has been considered protective against both acute and chronic sensory irritation in the airways in the general population assuming a lognormal distribution of nasal sensory irritation (Wolkoff amp Nielsen 2010)
276 PM
In the studies of long-term exposure to PM25 and mortality like the American Cancer Society (ACS) Cohort the exposure contrast were mainly related to secondary PM why the reported relative risk approx 6 increase in all-cause mortality (in adults) per 10 μgm3 is most relevant for background secondary PM concentrations (Pope et al 1995)
277 Health Impact Assessment
To summarize the types of pollutants that are found possible to include in the health impact assessment are NOX and NO2 benzene acetaldehyde formaldehyde secondary PM and ozone The assessment is restricted to the most important and well established effects of these pollutants This means that not all types of potential health impacts are included Results should however do for a comparison of the scenarios
The impact on formaldehyde levels are not calculated why it is not included in the current assessment Relative risks from epidemiological studies of vehicle exhaust using NOX and NO2 as exposure variables may be influenced from effects of their co-pollutants mainly ultrafine particles (elemental carbon soot) CO and HCs such as formaldehyde Exhaust particles are often introduced in a relatively high background of particles from other sources Thus exhaust particles were not measured directly in the important studies of long-term exposure and effects on mortality
3 Results
31 Emission factors
The emission factors are selected from available published data both for the exhaust and the evaporative emissions In both cases values relative to petrol are used The majority of the studies have been done with both E85 and petrol making this comparison more robust
Westerholm et al (2008) tested two flexi-fuel cars with E5 E70 and E85 in the European driving cycle NEDC and in the Artemis driving cycles The former is used at two temperatures (22degC and -7degC) They report the regulated emissions greenhouse gases a number of organic compounds and particle number Graham et al (2008) present measurement results for regulated emissions greenhouse gases and a number of organic compounds from four cars with E85 and regular petrol in the FTP cycle They also made a compilation of literature data for ethanol cars Yanowitz and McCormick (2009) present an analysis of US certification testing data in order to compare emissions for E85 and petrol
A comparison of emissions from ethanol and petrol fuelled cars IVL report B1962 Health risk assessment for Vaumlstra Goumltaland
12
The results from the three studies (for flexi fuel cars) and in addition the values used by Jacobson (2007) are given in Table 2
Table 2 Emissions factors for E85 fuelled cars relative to the emission factors for petrol fuelled cars
Relative change E85 vs petrol ()
Yanowitz and McCormick (2009) (95 conf)
Graham et al (2008) (sd )
Westerlund et al (2008) (average for NEDC)
Jacobson (2007)
NOX -14 (-23 - -5) -42 (15) -38 -30 NMOG 26 (17 - 37) 12 (39) NMHC -43 (-52 - -32) -45 (24) THC -14 (-24 - -4) 2 TOG 22 CO -19 (-25 - -12) -5 (51) 1 5 PM 25 0 Formaldehyde 59 (32 - 91) 80 (44) 184 60 Acetaldehyde 2855 (1189) 1031 2000 13 Butadiene -64 (31) -74 -10 Benzene -72 (15) -71 -79 Ethanol 3950 from TOG Methane 50 43
Table 2 shows lower emissions of NOX for E85 fuelled cars relative to petrol fuelled cars from test cycles generally including cold starts The emissions of hydrocarbons are higher for petrol while the emissions of organic gases are somewhat higher for E85 The emissions of aldehydes especially acetaldehyde are much higher for E85 as are the emissions of ethanol and methane The emissions of benzene and 13-butadiene are higher with petrol It should be noted that the data in Table 2 are in general for tests performed at ambient temperatures of around 20 degC Westerlund et al (2008) report that for ambient temperatures of -7 degC the emissions of CO and NMHC may be significantly higher with E85 compared with petrol For one vehicle they also report very high NOX emissions with petrol at this lower temperature
As seen in Table 2 there are a number of different quantities when it comes to the emission of organic compounds or unburnt fuel From a chemistry point of view HC is no molecule but a notation for the sum of all compounds that are hydrocarbons thus are of the form HxCy and not containing any elements but carbon and hydrogen Total organic gases (TOG) include organic compounds containing oxygen such as alcohols and aldehydes (but not CO or CO2) Volatile organic compounds (VOC) means carbon containing organic compounds present in the gaseous state at ambient temperature Non-methane hydrocarbons (NMHC) means HC minus the methane mass NMTOG and NMVOC are defined in the corresponding way1
1 When it comes to exhaust gas regulations the definitions differ somewhat In the US THC is defined as the signal obtained from a FID (Flame Ionisation Detector) instrument calibrated on propane This means that alcohols and aldehydes contribute to THC but to a lower extent since their responses in a FID instrument are lower than for hydrocarbons TOG is defined in the US regulations as THC + the mass of alcohols (eg methanol) and carbonyls (eg formaldehyde) measured separately NMHC is equal to THC ndash rCH4CH4 ndashralcAlc where the CH4-concentration is measured by gas chromatography and a FID calibrated with methane Alc is the alcohol concentration and rCH4curren and rAlc are the respective FIDresponse functions NMOG means TOG - CH4 and VOC is TOG - CH4 - C2H6 In the regulations it is stated that also a number of other non-ozone forming organic compounds eg acetone should be subtracted but these are present in very low concentrations in engine exhaust Note that there is actually a double counting of aldehydes in NMOG since they contribute to a certain extent to the NMHC value and then are added using values from separate measurements
A comparison of emissions from ethanol and petrol fuelled cars IVL report B1962 Health risk assessment for Vaumlstra Goumltaland
13
There will be emission limits for both THC and NMHC in also the future For petrol cars with low methane emissions the challenge will be to meet the limit for NMHC For E85 cars with higher methane emissions the challenge will be to meet the THC limit Thus it is reasonable that the emissions of NMHC from E85 cars will be lower than for petrol cars
In the modelling presented here the emission factors from Graham et al (2008) are used with some exceptions as will be discussed The reason is that that study comprises a compilation of a relatively large number of tests For CO the emission factor is set to the same value for E85 and petrol since the differences are small and within the uncertainty For particle emissions the studies cited in Table 2 give little information Instead data from Ericsson et al (2008) are used indicating that the primary PM emission using E85 is about 65 of that when using petrol For NOX the emission for E85 is set to 58 of that for petrol
The emission factors for NMHC (physical emission in gkm) including ethanol are in this study set to the same value for E85 as for petrol This is in line with the data for NMOG reported by Graham showing only small differences It is also reasonable considering that the car producers optimize emissions to meet the future emission legislation in Europe for NMHC and THC i e the Euro 6 standards that apply from September 2014 For petrol with low CH4 emissions the NMHC value will be limiting and this is on 68 mgkm For E85 with higher CH4 emissions the THC value of 100 mgkm will be limiting When considering the FID response as a measure of emission instead of physical emission about 50 of the THC comes from NMHC for E85 cars However the FID response is low for ethanol which means that the physical NMHC emission is about 25 higher Considering these factors the emissions of NMHC (physical) for E85 can be expected to be around 50 mgkm 125 = 625 mgkm which is about the same as for petrol The methane emission for E85 is set to 142 times the value for petrol following Lipman and Delucchi (2002) Further also the differences in the evaporate emissions are considered as is described in Appendix 1
The emissions factors for petrol cars are taken from the Artemis model (Andreacute 2005) The distribution of NMHC for petrol cars is from Passant (2002) The resulting emission factors used to obtain the emissions scenarios are presented in Table 3
In Europe THC is defined as the signal from a propane calibrated FID and thus contains oxygen containing compounds although the response factors for the latter are lower The FID instrument gives the number of molecules and in order to calculate the mass the EU regulations use the densities obtained from assuming the molecular formulas C1H274O0385 (209 gmole) for E85 and C1H189O0016 (1415 gmole) for petrol This thus compensates for the lower response factor for ethanol and acetaldehyde NMHC is obtained by subtracting the concentration of CH4 (times the FID response factor) measured separately
A comparison of emissions from ethanol and petrol fuelled cars IVL report B1962 Health risk assessment for Vaumlstra Goumltaland
14
Table 3 Emission factors (gkm) for 2020 for passenger cars (including evaporative emissions but excluding wear particle emissions) used in the modelling
Petrol E85 NOX 0112 0065 CO 179 174 PM 00013 00008 CH4 0013 0018 NMHC 033 028
division of NMHC Ethanol 00000 01898 Acetaldehyde 00025 00299 Ethene 00244 00237 Ethyne 00094 00011 Formaldehyde 00057 00072 Benzene 00187 00045 13 Butadiene 00030 00009 Ethane 00107 00009 Alkanes C3+ 00928 00076 Alkenes C3+ 00301 00025 Aromatics C7+ 01297 00106 Aldehydesketones C3+ 00051 00004
sum NMHC 03321 02792
32 Emissions
The emissions from road traffic vary between the two scenarios due to the differences in the emission factors From the EMEP modelling the total emissions from road traffic in the different scenarios are calculated for the countries included In Figure 4 emissions of NOX NMVOC and PM in the S2 (E-85) scenario relative to the S1 (all-petrol) scenario are shown for these countries The relative change is larger for countries with a high fraction of petrol cars relative to diesel cars (since the latter are the same in the two scenarios) such as Russia and Ukraine The relative change is smallest for PM emissions due to the very small contribution of the exhaust particles from petrol fuelled cars compared to the contribution from diesel vehicles and wear particles
A comparison of emissions from ethanol and petrol fuelled cars IVL report B1962 Health risk assessment for Vaumlstra Goumltaland
15
Figure 4 National emissions of NOX NMVOC and PM from the road traffic sector in E85 scenario (S2)
relative to lsquoall-petrolrsquo scenario (S1)
An important difference in the emissions between the scenarios lies in the speciation of the NMVOC emissions Figure 5 shows this speciation of NMVOCs for all road traffic emission categories used in this study The two rightmost bars in Figure 5 show the NMVOC speciation for Swedish road traffic emissions for the two scenarios S1 and S2 Comparison with Figure4 shows that the relative changes between the two scenarios are much larger for some individual NMVOC species that for the total NMVOC emissions Since the NMVOC emissions from traffic in Sweden are dominated by the emissions from petrol cars (about 85 of the road traffic emissions of NMVOC comes from petrol cars) the variations in NMVOC speciation between petrol and E85
0
02
04
06
08
1
NOx
0
02
04
06
08
1
NMVOC
0
02
04
06
08
1
Aus
tria
Bel
arus
Bel
gium
Bos
-Her
cB
ulga
riaC
roat
iaC
ypru
sC
zech
Rep
Den
mar
kE
ston
iaFi
nlan
dFr
ance
Ger
man
yG
reec
eH
unga
ryIr
elan
dIt
aly
Lat
via
Lith
uani
aL
uxem
bour
gM
alta
Net
herla
nds
Nor
way
Pola
ndPo
rtug
alR
oman
iaR
ussi
a_E
uro
Slov
ak R
epSl
oven
iaSp
ain
Swed
enSw
itzer
land
Tur
key
Ukr
aine
UK
PM
A comparison of emissions from ethanol and petrol fuelled cars IVL report B1962 Health risk assessment for Vaumlstra Goumltaland
16
will have a significant impact on the total road traffic NMVOC speciation As can be seen in Figure 5 scenario S1 is dominated by alkanes and aromatics while scenario S2 is dominated by ethanol It can also be noted that S1 contains a significant emission of benzene which is much lower in S2 while the opposite is true for acetaldehyde
Figure 5 Distribution of hydrocarbon species in NMVOC emissions from individual road traffic emission
categories as defined in emission scenarios in this study and from the whole road traffic emission sector in Sweden for scenarios S1 (All petrol) and S2 (All E85)
Figure 6 shows a map of the EMEP domain with emissions of acetaldehyde for the two studied scenarios as an example of the geographical distribution of emissions
Figure 6 Gridded emissions of acetaldehyde for the year 2020 (in tonnes per grid cell (50 km x 50 km)
and year) a ndash lsquoAll petrol scenario b ndash lsquoAll E85 scenariorsquo
As mentioned the emissions from road traffic in the Vaumlstra Goumltaland region are calculated in a 500 m x 500 m grid Figure 7 shows the emissions of NOX for 2005 as obtained from the database and the projected emissions for 2020 with a mixed use of E85 and petrol This can be considered as the base case for the emissions in 2020 It can be seen that the emissions decrease over the period which is due to reduction in NOX emissions factors as older vehicles are replaced by newer models (the traffic actually increases from a total of 754x109 vehicle-kilometres in 2005 to 937x109
0
20
40
60
80
100
Pet
rol e
xh
Pet
rol e
vap
E-8
5 ex
h
E-8
5 ev
ap
Pet
rol M
C
Die
sel L
DV
Die
sel H
DV
Roa
d Sw
eden
S1
Roa
d Sw
eden
S2
m
ass
Ethane
Alkanes C3+
Ethene
13 Butadiene
Alkenes C3+
Ethyne
Benzene
Aromatics C7+
Formaldehyde
Acetaldehyde
Aldket C3+
Ethanol
A comparison of emissions from ethanol and petrol fuelled cars IVL report B1962 Health risk assessment for Vaumlstra Goumltaland
17
vehicle-kilometres in 2020) The major roads in the region are clearly visible as well as the larger cities (especially Gothenburg)
Figure 7 Emissions of NOX (kgyear for a 500 m x 500 m grid cell) in the Vaumlstra Goumltaland region for 2005
and for 2020 for the base case
In Table 4 the traffic emissions for NOX benzene acetaldehyde ethanol and PM10 for the Vaumlstra Goumltaland region are shown for the four different emissions scenarios The emissions of NOX and benzene are reduced between 2005 and 2020 for the base case while the emissions of ethanol and acetaldehyde increase due to an expected increase in the use of ethanol fuel The NOX emissions for S1 are somewhat higher than for S2 due to the higher NOX emissions factor for petrol compared with E85
Table 4 Emissions from traffic for the Vaumlstra Goumltaland region in four different emission scenarios (in tonnesyear)
Substance base 2005 base 2020 S1 S2 NOX 13 243 4 843 4 954 4 631 Benzene 2 833 927 1 201 386 Acetaldehyde 628 1 074 305 2 595 Ethanol 192 5 192 0 15 400 PM10 1 324 486 483 476
33 Dispersion modelling
Resulting concentrations from calculations of the S1 and S2 scenarios with the EMEP model are used to provide input of primary and secondary air pollutants for the calculations with the TAPM model for the Vaumlstra Goumltaland region Concentrations of NOX NMVOC PM25 PM10 acetaldehyde ethanol and benzene are therefore calculated as boundary conditions for the Vaumlstra Goumltaland region In addition sensitivity studies are performed to investigate the role of formation of secondary acetaldehyde and secondary particulate matter (see Appendix 2) Time series analysis of the TAPM and EMEP model results of the S1 and S2 scenarios are presented in Figure 8
A comparison of emissions from ethanol and petrol fuelled cars IVL report B1962 Health risk assessment for Vaumlstra Goumltaland
18
a)
b)
Figure 8 Time series analyses of S1 and S2 scenarios for the EMEP and TAPM modelled concentrations of NOX and ozone at an urban background site in Gothenburg (TAPM) and in EMEP model grid cells including Gothenburg city (50 km x 50 km)
Concentrations of NOX and ozone at an urban background site in Gothenburg (TAPM) and in the 50 km x 50 km EMEP grid cells including Gothenburg are compared for one summer and one winter month Due to the well-known process of ozone titration by freshly emitted nitrogen monoxide (Seinfeld and Pandis 1998) the concentration of ozone often decreases in urban areas This phenomenon is expected to be captured by the fine-gridded TAPM model but not necessarily by the courser scale of the EMEP model Figure 8 shows the generally higher NOX levels in the small grid cell of the TAPM model in urban background location comparing to those in the large EMEP grid cell while the opposite is observed for the ozone concentrations (Remember that the boundary concentrations for TAPM are obtained from the EMEP model and they are thus the same in both cases) This indeed shows that local scale emissions and processes contribute to locally increased levels of NOX in urban areas both for the summer and the winter cases For ozone where there of course are no primary emissions the situation is the opposite where instead the result is decreased concentration levels at urban sites on a local scale The influence of the
A comparison of emissions from ethanol and petrol fuelled cars IVL report B1962 Health risk assessment for Vaumlstra Goumltaland
19
NMHC emissions from the passenger cars is studied in a sensitivity analysis (see Appendix 23) and it is found to have only a small influence on the ozone levels
To illustrate the results of the different scenario calculations the geographically distributed concentrations are presented as the difference in yearly average concentrations between the all E85 (S2) and all petrol (S1) scenarios both as microgm3 and sometimes as percentage of the difference to scenario S1 (see Appendix 3)
The difference in yearly average concentrations between scenario S1 and S2 for acetaldehyde and benzene can be seen in Figures 9 and 10 respectively The increase in acetaldehyde concentration resulting from a switch from petrol to E85 is up to about 05 gm3 or 80 in the central parts of the largest urban area of the region Gothenburg Outside this area the relative increase is about 10 for the other urban areas and less than that for the rural areas This large relative increase (see map in Appendix 4) is a result of the relatively high emissions of acetaldehyde from E85 fuelled cars For benzene the situation is opposite In the scenarios for 2020 the concentration of benzene decreases by up to a few tenths of gm3 as a result of a switch from petrol to E85 For benzene the relative change is not calculated
Figure 9 The difference in yearly average concentrations of acetaldehyde for 2020 between the all E85 (S2) and all petrol (S1) scenarios (microgm3)
A comparison of emissions from ethanol and petrol fuelled cars IVL report B1962 Health risk assessment for Vaumlstra Goumltaland
20
Figure 10 The difference in yearly average concentrations (gm3) of benzene for 2020 between the all E85 (S2) and all petrol (S1) scenarios
The difference in the calculated NOX NO2 and ozone concentrations between the two scenarios are shown in Appendix 4 The change in NOX concentration between the two scenarios only represents a small fraction of the total NOX concentration This is because the emissions of NOX from petrol cars are relatively low compared with the contribution from diesel engines and other sources Thus the resulting decrease in the NOX concentration with E85 is only up to 3 For ozone there is a small increase of about 01 microgm3 of E85 in the central areas of Gothenburg where there is relatively high traffic intensity (see Appendix 4 Figure A9) In the rest of the region there is a small decrease in the ozone concentration in the E85 scenario
34 Exposure
The resulting concentrations from the dispersion modelling together with the population density distribution are used to assess the exposure to acetaldehyde benzene NO2 NOX and ozone for the two scenarios S1 and S2 The exposure to PM25 is very similar for the two scenarios (the difference in concentration between scenarios S2 and S1 is only about -002 gm3 Table 5 shows the population weighted mean exposure both as total concentrations and as the difference between the two scenarios Detailed exposure results can be found in Appendix 5 It can be seen that the exposure to all the pollutants in Table 5 with the exception of acetaldehyde are somewhat lower for the all E85 scenario (S2) than for the all petrol scenario (S1) However the effect on health also
A comparison of emissions from ethanol and petrol fuelled cars IVL report B1962 Health risk assessment for Vaumlstra Goumltaland
21
depends on the level of the dose-response functions For example if the level of concentration is low in a populated area but the dose-response function is high the effect of even a low concentration increase can become important The increase in exposure from S1 to S2 (S2-S1) calculated as percentage of the population exposed to increased mean concentrations of pollutants is presented in Figure 11
Table 5 Populated weighted mean exposure (gm3)
S1 S2 S2-S1 Acetaldehyde 065 077 014 Benzene 01 005 -007 NOX 85 84 -012 Ozone 570 569 -012 PM25 270 268 -002
Increased concentrations Decreased concentrations Both increased and
decreased conc
Figure 11 The relative exposure (S2-S1) calculated as percentage of the population
In Figure 11 it is clear that the only pollutant that does not show an improvement regarding air quality and thus the health risks when modelling a switch from petrol to E85 is acetaldehyde For all pollutants except for ozone the changes of concentration levels observed between the scenarios are within the urban areas but for ozone there are also differences in rural areas
According to the data in Figure 11 about 14 of the population in the Vaumlstra Goumltaland region will be exposed to 03-08 microgm3 higher concentration levels of acetaldehyde in scenario S2 relative to S1 From Figure 9 it can be seen that the majority of these people live within the Gothenburg area Further about 28 of the population will be exposed to increased levels of between 01 to 03 microgm3 mainly in the suburban areas and rural surroundings of Gothenburg but also in some of the smaller cities in the region Outside the urban areas the concentration difference is lower than 01 microgm3
In the S2 scenario relative to the S1 scenario the population is exposed to decreased concentration levels of benzene and NOX This is mainly true also for O3 but with an exception for the central
A comparison of emissions from ethanol and petrol fuelled cars IVL report B1962 Health risk assessment for Vaumlstra Goumltaland
22
parts of Gothenburg where the concentration actually increases (see Appendix 4 Figure 7A) resulting in that 3 (blue area in Figure 11 for O3) of the population will be exposed to higher concentrations of O3 For the rest of the area there are decreased concentrations of ozone upon a switch to E85
The largest differences are again in the central parts of Gothenburg where about 20 of the population is being exposed to a lower benzene concentration of 01-03 microgm3 This also means that concerning benzene the majority (78) of the population have none or very low influence from a change to ethanol fuel
The largest effect on exposure difference is seen for NOX where just over 20 of the population has its exposure decreased with 03-05 microgm3 (in the central parts of Gothenburg) In the suburbs the decrease is between 01-02 microgm3 lower Along the largest roads there is a small but visible improvement on a yearly basis of 01 microgm3
For PM25 there is a difference in the populated weighted mean exposure of 002 gm3 between the scenarios with a lower value for the all-E85 case (see also Appendix 5)
35 Impact on health in Vaumlstra Goumltaland
351 NO2 and NOX
The impact of long-term exposure on mortality was estimated using the relative risk from the Norwegian cohort study (Nafstad et al 2004) reporting a relative risk of 08 increase per microgm3 increase in NOX however without adjustment for particle concentrations Assuming this effect on the total mortality and a typical baseline mortality of 1000 deaths per 100 000 person years a decrease in the population mean exposure of 012 microgm3 would correspond to approximately 104 less preterm deaths per year However for the present case this number is highly uncertain since the exposure to substances normally associated with changes in NOX exposure may here change in different ways since the relation between different exhaust components varies between the scenarios
The impact of long-term exposure on asthma incidence (new cases) in adults has been estimated using results from the Swedish RHINE Study Cohorts (Modig et al 2009) with very similar results in the ECRHS Study corresponding to approx 4 increase per microgm3 increase in NO2 From the RHINE Study the incidence can be estimated to 03 per year (proportion of adults developing the disease) with children and elderly excluded this means around 1500 adult cases per year A reduction of 009 microgm3 corresponds to 54 avoided new cases of adult asthma per year However also NO2 in the asthma study may have been mainly an indicator of vehicle exhaust
352 Ozone
The impact of long-term exposure on respiratory mortality has been reported to be approx 02 per microgm3 increase in the summer concentration when studied in the large ACS Cohort (Jerret et al 2009) Assuming this effect on the total population and a typical baseline respiratory mortality of 100 deaths per 100 000 person years a decrease in the population mean exposure of 012 microgm3 corresponds to approximately 03 less preterm deaths per year
A comparison of emissions from ethanol and petrol fuelled cars IVL report B1962 Health risk assessment for Vaumlstra Goumltaland
23
353 Acetaldehyde
According to US EPA (1999) a lifetime risk for cancer of 0000002 per microgm3 is to be assumed for this potential human carcinogen An increase in the population mean exposure of 012 microgm3 corresponds to 026 cases more per year in the current population
354 Benzene
According to US EPA (1999) a lifetime risk for cancer (leukaemia) of 00000022-00000078 per microgm3 is to be assumed for this human carcinogen A decrease in the population mean exposure of 0074 microgm3 corresponds to approximately 03 cases less per year in the current population (assuming 0000004 per microgm3)
355 PM25
In CAFEacute and other impact assessments a relative risk of 6 increase in all-cause mortality per 10 microgm3 has usually been assumed Assuming this effect on the total mortality and a typical baseline mortality of 1000 deaths per 100 000 person years a decrease in the population mean exposure of 002 microgm3 corresponds to approximately 13 less preterm deaths per year
4 Discussion
In this study the health risks from a large introduction of E85 to replace petrol is analysed in scenario studies for 2020 for the Vaumlstra Goumltaland region It is found that the change in pollutant concentration exposure and health risks are small between the two scenarios It should be emphasized that the study only considers vehicle emissions and does not take into account effects from the fuel production
The emissions of NOX in the model are somewhat lower from E85 fuelled cars than from petrol fuelled cars This is in line with the emission factors used by Jacobson (2007) The nitrogen oxides are key substances in the atmospheric reactions determining the concentrations of ozone in air NOX is involved in the formation of ozone but close to the NO source the ozone concentration is lowered due to the rapid reactions between NO and O3 forming NO2 If NO is released in an environment with already high NO concentration it may result in lowering of ozone levels on the regional scale In the present study the ozone concentrations calculated are somewhat lower for the E85 scenario than for the petrol scenario
The health risk analysis shows that the main difference between the scenarios is due to the lower concentration of NOX However it may have been other exhaust components than NOX such as exhaust particles that were behind the reported association with mortality In cases when NOX is not a good indicator of exhaust particle emissions and their toxicity our results may be misleading This should be studied further Neglecting the effects of the changes in NOX exposure the total difference between the scenarios sums up to 16 preterm deaths per year with lower values for the E85 scenario while it would sum up to 12 less preterm deaths for the E85 scenario if the effect related to NOX were included Since there are no similar studier for the effect on mortality among those younger than 30-50 years of age we assume the same relative effect on mortality in all ages This makes only a small difference since the large majority of deaths occur in older groups
A comparison of emissions from ethanol and petrol fuelled cars IVL report B1962 Health risk assessment for Vaumlstra Goumltaland
24
The opposite result for the ozone concentration was obtained by Jacobson The reason for this discrepancy is that the Jacobson study concerns Los Angeles a region with high concentrations of pollutants while the study here concerns the Vaumlstra Goumltaland region with much less dense traffic and also lower concentrations of pollutants importantly NOX It is not unlikely that the effect that Jacobson report also would be found for large parts of Europe with higher traffic densities than in the Vaumlstra Goumltaland region
It is worth to emphasize that the major negative health effect in the Jacobson (2007) study is attributed to the increase in ozone concentration that is a result of the decrease of the NO emissions from E85 cars Directly after the emission NO reacts with ozone resulting in drop of the ozone concentration the so-called ozone titration commonly observed in many cities This NO does however form even higher quantities of ozone further downwind contributing to the general increase in the background ozone levels It is also precursor of NO2 secondary PM and other toxic species as eg PAN and hence reductions in NO emissions are never regarded as disbeneficial from the environmental viewpoint
There are of course several sources of uncertainties that influence the results of this study Since the main results concern differences between the two scenarios several of these factors loose on importance for the conclusions This comprises uncertainties in meteorology in future traffic volumes and in the population density distribution However there are some uncertainties that remain important The emission factors for E85 fuelled cars are much less characterised than what they are for petrol cars The emission of particles from E85 fuelled cars is especially uncertain with only very few published results Also the emissions of NMHC are somewhat uncertain and may be higher for E85 at lower ambient temperatures However the sensitivity analysis performed shows that for the studied region the NMHC emissions only have a small influence on the ozone concentrations
5 Conclusions
In this study the impact of tailpipe and evaporative emissions from E85 fuelled cars on air pollution and health risks are calculated and compared with petrol fuelled cars The scenario calculations for the Vaumlstra Goumltaland Region give data on emissions pollutant concentrations exposure and a health risk evaluation
The differences in emission factors between E85 and petrol lies in the emissions of PM and NOX which are about 65 and 58 for E85 relative petrol respectively Also the speciation of the emitted hydrocarbons is significantly different with large emissions of acetaldehyde and ethanol from E85 and large emissions of benzene higher aromatics alkanes and alkenes from petrol
These differences in emission factors reflect in differences in emissions The emission calculations for all Swedish road traffic show a decrease for the E85 scenario relative to the petrol scenario of 65 for NOX 34 for PM25 67 for benzene For acetaldehyde there is an increase of 770
The differences obtained from the TAPM modelling show decreased levels of NOX ozone and benzene with E85 and increased levels of acetaldehyde For the latter the increase may be up to 80 while NOX and ozone show decreases of up to a few per cent and a few tenths of per cent respectively
A comparison of emissions from ethanol and petrol fuelled cars IVL report B1962 Health risk assessment for Vaumlstra Goumltaland
25
The health risk assessment shows decreased health risks in the E85 scenario relative the all-petrol scenario due to the increased NOX exposure correlated with both preterm deaths and asthma However NOX may be mainly an exhaust indicator Smaller effects are expected from the changes in ozone acetaldehyde and benzene exposure The overall difference considering the exposure to PM acetaldehyde benzene and ozone is 16 preterm deaths with lower values for the E85 scenario
6 Acknowledgements
Saab Automobile The Swedish Transport Administration and The Foundation for the Swedish Environmental Research Institute are gratefully acknowledged for financial contribution
Magnus Ekstroumlm and Maria Holmstroumlm at Saab and Martin Juneholm at the Swedish Transport Administration are acknowledged for their most valuable input to the study
David Simpson Norwegian Meteorological Institute EMEP MSC-W Norway and Dept Radio amp Space Science Chalmers Univ Technol Sweden is gratefully acknowledged for help with implementation of the Unified EMEP model
A comparison of emissions from ethanol and petrol fuelled cars IVL report B1962 Health risk assessment for Vaumlstra Goumltaland
26
7 References
Altenstedt J Pleijel K 2000 An alternative approach to photochemical ozone creation potentials under European conditions J Air amp Waste Manage Assoc 50 1023 ndash 1036
Andre J-M (2005) Vehicle emission measurement collection of the ARTEMIS datatbase Artemis 3312 report Available from httpwwwinretsfrurltepublicationspublications-pdfJoumardA3312reportJMALTE0504pdf
Bachand A MMundt K A Mundt D JMontgomery R R Epidemiological studies of formaldehyde exposure and risk of leukemia and nasopharyngeal cancer A meta-analysis Critical Reviews in Toxicology 2010 40(2) 85ndash100
Beane Freeman L E Blair A Lubin J H Stewart P A Hayes R B Hoover R N Hauptmann M Mortality from lymphohematopoietic malignancies among workers in formaldehyde industries The National Cancer Institute Cohort J Natl Cancer Inst 2009101751ndash761
Bosetti C McLaughlin J K Tarone R E Pira E LaVecchia C Formaldehyde and cancer risk A quantitative review of cohort studies through 2006 Ann Oncol 20081929ndash43
ConcaweJRC Well-to-wheel studies httpiesjrceceuropaeuwtwhtml
Derwent R G Jenkin M E Saunders S M 1996 Photchemical ozone creation potentials for a large number of reactive hydrocarbons under European conditions Atmos Environ 30 181 ndash 199
Derwent RG Jenkin ME Passant NR Pilling MJ 2007 Photochemical ozone creation potentials (POCPs) for different emission sources of organic compounds under European conditions estimated with a Master Chemical Mechanism Atmos Env 41 2570ndash2579
EEA Copenhagen 2009 wwweeaeuropaeudata-and-mapsdatapopulation-density-disaggregated-with-corine-land-cover-2000-2
Ericsson P Holmstroumlm M Amberntsson-Carlsson A Ohlson C Skoglundh M Andersson B Carlsson P-A 2008 Characterization of particulate emissions and methodologhy for oxidation of particulates from non-diesel combustion ystems SAE Technical Paper Series 2008-01-1746
GAINS 2010 httpgainsiiasaacatindexphpgains-europe
Graham LA Belisle SL Baas C-L Emissions from light duty gasoline vehicles operating on low blend ethanol gasoline and E85 Atmospheric Environment 42 4498 (2008)
Haskew H M Thomas P E Liberty F 2006 Fuel Permeation From Automotive Systems E0 E6 E10 E20 And E85 Final Report CRC Project No E-65-3 Coordinating Research Council Inc 3650 Mansell RoadSuite 140Alpharetta GA 30022
HEI Air Toxics Review Panel (2007) Mobile-Source Air Toxics A Critical Review of the Literature on Exposure and Health Effects HEI Special Report 16 Health Effects Institute Boston USA
Hurley P TAPM v 4 User Manual 2008 CSIRO ISBN 978-1-921424-73-1
IARC (2006) IARC Monographs on the Evaluation of Carcinogenic Risks to Humans Wood Dusts and Formaldehyde Lyon World Health Organization International Agency for Research on Cancer Lyon France 8837ndash325
Jacobson M Z Effects of Ethanol (E85) versus Gasoline Vehicles on Cancer and Mortality in the United States Environ Sci Technol 2007414150-4157
A comparison of emissions from ethanol and petrol fuelled cars IVL report B1962 Health risk assessment for Vaumlstra Goumltaland
27
Jerret M Burnett R T Pope C A Ito K Thurston G Krewski D Shi Y Calle E Thun M Long-Term Ozone Exposure and Mortality N Engl J Med 20093601085-95
Lipman T E Delucchi M A 2002 Emissions of nitrous oxide and methane from conventional and alternative fuel motor vehicles Climate Change 53 477
Modig L Toreacuten K Janson C Jarvholm B Forsberg B Vehicle exhaust outside the home and onset of asthma among adults Eur Respir J 2009 Jun33(6)1261-7
Nafstad P Haheim L L Wisloff T Gram F Oftedal B Holme I Hjermann I Leren P Urban air pollution and mortality in a cohort of Norwegian men Environ Health Perspect 2004112(5)610-5
OEHHA (1999) Air Toxics Hot Spots Program Risk Assessment Guidelines Part II Technical Support Document for Describing Available Cancer Potency Factors Prepared by the Air Toxicology and Epidemiology Section Office of Environmental Health Hazard Assessment April 1999
Passant NR (2002) Speciation of UK emissions of non-methane volatile organic compounds AEAT report AEATENVR0545 Issue 1 Culham UK
Pope CA III Thun MJ Namboodiri MM Dockery DW Evans JS Speizer FE Heath CJ Particulate air pollution as a predictor of mortality in a prospective study of US adults Am J Resp Crit Care Med 1995 151 669-674
Seinfeld J H and Pandis SN (1998) Atmospheric Chemistry and Physics From Air Pollution to Climate Change John Wiley amp Sons New YorkSimpson D Fagerli H Jonson JE Tsyro S Wind P Tuovinen J -P 2003 Transboundary acidification and eutrophication and ground level ozone in Europe Unified EMEP Model Description EMEP Status Report 12003 Part I EMEPMSC-W Report The Norwegian Meteorological Institute Oslo Norway
US EPA (1999) httpwwwepagovttnatwnata1999nsata1999
Vestreng V et al 2004 Inventory Review 2004 Emission data reported to CLRTAP and the NEC Directive EMEPEEA Joint Review Report EMEPMSC-W Note 1
Westerholm R Ahlvik P Karlsson HL An exhaust characterisation study based on regulated and unregulated emissions from bi-fuel and flexi-fuel light-duty passanger cars fuelled by petrol (E5) bioethanol (E70 E75) and biogas tested at ambient temperatures of +22degC and -7degC 2008
Wolkoff P Nielsen G D Non-cancer effects of formaldehyde and relevance for setting an indoor air guideline Environment International 201036788ndash799
Yanowitz J McCormick RL Effect of E85 on tailpipe emissions from light-duty vehicles J Air amp Waste Manage Assoc 59 172 (2009)
A comparison of emissions from ethanol and petrol fuelled cars IVL report B1962 Health risk assessment for Vaumlstra Goumltaland
28
Appendix 1 Evaporate emissions of NMHC
The following assumptions are done for evaporative emissions The NMHC emissions from E85 are reduced relative to petrol by 45 Methane emissions are zero and the split of NMHC species is 68 ethanol and the remaining 32 is divided in the same way as evaporative emissions for petrol The estimates by Graham et al (2008) are missing evaporative emission data however these assumptions agrees very well with measurements of evaporative emissions due to fuel permeation reported by Haskew et al (2006) where NMHC emissions are reported to be reduced by 50 for E85 fuel compared to petrol Haskew et al also presents the NMHC split to species with 60 ethanol This number agrees quite well with our assumption of 68 NMHC being ethanol NMHC in exhaust and evaporative emissions are thus divided as in Table A1
Table A1 Division of NMHC in the exhaust and evaporative emissions for E85 and petrol respectively (wt)
E85 Petrol E85 Petrol exhaust exhaust evaporative evaporative
Ethanol 680 0 680 0 Acetaldehyde 131 08 02 0 Ethene 99 73 24 0 Ethyne 03 28 09 0 Formaldehyde 31 17 06 0 Benzene 16 56 18 10 13 Butadiene 03 09 03 0 sum 963 191 741 10
The remaining NMHC emissions are divided as for petrol (ref) and listed in Table A2
Table A2 Division of NMHC in the exhaust and evaporative emissions for E85 and petrol respectively (wt)
E85 Petrol E85 Petrol exhaust exhaust evaporative evaporative
Ethane 02 32 10 0 Alkanes (C3+) 13 278 89 880 Alkenes (C3+) 04 90 29 95 Aromatics (C7+) 18 388 125 15 Aldehydesketones (C3+)
01 15 05 0
A comparison of emissions from ethanol and petrol fuelled cars IVL report B1962 Health risk assessment for Vaumlstra Goumltaland
29
Appendix 2 Description of the model system
A21 Atmospheric lifetimes
Table A3 gives tropospheric lifetimes with regard to reaction of ethanol formaldehyde acetaldehyde and benzene (C6H6) with OH nitrate radical (NO3) and photolysis The studied organic species are listed together with three species common in the gasoline exhaust (benzene ethene and toluene) for comparison Table 11 shows also photochemical ozone creation potential (POCP) of these species POCP is a measure of amount of ozone that is formed from a certain VOC emission relatively to other emission source which has been established to the same emission mass of ethene (Derwent et al 1996 Altenstedt et al 2000) The range represents different scenarios for VOC and NOX background concentrations Derwent et al (2007) used similar methodology to calculate POCP of different VOC sources and calculated POCP of mean road emission exhaust to be 69
Table A3 Atmospheric lifetimes of studies NMVOC species with respect to the OH- and NO3- initiated
degradation τ(OH) and τ(NO3) and with respect to the photolysis (The lifetime of a chemical species which decays in a first-order process is the time needed for a concentration of this species to decrease to 1e of its original value Statistically it represents the mean life expectancy of an excited species) The OH concentration of 1times106 moleculescm3 typical for summer troposphere was used for the lifetime calculation The NO3 concentrations of 5 and 100 ppt(V) were used for lifetime calculations as representative of rural and urban night-time 12 hrs mean concentration The studied organic species are listed together with 3 species common in the gasoline exhaust for comparison The rates of photolysis were calculated with radiation transfer model for July 58ordm latitude and integrated over 24 hours
τ(OH) τ(NO3) urbanrural τ (photolysis) POCP
hr hr hr
Ethanol 85 56 1times103 - 44 - 63
Acetaldehyde 15 47 1times103 86 68 - 80
Formaldehyde 30 194 4times103 10 18 - 55
Benzene 214 - - 23 - 47
Ethene 34 - - 100
Toluene 50 - - 30 - 67
A22 Defining of boundary concentrations for TAPM from EMEP fields
Calculation of initial concentration field for TAPM from EMEP concentration field of NO2 (as example) and EMEP mean wind vector components u_mid and v_mid Two EMEP model gridcells (i=56 j=60 and i=56 j=61) represent the TAPM model domain and concentrations from the surrounding EMEP gridcells SE-S SE-N NW-S NW-N NE NW (Figure A1) are used for calculation of boundary concentration NO2(bc) according to the following code if u_mid lt= 0 then ( isite = SE-S and jsite = SE-N) else isite = NW-S and jsite = NW-N) endif
A comparison of emissions from ethanol and petrol fuelled cars IVL report B1962 Health risk assessment for Vaumlstra Goumltaland
30
if v_mid lt= 0 then ( ksite = NE) else ksite = SW endif NO2(bc) = [(NO2(isite)u_mid(isite) + NO2(jsite)u_mid(jsite))2 + NO2(ksite)v_mid(ksite)] [(u_mid(isite) + u_mid(jsite))2 + v_mid(ksite)]
Figure A1 Gridcells covering Gothenburg domain and its boundary in EMEP model plotted on latitude-
longitude coordinates The red square represents centre of Gothenburg and the blue line the coastline EMEP i and j coordinates for the boundary gridcells are SE-S = 57-60 SE-N = 57-61 NW-S = 55-60 NW-N = 55-61 NE = 56-62 NW = 56-59 and for Gothenburg grid cells are Gbg-NE = 56-61 Gbg-SW = 56-60
A23 Atmospheric chemistry
The role of secondary chemistry in for the concentration of acetaldehyde are studied by first excluding the primary acetaldehyde emissions from the EMEP model simulations of scenarios S1 and S2 and then by excluding all NMVOC emissions from the car category with spark ignition engines The contribution from the primary acetaldehyde emissions as well as the contribution of secondary acetaldehyde formed from other NMVOC to the total acetaldehyde concentration is then obtained However the secondary chemistry is highly nonlinear due to the interactions of NMVOCs with ozone and OH and thus the results for the contribution of secondary acetaldehyde are somewhat uncertain Differences in acetaldehyde concentrations between S1 and S2 scenarios are studied with respect to contribution of primary and secondary acetaldehyde It is observed that in summer background air the monthly mean contribution of the secondary acetaldehyde is of the same magnitude as the contribution of the primary acetaldehyde to the difference between S1 and
565
57
575
58
585
105 115 125 135 145
Long
Lat
Gbg-SW
Gbg-NE
SE-S
NW-N
NW-S
SE-N
SW
NE
55-59
57-59
55-62
A comparison of emissions from ethanol and petrol fuelled cars IVL report B1962 Health risk assessment for Vaumlstra Goumltaland
31
S2 In the winter and in more polluted atmosphere (Gothenburg grid cells) the contribution from secondary acetaldehyde to the concentration difference appears to be negative due to the chemistry feedback ie the E-85 scenario has less secondary acetaldehyde than the all-petrol scenario
A comparison of S2-S1 differences in primary and secondary acetaldehyde concentrations in the background (=upwind) and Gothenburg grid cells show no increase in the secondary acetaldehyde from upwind to the Gothenburg grid cell It can thus be concluded that there is no significant contribution from secondary aldehydes on the small scale (tenths of km) Conclusion from this sensitivity study is that the secondary formaldehyde can be of importance under summer in the clean background air but that formation on the local scale is unimportant Using EMEP simulated boundary concentrations of acetaldehyde in the local scale model and simulating the primary acetaldehyde emissions will capture the most important features of acetaldehyde dispersion and chemistry in Vaumlstra Goumltaland
In the EMEP model the tail-pipe PM emissions are specified as primary particles Emissions of NOX and VOCs (and NH3 SO2) are oxidised in the atmosphere and a part is then transferred through the gas-to-particle transport to the PM as secondary PM The petrol fuelled cars emit both more primary PM and more NOX compared to the E85 cars If we compare differences in primary and secondary PM between the S1 and S2 scenarios simulated by EMEP we can directly see what part of the difference is from the tail-pipe emissions of the primary particles and what part is from the formation of the secondary PM in atmosphere (mostly from higher emissions of NOX) Table A4 shows the differences between S1 and S2 (S1-S2) of monthly PM averages for January and June (two months with low and high photochemical activities respectively) It can be seen that the higher formation of secondary PM in the S1 (all-petrol) scenario is more important than the higher tail-pipe emission of primary PM by factor 10 - 20
When we compare simulated PM differences between S1-S2 for the background air (=upwind) grid cells and for grid cells including Gothenburg (50 km x 50 km scale) we can see significant increase in primary PM in the S1 scenario from the upwind grid cells to Gothenburg (746 in winter 132 in summer) while no systematic increase can be seen for the secondary PM (-42 in winter +24 in summer) From this comparison it can be concluded that no systematic increase in secondary PM can be seen (in difference from the primary PM) on the scale of 50-100 km and we can neglect this process on the small scale However the overall change in PM concentrations due to the switch of the fuel is very small both on the large scale and on the small scale as can be seen when the differences in PM concentrations between S1 and S2 are compared to absolute PM concentrations in S1 presented in the last column of Table A4
Table A4 Differences in primary and secondary PM concentrations between the lsquoAll-petrolrsquo (S1) and lsquoE-85rsquo (S2) scenarios simulated in gridcells upwind Gothenburg and in gridcells including Gothenburg (2 50 km x 50 km gridcells)
S1-S2 Background
S1-S2 Gothenburg
Increase S1-S2 Gothenburg
S1 Background
μgm3 μgm3 μgm3 bkgnd μgm3
Prim PM10 Jan 00008 00014 00006 746 084
Jun 00008 00018 00010 1319 084
Sec PM10 Jan 00155 00148 -00006
-42 157
Jun 00080 00081 00002 24 213
The sensitivity of the used emission factors for NMHC with respect to the ozone formation in the region of the Swedish West Coast can be analysed with the help of results from studying the
A comparison of emissions from ethanol and petrol fuelled cars IVL report B1962 Health risk assessment for Vaumlstra Goumltaland
32
formation of secondary acetaldehyde In this study first all primary acetaldehyde emitted by the E85 fleet are omitted in a model simulation (S2_nopAA) and secondly all NMHC emissions from the E-85 fleet are switched off (S2_noVOC) Acetaldehyde has a somewhat higher though still comparable photochemical ozone creation potential compared to ethanol (ethanol 44-63 acetaldehyde 68-80 Altenstedt and Pleijel 2000) and this simulation will thus also give information on the sensitivity of the calculations to uncertainties in the ethanol emissions Setting the emission factor for NMHC to zero gives the sensitivity to the emission factor of total NMHC Figure A2 shows the differences in ozone concentration as a result of acetaldehyde only and the total NMHC from the E85 car fleet (S2 scenario) We can see that the effect on ozone formation is very small for the Swedish West coast The reason is that the ozone formation in this area is controlled by the availability of NOX while NMHC or rather their degradation products the peroxy radicals that serve as a lsquofuelrsquo to ozone formation are usually in excess here and further VOC emissions do not increase ozone concentrations significantly The situation looks different in areas that are more heavily polluted with NOX andor which is limited in the availability of peroxy radicals The results from this sensitivity study are fully consistent with the observed increase in ozone concentrations as a result of lower NO emissions (the so-called ozone titration) only very close to the major roads but no larger-scale decrease in ozone concentrations in the Gothenburg area or in any other communities
Figure A2 Sensitivity of the ozone formation in the 2 EMEP model grid cells covering Gothenburg (blue) and in the 6 surrounding grid cells (red see Fig A1) to changes in NMHC emission factor of the E85 fuelled cars lsquobasersquo is simulation S2 with EF for NMHC as in Table 3 lsquonoVOCrsquo is S2 with EF for all NMHC = 0 lsquonopAArsquo is S2 with EF for acetaldehyde = 0 a ndash Mean sensitivity in January absolute difference in ozone formation in ppb(V) as a result of NMHC (base-noVOC) and acetaldehyde (base-nopAA) emissions b ndash Sensitivity relative to ozone concentration in the S2-base simulation January c ndash same as a) but June d ndash same as b) but June
‐002
‐001
0
001
base‐noVOC base‐nopAA
ΔO3(ppb)
a)
0
001
002
base‐noVOC base‐nopAA
ΔO
3(ppb)
c)
‐010
‐005
000
005
base‐noVOC base‐nopAA
ΔO
3
b)
000
002
004
006
base‐noVOC base‐nopAA
ΔO
3
d)
A comparison of emissions from ethanol and petrol fuelled cars IVL report B1962 Health risk assessment for Vaumlstra Goumltaland
33
Appendix 3 Emission results
The geographically distributed NOX and acetaldehyde emissions for the Vaumlstra Goumltaland region are presented in Figures A3 and A4 respectively
Figure A3 NOX emissions for the Vaumlstra Goumltaland region for the All Petrol scenario
A comparison of emissions from ethanol and petrol fuelled cars IVL report B1962 Health risk assessment for Vaumlstra Goumltaland
34
Figure A4 Acetaldehyde emissions for the Vaumlstra Goumltaland region for the All Ethanol scenario
A comparison of emissions from ethanol and petrol fuelled cars IVL report B1962 Health risk assessment for Vaumlstra Goumltaland
35
Appendix 4 Dispersion modelling results
The difference in yearly average concentration between scenario S1 and S2 for acetaldehyde and benzene can be seen in Figure A5 and Figure A6 respectively a)
b)
Figure A5 The difference in yearly average concentrations of acetaldehyde for 2020 between the all E85 (S2) and all petrol (S1) scenarios presented as a) microgm3 and as b) percentage for the Gothenburg area
A comparison of emissions from ethanol and petrol fuelled cars IVL report B1962 Health risk assessment for Vaumlstra Goumltaland
36
a)
b) all E85 c) all petrol
Figure A6 a) the difference in yearly average concentrations (gm3) of benzene for 2020 between the all E85 (S2) and all petrol (S1) scenarios yearly means for b) all E85 and c) all petrol (note the different scales)
The difference in the calculated NOX NO2 and ozone concentrations between the two scenarios are shown in Figures A7 A8 and A9
A comparison of emissions from ethanol and petrol fuelled cars IVL report B1962 Health risk assessment for Vaumlstra Goumltaland
37
a)
b)
Figure A7 The difference in yearly average concentrations of NOX for 2020 between the all E85 (S2) and all petrol (S1) scenarios presented as a) microgm3 and as b) percentage for the Gothenburg area
A comparison of emissions from ethanol and petrol fuelled cars IVL report B1962 Health risk assessment for Vaumlstra Goumltaland
38
a)
Figure A8 The difference in yearly average concentrations of NO2 for 2020 between the all E85 (S2) and all petrol (S1) scenarios presented as a) microgm3 and as b) percentage for the Gothenburg area
A comparison of emissions from ethanol and petrol fuelled cars IVL report B1962 Health risk assessment for Vaumlstra Goumltaland
39
a)
b)
Figure A9 The difference in yearly average concentrations of ozone for 2020 between the all E85 (S2) and all petrol (S1) scenarios presented as a) microgm3 and as b) percentage for mainly the Gothenburg area
A comparison of emissions from ethanol and petrol fuelled cars IVL report B1962 Health risk assessment for Vaumlstra Goumltaland
40
Appendix 5 Detailed Exposure data
Detailed exposure data for the difference between the all E85 (S2) and the all petrol (S1) scenarios can be found in Table A5
Table A5 Exposure data for the difference between the all E85 (S2) and the all petrol (S1) scenarios
Acetaldehyde diff E-P (microgm3)
Populated weighted mean
Number of people Percentage of population
0 - 01 627198 582 01 - 02 163394 152 02 - 03 134879 125 03 - 04 88099 82 04 - 05 38686 36 05 - 06 16880 16 06 - 07 7983 07 07 - 08 1248 01 Tot 014 1078367 Benzene diff E-P (microgm3)
Populated weighted mean
Number of people Percentage of population
-03 - -02 26680 25 -02 - -01 205757 191 -01 - -0 845930 784 Tot -0074 1078367 NO2 diff E-P (microgm3) Populated weighted
mean Number of people Percentage of
population -04 - -03 7698 07 -03 - -02 50131 46 -02 - -01 296288 275 -01 - -0 724250 672 Tot -009 1078367 NOX diff E-P (microgm3) Populated weighted
mean Number of people Percentage of
population -06 - -05 7698 -05 - -04 19639 18 -04 - -03 36626 34 -03 - -02 161685 150 -02 - -01 186500 173 -01 - -0 666219 618 Tot -012 1078367 O3 diff E-P (microgm3) Populated weighted
mean Number of people Percentage of
population -02 - -01 779132 723 -01 - -0 266417 247 0 - 01 32818 30 Tot -012 1078367
Exposure data for the total levels in the two scenarios can be found in Table A6
A comparison of emissions from ethanol and petrol fuelled cars IVL report B1962 Health risk assessment for Vaumlstra Goumltaland
41
Table A6 Exposure data for the total levels in the two scenarios
Acetaldehyde tot All ethanol (microgm3)
Populated weighted mean
Number of people Percentage of population
06 - 07 568825 527 07 - 08 171845 159 08 - 09 124551 115 09 - 10 100946 94 10 - 11 59235 55 11 - 12 30559 28 12 - 13 13175 12 13 - 14 7983 07 14 - 15 1248 01 Tot 077 1078367 Acetaldehyde tot All petrol (microgm3)
Populated weighted mean
Number of people Percentage of population
05 - 06 45111 42 06 - 07 1032008 957 07 - 08 1248 01 Tot 065 1078367 Benzene tot All ethanol (microgm3)
Populated weighted mean
Number of people Percentage of population
0 - 01 1055961 98 01 - 02 22406 2 Tot 005 1078367 Benzene tot All petrol (microgm3)
Populated weighted mean
Number of people Percentage of population
0 - 01 729093 676 01 - 02 232961 216 02 - 03 94042 87 03 - 04 21023 19 04 - 05 1248 01 Tot 010 1078367 NOX tot All ethanol (microgm3)
Populated weighted mean
Number of people Percentage of population
0-10 779108 722 10-20 254658 236 20-30 28683 27 30-40 11070 10 40-50 3426 03 50-60 0 00 60-70 0 00 70-80 639 01 80-90 0 00 90-100 0 00 100-110 783 01 Tot 84 1078367 NOX tot All petrol (microgm3)
Populated weighted mean
Number of people Percentage of population
0-10 769557 714 10-20 264209 245 20-30 28683 27 30-40 11070 10 40-50 3426 03 50-60 0 00
A comparison of emissions from ethanol and petrol fuelled cars IVL report B1962 Health risk assessment for Vaumlstra Goumltaland
42
60-70 0 00 70-80 639 01 80-90 0 00 90-100 0 00 100-110 783 01 Tot 85 1078367 O3 tot All ethanol (microgm3)
Populated weighted mean
Number of people Percentage of population
40-45 1422 01 45-50 26487 25 50-55 176636 164 55-60 770370 714 60-65 103452 96 Tot 569 1078367 O3 tot All petrol (microgm3)
Populated weighted mean
Number of people Percentage of population
40-45 1422 01 45-50 20229 19 50-55 181876 169 55-60 763361 708 60-65 111479 103 Tot 570 1078367 PM25 tot All ethanol (microgm3)
Populated weighted mean
Number of people Percentage of population
1-2 0 00 2-3 885325 821 3-4 192259 178 4-5 783 01 Tot 268 1078367 PM25 tot All petrol (microgm3)
Populated weighted mean
Number of people Percentage of population
1-2 0 00 2-3 868773 806 3-4 208811 194 4-5 783 01 Tot 270 1078367
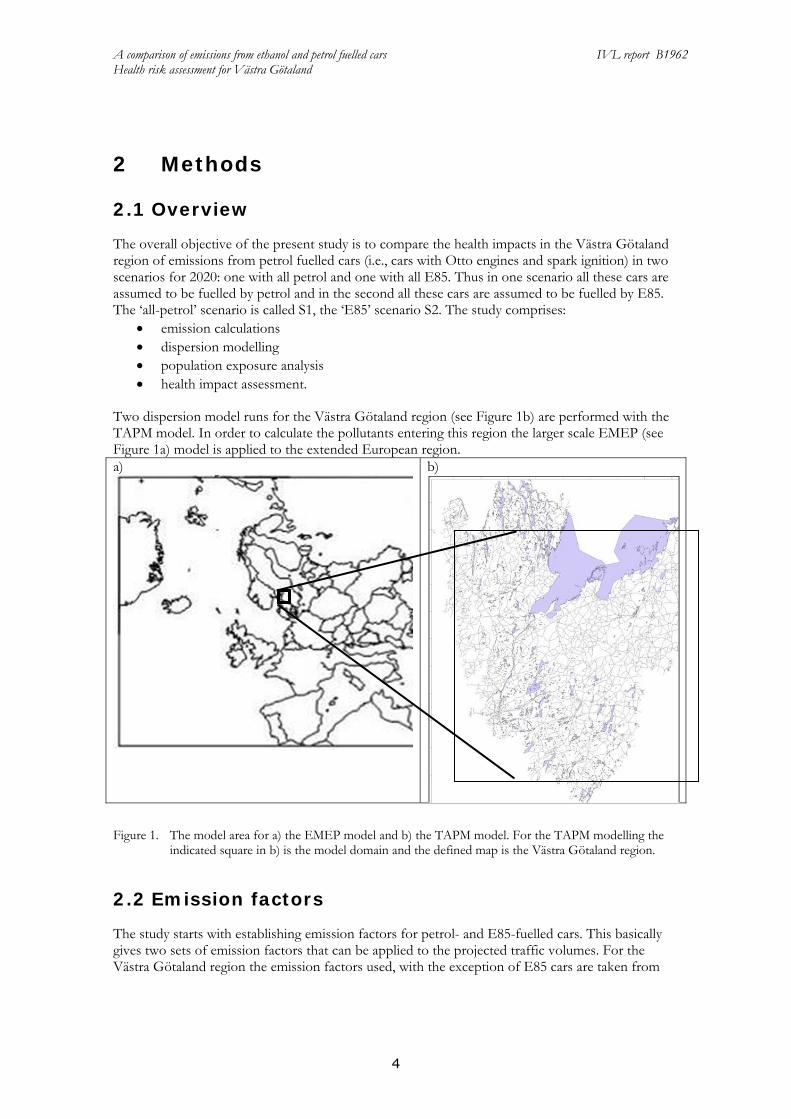
A comparison of emissions from ethanol and petrol fuelled cars IVL report B1962 Health risk assessment for Vaumlstra Goumltaland
6
For the whole Sweden the traffic prognosis and emissions obtained from the Artemis model are used The results here are very similar to what can be found in the EMEP database which is to be expected since Artemis is used in the Swedish reporting Figure 2 shows the fleet composition in Sweden 2020 from the Artemis model
Figure 2 Contribution of vehicles and fuel categories to the total transport work (vehicle-kilometersyear)
in 2020 in the Artemis model S1-scenario all categories with blue or green colour except the E85 busses use petrol S2-scenario all categories with blue or green colour use E85
For the Vaumlstra Goumltaland region the traffic data for 2005 come from two sources For the city of Gothenburg detailed traffic data are obtained from the local environmental agency For the remaining Vaumlstra Goumltaland region traffic data from the Swedish Transport Administration are used
The changes in all national Swedish emission sources in the EMEP model from year 2005 to 2020 are applied to the emission sources in the inventory for Vaumlstra Goumltaland to produce the 2020 emission scenario
24 Emissions
The emission factors and traffic data are used to obtain emissions in two emissions scenarios S1 where all ignition injection cars are assumed to use petrol and S2 where these cars all use E85 Note that all other road traffic sources such as diesel cars heavy duty vehicles etc are treated in the same way in both scenarios The emissions for Vaumlstra Goumltaland are also calculated for two base-scenarios for 2005 and 2020 where the actual traffic and fuel composition (for 2005) and a prognosis on traffic and fuel composition (for 2020) from the Swedish Transport Administration are used In the impact assessment however only the scenarios with all petrol or all E85 are used
The input of emission data required by the EMEP model consists of annual national emissions The species considered are sulphur dioxide (SO2) nitrogen oxides (NOX = NO+NO2) ammonia (NH3) non-methane volatile organic compounds (NMVOC) carbon monoxide (CO) and
busses dieselampCNG
busses E85
HGV diesel
HGV petrol
LCV diesel
LCV petrol
pass cars dieselCNG LPG hybridpass cars petrol
pass cars E‐85
A comparison of emissions from ethanol and petrol fuelled cars IVL report B1962 Health risk assessment for Vaumlstra Goumltaland
7
particulate matter (PM25 PM10) These emissions are provided for ten anthropogenic source sectors of which only emissions in the road traffic sector changes between the emissions scenarios calculated in this study The emissions are also distributed to vary between months weekdays and over the hours of the day Distribution of the NMVOC emissions between different compounds which are specific to each emission sector and country are used In this study this speciation will vary for road traffic between the scenarios as is described below
For the Vaumlstra Goumltaland region the emissions from traffic and non-road machinery are distributed as 500 m x 500 m grids while emissions from industry and heating plants are treated as point sources (including all physical processes usually connected to that type of sources) Emissions from ships are described as line sources The data are time resolved hourly over the day over the days of the week for each month
25 Dispersion modelling
Effects of the Europe-wide use of the E85 fuel on air pollution in Sweden are studied with two models on two different geographical scales To capture the large-scale changes especially those concerning ozone and other secondary air pollutants the European-scale chemistry transport model EMEP is used (Simpson et al 2003) The effects on exposure of people to air pollutants and consequent health effects are studied using air pollutant concentrations calculated with the small scale dispersion model TAPM which is nudged into EMEP air pollution fields (See Appendix 2 for details) In this way the large scale effects such as formation of ozone secondary PM and secondary aldehydes are accounted for also on the local scale In the case of benzene only the road traffic contribution is calculated due to lack of information on emissions from sources other than traffic
251 Local scale modelling
The TAPM model (Hurley 2008) is used to calculate the local contribution to air pollutants in the Vaumlstra Goumltaland region in the two scenarios The geographically distributed pollutants are then used for the exposure calculations and eventually the health risk assessment TAPM is a three dimensional meteorological and chemical model for air pollution studies that includes topography as well as land-use On the basis of this the model generates the meteorological parameters required for the dispersion modelling such as temperature layering (inversions) and three dimensional wind field all based on daily synoptic input data (large scale meteorological re-analyse data ndashcalled GASP (Global AnalysiS and Prediction) from Australian Government Bureau of Meteorology (wwwbomgovau) TAPM also includes chemistry such as NONO2 ozone SO2 and particle transformation Acetaldehyde and benzene are however not included in the chemical scheme of TAPM and these species are therefore simulated as reactive tracers in this study (see below)
In order to perform the calculations with TAPM a number of input data are required Emission data for the Vaumlstra Goumltaland region as described above Meteorological data Levels of the relevant pollutants on the model domain boundaries for the two scenarios
obtained from the EMEP model A model describing the decay of benzene and acetaldehyde emitted from traffic
A comparison of emissions from ethanol and petrol fuelled cars IVL report B1962 Health risk assessment for Vaumlstra Goumltaland
8
Since acetaldehyde and benzene are not included in the chemical scheme of TAPM their chemical lifetimes are set to be their rate constant with respect to the reaction with OH radicals multiplied by the OH mean concentrations obtained from the EMEP simulations (see below) Four different rates for the four seasons are used according to Table 1
Table 1 Rate constant for reaction with OH and chemical lifetimes for acetaldehyde and benzene used in the TAPM simulations
k(OH) Chemical lifetime (days)
mol-1 cm3s-1
Mar Apr May Jun Jul Aug Sep Oct Nov Dec Jan Feb
Acetaldehyde 15 10-11 12 04 13 155
Benzene 12 10-12 148 49 159 1937
252 EMEP modelling
Several EMEP models are developed and used for air quality policy work in Europe mainly for the Convention on Long-range Trans boundary Air Pollution The Unified EMEP model used in this study is designed to calculate concentrations in air and deposition patterns for major acidifying and eutrophying pollutants photo-oxidants and particulate matter In its standard version it has a 50 km x 50 km resolution in the horizontal direction and 20 layers distributed from the ground up to the pressure level of 100 hPa (ca 16 km) in the vertical direction A detailed description is given in Simpson et al (2003) The meteorological data used for the simulations obtained from wwwemepint are for the year 2005 and are of the same spatial resolution with a time resolution of three hours
As already mentioned the concentration fields generated by the EMEP model are used as an input to the TAPM model Boundary concentration fields for TAPM are calculated from hourly concentrations in the grid cells surrounding the Vaumlstra Goumltaland region that are weighted together with wind field vectors on corresponding boundaries of the Vaumlstra Goumltaland grid cells Since the chemistry of the organic compounds differs between the two models all organic compounds in EMEP are used and recalculated to the reactivity of organic compounds as used by TAPM
While the role of NOX NMVOC and primary PM can be investigated directly by simulations of emission in scenarios S1 and S2 effects of E85 fuelled cars on concentrations of acetaldehyde benzene and secondary PM are obtained from additional sensitivity runs The contribution of the emissions from the use of E85 fuel on acetaldehyde concentrations can be modelled directly in the EMEP model which includes also the formation and consumption of acetaldehyde in atmospheric reactions However TAPM does not include these processes and therefore the role of acetaldehyde formation is investigated further Two additional EMEP simulations are run one excluding primary acetaldehyde emissions and one excluding all NMVOC emissions from petrol and E85 fuelled vehicles By relating the results of these runs to the results of S1 and S2 the contribution of primary and secondary acetaldehydes respectively can be deduced The results from this analysis can be found in Appendix A23 The conclusion is that on the scale of the Vaumlstra Goumltaland region the formation of acetaldehydes in the atmosphere is not important and therefore the acetaldehyde concentration in TAPM can be described using the lifetimes given in Table 1 Further also the impact of the NMHC emissions on the ozone levels is studied (Appendix 23) and found to be small
Benzene is not included explicitly in the EMEP model The benzene concentrations are therefore studied in sensitivity runs with benzene from road traffic added to the S1 and S2 scenarios as
A comparison of emissions from ethanol and petrol fuelled cars IVL report B1962 Health risk assessment for Vaumlstra Goumltaland
9
methanol which has similar atmospheric lifetime as benzene The benzene concentration is then obtained by comparing the methanol concentration from the different runs
The contribution of primary and secondary PM respectively is investigated by excluding the primary PM from petrol and E85 fuelled vehicles in separate runs of the EMEP model The PM boundary values for the TAPM modelling are not separated into secondary and primary PM The results from this analysis are used to draw general conclusions about the difference in secondary PM formation between the two scenarios
26 Exposure
The human exposure of the annual mean concentrations of NOX NO2 O3 acetaldehyde and benzene are calculated based on the dispersion calculations of the Vaumlstra Goumltaland area in combination with the population density The population density distribution for the region is obtained from EEA (EEA 2009) and shown in Figure 3 The total population in the investigated area is 1 078 400
Figure 3 Population density distribution (number of people in a 1 km x 1 km grid for 2006) for the investigated area (according to Figure 1)
A comparison of emissions from ethanol and petrol fuelled cars IVL report B1962 Health risk assessment for Vaumlstra Goumltaland
10
27 Health effects and risk assumptions
271 NOX and NO2
Using modelled levels of NOX in the residential area as a vehicle exhaust marker a Norwegian study of 16 000 men from Oslo of whom 25 died during the follow up found a strong association (Nafstad et al 2004) This cohort with people of between 40-49 years of age at the start of the study was followed from 197273 through 1998 NOX was estimated in a model with 1000 m grids and a street contribution added for the largest streets When the median concentration of NOX for 1974-78 was used (mean 107 μgm3) the relative risk for total non-violent mortality was 8 per 10 μgm3 Nitrogen oxides do not have to be important as causal components behind this association
272 Ozone
Short-term effects of ozone on the respiratory system and on daily number of deaths have been reported from a large number of studies especially for summer concentrations why a threshold has sometimes been assumed in impact assessments Only recently has an effect of long-term exposure on mortality been reported from the very large American Cancer Society (ACS) Cohort Study (Jerret et al 2009)
Jacobson (2007) reported that E85 would cause an increase in mortality but assumed an effect of short-term exposure only The estimated impact was explained by the calculated ozone formation
273 Acetaldehyde
An increased incidence of nasal tumours in rats and laryngeal tumours in hamsters were observed after inhalation of high concentrations of acetaldehyde (HEI 2007) A few epidemiological studies of occupational exposure found associations but with a complex mixture of chemicals and have not been used in the cancer risk assessment for acetaldehyde Acetaldehyde is classified by the National Institute of Occupational Safety and Health as ldquoa potential human carcinogenrdquo by the US EPA (1999) as ldquoa probable human carcinogenrdquo and by the IARC as ldquopossibly carcinogenic to humansrdquo (OEHHA 1999 HEI 2007)
274 Benzene
There is clear and widely accepted evidence from a variety of epidemiologic studies of occupational exposure that benzene increase the risks of acute myeloid leukaemia (HEI 2007) but there is more uncertainty about other lymph hematopoietic cancers Studies on traffic exposure and childhood leukaemia have produced mixed results with regard to associations
275 Formaldehyde
IARCrsquos Monograph 88 says that the evidence is sufficient to conclude that formaldehyde causes cancer in humans (IARC 2006) This was because of evidence of nasopharyngeal cancer at concentrations historically encountered in industrial settings However this conclusion by IARC was largely based on the results from one occupational exposure site and the results and conclusions have not been supportive in other reviews and more recent studies (Bosetti et al 2006 Beane Freeman et al 2009 Bachand et al 2010) OEHHA (1999) uses a lifetime risk for cancer of 0000006 per microgm3 for formaldehyde and US EPA (1999) a lifetime risk of 0000013 per microgm3
A comparison of emissions from ethanol and petrol fuelled cars IVL report B1962 Health risk assessment for Vaumlstra Goumltaland
11
For non-cancer effects the eye is the organ most sensitive to formaldehyde subjective irritation has been reported at 300-500 microgm3 which is above the odour thresholds (Wolkoff amp Nielsen 2010) Effects in the eyes and in airways occur around 600ndash1000 μgm3 Effects on lung function have not been found in controlled human exposure studies below 1 mgm3 In epidemiological studies of associations between formaldehyde and exacerbation of asthma several co-pollutants make the findings difficult to interpret An indoor air quality guideline of 100 μgm3 has been considered protective against both acute and chronic sensory irritation in the airways in the general population assuming a lognormal distribution of nasal sensory irritation (Wolkoff amp Nielsen 2010)
276 PM
In the studies of long-term exposure to PM25 and mortality like the American Cancer Society (ACS) Cohort the exposure contrast were mainly related to secondary PM why the reported relative risk approx 6 increase in all-cause mortality (in adults) per 10 μgm3 is most relevant for background secondary PM concentrations (Pope et al 1995)
277 Health Impact Assessment
To summarize the types of pollutants that are found possible to include in the health impact assessment are NOX and NO2 benzene acetaldehyde formaldehyde secondary PM and ozone The assessment is restricted to the most important and well established effects of these pollutants This means that not all types of potential health impacts are included Results should however do for a comparison of the scenarios
The impact on formaldehyde levels are not calculated why it is not included in the current assessment Relative risks from epidemiological studies of vehicle exhaust using NOX and NO2 as exposure variables may be influenced from effects of their co-pollutants mainly ultrafine particles (elemental carbon soot) CO and HCs such as formaldehyde Exhaust particles are often introduced in a relatively high background of particles from other sources Thus exhaust particles were not measured directly in the important studies of long-term exposure and effects on mortality
3 Results
31 Emission factors
The emission factors are selected from available published data both for the exhaust and the evaporative emissions In both cases values relative to petrol are used The majority of the studies have been done with both E85 and petrol making this comparison more robust
Westerholm et al (2008) tested two flexi-fuel cars with E5 E70 and E85 in the European driving cycle NEDC and in the Artemis driving cycles The former is used at two temperatures (22degC and -7degC) They report the regulated emissions greenhouse gases a number of organic compounds and particle number Graham et al (2008) present measurement results for regulated emissions greenhouse gases and a number of organic compounds from four cars with E85 and regular petrol in the FTP cycle They also made a compilation of literature data for ethanol cars Yanowitz and McCormick (2009) present an analysis of US certification testing data in order to compare emissions for E85 and petrol
A comparison of emissions from ethanol and petrol fuelled cars IVL report B1962 Health risk assessment for Vaumlstra Goumltaland
12
The results from the three studies (for flexi fuel cars) and in addition the values used by Jacobson (2007) are given in Table 2
Table 2 Emissions factors for E85 fuelled cars relative to the emission factors for petrol fuelled cars
Relative change E85 vs petrol ()
Yanowitz and McCormick (2009) (95 conf)
Graham et al (2008) (sd )
Westerlund et al (2008) (average for NEDC)
Jacobson (2007)
NOX -14 (-23 - -5) -42 (15) -38 -30 NMOG 26 (17 - 37) 12 (39) NMHC -43 (-52 - -32) -45 (24) THC -14 (-24 - -4) 2 TOG 22 CO -19 (-25 - -12) -5 (51) 1 5 PM 25 0 Formaldehyde 59 (32 - 91) 80 (44) 184 60 Acetaldehyde 2855 (1189) 1031 2000 13 Butadiene -64 (31) -74 -10 Benzene -72 (15) -71 -79 Ethanol 3950 from TOG Methane 50 43
Table 2 shows lower emissions of NOX for E85 fuelled cars relative to petrol fuelled cars from test cycles generally including cold starts The emissions of hydrocarbons are higher for petrol while the emissions of organic gases are somewhat higher for E85 The emissions of aldehydes especially acetaldehyde are much higher for E85 as are the emissions of ethanol and methane The emissions of benzene and 13-butadiene are higher with petrol It should be noted that the data in Table 2 are in general for tests performed at ambient temperatures of around 20 degC Westerlund et al (2008) report that for ambient temperatures of -7 degC the emissions of CO and NMHC may be significantly higher with E85 compared with petrol For one vehicle they also report very high NOX emissions with petrol at this lower temperature
As seen in Table 2 there are a number of different quantities when it comes to the emission of organic compounds or unburnt fuel From a chemistry point of view HC is no molecule but a notation for the sum of all compounds that are hydrocarbons thus are of the form HxCy and not containing any elements but carbon and hydrogen Total organic gases (TOG) include organic compounds containing oxygen such as alcohols and aldehydes (but not CO or CO2) Volatile organic compounds (VOC) means carbon containing organic compounds present in the gaseous state at ambient temperature Non-methane hydrocarbons (NMHC) means HC minus the methane mass NMTOG and NMVOC are defined in the corresponding way1
1 When it comes to exhaust gas regulations the definitions differ somewhat In the US THC is defined as the signal obtained from a FID (Flame Ionisation Detector) instrument calibrated on propane This means that alcohols and aldehydes contribute to THC but to a lower extent since their responses in a FID instrument are lower than for hydrocarbons TOG is defined in the US regulations as THC + the mass of alcohols (eg methanol) and carbonyls (eg formaldehyde) measured separately NMHC is equal to THC ndash rCH4CH4 ndashralcAlc where the CH4-concentration is measured by gas chromatography and a FID calibrated with methane Alc is the alcohol concentration and rCH4curren and rAlc are the respective FIDresponse functions NMOG means TOG - CH4 and VOC is TOG - CH4 - C2H6 In the regulations it is stated that also a number of other non-ozone forming organic compounds eg acetone should be subtracted but these are present in very low concentrations in engine exhaust Note that there is actually a double counting of aldehydes in NMOG since they contribute to a certain extent to the NMHC value and then are added using values from separate measurements
A comparison of emissions from ethanol and petrol fuelled cars IVL report B1962 Health risk assessment for Vaumlstra Goumltaland
13
There will be emission limits for both THC and NMHC in also the future For petrol cars with low methane emissions the challenge will be to meet the limit for NMHC For E85 cars with higher methane emissions the challenge will be to meet the THC limit Thus it is reasonable that the emissions of NMHC from E85 cars will be lower than for petrol cars
In the modelling presented here the emission factors from Graham et al (2008) are used with some exceptions as will be discussed The reason is that that study comprises a compilation of a relatively large number of tests For CO the emission factor is set to the same value for E85 and petrol since the differences are small and within the uncertainty For particle emissions the studies cited in Table 2 give little information Instead data from Ericsson et al (2008) are used indicating that the primary PM emission using E85 is about 65 of that when using petrol For NOX the emission for E85 is set to 58 of that for petrol
The emission factors for NMHC (physical emission in gkm) including ethanol are in this study set to the same value for E85 as for petrol This is in line with the data for NMOG reported by Graham showing only small differences It is also reasonable considering that the car producers optimize emissions to meet the future emission legislation in Europe for NMHC and THC i e the Euro 6 standards that apply from September 2014 For petrol with low CH4 emissions the NMHC value will be limiting and this is on 68 mgkm For E85 with higher CH4 emissions the THC value of 100 mgkm will be limiting When considering the FID response as a measure of emission instead of physical emission about 50 of the THC comes from NMHC for E85 cars However the FID response is low for ethanol which means that the physical NMHC emission is about 25 higher Considering these factors the emissions of NMHC (physical) for E85 can be expected to be around 50 mgkm 125 = 625 mgkm which is about the same as for petrol The methane emission for E85 is set to 142 times the value for petrol following Lipman and Delucchi (2002) Further also the differences in the evaporate emissions are considered as is described in Appendix 1
The emissions factors for petrol cars are taken from the Artemis model (Andreacute 2005) The distribution of NMHC for petrol cars is from Passant (2002) The resulting emission factors used to obtain the emissions scenarios are presented in Table 3
In Europe THC is defined as the signal from a propane calibrated FID and thus contains oxygen containing compounds although the response factors for the latter are lower The FID instrument gives the number of molecules and in order to calculate the mass the EU regulations use the densities obtained from assuming the molecular formulas C1H274O0385 (209 gmole) for E85 and C1H189O0016 (1415 gmole) for petrol This thus compensates for the lower response factor for ethanol and acetaldehyde NMHC is obtained by subtracting the concentration of CH4 (times the FID response factor) measured separately
A comparison of emissions from ethanol and petrol fuelled cars IVL report B1962 Health risk assessment for Vaumlstra Goumltaland
14
Table 3 Emission factors (gkm) for 2020 for passenger cars (including evaporative emissions but excluding wear particle emissions) used in the modelling
Petrol E85 NOX 0112 0065 CO 179 174 PM 00013 00008 CH4 0013 0018 NMHC 033 028
division of NMHC Ethanol 00000 01898 Acetaldehyde 00025 00299 Ethene 00244 00237 Ethyne 00094 00011 Formaldehyde 00057 00072 Benzene 00187 00045 13 Butadiene 00030 00009 Ethane 00107 00009 Alkanes C3+ 00928 00076 Alkenes C3+ 00301 00025 Aromatics C7+ 01297 00106 Aldehydesketones C3+ 00051 00004
sum NMHC 03321 02792
32 Emissions
The emissions from road traffic vary between the two scenarios due to the differences in the emission factors From the EMEP modelling the total emissions from road traffic in the different scenarios are calculated for the countries included In Figure 4 emissions of NOX NMVOC and PM in the S2 (E-85) scenario relative to the S1 (all-petrol) scenario are shown for these countries The relative change is larger for countries with a high fraction of petrol cars relative to diesel cars (since the latter are the same in the two scenarios) such as Russia and Ukraine The relative change is smallest for PM emissions due to the very small contribution of the exhaust particles from petrol fuelled cars compared to the contribution from diesel vehicles and wear particles
A comparison of emissions from ethanol and petrol fuelled cars IVL report B1962 Health risk assessment for Vaumlstra Goumltaland
15
Figure 4 National emissions of NOX NMVOC and PM from the road traffic sector in E85 scenario (S2)
relative to lsquoall-petrolrsquo scenario (S1)
An important difference in the emissions between the scenarios lies in the speciation of the NMVOC emissions Figure 5 shows this speciation of NMVOCs for all road traffic emission categories used in this study The two rightmost bars in Figure 5 show the NMVOC speciation for Swedish road traffic emissions for the two scenarios S1 and S2 Comparison with Figure4 shows that the relative changes between the two scenarios are much larger for some individual NMVOC species that for the total NMVOC emissions Since the NMVOC emissions from traffic in Sweden are dominated by the emissions from petrol cars (about 85 of the road traffic emissions of NMVOC comes from petrol cars) the variations in NMVOC speciation between petrol and E85
0
02
04
06
08
1
NOx
0
02
04
06
08
1
NMVOC
0
02
04
06
08
1
Aus
tria
Bel
arus
Bel
gium
Bos
-Her
cB
ulga
riaC
roat
iaC
ypru
sC
zech
Rep
Den
mar
kE
ston
iaFi
nlan
dFr
ance
Ger
man
yG
reec
eH
unga
ryIr
elan
dIt
aly
Lat
via
Lith
uani
aL
uxem
bour
gM
alta
Net
herla
nds
Nor
way
Pola
ndPo
rtug
alR
oman
iaR
ussi
a_E
uro
Slov
ak R
epSl
oven
iaSp
ain
Swed
enSw
itzer
land
Tur
key
Ukr
aine
UK
PM
A comparison of emissions from ethanol and petrol fuelled cars IVL report B1962 Health risk assessment for Vaumlstra Goumltaland
16
will have a significant impact on the total road traffic NMVOC speciation As can be seen in Figure 5 scenario S1 is dominated by alkanes and aromatics while scenario S2 is dominated by ethanol It can also be noted that S1 contains a significant emission of benzene which is much lower in S2 while the opposite is true for acetaldehyde
Figure 5 Distribution of hydrocarbon species in NMVOC emissions from individual road traffic emission
categories as defined in emission scenarios in this study and from the whole road traffic emission sector in Sweden for scenarios S1 (All petrol) and S2 (All E85)
Figure 6 shows a map of the EMEP domain with emissions of acetaldehyde for the two studied scenarios as an example of the geographical distribution of emissions
Figure 6 Gridded emissions of acetaldehyde for the year 2020 (in tonnes per grid cell (50 km x 50 km)
and year) a ndash lsquoAll petrol scenario b ndash lsquoAll E85 scenariorsquo
As mentioned the emissions from road traffic in the Vaumlstra Goumltaland region are calculated in a 500 m x 500 m grid Figure 7 shows the emissions of NOX for 2005 as obtained from the database and the projected emissions for 2020 with a mixed use of E85 and petrol This can be considered as the base case for the emissions in 2020 It can be seen that the emissions decrease over the period which is due to reduction in NOX emissions factors as older vehicles are replaced by newer models (the traffic actually increases from a total of 754x109 vehicle-kilometres in 2005 to 937x109
0
20
40
60
80
100
Pet
rol e
xh
Pet
rol e
vap
E-8
5 ex
h
E-8
5 ev
ap
Pet
rol M
C
Die
sel L
DV
Die
sel H
DV
Roa
d Sw
eden
S1
Roa
d Sw
eden
S2
m
ass
Ethane
Alkanes C3+
Ethene
13 Butadiene
Alkenes C3+
Ethyne
Benzene
Aromatics C7+
Formaldehyde
Acetaldehyde
Aldket C3+
Ethanol
A comparison of emissions from ethanol and petrol fuelled cars IVL report B1962 Health risk assessment for Vaumlstra Goumltaland
17
vehicle-kilometres in 2020) The major roads in the region are clearly visible as well as the larger cities (especially Gothenburg)
Figure 7 Emissions of NOX (kgyear for a 500 m x 500 m grid cell) in the Vaumlstra Goumltaland region for 2005
and for 2020 for the base case
In Table 4 the traffic emissions for NOX benzene acetaldehyde ethanol and PM10 for the Vaumlstra Goumltaland region are shown for the four different emissions scenarios The emissions of NOX and benzene are reduced between 2005 and 2020 for the base case while the emissions of ethanol and acetaldehyde increase due to an expected increase in the use of ethanol fuel The NOX emissions for S1 are somewhat higher than for S2 due to the higher NOX emissions factor for petrol compared with E85
Table 4 Emissions from traffic for the Vaumlstra Goumltaland region in four different emission scenarios (in tonnesyear)
Substance base 2005 base 2020 S1 S2 NOX 13 243 4 843 4 954 4 631 Benzene 2 833 927 1 201 386 Acetaldehyde 628 1 074 305 2 595 Ethanol 192 5 192 0 15 400 PM10 1 324 486 483 476
33 Dispersion modelling
Resulting concentrations from calculations of the S1 and S2 scenarios with the EMEP model are used to provide input of primary and secondary air pollutants for the calculations with the TAPM model for the Vaumlstra Goumltaland region Concentrations of NOX NMVOC PM25 PM10 acetaldehyde ethanol and benzene are therefore calculated as boundary conditions for the Vaumlstra Goumltaland region In addition sensitivity studies are performed to investigate the role of formation of secondary acetaldehyde and secondary particulate matter (see Appendix 2) Time series analysis of the TAPM and EMEP model results of the S1 and S2 scenarios are presented in Figure 8
A comparison of emissions from ethanol and petrol fuelled cars IVL report B1962 Health risk assessment for Vaumlstra Goumltaland
18
a)
b)
Figure 8 Time series analyses of S1 and S2 scenarios for the EMEP and TAPM modelled concentrations of NOX and ozone at an urban background site in Gothenburg (TAPM) and in EMEP model grid cells including Gothenburg city (50 km x 50 km)
Concentrations of NOX and ozone at an urban background site in Gothenburg (TAPM) and in the 50 km x 50 km EMEP grid cells including Gothenburg are compared for one summer and one winter month Due to the well-known process of ozone titration by freshly emitted nitrogen monoxide (Seinfeld and Pandis 1998) the concentration of ozone often decreases in urban areas This phenomenon is expected to be captured by the fine-gridded TAPM model but not necessarily by the courser scale of the EMEP model Figure 8 shows the generally higher NOX levels in the small grid cell of the TAPM model in urban background location comparing to those in the large EMEP grid cell while the opposite is observed for the ozone concentrations (Remember that the boundary concentrations for TAPM are obtained from the EMEP model and they are thus the same in both cases) This indeed shows that local scale emissions and processes contribute to locally increased levels of NOX in urban areas both for the summer and the winter cases For ozone where there of course are no primary emissions the situation is the opposite where instead the result is decreased concentration levels at urban sites on a local scale The influence of the
A comparison of emissions from ethanol and petrol fuelled cars IVL report B1962 Health risk assessment for Vaumlstra Goumltaland
19
NMHC emissions from the passenger cars is studied in a sensitivity analysis (see Appendix 23) and it is found to have only a small influence on the ozone levels
To illustrate the results of the different scenario calculations the geographically distributed concentrations are presented as the difference in yearly average concentrations between the all E85 (S2) and all petrol (S1) scenarios both as microgm3 and sometimes as percentage of the difference to scenario S1 (see Appendix 3)
The difference in yearly average concentrations between scenario S1 and S2 for acetaldehyde and benzene can be seen in Figures 9 and 10 respectively The increase in acetaldehyde concentration resulting from a switch from petrol to E85 is up to about 05 gm3 or 80 in the central parts of the largest urban area of the region Gothenburg Outside this area the relative increase is about 10 for the other urban areas and less than that for the rural areas This large relative increase (see map in Appendix 4) is a result of the relatively high emissions of acetaldehyde from E85 fuelled cars For benzene the situation is opposite In the scenarios for 2020 the concentration of benzene decreases by up to a few tenths of gm3 as a result of a switch from petrol to E85 For benzene the relative change is not calculated
Figure 9 The difference in yearly average concentrations of acetaldehyde for 2020 between the all E85 (S2) and all petrol (S1) scenarios (microgm3)
A comparison of emissions from ethanol and petrol fuelled cars IVL report B1962 Health risk assessment for Vaumlstra Goumltaland
20
Figure 10 The difference in yearly average concentrations (gm3) of benzene for 2020 between the all E85 (S2) and all petrol (S1) scenarios
The difference in the calculated NOX NO2 and ozone concentrations between the two scenarios are shown in Appendix 4 The change in NOX concentration between the two scenarios only represents a small fraction of the total NOX concentration This is because the emissions of NOX from petrol cars are relatively low compared with the contribution from diesel engines and other sources Thus the resulting decrease in the NOX concentration with E85 is only up to 3 For ozone there is a small increase of about 01 microgm3 of E85 in the central areas of Gothenburg where there is relatively high traffic intensity (see Appendix 4 Figure A9) In the rest of the region there is a small decrease in the ozone concentration in the E85 scenario
34 Exposure
The resulting concentrations from the dispersion modelling together with the population density distribution are used to assess the exposure to acetaldehyde benzene NO2 NOX and ozone for the two scenarios S1 and S2 The exposure to PM25 is very similar for the two scenarios (the difference in concentration between scenarios S2 and S1 is only about -002 gm3 Table 5 shows the population weighted mean exposure both as total concentrations and as the difference between the two scenarios Detailed exposure results can be found in Appendix 5 It can be seen that the exposure to all the pollutants in Table 5 with the exception of acetaldehyde are somewhat lower for the all E85 scenario (S2) than for the all petrol scenario (S1) However the effect on health also
A comparison of emissions from ethanol and petrol fuelled cars IVL report B1962 Health risk assessment for Vaumlstra Goumltaland
21
depends on the level of the dose-response functions For example if the level of concentration is low in a populated area but the dose-response function is high the effect of even a low concentration increase can become important The increase in exposure from S1 to S2 (S2-S1) calculated as percentage of the population exposed to increased mean concentrations of pollutants is presented in Figure 11
Table 5 Populated weighted mean exposure (gm3)
S1 S2 S2-S1 Acetaldehyde 065 077 014 Benzene 01 005 -007 NOX 85 84 -012 Ozone 570 569 -012 PM25 270 268 -002
Increased concentrations Decreased concentrations Both increased and
decreased conc
Figure 11 The relative exposure (S2-S1) calculated as percentage of the population
In Figure 11 it is clear that the only pollutant that does not show an improvement regarding air quality and thus the health risks when modelling a switch from petrol to E85 is acetaldehyde For all pollutants except for ozone the changes of concentration levels observed between the scenarios are within the urban areas but for ozone there are also differences in rural areas
According to the data in Figure 11 about 14 of the population in the Vaumlstra Goumltaland region will be exposed to 03-08 microgm3 higher concentration levels of acetaldehyde in scenario S2 relative to S1 From Figure 9 it can be seen that the majority of these people live within the Gothenburg area Further about 28 of the population will be exposed to increased levels of between 01 to 03 microgm3 mainly in the suburban areas and rural surroundings of Gothenburg but also in some of the smaller cities in the region Outside the urban areas the concentration difference is lower than 01 microgm3
In the S2 scenario relative to the S1 scenario the population is exposed to decreased concentration levels of benzene and NOX This is mainly true also for O3 but with an exception for the central
A comparison of emissions from ethanol and petrol fuelled cars IVL report B1962 Health risk assessment for Vaumlstra Goumltaland
22
parts of Gothenburg where the concentration actually increases (see Appendix 4 Figure 7A) resulting in that 3 (blue area in Figure 11 for O3) of the population will be exposed to higher concentrations of O3 For the rest of the area there are decreased concentrations of ozone upon a switch to E85
The largest differences are again in the central parts of Gothenburg where about 20 of the population is being exposed to a lower benzene concentration of 01-03 microgm3 This also means that concerning benzene the majority (78) of the population have none or very low influence from a change to ethanol fuel
The largest effect on exposure difference is seen for NOX where just over 20 of the population has its exposure decreased with 03-05 microgm3 (in the central parts of Gothenburg) In the suburbs the decrease is between 01-02 microgm3 lower Along the largest roads there is a small but visible improvement on a yearly basis of 01 microgm3
For PM25 there is a difference in the populated weighted mean exposure of 002 gm3 between the scenarios with a lower value for the all-E85 case (see also Appendix 5)
35 Impact on health in Vaumlstra Goumltaland
351 NO2 and NOX
The impact of long-term exposure on mortality was estimated using the relative risk from the Norwegian cohort study (Nafstad et al 2004) reporting a relative risk of 08 increase per microgm3 increase in NOX however without adjustment for particle concentrations Assuming this effect on the total mortality and a typical baseline mortality of 1000 deaths per 100 000 person years a decrease in the population mean exposure of 012 microgm3 would correspond to approximately 104 less preterm deaths per year However for the present case this number is highly uncertain since the exposure to substances normally associated with changes in NOX exposure may here change in different ways since the relation between different exhaust components varies between the scenarios
The impact of long-term exposure on asthma incidence (new cases) in adults has been estimated using results from the Swedish RHINE Study Cohorts (Modig et al 2009) with very similar results in the ECRHS Study corresponding to approx 4 increase per microgm3 increase in NO2 From the RHINE Study the incidence can be estimated to 03 per year (proportion of adults developing the disease) with children and elderly excluded this means around 1500 adult cases per year A reduction of 009 microgm3 corresponds to 54 avoided new cases of adult asthma per year However also NO2 in the asthma study may have been mainly an indicator of vehicle exhaust
352 Ozone
The impact of long-term exposure on respiratory mortality has been reported to be approx 02 per microgm3 increase in the summer concentration when studied in the large ACS Cohort (Jerret et al 2009) Assuming this effect on the total population and a typical baseline respiratory mortality of 100 deaths per 100 000 person years a decrease in the population mean exposure of 012 microgm3 corresponds to approximately 03 less preterm deaths per year
A comparison of emissions from ethanol and petrol fuelled cars IVL report B1962 Health risk assessment for Vaumlstra Goumltaland
23
353 Acetaldehyde
According to US EPA (1999) a lifetime risk for cancer of 0000002 per microgm3 is to be assumed for this potential human carcinogen An increase in the population mean exposure of 012 microgm3 corresponds to 026 cases more per year in the current population
354 Benzene
According to US EPA (1999) a lifetime risk for cancer (leukaemia) of 00000022-00000078 per microgm3 is to be assumed for this human carcinogen A decrease in the population mean exposure of 0074 microgm3 corresponds to approximately 03 cases less per year in the current population (assuming 0000004 per microgm3)
355 PM25
In CAFEacute and other impact assessments a relative risk of 6 increase in all-cause mortality per 10 microgm3 has usually been assumed Assuming this effect on the total mortality and a typical baseline mortality of 1000 deaths per 100 000 person years a decrease in the population mean exposure of 002 microgm3 corresponds to approximately 13 less preterm deaths per year
4 Discussion
In this study the health risks from a large introduction of E85 to replace petrol is analysed in scenario studies for 2020 for the Vaumlstra Goumltaland region It is found that the change in pollutant concentration exposure and health risks are small between the two scenarios It should be emphasized that the study only considers vehicle emissions and does not take into account effects from the fuel production
The emissions of NOX in the model are somewhat lower from E85 fuelled cars than from petrol fuelled cars This is in line with the emission factors used by Jacobson (2007) The nitrogen oxides are key substances in the atmospheric reactions determining the concentrations of ozone in air NOX is involved in the formation of ozone but close to the NO source the ozone concentration is lowered due to the rapid reactions between NO and O3 forming NO2 If NO is released in an environment with already high NO concentration it may result in lowering of ozone levels on the regional scale In the present study the ozone concentrations calculated are somewhat lower for the E85 scenario than for the petrol scenario
The health risk analysis shows that the main difference between the scenarios is due to the lower concentration of NOX However it may have been other exhaust components than NOX such as exhaust particles that were behind the reported association with mortality In cases when NOX is not a good indicator of exhaust particle emissions and their toxicity our results may be misleading This should be studied further Neglecting the effects of the changes in NOX exposure the total difference between the scenarios sums up to 16 preterm deaths per year with lower values for the E85 scenario while it would sum up to 12 less preterm deaths for the E85 scenario if the effect related to NOX were included Since there are no similar studier for the effect on mortality among those younger than 30-50 years of age we assume the same relative effect on mortality in all ages This makes only a small difference since the large majority of deaths occur in older groups
A comparison of emissions from ethanol and petrol fuelled cars IVL report B1962 Health risk assessment for Vaumlstra Goumltaland
24
The opposite result for the ozone concentration was obtained by Jacobson The reason for this discrepancy is that the Jacobson study concerns Los Angeles a region with high concentrations of pollutants while the study here concerns the Vaumlstra Goumltaland region with much less dense traffic and also lower concentrations of pollutants importantly NOX It is not unlikely that the effect that Jacobson report also would be found for large parts of Europe with higher traffic densities than in the Vaumlstra Goumltaland region
It is worth to emphasize that the major negative health effect in the Jacobson (2007) study is attributed to the increase in ozone concentration that is a result of the decrease of the NO emissions from E85 cars Directly after the emission NO reacts with ozone resulting in drop of the ozone concentration the so-called ozone titration commonly observed in many cities This NO does however form even higher quantities of ozone further downwind contributing to the general increase in the background ozone levels It is also precursor of NO2 secondary PM and other toxic species as eg PAN and hence reductions in NO emissions are never regarded as disbeneficial from the environmental viewpoint
There are of course several sources of uncertainties that influence the results of this study Since the main results concern differences between the two scenarios several of these factors loose on importance for the conclusions This comprises uncertainties in meteorology in future traffic volumes and in the population density distribution However there are some uncertainties that remain important The emission factors for E85 fuelled cars are much less characterised than what they are for petrol cars The emission of particles from E85 fuelled cars is especially uncertain with only very few published results Also the emissions of NMHC are somewhat uncertain and may be higher for E85 at lower ambient temperatures However the sensitivity analysis performed shows that for the studied region the NMHC emissions only have a small influence on the ozone concentrations
5 Conclusions
In this study the impact of tailpipe and evaporative emissions from E85 fuelled cars on air pollution and health risks are calculated and compared with petrol fuelled cars The scenario calculations for the Vaumlstra Goumltaland Region give data on emissions pollutant concentrations exposure and a health risk evaluation
The differences in emission factors between E85 and petrol lies in the emissions of PM and NOX which are about 65 and 58 for E85 relative petrol respectively Also the speciation of the emitted hydrocarbons is significantly different with large emissions of acetaldehyde and ethanol from E85 and large emissions of benzene higher aromatics alkanes and alkenes from petrol
These differences in emission factors reflect in differences in emissions The emission calculations for all Swedish road traffic show a decrease for the E85 scenario relative to the petrol scenario of 65 for NOX 34 for PM25 67 for benzene For acetaldehyde there is an increase of 770
The differences obtained from the TAPM modelling show decreased levels of NOX ozone and benzene with E85 and increased levels of acetaldehyde For the latter the increase may be up to 80 while NOX and ozone show decreases of up to a few per cent and a few tenths of per cent respectively
A comparison of emissions from ethanol and petrol fuelled cars IVL report B1962 Health risk assessment for Vaumlstra Goumltaland
25
The health risk assessment shows decreased health risks in the E85 scenario relative the all-petrol scenario due to the increased NOX exposure correlated with both preterm deaths and asthma However NOX may be mainly an exhaust indicator Smaller effects are expected from the changes in ozone acetaldehyde and benzene exposure The overall difference considering the exposure to PM acetaldehyde benzene and ozone is 16 preterm deaths with lower values for the E85 scenario
6 Acknowledgements
Saab Automobile The Swedish Transport Administration and The Foundation for the Swedish Environmental Research Institute are gratefully acknowledged for financial contribution
Magnus Ekstroumlm and Maria Holmstroumlm at Saab and Martin Juneholm at the Swedish Transport Administration are acknowledged for their most valuable input to the study
David Simpson Norwegian Meteorological Institute EMEP MSC-W Norway and Dept Radio amp Space Science Chalmers Univ Technol Sweden is gratefully acknowledged for help with implementation of the Unified EMEP model
A comparison of emissions from ethanol and petrol fuelled cars IVL report B1962 Health risk assessment for Vaumlstra Goumltaland
26
7 References
Altenstedt J Pleijel K 2000 An alternative approach to photochemical ozone creation potentials under European conditions J Air amp Waste Manage Assoc 50 1023 ndash 1036
Andre J-M (2005) Vehicle emission measurement collection of the ARTEMIS datatbase Artemis 3312 report Available from httpwwwinretsfrurltepublicationspublications-pdfJoumardA3312reportJMALTE0504pdf
Bachand A MMundt K A Mundt D JMontgomery R R Epidemiological studies of formaldehyde exposure and risk of leukemia and nasopharyngeal cancer A meta-analysis Critical Reviews in Toxicology 2010 40(2) 85ndash100
Beane Freeman L E Blair A Lubin J H Stewart P A Hayes R B Hoover R N Hauptmann M Mortality from lymphohematopoietic malignancies among workers in formaldehyde industries The National Cancer Institute Cohort J Natl Cancer Inst 2009101751ndash761
Bosetti C McLaughlin J K Tarone R E Pira E LaVecchia C Formaldehyde and cancer risk A quantitative review of cohort studies through 2006 Ann Oncol 20081929ndash43
ConcaweJRC Well-to-wheel studies httpiesjrceceuropaeuwtwhtml
Derwent R G Jenkin M E Saunders S M 1996 Photchemical ozone creation potentials for a large number of reactive hydrocarbons under European conditions Atmos Environ 30 181 ndash 199
Derwent RG Jenkin ME Passant NR Pilling MJ 2007 Photochemical ozone creation potentials (POCPs) for different emission sources of organic compounds under European conditions estimated with a Master Chemical Mechanism Atmos Env 41 2570ndash2579
EEA Copenhagen 2009 wwweeaeuropaeudata-and-mapsdatapopulation-density-disaggregated-with-corine-land-cover-2000-2
Ericsson P Holmstroumlm M Amberntsson-Carlsson A Ohlson C Skoglundh M Andersson B Carlsson P-A 2008 Characterization of particulate emissions and methodologhy for oxidation of particulates from non-diesel combustion ystems SAE Technical Paper Series 2008-01-1746
GAINS 2010 httpgainsiiasaacatindexphpgains-europe
Graham LA Belisle SL Baas C-L Emissions from light duty gasoline vehicles operating on low blend ethanol gasoline and E85 Atmospheric Environment 42 4498 (2008)
Haskew H M Thomas P E Liberty F 2006 Fuel Permeation From Automotive Systems E0 E6 E10 E20 And E85 Final Report CRC Project No E-65-3 Coordinating Research Council Inc 3650 Mansell RoadSuite 140Alpharetta GA 30022
HEI Air Toxics Review Panel (2007) Mobile-Source Air Toxics A Critical Review of the Literature on Exposure and Health Effects HEI Special Report 16 Health Effects Institute Boston USA
Hurley P TAPM v 4 User Manual 2008 CSIRO ISBN 978-1-921424-73-1
IARC (2006) IARC Monographs on the Evaluation of Carcinogenic Risks to Humans Wood Dusts and Formaldehyde Lyon World Health Organization International Agency for Research on Cancer Lyon France 8837ndash325
Jacobson M Z Effects of Ethanol (E85) versus Gasoline Vehicles on Cancer and Mortality in the United States Environ Sci Technol 2007414150-4157
A comparison of emissions from ethanol and petrol fuelled cars IVL report B1962 Health risk assessment for Vaumlstra Goumltaland
27
Jerret M Burnett R T Pope C A Ito K Thurston G Krewski D Shi Y Calle E Thun M Long-Term Ozone Exposure and Mortality N Engl J Med 20093601085-95
Lipman T E Delucchi M A 2002 Emissions of nitrous oxide and methane from conventional and alternative fuel motor vehicles Climate Change 53 477
Modig L Toreacuten K Janson C Jarvholm B Forsberg B Vehicle exhaust outside the home and onset of asthma among adults Eur Respir J 2009 Jun33(6)1261-7
Nafstad P Haheim L L Wisloff T Gram F Oftedal B Holme I Hjermann I Leren P Urban air pollution and mortality in a cohort of Norwegian men Environ Health Perspect 2004112(5)610-5
OEHHA (1999) Air Toxics Hot Spots Program Risk Assessment Guidelines Part II Technical Support Document for Describing Available Cancer Potency Factors Prepared by the Air Toxicology and Epidemiology Section Office of Environmental Health Hazard Assessment April 1999
Passant NR (2002) Speciation of UK emissions of non-methane volatile organic compounds AEAT report AEATENVR0545 Issue 1 Culham UK
Pope CA III Thun MJ Namboodiri MM Dockery DW Evans JS Speizer FE Heath CJ Particulate air pollution as a predictor of mortality in a prospective study of US adults Am J Resp Crit Care Med 1995 151 669-674
Seinfeld J H and Pandis SN (1998) Atmospheric Chemistry and Physics From Air Pollution to Climate Change John Wiley amp Sons New YorkSimpson D Fagerli H Jonson JE Tsyro S Wind P Tuovinen J -P 2003 Transboundary acidification and eutrophication and ground level ozone in Europe Unified EMEP Model Description EMEP Status Report 12003 Part I EMEPMSC-W Report The Norwegian Meteorological Institute Oslo Norway
US EPA (1999) httpwwwepagovttnatwnata1999nsata1999
Vestreng V et al 2004 Inventory Review 2004 Emission data reported to CLRTAP and the NEC Directive EMEPEEA Joint Review Report EMEPMSC-W Note 1
Westerholm R Ahlvik P Karlsson HL An exhaust characterisation study based on regulated and unregulated emissions from bi-fuel and flexi-fuel light-duty passanger cars fuelled by petrol (E5) bioethanol (E70 E75) and biogas tested at ambient temperatures of +22degC and -7degC 2008
Wolkoff P Nielsen G D Non-cancer effects of formaldehyde and relevance for setting an indoor air guideline Environment International 201036788ndash799
Yanowitz J McCormick RL Effect of E85 on tailpipe emissions from light-duty vehicles J Air amp Waste Manage Assoc 59 172 (2009)
A comparison of emissions from ethanol and petrol fuelled cars IVL report B1962 Health risk assessment for Vaumlstra Goumltaland
28
Appendix 1 Evaporate emissions of NMHC
The following assumptions are done for evaporative emissions The NMHC emissions from E85 are reduced relative to petrol by 45 Methane emissions are zero and the split of NMHC species is 68 ethanol and the remaining 32 is divided in the same way as evaporative emissions for petrol The estimates by Graham et al (2008) are missing evaporative emission data however these assumptions agrees very well with measurements of evaporative emissions due to fuel permeation reported by Haskew et al (2006) where NMHC emissions are reported to be reduced by 50 for E85 fuel compared to petrol Haskew et al also presents the NMHC split to species with 60 ethanol This number agrees quite well with our assumption of 68 NMHC being ethanol NMHC in exhaust and evaporative emissions are thus divided as in Table A1
Table A1 Division of NMHC in the exhaust and evaporative emissions for E85 and petrol respectively (wt)
E85 Petrol E85 Petrol exhaust exhaust evaporative evaporative
Ethanol 680 0 680 0 Acetaldehyde 131 08 02 0 Ethene 99 73 24 0 Ethyne 03 28 09 0 Formaldehyde 31 17 06 0 Benzene 16 56 18 10 13 Butadiene 03 09 03 0 sum 963 191 741 10
The remaining NMHC emissions are divided as for petrol (ref) and listed in Table A2
Table A2 Division of NMHC in the exhaust and evaporative emissions for E85 and petrol respectively (wt)
E85 Petrol E85 Petrol exhaust exhaust evaporative evaporative
Ethane 02 32 10 0 Alkanes (C3+) 13 278 89 880 Alkenes (C3+) 04 90 29 95 Aromatics (C7+) 18 388 125 15 Aldehydesketones (C3+)
01 15 05 0
A comparison of emissions from ethanol and petrol fuelled cars IVL report B1962 Health risk assessment for Vaumlstra Goumltaland
29
Appendix 2 Description of the model system
A21 Atmospheric lifetimes
Table A3 gives tropospheric lifetimes with regard to reaction of ethanol formaldehyde acetaldehyde and benzene (C6H6) with OH nitrate radical (NO3) and photolysis The studied organic species are listed together with three species common in the gasoline exhaust (benzene ethene and toluene) for comparison Table 11 shows also photochemical ozone creation potential (POCP) of these species POCP is a measure of amount of ozone that is formed from a certain VOC emission relatively to other emission source which has been established to the same emission mass of ethene (Derwent et al 1996 Altenstedt et al 2000) The range represents different scenarios for VOC and NOX background concentrations Derwent et al (2007) used similar methodology to calculate POCP of different VOC sources and calculated POCP of mean road emission exhaust to be 69
Table A3 Atmospheric lifetimes of studies NMVOC species with respect to the OH- and NO3- initiated
degradation τ(OH) and τ(NO3) and with respect to the photolysis (The lifetime of a chemical species which decays in a first-order process is the time needed for a concentration of this species to decrease to 1e of its original value Statistically it represents the mean life expectancy of an excited species) The OH concentration of 1times106 moleculescm3 typical for summer troposphere was used for the lifetime calculation The NO3 concentrations of 5 and 100 ppt(V) were used for lifetime calculations as representative of rural and urban night-time 12 hrs mean concentration The studied organic species are listed together with 3 species common in the gasoline exhaust for comparison The rates of photolysis were calculated with radiation transfer model for July 58ordm latitude and integrated over 24 hours
τ(OH) τ(NO3) urbanrural τ (photolysis) POCP
hr hr hr
Ethanol 85 56 1times103 - 44 - 63
Acetaldehyde 15 47 1times103 86 68 - 80
Formaldehyde 30 194 4times103 10 18 - 55
Benzene 214 - - 23 - 47
Ethene 34 - - 100
Toluene 50 - - 30 - 67
A22 Defining of boundary concentrations for TAPM from EMEP fields
Calculation of initial concentration field for TAPM from EMEP concentration field of NO2 (as example) and EMEP mean wind vector components u_mid and v_mid Two EMEP model gridcells (i=56 j=60 and i=56 j=61) represent the TAPM model domain and concentrations from the surrounding EMEP gridcells SE-S SE-N NW-S NW-N NE NW (Figure A1) are used for calculation of boundary concentration NO2(bc) according to the following code if u_mid lt= 0 then ( isite = SE-S and jsite = SE-N) else isite = NW-S and jsite = NW-N) endif
A comparison of emissions from ethanol and petrol fuelled cars IVL report B1962 Health risk assessment for Vaumlstra Goumltaland
30
if v_mid lt= 0 then ( ksite = NE) else ksite = SW endif NO2(bc) = [(NO2(isite)u_mid(isite) + NO2(jsite)u_mid(jsite))2 + NO2(ksite)v_mid(ksite)] [(u_mid(isite) + u_mid(jsite))2 + v_mid(ksite)]
Figure A1 Gridcells covering Gothenburg domain and its boundary in EMEP model plotted on latitude-
longitude coordinates The red square represents centre of Gothenburg and the blue line the coastline EMEP i and j coordinates for the boundary gridcells are SE-S = 57-60 SE-N = 57-61 NW-S = 55-60 NW-N = 55-61 NE = 56-62 NW = 56-59 and for Gothenburg grid cells are Gbg-NE = 56-61 Gbg-SW = 56-60
A23 Atmospheric chemistry
The role of secondary chemistry in for the concentration of acetaldehyde are studied by first excluding the primary acetaldehyde emissions from the EMEP model simulations of scenarios S1 and S2 and then by excluding all NMVOC emissions from the car category with spark ignition engines The contribution from the primary acetaldehyde emissions as well as the contribution of secondary acetaldehyde formed from other NMVOC to the total acetaldehyde concentration is then obtained However the secondary chemistry is highly nonlinear due to the interactions of NMVOCs with ozone and OH and thus the results for the contribution of secondary acetaldehyde are somewhat uncertain Differences in acetaldehyde concentrations between S1 and S2 scenarios are studied with respect to contribution of primary and secondary acetaldehyde It is observed that in summer background air the monthly mean contribution of the secondary acetaldehyde is of the same magnitude as the contribution of the primary acetaldehyde to the difference between S1 and
565
57
575
58
585
105 115 125 135 145
Long
Lat
Gbg-SW
Gbg-NE
SE-S
NW-N
NW-S
SE-N
SW
NE
55-59
57-59
55-62
A comparison of emissions from ethanol and petrol fuelled cars IVL report B1962 Health risk assessment for Vaumlstra Goumltaland
31
S2 In the winter and in more polluted atmosphere (Gothenburg grid cells) the contribution from secondary acetaldehyde to the concentration difference appears to be negative due to the chemistry feedback ie the E-85 scenario has less secondary acetaldehyde than the all-petrol scenario
A comparison of S2-S1 differences in primary and secondary acetaldehyde concentrations in the background (=upwind) and Gothenburg grid cells show no increase in the secondary acetaldehyde from upwind to the Gothenburg grid cell It can thus be concluded that there is no significant contribution from secondary aldehydes on the small scale (tenths of km) Conclusion from this sensitivity study is that the secondary formaldehyde can be of importance under summer in the clean background air but that formation on the local scale is unimportant Using EMEP simulated boundary concentrations of acetaldehyde in the local scale model and simulating the primary acetaldehyde emissions will capture the most important features of acetaldehyde dispersion and chemistry in Vaumlstra Goumltaland
In the EMEP model the tail-pipe PM emissions are specified as primary particles Emissions of NOX and VOCs (and NH3 SO2) are oxidised in the atmosphere and a part is then transferred through the gas-to-particle transport to the PM as secondary PM The petrol fuelled cars emit both more primary PM and more NOX compared to the E85 cars If we compare differences in primary and secondary PM between the S1 and S2 scenarios simulated by EMEP we can directly see what part of the difference is from the tail-pipe emissions of the primary particles and what part is from the formation of the secondary PM in atmosphere (mostly from higher emissions of NOX) Table A4 shows the differences between S1 and S2 (S1-S2) of monthly PM averages for January and June (two months with low and high photochemical activities respectively) It can be seen that the higher formation of secondary PM in the S1 (all-petrol) scenario is more important than the higher tail-pipe emission of primary PM by factor 10 - 20
When we compare simulated PM differences between S1-S2 for the background air (=upwind) grid cells and for grid cells including Gothenburg (50 km x 50 km scale) we can see significant increase in primary PM in the S1 scenario from the upwind grid cells to Gothenburg (746 in winter 132 in summer) while no systematic increase can be seen for the secondary PM (-42 in winter +24 in summer) From this comparison it can be concluded that no systematic increase in secondary PM can be seen (in difference from the primary PM) on the scale of 50-100 km and we can neglect this process on the small scale However the overall change in PM concentrations due to the switch of the fuel is very small both on the large scale and on the small scale as can be seen when the differences in PM concentrations between S1 and S2 are compared to absolute PM concentrations in S1 presented in the last column of Table A4
Table A4 Differences in primary and secondary PM concentrations between the lsquoAll-petrolrsquo (S1) and lsquoE-85rsquo (S2) scenarios simulated in gridcells upwind Gothenburg and in gridcells including Gothenburg (2 50 km x 50 km gridcells)
S1-S2 Background
S1-S2 Gothenburg
Increase S1-S2 Gothenburg
S1 Background
μgm3 μgm3 μgm3 bkgnd μgm3
Prim PM10 Jan 00008 00014 00006 746 084
Jun 00008 00018 00010 1319 084
Sec PM10 Jan 00155 00148 -00006
-42 157
Jun 00080 00081 00002 24 213
The sensitivity of the used emission factors for NMHC with respect to the ozone formation in the region of the Swedish West Coast can be analysed with the help of results from studying the
A comparison of emissions from ethanol and petrol fuelled cars IVL report B1962 Health risk assessment for Vaumlstra Goumltaland
32
formation of secondary acetaldehyde In this study first all primary acetaldehyde emitted by the E85 fleet are omitted in a model simulation (S2_nopAA) and secondly all NMHC emissions from the E-85 fleet are switched off (S2_noVOC) Acetaldehyde has a somewhat higher though still comparable photochemical ozone creation potential compared to ethanol (ethanol 44-63 acetaldehyde 68-80 Altenstedt and Pleijel 2000) and this simulation will thus also give information on the sensitivity of the calculations to uncertainties in the ethanol emissions Setting the emission factor for NMHC to zero gives the sensitivity to the emission factor of total NMHC Figure A2 shows the differences in ozone concentration as a result of acetaldehyde only and the total NMHC from the E85 car fleet (S2 scenario) We can see that the effect on ozone formation is very small for the Swedish West coast The reason is that the ozone formation in this area is controlled by the availability of NOX while NMHC or rather their degradation products the peroxy radicals that serve as a lsquofuelrsquo to ozone formation are usually in excess here and further VOC emissions do not increase ozone concentrations significantly The situation looks different in areas that are more heavily polluted with NOX andor which is limited in the availability of peroxy radicals The results from this sensitivity study are fully consistent with the observed increase in ozone concentrations as a result of lower NO emissions (the so-called ozone titration) only very close to the major roads but no larger-scale decrease in ozone concentrations in the Gothenburg area or in any other communities
Figure A2 Sensitivity of the ozone formation in the 2 EMEP model grid cells covering Gothenburg (blue) and in the 6 surrounding grid cells (red see Fig A1) to changes in NMHC emission factor of the E85 fuelled cars lsquobasersquo is simulation S2 with EF for NMHC as in Table 3 lsquonoVOCrsquo is S2 with EF for all NMHC = 0 lsquonopAArsquo is S2 with EF for acetaldehyde = 0 a ndash Mean sensitivity in January absolute difference in ozone formation in ppb(V) as a result of NMHC (base-noVOC) and acetaldehyde (base-nopAA) emissions b ndash Sensitivity relative to ozone concentration in the S2-base simulation January c ndash same as a) but June d ndash same as b) but June
‐002
‐001
0
001
base‐noVOC base‐nopAA
ΔO3(ppb)
a)
0
001
002
base‐noVOC base‐nopAA
ΔO
3(ppb)
c)
‐010
‐005
000
005
base‐noVOC base‐nopAA
ΔO
3
b)
000
002
004
006
base‐noVOC base‐nopAA
ΔO
3
d)
A comparison of emissions from ethanol and petrol fuelled cars IVL report B1962 Health risk assessment for Vaumlstra Goumltaland
33
Appendix 3 Emission results
The geographically distributed NOX and acetaldehyde emissions for the Vaumlstra Goumltaland region are presented in Figures A3 and A4 respectively
Figure A3 NOX emissions for the Vaumlstra Goumltaland region for the All Petrol scenario
A comparison of emissions from ethanol and petrol fuelled cars IVL report B1962 Health risk assessment for Vaumlstra Goumltaland
34
Figure A4 Acetaldehyde emissions for the Vaumlstra Goumltaland region for the All Ethanol scenario
A comparison of emissions from ethanol and petrol fuelled cars IVL report B1962 Health risk assessment for Vaumlstra Goumltaland
35
Appendix 4 Dispersion modelling results
The difference in yearly average concentration between scenario S1 and S2 for acetaldehyde and benzene can be seen in Figure A5 and Figure A6 respectively a)
b)
Figure A5 The difference in yearly average concentrations of acetaldehyde for 2020 between the all E85 (S2) and all petrol (S1) scenarios presented as a) microgm3 and as b) percentage for the Gothenburg area
A comparison of emissions from ethanol and petrol fuelled cars IVL report B1962 Health risk assessment for Vaumlstra Goumltaland
36
a)
b) all E85 c) all petrol
Figure A6 a) the difference in yearly average concentrations (gm3) of benzene for 2020 between the all E85 (S2) and all petrol (S1) scenarios yearly means for b) all E85 and c) all petrol (note the different scales)
The difference in the calculated NOX NO2 and ozone concentrations between the two scenarios are shown in Figures A7 A8 and A9
A comparison of emissions from ethanol and petrol fuelled cars IVL report B1962 Health risk assessment for Vaumlstra Goumltaland
37
a)
b)
Figure A7 The difference in yearly average concentrations of NOX for 2020 between the all E85 (S2) and all petrol (S1) scenarios presented as a) microgm3 and as b) percentage for the Gothenburg area
A comparison of emissions from ethanol and petrol fuelled cars IVL report B1962 Health risk assessment for Vaumlstra Goumltaland
38
a)
Figure A8 The difference in yearly average concentrations of NO2 for 2020 between the all E85 (S2) and all petrol (S1) scenarios presented as a) microgm3 and as b) percentage for the Gothenburg area
A comparison of emissions from ethanol and petrol fuelled cars IVL report B1962 Health risk assessment for Vaumlstra Goumltaland
39
a)
b)
Figure A9 The difference in yearly average concentrations of ozone for 2020 between the all E85 (S2) and all petrol (S1) scenarios presented as a) microgm3 and as b) percentage for mainly the Gothenburg area
A comparison of emissions from ethanol and petrol fuelled cars IVL report B1962 Health risk assessment for Vaumlstra Goumltaland
40
Appendix 5 Detailed Exposure data
Detailed exposure data for the difference between the all E85 (S2) and the all petrol (S1) scenarios can be found in Table A5
Table A5 Exposure data for the difference between the all E85 (S2) and the all petrol (S1) scenarios
Acetaldehyde diff E-P (microgm3)
Populated weighted mean
Number of people Percentage of population
0 - 01 627198 582 01 - 02 163394 152 02 - 03 134879 125 03 - 04 88099 82 04 - 05 38686 36 05 - 06 16880 16 06 - 07 7983 07 07 - 08 1248 01 Tot 014 1078367 Benzene diff E-P (microgm3)
Populated weighted mean
Number of people Percentage of population
-03 - -02 26680 25 -02 - -01 205757 191 -01 - -0 845930 784 Tot -0074 1078367 NO2 diff E-P (microgm3) Populated weighted
mean Number of people Percentage of
population -04 - -03 7698 07 -03 - -02 50131 46 -02 - -01 296288 275 -01 - -0 724250 672 Tot -009 1078367 NOX diff E-P (microgm3) Populated weighted
mean Number of people Percentage of
population -06 - -05 7698 -05 - -04 19639 18 -04 - -03 36626 34 -03 - -02 161685 150 -02 - -01 186500 173 -01 - -0 666219 618 Tot -012 1078367 O3 diff E-P (microgm3) Populated weighted
mean Number of people Percentage of
population -02 - -01 779132 723 -01 - -0 266417 247 0 - 01 32818 30 Tot -012 1078367
Exposure data for the total levels in the two scenarios can be found in Table A6
A comparison of emissions from ethanol and petrol fuelled cars IVL report B1962 Health risk assessment for Vaumlstra Goumltaland
41
Table A6 Exposure data for the total levels in the two scenarios
Acetaldehyde tot All ethanol (microgm3)
Populated weighted mean
Number of people Percentage of population
06 - 07 568825 527 07 - 08 171845 159 08 - 09 124551 115 09 - 10 100946 94 10 - 11 59235 55 11 - 12 30559 28 12 - 13 13175 12 13 - 14 7983 07 14 - 15 1248 01 Tot 077 1078367 Acetaldehyde tot All petrol (microgm3)
Populated weighted mean
Number of people Percentage of population
05 - 06 45111 42 06 - 07 1032008 957 07 - 08 1248 01 Tot 065 1078367 Benzene tot All ethanol (microgm3)
Populated weighted mean
Number of people Percentage of population
0 - 01 1055961 98 01 - 02 22406 2 Tot 005 1078367 Benzene tot All petrol (microgm3)
Populated weighted mean
Number of people Percentage of population
0 - 01 729093 676 01 - 02 232961 216 02 - 03 94042 87 03 - 04 21023 19 04 - 05 1248 01 Tot 010 1078367 NOX tot All ethanol (microgm3)
Populated weighted mean
Number of people Percentage of population
0-10 779108 722 10-20 254658 236 20-30 28683 27 30-40 11070 10 40-50 3426 03 50-60 0 00 60-70 0 00 70-80 639 01 80-90 0 00 90-100 0 00 100-110 783 01 Tot 84 1078367 NOX tot All petrol (microgm3)
Populated weighted mean
Number of people Percentage of population
0-10 769557 714 10-20 264209 245 20-30 28683 27 30-40 11070 10 40-50 3426 03 50-60 0 00
A comparison of emissions from ethanol and petrol fuelled cars IVL report B1962 Health risk assessment for Vaumlstra Goumltaland
42
60-70 0 00 70-80 639 01 80-90 0 00 90-100 0 00 100-110 783 01 Tot 85 1078367 O3 tot All ethanol (microgm3)
Populated weighted mean
Number of people Percentage of population
40-45 1422 01 45-50 26487 25 50-55 176636 164 55-60 770370 714 60-65 103452 96 Tot 569 1078367 O3 tot All petrol (microgm3)
Populated weighted mean
Number of people Percentage of population
40-45 1422 01 45-50 20229 19 50-55 181876 169 55-60 763361 708 60-65 111479 103 Tot 570 1078367 PM25 tot All ethanol (microgm3)
Populated weighted mean
Number of people Percentage of population
1-2 0 00 2-3 885325 821 3-4 192259 178 4-5 783 01 Tot 268 1078367 PM25 tot All petrol (microgm3)
Populated weighted mean
Number of people Percentage of population
1-2 0 00 2-3 868773 806 3-4 208811 194 4-5 783 01 Tot 270 1078367
A comparison of emissions from ethanol and petrol fuelled cars IVL report B1962 Health risk assessment for Vaumlstra Goumltaland
7
particulate matter (PM25 PM10) These emissions are provided for ten anthropogenic source sectors of which only emissions in the road traffic sector changes between the emissions scenarios calculated in this study The emissions are also distributed to vary between months weekdays and over the hours of the day Distribution of the NMVOC emissions between different compounds which are specific to each emission sector and country are used In this study this speciation will vary for road traffic between the scenarios as is described below
For the Vaumlstra Goumltaland region the emissions from traffic and non-road machinery are distributed as 500 m x 500 m grids while emissions from industry and heating plants are treated as point sources (including all physical processes usually connected to that type of sources) Emissions from ships are described as line sources The data are time resolved hourly over the day over the days of the week for each month
25 Dispersion modelling
Effects of the Europe-wide use of the E85 fuel on air pollution in Sweden are studied with two models on two different geographical scales To capture the large-scale changes especially those concerning ozone and other secondary air pollutants the European-scale chemistry transport model EMEP is used (Simpson et al 2003) The effects on exposure of people to air pollutants and consequent health effects are studied using air pollutant concentrations calculated with the small scale dispersion model TAPM which is nudged into EMEP air pollution fields (See Appendix 2 for details) In this way the large scale effects such as formation of ozone secondary PM and secondary aldehydes are accounted for also on the local scale In the case of benzene only the road traffic contribution is calculated due to lack of information on emissions from sources other than traffic
251 Local scale modelling
The TAPM model (Hurley 2008) is used to calculate the local contribution to air pollutants in the Vaumlstra Goumltaland region in the two scenarios The geographically distributed pollutants are then used for the exposure calculations and eventually the health risk assessment TAPM is a three dimensional meteorological and chemical model for air pollution studies that includes topography as well as land-use On the basis of this the model generates the meteorological parameters required for the dispersion modelling such as temperature layering (inversions) and three dimensional wind field all based on daily synoptic input data (large scale meteorological re-analyse data ndashcalled GASP (Global AnalysiS and Prediction) from Australian Government Bureau of Meteorology (wwwbomgovau) TAPM also includes chemistry such as NONO2 ozone SO2 and particle transformation Acetaldehyde and benzene are however not included in the chemical scheme of TAPM and these species are therefore simulated as reactive tracers in this study (see below)
In order to perform the calculations with TAPM a number of input data are required Emission data for the Vaumlstra Goumltaland region as described above Meteorological data Levels of the relevant pollutants on the model domain boundaries for the two scenarios
obtained from the EMEP model A model describing the decay of benzene and acetaldehyde emitted from traffic
A comparison of emissions from ethanol and petrol fuelled cars IVL report B1962 Health risk assessment for Vaumlstra Goumltaland
8
Since acetaldehyde and benzene are not included in the chemical scheme of TAPM their chemical lifetimes are set to be their rate constant with respect to the reaction with OH radicals multiplied by the OH mean concentrations obtained from the EMEP simulations (see below) Four different rates for the four seasons are used according to Table 1
Table 1 Rate constant for reaction with OH and chemical lifetimes for acetaldehyde and benzene used in the TAPM simulations
k(OH) Chemical lifetime (days)
mol-1 cm3s-1
Mar Apr May Jun Jul Aug Sep Oct Nov Dec Jan Feb
Acetaldehyde 15 10-11 12 04 13 155
Benzene 12 10-12 148 49 159 1937
252 EMEP modelling
Several EMEP models are developed and used for air quality policy work in Europe mainly for the Convention on Long-range Trans boundary Air Pollution The Unified EMEP model used in this study is designed to calculate concentrations in air and deposition patterns for major acidifying and eutrophying pollutants photo-oxidants and particulate matter In its standard version it has a 50 km x 50 km resolution in the horizontal direction and 20 layers distributed from the ground up to the pressure level of 100 hPa (ca 16 km) in the vertical direction A detailed description is given in Simpson et al (2003) The meteorological data used for the simulations obtained from wwwemepint are for the year 2005 and are of the same spatial resolution with a time resolution of three hours
As already mentioned the concentration fields generated by the EMEP model are used as an input to the TAPM model Boundary concentration fields for TAPM are calculated from hourly concentrations in the grid cells surrounding the Vaumlstra Goumltaland region that are weighted together with wind field vectors on corresponding boundaries of the Vaumlstra Goumltaland grid cells Since the chemistry of the organic compounds differs between the two models all organic compounds in EMEP are used and recalculated to the reactivity of organic compounds as used by TAPM
While the role of NOX NMVOC and primary PM can be investigated directly by simulations of emission in scenarios S1 and S2 effects of E85 fuelled cars on concentrations of acetaldehyde benzene and secondary PM are obtained from additional sensitivity runs The contribution of the emissions from the use of E85 fuel on acetaldehyde concentrations can be modelled directly in the EMEP model which includes also the formation and consumption of acetaldehyde in atmospheric reactions However TAPM does not include these processes and therefore the role of acetaldehyde formation is investigated further Two additional EMEP simulations are run one excluding primary acetaldehyde emissions and one excluding all NMVOC emissions from petrol and E85 fuelled vehicles By relating the results of these runs to the results of S1 and S2 the contribution of primary and secondary acetaldehydes respectively can be deduced The results from this analysis can be found in Appendix A23 The conclusion is that on the scale of the Vaumlstra Goumltaland region the formation of acetaldehydes in the atmosphere is not important and therefore the acetaldehyde concentration in TAPM can be described using the lifetimes given in Table 1 Further also the impact of the NMHC emissions on the ozone levels is studied (Appendix 23) and found to be small
Benzene is not included explicitly in the EMEP model The benzene concentrations are therefore studied in sensitivity runs with benzene from road traffic added to the S1 and S2 scenarios as
A comparison of emissions from ethanol and petrol fuelled cars IVL report B1962 Health risk assessment for Vaumlstra Goumltaland
9
methanol which has similar atmospheric lifetime as benzene The benzene concentration is then obtained by comparing the methanol concentration from the different runs
The contribution of primary and secondary PM respectively is investigated by excluding the primary PM from petrol and E85 fuelled vehicles in separate runs of the EMEP model The PM boundary values for the TAPM modelling are not separated into secondary and primary PM The results from this analysis are used to draw general conclusions about the difference in secondary PM formation between the two scenarios
26 Exposure
The human exposure of the annual mean concentrations of NOX NO2 O3 acetaldehyde and benzene are calculated based on the dispersion calculations of the Vaumlstra Goumltaland area in combination with the population density The population density distribution for the region is obtained from EEA (EEA 2009) and shown in Figure 3 The total population in the investigated area is 1 078 400
Figure 3 Population density distribution (number of people in a 1 km x 1 km grid for 2006) for the investigated area (according to Figure 1)
A comparison of emissions from ethanol and petrol fuelled cars IVL report B1962 Health risk assessment for Vaumlstra Goumltaland
10
27 Health effects and risk assumptions
271 NOX and NO2
Using modelled levels of NOX in the residential area as a vehicle exhaust marker a Norwegian study of 16 000 men from Oslo of whom 25 died during the follow up found a strong association (Nafstad et al 2004) This cohort with people of between 40-49 years of age at the start of the study was followed from 197273 through 1998 NOX was estimated in a model with 1000 m grids and a street contribution added for the largest streets When the median concentration of NOX for 1974-78 was used (mean 107 μgm3) the relative risk for total non-violent mortality was 8 per 10 μgm3 Nitrogen oxides do not have to be important as causal components behind this association
272 Ozone
Short-term effects of ozone on the respiratory system and on daily number of deaths have been reported from a large number of studies especially for summer concentrations why a threshold has sometimes been assumed in impact assessments Only recently has an effect of long-term exposure on mortality been reported from the very large American Cancer Society (ACS) Cohort Study (Jerret et al 2009)
Jacobson (2007) reported that E85 would cause an increase in mortality but assumed an effect of short-term exposure only The estimated impact was explained by the calculated ozone formation
273 Acetaldehyde
An increased incidence of nasal tumours in rats and laryngeal tumours in hamsters were observed after inhalation of high concentrations of acetaldehyde (HEI 2007) A few epidemiological studies of occupational exposure found associations but with a complex mixture of chemicals and have not been used in the cancer risk assessment for acetaldehyde Acetaldehyde is classified by the National Institute of Occupational Safety and Health as ldquoa potential human carcinogenrdquo by the US EPA (1999) as ldquoa probable human carcinogenrdquo and by the IARC as ldquopossibly carcinogenic to humansrdquo (OEHHA 1999 HEI 2007)
274 Benzene
There is clear and widely accepted evidence from a variety of epidemiologic studies of occupational exposure that benzene increase the risks of acute myeloid leukaemia (HEI 2007) but there is more uncertainty about other lymph hematopoietic cancers Studies on traffic exposure and childhood leukaemia have produced mixed results with regard to associations
275 Formaldehyde
IARCrsquos Monograph 88 says that the evidence is sufficient to conclude that formaldehyde causes cancer in humans (IARC 2006) This was because of evidence of nasopharyngeal cancer at concentrations historically encountered in industrial settings However this conclusion by IARC was largely based on the results from one occupational exposure site and the results and conclusions have not been supportive in other reviews and more recent studies (Bosetti et al 2006 Beane Freeman et al 2009 Bachand et al 2010) OEHHA (1999) uses a lifetime risk for cancer of 0000006 per microgm3 for formaldehyde and US EPA (1999) a lifetime risk of 0000013 per microgm3
A comparison of emissions from ethanol and petrol fuelled cars IVL report B1962 Health risk assessment for Vaumlstra Goumltaland
11
For non-cancer effects the eye is the organ most sensitive to formaldehyde subjective irritation has been reported at 300-500 microgm3 which is above the odour thresholds (Wolkoff amp Nielsen 2010) Effects in the eyes and in airways occur around 600ndash1000 μgm3 Effects on lung function have not been found in controlled human exposure studies below 1 mgm3 In epidemiological studies of associations between formaldehyde and exacerbation of asthma several co-pollutants make the findings difficult to interpret An indoor air quality guideline of 100 μgm3 has been considered protective against both acute and chronic sensory irritation in the airways in the general population assuming a lognormal distribution of nasal sensory irritation (Wolkoff amp Nielsen 2010)
276 PM
In the studies of long-term exposure to PM25 and mortality like the American Cancer Society (ACS) Cohort the exposure contrast were mainly related to secondary PM why the reported relative risk approx 6 increase in all-cause mortality (in adults) per 10 μgm3 is most relevant for background secondary PM concentrations (Pope et al 1995)
277 Health Impact Assessment
To summarize the types of pollutants that are found possible to include in the health impact assessment are NOX and NO2 benzene acetaldehyde formaldehyde secondary PM and ozone The assessment is restricted to the most important and well established effects of these pollutants This means that not all types of potential health impacts are included Results should however do for a comparison of the scenarios
The impact on formaldehyde levels are not calculated why it is not included in the current assessment Relative risks from epidemiological studies of vehicle exhaust using NOX and NO2 as exposure variables may be influenced from effects of their co-pollutants mainly ultrafine particles (elemental carbon soot) CO and HCs such as formaldehyde Exhaust particles are often introduced in a relatively high background of particles from other sources Thus exhaust particles were not measured directly in the important studies of long-term exposure and effects on mortality
3 Results
31 Emission factors
The emission factors are selected from available published data both for the exhaust and the evaporative emissions In both cases values relative to petrol are used The majority of the studies have been done with both E85 and petrol making this comparison more robust
Westerholm et al (2008) tested two flexi-fuel cars with E5 E70 and E85 in the European driving cycle NEDC and in the Artemis driving cycles The former is used at two temperatures (22degC and -7degC) They report the regulated emissions greenhouse gases a number of organic compounds and particle number Graham et al (2008) present measurement results for regulated emissions greenhouse gases and a number of organic compounds from four cars with E85 and regular petrol in the FTP cycle They also made a compilation of literature data for ethanol cars Yanowitz and McCormick (2009) present an analysis of US certification testing data in order to compare emissions for E85 and petrol
A comparison of emissions from ethanol and petrol fuelled cars IVL report B1962 Health risk assessment for Vaumlstra Goumltaland
12
The results from the three studies (for flexi fuel cars) and in addition the values used by Jacobson (2007) are given in Table 2
Table 2 Emissions factors for E85 fuelled cars relative to the emission factors for petrol fuelled cars
Relative change E85 vs petrol ()
Yanowitz and McCormick (2009) (95 conf)
Graham et al (2008) (sd )
Westerlund et al (2008) (average for NEDC)
Jacobson (2007)
NOX -14 (-23 - -5) -42 (15) -38 -30 NMOG 26 (17 - 37) 12 (39) NMHC -43 (-52 - -32) -45 (24) THC -14 (-24 - -4) 2 TOG 22 CO -19 (-25 - -12) -5 (51) 1 5 PM 25 0 Formaldehyde 59 (32 - 91) 80 (44) 184 60 Acetaldehyde 2855 (1189) 1031 2000 13 Butadiene -64 (31) -74 -10 Benzene -72 (15) -71 -79 Ethanol 3950 from TOG Methane 50 43
Table 2 shows lower emissions of NOX for E85 fuelled cars relative to petrol fuelled cars from test cycles generally including cold starts The emissions of hydrocarbons are higher for petrol while the emissions of organic gases are somewhat higher for E85 The emissions of aldehydes especially acetaldehyde are much higher for E85 as are the emissions of ethanol and methane The emissions of benzene and 13-butadiene are higher with petrol It should be noted that the data in Table 2 are in general for tests performed at ambient temperatures of around 20 degC Westerlund et al (2008) report that for ambient temperatures of -7 degC the emissions of CO and NMHC may be significantly higher with E85 compared with petrol For one vehicle they also report very high NOX emissions with petrol at this lower temperature
As seen in Table 2 there are a number of different quantities when it comes to the emission of organic compounds or unburnt fuel From a chemistry point of view HC is no molecule but a notation for the sum of all compounds that are hydrocarbons thus are of the form HxCy and not containing any elements but carbon and hydrogen Total organic gases (TOG) include organic compounds containing oxygen such as alcohols and aldehydes (but not CO or CO2) Volatile organic compounds (VOC) means carbon containing organic compounds present in the gaseous state at ambient temperature Non-methane hydrocarbons (NMHC) means HC minus the methane mass NMTOG and NMVOC are defined in the corresponding way1
1 When it comes to exhaust gas regulations the definitions differ somewhat In the US THC is defined as the signal obtained from a FID (Flame Ionisation Detector) instrument calibrated on propane This means that alcohols and aldehydes contribute to THC but to a lower extent since their responses in a FID instrument are lower than for hydrocarbons TOG is defined in the US regulations as THC + the mass of alcohols (eg methanol) and carbonyls (eg formaldehyde) measured separately NMHC is equal to THC ndash rCH4CH4 ndashralcAlc where the CH4-concentration is measured by gas chromatography and a FID calibrated with methane Alc is the alcohol concentration and rCH4curren and rAlc are the respective FIDresponse functions NMOG means TOG - CH4 and VOC is TOG - CH4 - C2H6 In the regulations it is stated that also a number of other non-ozone forming organic compounds eg acetone should be subtracted but these are present in very low concentrations in engine exhaust Note that there is actually a double counting of aldehydes in NMOG since they contribute to a certain extent to the NMHC value and then are added using values from separate measurements
A comparison of emissions from ethanol and petrol fuelled cars IVL report B1962 Health risk assessment for Vaumlstra Goumltaland
13
There will be emission limits for both THC and NMHC in also the future For petrol cars with low methane emissions the challenge will be to meet the limit for NMHC For E85 cars with higher methane emissions the challenge will be to meet the THC limit Thus it is reasonable that the emissions of NMHC from E85 cars will be lower than for petrol cars
In the modelling presented here the emission factors from Graham et al (2008) are used with some exceptions as will be discussed The reason is that that study comprises a compilation of a relatively large number of tests For CO the emission factor is set to the same value for E85 and petrol since the differences are small and within the uncertainty For particle emissions the studies cited in Table 2 give little information Instead data from Ericsson et al (2008) are used indicating that the primary PM emission using E85 is about 65 of that when using petrol For NOX the emission for E85 is set to 58 of that for petrol
The emission factors for NMHC (physical emission in gkm) including ethanol are in this study set to the same value for E85 as for petrol This is in line with the data for NMOG reported by Graham showing only small differences It is also reasonable considering that the car producers optimize emissions to meet the future emission legislation in Europe for NMHC and THC i e the Euro 6 standards that apply from September 2014 For petrol with low CH4 emissions the NMHC value will be limiting and this is on 68 mgkm For E85 with higher CH4 emissions the THC value of 100 mgkm will be limiting When considering the FID response as a measure of emission instead of physical emission about 50 of the THC comes from NMHC for E85 cars However the FID response is low for ethanol which means that the physical NMHC emission is about 25 higher Considering these factors the emissions of NMHC (physical) for E85 can be expected to be around 50 mgkm 125 = 625 mgkm which is about the same as for petrol The methane emission for E85 is set to 142 times the value for petrol following Lipman and Delucchi (2002) Further also the differences in the evaporate emissions are considered as is described in Appendix 1
The emissions factors for petrol cars are taken from the Artemis model (Andreacute 2005) The distribution of NMHC for petrol cars is from Passant (2002) The resulting emission factors used to obtain the emissions scenarios are presented in Table 3
In Europe THC is defined as the signal from a propane calibrated FID and thus contains oxygen containing compounds although the response factors for the latter are lower The FID instrument gives the number of molecules and in order to calculate the mass the EU regulations use the densities obtained from assuming the molecular formulas C1H274O0385 (209 gmole) for E85 and C1H189O0016 (1415 gmole) for petrol This thus compensates for the lower response factor for ethanol and acetaldehyde NMHC is obtained by subtracting the concentration of CH4 (times the FID response factor) measured separately
A comparison of emissions from ethanol and petrol fuelled cars IVL report B1962 Health risk assessment for Vaumlstra Goumltaland
14
Table 3 Emission factors (gkm) for 2020 for passenger cars (including evaporative emissions but excluding wear particle emissions) used in the modelling
Petrol E85 NOX 0112 0065 CO 179 174 PM 00013 00008 CH4 0013 0018 NMHC 033 028
division of NMHC Ethanol 00000 01898 Acetaldehyde 00025 00299 Ethene 00244 00237 Ethyne 00094 00011 Formaldehyde 00057 00072 Benzene 00187 00045 13 Butadiene 00030 00009 Ethane 00107 00009 Alkanes C3+ 00928 00076 Alkenes C3+ 00301 00025 Aromatics C7+ 01297 00106 Aldehydesketones C3+ 00051 00004
sum NMHC 03321 02792
32 Emissions
The emissions from road traffic vary between the two scenarios due to the differences in the emission factors From the EMEP modelling the total emissions from road traffic in the different scenarios are calculated for the countries included In Figure 4 emissions of NOX NMVOC and PM in the S2 (E-85) scenario relative to the S1 (all-petrol) scenario are shown for these countries The relative change is larger for countries with a high fraction of petrol cars relative to diesel cars (since the latter are the same in the two scenarios) such as Russia and Ukraine The relative change is smallest for PM emissions due to the very small contribution of the exhaust particles from petrol fuelled cars compared to the contribution from diesel vehicles and wear particles
A comparison of emissions from ethanol and petrol fuelled cars IVL report B1962 Health risk assessment for Vaumlstra Goumltaland
15
Figure 4 National emissions of NOX NMVOC and PM from the road traffic sector in E85 scenario (S2)
relative to lsquoall-petrolrsquo scenario (S1)
An important difference in the emissions between the scenarios lies in the speciation of the NMVOC emissions Figure 5 shows this speciation of NMVOCs for all road traffic emission categories used in this study The two rightmost bars in Figure 5 show the NMVOC speciation for Swedish road traffic emissions for the two scenarios S1 and S2 Comparison with Figure4 shows that the relative changes between the two scenarios are much larger for some individual NMVOC species that for the total NMVOC emissions Since the NMVOC emissions from traffic in Sweden are dominated by the emissions from petrol cars (about 85 of the road traffic emissions of NMVOC comes from petrol cars) the variations in NMVOC speciation between petrol and E85
0
02
04
06
08
1
NOx
0
02
04
06
08
1
NMVOC
0
02
04
06
08
1
Aus
tria
Bel
arus
Bel
gium
Bos
-Her
cB
ulga
riaC
roat
iaC
ypru
sC
zech
Rep
Den
mar
kE
ston
iaFi
nlan
dFr
ance
Ger
man
yG
reec
eH
unga
ryIr
elan
dIt
aly
Lat
via
Lith
uani
aL
uxem
bour
gM
alta
Net
herla
nds
Nor
way
Pola
ndPo
rtug
alR
oman
iaR
ussi
a_E
uro
Slov
ak R
epSl
oven
iaSp
ain
Swed
enSw
itzer
land
Tur
key
Ukr
aine
UK
PM
A comparison of emissions from ethanol and petrol fuelled cars IVL report B1962 Health risk assessment for Vaumlstra Goumltaland
16
will have a significant impact on the total road traffic NMVOC speciation As can be seen in Figure 5 scenario S1 is dominated by alkanes and aromatics while scenario S2 is dominated by ethanol It can also be noted that S1 contains a significant emission of benzene which is much lower in S2 while the opposite is true for acetaldehyde
Figure 5 Distribution of hydrocarbon species in NMVOC emissions from individual road traffic emission
categories as defined in emission scenarios in this study and from the whole road traffic emission sector in Sweden for scenarios S1 (All petrol) and S2 (All E85)
Figure 6 shows a map of the EMEP domain with emissions of acetaldehyde for the two studied scenarios as an example of the geographical distribution of emissions
Figure 6 Gridded emissions of acetaldehyde for the year 2020 (in tonnes per grid cell (50 km x 50 km)
and year) a ndash lsquoAll petrol scenario b ndash lsquoAll E85 scenariorsquo
As mentioned the emissions from road traffic in the Vaumlstra Goumltaland region are calculated in a 500 m x 500 m grid Figure 7 shows the emissions of NOX for 2005 as obtained from the database and the projected emissions for 2020 with a mixed use of E85 and petrol This can be considered as the base case for the emissions in 2020 It can be seen that the emissions decrease over the period which is due to reduction in NOX emissions factors as older vehicles are replaced by newer models (the traffic actually increases from a total of 754x109 vehicle-kilometres in 2005 to 937x109
0
20
40
60
80
100
Pet
rol e
xh
Pet
rol e
vap
E-8
5 ex
h
E-8
5 ev
ap
Pet
rol M
C
Die
sel L
DV
Die
sel H
DV
Roa
d Sw
eden
S1
Roa
d Sw
eden
S2
m
ass
Ethane
Alkanes C3+
Ethene
13 Butadiene
Alkenes C3+
Ethyne
Benzene
Aromatics C7+
Formaldehyde
Acetaldehyde
Aldket C3+
Ethanol
A comparison of emissions from ethanol and petrol fuelled cars IVL report B1962 Health risk assessment for Vaumlstra Goumltaland
17
vehicle-kilometres in 2020) The major roads in the region are clearly visible as well as the larger cities (especially Gothenburg)
Figure 7 Emissions of NOX (kgyear for a 500 m x 500 m grid cell) in the Vaumlstra Goumltaland region for 2005
and for 2020 for the base case
In Table 4 the traffic emissions for NOX benzene acetaldehyde ethanol and PM10 for the Vaumlstra Goumltaland region are shown for the four different emissions scenarios The emissions of NOX and benzene are reduced between 2005 and 2020 for the base case while the emissions of ethanol and acetaldehyde increase due to an expected increase in the use of ethanol fuel The NOX emissions for S1 are somewhat higher than for S2 due to the higher NOX emissions factor for petrol compared with E85
Table 4 Emissions from traffic for the Vaumlstra Goumltaland region in four different emission scenarios (in tonnesyear)
Substance base 2005 base 2020 S1 S2 NOX 13 243 4 843 4 954 4 631 Benzene 2 833 927 1 201 386 Acetaldehyde 628 1 074 305 2 595 Ethanol 192 5 192 0 15 400 PM10 1 324 486 483 476
33 Dispersion modelling
Resulting concentrations from calculations of the S1 and S2 scenarios with the EMEP model are used to provide input of primary and secondary air pollutants for the calculations with the TAPM model for the Vaumlstra Goumltaland region Concentrations of NOX NMVOC PM25 PM10 acetaldehyde ethanol and benzene are therefore calculated as boundary conditions for the Vaumlstra Goumltaland region In addition sensitivity studies are performed to investigate the role of formation of secondary acetaldehyde and secondary particulate matter (see Appendix 2) Time series analysis of the TAPM and EMEP model results of the S1 and S2 scenarios are presented in Figure 8
A comparison of emissions from ethanol and petrol fuelled cars IVL report B1962 Health risk assessment for Vaumlstra Goumltaland
18
a)
b)
Figure 8 Time series analyses of S1 and S2 scenarios for the EMEP and TAPM modelled concentrations of NOX and ozone at an urban background site in Gothenburg (TAPM) and in EMEP model grid cells including Gothenburg city (50 km x 50 km)
Concentrations of NOX and ozone at an urban background site in Gothenburg (TAPM) and in the 50 km x 50 km EMEP grid cells including Gothenburg are compared for one summer and one winter month Due to the well-known process of ozone titration by freshly emitted nitrogen monoxide (Seinfeld and Pandis 1998) the concentration of ozone often decreases in urban areas This phenomenon is expected to be captured by the fine-gridded TAPM model but not necessarily by the courser scale of the EMEP model Figure 8 shows the generally higher NOX levels in the small grid cell of the TAPM model in urban background location comparing to those in the large EMEP grid cell while the opposite is observed for the ozone concentrations (Remember that the boundary concentrations for TAPM are obtained from the EMEP model and they are thus the same in both cases) This indeed shows that local scale emissions and processes contribute to locally increased levels of NOX in urban areas both for the summer and the winter cases For ozone where there of course are no primary emissions the situation is the opposite where instead the result is decreased concentration levels at urban sites on a local scale The influence of the
A comparison of emissions from ethanol and petrol fuelled cars IVL report B1962 Health risk assessment for Vaumlstra Goumltaland
19
NMHC emissions from the passenger cars is studied in a sensitivity analysis (see Appendix 23) and it is found to have only a small influence on the ozone levels
To illustrate the results of the different scenario calculations the geographically distributed concentrations are presented as the difference in yearly average concentrations between the all E85 (S2) and all petrol (S1) scenarios both as microgm3 and sometimes as percentage of the difference to scenario S1 (see Appendix 3)
The difference in yearly average concentrations between scenario S1 and S2 for acetaldehyde and benzene can be seen in Figures 9 and 10 respectively The increase in acetaldehyde concentration resulting from a switch from petrol to E85 is up to about 05 gm3 or 80 in the central parts of the largest urban area of the region Gothenburg Outside this area the relative increase is about 10 for the other urban areas and less than that for the rural areas This large relative increase (see map in Appendix 4) is a result of the relatively high emissions of acetaldehyde from E85 fuelled cars For benzene the situation is opposite In the scenarios for 2020 the concentration of benzene decreases by up to a few tenths of gm3 as a result of a switch from petrol to E85 For benzene the relative change is not calculated
Figure 9 The difference in yearly average concentrations of acetaldehyde for 2020 between the all E85 (S2) and all petrol (S1) scenarios (microgm3)
A comparison of emissions from ethanol and petrol fuelled cars IVL report B1962 Health risk assessment for Vaumlstra Goumltaland
20
Figure 10 The difference in yearly average concentrations (gm3) of benzene for 2020 between the all E85 (S2) and all petrol (S1) scenarios
The difference in the calculated NOX NO2 and ozone concentrations between the two scenarios are shown in Appendix 4 The change in NOX concentration between the two scenarios only represents a small fraction of the total NOX concentration This is because the emissions of NOX from petrol cars are relatively low compared with the contribution from diesel engines and other sources Thus the resulting decrease in the NOX concentration with E85 is only up to 3 For ozone there is a small increase of about 01 microgm3 of E85 in the central areas of Gothenburg where there is relatively high traffic intensity (see Appendix 4 Figure A9) In the rest of the region there is a small decrease in the ozone concentration in the E85 scenario
34 Exposure
The resulting concentrations from the dispersion modelling together with the population density distribution are used to assess the exposure to acetaldehyde benzene NO2 NOX and ozone for the two scenarios S1 and S2 The exposure to PM25 is very similar for the two scenarios (the difference in concentration between scenarios S2 and S1 is only about -002 gm3 Table 5 shows the population weighted mean exposure both as total concentrations and as the difference between the two scenarios Detailed exposure results can be found in Appendix 5 It can be seen that the exposure to all the pollutants in Table 5 with the exception of acetaldehyde are somewhat lower for the all E85 scenario (S2) than for the all petrol scenario (S1) However the effect on health also
A comparison of emissions from ethanol and petrol fuelled cars IVL report B1962 Health risk assessment for Vaumlstra Goumltaland
21
depends on the level of the dose-response functions For example if the level of concentration is low in a populated area but the dose-response function is high the effect of even a low concentration increase can become important The increase in exposure from S1 to S2 (S2-S1) calculated as percentage of the population exposed to increased mean concentrations of pollutants is presented in Figure 11
Table 5 Populated weighted mean exposure (gm3)
S1 S2 S2-S1 Acetaldehyde 065 077 014 Benzene 01 005 -007 NOX 85 84 -012 Ozone 570 569 -012 PM25 270 268 -002
Increased concentrations Decreased concentrations Both increased and
decreased conc
Figure 11 The relative exposure (S2-S1) calculated as percentage of the population
In Figure 11 it is clear that the only pollutant that does not show an improvement regarding air quality and thus the health risks when modelling a switch from petrol to E85 is acetaldehyde For all pollutants except for ozone the changes of concentration levels observed between the scenarios are within the urban areas but for ozone there are also differences in rural areas
According to the data in Figure 11 about 14 of the population in the Vaumlstra Goumltaland region will be exposed to 03-08 microgm3 higher concentration levels of acetaldehyde in scenario S2 relative to S1 From Figure 9 it can be seen that the majority of these people live within the Gothenburg area Further about 28 of the population will be exposed to increased levels of between 01 to 03 microgm3 mainly in the suburban areas and rural surroundings of Gothenburg but also in some of the smaller cities in the region Outside the urban areas the concentration difference is lower than 01 microgm3
In the S2 scenario relative to the S1 scenario the population is exposed to decreased concentration levels of benzene and NOX This is mainly true also for O3 but with an exception for the central
A comparison of emissions from ethanol and petrol fuelled cars IVL report B1962 Health risk assessment for Vaumlstra Goumltaland
22
parts of Gothenburg where the concentration actually increases (see Appendix 4 Figure 7A) resulting in that 3 (blue area in Figure 11 for O3) of the population will be exposed to higher concentrations of O3 For the rest of the area there are decreased concentrations of ozone upon a switch to E85
The largest differences are again in the central parts of Gothenburg where about 20 of the population is being exposed to a lower benzene concentration of 01-03 microgm3 This also means that concerning benzene the majority (78) of the population have none or very low influence from a change to ethanol fuel
The largest effect on exposure difference is seen for NOX where just over 20 of the population has its exposure decreased with 03-05 microgm3 (in the central parts of Gothenburg) In the suburbs the decrease is between 01-02 microgm3 lower Along the largest roads there is a small but visible improvement on a yearly basis of 01 microgm3
For PM25 there is a difference in the populated weighted mean exposure of 002 gm3 between the scenarios with a lower value for the all-E85 case (see also Appendix 5)
35 Impact on health in Vaumlstra Goumltaland
351 NO2 and NOX
The impact of long-term exposure on mortality was estimated using the relative risk from the Norwegian cohort study (Nafstad et al 2004) reporting a relative risk of 08 increase per microgm3 increase in NOX however without adjustment for particle concentrations Assuming this effect on the total mortality and a typical baseline mortality of 1000 deaths per 100 000 person years a decrease in the population mean exposure of 012 microgm3 would correspond to approximately 104 less preterm deaths per year However for the present case this number is highly uncertain since the exposure to substances normally associated with changes in NOX exposure may here change in different ways since the relation between different exhaust components varies between the scenarios
The impact of long-term exposure on asthma incidence (new cases) in adults has been estimated using results from the Swedish RHINE Study Cohorts (Modig et al 2009) with very similar results in the ECRHS Study corresponding to approx 4 increase per microgm3 increase in NO2 From the RHINE Study the incidence can be estimated to 03 per year (proportion of adults developing the disease) with children and elderly excluded this means around 1500 adult cases per year A reduction of 009 microgm3 corresponds to 54 avoided new cases of adult asthma per year However also NO2 in the asthma study may have been mainly an indicator of vehicle exhaust
352 Ozone
The impact of long-term exposure on respiratory mortality has been reported to be approx 02 per microgm3 increase in the summer concentration when studied in the large ACS Cohort (Jerret et al 2009) Assuming this effect on the total population and a typical baseline respiratory mortality of 100 deaths per 100 000 person years a decrease in the population mean exposure of 012 microgm3 corresponds to approximately 03 less preterm deaths per year
A comparison of emissions from ethanol and petrol fuelled cars IVL report B1962 Health risk assessment for Vaumlstra Goumltaland
23
353 Acetaldehyde
According to US EPA (1999) a lifetime risk for cancer of 0000002 per microgm3 is to be assumed for this potential human carcinogen An increase in the population mean exposure of 012 microgm3 corresponds to 026 cases more per year in the current population
354 Benzene
According to US EPA (1999) a lifetime risk for cancer (leukaemia) of 00000022-00000078 per microgm3 is to be assumed for this human carcinogen A decrease in the population mean exposure of 0074 microgm3 corresponds to approximately 03 cases less per year in the current population (assuming 0000004 per microgm3)
355 PM25
In CAFEacute and other impact assessments a relative risk of 6 increase in all-cause mortality per 10 microgm3 has usually been assumed Assuming this effect on the total mortality and a typical baseline mortality of 1000 deaths per 100 000 person years a decrease in the population mean exposure of 002 microgm3 corresponds to approximately 13 less preterm deaths per year
4 Discussion
In this study the health risks from a large introduction of E85 to replace petrol is analysed in scenario studies for 2020 for the Vaumlstra Goumltaland region It is found that the change in pollutant concentration exposure and health risks are small between the two scenarios It should be emphasized that the study only considers vehicle emissions and does not take into account effects from the fuel production
The emissions of NOX in the model are somewhat lower from E85 fuelled cars than from petrol fuelled cars This is in line with the emission factors used by Jacobson (2007) The nitrogen oxides are key substances in the atmospheric reactions determining the concentrations of ozone in air NOX is involved in the formation of ozone but close to the NO source the ozone concentration is lowered due to the rapid reactions between NO and O3 forming NO2 If NO is released in an environment with already high NO concentration it may result in lowering of ozone levels on the regional scale In the present study the ozone concentrations calculated are somewhat lower for the E85 scenario than for the petrol scenario
The health risk analysis shows that the main difference between the scenarios is due to the lower concentration of NOX However it may have been other exhaust components than NOX such as exhaust particles that were behind the reported association with mortality In cases when NOX is not a good indicator of exhaust particle emissions and their toxicity our results may be misleading This should be studied further Neglecting the effects of the changes in NOX exposure the total difference between the scenarios sums up to 16 preterm deaths per year with lower values for the E85 scenario while it would sum up to 12 less preterm deaths for the E85 scenario if the effect related to NOX were included Since there are no similar studier for the effect on mortality among those younger than 30-50 years of age we assume the same relative effect on mortality in all ages This makes only a small difference since the large majority of deaths occur in older groups
A comparison of emissions from ethanol and petrol fuelled cars IVL report B1962 Health risk assessment for Vaumlstra Goumltaland
24
The opposite result for the ozone concentration was obtained by Jacobson The reason for this discrepancy is that the Jacobson study concerns Los Angeles a region with high concentrations of pollutants while the study here concerns the Vaumlstra Goumltaland region with much less dense traffic and also lower concentrations of pollutants importantly NOX It is not unlikely that the effect that Jacobson report also would be found for large parts of Europe with higher traffic densities than in the Vaumlstra Goumltaland region
It is worth to emphasize that the major negative health effect in the Jacobson (2007) study is attributed to the increase in ozone concentration that is a result of the decrease of the NO emissions from E85 cars Directly after the emission NO reacts with ozone resulting in drop of the ozone concentration the so-called ozone titration commonly observed in many cities This NO does however form even higher quantities of ozone further downwind contributing to the general increase in the background ozone levels It is also precursor of NO2 secondary PM and other toxic species as eg PAN and hence reductions in NO emissions are never regarded as disbeneficial from the environmental viewpoint
There are of course several sources of uncertainties that influence the results of this study Since the main results concern differences between the two scenarios several of these factors loose on importance for the conclusions This comprises uncertainties in meteorology in future traffic volumes and in the population density distribution However there are some uncertainties that remain important The emission factors for E85 fuelled cars are much less characterised than what they are for petrol cars The emission of particles from E85 fuelled cars is especially uncertain with only very few published results Also the emissions of NMHC are somewhat uncertain and may be higher for E85 at lower ambient temperatures However the sensitivity analysis performed shows that for the studied region the NMHC emissions only have a small influence on the ozone concentrations
5 Conclusions
In this study the impact of tailpipe and evaporative emissions from E85 fuelled cars on air pollution and health risks are calculated and compared with petrol fuelled cars The scenario calculations for the Vaumlstra Goumltaland Region give data on emissions pollutant concentrations exposure and a health risk evaluation
The differences in emission factors between E85 and petrol lies in the emissions of PM and NOX which are about 65 and 58 for E85 relative petrol respectively Also the speciation of the emitted hydrocarbons is significantly different with large emissions of acetaldehyde and ethanol from E85 and large emissions of benzene higher aromatics alkanes and alkenes from petrol
These differences in emission factors reflect in differences in emissions The emission calculations for all Swedish road traffic show a decrease for the E85 scenario relative to the petrol scenario of 65 for NOX 34 for PM25 67 for benzene For acetaldehyde there is an increase of 770
The differences obtained from the TAPM modelling show decreased levels of NOX ozone and benzene with E85 and increased levels of acetaldehyde For the latter the increase may be up to 80 while NOX and ozone show decreases of up to a few per cent and a few tenths of per cent respectively
A comparison of emissions from ethanol and petrol fuelled cars IVL report B1962 Health risk assessment for Vaumlstra Goumltaland
25
The health risk assessment shows decreased health risks in the E85 scenario relative the all-petrol scenario due to the increased NOX exposure correlated with both preterm deaths and asthma However NOX may be mainly an exhaust indicator Smaller effects are expected from the changes in ozone acetaldehyde and benzene exposure The overall difference considering the exposure to PM acetaldehyde benzene and ozone is 16 preterm deaths with lower values for the E85 scenario
6 Acknowledgements
Saab Automobile The Swedish Transport Administration and The Foundation for the Swedish Environmental Research Institute are gratefully acknowledged for financial contribution
Magnus Ekstroumlm and Maria Holmstroumlm at Saab and Martin Juneholm at the Swedish Transport Administration are acknowledged for their most valuable input to the study
David Simpson Norwegian Meteorological Institute EMEP MSC-W Norway and Dept Radio amp Space Science Chalmers Univ Technol Sweden is gratefully acknowledged for help with implementation of the Unified EMEP model
A comparison of emissions from ethanol and petrol fuelled cars IVL report B1962 Health risk assessment for Vaumlstra Goumltaland
26
7 References
Altenstedt J Pleijel K 2000 An alternative approach to photochemical ozone creation potentials under European conditions J Air amp Waste Manage Assoc 50 1023 ndash 1036
Andre J-M (2005) Vehicle emission measurement collection of the ARTEMIS datatbase Artemis 3312 report Available from httpwwwinretsfrurltepublicationspublications-pdfJoumardA3312reportJMALTE0504pdf
Bachand A MMundt K A Mundt D JMontgomery R R Epidemiological studies of formaldehyde exposure and risk of leukemia and nasopharyngeal cancer A meta-analysis Critical Reviews in Toxicology 2010 40(2) 85ndash100
Beane Freeman L E Blair A Lubin J H Stewart P A Hayes R B Hoover R N Hauptmann M Mortality from lymphohematopoietic malignancies among workers in formaldehyde industries The National Cancer Institute Cohort J Natl Cancer Inst 2009101751ndash761
Bosetti C McLaughlin J K Tarone R E Pira E LaVecchia C Formaldehyde and cancer risk A quantitative review of cohort studies through 2006 Ann Oncol 20081929ndash43
ConcaweJRC Well-to-wheel studies httpiesjrceceuropaeuwtwhtml
Derwent R G Jenkin M E Saunders S M 1996 Photchemical ozone creation potentials for a large number of reactive hydrocarbons under European conditions Atmos Environ 30 181 ndash 199
Derwent RG Jenkin ME Passant NR Pilling MJ 2007 Photochemical ozone creation potentials (POCPs) for different emission sources of organic compounds under European conditions estimated with a Master Chemical Mechanism Atmos Env 41 2570ndash2579
EEA Copenhagen 2009 wwweeaeuropaeudata-and-mapsdatapopulation-density-disaggregated-with-corine-land-cover-2000-2
Ericsson P Holmstroumlm M Amberntsson-Carlsson A Ohlson C Skoglundh M Andersson B Carlsson P-A 2008 Characterization of particulate emissions and methodologhy for oxidation of particulates from non-diesel combustion ystems SAE Technical Paper Series 2008-01-1746
GAINS 2010 httpgainsiiasaacatindexphpgains-europe
Graham LA Belisle SL Baas C-L Emissions from light duty gasoline vehicles operating on low blend ethanol gasoline and E85 Atmospheric Environment 42 4498 (2008)
Haskew H M Thomas P E Liberty F 2006 Fuel Permeation From Automotive Systems E0 E6 E10 E20 And E85 Final Report CRC Project No E-65-3 Coordinating Research Council Inc 3650 Mansell RoadSuite 140Alpharetta GA 30022
HEI Air Toxics Review Panel (2007) Mobile-Source Air Toxics A Critical Review of the Literature on Exposure and Health Effects HEI Special Report 16 Health Effects Institute Boston USA
Hurley P TAPM v 4 User Manual 2008 CSIRO ISBN 978-1-921424-73-1
IARC (2006) IARC Monographs on the Evaluation of Carcinogenic Risks to Humans Wood Dusts and Formaldehyde Lyon World Health Organization International Agency for Research on Cancer Lyon France 8837ndash325
Jacobson M Z Effects of Ethanol (E85) versus Gasoline Vehicles on Cancer and Mortality in the United States Environ Sci Technol 2007414150-4157
A comparison of emissions from ethanol and petrol fuelled cars IVL report B1962 Health risk assessment for Vaumlstra Goumltaland
27
Jerret M Burnett R T Pope C A Ito K Thurston G Krewski D Shi Y Calle E Thun M Long-Term Ozone Exposure and Mortality N Engl J Med 20093601085-95
Lipman T E Delucchi M A 2002 Emissions of nitrous oxide and methane from conventional and alternative fuel motor vehicles Climate Change 53 477
Modig L Toreacuten K Janson C Jarvholm B Forsberg B Vehicle exhaust outside the home and onset of asthma among adults Eur Respir J 2009 Jun33(6)1261-7
Nafstad P Haheim L L Wisloff T Gram F Oftedal B Holme I Hjermann I Leren P Urban air pollution and mortality in a cohort of Norwegian men Environ Health Perspect 2004112(5)610-5
OEHHA (1999) Air Toxics Hot Spots Program Risk Assessment Guidelines Part II Technical Support Document for Describing Available Cancer Potency Factors Prepared by the Air Toxicology and Epidemiology Section Office of Environmental Health Hazard Assessment April 1999
Passant NR (2002) Speciation of UK emissions of non-methane volatile organic compounds AEAT report AEATENVR0545 Issue 1 Culham UK
Pope CA III Thun MJ Namboodiri MM Dockery DW Evans JS Speizer FE Heath CJ Particulate air pollution as a predictor of mortality in a prospective study of US adults Am J Resp Crit Care Med 1995 151 669-674
Seinfeld J H and Pandis SN (1998) Atmospheric Chemistry and Physics From Air Pollution to Climate Change John Wiley amp Sons New YorkSimpson D Fagerli H Jonson JE Tsyro S Wind P Tuovinen J -P 2003 Transboundary acidification and eutrophication and ground level ozone in Europe Unified EMEP Model Description EMEP Status Report 12003 Part I EMEPMSC-W Report The Norwegian Meteorological Institute Oslo Norway
US EPA (1999) httpwwwepagovttnatwnata1999nsata1999
Vestreng V et al 2004 Inventory Review 2004 Emission data reported to CLRTAP and the NEC Directive EMEPEEA Joint Review Report EMEPMSC-W Note 1
Westerholm R Ahlvik P Karlsson HL An exhaust characterisation study based on regulated and unregulated emissions from bi-fuel and flexi-fuel light-duty passanger cars fuelled by petrol (E5) bioethanol (E70 E75) and biogas tested at ambient temperatures of +22degC and -7degC 2008
Wolkoff P Nielsen G D Non-cancer effects of formaldehyde and relevance for setting an indoor air guideline Environment International 201036788ndash799
Yanowitz J McCormick RL Effect of E85 on tailpipe emissions from light-duty vehicles J Air amp Waste Manage Assoc 59 172 (2009)
A comparison of emissions from ethanol and petrol fuelled cars IVL report B1962 Health risk assessment for Vaumlstra Goumltaland
28
Appendix 1 Evaporate emissions of NMHC
The following assumptions are done for evaporative emissions The NMHC emissions from E85 are reduced relative to petrol by 45 Methane emissions are zero and the split of NMHC species is 68 ethanol and the remaining 32 is divided in the same way as evaporative emissions for petrol The estimates by Graham et al (2008) are missing evaporative emission data however these assumptions agrees very well with measurements of evaporative emissions due to fuel permeation reported by Haskew et al (2006) where NMHC emissions are reported to be reduced by 50 for E85 fuel compared to petrol Haskew et al also presents the NMHC split to species with 60 ethanol This number agrees quite well with our assumption of 68 NMHC being ethanol NMHC in exhaust and evaporative emissions are thus divided as in Table A1
Table A1 Division of NMHC in the exhaust and evaporative emissions for E85 and petrol respectively (wt)
E85 Petrol E85 Petrol exhaust exhaust evaporative evaporative
Ethanol 680 0 680 0 Acetaldehyde 131 08 02 0 Ethene 99 73 24 0 Ethyne 03 28 09 0 Formaldehyde 31 17 06 0 Benzene 16 56 18 10 13 Butadiene 03 09 03 0 sum 963 191 741 10
The remaining NMHC emissions are divided as for petrol (ref) and listed in Table A2
Table A2 Division of NMHC in the exhaust and evaporative emissions for E85 and petrol respectively (wt)
E85 Petrol E85 Petrol exhaust exhaust evaporative evaporative
Ethane 02 32 10 0 Alkanes (C3+) 13 278 89 880 Alkenes (C3+) 04 90 29 95 Aromatics (C7+) 18 388 125 15 Aldehydesketones (C3+)
01 15 05 0
A comparison of emissions from ethanol and petrol fuelled cars IVL report B1962 Health risk assessment for Vaumlstra Goumltaland
29
Appendix 2 Description of the model system
A21 Atmospheric lifetimes
Table A3 gives tropospheric lifetimes with regard to reaction of ethanol formaldehyde acetaldehyde and benzene (C6H6) with OH nitrate radical (NO3) and photolysis The studied organic species are listed together with three species common in the gasoline exhaust (benzene ethene and toluene) for comparison Table 11 shows also photochemical ozone creation potential (POCP) of these species POCP is a measure of amount of ozone that is formed from a certain VOC emission relatively to other emission source which has been established to the same emission mass of ethene (Derwent et al 1996 Altenstedt et al 2000) The range represents different scenarios for VOC and NOX background concentrations Derwent et al (2007) used similar methodology to calculate POCP of different VOC sources and calculated POCP of mean road emission exhaust to be 69
Table A3 Atmospheric lifetimes of studies NMVOC species with respect to the OH- and NO3- initiated
degradation τ(OH) and τ(NO3) and with respect to the photolysis (The lifetime of a chemical species which decays in a first-order process is the time needed for a concentration of this species to decrease to 1e of its original value Statistically it represents the mean life expectancy of an excited species) The OH concentration of 1times106 moleculescm3 typical for summer troposphere was used for the lifetime calculation The NO3 concentrations of 5 and 100 ppt(V) were used for lifetime calculations as representative of rural and urban night-time 12 hrs mean concentration The studied organic species are listed together with 3 species common in the gasoline exhaust for comparison The rates of photolysis were calculated with radiation transfer model for July 58ordm latitude and integrated over 24 hours
τ(OH) τ(NO3) urbanrural τ (photolysis) POCP
hr hr hr
Ethanol 85 56 1times103 - 44 - 63
Acetaldehyde 15 47 1times103 86 68 - 80
Formaldehyde 30 194 4times103 10 18 - 55
Benzene 214 - - 23 - 47
Ethene 34 - - 100
Toluene 50 - - 30 - 67
A22 Defining of boundary concentrations for TAPM from EMEP fields
Calculation of initial concentration field for TAPM from EMEP concentration field of NO2 (as example) and EMEP mean wind vector components u_mid and v_mid Two EMEP model gridcells (i=56 j=60 and i=56 j=61) represent the TAPM model domain and concentrations from the surrounding EMEP gridcells SE-S SE-N NW-S NW-N NE NW (Figure A1) are used for calculation of boundary concentration NO2(bc) according to the following code if u_mid lt= 0 then ( isite = SE-S and jsite = SE-N) else isite = NW-S and jsite = NW-N) endif
A comparison of emissions from ethanol and petrol fuelled cars IVL report B1962 Health risk assessment for Vaumlstra Goumltaland
30
if v_mid lt= 0 then ( ksite = NE) else ksite = SW endif NO2(bc) = [(NO2(isite)u_mid(isite) + NO2(jsite)u_mid(jsite))2 + NO2(ksite)v_mid(ksite)] [(u_mid(isite) + u_mid(jsite))2 + v_mid(ksite)]
Figure A1 Gridcells covering Gothenburg domain and its boundary in EMEP model plotted on latitude-
longitude coordinates The red square represents centre of Gothenburg and the blue line the coastline EMEP i and j coordinates for the boundary gridcells are SE-S = 57-60 SE-N = 57-61 NW-S = 55-60 NW-N = 55-61 NE = 56-62 NW = 56-59 and for Gothenburg grid cells are Gbg-NE = 56-61 Gbg-SW = 56-60
A23 Atmospheric chemistry
The role of secondary chemistry in for the concentration of acetaldehyde are studied by first excluding the primary acetaldehyde emissions from the EMEP model simulations of scenarios S1 and S2 and then by excluding all NMVOC emissions from the car category with spark ignition engines The contribution from the primary acetaldehyde emissions as well as the contribution of secondary acetaldehyde formed from other NMVOC to the total acetaldehyde concentration is then obtained However the secondary chemistry is highly nonlinear due to the interactions of NMVOCs with ozone and OH and thus the results for the contribution of secondary acetaldehyde are somewhat uncertain Differences in acetaldehyde concentrations between S1 and S2 scenarios are studied with respect to contribution of primary and secondary acetaldehyde It is observed that in summer background air the monthly mean contribution of the secondary acetaldehyde is of the same magnitude as the contribution of the primary acetaldehyde to the difference between S1 and
565
57
575
58
585
105 115 125 135 145
Long
Lat
Gbg-SW
Gbg-NE
SE-S
NW-N
NW-S
SE-N
SW
NE
55-59
57-59
55-62
A comparison of emissions from ethanol and petrol fuelled cars IVL report B1962 Health risk assessment for Vaumlstra Goumltaland
31
S2 In the winter and in more polluted atmosphere (Gothenburg grid cells) the contribution from secondary acetaldehyde to the concentration difference appears to be negative due to the chemistry feedback ie the E-85 scenario has less secondary acetaldehyde than the all-petrol scenario
A comparison of S2-S1 differences in primary and secondary acetaldehyde concentrations in the background (=upwind) and Gothenburg grid cells show no increase in the secondary acetaldehyde from upwind to the Gothenburg grid cell It can thus be concluded that there is no significant contribution from secondary aldehydes on the small scale (tenths of km) Conclusion from this sensitivity study is that the secondary formaldehyde can be of importance under summer in the clean background air but that formation on the local scale is unimportant Using EMEP simulated boundary concentrations of acetaldehyde in the local scale model and simulating the primary acetaldehyde emissions will capture the most important features of acetaldehyde dispersion and chemistry in Vaumlstra Goumltaland
In the EMEP model the tail-pipe PM emissions are specified as primary particles Emissions of NOX and VOCs (and NH3 SO2) are oxidised in the atmosphere and a part is then transferred through the gas-to-particle transport to the PM as secondary PM The petrol fuelled cars emit both more primary PM and more NOX compared to the E85 cars If we compare differences in primary and secondary PM between the S1 and S2 scenarios simulated by EMEP we can directly see what part of the difference is from the tail-pipe emissions of the primary particles and what part is from the formation of the secondary PM in atmosphere (mostly from higher emissions of NOX) Table A4 shows the differences between S1 and S2 (S1-S2) of monthly PM averages for January and June (two months with low and high photochemical activities respectively) It can be seen that the higher formation of secondary PM in the S1 (all-petrol) scenario is more important than the higher tail-pipe emission of primary PM by factor 10 - 20
When we compare simulated PM differences between S1-S2 for the background air (=upwind) grid cells and for grid cells including Gothenburg (50 km x 50 km scale) we can see significant increase in primary PM in the S1 scenario from the upwind grid cells to Gothenburg (746 in winter 132 in summer) while no systematic increase can be seen for the secondary PM (-42 in winter +24 in summer) From this comparison it can be concluded that no systematic increase in secondary PM can be seen (in difference from the primary PM) on the scale of 50-100 km and we can neglect this process on the small scale However the overall change in PM concentrations due to the switch of the fuel is very small both on the large scale and on the small scale as can be seen when the differences in PM concentrations between S1 and S2 are compared to absolute PM concentrations in S1 presented in the last column of Table A4
Table A4 Differences in primary and secondary PM concentrations between the lsquoAll-petrolrsquo (S1) and lsquoE-85rsquo (S2) scenarios simulated in gridcells upwind Gothenburg and in gridcells including Gothenburg (2 50 km x 50 km gridcells)
S1-S2 Background
S1-S2 Gothenburg
Increase S1-S2 Gothenburg
S1 Background
μgm3 μgm3 μgm3 bkgnd μgm3
Prim PM10 Jan 00008 00014 00006 746 084
Jun 00008 00018 00010 1319 084
Sec PM10 Jan 00155 00148 -00006
-42 157
Jun 00080 00081 00002 24 213
The sensitivity of the used emission factors for NMHC with respect to the ozone formation in the region of the Swedish West Coast can be analysed with the help of results from studying the
A comparison of emissions from ethanol and petrol fuelled cars IVL report B1962 Health risk assessment for Vaumlstra Goumltaland
32
formation of secondary acetaldehyde In this study first all primary acetaldehyde emitted by the E85 fleet are omitted in a model simulation (S2_nopAA) and secondly all NMHC emissions from the E-85 fleet are switched off (S2_noVOC) Acetaldehyde has a somewhat higher though still comparable photochemical ozone creation potential compared to ethanol (ethanol 44-63 acetaldehyde 68-80 Altenstedt and Pleijel 2000) and this simulation will thus also give information on the sensitivity of the calculations to uncertainties in the ethanol emissions Setting the emission factor for NMHC to zero gives the sensitivity to the emission factor of total NMHC Figure A2 shows the differences in ozone concentration as a result of acetaldehyde only and the total NMHC from the E85 car fleet (S2 scenario) We can see that the effect on ozone formation is very small for the Swedish West coast The reason is that the ozone formation in this area is controlled by the availability of NOX while NMHC or rather their degradation products the peroxy radicals that serve as a lsquofuelrsquo to ozone formation are usually in excess here and further VOC emissions do not increase ozone concentrations significantly The situation looks different in areas that are more heavily polluted with NOX andor which is limited in the availability of peroxy radicals The results from this sensitivity study are fully consistent with the observed increase in ozone concentrations as a result of lower NO emissions (the so-called ozone titration) only very close to the major roads but no larger-scale decrease in ozone concentrations in the Gothenburg area or in any other communities
Figure A2 Sensitivity of the ozone formation in the 2 EMEP model grid cells covering Gothenburg (blue) and in the 6 surrounding grid cells (red see Fig A1) to changes in NMHC emission factor of the E85 fuelled cars lsquobasersquo is simulation S2 with EF for NMHC as in Table 3 lsquonoVOCrsquo is S2 with EF for all NMHC = 0 lsquonopAArsquo is S2 with EF for acetaldehyde = 0 a ndash Mean sensitivity in January absolute difference in ozone formation in ppb(V) as a result of NMHC (base-noVOC) and acetaldehyde (base-nopAA) emissions b ndash Sensitivity relative to ozone concentration in the S2-base simulation January c ndash same as a) but June d ndash same as b) but June
‐002
‐001
0
001
base‐noVOC base‐nopAA
ΔO3(ppb)
a)
0
001
002
base‐noVOC base‐nopAA
ΔO
3(ppb)
c)
‐010
‐005
000
005
base‐noVOC base‐nopAA
ΔO
3
b)
000
002
004
006
base‐noVOC base‐nopAA
ΔO
3
d)
A comparison of emissions from ethanol and petrol fuelled cars IVL report B1962 Health risk assessment for Vaumlstra Goumltaland
33
Appendix 3 Emission results
The geographically distributed NOX and acetaldehyde emissions for the Vaumlstra Goumltaland region are presented in Figures A3 and A4 respectively
Figure A3 NOX emissions for the Vaumlstra Goumltaland region for the All Petrol scenario
A comparison of emissions from ethanol and petrol fuelled cars IVL report B1962 Health risk assessment for Vaumlstra Goumltaland
34
Figure A4 Acetaldehyde emissions for the Vaumlstra Goumltaland region for the All Ethanol scenario
A comparison of emissions from ethanol and petrol fuelled cars IVL report B1962 Health risk assessment for Vaumlstra Goumltaland
35
Appendix 4 Dispersion modelling results
The difference in yearly average concentration between scenario S1 and S2 for acetaldehyde and benzene can be seen in Figure A5 and Figure A6 respectively a)
b)
Figure A5 The difference in yearly average concentrations of acetaldehyde for 2020 between the all E85 (S2) and all petrol (S1) scenarios presented as a) microgm3 and as b) percentage for the Gothenburg area
A comparison of emissions from ethanol and petrol fuelled cars IVL report B1962 Health risk assessment for Vaumlstra Goumltaland
36
a)
b) all E85 c) all petrol
Figure A6 a) the difference in yearly average concentrations (gm3) of benzene for 2020 between the all E85 (S2) and all petrol (S1) scenarios yearly means for b) all E85 and c) all petrol (note the different scales)
The difference in the calculated NOX NO2 and ozone concentrations between the two scenarios are shown in Figures A7 A8 and A9
A comparison of emissions from ethanol and petrol fuelled cars IVL report B1962 Health risk assessment for Vaumlstra Goumltaland
37
a)
b)
Figure A7 The difference in yearly average concentrations of NOX for 2020 between the all E85 (S2) and all petrol (S1) scenarios presented as a) microgm3 and as b) percentage for the Gothenburg area
A comparison of emissions from ethanol and petrol fuelled cars IVL report B1962 Health risk assessment for Vaumlstra Goumltaland
38
a)
Figure A8 The difference in yearly average concentrations of NO2 for 2020 between the all E85 (S2) and all petrol (S1) scenarios presented as a) microgm3 and as b) percentage for the Gothenburg area
A comparison of emissions from ethanol and petrol fuelled cars IVL report B1962 Health risk assessment for Vaumlstra Goumltaland
39
a)
b)
Figure A9 The difference in yearly average concentrations of ozone for 2020 between the all E85 (S2) and all petrol (S1) scenarios presented as a) microgm3 and as b) percentage for mainly the Gothenburg area
A comparison of emissions from ethanol and petrol fuelled cars IVL report B1962 Health risk assessment for Vaumlstra Goumltaland
40
Appendix 5 Detailed Exposure data
Detailed exposure data for the difference between the all E85 (S2) and the all petrol (S1) scenarios can be found in Table A5
Table A5 Exposure data for the difference between the all E85 (S2) and the all petrol (S1) scenarios
Acetaldehyde diff E-P (microgm3)
Populated weighted mean
Number of people Percentage of population
0 - 01 627198 582 01 - 02 163394 152 02 - 03 134879 125 03 - 04 88099 82 04 - 05 38686 36 05 - 06 16880 16 06 - 07 7983 07 07 - 08 1248 01 Tot 014 1078367 Benzene diff E-P (microgm3)
Populated weighted mean
Number of people Percentage of population
-03 - -02 26680 25 -02 - -01 205757 191 -01 - -0 845930 784 Tot -0074 1078367 NO2 diff E-P (microgm3) Populated weighted
mean Number of people Percentage of
population -04 - -03 7698 07 -03 - -02 50131 46 -02 - -01 296288 275 -01 - -0 724250 672 Tot -009 1078367 NOX diff E-P (microgm3) Populated weighted
mean Number of people Percentage of
population -06 - -05 7698 -05 - -04 19639 18 -04 - -03 36626 34 -03 - -02 161685 150 -02 - -01 186500 173 -01 - -0 666219 618 Tot -012 1078367 O3 diff E-P (microgm3) Populated weighted
mean Number of people Percentage of
population -02 - -01 779132 723 -01 - -0 266417 247 0 - 01 32818 30 Tot -012 1078367
Exposure data for the total levels in the two scenarios can be found in Table A6
A comparison of emissions from ethanol and petrol fuelled cars IVL report B1962 Health risk assessment for Vaumlstra Goumltaland
41
Table A6 Exposure data for the total levels in the two scenarios
Acetaldehyde tot All ethanol (microgm3)
Populated weighted mean
Number of people Percentage of population
06 - 07 568825 527 07 - 08 171845 159 08 - 09 124551 115 09 - 10 100946 94 10 - 11 59235 55 11 - 12 30559 28 12 - 13 13175 12 13 - 14 7983 07 14 - 15 1248 01 Tot 077 1078367 Acetaldehyde tot All petrol (microgm3)
Populated weighted mean
Number of people Percentage of population
05 - 06 45111 42 06 - 07 1032008 957 07 - 08 1248 01 Tot 065 1078367 Benzene tot All ethanol (microgm3)
Populated weighted mean
Number of people Percentage of population
0 - 01 1055961 98 01 - 02 22406 2 Tot 005 1078367 Benzene tot All petrol (microgm3)
Populated weighted mean
Number of people Percentage of population
0 - 01 729093 676 01 - 02 232961 216 02 - 03 94042 87 03 - 04 21023 19 04 - 05 1248 01 Tot 010 1078367 NOX tot All ethanol (microgm3)
Populated weighted mean
Number of people Percentage of population
0-10 779108 722 10-20 254658 236 20-30 28683 27 30-40 11070 10 40-50 3426 03 50-60 0 00 60-70 0 00 70-80 639 01 80-90 0 00 90-100 0 00 100-110 783 01 Tot 84 1078367 NOX tot All petrol (microgm3)
Populated weighted mean
Number of people Percentage of population
0-10 769557 714 10-20 264209 245 20-30 28683 27 30-40 11070 10 40-50 3426 03 50-60 0 00
A comparison of emissions from ethanol and petrol fuelled cars IVL report B1962 Health risk assessment for Vaumlstra Goumltaland
42
60-70 0 00 70-80 639 01 80-90 0 00 90-100 0 00 100-110 783 01 Tot 85 1078367 O3 tot All ethanol (microgm3)
Populated weighted mean
Number of people Percentage of population
40-45 1422 01 45-50 26487 25 50-55 176636 164 55-60 770370 714 60-65 103452 96 Tot 569 1078367 O3 tot All petrol (microgm3)
Populated weighted mean
Number of people Percentage of population
40-45 1422 01 45-50 20229 19 50-55 181876 169 55-60 763361 708 60-65 111479 103 Tot 570 1078367 PM25 tot All ethanol (microgm3)
Populated weighted mean
Number of people Percentage of population
1-2 0 00 2-3 885325 821 3-4 192259 178 4-5 783 01 Tot 268 1078367 PM25 tot All petrol (microgm3)
Populated weighted mean
Number of people Percentage of population
1-2 0 00 2-3 868773 806 3-4 208811 194 4-5 783 01 Tot 270 1078367
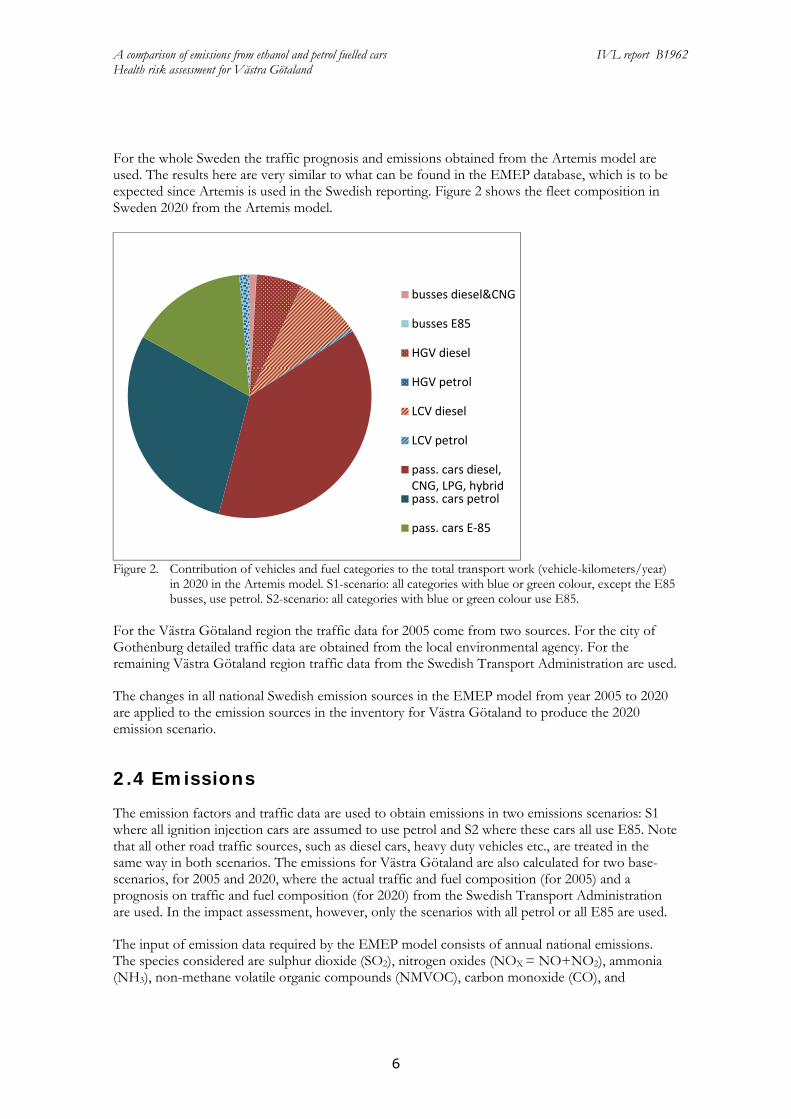
A comparison of emissions from ethanol and petrol fuelled cars IVL report B1962 Health risk assessment for Vaumlstra Goumltaland
8
Since acetaldehyde and benzene are not included in the chemical scheme of TAPM their chemical lifetimes are set to be their rate constant with respect to the reaction with OH radicals multiplied by the OH mean concentrations obtained from the EMEP simulations (see below) Four different rates for the four seasons are used according to Table 1
Table 1 Rate constant for reaction with OH and chemical lifetimes for acetaldehyde and benzene used in the TAPM simulations
k(OH) Chemical lifetime (days)
mol-1 cm3s-1
Mar Apr May Jun Jul Aug Sep Oct Nov Dec Jan Feb
Acetaldehyde 15 10-11 12 04 13 155
Benzene 12 10-12 148 49 159 1937
252 EMEP modelling
Several EMEP models are developed and used for air quality policy work in Europe mainly for the Convention on Long-range Trans boundary Air Pollution The Unified EMEP model used in this study is designed to calculate concentrations in air and deposition patterns for major acidifying and eutrophying pollutants photo-oxidants and particulate matter In its standard version it has a 50 km x 50 km resolution in the horizontal direction and 20 layers distributed from the ground up to the pressure level of 100 hPa (ca 16 km) in the vertical direction A detailed description is given in Simpson et al (2003) The meteorological data used for the simulations obtained from wwwemepint are for the year 2005 and are of the same spatial resolution with a time resolution of three hours
As already mentioned the concentration fields generated by the EMEP model are used as an input to the TAPM model Boundary concentration fields for TAPM are calculated from hourly concentrations in the grid cells surrounding the Vaumlstra Goumltaland region that are weighted together with wind field vectors on corresponding boundaries of the Vaumlstra Goumltaland grid cells Since the chemistry of the organic compounds differs between the two models all organic compounds in EMEP are used and recalculated to the reactivity of organic compounds as used by TAPM
While the role of NOX NMVOC and primary PM can be investigated directly by simulations of emission in scenarios S1 and S2 effects of E85 fuelled cars on concentrations of acetaldehyde benzene and secondary PM are obtained from additional sensitivity runs The contribution of the emissions from the use of E85 fuel on acetaldehyde concentrations can be modelled directly in the EMEP model which includes also the formation and consumption of acetaldehyde in atmospheric reactions However TAPM does not include these processes and therefore the role of acetaldehyde formation is investigated further Two additional EMEP simulations are run one excluding primary acetaldehyde emissions and one excluding all NMVOC emissions from petrol and E85 fuelled vehicles By relating the results of these runs to the results of S1 and S2 the contribution of primary and secondary acetaldehydes respectively can be deduced The results from this analysis can be found in Appendix A23 The conclusion is that on the scale of the Vaumlstra Goumltaland region the formation of acetaldehydes in the atmosphere is not important and therefore the acetaldehyde concentration in TAPM can be described using the lifetimes given in Table 1 Further also the impact of the NMHC emissions on the ozone levels is studied (Appendix 23) and found to be small
Benzene is not included explicitly in the EMEP model The benzene concentrations are therefore studied in sensitivity runs with benzene from road traffic added to the S1 and S2 scenarios as
A comparison of emissions from ethanol and petrol fuelled cars IVL report B1962 Health risk assessment for Vaumlstra Goumltaland
9
methanol which has similar atmospheric lifetime as benzene The benzene concentration is then obtained by comparing the methanol concentration from the different runs
The contribution of primary and secondary PM respectively is investigated by excluding the primary PM from petrol and E85 fuelled vehicles in separate runs of the EMEP model The PM boundary values for the TAPM modelling are not separated into secondary and primary PM The results from this analysis are used to draw general conclusions about the difference in secondary PM formation between the two scenarios
26 Exposure
The human exposure of the annual mean concentrations of NOX NO2 O3 acetaldehyde and benzene are calculated based on the dispersion calculations of the Vaumlstra Goumltaland area in combination with the population density The population density distribution for the region is obtained from EEA (EEA 2009) and shown in Figure 3 The total population in the investigated area is 1 078 400
Figure 3 Population density distribution (number of people in a 1 km x 1 km grid for 2006) for the investigated area (according to Figure 1)
A comparison of emissions from ethanol and petrol fuelled cars IVL report B1962 Health risk assessment for Vaumlstra Goumltaland
10
27 Health effects and risk assumptions
271 NOX and NO2
Using modelled levels of NOX in the residential area as a vehicle exhaust marker a Norwegian study of 16 000 men from Oslo of whom 25 died during the follow up found a strong association (Nafstad et al 2004) This cohort with people of between 40-49 years of age at the start of the study was followed from 197273 through 1998 NOX was estimated in a model with 1000 m grids and a street contribution added for the largest streets When the median concentration of NOX for 1974-78 was used (mean 107 μgm3) the relative risk for total non-violent mortality was 8 per 10 μgm3 Nitrogen oxides do not have to be important as causal components behind this association
272 Ozone
Short-term effects of ozone on the respiratory system and on daily number of deaths have been reported from a large number of studies especially for summer concentrations why a threshold has sometimes been assumed in impact assessments Only recently has an effect of long-term exposure on mortality been reported from the very large American Cancer Society (ACS) Cohort Study (Jerret et al 2009)
Jacobson (2007) reported that E85 would cause an increase in mortality but assumed an effect of short-term exposure only The estimated impact was explained by the calculated ozone formation
273 Acetaldehyde
An increased incidence of nasal tumours in rats and laryngeal tumours in hamsters were observed after inhalation of high concentrations of acetaldehyde (HEI 2007) A few epidemiological studies of occupational exposure found associations but with a complex mixture of chemicals and have not been used in the cancer risk assessment for acetaldehyde Acetaldehyde is classified by the National Institute of Occupational Safety and Health as ldquoa potential human carcinogenrdquo by the US EPA (1999) as ldquoa probable human carcinogenrdquo and by the IARC as ldquopossibly carcinogenic to humansrdquo (OEHHA 1999 HEI 2007)
274 Benzene
There is clear and widely accepted evidence from a variety of epidemiologic studies of occupational exposure that benzene increase the risks of acute myeloid leukaemia (HEI 2007) but there is more uncertainty about other lymph hematopoietic cancers Studies on traffic exposure and childhood leukaemia have produced mixed results with regard to associations
275 Formaldehyde
IARCrsquos Monograph 88 says that the evidence is sufficient to conclude that formaldehyde causes cancer in humans (IARC 2006) This was because of evidence of nasopharyngeal cancer at concentrations historically encountered in industrial settings However this conclusion by IARC was largely based on the results from one occupational exposure site and the results and conclusions have not been supportive in other reviews and more recent studies (Bosetti et al 2006 Beane Freeman et al 2009 Bachand et al 2010) OEHHA (1999) uses a lifetime risk for cancer of 0000006 per microgm3 for formaldehyde and US EPA (1999) a lifetime risk of 0000013 per microgm3
A comparison of emissions from ethanol and petrol fuelled cars IVL report B1962 Health risk assessment for Vaumlstra Goumltaland
11
For non-cancer effects the eye is the organ most sensitive to formaldehyde subjective irritation has been reported at 300-500 microgm3 which is above the odour thresholds (Wolkoff amp Nielsen 2010) Effects in the eyes and in airways occur around 600ndash1000 μgm3 Effects on lung function have not been found in controlled human exposure studies below 1 mgm3 In epidemiological studies of associations between formaldehyde and exacerbation of asthma several co-pollutants make the findings difficult to interpret An indoor air quality guideline of 100 μgm3 has been considered protective against both acute and chronic sensory irritation in the airways in the general population assuming a lognormal distribution of nasal sensory irritation (Wolkoff amp Nielsen 2010)
276 PM
In the studies of long-term exposure to PM25 and mortality like the American Cancer Society (ACS) Cohort the exposure contrast were mainly related to secondary PM why the reported relative risk approx 6 increase in all-cause mortality (in adults) per 10 μgm3 is most relevant for background secondary PM concentrations (Pope et al 1995)
277 Health Impact Assessment
To summarize the types of pollutants that are found possible to include in the health impact assessment are NOX and NO2 benzene acetaldehyde formaldehyde secondary PM and ozone The assessment is restricted to the most important and well established effects of these pollutants This means that not all types of potential health impacts are included Results should however do for a comparison of the scenarios
The impact on formaldehyde levels are not calculated why it is not included in the current assessment Relative risks from epidemiological studies of vehicle exhaust using NOX and NO2 as exposure variables may be influenced from effects of their co-pollutants mainly ultrafine particles (elemental carbon soot) CO and HCs such as formaldehyde Exhaust particles are often introduced in a relatively high background of particles from other sources Thus exhaust particles were not measured directly in the important studies of long-term exposure and effects on mortality
3 Results
31 Emission factors
The emission factors are selected from available published data both for the exhaust and the evaporative emissions In both cases values relative to petrol are used The majority of the studies have been done with both E85 and petrol making this comparison more robust
Westerholm et al (2008) tested two flexi-fuel cars with E5 E70 and E85 in the European driving cycle NEDC and in the Artemis driving cycles The former is used at two temperatures (22degC and -7degC) They report the regulated emissions greenhouse gases a number of organic compounds and particle number Graham et al (2008) present measurement results for regulated emissions greenhouse gases and a number of organic compounds from four cars with E85 and regular petrol in the FTP cycle They also made a compilation of literature data for ethanol cars Yanowitz and McCormick (2009) present an analysis of US certification testing data in order to compare emissions for E85 and petrol
A comparison of emissions from ethanol and petrol fuelled cars IVL report B1962 Health risk assessment for Vaumlstra Goumltaland
12
The results from the three studies (for flexi fuel cars) and in addition the values used by Jacobson (2007) are given in Table 2
Table 2 Emissions factors for E85 fuelled cars relative to the emission factors for petrol fuelled cars
Relative change E85 vs petrol ()
Yanowitz and McCormick (2009) (95 conf)
Graham et al (2008) (sd )
Westerlund et al (2008) (average for NEDC)
Jacobson (2007)
NOX -14 (-23 - -5) -42 (15) -38 -30 NMOG 26 (17 - 37) 12 (39) NMHC -43 (-52 - -32) -45 (24) THC -14 (-24 - -4) 2 TOG 22 CO -19 (-25 - -12) -5 (51) 1 5 PM 25 0 Formaldehyde 59 (32 - 91) 80 (44) 184 60 Acetaldehyde 2855 (1189) 1031 2000 13 Butadiene -64 (31) -74 -10 Benzene -72 (15) -71 -79 Ethanol 3950 from TOG Methane 50 43
Table 2 shows lower emissions of NOX for E85 fuelled cars relative to petrol fuelled cars from test cycles generally including cold starts The emissions of hydrocarbons are higher for petrol while the emissions of organic gases are somewhat higher for E85 The emissions of aldehydes especially acetaldehyde are much higher for E85 as are the emissions of ethanol and methane The emissions of benzene and 13-butadiene are higher with petrol It should be noted that the data in Table 2 are in general for tests performed at ambient temperatures of around 20 degC Westerlund et al (2008) report that for ambient temperatures of -7 degC the emissions of CO and NMHC may be significantly higher with E85 compared with petrol For one vehicle they also report very high NOX emissions with petrol at this lower temperature
As seen in Table 2 there are a number of different quantities when it comes to the emission of organic compounds or unburnt fuel From a chemistry point of view HC is no molecule but a notation for the sum of all compounds that are hydrocarbons thus are of the form HxCy and not containing any elements but carbon and hydrogen Total organic gases (TOG) include organic compounds containing oxygen such as alcohols and aldehydes (but not CO or CO2) Volatile organic compounds (VOC) means carbon containing organic compounds present in the gaseous state at ambient temperature Non-methane hydrocarbons (NMHC) means HC minus the methane mass NMTOG and NMVOC are defined in the corresponding way1
1 When it comes to exhaust gas regulations the definitions differ somewhat In the US THC is defined as the signal obtained from a FID (Flame Ionisation Detector) instrument calibrated on propane This means that alcohols and aldehydes contribute to THC but to a lower extent since their responses in a FID instrument are lower than for hydrocarbons TOG is defined in the US regulations as THC + the mass of alcohols (eg methanol) and carbonyls (eg formaldehyde) measured separately NMHC is equal to THC ndash rCH4CH4 ndashralcAlc where the CH4-concentration is measured by gas chromatography and a FID calibrated with methane Alc is the alcohol concentration and rCH4curren and rAlc are the respective FIDresponse functions NMOG means TOG - CH4 and VOC is TOG - CH4 - C2H6 In the regulations it is stated that also a number of other non-ozone forming organic compounds eg acetone should be subtracted but these are present in very low concentrations in engine exhaust Note that there is actually a double counting of aldehydes in NMOG since they contribute to a certain extent to the NMHC value and then are added using values from separate measurements
A comparison of emissions from ethanol and petrol fuelled cars IVL report B1962 Health risk assessment for Vaumlstra Goumltaland
13
There will be emission limits for both THC and NMHC in also the future For petrol cars with low methane emissions the challenge will be to meet the limit for NMHC For E85 cars with higher methane emissions the challenge will be to meet the THC limit Thus it is reasonable that the emissions of NMHC from E85 cars will be lower than for petrol cars
In the modelling presented here the emission factors from Graham et al (2008) are used with some exceptions as will be discussed The reason is that that study comprises a compilation of a relatively large number of tests For CO the emission factor is set to the same value for E85 and petrol since the differences are small and within the uncertainty For particle emissions the studies cited in Table 2 give little information Instead data from Ericsson et al (2008) are used indicating that the primary PM emission using E85 is about 65 of that when using petrol For NOX the emission for E85 is set to 58 of that for petrol
The emission factors for NMHC (physical emission in gkm) including ethanol are in this study set to the same value for E85 as for petrol This is in line with the data for NMOG reported by Graham showing only small differences It is also reasonable considering that the car producers optimize emissions to meet the future emission legislation in Europe for NMHC and THC i e the Euro 6 standards that apply from September 2014 For petrol with low CH4 emissions the NMHC value will be limiting and this is on 68 mgkm For E85 with higher CH4 emissions the THC value of 100 mgkm will be limiting When considering the FID response as a measure of emission instead of physical emission about 50 of the THC comes from NMHC for E85 cars However the FID response is low for ethanol which means that the physical NMHC emission is about 25 higher Considering these factors the emissions of NMHC (physical) for E85 can be expected to be around 50 mgkm 125 = 625 mgkm which is about the same as for petrol The methane emission for E85 is set to 142 times the value for petrol following Lipman and Delucchi (2002) Further also the differences in the evaporate emissions are considered as is described in Appendix 1
The emissions factors for petrol cars are taken from the Artemis model (Andreacute 2005) The distribution of NMHC for petrol cars is from Passant (2002) The resulting emission factors used to obtain the emissions scenarios are presented in Table 3
In Europe THC is defined as the signal from a propane calibrated FID and thus contains oxygen containing compounds although the response factors for the latter are lower The FID instrument gives the number of molecules and in order to calculate the mass the EU regulations use the densities obtained from assuming the molecular formulas C1H274O0385 (209 gmole) for E85 and C1H189O0016 (1415 gmole) for petrol This thus compensates for the lower response factor for ethanol and acetaldehyde NMHC is obtained by subtracting the concentration of CH4 (times the FID response factor) measured separately
A comparison of emissions from ethanol and petrol fuelled cars IVL report B1962 Health risk assessment for Vaumlstra Goumltaland
14
Table 3 Emission factors (gkm) for 2020 for passenger cars (including evaporative emissions but excluding wear particle emissions) used in the modelling
Petrol E85 NOX 0112 0065 CO 179 174 PM 00013 00008 CH4 0013 0018 NMHC 033 028
division of NMHC Ethanol 00000 01898 Acetaldehyde 00025 00299 Ethene 00244 00237 Ethyne 00094 00011 Formaldehyde 00057 00072 Benzene 00187 00045 13 Butadiene 00030 00009 Ethane 00107 00009 Alkanes C3+ 00928 00076 Alkenes C3+ 00301 00025 Aromatics C7+ 01297 00106 Aldehydesketones C3+ 00051 00004
sum NMHC 03321 02792
32 Emissions
The emissions from road traffic vary between the two scenarios due to the differences in the emission factors From the EMEP modelling the total emissions from road traffic in the different scenarios are calculated for the countries included In Figure 4 emissions of NOX NMVOC and PM in the S2 (E-85) scenario relative to the S1 (all-petrol) scenario are shown for these countries The relative change is larger for countries with a high fraction of petrol cars relative to diesel cars (since the latter are the same in the two scenarios) such as Russia and Ukraine The relative change is smallest for PM emissions due to the very small contribution of the exhaust particles from petrol fuelled cars compared to the contribution from diesel vehicles and wear particles
A comparison of emissions from ethanol and petrol fuelled cars IVL report B1962 Health risk assessment for Vaumlstra Goumltaland
15
Figure 4 National emissions of NOX NMVOC and PM from the road traffic sector in E85 scenario (S2)
relative to lsquoall-petrolrsquo scenario (S1)
An important difference in the emissions between the scenarios lies in the speciation of the NMVOC emissions Figure 5 shows this speciation of NMVOCs for all road traffic emission categories used in this study The two rightmost bars in Figure 5 show the NMVOC speciation for Swedish road traffic emissions for the two scenarios S1 and S2 Comparison with Figure4 shows that the relative changes between the two scenarios are much larger for some individual NMVOC species that for the total NMVOC emissions Since the NMVOC emissions from traffic in Sweden are dominated by the emissions from petrol cars (about 85 of the road traffic emissions of NMVOC comes from petrol cars) the variations in NMVOC speciation between petrol and E85
0
02
04
06
08
1
NOx
0
02
04
06
08
1
NMVOC
0
02
04
06
08
1
Aus
tria
Bel
arus
Bel
gium
Bos
-Her
cB
ulga
riaC
roat
iaC
ypru
sC
zech
Rep
Den
mar
kE
ston
iaFi
nlan
dFr
ance
Ger
man
yG
reec
eH
unga
ryIr
elan
dIt
aly
Lat
via
Lith
uani
aL
uxem
bour
gM
alta
Net
herla
nds
Nor
way
Pola
ndPo
rtug
alR
oman
iaR
ussi
a_E
uro
Slov
ak R
epSl
oven
iaSp
ain
Swed
enSw
itzer
land
Tur
key
Ukr
aine
UK
PM
A comparison of emissions from ethanol and petrol fuelled cars IVL report B1962 Health risk assessment for Vaumlstra Goumltaland
16
will have a significant impact on the total road traffic NMVOC speciation As can be seen in Figure 5 scenario S1 is dominated by alkanes and aromatics while scenario S2 is dominated by ethanol It can also be noted that S1 contains a significant emission of benzene which is much lower in S2 while the opposite is true for acetaldehyde
Figure 5 Distribution of hydrocarbon species in NMVOC emissions from individual road traffic emission
categories as defined in emission scenarios in this study and from the whole road traffic emission sector in Sweden for scenarios S1 (All petrol) and S2 (All E85)
Figure 6 shows a map of the EMEP domain with emissions of acetaldehyde for the two studied scenarios as an example of the geographical distribution of emissions
Figure 6 Gridded emissions of acetaldehyde for the year 2020 (in tonnes per grid cell (50 km x 50 km)
and year) a ndash lsquoAll petrol scenario b ndash lsquoAll E85 scenariorsquo
As mentioned the emissions from road traffic in the Vaumlstra Goumltaland region are calculated in a 500 m x 500 m grid Figure 7 shows the emissions of NOX for 2005 as obtained from the database and the projected emissions for 2020 with a mixed use of E85 and petrol This can be considered as the base case for the emissions in 2020 It can be seen that the emissions decrease over the period which is due to reduction in NOX emissions factors as older vehicles are replaced by newer models (the traffic actually increases from a total of 754x109 vehicle-kilometres in 2005 to 937x109
0
20
40
60
80
100
Pet
rol e
xh
Pet
rol e
vap
E-8
5 ex
h
E-8
5 ev
ap
Pet
rol M
C
Die
sel L
DV
Die
sel H
DV
Roa
d Sw
eden
S1
Roa
d Sw
eden
S2
m
ass
Ethane
Alkanes C3+
Ethene
13 Butadiene
Alkenes C3+
Ethyne
Benzene
Aromatics C7+
Formaldehyde
Acetaldehyde
Aldket C3+
Ethanol
A comparison of emissions from ethanol and petrol fuelled cars IVL report B1962 Health risk assessment for Vaumlstra Goumltaland
17
vehicle-kilometres in 2020) The major roads in the region are clearly visible as well as the larger cities (especially Gothenburg)
Figure 7 Emissions of NOX (kgyear for a 500 m x 500 m grid cell) in the Vaumlstra Goumltaland region for 2005
and for 2020 for the base case
In Table 4 the traffic emissions for NOX benzene acetaldehyde ethanol and PM10 for the Vaumlstra Goumltaland region are shown for the four different emissions scenarios The emissions of NOX and benzene are reduced between 2005 and 2020 for the base case while the emissions of ethanol and acetaldehyde increase due to an expected increase in the use of ethanol fuel The NOX emissions for S1 are somewhat higher than for S2 due to the higher NOX emissions factor for petrol compared with E85
Table 4 Emissions from traffic for the Vaumlstra Goumltaland region in four different emission scenarios (in tonnesyear)
Substance base 2005 base 2020 S1 S2 NOX 13 243 4 843 4 954 4 631 Benzene 2 833 927 1 201 386 Acetaldehyde 628 1 074 305 2 595 Ethanol 192 5 192 0 15 400 PM10 1 324 486 483 476
33 Dispersion modelling
Resulting concentrations from calculations of the S1 and S2 scenarios with the EMEP model are used to provide input of primary and secondary air pollutants for the calculations with the TAPM model for the Vaumlstra Goumltaland region Concentrations of NOX NMVOC PM25 PM10 acetaldehyde ethanol and benzene are therefore calculated as boundary conditions for the Vaumlstra Goumltaland region In addition sensitivity studies are performed to investigate the role of formation of secondary acetaldehyde and secondary particulate matter (see Appendix 2) Time series analysis of the TAPM and EMEP model results of the S1 and S2 scenarios are presented in Figure 8
A comparison of emissions from ethanol and petrol fuelled cars IVL report B1962 Health risk assessment for Vaumlstra Goumltaland
18
a)
b)
Figure 8 Time series analyses of S1 and S2 scenarios for the EMEP and TAPM modelled concentrations of NOX and ozone at an urban background site in Gothenburg (TAPM) and in EMEP model grid cells including Gothenburg city (50 km x 50 km)
Concentrations of NOX and ozone at an urban background site in Gothenburg (TAPM) and in the 50 km x 50 km EMEP grid cells including Gothenburg are compared for one summer and one winter month Due to the well-known process of ozone titration by freshly emitted nitrogen monoxide (Seinfeld and Pandis 1998) the concentration of ozone often decreases in urban areas This phenomenon is expected to be captured by the fine-gridded TAPM model but not necessarily by the courser scale of the EMEP model Figure 8 shows the generally higher NOX levels in the small grid cell of the TAPM model in urban background location comparing to those in the large EMEP grid cell while the opposite is observed for the ozone concentrations (Remember that the boundary concentrations for TAPM are obtained from the EMEP model and they are thus the same in both cases) This indeed shows that local scale emissions and processes contribute to locally increased levels of NOX in urban areas both for the summer and the winter cases For ozone where there of course are no primary emissions the situation is the opposite where instead the result is decreased concentration levels at urban sites on a local scale The influence of the
A comparison of emissions from ethanol and petrol fuelled cars IVL report B1962 Health risk assessment for Vaumlstra Goumltaland
19
NMHC emissions from the passenger cars is studied in a sensitivity analysis (see Appendix 23) and it is found to have only a small influence on the ozone levels
To illustrate the results of the different scenario calculations the geographically distributed concentrations are presented as the difference in yearly average concentrations between the all E85 (S2) and all petrol (S1) scenarios both as microgm3 and sometimes as percentage of the difference to scenario S1 (see Appendix 3)
The difference in yearly average concentrations between scenario S1 and S2 for acetaldehyde and benzene can be seen in Figures 9 and 10 respectively The increase in acetaldehyde concentration resulting from a switch from petrol to E85 is up to about 05 gm3 or 80 in the central parts of the largest urban area of the region Gothenburg Outside this area the relative increase is about 10 for the other urban areas and less than that for the rural areas This large relative increase (see map in Appendix 4) is a result of the relatively high emissions of acetaldehyde from E85 fuelled cars For benzene the situation is opposite In the scenarios for 2020 the concentration of benzene decreases by up to a few tenths of gm3 as a result of a switch from petrol to E85 For benzene the relative change is not calculated
Figure 9 The difference in yearly average concentrations of acetaldehyde for 2020 between the all E85 (S2) and all petrol (S1) scenarios (microgm3)
A comparison of emissions from ethanol and petrol fuelled cars IVL report B1962 Health risk assessment for Vaumlstra Goumltaland
20
Figure 10 The difference in yearly average concentrations (gm3) of benzene for 2020 between the all E85 (S2) and all petrol (S1) scenarios
The difference in the calculated NOX NO2 and ozone concentrations between the two scenarios are shown in Appendix 4 The change in NOX concentration between the two scenarios only represents a small fraction of the total NOX concentration This is because the emissions of NOX from petrol cars are relatively low compared with the contribution from diesel engines and other sources Thus the resulting decrease in the NOX concentration with E85 is only up to 3 For ozone there is a small increase of about 01 microgm3 of E85 in the central areas of Gothenburg where there is relatively high traffic intensity (see Appendix 4 Figure A9) In the rest of the region there is a small decrease in the ozone concentration in the E85 scenario
34 Exposure
The resulting concentrations from the dispersion modelling together with the population density distribution are used to assess the exposure to acetaldehyde benzene NO2 NOX and ozone for the two scenarios S1 and S2 The exposure to PM25 is very similar for the two scenarios (the difference in concentration between scenarios S2 and S1 is only about -002 gm3 Table 5 shows the population weighted mean exposure both as total concentrations and as the difference between the two scenarios Detailed exposure results can be found in Appendix 5 It can be seen that the exposure to all the pollutants in Table 5 with the exception of acetaldehyde are somewhat lower for the all E85 scenario (S2) than for the all petrol scenario (S1) However the effect on health also
A comparison of emissions from ethanol and petrol fuelled cars IVL report B1962 Health risk assessment for Vaumlstra Goumltaland
21
depends on the level of the dose-response functions For example if the level of concentration is low in a populated area but the dose-response function is high the effect of even a low concentration increase can become important The increase in exposure from S1 to S2 (S2-S1) calculated as percentage of the population exposed to increased mean concentrations of pollutants is presented in Figure 11
Table 5 Populated weighted mean exposure (gm3)
S1 S2 S2-S1 Acetaldehyde 065 077 014 Benzene 01 005 -007 NOX 85 84 -012 Ozone 570 569 -012 PM25 270 268 -002
Increased concentrations Decreased concentrations Both increased and
decreased conc
Figure 11 The relative exposure (S2-S1) calculated as percentage of the population
In Figure 11 it is clear that the only pollutant that does not show an improvement regarding air quality and thus the health risks when modelling a switch from petrol to E85 is acetaldehyde For all pollutants except for ozone the changes of concentration levels observed between the scenarios are within the urban areas but for ozone there are also differences in rural areas
According to the data in Figure 11 about 14 of the population in the Vaumlstra Goumltaland region will be exposed to 03-08 microgm3 higher concentration levels of acetaldehyde in scenario S2 relative to S1 From Figure 9 it can be seen that the majority of these people live within the Gothenburg area Further about 28 of the population will be exposed to increased levels of between 01 to 03 microgm3 mainly in the suburban areas and rural surroundings of Gothenburg but also in some of the smaller cities in the region Outside the urban areas the concentration difference is lower than 01 microgm3
In the S2 scenario relative to the S1 scenario the population is exposed to decreased concentration levels of benzene and NOX This is mainly true also for O3 but with an exception for the central
A comparison of emissions from ethanol and petrol fuelled cars IVL report B1962 Health risk assessment for Vaumlstra Goumltaland
22
parts of Gothenburg where the concentration actually increases (see Appendix 4 Figure 7A) resulting in that 3 (blue area in Figure 11 for O3) of the population will be exposed to higher concentrations of O3 For the rest of the area there are decreased concentrations of ozone upon a switch to E85
The largest differences are again in the central parts of Gothenburg where about 20 of the population is being exposed to a lower benzene concentration of 01-03 microgm3 This also means that concerning benzene the majority (78) of the population have none or very low influence from a change to ethanol fuel
The largest effect on exposure difference is seen for NOX where just over 20 of the population has its exposure decreased with 03-05 microgm3 (in the central parts of Gothenburg) In the suburbs the decrease is between 01-02 microgm3 lower Along the largest roads there is a small but visible improvement on a yearly basis of 01 microgm3
For PM25 there is a difference in the populated weighted mean exposure of 002 gm3 between the scenarios with a lower value for the all-E85 case (see also Appendix 5)
35 Impact on health in Vaumlstra Goumltaland
351 NO2 and NOX
The impact of long-term exposure on mortality was estimated using the relative risk from the Norwegian cohort study (Nafstad et al 2004) reporting a relative risk of 08 increase per microgm3 increase in NOX however without adjustment for particle concentrations Assuming this effect on the total mortality and a typical baseline mortality of 1000 deaths per 100 000 person years a decrease in the population mean exposure of 012 microgm3 would correspond to approximately 104 less preterm deaths per year However for the present case this number is highly uncertain since the exposure to substances normally associated with changes in NOX exposure may here change in different ways since the relation between different exhaust components varies between the scenarios
The impact of long-term exposure on asthma incidence (new cases) in adults has been estimated using results from the Swedish RHINE Study Cohorts (Modig et al 2009) with very similar results in the ECRHS Study corresponding to approx 4 increase per microgm3 increase in NO2 From the RHINE Study the incidence can be estimated to 03 per year (proportion of adults developing the disease) with children and elderly excluded this means around 1500 adult cases per year A reduction of 009 microgm3 corresponds to 54 avoided new cases of adult asthma per year However also NO2 in the asthma study may have been mainly an indicator of vehicle exhaust
352 Ozone
The impact of long-term exposure on respiratory mortality has been reported to be approx 02 per microgm3 increase in the summer concentration when studied in the large ACS Cohort (Jerret et al 2009) Assuming this effect on the total population and a typical baseline respiratory mortality of 100 deaths per 100 000 person years a decrease in the population mean exposure of 012 microgm3 corresponds to approximately 03 less preterm deaths per year
A comparison of emissions from ethanol and petrol fuelled cars IVL report B1962 Health risk assessment for Vaumlstra Goumltaland
23
353 Acetaldehyde
According to US EPA (1999) a lifetime risk for cancer of 0000002 per microgm3 is to be assumed for this potential human carcinogen An increase in the population mean exposure of 012 microgm3 corresponds to 026 cases more per year in the current population
354 Benzene
According to US EPA (1999) a lifetime risk for cancer (leukaemia) of 00000022-00000078 per microgm3 is to be assumed for this human carcinogen A decrease in the population mean exposure of 0074 microgm3 corresponds to approximately 03 cases less per year in the current population (assuming 0000004 per microgm3)
355 PM25
In CAFEacute and other impact assessments a relative risk of 6 increase in all-cause mortality per 10 microgm3 has usually been assumed Assuming this effect on the total mortality and a typical baseline mortality of 1000 deaths per 100 000 person years a decrease in the population mean exposure of 002 microgm3 corresponds to approximately 13 less preterm deaths per year
4 Discussion
In this study the health risks from a large introduction of E85 to replace petrol is analysed in scenario studies for 2020 for the Vaumlstra Goumltaland region It is found that the change in pollutant concentration exposure and health risks are small between the two scenarios It should be emphasized that the study only considers vehicle emissions and does not take into account effects from the fuel production
The emissions of NOX in the model are somewhat lower from E85 fuelled cars than from petrol fuelled cars This is in line with the emission factors used by Jacobson (2007) The nitrogen oxides are key substances in the atmospheric reactions determining the concentrations of ozone in air NOX is involved in the formation of ozone but close to the NO source the ozone concentration is lowered due to the rapid reactions between NO and O3 forming NO2 If NO is released in an environment with already high NO concentration it may result in lowering of ozone levels on the regional scale In the present study the ozone concentrations calculated are somewhat lower for the E85 scenario than for the petrol scenario
The health risk analysis shows that the main difference between the scenarios is due to the lower concentration of NOX However it may have been other exhaust components than NOX such as exhaust particles that were behind the reported association with mortality In cases when NOX is not a good indicator of exhaust particle emissions and their toxicity our results may be misleading This should be studied further Neglecting the effects of the changes in NOX exposure the total difference between the scenarios sums up to 16 preterm deaths per year with lower values for the E85 scenario while it would sum up to 12 less preterm deaths for the E85 scenario if the effect related to NOX were included Since there are no similar studier for the effect on mortality among those younger than 30-50 years of age we assume the same relative effect on mortality in all ages This makes only a small difference since the large majority of deaths occur in older groups
A comparison of emissions from ethanol and petrol fuelled cars IVL report B1962 Health risk assessment for Vaumlstra Goumltaland
24
The opposite result for the ozone concentration was obtained by Jacobson The reason for this discrepancy is that the Jacobson study concerns Los Angeles a region with high concentrations of pollutants while the study here concerns the Vaumlstra Goumltaland region with much less dense traffic and also lower concentrations of pollutants importantly NOX It is not unlikely that the effect that Jacobson report also would be found for large parts of Europe with higher traffic densities than in the Vaumlstra Goumltaland region
It is worth to emphasize that the major negative health effect in the Jacobson (2007) study is attributed to the increase in ozone concentration that is a result of the decrease of the NO emissions from E85 cars Directly after the emission NO reacts with ozone resulting in drop of the ozone concentration the so-called ozone titration commonly observed in many cities This NO does however form even higher quantities of ozone further downwind contributing to the general increase in the background ozone levels It is also precursor of NO2 secondary PM and other toxic species as eg PAN and hence reductions in NO emissions are never regarded as disbeneficial from the environmental viewpoint
There are of course several sources of uncertainties that influence the results of this study Since the main results concern differences between the two scenarios several of these factors loose on importance for the conclusions This comprises uncertainties in meteorology in future traffic volumes and in the population density distribution However there are some uncertainties that remain important The emission factors for E85 fuelled cars are much less characterised than what they are for petrol cars The emission of particles from E85 fuelled cars is especially uncertain with only very few published results Also the emissions of NMHC are somewhat uncertain and may be higher for E85 at lower ambient temperatures However the sensitivity analysis performed shows that for the studied region the NMHC emissions only have a small influence on the ozone concentrations
5 Conclusions
In this study the impact of tailpipe and evaporative emissions from E85 fuelled cars on air pollution and health risks are calculated and compared with petrol fuelled cars The scenario calculations for the Vaumlstra Goumltaland Region give data on emissions pollutant concentrations exposure and a health risk evaluation
The differences in emission factors between E85 and petrol lies in the emissions of PM and NOX which are about 65 and 58 for E85 relative petrol respectively Also the speciation of the emitted hydrocarbons is significantly different with large emissions of acetaldehyde and ethanol from E85 and large emissions of benzene higher aromatics alkanes and alkenes from petrol
These differences in emission factors reflect in differences in emissions The emission calculations for all Swedish road traffic show a decrease for the E85 scenario relative to the petrol scenario of 65 for NOX 34 for PM25 67 for benzene For acetaldehyde there is an increase of 770
The differences obtained from the TAPM modelling show decreased levels of NOX ozone and benzene with E85 and increased levels of acetaldehyde For the latter the increase may be up to 80 while NOX and ozone show decreases of up to a few per cent and a few tenths of per cent respectively
A comparison of emissions from ethanol and petrol fuelled cars IVL report B1962 Health risk assessment for Vaumlstra Goumltaland
25
The health risk assessment shows decreased health risks in the E85 scenario relative the all-petrol scenario due to the increased NOX exposure correlated with both preterm deaths and asthma However NOX may be mainly an exhaust indicator Smaller effects are expected from the changes in ozone acetaldehyde and benzene exposure The overall difference considering the exposure to PM acetaldehyde benzene and ozone is 16 preterm deaths with lower values for the E85 scenario
6 Acknowledgements
Saab Automobile The Swedish Transport Administration and The Foundation for the Swedish Environmental Research Institute are gratefully acknowledged for financial contribution
Magnus Ekstroumlm and Maria Holmstroumlm at Saab and Martin Juneholm at the Swedish Transport Administration are acknowledged for their most valuable input to the study
David Simpson Norwegian Meteorological Institute EMEP MSC-W Norway and Dept Radio amp Space Science Chalmers Univ Technol Sweden is gratefully acknowledged for help with implementation of the Unified EMEP model
A comparison of emissions from ethanol and petrol fuelled cars IVL report B1962 Health risk assessment for Vaumlstra Goumltaland
26
7 References
Altenstedt J Pleijel K 2000 An alternative approach to photochemical ozone creation potentials under European conditions J Air amp Waste Manage Assoc 50 1023 ndash 1036
Andre J-M (2005) Vehicle emission measurement collection of the ARTEMIS datatbase Artemis 3312 report Available from httpwwwinretsfrurltepublicationspublications-pdfJoumardA3312reportJMALTE0504pdf
Bachand A MMundt K A Mundt D JMontgomery R R Epidemiological studies of formaldehyde exposure and risk of leukemia and nasopharyngeal cancer A meta-analysis Critical Reviews in Toxicology 2010 40(2) 85ndash100
Beane Freeman L E Blair A Lubin J H Stewart P A Hayes R B Hoover R N Hauptmann M Mortality from lymphohematopoietic malignancies among workers in formaldehyde industries The National Cancer Institute Cohort J Natl Cancer Inst 2009101751ndash761
Bosetti C McLaughlin J K Tarone R E Pira E LaVecchia C Formaldehyde and cancer risk A quantitative review of cohort studies through 2006 Ann Oncol 20081929ndash43
ConcaweJRC Well-to-wheel studies httpiesjrceceuropaeuwtwhtml
Derwent R G Jenkin M E Saunders S M 1996 Photchemical ozone creation potentials for a large number of reactive hydrocarbons under European conditions Atmos Environ 30 181 ndash 199
Derwent RG Jenkin ME Passant NR Pilling MJ 2007 Photochemical ozone creation potentials (POCPs) for different emission sources of organic compounds under European conditions estimated with a Master Chemical Mechanism Atmos Env 41 2570ndash2579
EEA Copenhagen 2009 wwweeaeuropaeudata-and-mapsdatapopulation-density-disaggregated-with-corine-land-cover-2000-2
Ericsson P Holmstroumlm M Amberntsson-Carlsson A Ohlson C Skoglundh M Andersson B Carlsson P-A 2008 Characterization of particulate emissions and methodologhy for oxidation of particulates from non-diesel combustion ystems SAE Technical Paper Series 2008-01-1746
GAINS 2010 httpgainsiiasaacatindexphpgains-europe
Graham LA Belisle SL Baas C-L Emissions from light duty gasoline vehicles operating on low blend ethanol gasoline and E85 Atmospheric Environment 42 4498 (2008)
Haskew H M Thomas P E Liberty F 2006 Fuel Permeation From Automotive Systems E0 E6 E10 E20 And E85 Final Report CRC Project No E-65-3 Coordinating Research Council Inc 3650 Mansell RoadSuite 140Alpharetta GA 30022
HEI Air Toxics Review Panel (2007) Mobile-Source Air Toxics A Critical Review of the Literature on Exposure and Health Effects HEI Special Report 16 Health Effects Institute Boston USA
Hurley P TAPM v 4 User Manual 2008 CSIRO ISBN 978-1-921424-73-1
IARC (2006) IARC Monographs on the Evaluation of Carcinogenic Risks to Humans Wood Dusts and Formaldehyde Lyon World Health Organization International Agency for Research on Cancer Lyon France 8837ndash325
Jacobson M Z Effects of Ethanol (E85) versus Gasoline Vehicles on Cancer and Mortality in the United States Environ Sci Technol 2007414150-4157
A comparison of emissions from ethanol and petrol fuelled cars IVL report B1962 Health risk assessment for Vaumlstra Goumltaland
27
Jerret M Burnett R T Pope C A Ito K Thurston G Krewski D Shi Y Calle E Thun M Long-Term Ozone Exposure and Mortality N Engl J Med 20093601085-95
Lipman T E Delucchi M A 2002 Emissions of nitrous oxide and methane from conventional and alternative fuel motor vehicles Climate Change 53 477
Modig L Toreacuten K Janson C Jarvholm B Forsberg B Vehicle exhaust outside the home and onset of asthma among adults Eur Respir J 2009 Jun33(6)1261-7
Nafstad P Haheim L L Wisloff T Gram F Oftedal B Holme I Hjermann I Leren P Urban air pollution and mortality in a cohort of Norwegian men Environ Health Perspect 2004112(5)610-5
OEHHA (1999) Air Toxics Hot Spots Program Risk Assessment Guidelines Part II Technical Support Document for Describing Available Cancer Potency Factors Prepared by the Air Toxicology and Epidemiology Section Office of Environmental Health Hazard Assessment April 1999
Passant NR (2002) Speciation of UK emissions of non-methane volatile organic compounds AEAT report AEATENVR0545 Issue 1 Culham UK
Pope CA III Thun MJ Namboodiri MM Dockery DW Evans JS Speizer FE Heath CJ Particulate air pollution as a predictor of mortality in a prospective study of US adults Am J Resp Crit Care Med 1995 151 669-674
Seinfeld J H and Pandis SN (1998) Atmospheric Chemistry and Physics From Air Pollution to Climate Change John Wiley amp Sons New YorkSimpson D Fagerli H Jonson JE Tsyro S Wind P Tuovinen J -P 2003 Transboundary acidification and eutrophication and ground level ozone in Europe Unified EMEP Model Description EMEP Status Report 12003 Part I EMEPMSC-W Report The Norwegian Meteorological Institute Oslo Norway
US EPA (1999) httpwwwepagovttnatwnata1999nsata1999
Vestreng V et al 2004 Inventory Review 2004 Emission data reported to CLRTAP and the NEC Directive EMEPEEA Joint Review Report EMEPMSC-W Note 1
Westerholm R Ahlvik P Karlsson HL An exhaust characterisation study based on regulated and unregulated emissions from bi-fuel and flexi-fuel light-duty passanger cars fuelled by petrol (E5) bioethanol (E70 E75) and biogas tested at ambient temperatures of +22degC and -7degC 2008
Wolkoff P Nielsen G D Non-cancer effects of formaldehyde and relevance for setting an indoor air guideline Environment International 201036788ndash799
Yanowitz J McCormick RL Effect of E85 on tailpipe emissions from light-duty vehicles J Air amp Waste Manage Assoc 59 172 (2009)
A comparison of emissions from ethanol and petrol fuelled cars IVL report B1962 Health risk assessment for Vaumlstra Goumltaland
28
Appendix 1 Evaporate emissions of NMHC
The following assumptions are done for evaporative emissions The NMHC emissions from E85 are reduced relative to petrol by 45 Methane emissions are zero and the split of NMHC species is 68 ethanol and the remaining 32 is divided in the same way as evaporative emissions for petrol The estimates by Graham et al (2008) are missing evaporative emission data however these assumptions agrees very well with measurements of evaporative emissions due to fuel permeation reported by Haskew et al (2006) where NMHC emissions are reported to be reduced by 50 for E85 fuel compared to petrol Haskew et al also presents the NMHC split to species with 60 ethanol This number agrees quite well with our assumption of 68 NMHC being ethanol NMHC in exhaust and evaporative emissions are thus divided as in Table A1
Table A1 Division of NMHC in the exhaust and evaporative emissions for E85 and petrol respectively (wt)
E85 Petrol E85 Petrol exhaust exhaust evaporative evaporative
Ethanol 680 0 680 0 Acetaldehyde 131 08 02 0 Ethene 99 73 24 0 Ethyne 03 28 09 0 Formaldehyde 31 17 06 0 Benzene 16 56 18 10 13 Butadiene 03 09 03 0 sum 963 191 741 10
The remaining NMHC emissions are divided as for petrol (ref) and listed in Table A2
Table A2 Division of NMHC in the exhaust and evaporative emissions for E85 and petrol respectively (wt)
E85 Petrol E85 Petrol exhaust exhaust evaporative evaporative
Ethane 02 32 10 0 Alkanes (C3+) 13 278 89 880 Alkenes (C3+) 04 90 29 95 Aromatics (C7+) 18 388 125 15 Aldehydesketones (C3+)
01 15 05 0
A comparison of emissions from ethanol and petrol fuelled cars IVL report B1962 Health risk assessment for Vaumlstra Goumltaland
29
Appendix 2 Description of the model system
A21 Atmospheric lifetimes
Table A3 gives tropospheric lifetimes with regard to reaction of ethanol formaldehyde acetaldehyde and benzene (C6H6) with OH nitrate radical (NO3) and photolysis The studied organic species are listed together with three species common in the gasoline exhaust (benzene ethene and toluene) for comparison Table 11 shows also photochemical ozone creation potential (POCP) of these species POCP is a measure of amount of ozone that is formed from a certain VOC emission relatively to other emission source which has been established to the same emission mass of ethene (Derwent et al 1996 Altenstedt et al 2000) The range represents different scenarios for VOC and NOX background concentrations Derwent et al (2007) used similar methodology to calculate POCP of different VOC sources and calculated POCP of mean road emission exhaust to be 69
Table A3 Atmospheric lifetimes of studies NMVOC species with respect to the OH- and NO3- initiated
degradation τ(OH) and τ(NO3) and with respect to the photolysis (The lifetime of a chemical species which decays in a first-order process is the time needed for a concentration of this species to decrease to 1e of its original value Statistically it represents the mean life expectancy of an excited species) The OH concentration of 1times106 moleculescm3 typical for summer troposphere was used for the lifetime calculation The NO3 concentrations of 5 and 100 ppt(V) were used for lifetime calculations as representative of rural and urban night-time 12 hrs mean concentration The studied organic species are listed together with 3 species common in the gasoline exhaust for comparison The rates of photolysis were calculated with radiation transfer model for July 58ordm latitude and integrated over 24 hours
τ(OH) τ(NO3) urbanrural τ (photolysis) POCP
hr hr hr
Ethanol 85 56 1times103 - 44 - 63
Acetaldehyde 15 47 1times103 86 68 - 80
Formaldehyde 30 194 4times103 10 18 - 55
Benzene 214 - - 23 - 47
Ethene 34 - - 100
Toluene 50 - - 30 - 67
A22 Defining of boundary concentrations for TAPM from EMEP fields
Calculation of initial concentration field for TAPM from EMEP concentration field of NO2 (as example) and EMEP mean wind vector components u_mid and v_mid Two EMEP model gridcells (i=56 j=60 and i=56 j=61) represent the TAPM model domain and concentrations from the surrounding EMEP gridcells SE-S SE-N NW-S NW-N NE NW (Figure A1) are used for calculation of boundary concentration NO2(bc) according to the following code if u_mid lt= 0 then ( isite = SE-S and jsite = SE-N) else isite = NW-S and jsite = NW-N) endif
A comparison of emissions from ethanol and petrol fuelled cars IVL report B1962 Health risk assessment for Vaumlstra Goumltaland
30
if v_mid lt= 0 then ( ksite = NE) else ksite = SW endif NO2(bc) = [(NO2(isite)u_mid(isite) + NO2(jsite)u_mid(jsite))2 + NO2(ksite)v_mid(ksite)] [(u_mid(isite) + u_mid(jsite))2 + v_mid(ksite)]
Figure A1 Gridcells covering Gothenburg domain and its boundary in EMEP model plotted on latitude-
longitude coordinates The red square represents centre of Gothenburg and the blue line the coastline EMEP i and j coordinates for the boundary gridcells are SE-S = 57-60 SE-N = 57-61 NW-S = 55-60 NW-N = 55-61 NE = 56-62 NW = 56-59 and for Gothenburg grid cells are Gbg-NE = 56-61 Gbg-SW = 56-60
A23 Atmospheric chemistry
The role of secondary chemistry in for the concentration of acetaldehyde are studied by first excluding the primary acetaldehyde emissions from the EMEP model simulations of scenarios S1 and S2 and then by excluding all NMVOC emissions from the car category with spark ignition engines The contribution from the primary acetaldehyde emissions as well as the contribution of secondary acetaldehyde formed from other NMVOC to the total acetaldehyde concentration is then obtained However the secondary chemistry is highly nonlinear due to the interactions of NMVOCs with ozone and OH and thus the results for the contribution of secondary acetaldehyde are somewhat uncertain Differences in acetaldehyde concentrations between S1 and S2 scenarios are studied with respect to contribution of primary and secondary acetaldehyde It is observed that in summer background air the monthly mean contribution of the secondary acetaldehyde is of the same magnitude as the contribution of the primary acetaldehyde to the difference between S1 and
565
57
575
58
585
105 115 125 135 145
Long
Lat
Gbg-SW
Gbg-NE
SE-S
NW-N
NW-S
SE-N
SW
NE
55-59
57-59
55-62
A comparison of emissions from ethanol and petrol fuelled cars IVL report B1962 Health risk assessment for Vaumlstra Goumltaland
31
S2 In the winter and in more polluted atmosphere (Gothenburg grid cells) the contribution from secondary acetaldehyde to the concentration difference appears to be negative due to the chemistry feedback ie the E-85 scenario has less secondary acetaldehyde than the all-petrol scenario
A comparison of S2-S1 differences in primary and secondary acetaldehyde concentrations in the background (=upwind) and Gothenburg grid cells show no increase in the secondary acetaldehyde from upwind to the Gothenburg grid cell It can thus be concluded that there is no significant contribution from secondary aldehydes on the small scale (tenths of km) Conclusion from this sensitivity study is that the secondary formaldehyde can be of importance under summer in the clean background air but that formation on the local scale is unimportant Using EMEP simulated boundary concentrations of acetaldehyde in the local scale model and simulating the primary acetaldehyde emissions will capture the most important features of acetaldehyde dispersion and chemistry in Vaumlstra Goumltaland
In the EMEP model the tail-pipe PM emissions are specified as primary particles Emissions of NOX and VOCs (and NH3 SO2) are oxidised in the atmosphere and a part is then transferred through the gas-to-particle transport to the PM as secondary PM The petrol fuelled cars emit both more primary PM and more NOX compared to the E85 cars If we compare differences in primary and secondary PM between the S1 and S2 scenarios simulated by EMEP we can directly see what part of the difference is from the tail-pipe emissions of the primary particles and what part is from the formation of the secondary PM in atmosphere (mostly from higher emissions of NOX) Table A4 shows the differences between S1 and S2 (S1-S2) of monthly PM averages for January and June (two months with low and high photochemical activities respectively) It can be seen that the higher formation of secondary PM in the S1 (all-petrol) scenario is more important than the higher tail-pipe emission of primary PM by factor 10 - 20
When we compare simulated PM differences between S1-S2 for the background air (=upwind) grid cells and for grid cells including Gothenburg (50 km x 50 km scale) we can see significant increase in primary PM in the S1 scenario from the upwind grid cells to Gothenburg (746 in winter 132 in summer) while no systematic increase can be seen for the secondary PM (-42 in winter +24 in summer) From this comparison it can be concluded that no systematic increase in secondary PM can be seen (in difference from the primary PM) on the scale of 50-100 km and we can neglect this process on the small scale However the overall change in PM concentrations due to the switch of the fuel is very small both on the large scale and on the small scale as can be seen when the differences in PM concentrations between S1 and S2 are compared to absolute PM concentrations in S1 presented in the last column of Table A4
Table A4 Differences in primary and secondary PM concentrations between the lsquoAll-petrolrsquo (S1) and lsquoE-85rsquo (S2) scenarios simulated in gridcells upwind Gothenburg and in gridcells including Gothenburg (2 50 km x 50 km gridcells)
S1-S2 Background
S1-S2 Gothenburg
Increase S1-S2 Gothenburg
S1 Background
μgm3 μgm3 μgm3 bkgnd μgm3
Prim PM10 Jan 00008 00014 00006 746 084
Jun 00008 00018 00010 1319 084
Sec PM10 Jan 00155 00148 -00006
-42 157
Jun 00080 00081 00002 24 213
The sensitivity of the used emission factors for NMHC with respect to the ozone formation in the region of the Swedish West Coast can be analysed with the help of results from studying the
A comparison of emissions from ethanol and petrol fuelled cars IVL report B1962 Health risk assessment for Vaumlstra Goumltaland
32
formation of secondary acetaldehyde In this study first all primary acetaldehyde emitted by the E85 fleet are omitted in a model simulation (S2_nopAA) and secondly all NMHC emissions from the E-85 fleet are switched off (S2_noVOC) Acetaldehyde has a somewhat higher though still comparable photochemical ozone creation potential compared to ethanol (ethanol 44-63 acetaldehyde 68-80 Altenstedt and Pleijel 2000) and this simulation will thus also give information on the sensitivity of the calculations to uncertainties in the ethanol emissions Setting the emission factor for NMHC to zero gives the sensitivity to the emission factor of total NMHC Figure A2 shows the differences in ozone concentration as a result of acetaldehyde only and the total NMHC from the E85 car fleet (S2 scenario) We can see that the effect on ozone formation is very small for the Swedish West coast The reason is that the ozone formation in this area is controlled by the availability of NOX while NMHC or rather their degradation products the peroxy radicals that serve as a lsquofuelrsquo to ozone formation are usually in excess here and further VOC emissions do not increase ozone concentrations significantly The situation looks different in areas that are more heavily polluted with NOX andor which is limited in the availability of peroxy radicals The results from this sensitivity study are fully consistent with the observed increase in ozone concentrations as a result of lower NO emissions (the so-called ozone titration) only very close to the major roads but no larger-scale decrease in ozone concentrations in the Gothenburg area or in any other communities
Figure A2 Sensitivity of the ozone formation in the 2 EMEP model grid cells covering Gothenburg (blue) and in the 6 surrounding grid cells (red see Fig A1) to changes in NMHC emission factor of the E85 fuelled cars lsquobasersquo is simulation S2 with EF for NMHC as in Table 3 lsquonoVOCrsquo is S2 with EF for all NMHC = 0 lsquonopAArsquo is S2 with EF for acetaldehyde = 0 a ndash Mean sensitivity in January absolute difference in ozone formation in ppb(V) as a result of NMHC (base-noVOC) and acetaldehyde (base-nopAA) emissions b ndash Sensitivity relative to ozone concentration in the S2-base simulation January c ndash same as a) but June d ndash same as b) but June
‐002
‐001
0
001
base‐noVOC base‐nopAA
ΔO3(ppb)
a)
0
001
002
base‐noVOC base‐nopAA
ΔO
3(ppb)
c)
‐010
‐005
000
005
base‐noVOC base‐nopAA
ΔO
3
b)
000
002
004
006
base‐noVOC base‐nopAA
ΔO
3
d)
A comparison of emissions from ethanol and petrol fuelled cars IVL report B1962 Health risk assessment for Vaumlstra Goumltaland
33
Appendix 3 Emission results
The geographically distributed NOX and acetaldehyde emissions for the Vaumlstra Goumltaland region are presented in Figures A3 and A4 respectively
Figure A3 NOX emissions for the Vaumlstra Goumltaland region for the All Petrol scenario
A comparison of emissions from ethanol and petrol fuelled cars IVL report B1962 Health risk assessment for Vaumlstra Goumltaland
34
Figure A4 Acetaldehyde emissions for the Vaumlstra Goumltaland region for the All Ethanol scenario
A comparison of emissions from ethanol and petrol fuelled cars IVL report B1962 Health risk assessment for Vaumlstra Goumltaland
35
Appendix 4 Dispersion modelling results
The difference in yearly average concentration between scenario S1 and S2 for acetaldehyde and benzene can be seen in Figure A5 and Figure A6 respectively a)
b)
Figure A5 The difference in yearly average concentrations of acetaldehyde for 2020 between the all E85 (S2) and all petrol (S1) scenarios presented as a) microgm3 and as b) percentage for the Gothenburg area
A comparison of emissions from ethanol and petrol fuelled cars IVL report B1962 Health risk assessment for Vaumlstra Goumltaland
36
a)
b) all E85 c) all petrol
Figure A6 a) the difference in yearly average concentrations (gm3) of benzene for 2020 between the all E85 (S2) and all petrol (S1) scenarios yearly means for b) all E85 and c) all petrol (note the different scales)
The difference in the calculated NOX NO2 and ozone concentrations between the two scenarios are shown in Figures A7 A8 and A9
A comparison of emissions from ethanol and petrol fuelled cars IVL report B1962 Health risk assessment for Vaumlstra Goumltaland
37
a)
b)
Figure A7 The difference in yearly average concentrations of NOX for 2020 between the all E85 (S2) and all petrol (S1) scenarios presented as a) microgm3 and as b) percentage for the Gothenburg area
A comparison of emissions from ethanol and petrol fuelled cars IVL report B1962 Health risk assessment for Vaumlstra Goumltaland
38
a)
Figure A8 The difference in yearly average concentrations of NO2 for 2020 between the all E85 (S2) and all petrol (S1) scenarios presented as a) microgm3 and as b) percentage for the Gothenburg area
A comparison of emissions from ethanol and petrol fuelled cars IVL report B1962 Health risk assessment for Vaumlstra Goumltaland
39
a)
b)
Figure A9 The difference in yearly average concentrations of ozone for 2020 between the all E85 (S2) and all petrol (S1) scenarios presented as a) microgm3 and as b) percentage for mainly the Gothenburg area
A comparison of emissions from ethanol and petrol fuelled cars IVL report B1962 Health risk assessment for Vaumlstra Goumltaland
40
Appendix 5 Detailed Exposure data
Detailed exposure data for the difference between the all E85 (S2) and the all petrol (S1) scenarios can be found in Table A5
Table A5 Exposure data for the difference between the all E85 (S2) and the all petrol (S1) scenarios
Acetaldehyde diff E-P (microgm3)
Populated weighted mean
Number of people Percentage of population
0 - 01 627198 582 01 - 02 163394 152 02 - 03 134879 125 03 - 04 88099 82 04 - 05 38686 36 05 - 06 16880 16 06 - 07 7983 07 07 - 08 1248 01 Tot 014 1078367 Benzene diff E-P (microgm3)
Populated weighted mean
Number of people Percentage of population
-03 - -02 26680 25 -02 - -01 205757 191 -01 - -0 845930 784 Tot -0074 1078367 NO2 diff E-P (microgm3) Populated weighted
mean Number of people Percentage of
population -04 - -03 7698 07 -03 - -02 50131 46 -02 - -01 296288 275 -01 - -0 724250 672 Tot -009 1078367 NOX diff E-P (microgm3) Populated weighted
mean Number of people Percentage of
population -06 - -05 7698 -05 - -04 19639 18 -04 - -03 36626 34 -03 - -02 161685 150 -02 - -01 186500 173 -01 - -0 666219 618 Tot -012 1078367 O3 diff E-P (microgm3) Populated weighted
mean Number of people Percentage of
population -02 - -01 779132 723 -01 - -0 266417 247 0 - 01 32818 30 Tot -012 1078367
Exposure data for the total levels in the two scenarios can be found in Table A6
A comparison of emissions from ethanol and petrol fuelled cars IVL report B1962 Health risk assessment for Vaumlstra Goumltaland
41
Table A6 Exposure data for the total levels in the two scenarios
Acetaldehyde tot All ethanol (microgm3)
Populated weighted mean
Number of people Percentage of population
06 - 07 568825 527 07 - 08 171845 159 08 - 09 124551 115 09 - 10 100946 94 10 - 11 59235 55 11 - 12 30559 28 12 - 13 13175 12 13 - 14 7983 07 14 - 15 1248 01 Tot 077 1078367 Acetaldehyde tot All petrol (microgm3)
Populated weighted mean
Number of people Percentage of population
05 - 06 45111 42 06 - 07 1032008 957 07 - 08 1248 01 Tot 065 1078367 Benzene tot All ethanol (microgm3)
Populated weighted mean
Number of people Percentage of population
0 - 01 1055961 98 01 - 02 22406 2 Tot 005 1078367 Benzene tot All petrol (microgm3)
Populated weighted mean
Number of people Percentage of population
0 - 01 729093 676 01 - 02 232961 216 02 - 03 94042 87 03 - 04 21023 19 04 - 05 1248 01 Tot 010 1078367 NOX tot All ethanol (microgm3)
Populated weighted mean
Number of people Percentage of population
0-10 779108 722 10-20 254658 236 20-30 28683 27 30-40 11070 10 40-50 3426 03 50-60 0 00 60-70 0 00 70-80 639 01 80-90 0 00 90-100 0 00 100-110 783 01 Tot 84 1078367 NOX tot All petrol (microgm3)
Populated weighted mean
Number of people Percentage of population
0-10 769557 714 10-20 264209 245 20-30 28683 27 30-40 11070 10 40-50 3426 03 50-60 0 00
A comparison of emissions from ethanol and petrol fuelled cars IVL report B1962 Health risk assessment for Vaumlstra Goumltaland
42
60-70 0 00 70-80 639 01 80-90 0 00 90-100 0 00 100-110 783 01 Tot 85 1078367 O3 tot All ethanol (microgm3)
Populated weighted mean
Number of people Percentage of population
40-45 1422 01 45-50 26487 25 50-55 176636 164 55-60 770370 714 60-65 103452 96 Tot 569 1078367 O3 tot All petrol (microgm3)
Populated weighted mean
Number of people Percentage of population
40-45 1422 01 45-50 20229 19 50-55 181876 169 55-60 763361 708 60-65 111479 103 Tot 570 1078367 PM25 tot All ethanol (microgm3)
Populated weighted mean
Number of people Percentage of population
1-2 0 00 2-3 885325 821 3-4 192259 178 4-5 783 01 Tot 268 1078367 PM25 tot All petrol (microgm3)
Populated weighted mean
Number of people Percentage of population
1-2 0 00 2-3 868773 806 3-4 208811 194 4-5 783 01 Tot 270 1078367
A comparison of emissions from ethanol and petrol fuelled cars IVL report B1962 Health risk assessment for Vaumlstra Goumltaland
9
methanol which has similar atmospheric lifetime as benzene The benzene concentration is then obtained by comparing the methanol concentration from the different runs
The contribution of primary and secondary PM respectively is investigated by excluding the primary PM from petrol and E85 fuelled vehicles in separate runs of the EMEP model The PM boundary values for the TAPM modelling are not separated into secondary and primary PM The results from this analysis are used to draw general conclusions about the difference in secondary PM formation between the two scenarios
26 Exposure
The human exposure of the annual mean concentrations of NOX NO2 O3 acetaldehyde and benzene are calculated based on the dispersion calculations of the Vaumlstra Goumltaland area in combination with the population density The population density distribution for the region is obtained from EEA (EEA 2009) and shown in Figure 3 The total population in the investigated area is 1 078 400
Figure 3 Population density distribution (number of people in a 1 km x 1 km grid for 2006) for the investigated area (according to Figure 1)
A comparison of emissions from ethanol and petrol fuelled cars IVL report B1962 Health risk assessment for Vaumlstra Goumltaland
10
27 Health effects and risk assumptions
271 NOX and NO2
Using modelled levels of NOX in the residential area as a vehicle exhaust marker a Norwegian study of 16 000 men from Oslo of whom 25 died during the follow up found a strong association (Nafstad et al 2004) This cohort with people of between 40-49 years of age at the start of the study was followed from 197273 through 1998 NOX was estimated in a model with 1000 m grids and a street contribution added for the largest streets When the median concentration of NOX for 1974-78 was used (mean 107 μgm3) the relative risk for total non-violent mortality was 8 per 10 μgm3 Nitrogen oxides do not have to be important as causal components behind this association
272 Ozone
Short-term effects of ozone on the respiratory system and on daily number of deaths have been reported from a large number of studies especially for summer concentrations why a threshold has sometimes been assumed in impact assessments Only recently has an effect of long-term exposure on mortality been reported from the very large American Cancer Society (ACS) Cohort Study (Jerret et al 2009)
Jacobson (2007) reported that E85 would cause an increase in mortality but assumed an effect of short-term exposure only The estimated impact was explained by the calculated ozone formation
273 Acetaldehyde
An increased incidence of nasal tumours in rats and laryngeal tumours in hamsters were observed after inhalation of high concentrations of acetaldehyde (HEI 2007) A few epidemiological studies of occupational exposure found associations but with a complex mixture of chemicals and have not been used in the cancer risk assessment for acetaldehyde Acetaldehyde is classified by the National Institute of Occupational Safety and Health as ldquoa potential human carcinogenrdquo by the US EPA (1999) as ldquoa probable human carcinogenrdquo and by the IARC as ldquopossibly carcinogenic to humansrdquo (OEHHA 1999 HEI 2007)
274 Benzene
There is clear and widely accepted evidence from a variety of epidemiologic studies of occupational exposure that benzene increase the risks of acute myeloid leukaemia (HEI 2007) but there is more uncertainty about other lymph hematopoietic cancers Studies on traffic exposure and childhood leukaemia have produced mixed results with regard to associations
275 Formaldehyde
IARCrsquos Monograph 88 says that the evidence is sufficient to conclude that formaldehyde causes cancer in humans (IARC 2006) This was because of evidence of nasopharyngeal cancer at concentrations historically encountered in industrial settings However this conclusion by IARC was largely based on the results from one occupational exposure site and the results and conclusions have not been supportive in other reviews and more recent studies (Bosetti et al 2006 Beane Freeman et al 2009 Bachand et al 2010) OEHHA (1999) uses a lifetime risk for cancer of 0000006 per microgm3 for formaldehyde and US EPA (1999) a lifetime risk of 0000013 per microgm3
A comparison of emissions from ethanol and petrol fuelled cars IVL report B1962 Health risk assessment for Vaumlstra Goumltaland
11
For non-cancer effects the eye is the organ most sensitive to formaldehyde subjective irritation has been reported at 300-500 microgm3 which is above the odour thresholds (Wolkoff amp Nielsen 2010) Effects in the eyes and in airways occur around 600ndash1000 μgm3 Effects on lung function have not been found in controlled human exposure studies below 1 mgm3 In epidemiological studies of associations between formaldehyde and exacerbation of asthma several co-pollutants make the findings difficult to interpret An indoor air quality guideline of 100 μgm3 has been considered protective against both acute and chronic sensory irritation in the airways in the general population assuming a lognormal distribution of nasal sensory irritation (Wolkoff amp Nielsen 2010)
276 PM
In the studies of long-term exposure to PM25 and mortality like the American Cancer Society (ACS) Cohort the exposure contrast were mainly related to secondary PM why the reported relative risk approx 6 increase in all-cause mortality (in adults) per 10 μgm3 is most relevant for background secondary PM concentrations (Pope et al 1995)
277 Health Impact Assessment
To summarize the types of pollutants that are found possible to include in the health impact assessment are NOX and NO2 benzene acetaldehyde formaldehyde secondary PM and ozone The assessment is restricted to the most important and well established effects of these pollutants This means that not all types of potential health impacts are included Results should however do for a comparison of the scenarios
The impact on formaldehyde levels are not calculated why it is not included in the current assessment Relative risks from epidemiological studies of vehicle exhaust using NOX and NO2 as exposure variables may be influenced from effects of their co-pollutants mainly ultrafine particles (elemental carbon soot) CO and HCs such as formaldehyde Exhaust particles are often introduced in a relatively high background of particles from other sources Thus exhaust particles were not measured directly in the important studies of long-term exposure and effects on mortality
3 Results
31 Emission factors
The emission factors are selected from available published data both for the exhaust and the evaporative emissions In both cases values relative to petrol are used The majority of the studies have been done with both E85 and petrol making this comparison more robust
Westerholm et al (2008) tested two flexi-fuel cars with E5 E70 and E85 in the European driving cycle NEDC and in the Artemis driving cycles The former is used at two temperatures (22degC and -7degC) They report the regulated emissions greenhouse gases a number of organic compounds and particle number Graham et al (2008) present measurement results for regulated emissions greenhouse gases and a number of organic compounds from four cars with E85 and regular petrol in the FTP cycle They also made a compilation of literature data for ethanol cars Yanowitz and McCormick (2009) present an analysis of US certification testing data in order to compare emissions for E85 and petrol
A comparison of emissions from ethanol and petrol fuelled cars IVL report B1962 Health risk assessment for Vaumlstra Goumltaland
12
The results from the three studies (for flexi fuel cars) and in addition the values used by Jacobson (2007) are given in Table 2
Table 2 Emissions factors for E85 fuelled cars relative to the emission factors for petrol fuelled cars
Relative change E85 vs petrol ()
Yanowitz and McCormick (2009) (95 conf)
Graham et al (2008) (sd )
Westerlund et al (2008) (average for NEDC)
Jacobson (2007)
NOX -14 (-23 - -5) -42 (15) -38 -30 NMOG 26 (17 - 37) 12 (39) NMHC -43 (-52 - -32) -45 (24) THC -14 (-24 - -4) 2 TOG 22 CO -19 (-25 - -12) -5 (51) 1 5 PM 25 0 Formaldehyde 59 (32 - 91) 80 (44) 184 60 Acetaldehyde 2855 (1189) 1031 2000 13 Butadiene -64 (31) -74 -10 Benzene -72 (15) -71 -79 Ethanol 3950 from TOG Methane 50 43
Table 2 shows lower emissions of NOX for E85 fuelled cars relative to petrol fuelled cars from test cycles generally including cold starts The emissions of hydrocarbons are higher for petrol while the emissions of organic gases are somewhat higher for E85 The emissions of aldehydes especially acetaldehyde are much higher for E85 as are the emissions of ethanol and methane The emissions of benzene and 13-butadiene are higher with petrol It should be noted that the data in Table 2 are in general for tests performed at ambient temperatures of around 20 degC Westerlund et al (2008) report that for ambient temperatures of -7 degC the emissions of CO and NMHC may be significantly higher with E85 compared with petrol For one vehicle they also report very high NOX emissions with petrol at this lower temperature
As seen in Table 2 there are a number of different quantities when it comes to the emission of organic compounds or unburnt fuel From a chemistry point of view HC is no molecule but a notation for the sum of all compounds that are hydrocarbons thus are of the form HxCy and not containing any elements but carbon and hydrogen Total organic gases (TOG) include organic compounds containing oxygen such as alcohols and aldehydes (but not CO or CO2) Volatile organic compounds (VOC) means carbon containing organic compounds present in the gaseous state at ambient temperature Non-methane hydrocarbons (NMHC) means HC minus the methane mass NMTOG and NMVOC are defined in the corresponding way1
1 When it comes to exhaust gas regulations the definitions differ somewhat In the US THC is defined as the signal obtained from a FID (Flame Ionisation Detector) instrument calibrated on propane This means that alcohols and aldehydes contribute to THC but to a lower extent since their responses in a FID instrument are lower than for hydrocarbons TOG is defined in the US regulations as THC + the mass of alcohols (eg methanol) and carbonyls (eg formaldehyde) measured separately NMHC is equal to THC ndash rCH4CH4 ndashralcAlc where the CH4-concentration is measured by gas chromatography and a FID calibrated with methane Alc is the alcohol concentration and rCH4curren and rAlc are the respective FIDresponse functions NMOG means TOG - CH4 and VOC is TOG - CH4 - C2H6 In the regulations it is stated that also a number of other non-ozone forming organic compounds eg acetone should be subtracted but these are present in very low concentrations in engine exhaust Note that there is actually a double counting of aldehydes in NMOG since they contribute to a certain extent to the NMHC value and then are added using values from separate measurements
A comparison of emissions from ethanol and petrol fuelled cars IVL report B1962 Health risk assessment for Vaumlstra Goumltaland
13
There will be emission limits for both THC and NMHC in also the future For petrol cars with low methane emissions the challenge will be to meet the limit for NMHC For E85 cars with higher methane emissions the challenge will be to meet the THC limit Thus it is reasonable that the emissions of NMHC from E85 cars will be lower than for petrol cars
In the modelling presented here the emission factors from Graham et al (2008) are used with some exceptions as will be discussed The reason is that that study comprises a compilation of a relatively large number of tests For CO the emission factor is set to the same value for E85 and petrol since the differences are small and within the uncertainty For particle emissions the studies cited in Table 2 give little information Instead data from Ericsson et al (2008) are used indicating that the primary PM emission using E85 is about 65 of that when using petrol For NOX the emission for E85 is set to 58 of that for petrol
The emission factors for NMHC (physical emission in gkm) including ethanol are in this study set to the same value for E85 as for petrol This is in line with the data for NMOG reported by Graham showing only small differences It is also reasonable considering that the car producers optimize emissions to meet the future emission legislation in Europe for NMHC and THC i e the Euro 6 standards that apply from September 2014 For petrol with low CH4 emissions the NMHC value will be limiting and this is on 68 mgkm For E85 with higher CH4 emissions the THC value of 100 mgkm will be limiting When considering the FID response as a measure of emission instead of physical emission about 50 of the THC comes from NMHC for E85 cars However the FID response is low for ethanol which means that the physical NMHC emission is about 25 higher Considering these factors the emissions of NMHC (physical) for E85 can be expected to be around 50 mgkm 125 = 625 mgkm which is about the same as for petrol The methane emission for E85 is set to 142 times the value for petrol following Lipman and Delucchi (2002) Further also the differences in the evaporate emissions are considered as is described in Appendix 1
The emissions factors for petrol cars are taken from the Artemis model (Andreacute 2005) The distribution of NMHC for petrol cars is from Passant (2002) The resulting emission factors used to obtain the emissions scenarios are presented in Table 3
In Europe THC is defined as the signal from a propane calibrated FID and thus contains oxygen containing compounds although the response factors for the latter are lower The FID instrument gives the number of molecules and in order to calculate the mass the EU regulations use the densities obtained from assuming the molecular formulas C1H274O0385 (209 gmole) for E85 and C1H189O0016 (1415 gmole) for petrol This thus compensates for the lower response factor for ethanol and acetaldehyde NMHC is obtained by subtracting the concentration of CH4 (times the FID response factor) measured separately
A comparison of emissions from ethanol and petrol fuelled cars IVL report B1962 Health risk assessment for Vaumlstra Goumltaland
14
Table 3 Emission factors (gkm) for 2020 for passenger cars (including evaporative emissions but excluding wear particle emissions) used in the modelling
Petrol E85 NOX 0112 0065 CO 179 174 PM 00013 00008 CH4 0013 0018 NMHC 033 028
division of NMHC Ethanol 00000 01898 Acetaldehyde 00025 00299 Ethene 00244 00237 Ethyne 00094 00011 Formaldehyde 00057 00072 Benzene 00187 00045 13 Butadiene 00030 00009 Ethane 00107 00009 Alkanes C3+ 00928 00076 Alkenes C3+ 00301 00025 Aromatics C7+ 01297 00106 Aldehydesketones C3+ 00051 00004
sum NMHC 03321 02792
32 Emissions
The emissions from road traffic vary between the two scenarios due to the differences in the emission factors From the EMEP modelling the total emissions from road traffic in the different scenarios are calculated for the countries included In Figure 4 emissions of NOX NMVOC and PM in the S2 (E-85) scenario relative to the S1 (all-petrol) scenario are shown for these countries The relative change is larger for countries with a high fraction of petrol cars relative to diesel cars (since the latter are the same in the two scenarios) such as Russia and Ukraine The relative change is smallest for PM emissions due to the very small contribution of the exhaust particles from petrol fuelled cars compared to the contribution from diesel vehicles and wear particles
A comparison of emissions from ethanol and petrol fuelled cars IVL report B1962 Health risk assessment for Vaumlstra Goumltaland
15
Figure 4 National emissions of NOX NMVOC and PM from the road traffic sector in E85 scenario (S2)
relative to lsquoall-petrolrsquo scenario (S1)
An important difference in the emissions between the scenarios lies in the speciation of the NMVOC emissions Figure 5 shows this speciation of NMVOCs for all road traffic emission categories used in this study The two rightmost bars in Figure 5 show the NMVOC speciation for Swedish road traffic emissions for the two scenarios S1 and S2 Comparison with Figure4 shows that the relative changes between the two scenarios are much larger for some individual NMVOC species that for the total NMVOC emissions Since the NMVOC emissions from traffic in Sweden are dominated by the emissions from petrol cars (about 85 of the road traffic emissions of NMVOC comes from petrol cars) the variations in NMVOC speciation between petrol and E85
0
02
04
06
08
1
NOx
0
02
04
06
08
1
NMVOC
0
02
04
06
08
1
Aus
tria
Bel
arus
Bel
gium
Bos
-Her
cB
ulga
riaC
roat
iaC
ypru
sC
zech
Rep
Den
mar
kE
ston
iaFi
nlan
dFr
ance
Ger
man
yG
reec
eH
unga
ryIr
elan
dIt
aly
Lat
via
Lith
uani
aL
uxem
bour
gM
alta
Net
herla
nds
Nor
way
Pola
ndPo
rtug
alR
oman
iaR
ussi
a_E
uro
Slov
ak R
epSl
oven
iaSp
ain
Swed
enSw
itzer
land
Tur
key
Ukr
aine
UK
PM
A comparison of emissions from ethanol and petrol fuelled cars IVL report B1962 Health risk assessment for Vaumlstra Goumltaland
16
will have a significant impact on the total road traffic NMVOC speciation As can be seen in Figure 5 scenario S1 is dominated by alkanes and aromatics while scenario S2 is dominated by ethanol It can also be noted that S1 contains a significant emission of benzene which is much lower in S2 while the opposite is true for acetaldehyde
Figure 5 Distribution of hydrocarbon species in NMVOC emissions from individual road traffic emission
categories as defined in emission scenarios in this study and from the whole road traffic emission sector in Sweden for scenarios S1 (All petrol) and S2 (All E85)
Figure 6 shows a map of the EMEP domain with emissions of acetaldehyde for the two studied scenarios as an example of the geographical distribution of emissions
Figure 6 Gridded emissions of acetaldehyde for the year 2020 (in tonnes per grid cell (50 km x 50 km)
and year) a ndash lsquoAll petrol scenario b ndash lsquoAll E85 scenariorsquo
As mentioned the emissions from road traffic in the Vaumlstra Goumltaland region are calculated in a 500 m x 500 m grid Figure 7 shows the emissions of NOX for 2005 as obtained from the database and the projected emissions for 2020 with a mixed use of E85 and petrol This can be considered as the base case for the emissions in 2020 It can be seen that the emissions decrease over the period which is due to reduction in NOX emissions factors as older vehicles are replaced by newer models (the traffic actually increases from a total of 754x109 vehicle-kilometres in 2005 to 937x109
0
20
40
60
80
100
Pet
rol e
xh
Pet
rol e
vap
E-8
5 ex
h
E-8
5 ev
ap
Pet
rol M
C
Die
sel L
DV
Die
sel H
DV
Roa
d Sw
eden
S1
Roa
d Sw
eden
S2
m
ass
Ethane
Alkanes C3+
Ethene
13 Butadiene
Alkenes C3+
Ethyne
Benzene
Aromatics C7+
Formaldehyde
Acetaldehyde
Aldket C3+
Ethanol
A comparison of emissions from ethanol and petrol fuelled cars IVL report B1962 Health risk assessment for Vaumlstra Goumltaland
17
vehicle-kilometres in 2020) The major roads in the region are clearly visible as well as the larger cities (especially Gothenburg)
Figure 7 Emissions of NOX (kgyear for a 500 m x 500 m grid cell) in the Vaumlstra Goumltaland region for 2005
and for 2020 for the base case
In Table 4 the traffic emissions for NOX benzene acetaldehyde ethanol and PM10 for the Vaumlstra Goumltaland region are shown for the four different emissions scenarios The emissions of NOX and benzene are reduced between 2005 and 2020 for the base case while the emissions of ethanol and acetaldehyde increase due to an expected increase in the use of ethanol fuel The NOX emissions for S1 are somewhat higher than for S2 due to the higher NOX emissions factor for petrol compared with E85
Table 4 Emissions from traffic for the Vaumlstra Goumltaland region in four different emission scenarios (in tonnesyear)
Substance base 2005 base 2020 S1 S2 NOX 13 243 4 843 4 954 4 631 Benzene 2 833 927 1 201 386 Acetaldehyde 628 1 074 305 2 595 Ethanol 192 5 192 0 15 400 PM10 1 324 486 483 476
33 Dispersion modelling
Resulting concentrations from calculations of the S1 and S2 scenarios with the EMEP model are used to provide input of primary and secondary air pollutants for the calculations with the TAPM model for the Vaumlstra Goumltaland region Concentrations of NOX NMVOC PM25 PM10 acetaldehyde ethanol and benzene are therefore calculated as boundary conditions for the Vaumlstra Goumltaland region In addition sensitivity studies are performed to investigate the role of formation of secondary acetaldehyde and secondary particulate matter (see Appendix 2) Time series analysis of the TAPM and EMEP model results of the S1 and S2 scenarios are presented in Figure 8
A comparison of emissions from ethanol and petrol fuelled cars IVL report B1962 Health risk assessment for Vaumlstra Goumltaland
18
a)
b)
Figure 8 Time series analyses of S1 and S2 scenarios for the EMEP and TAPM modelled concentrations of NOX and ozone at an urban background site in Gothenburg (TAPM) and in EMEP model grid cells including Gothenburg city (50 km x 50 km)
Concentrations of NOX and ozone at an urban background site in Gothenburg (TAPM) and in the 50 km x 50 km EMEP grid cells including Gothenburg are compared for one summer and one winter month Due to the well-known process of ozone titration by freshly emitted nitrogen monoxide (Seinfeld and Pandis 1998) the concentration of ozone often decreases in urban areas This phenomenon is expected to be captured by the fine-gridded TAPM model but not necessarily by the courser scale of the EMEP model Figure 8 shows the generally higher NOX levels in the small grid cell of the TAPM model in urban background location comparing to those in the large EMEP grid cell while the opposite is observed for the ozone concentrations (Remember that the boundary concentrations for TAPM are obtained from the EMEP model and they are thus the same in both cases) This indeed shows that local scale emissions and processes contribute to locally increased levels of NOX in urban areas both for the summer and the winter cases For ozone where there of course are no primary emissions the situation is the opposite where instead the result is decreased concentration levels at urban sites on a local scale The influence of the
A comparison of emissions from ethanol and petrol fuelled cars IVL report B1962 Health risk assessment for Vaumlstra Goumltaland
19
NMHC emissions from the passenger cars is studied in a sensitivity analysis (see Appendix 23) and it is found to have only a small influence on the ozone levels
To illustrate the results of the different scenario calculations the geographically distributed concentrations are presented as the difference in yearly average concentrations between the all E85 (S2) and all petrol (S1) scenarios both as microgm3 and sometimes as percentage of the difference to scenario S1 (see Appendix 3)
The difference in yearly average concentrations between scenario S1 and S2 for acetaldehyde and benzene can be seen in Figures 9 and 10 respectively The increase in acetaldehyde concentration resulting from a switch from petrol to E85 is up to about 05 gm3 or 80 in the central parts of the largest urban area of the region Gothenburg Outside this area the relative increase is about 10 for the other urban areas and less than that for the rural areas This large relative increase (see map in Appendix 4) is a result of the relatively high emissions of acetaldehyde from E85 fuelled cars For benzene the situation is opposite In the scenarios for 2020 the concentration of benzene decreases by up to a few tenths of gm3 as a result of a switch from petrol to E85 For benzene the relative change is not calculated
Figure 9 The difference in yearly average concentrations of acetaldehyde for 2020 between the all E85 (S2) and all petrol (S1) scenarios (microgm3)
A comparison of emissions from ethanol and petrol fuelled cars IVL report B1962 Health risk assessment for Vaumlstra Goumltaland
20
Figure 10 The difference in yearly average concentrations (gm3) of benzene for 2020 between the all E85 (S2) and all petrol (S1) scenarios
The difference in the calculated NOX NO2 and ozone concentrations between the two scenarios are shown in Appendix 4 The change in NOX concentration between the two scenarios only represents a small fraction of the total NOX concentration This is because the emissions of NOX from petrol cars are relatively low compared with the contribution from diesel engines and other sources Thus the resulting decrease in the NOX concentration with E85 is only up to 3 For ozone there is a small increase of about 01 microgm3 of E85 in the central areas of Gothenburg where there is relatively high traffic intensity (see Appendix 4 Figure A9) In the rest of the region there is a small decrease in the ozone concentration in the E85 scenario
34 Exposure
The resulting concentrations from the dispersion modelling together with the population density distribution are used to assess the exposure to acetaldehyde benzene NO2 NOX and ozone for the two scenarios S1 and S2 The exposure to PM25 is very similar for the two scenarios (the difference in concentration between scenarios S2 and S1 is only about -002 gm3 Table 5 shows the population weighted mean exposure both as total concentrations and as the difference between the two scenarios Detailed exposure results can be found in Appendix 5 It can be seen that the exposure to all the pollutants in Table 5 with the exception of acetaldehyde are somewhat lower for the all E85 scenario (S2) than for the all petrol scenario (S1) However the effect on health also
A comparison of emissions from ethanol and petrol fuelled cars IVL report B1962 Health risk assessment for Vaumlstra Goumltaland
21
depends on the level of the dose-response functions For example if the level of concentration is low in a populated area but the dose-response function is high the effect of even a low concentration increase can become important The increase in exposure from S1 to S2 (S2-S1) calculated as percentage of the population exposed to increased mean concentrations of pollutants is presented in Figure 11
Table 5 Populated weighted mean exposure (gm3)
S1 S2 S2-S1 Acetaldehyde 065 077 014 Benzene 01 005 -007 NOX 85 84 -012 Ozone 570 569 -012 PM25 270 268 -002
Increased concentrations Decreased concentrations Both increased and
decreased conc
Figure 11 The relative exposure (S2-S1) calculated as percentage of the population
In Figure 11 it is clear that the only pollutant that does not show an improvement regarding air quality and thus the health risks when modelling a switch from petrol to E85 is acetaldehyde For all pollutants except for ozone the changes of concentration levels observed between the scenarios are within the urban areas but for ozone there are also differences in rural areas
According to the data in Figure 11 about 14 of the population in the Vaumlstra Goumltaland region will be exposed to 03-08 microgm3 higher concentration levels of acetaldehyde in scenario S2 relative to S1 From Figure 9 it can be seen that the majority of these people live within the Gothenburg area Further about 28 of the population will be exposed to increased levels of between 01 to 03 microgm3 mainly in the suburban areas and rural surroundings of Gothenburg but also in some of the smaller cities in the region Outside the urban areas the concentration difference is lower than 01 microgm3
In the S2 scenario relative to the S1 scenario the population is exposed to decreased concentration levels of benzene and NOX This is mainly true also for O3 but with an exception for the central
A comparison of emissions from ethanol and petrol fuelled cars IVL report B1962 Health risk assessment for Vaumlstra Goumltaland
22
parts of Gothenburg where the concentration actually increases (see Appendix 4 Figure 7A) resulting in that 3 (blue area in Figure 11 for O3) of the population will be exposed to higher concentrations of O3 For the rest of the area there are decreased concentrations of ozone upon a switch to E85
The largest differences are again in the central parts of Gothenburg where about 20 of the population is being exposed to a lower benzene concentration of 01-03 microgm3 This also means that concerning benzene the majority (78) of the population have none or very low influence from a change to ethanol fuel
The largest effect on exposure difference is seen for NOX where just over 20 of the population has its exposure decreased with 03-05 microgm3 (in the central parts of Gothenburg) In the suburbs the decrease is between 01-02 microgm3 lower Along the largest roads there is a small but visible improvement on a yearly basis of 01 microgm3
For PM25 there is a difference in the populated weighted mean exposure of 002 gm3 between the scenarios with a lower value for the all-E85 case (see also Appendix 5)
35 Impact on health in Vaumlstra Goumltaland
351 NO2 and NOX
The impact of long-term exposure on mortality was estimated using the relative risk from the Norwegian cohort study (Nafstad et al 2004) reporting a relative risk of 08 increase per microgm3 increase in NOX however without adjustment for particle concentrations Assuming this effect on the total mortality and a typical baseline mortality of 1000 deaths per 100 000 person years a decrease in the population mean exposure of 012 microgm3 would correspond to approximately 104 less preterm deaths per year However for the present case this number is highly uncertain since the exposure to substances normally associated with changes in NOX exposure may here change in different ways since the relation between different exhaust components varies between the scenarios
The impact of long-term exposure on asthma incidence (new cases) in adults has been estimated using results from the Swedish RHINE Study Cohorts (Modig et al 2009) with very similar results in the ECRHS Study corresponding to approx 4 increase per microgm3 increase in NO2 From the RHINE Study the incidence can be estimated to 03 per year (proportion of adults developing the disease) with children and elderly excluded this means around 1500 adult cases per year A reduction of 009 microgm3 corresponds to 54 avoided new cases of adult asthma per year However also NO2 in the asthma study may have been mainly an indicator of vehicle exhaust
352 Ozone
The impact of long-term exposure on respiratory mortality has been reported to be approx 02 per microgm3 increase in the summer concentration when studied in the large ACS Cohort (Jerret et al 2009) Assuming this effect on the total population and a typical baseline respiratory mortality of 100 deaths per 100 000 person years a decrease in the population mean exposure of 012 microgm3 corresponds to approximately 03 less preterm deaths per year
A comparison of emissions from ethanol and petrol fuelled cars IVL report B1962 Health risk assessment for Vaumlstra Goumltaland
23
353 Acetaldehyde
According to US EPA (1999) a lifetime risk for cancer of 0000002 per microgm3 is to be assumed for this potential human carcinogen An increase in the population mean exposure of 012 microgm3 corresponds to 026 cases more per year in the current population
354 Benzene
According to US EPA (1999) a lifetime risk for cancer (leukaemia) of 00000022-00000078 per microgm3 is to be assumed for this human carcinogen A decrease in the population mean exposure of 0074 microgm3 corresponds to approximately 03 cases less per year in the current population (assuming 0000004 per microgm3)
355 PM25
In CAFEacute and other impact assessments a relative risk of 6 increase in all-cause mortality per 10 microgm3 has usually been assumed Assuming this effect on the total mortality and a typical baseline mortality of 1000 deaths per 100 000 person years a decrease in the population mean exposure of 002 microgm3 corresponds to approximately 13 less preterm deaths per year
4 Discussion
In this study the health risks from a large introduction of E85 to replace petrol is analysed in scenario studies for 2020 for the Vaumlstra Goumltaland region It is found that the change in pollutant concentration exposure and health risks are small between the two scenarios It should be emphasized that the study only considers vehicle emissions and does not take into account effects from the fuel production
The emissions of NOX in the model are somewhat lower from E85 fuelled cars than from petrol fuelled cars This is in line with the emission factors used by Jacobson (2007) The nitrogen oxides are key substances in the atmospheric reactions determining the concentrations of ozone in air NOX is involved in the formation of ozone but close to the NO source the ozone concentration is lowered due to the rapid reactions between NO and O3 forming NO2 If NO is released in an environment with already high NO concentration it may result in lowering of ozone levels on the regional scale In the present study the ozone concentrations calculated are somewhat lower for the E85 scenario than for the petrol scenario
The health risk analysis shows that the main difference between the scenarios is due to the lower concentration of NOX However it may have been other exhaust components than NOX such as exhaust particles that were behind the reported association with mortality In cases when NOX is not a good indicator of exhaust particle emissions and their toxicity our results may be misleading This should be studied further Neglecting the effects of the changes in NOX exposure the total difference between the scenarios sums up to 16 preterm deaths per year with lower values for the E85 scenario while it would sum up to 12 less preterm deaths for the E85 scenario if the effect related to NOX were included Since there are no similar studier for the effect on mortality among those younger than 30-50 years of age we assume the same relative effect on mortality in all ages This makes only a small difference since the large majority of deaths occur in older groups
A comparison of emissions from ethanol and petrol fuelled cars IVL report B1962 Health risk assessment for Vaumlstra Goumltaland
24
The opposite result for the ozone concentration was obtained by Jacobson The reason for this discrepancy is that the Jacobson study concerns Los Angeles a region with high concentrations of pollutants while the study here concerns the Vaumlstra Goumltaland region with much less dense traffic and also lower concentrations of pollutants importantly NOX It is not unlikely that the effect that Jacobson report also would be found for large parts of Europe with higher traffic densities than in the Vaumlstra Goumltaland region
It is worth to emphasize that the major negative health effect in the Jacobson (2007) study is attributed to the increase in ozone concentration that is a result of the decrease of the NO emissions from E85 cars Directly after the emission NO reacts with ozone resulting in drop of the ozone concentration the so-called ozone titration commonly observed in many cities This NO does however form even higher quantities of ozone further downwind contributing to the general increase in the background ozone levels It is also precursor of NO2 secondary PM and other toxic species as eg PAN and hence reductions in NO emissions are never regarded as disbeneficial from the environmental viewpoint
There are of course several sources of uncertainties that influence the results of this study Since the main results concern differences between the two scenarios several of these factors loose on importance for the conclusions This comprises uncertainties in meteorology in future traffic volumes and in the population density distribution However there are some uncertainties that remain important The emission factors for E85 fuelled cars are much less characterised than what they are for petrol cars The emission of particles from E85 fuelled cars is especially uncertain with only very few published results Also the emissions of NMHC are somewhat uncertain and may be higher for E85 at lower ambient temperatures However the sensitivity analysis performed shows that for the studied region the NMHC emissions only have a small influence on the ozone concentrations
5 Conclusions
In this study the impact of tailpipe and evaporative emissions from E85 fuelled cars on air pollution and health risks are calculated and compared with petrol fuelled cars The scenario calculations for the Vaumlstra Goumltaland Region give data on emissions pollutant concentrations exposure and a health risk evaluation
The differences in emission factors between E85 and petrol lies in the emissions of PM and NOX which are about 65 and 58 for E85 relative petrol respectively Also the speciation of the emitted hydrocarbons is significantly different with large emissions of acetaldehyde and ethanol from E85 and large emissions of benzene higher aromatics alkanes and alkenes from petrol
These differences in emission factors reflect in differences in emissions The emission calculations for all Swedish road traffic show a decrease for the E85 scenario relative to the petrol scenario of 65 for NOX 34 for PM25 67 for benzene For acetaldehyde there is an increase of 770
The differences obtained from the TAPM modelling show decreased levels of NOX ozone and benzene with E85 and increased levels of acetaldehyde For the latter the increase may be up to 80 while NOX and ozone show decreases of up to a few per cent and a few tenths of per cent respectively
A comparison of emissions from ethanol and petrol fuelled cars IVL report B1962 Health risk assessment for Vaumlstra Goumltaland
25
The health risk assessment shows decreased health risks in the E85 scenario relative the all-petrol scenario due to the increased NOX exposure correlated with both preterm deaths and asthma However NOX may be mainly an exhaust indicator Smaller effects are expected from the changes in ozone acetaldehyde and benzene exposure The overall difference considering the exposure to PM acetaldehyde benzene and ozone is 16 preterm deaths with lower values for the E85 scenario
6 Acknowledgements
Saab Automobile The Swedish Transport Administration and The Foundation for the Swedish Environmental Research Institute are gratefully acknowledged for financial contribution
Magnus Ekstroumlm and Maria Holmstroumlm at Saab and Martin Juneholm at the Swedish Transport Administration are acknowledged for their most valuable input to the study
David Simpson Norwegian Meteorological Institute EMEP MSC-W Norway and Dept Radio amp Space Science Chalmers Univ Technol Sweden is gratefully acknowledged for help with implementation of the Unified EMEP model
A comparison of emissions from ethanol and petrol fuelled cars IVL report B1962 Health risk assessment for Vaumlstra Goumltaland
26
7 References
Altenstedt J Pleijel K 2000 An alternative approach to photochemical ozone creation potentials under European conditions J Air amp Waste Manage Assoc 50 1023 ndash 1036
Andre J-M (2005) Vehicle emission measurement collection of the ARTEMIS datatbase Artemis 3312 report Available from httpwwwinretsfrurltepublicationspublications-pdfJoumardA3312reportJMALTE0504pdf
Bachand A MMundt K A Mundt D JMontgomery R R Epidemiological studies of formaldehyde exposure and risk of leukemia and nasopharyngeal cancer A meta-analysis Critical Reviews in Toxicology 2010 40(2) 85ndash100
Beane Freeman L E Blair A Lubin J H Stewart P A Hayes R B Hoover R N Hauptmann M Mortality from lymphohematopoietic malignancies among workers in formaldehyde industries The National Cancer Institute Cohort J Natl Cancer Inst 2009101751ndash761
Bosetti C McLaughlin J K Tarone R E Pira E LaVecchia C Formaldehyde and cancer risk A quantitative review of cohort studies through 2006 Ann Oncol 20081929ndash43
ConcaweJRC Well-to-wheel studies httpiesjrceceuropaeuwtwhtml
Derwent R G Jenkin M E Saunders S M 1996 Photchemical ozone creation potentials for a large number of reactive hydrocarbons under European conditions Atmos Environ 30 181 ndash 199
Derwent RG Jenkin ME Passant NR Pilling MJ 2007 Photochemical ozone creation potentials (POCPs) for different emission sources of organic compounds under European conditions estimated with a Master Chemical Mechanism Atmos Env 41 2570ndash2579
EEA Copenhagen 2009 wwweeaeuropaeudata-and-mapsdatapopulation-density-disaggregated-with-corine-land-cover-2000-2
Ericsson P Holmstroumlm M Amberntsson-Carlsson A Ohlson C Skoglundh M Andersson B Carlsson P-A 2008 Characterization of particulate emissions and methodologhy for oxidation of particulates from non-diesel combustion ystems SAE Technical Paper Series 2008-01-1746
GAINS 2010 httpgainsiiasaacatindexphpgains-europe
Graham LA Belisle SL Baas C-L Emissions from light duty gasoline vehicles operating on low blend ethanol gasoline and E85 Atmospheric Environment 42 4498 (2008)
Haskew H M Thomas P E Liberty F 2006 Fuel Permeation From Automotive Systems E0 E6 E10 E20 And E85 Final Report CRC Project No E-65-3 Coordinating Research Council Inc 3650 Mansell RoadSuite 140Alpharetta GA 30022
HEI Air Toxics Review Panel (2007) Mobile-Source Air Toxics A Critical Review of the Literature on Exposure and Health Effects HEI Special Report 16 Health Effects Institute Boston USA
Hurley P TAPM v 4 User Manual 2008 CSIRO ISBN 978-1-921424-73-1
IARC (2006) IARC Monographs on the Evaluation of Carcinogenic Risks to Humans Wood Dusts and Formaldehyde Lyon World Health Organization International Agency for Research on Cancer Lyon France 8837ndash325
Jacobson M Z Effects of Ethanol (E85) versus Gasoline Vehicles on Cancer and Mortality in the United States Environ Sci Technol 2007414150-4157
A comparison of emissions from ethanol and petrol fuelled cars IVL report B1962 Health risk assessment for Vaumlstra Goumltaland
27
Jerret M Burnett R T Pope C A Ito K Thurston G Krewski D Shi Y Calle E Thun M Long-Term Ozone Exposure and Mortality N Engl J Med 20093601085-95
Lipman T E Delucchi M A 2002 Emissions of nitrous oxide and methane from conventional and alternative fuel motor vehicles Climate Change 53 477
Modig L Toreacuten K Janson C Jarvholm B Forsberg B Vehicle exhaust outside the home and onset of asthma among adults Eur Respir J 2009 Jun33(6)1261-7
Nafstad P Haheim L L Wisloff T Gram F Oftedal B Holme I Hjermann I Leren P Urban air pollution and mortality in a cohort of Norwegian men Environ Health Perspect 2004112(5)610-5
OEHHA (1999) Air Toxics Hot Spots Program Risk Assessment Guidelines Part II Technical Support Document for Describing Available Cancer Potency Factors Prepared by the Air Toxicology and Epidemiology Section Office of Environmental Health Hazard Assessment April 1999
Passant NR (2002) Speciation of UK emissions of non-methane volatile organic compounds AEAT report AEATENVR0545 Issue 1 Culham UK
Pope CA III Thun MJ Namboodiri MM Dockery DW Evans JS Speizer FE Heath CJ Particulate air pollution as a predictor of mortality in a prospective study of US adults Am J Resp Crit Care Med 1995 151 669-674
Seinfeld J H and Pandis SN (1998) Atmospheric Chemistry and Physics From Air Pollution to Climate Change John Wiley amp Sons New YorkSimpson D Fagerli H Jonson JE Tsyro S Wind P Tuovinen J -P 2003 Transboundary acidification and eutrophication and ground level ozone in Europe Unified EMEP Model Description EMEP Status Report 12003 Part I EMEPMSC-W Report The Norwegian Meteorological Institute Oslo Norway
US EPA (1999) httpwwwepagovttnatwnata1999nsata1999
Vestreng V et al 2004 Inventory Review 2004 Emission data reported to CLRTAP and the NEC Directive EMEPEEA Joint Review Report EMEPMSC-W Note 1
Westerholm R Ahlvik P Karlsson HL An exhaust characterisation study based on regulated and unregulated emissions from bi-fuel and flexi-fuel light-duty passanger cars fuelled by petrol (E5) bioethanol (E70 E75) and biogas tested at ambient temperatures of +22degC and -7degC 2008
Wolkoff P Nielsen G D Non-cancer effects of formaldehyde and relevance for setting an indoor air guideline Environment International 201036788ndash799
Yanowitz J McCormick RL Effect of E85 on tailpipe emissions from light-duty vehicles J Air amp Waste Manage Assoc 59 172 (2009)
A comparison of emissions from ethanol and petrol fuelled cars IVL report B1962 Health risk assessment for Vaumlstra Goumltaland
28
Appendix 1 Evaporate emissions of NMHC
The following assumptions are done for evaporative emissions The NMHC emissions from E85 are reduced relative to petrol by 45 Methane emissions are zero and the split of NMHC species is 68 ethanol and the remaining 32 is divided in the same way as evaporative emissions for petrol The estimates by Graham et al (2008) are missing evaporative emission data however these assumptions agrees very well with measurements of evaporative emissions due to fuel permeation reported by Haskew et al (2006) where NMHC emissions are reported to be reduced by 50 for E85 fuel compared to petrol Haskew et al also presents the NMHC split to species with 60 ethanol This number agrees quite well with our assumption of 68 NMHC being ethanol NMHC in exhaust and evaporative emissions are thus divided as in Table A1
Table A1 Division of NMHC in the exhaust and evaporative emissions for E85 and petrol respectively (wt)
E85 Petrol E85 Petrol exhaust exhaust evaporative evaporative
Ethanol 680 0 680 0 Acetaldehyde 131 08 02 0 Ethene 99 73 24 0 Ethyne 03 28 09 0 Formaldehyde 31 17 06 0 Benzene 16 56 18 10 13 Butadiene 03 09 03 0 sum 963 191 741 10
The remaining NMHC emissions are divided as for petrol (ref) and listed in Table A2
Table A2 Division of NMHC in the exhaust and evaporative emissions for E85 and petrol respectively (wt)
E85 Petrol E85 Petrol exhaust exhaust evaporative evaporative
Ethane 02 32 10 0 Alkanes (C3+) 13 278 89 880 Alkenes (C3+) 04 90 29 95 Aromatics (C7+) 18 388 125 15 Aldehydesketones (C3+)
01 15 05 0
A comparison of emissions from ethanol and petrol fuelled cars IVL report B1962 Health risk assessment for Vaumlstra Goumltaland
29
Appendix 2 Description of the model system
A21 Atmospheric lifetimes
Table A3 gives tropospheric lifetimes with regard to reaction of ethanol formaldehyde acetaldehyde and benzene (C6H6) with OH nitrate radical (NO3) and photolysis The studied organic species are listed together with three species common in the gasoline exhaust (benzene ethene and toluene) for comparison Table 11 shows also photochemical ozone creation potential (POCP) of these species POCP is a measure of amount of ozone that is formed from a certain VOC emission relatively to other emission source which has been established to the same emission mass of ethene (Derwent et al 1996 Altenstedt et al 2000) The range represents different scenarios for VOC and NOX background concentrations Derwent et al (2007) used similar methodology to calculate POCP of different VOC sources and calculated POCP of mean road emission exhaust to be 69
Table A3 Atmospheric lifetimes of studies NMVOC species with respect to the OH- and NO3- initiated
degradation τ(OH) and τ(NO3) and with respect to the photolysis (The lifetime of a chemical species which decays in a first-order process is the time needed for a concentration of this species to decrease to 1e of its original value Statistically it represents the mean life expectancy of an excited species) The OH concentration of 1times106 moleculescm3 typical for summer troposphere was used for the lifetime calculation The NO3 concentrations of 5 and 100 ppt(V) were used for lifetime calculations as representative of rural and urban night-time 12 hrs mean concentration The studied organic species are listed together with 3 species common in the gasoline exhaust for comparison The rates of photolysis were calculated with radiation transfer model for July 58ordm latitude and integrated over 24 hours
τ(OH) τ(NO3) urbanrural τ (photolysis) POCP
hr hr hr
Ethanol 85 56 1times103 - 44 - 63
Acetaldehyde 15 47 1times103 86 68 - 80
Formaldehyde 30 194 4times103 10 18 - 55
Benzene 214 - - 23 - 47
Ethene 34 - - 100
Toluene 50 - - 30 - 67
A22 Defining of boundary concentrations for TAPM from EMEP fields
Calculation of initial concentration field for TAPM from EMEP concentration field of NO2 (as example) and EMEP mean wind vector components u_mid and v_mid Two EMEP model gridcells (i=56 j=60 and i=56 j=61) represent the TAPM model domain and concentrations from the surrounding EMEP gridcells SE-S SE-N NW-S NW-N NE NW (Figure A1) are used for calculation of boundary concentration NO2(bc) according to the following code if u_mid lt= 0 then ( isite = SE-S and jsite = SE-N) else isite = NW-S and jsite = NW-N) endif
A comparison of emissions from ethanol and petrol fuelled cars IVL report B1962 Health risk assessment for Vaumlstra Goumltaland
30
if v_mid lt= 0 then ( ksite = NE) else ksite = SW endif NO2(bc) = [(NO2(isite)u_mid(isite) + NO2(jsite)u_mid(jsite))2 + NO2(ksite)v_mid(ksite)] [(u_mid(isite) + u_mid(jsite))2 + v_mid(ksite)]
Figure A1 Gridcells covering Gothenburg domain and its boundary in EMEP model plotted on latitude-
longitude coordinates The red square represents centre of Gothenburg and the blue line the coastline EMEP i and j coordinates for the boundary gridcells are SE-S = 57-60 SE-N = 57-61 NW-S = 55-60 NW-N = 55-61 NE = 56-62 NW = 56-59 and for Gothenburg grid cells are Gbg-NE = 56-61 Gbg-SW = 56-60
A23 Atmospheric chemistry
The role of secondary chemistry in for the concentration of acetaldehyde are studied by first excluding the primary acetaldehyde emissions from the EMEP model simulations of scenarios S1 and S2 and then by excluding all NMVOC emissions from the car category with spark ignition engines The contribution from the primary acetaldehyde emissions as well as the contribution of secondary acetaldehyde formed from other NMVOC to the total acetaldehyde concentration is then obtained However the secondary chemistry is highly nonlinear due to the interactions of NMVOCs with ozone and OH and thus the results for the contribution of secondary acetaldehyde are somewhat uncertain Differences in acetaldehyde concentrations between S1 and S2 scenarios are studied with respect to contribution of primary and secondary acetaldehyde It is observed that in summer background air the monthly mean contribution of the secondary acetaldehyde is of the same magnitude as the contribution of the primary acetaldehyde to the difference between S1 and
565
57
575
58
585
105 115 125 135 145
Long
Lat
Gbg-SW
Gbg-NE
SE-S
NW-N
NW-S
SE-N
SW
NE
55-59
57-59
55-62
A comparison of emissions from ethanol and petrol fuelled cars IVL report B1962 Health risk assessment for Vaumlstra Goumltaland
31
S2 In the winter and in more polluted atmosphere (Gothenburg grid cells) the contribution from secondary acetaldehyde to the concentration difference appears to be negative due to the chemistry feedback ie the E-85 scenario has less secondary acetaldehyde than the all-petrol scenario
A comparison of S2-S1 differences in primary and secondary acetaldehyde concentrations in the background (=upwind) and Gothenburg grid cells show no increase in the secondary acetaldehyde from upwind to the Gothenburg grid cell It can thus be concluded that there is no significant contribution from secondary aldehydes on the small scale (tenths of km) Conclusion from this sensitivity study is that the secondary formaldehyde can be of importance under summer in the clean background air but that formation on the local scale is unimportant Using EMEP simulated boundary concentrations of acetaldehyde in the local scale model and simulating the primary acetaldehyde emissions will capture the most important features of acetaldehyde dispersion and chemistry in Vaumlstra Goumltaland
In the EMEP model the tail-pipe PM emissions are specified as primary particles Emissions of NOX and VOCs (and NH3 SO2) are oxidised in the atmosphere and a part is then transferred through the gas-to-particle transport to the PM as secondary PM The petrol fuelled cars emit both more primary PM and more NOX compared to the E85 cars If we compare differences in primary and secondary PM between the S1 and S2 scenarios simulated by EMEP we can directly see what part of the difference is from the tail-pipe emissions of the primary particles and what part is from the formation of the secondary PM in atmosphere (mostly from higher emissions of NOX) Table A4 shows the differences between S1 and S2 (S1-S2) of monthly PM averages for January and June (two months with low and high photochemical activities respectively) It can be seen that the higher formation of secondary PM in the S1 (all-petrol) scenario is more important than the higher tail-pipe emission of primary PM by factor 10 - 20
When we compare simulated PM differences between S1-S2 for the background air (=upwind) grid cells and for grid cells including Gothenburg (50 km x 50 km scale) we can see significant increase in primary PM in the S1 scenario from the upwind grid cells to Gothenburg (746 in winter 132 in summer) while no systematic increase can be seen for the secondary PM (-42 in winter +24 in summer) From this comparison it can be concluded that no systematic increase in secondary PM can be seen (in difference from the primary PM) on the scale of 50-100 km and we can neglect this process on the small scale However the overall change in PM concentrations due to the switch of the fuel is very small both on the large scale and on the small scale as can be seen when the differences in PM concentrations between S1 and S2 are compared to absolute PM concentrations in S1 presented in the last column of Table A4
Table A4 Differences in primary and secondary PM concentrations between the lsquoAll-petrolrsquo (S1) and lsquoE-85rsquo (S2) scenarios simulated in gridcells upwind Gothenburg and in gridcells including Gothenburg (2 50 km x 50 km gridcells)
S1-S2 Background
S1-S2 Gothenburg
Increase S1-S2 Gothenburg
S1 Background
μgm3 μgm3 μgm3 bkgnd μgm3
Prim PM10 Jan 00008 00014 00006 746 084
Jun 00008 00018 00010 1319 084
Sec PM10 Jan 00155 00148 -00006
-42 157
Jun 00080 00081 00002 24 213
The sensitivity of the used emission factors for NMHC with respect to the ozone formation in the region of the Swedish West Coast can be analysed with the help of results from studying the
A comparison of emissions from ethanol and petrol fuelled cars IVL report B1962 Health risk assessment for Vaumlstra Goumltaland
32
formation of secondary acetaldehyde In this study first all primary acetaldehyde emitted by the E85 fleet are omitted in a model simulation (S2_nopAA) and secondly all NMHC emissions from the E-85 fleet are switched off (S2_noVOC) Acetaldehyde has a somewhat higher though still comparable photochemical ozone creation potential compared to ethanol (ethanol 44-63 acetaldehyde 68-80 Altenstedt and Pleijel 2000) and this simulation will thus also give information on the sensitivity of the calculations to uncertainties in the ethanol emissions Setting the emission factor for NMHC to zero gives the sensitivity to the emission factor of total NMHC Figure A2 shows the differences in ozone concentration as a result of acetaldehyde only and the total NMHC from the E85 car fleet (S2 scenario) We can see that the effect on ozone formation is very small for the Swedish West coast The reason is that the ozone formation in this area is controlled by the availability of NOX while NMHC or rather their degradation products the peroxy radicals that serve as a lsquofuelrsquo to ozone formation are usually in excess here and further VOC emissions do not increase ozone concentrations significantly The situation looks different in areas that are more heavily polluted with NOX andor which is limited in the availability of peroxy radicals The results from this sensitivity study are fully consistent with the observed increase in ozone concentrations as a result of lower NO emissions (the so-called ozone titration) only very close to the major roads but no larger-scale decrease in ozone concentrations in the Gothenburg area or in any other communities
Figure A2 Sensitivity of the ozone formation in the 2 EMEP model grid cells covering Gothenburg (blue) and in the 6 surrounding grid cells (red see Fig A1) to changes in NMHC emission factor of the E85 fuelled cars lsquobasersquo is simulation S2 with EF for NMHC as in Table 3 lsquonoVOCrsquo is S2 with EF for all NMHC = 0 lsquonopAArsquo is S2 with EF for acetaldehyde = 0 a ndash Mean sensitivity in January absolute difference in ozone formation in ppb(V) as a result of NMHC (base-noVOC) and acetaldehyde (base-nopAA) emissions b ndash Sensitivity relative to ozone concentration in the S2-base simulation January c ndash same as a) but June d ndash same as b) but June
‐002
‐001
0
001
base‐noVOC base‐nopAA
ΔO3(ppb)
a)
0
001
002
base‐noVOC base‐nopAA
ΔO
3(ppb)
c)
‐010
‐005
000
005
base‐noVOC base‐nopAA
ΔO
3
b)
000
002
004
006
base‐noVOC base‐nopAA
ΔO
3
d)
A comparison of emissions from ethanol and petrol fuelled cars IVL report B1962 Health risk assessment for Vaumlstra Goumltaland
33
Appendix 3 Emission results
The geographically distributed NOX and acetaldehyde emissions for the Vaumlstra Goumltaland region are presented in Figures A3 and A4 respectively
Figure A3 NOX emissions for the Vaumlstra Goumltaland region for the All Petrol scenario
A comparison of emissions from ethanol and petrol fuelled cars IVL report B1962 Health risk assessment for Vaumlstra Goumltaland
34
Figure A4 Acetaldehyde emissions for the Vaumlstra Goumltaland region for the All Ethanol scenario
A comparison of emissions from ethanol and petrol fuelled cars IVL report B1962 Health risk assessment for Vaumlstra Goumltaland
35
Appendix 4 Dispersion modelling results
The difference in yearly average concentration between scenario S1 and S2 for acetaldehyde and benzene can be seen in Figure A5 and Figure A6 respectively a)
b)
Figure A5 The difference in yearly average concentrations of acetaldehyde for 2020 between the all E85 (S2) and all petrol (S1) scenarios presented as a) microgm3 and as b) percentage for the Gothenburg area
A comparison of emissions from ethanol and petrol fuelled cars IVL report B1962 Health risk assessment for Vaumlstra Goumltaland
36
a)
b) all E85 c) all petrol
Figure A6 a) the difference in yearly average concentrations (gm3) of benzene for 2020 between the all E85 (S2) and all petrol (S1) scenarios yearly means for b) all E85 and c) all petrol (note the different scales)
The difference in the calculated NOX NO2 and ozone concentrations between the two scenarios are shown in Figures A7 A8 and A9
A comparison of emissions from ethanol and petrol fuelled cars IVL report B1962 Health risk assessment for Vaumlstra Goumltaland
37
a)
b)
Figure A7 The difference in yearly average concentrations of NOX for 2020 between the all E85 (S2) and all petrol (S1) scenarios presented as a) microgm3 and as b) percentage for the Gothenburg area
A comparison of emissions from ethanol and petrol fuelled cars IVL report B1962 Health risk assessment for Vaumlstra Goumltaland
38
a)
Figure A8 The difference in yearly average concentrations of NO2 for 2020 between the all E85 (S2) and all petrol (S1) scenarios presented as a) microgm3 and as b) percentage for the Gothenburg area
A comparison of emissions from ethanol and petrol fuelled cars IVL report B1962 Health risk assessment for Vaumlstra Goumltaland
39
a)
b)
Figure A9 The difference in yearly average concentrations of ozone for 2020 between the all E85 (S2) and all petrol (S1) scenarios presented as a) microgm3 and as b) percentage for mainly the Gothenburg area
A comparison of emissions from ethanol and petrol fuelled cars IVL report B1962 Health risk assessment for Vaumlstra Goumltaland
40
Appendix 5 Detailed Exposure data
Detailed exposure data for the difference between the all E85 (S2) and the all petrol (S1) scenarios can be found in Table A5
Table A5 Exposure data for the difference between the all E85 (S2) and the all petrol (S1) scenarios
Acetaldehyde diff E-P (microgm3)
Populated weighted mean
Number of people Percentage of population
0 - 01 627198 582 01 - 02 163394 152 02 - 03 134879 125 03 - 04 88099 82 04 - 05 38686 36 05 - 06 16880 16 06 - 07 7983 07 07 - 08 1248 01 Tot 014 1078367 Benzene diff E-P (microgm3)
Populated weighted mean
Number of people Percentage of population
-03 - -02 26680 25 -02 - -01 205757 191 -01 - -0 845930 784 Tot -0074 1078367 NO2 diff E-P (microgm3) Populated weighted
mean Number of people Percentage of
population -04 - -03 7698 07 -03 - -02 50131 46 -02 - -01 296288 275 -01 - -0 724250 672 Tot -009 1078367 NOX diff E-P (microgm3) Populated weighted
mean Number of people Percentage of
population -06 - -05 7698 -05 - -04 19639 18 -04 - -03 36626 34 -03 - -02 161685 150 -02 - -01 186500 173 -01 - -0 666219 618 Tot -012 1078367 O3 diff E-P (microgm3) Populated weighted
mean Number of people Percentage of
population -02 - -01 779132 723 -01 - -0 266417 247 0 - 01 32818 30 Tot -012 1078367
Exposure data for the total levels in the two scenarios can be found in Table A6
A comparison of emissions from ethanol and petrol fuelled cars IVL report B1962 Health risk assessment for Vaumlstra Goumltaland
41
Table A6 Exposure data for the total levels in the two scenarios
Acetaldehyde tot All ethanol (microgm3)
Populated weighted mean
Number of people Percentage of population
06 - 07 568825 527 07 - 08 171845 159 08 - 09 124551 115 09 - 10 100946 94 10 - 11 59235 55 11 - 12 30559 28 12 - 13 13175 12 13 - 14 7983 07 14 - 15 1248 01 Tot 077 1078367 Acetaldehyde tot All petrol (microgm3)
Populated weighted mean
Number of people Percentage of population
05 - 06 45111 42 06 - 07 1032008 957 07 - 08 1248 01 Tot 065 1078367 Benzene tot All ethanol (microgm3)
Populated weighted mean
Number of people Percentage of population
0 - 01 1055961 98 01 - 02 22406 2 Tot 005 1078367 Benzene tot All petrol (microgm3)
Populated weighted mean
Number of people Percentage of population
0 - 01 729093 676 01 - 02 232961 216 02 - 03 94042 87 03 - 04 21023 19 04 - 05 1248 01 Tot 010 1078367 NOX tot All ethanol (microgm3)
Populated weighted mean
Number of people Percentage of population
0-10 779108 722 10-20 254658 236 20-30 28683 27 30-40 11070 10 40-50 3426 03 50-60 0 00 60-70 0 00 70-80 639 01 80-90 0 00 90-100 0 00 100-110 783 01 Tot 84 1078367 NOX tot All petrol (microgm3)
Populated weighted mean
Number of people Percentage of population
0-10 769557 714 10-20 264209 245 20-30 28683 27 30-40 11070 10 40-50 3426 03 50-60 0 00
A comparison of emissions from ethanol and petrol fuelled cars IVL report B1962 Health risk assessment for Vaumlstra Goumltaland
42
60-70 0 00 70-80 639 01 80-90 0 00 90-100 0 00 100-110 783 01 Tot 85 1078367 O3 tot All ethanol (microgm3)
Populated weighted mean
Number of people Percentage of population
40-45 1422 01 45-50 26487 25 50-55 176636 164 55-60 770370 714 60-65 103452 96 Tot 569 1078367 O3 tot All petrol (microgm3)
Populated weighted mean
Number of people Percentage of population
40-45 1422 01 45-50 20229 19 50-55 181876 169 55-60 763361 708 60-65 111479 103 Tot 570 1078367 PM25 tot All ethanol (microgm3)
Populated weighted mean
Number of people Percentage of population
1-2 0 00 2-3 885325 821 3-4 192259 178 4-5 783 01 Tot 268 1078367 PM25 tot All petrol (microgm3)
Populated weighted mean
Number of people Percentage of population
1-2 0 00 2-3 868773 806 3-4 208811 194 4-5 783 01 Tot 270 1078367
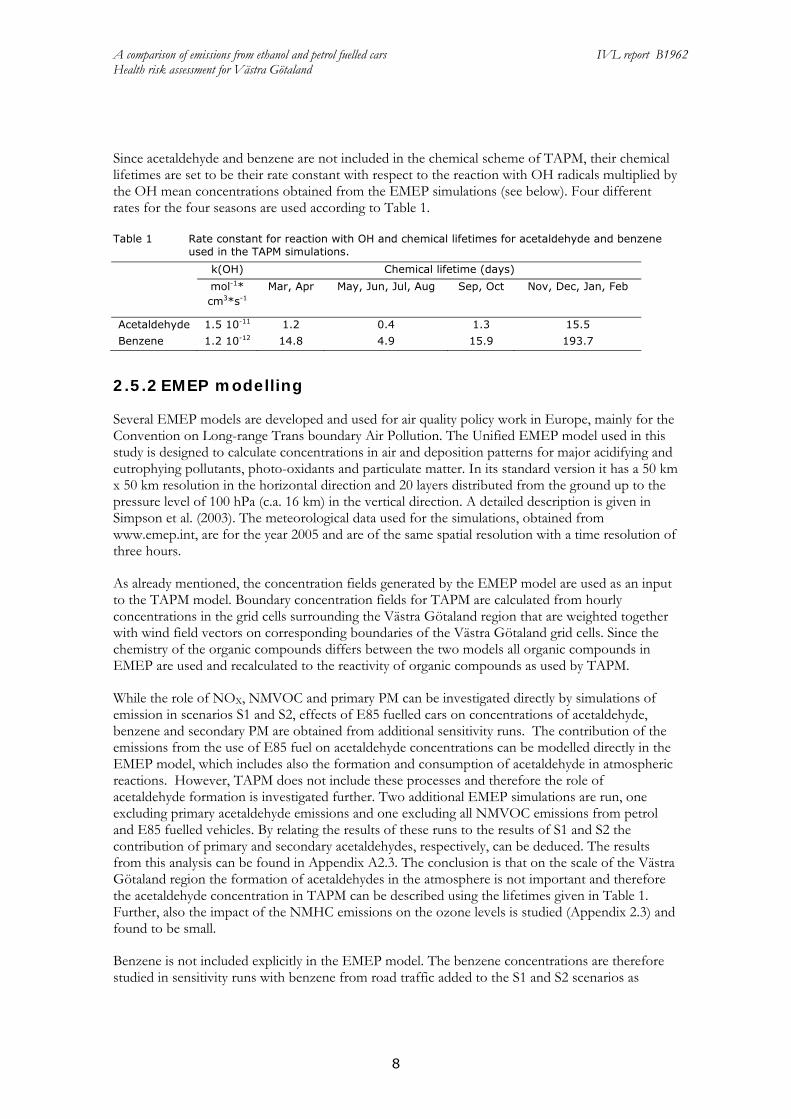
A comparison of emissions from ethanol and petrol fuelled cars IVL report B1962 Health risk assessment for Vaumlstra Goumltaland
10
27 Health effects and risk assumptions
271 NOX and NO2
Using modelled levels of NOX in the residential area as a vehicle exhaust marker a Norwegian study of 16 000 men from Oslo of whom 25 died during the follow up found a strong association (Nafstad et al 2004) This cohort with people of between 40-49 years of age at the start of the study was followed from 197273 through 1998 NOX was estimated in a model with 1000 m grids and a street contribution added for the largest streets When the median concentration of NOX for 1974-78 was used (mean 107 μgm3) the relative risk for total non-violent mortality was 8 per 10 μgm3 Nitrogen oxides do not have to be important as causal components behind this association
272 Ozone
Short-term effects of ozone on the respiratory system and on daily number of deaths have been reported from a large number of studies especially for summer concentrations why a threshold has sometimes been assumed in impact assessments Only recently has an effect of long-term exposure on mortality been reported from the very large American Cancer Society (ACS) Cohort Study (Jerret et al 2009)
Jacobson (2007) reported that E85 would cause an increase in mortality but assumed an effect of short-term exposure only The estimated impact was explained by the calculated ozone formation
273 Acetaldehyde
An increased incidence of nasal tumours in rats and laryngeal tumours in hamsters were observed after inhalation of high concentrations of acetaldehyde (HEI 2007) A few epidemiological studies of occupational exposure found associations but with a complex mixture of chemicals and have not been used in the cancer risk assessment for acetaldehyde Acetaldehyde is classified by the National Institute of Occupational Safety and Health as ldquoa potential human carcinogenrdquo by the US EPA (1999) as ldquoa probable human carcinogenrdquo and by the IARC as ldquopossibly carcinogenic to humansrdquo (OEHHA 1999 HEI 2007)
274 Benzene
There is clear and widely accepted evidence from a variety of epidemiologic studies of occupational exposure that benzene increase the risks of acute myeloid leukaemia (HEI 2007) but there is more uncertainty about other lymph hematopoietic cancers Studies on traffic exposure and childhood leukaemia have produced mixed results with regard to associations
275 Formaldehyde
IARCrsquos Monograph 88 says that the evidence is sufficient to conclude that formaldehyde causes cancer in humans (IARC 2006) This was because of evidence of nasopharyngeal cancer at concentrations historically encountered in industrial settings However this conclusion by IARC was largely based on the results from one occupational exposure site and the results and conclusions have not been supportive in other reviews and more recent studies (Bosetti et al 2006 Beane Freeman et al 2009 Bachand et al 2010) OEHHA (1999) uses a lifetime risk for cancer of 0000006 per microgm3 for formaldehyde and US EPA (1999) a lifetime risk of 0000013 per microgm3
A comparison of emissions from ethanol and petrol fuelled cars IVL report B1962 Health risk assessment for Vaumlstra Goumltaland
11
For non-cancer effects the eye is the organ most sensitive to formaldehyde subjective irritation has been reported at 300-500 microgm3 which is above the odour thresholds (Wolkoff amp Nielsen 2010) Effects in the eyes and in airways occur around 600ndash1000 μgm3 Effects on lung function have not been found in controlled human exposure studies below 1 mgm3 In epidemiological studies of associations between formaldehyde and exacerbation of asthma several co-pollutants make the findings difficult to interpret An indoor air quality guideline of 100 μgm3 has been considered protective against both acute and chronic sensory irritation in the airways in the general population assuming a lognormal distribution of nasal sensory irritation (Wolkoff amp Nielsen 2010)
276 PM
In the studies of long-term exposure to PM25 and mortality like the American Cancer Society (ACS) Cohort the exposure contrast were mainly related to secondary PM why the reported relative risk approx 6 increase in all-cause mortality (in adults) per 10 μgm3 is most relevant for background secondary PM concentrations (Pope et al 1995)
277 Health Impact Assessment
To summarize the types of pollutants that are found possible to include in the health impact assessment are NOX and NO2 benzene acetaldehyde formaldehyde secondary PM and ozone The assessment is restricted to the most important and well established effects of these pollutants This means that not all types of potential health impacts are included Results should however do for a comparison of the scenarios
The impact on formaldehyde levels are not calculated why it is not included in the current assessment Relative risks from epidemiological studies of vehicle exhaust using NOX and NO2 as exposure variables may be influenced from effects of their co-pollutants mainly ultrafine particles (elemental carbon soot) CO and HCs such as formaldehyde Exhaust particles are often introduced in a relatively high background of particles from other sources Thus exhaust particles were not measured directly in the important studies of long-term exposure and effects on mortality
3 Results
31 Emission factors
The emission factors are selected from available published data both for the exhaust and the evaporative emissions In both cases values relative to petrol are used The majority of the studies have been done with both E85 and petrol making this comparison more robust
Westerholm et al (2008) tested two flexi-fuel cars with E5 E70 and E85 in the European driving cycle NEDC and in the Artemis driving cycles The former is used at two temperatures (22degC and -7degC) They report the regulated emissions greenhouse gases a number of organic compounds and particle number Graham et al (2008) present measurement results for regulated emissions greenhouse gases and a number of organic compounds from four cars with E85 and regular petrol in the FTP cycle They also made a compilation of literature data for ethanol cars Yanowitz and McCormick (2009) present an analysis of US certification testing data in order to compare emissions for E85 and petrol
A comparison of emissions from ethanol and petrol fuelled cars IVL report B1962 Health risk assessment for Vaumlstra Goumltaland
12
The results from the three studies (for flexi fuel cars) and in addition the values used by Jacobson (2007) are given in Table 2
Table 2 Emissions factors for E85 fuelled cars relative to the emission factors for petrol fuelled cars
Relative change E85 vs petrol ()
Yanowitz and McCormick (2009) (95 conf)
Graham et al (2008) (sd )
Westerlund et al (2008) (average for NEDC)
Jacobson (2007)
NOX -14 (-23 - -5) -42 (15) -38 -30 NMOG 26 (17 - 37) 12 (39) NMHC -43 (-52 - -32) -45 (24) THC -14 (-24 - -4) 2 TOG 22 CO -19 (-25 - -12) -5 (51) 1 5 PM 25 0 Formaldehyde 59 (32 - 91) 80 (44) 184 60 Acetaldehyde 2855 (1189) 1031 2000 13 Butadiene -64 (31) -74 -10 Benzene -72 (15) -71 -79 Ethanol 3950 from TOG Methane 50 43
Table 2 shows lower emissions of NOX for E85 fuelled cars relative to petrol fuelled cars from test cycles generally including cold starts The emissions of hydrocarbons are higher for petrol while the emissions of organic gases are somewhat higher for E85 The emissions of aldehydes especially acetaldehyde are much higher for E85 as are the emissions of ethanol and methane The emissions of benzene and 13-butadiene are higher with petrol It should be noted that the data in Table 2 are in general for tests performed at ambient temperatures of around 20 degC Westerlund et al (2008) report that for ambient temperatures of -7 degC the emissions of CO and NMHC may be significantly higher with E85 compared with petrol For one vehicle they also report very high NOX emissions with petrol at this lower temperature
As seen in Table 2 there are a number of different quantities when it comes to the emission of organic compounds or unburnt fuel From a chemistry point of view HC is no molecule but a notation for the sum of all compounds that are hydrocarbons thus are of the form HxCy and not containing any elements but carbon and hydrogen Total organic gases (TOG) include organic compounds containing oxygen such as alcohols and aldehydes (but not CO or CO2) Volatile organic compounds (VOC) means carbon containing organic compounds present in the gaseous state at ambient temperature Non-methane hydrocarbons (NMHC) means HC minus the methane mass NMTOG and NMVOC are defined in the corresponding way1
1 When it comes to exhaust gas regulations the definitions differ somewhat In the US THC is defined as the signal obtained from a FID (Flame Ionisation Detector) instrument calibrated on propane This means that alcohols and aldehydes contribute to THC but to a lower extent since their responses in a FID instrument are lower than for hydrocarbons TOG is defined in the US regulations as THC + the mass of alcohols (eg methanol) and carbonyls (eg formaldehyde) measured separately NMHC is equal to THC ndash rCH4CH4 ndashralcAlc where the CH4-concentration is measured by gas chromatography and a FID calibrated with methane Alc is the alcohol concentration and rCH4curren and rAlc are the respective FIDresponse functions NMOG means TOG - CH4 and VOC is TOG - CH4 - C2H6 In the regulations it is stated that also a number of other non-ozone forming organic compounds eg acetone should be subtracted but these are present in very low concentrations in engine exhaust Note that there is actually a double counting of aldehydes in NMOG since they contribute to a certain extent to the NMHC value and then are added using values from separate measurements
A comparison of emissions from ethanol and petrol fuelled cars IVL report B1962 Health risk assessment for Vaumlstra Goumltaland
13
There will be emission limits for both THC and NMHC in also the future For petrol cars with low methane emissions the challenge will be to meet the limit for NMHC For E85 cars with higher methane emissions the challenge will be to meet the THC limit Thus it is reasonable that the emissions of NMHC from E85 cars will be lower than for petrol cars
In the modelling presented here the emission factors from Graham et al (2008) are used with some exceptions as will be discussed The reason is that that study comprises a compilation of a relatively large number of tests For CO the emission factor is set to the same value for E85 and petrol since the differences are small and within the uncertainty For particle emissions the studies cited in Table 2 give little information Instead data from Ericsson et al (2008) are used indicating that the primary PM emission using E85 is about 65 of that when using petrol For NOX the emission for E85 is set to 58 of that for petrol
The emission factors for NMHC (physical emission in gkm) including ethanol are in this study set to the same value for E85 as for petrol This is in line with the data for NMOG reported by Graham showing only small differences It is also reasonable considering that the car producers optimize emissions to meet the future emission legislation in Europe for NMHC and THC i e the Euro 6 standards that apply from September 2014 For petrol with low CH4 emissions the NMHC value will be limiting and this is on 68 mgkm For E85 with higher CH4 emissions the THC value of 100 mgkm will be limiting When considering the FID response as a measure of emission instead of physical emission about 50 of the THC comes from NMHC for E85 cars However the FID response is low for ethanol which means that the physical NMHC emission is about 25 higher Considering these factors the emissions of NMHC (physical) for E85 can be expected to be around 50 mgkm 125 = 625 mgkm which is about the same as for petrol The methane emission for E85 is set to 142 times the value for petrol following Lipman and Delucchi (2002) Further also the differences in the evaporate emissions are considered as is described in Appendix 1
The emissions factors for petrol cars are taken from the Artemis model (Andreacute 2005) The distribution of NMHC for petrol cars is from Passant (2002) The resulting emission factors used to obtain the emissions scenarios are presented in Table 3
In Europe THC is defined as the signal from a propane calibrated FID and thus contains oxygen containing compounds although the response factors for the latter are lower The FID instrument gives the number of molecules and in order to calculate the mass the EU regulations use the densities obtained from assuming the molecular formulas C1H274O0385 (209 gmole) for E85 and C1H189O0016 (1415 gmole) for petrol This thus compensates for the lower response factor for ethanol and acetaldehyde NMHC is obtained by subtracting the concentration of CH4 (times the FID response factor) measured separately
A comparison of emissions from ethanol and petrol fuelled cars IVL report B1962 Health risk assessment for Vaumlstra Goumltaland
14
Table 3 Emission factors (gkm) for 2020 for passenger cars (including evaporative emissions but excluding wear particle emissions) used in the modelling
Petrol E85 NOX 0112 0065 CO 179 174 PM 00013 00008 CH4 0013 0018 NMHC 033 028
division of NMHC Ethanol 00000 01898 Acetaldehyde 00025 00299 Ethene 00244 00237 Ethyne 00094 00011 Formaldehyde 00057 00072 Benzene 00187 00045 13 Butadiene 00030 00009 Ethane 00107 00009 Alkanes C3+ 00928 00076 Alkenes C3+ 00301 00025 Aromatics C7+ 01297 00106 Aldehydesketones C3+ 00051 00004
sum NMHC 03321 02792
32 Emissions
The emissions from road traffic vary between the two scenarios due to the differences in the emission factors From the EMEP modelling the total emissions from road traffic in the different scenarios are calculated for the countries included In Figure 4 emissions of NOX NMVOC and PM in the S2 (E-85) scenario relative to the S1 (all-petrol) scenario are shown for these countries The relative change is larger for countries with a high fraction of petrol cars relative to diesel cars (since the latter are the same in the two scenarios) such as Russia and Ukraine The relative change is smallest for PM emissions due to the very small contribution of the exhaust particles from petrol fuelled cars compared to the contribution from diesel vehicles and wear particles
A comparison of emissions from ethanol and petrol fuelled cars IVL report B1962 Health risk assessment for Vaumlstra Goumltaland
15
Figure 4 National emissions of NOX NMVOC and PM from the road traffic sector in E85 scenario (S2)
relative to lsquoall-petrolrsquo scenario (S1)
An important difference in the emissions between the scenarios lies in the speciation of the NMVOC emissions Figure 5 shows this speciation of NMVOCs for all road traffic emission categories used in this study The two rightmost bars in Figure 5 show the NMVOC speciation for Swedish road traffic emissions for the two scenarios S1 and S2 Comparison with Figure4 shows that the relative changes between the two scenarios are much larger for some individual NMVOC species that for the total NMVOC emissions Since the NMVOC emissions from traffic in Sweden are dominated by the emissions from petrol cars (about 85 of the road traffic emissions of NMVOC comes from petrol cars) the variations in NMVOC speciation between petrol and E85
0
02
04
06
08
1
NOx
0
02
04
06
08
1
NMVOC
0
02
04
06
08
1
Aus
tria
Bel
arus
Bel
gium
Bos
-Her
cB
ulga
riaC
roat
iaC
ypru
sC
zech
Rep
Den
mar
kE
ston
iaFi
nlan
dFr
ance
Ger
man
yG
reec
eH
unga
ryIr
elan
dIt
aly
Lat
via
Lith
uani
aL
uxem
bour
gM
alta
Net
herla
nds
Nor
way
Pola
ndPo
rtug
alR
oman
iaR
ussi
a_E
uro
Slov
ak R
epSl
oven
iaSp
ain
Swed
enSw
itzer
land
Tur
key
Ukr
aine
UK
PM
A comparison of emissions from ethanol and petrol fuelled cars IVL report B1962 Health risk assessment for Vaumlstra Goumltaland
16
will have a significant impact on the total road traffic NMVOC speciation As can be seen in Figure 5 scenario S1 is dominated by alkanes and aromatics while scenario S2 is dominated by ethanol It can also be noted that S1 contains a significant emission of benzene which is much lower in S2 while the opposite is true for acetaldehyde
Figure 5 Distribution of hydrocarbon species in NMVOC emissions from individual road traffic emission
categories as defined in emission scenarios in this study and from the whole road traffic emission sector in Sweden for scenarios S1 (All petrol) and S2 (All E85)
Figure 6 shows a map of the EMEP domain with emissions of acetaldehyde for the two studied scenarios as an example of the geographical distribution of emissions
Figure 6 Gridded emissions of acetaldehyde for the year 2020 (in tonnes per grid cell (50 km x 50 km)
and year) a ndash lsquoAll petrol scenario b ndash lsquoAll E85 scenariorsquo
As mentioned the emissions from road traffic in the Vaumlstra Goumltaland region are calculated in a 500 m x 500 m grid Figure 7 shows the emissions of NOX for 2005 as obtained from the database and the projected emissions for 2020 with a mixed use of E85 and petrol This can be considered as the base case for the emissions in 2020 It can be seen that the emissions decrease over the period which is due to reduction in NOX emissions factors as older vehicles are replaced by newer models (the traffic actually increases from a total of 754x109 vehicle-kilometres in 2005 to 937x109
0
20
40
60
80
100
Pet
rol e
xh
Pet
rol e
vap
E-8
5 ex
h
E-8
5 ev
ap
Pet
rol M
C
Die
sel L
DV
Die
sel H
DV
Roa
d Sw
eden
S1
Roa
d Sw
eden
S2
m
ass
Ethane
Alkanes C3+
Ethene
13 Butadiene
Alkenes C3+
Ethyne
Benzene
Aromatics C7+
Formaldehyde
Acetaldehyde
Aldket C3+
Ethanol
A comparison of emissions from ethanol and petrol fuelled cars IVL report B1962 Health risk assessment for Vaumlstra Goumltaland
17
vehicle-kilometres in 2020) The major roads in the region are clearly visible as well as the larger cities (especially Gothenburg)
Figure 7 Emissions of NOX (kgyear for a 500 m x 500 m grid cell) in the Vaumlstra Goumltaland region for 2005
and for 2020 for the base case
In Table 4 the traffic emissions for NOX benzene acetaldehyde ethanol and PM10 for the Vaumlstra Goumltaland region are shown for the four different emissions scenarios The emissions of NOX and benzene are reduced between 2005 and 2020 for the base case while the emissions of ethanol and acetaldehyde increase due to an expected increase in the use of ethanol fuel The NOX emissions for S1 are somewhat higher than for S2 due to the higher NOX emissions factor for petrol compared with E85
Table 4 Emissions from traffic for the Vaumlstra Goumltaland region in four different emission scenarios (in tonnesyear)
Substance base 2005 base 2020 S1 S2 NOX 13 243 4 843 4 954 4 631 Benzene 2 833 927 1 201 386 Acetaldehyde 628 1 074 305 2 595 Ethanol 192 5 192 0 15 400 PM10 1 324 486 483 476
33 Dispersion modelling
Resulting concentrations from calculations of the S1 and S2 scenarios with the EMEP model are used to provide input of primary and secondary air pollutants for the calculations with the TAPM model for the Vaumlstra Goumltaland region Concentrations of NOX NMVOC PM25 PM10 acetaldehyde ethanol and benzene are therefore calculated as boundary conditions for the Vaumlstra Goumltaland region In addition sensitivity studies are performed to investigate the role of formation of secondary acetaldehyde and secondary particulate matter (see Appendix 2) Time series analysis of the TAPM and EMEP model results of the S1 and S2 scenarios are presented in Figure 8
A comparison of emissions from ethanol and petrol fuelled cars IVL report B1962 Health risk assessment for Vaumlstra Goumltaland
18
a)
b)
Figure 8 Time series analyses of S1 and S2 scenarios for the EMEP and TAPM modelled concentrations of NOX and ozone at an urban background site in Gothenburg (TAPM) and in EMEP model grid cells including Gothenburg city (50 km x 50 km)
Concentrations of NOX and ozone at an urban background site in Gothenburg (TAPM) and in the 50 km x 50 km EMEP grid cells including Gothenburg are compared for one summer and one winter month Due to the well-known process of ozone titration by freshly emitted nitrogen monoxide (Seinfeld and Pandis 1998) the concentration of ozone often decreases in urban areas This phenomenon is expected to be captured by the fine-gridded TAPM model but not necessarily by the courser scale of the EMEP model Figure 8 shows the generally higher NOX levels in the small grid cell of the TAPM model in urban background location comparing to those in the large EMEP grid cell while the opposite is observed for the ozone concentrations (Remember that the boundary concentrations for TAPM are obtained from the EMEP model and they are thus the same in both cases) This indeed shows that local scale emissions and processes contribute to locally increased levels of NOX in urban areas both for the summer and the winter cases For ozone where there of course are no primary emissions the situation is the opposite where instead the result is decreased concentration levels at urban sites on a local scale The influence of the
A comparison of emissions from ethanol and petrol fuelled cars IVL report B1962 Health risk assessment for Vaumlstra Goumltaland
19
NMHC emissions from the passenger cars is studied in a sensitivity analysis (see Appendix 23) and it is found to have only a small influence on the ozone levels
To illustrate the results of the different scenario calculations the geographically distributed concentrations are presented as the difference in yearly average concentrations between the all E85 (S2) and all petrol (S1) scenarios both as microgm3 and sometimes as percentage of the difference to scenario S1 (see Appendix 3)
The difference in yearly average concentrations between scenario S1 and S2 for acetaldehyde and benzene can be seen in Figures 9 and 10 respectively The increase in acetaldehyde concentration resulting from a switch from petrol to E85 is up to about 05 gm3 or 80 in the central parts of the largest urban area of the region Gothenburg Outside this area the relative increase is about 10 for the other urban areas and less than that for the rural areas This large relative increase (see map in Appendix 4) is a result of the relatively high emissions of acetaldehyde from E85 fuelled cars For benzene the situation is opposite In the scenarios for 2020 the concentration of benzene decreases by up to a few tenths of gm3 as a result of a switch from petrol to E85 For benzene the relative change is not calculated
Figure 9 The difference in yearly average concentrations of acetaldehyde for 2020 between the all E85 (S2) and all petrol (S1) scenarios (microgm3)
A comparison of emissions from ethanol and petrol fuelled cars IVL report B1962 Health risk assessment for Vaumlstra Goumltaland
20
Figure 10 The difference in yearly average concentrations (gm3) of benzene for 2020 between the all E85 (S2) and all petrol (S1) scenarios
The difference in the calculated NOX NO2 and ozone concentrations between the two scenarios are shown in Appendix 4 The change in NOX concentration between the two scenarios only represents a small fraction of the total NOX concentration This is because the emissions of NOX from petrol cars are relatively low compared with the contribution from diesel engines and other sources Thus the resulting decrease in the NOX concentration with E85 is only up to 3 For ozone there is a small increase of about 01 microgm3 of E85 in the central areas of Gothenburg where there is relatively high traffic intensity (see Appendix 4 Figure A9) In the rest of the region there is a small decrease in the ozone concentration in the E85 scenario
34 Exposure
The resulting concentrations from the dispersion modelling together with the population density distribution are used to assess the exposure to acetaldehyde benzene NO2 NOX and ozone for the two scenarios S1 and S2 The exposure to PM25 is very similar for the two scenarios (the difference in concentration between scenarios S2 and S1 is only about -002 gm3 Table 5 shows the population weighted mean exposure both as total concentrations and as the difference between the two scenarios Detailed exposure results can be found in Appendix 5 It can be seen that the exposure to all the pollutants in Table 5 with the exception of acetaldehyde are somewhat lower for the all E85 scenario (S2) than for the all petrol scenario (S1) However the effect on health also
A comparison of emissions from ethanol and petrol fuelled cars IVL report B1962 Health risk assessment for Vaumlstra Goumltaland
21
depends on the level of the dose-response functions For example if the level of concentration is low in a populated area but the dose-response function is high the effect of even a low concentration increase can become important The increase in exposure from S1 to S2 (S2-S1) calculated as percentage of the population exposed to increased mean concentrations of pollutants is presented in Figure 11
Table 5 Populated weighted mean exposure (gm3)
S1 S2 S2-S1 Acetaldehyde 065 077 014 Benzene 01 005 -007 NOX 85 84 -012 Ozone 570 569 -012 PM25 270 268 -002
Increased concentrations Decreased concentrations Both increased and
decreased conc
Figure 11 The relative exposure (S2-S1) calculated as percentage of the population
In Figure 11 it is clear that the only pollutant that does not show an improvement regarding air quality and thus the health risks when modelling a switch from petrol to E85 is acetaldehyde For all pollutants except for ozone the changes of concentration levels observed between the scenarios are within the urban areas but for ozone there are also differences in rural areas
According to the data in Figure 11 about 14 of the population in the Vaumlstra Goumltaland region will be exposed to 03-08 microgm3 higher concentration levels of acetaldehyde in scenario S2 relative to S1 From Figure 9 it can be seen that the majority of these people live within the Gothenburg area Further about 28 of the population will be exposed to increased levels of between 01 to 03 microgm3 mainly in the suburban areas and rural surroundings of Gothenburg but also in some of the smaller cities in the region Outside the urban areas the concentration difference is lower than 01 microgm3
In the S2 scenario relative to the S1 scenario the population is exposed to decreased concentration levels of benzene and NOX This is mainly true also for O3 but with an exception for the central
A comparison of emissions from ethanol and petrol fuelled cars IVL report B1962 Health risk assessment for Vaumlstra Goumltaland
22
parts of Gothenburg where the concentration actually increases (see Appendix 4 Figure 7A) resulting in that 3 (blue area in Figure 11 for O3) of the population will be exposed to higher concentrations of O3 For the rest of the area there are decreased concentrations of ozone upon a switch to E85
The largest differences are again in the central parts of Gothenburg where about 20 of the population is being exposed to a lower benzene concentration of 01-03 microgm3 This also means that concerning benzene the majority (78) of the population have none or very low influence from a change to ethanol fuel
The largest effect on exposure difference is seen for NOX where just over 20 of the population has its exposure decreased with 03-05 microgm3 (in the central parts of Gothenburg) In the suburbs the decrease is between 01-02 microgm3 lower Along the largest roads there is a small but visible improvement on a yearly basis of 01 microgm3
For PM25 there is a difference in the populated weighted mean exposure of 002 gm3 between the scenarios with a lower value for the all-E85 case (see also Appendix 5)
35 Impact on health in Vaumlstra Goumltaland
351 NO2 and NOX
The impact of long-term exposure on mortality was estimated using the relative risk from the Norwegian cohort study (Nafstad et al 2004) reporting a relative risk of 08 increase per microgm3 increase in NOX however without adjustment for particle concentrations Assuming this effect on the total mortality and a typical baseline mortality of 1000 deaths per 100 000 person years a decrease in the population mean exposure of 012 microgm3 would correspond to approximately 104 less preterm deaths per year However for the present case this number is highly uncertain since the exposure to substances normally associated with changes in NOX exposure may here change in different ways since the relation between different exhaust components varies between the scenarios
The impact of long-term exposure on asthma incidence (new cases) in adults has been estimated using results from the Swedish RHINE Study Cohorts (Modig et al 2009) with very similar results in the ECRHS Study corresponding to approx 4 increase per microgm3 increase in NO2 From the RHINE Study the incidence can be estimated to 03 per year (proportion of adults developing the disease) with children and elderly excluded this means around 1500 adult cases per year A reduction of 009 microgm3 corresponds to 54 avoided new cases of adult asthma per year However also NO2 in the asthma study may have been mainly an indicator of vehicle exhaust
352 Ozone
The impact of long-term exposure on respiratory mortality has been reported to be approx 02 per microgm3 increase in the summer concentration when studied in the large ACS Cohort (Jerret et al 2009) Assuming this effect on the total population and a typical baseline respiratory mortality of 100 deaths per 100 000 person years a decrease in the population mean exposure of 012 microgm3 corresponds to approximately 03 less preterm deaths per year
A comparison of emissions from ethanol and petrol fuelled cars IVL report B1962 Health risk assessment for Vaumlstra Goumltaland
23
353 Acetaldehyde
According to US EPA (1999) a lifetime risk for cancer of 0000002 per microgm3 is to be assumed for this potential human carcinogen An increase in the population mean exposure of 012 microgm3 corresponds to 026 cases more per year in the current population
354 Benzene
According to US EPA (1999) a lifetime risk for cancer (leukaemia) of 00000022-00000078 per microgm3 is to be assumed for this human carcinogen A decrease in the population mean exposure of 0074 microgm3 corresponds to approximately 03 cases less per year in the current population (assuming 0000004 per microgm3)
355 PM25
In CAFEacute and other impact assessments a relative risk of 6 increase in all-cause mortality per 10 microgm3 has usually been assumed Assuming this effect on the total mortality and a typical baseline mortality of 1000 deaths per 100 000 person years a decrease in the population mean exposure of 002 microgm3 corresponds to approximately 13 less preterm deaths per year
4 Discussion
In this study the health risks from a large introduction of E85 to replace petrol is analysed in scenario studies for 2020 for the Vaumlstra Goumltaland region It is found that the change in pollutant concentration exposure and health risks are small between the two scenarios It should be emphasized that the study only considers vehicle emissions and does not take into account effects from the fuel production
The emissions of NOX in the model are somewhat lower from E85 fuelled cars than from petrol fuelled cars This is in line with the emission factors used by Jacobson (2007) The nitrogen oxides are key substances in the atmospheric reactions determining the concentrations of ozone in air NOX is involved in the formation of ozone but close to the NO source the ozone concentration is lowered due to the rapid reactions between NO and O3 forming NO2 If NO is released in an environment with already high NO concentration it may result in lowering of ozone levels on the regional scale In the present study the ozone concentrations calculated are somewhat lower for the E85 scenario than for the petrol scenario
The health risk analysis shows that the main difference between the scenarios is due to the lower concentration of NOX However it may have been other exhaust components than NOX such as exhaust particles that were behind the reported association with mortality In cases when NOX is not a good indicator of exhaust particle emissions and their toxicity our results may be misleading This should be studied further Neglecting the effects of the changes in NOX exposure the total difference between the scenarios sums up to 16 preterm deaths per year with lower values for the E85 scenario while it would sum up to 12 less preterm deaths for the E85 scenario if the effect related to NOX were included Since there are no similar studier for the effect on mortality among those younger than 30-50 years of age we assume the same relative effect on mortality in all ages This makes only a small difference since the large majority of deaths occur in older groups
A comparison of emissions from ethanol and petrol fuelled cars IVL report B1962 Health risk assessment for Vaumlstra Goumltaland
24
The opposite result for the ozone concentration was obtained by Jacobson The reason for this discrepancy is that the Jacobson study concerns Los Angeles a region with high concentrations of pollutants while the study here concerns the Vaumlstra Goumltaland region with much less dense traffic and also lower concentrations of pollutants importantly NOX It is not unlikely that the effect that Jacobson report also would be found for large parts of Europe with higher traffic densities than in the Vaumlstra Goumltaland region
It is worth to emphasize that the major negative health effect in the Jacobson (2007) study is attributed to the increase in ozone concentration that is a result of the decrease of the NO emissions from E85 cars Directly after the emission NO reacts with ozone resulting in drop of the ozone concentration the so-called ozone titration commonly observed in many cities This NO does however form even higher quantities of ozone further downwind contributing to the general increase in the background ozone levels It is also precursor of NO2 secondary PM and other toxic species as eg PAN and hence reductions in NO emissions are never regarded as disbeneficial from the environmental viewpoint
There are of course several sources of uncertainties that influence the results of this study Since the main results concern differences between the two scenarios several of these factors loose on importance for the conclusions This comprises uncertainties in meteorology in future traffic volumes and in the population density distribution However there are some uncertainties that remain important The emission factors for E85 fuelled cars are much less characterised than what they are for petrol cars The emission of particles from E85 fuelled cars is especially uncertain with only very few published results Also the emissions of NMHC are somewhat uncertain and may be higher for E85 at lower ambient temperatures However the sensitivity analysis performed shows that for the studied region the NMHC emissions only have a small influence on the ozone concentrations
5 Conclusions
In this study the impact of tailpipe and evaporative emissions from E85 fuelled cars on air pollution and health risks are calculated and compared with petrol fuelled cars The scenario calculations for the Vaumlstra Goumltaland Region give data on emissions pollutant concentrations exposure and a health risk evaluation
The differences in emission factors between E85 and petrol lies in the emissions of PM and NOX which are about 65 and 58 for E85 relative petrol respectively Also the speciation of the emitted hydrocarbons is significantly different with large emissions of acetaldehyde and ethanol from E85 and large emissions of benzene higher aromatics alkanes and alkenes from petrol
These differences in emission factors reflect in differences in emissions The emission calculations for all Swedish road traffic show a decrease for the E85 scenario relative to the petrol scenario of 65 for NOX 34 for PM25 67 for benzene For acetaldehyde there is an increase of 770
The differences obtained from the TAPM modelling show decreased levels of NOX ozone and benzene with E85 and increased levels of acetaldehyde For the latter the increase may be up to 80 while NOX and ozone show decreases of up to a few per cent and a few tenths of per cent respectively
A comparison of emissions from ethanol and petrol fuelled cars IVL report B1962 Health risk assessment for Vaumlstra Goumltaland
25
The health risk assessment shows decreased health risks in the E85 scenario relative the all-petrol scenario due to the increased NOX exposure correlated with both preterm deaths and asthma However NOX may be mainly an exhaust indicator Smaller effects are expected from the changes in ozone acetaldehyde and benzene exposure The overall difference considering the exposure to PM acetaldehyde benzene and ozone is 16 preterm deaths with lower values for the E85 scenario
6 Acknowledgements
Saab Automobile The Swedish Transport Administration and The Foundation for the Swedish Environmental Research Institute are gratefully acknowledged for financial contribution
Magnus Ekstroumlm and Maria Holmstroumlm at Saab and Martin Juneholm at the Swedish Transport Administration are acknowledged for their most valuable input to the study
David Simpson Norwegian Meteorological Institute EMEP MSC-W Norway and Dept Radio amp Space Science Chalmers Univ Technol Sweden is gratefully acknowledged for help with implementation of the Unified EMEP model
A comparison of emissions from ethanol and petrol fuelled cars IVL report B1962 Health risk assessment for Vaumlstra Goumltaland
26
7 References
Altenstedt J Pleijel K 2000 An alternative approach to photochemical ozone creation potentials under European conditions J Air amp Waste Manage Assoc 50 1023 ndash 1036
Andre J-M (2005) Vehicle emission measurement collection of the ARTEMIS datatbase Artemis 3312 report Available from httpwwwinretsfrurltepublicationspublications-pdfJoumardA3312reportJMALTE0504pdf
Bachand A MMundt K A Mundt D JMontgomery R R Epidemiological studies of formaldehyde exposure and risk of leukemia and nasopharyngeal cancer A meta-analysis Critical Reviews in Toxicology 2010 40(2) 85ndash100
Beane Freeman L E Blair A Lubin J H Stewart P A Hayes R B Hoover R N Hauptmann M Mortality from lymphohematopoietic malignancies among workers in formaldehyde industries The National Cancer Institute Cohort J Natl Cancer Inst 2009101751ndash761
Bosetti C McLaughlin J K Tarone R E Pira E LaVecchia C Formaldehyde and cancer risk A quantitative review of cohort studies through 2006 Ann Oncol 20081929ndash43
ConcaweJRC Well-to-wheel studies httpiesjrceceuropaeuwtwhtml
Derwent R G Jenkin M E Saunders S M 1996 Photchemical ozone creation potentials for a large number of reactive hydrocarbons under European conditions Atmos Environ 30 181 ndash 199
Derwent RG Jenkin ME Passant NR Pilling MJ 2007 Photochemical ozone creation potentials (POCPs) for different emission sources of organic compounds under European conditions estimated with a Master Chemical Mechanism Atmos Env 41 2570ndash2579
EEA Copenhagen 2009 wwweeaeuropaeudata-and-mapsdatapopulation-density-disaggregated-with-corine-land-cover-2000-2
Ericsson P Holmstroumlm M Amberntsson-Carlsson A Ohlson C Skoglundh M Andersson B Carlsson P-A 2008 Characterization of particulate emissions and methodologhy for oxidation of particulates from non-diesel combustion ystems SAE Technical Paper Series 2008-01-1746
GAINS 2010 httpgainsiiasaacatindexphpgains-europe
Graham LA Belisle SL Baas C-L Emissions from light duty gasoline vehicles operating on low blend ethanol gasoline and E85 Atmospheric Environment 42 4498 (2008)
Haskew H M Thomas P E Liberty F 2006 Fuel Permeation From Automotive Systems E0 E6 E10 E20 And E85 Final Report CRC Project No E-65-3 Coordinating Research Council Inc 3650 Mansell RoadSuite 140Alpharetta GA 30022
HEI Air Toxics Review Panel (2007) Mobile-Source Air Toxics A Critical Review of the Literature on Exposure and Health Effects HEI Special Report 16 Health Effects Institute Boston USA
Hurley P TAPM v 4 User Manual 2008 CSIRO ISBN 978-1-921424-73-1
IARC (2006) IARC Monographs on the Evaluation of Carcinogenic Risks to Humans Wood Dusts and Formaldehyde Lyon World Health Organization International Agency for Research on Cancer Lyon France 8837ndash325
Jacobson M Z Effects of Ethanol (E85) versus Gasoline Vehicles on Cancer and Mortality in the United States Environ Sci Technol 2007414150-4157
A comparison of emissions from ethanol and petrol fuelled cars IVL report B1962 Health risk assessment for Vaumlstra Goumltaland
27
Jerret M Burnett R T Pope C A Ito K Thurston G Krewski D Shi Y Calle E Thun M Long-Term Ozone Exposure and Mortality N Engl J Med 20093601085-95
Lipman T E Delucchi M A 2002 Emissions of nitrous oxide and methane from conventional and alternative fuel motor vehicles Climate Change 53 477
Modig L Toreacuten K Janson C Jarvholm B Forsberg B Vehicle exhaust outside the home and onset of asthma among adults Eur Respir J 2009 Jun33(6)1261-7
Nafstad P Haheim L L Wisloff T Gram F Oftedal B Holme I Hjermann I Leren P Urban air pollution and mortality in a cohort of Norwegian men Environ Health Perspect 2004112(5)610-5
OEHHA (1999) Air Toxics Hot Spots Program Risk Assessment Guidelines Part II Technical Support Document for Describing Available Cancer Potency Factors Prepared by the Air Toxicology and Epidemiology Section Office of Environmental Health Hazard Assessment April 1999
Passant NR (2002) Speciation of UK emissions of non-methane volatile organic compounds AEAT report AEATENVR0545 Issue 1 Culham UK
Pope CA III Thun MJ Namboodiri MM Dockery DW Evans JS Speizer FE Heath CJ Particulate air pollution as a predictor of mortality in a prospective study of US adults Am J Resp Crit Care Med 1995 151 669-674
Seinfeld J H and Pandis SN (1998) Atmospheric Chemistry and Physics From Air Pollution to Climate Change John Wiley amp Sons New YorkSimpson D Fagerli H Jonson JE Tsyro S Wind P Tuovinen J -P 2003 Transboundary acidification and eutrophication and ground level ozone in Europe Unified EMEP Model Description EMEP Status Report 12003 Part I EMEPMSC-W Report The Norwegian Meteorological Institute Oslo Norway
US EPA (1999) httpwwwepagovttnatwnata1999nsata1999
Vestreng V et al 2004 Inventory Review 2004 Emission data reported to CLRTAP and the NEC Directive EMEPEEA Joint Review Report EMEPMSC-W Note 1
Westerholm R Ahlvik P Karlsson HL An exhaust characterisation study based on regulated and unregulated emissions from bi-fuel and flexi-fuel light-duty passanger cars fuelled by petrol (E5) bioethanol (E70 E75) and biogas tested at ambient temperatures of +22degC and -7degC 2008
Wolkoff P Nielsen G D Non-cancer effects of formaldehyde and relevance for setting an indoor air guideline Environment International 201036788ndash799
Yanowitz J McCormick RL Effect of E85 on tailpipe emissions from light-duty vehicles J Air amp Waste Manage Assoc 59 172 (2009)
A comparison of emissions from ethanol and petrol fuelled cars IVL report B1962 Health risk assessment for Vaumlstra Goumltaland
28
Appendix 1 Evaporate emissions of NMHC
The following assumptions are done for evaporative emissions The NMHC emissions from E85 are reduced relative to petrol by 45 Methane emissions are zero and the split of NMHC species is 68 ethanol and the remaining 32 is divided in the same way as evaporative emissions for petrol The estimates by Graham et al (2008) are missing evaporative emission data however these assumptions agrees very well with measurements of evaporative emissions due to fuel permeation reported by Haskew et al (2006) where NMHC emissions are reported to be reduced by 50 for E85 fuel compared to petrol Haskew et al also presents the NMHC split to species with 60 ethanol This number agrees quite well with our assumption of 68 NMHC being ethanol NMHC in exhaust and evaporative emissions are thus divided as in Table A1
Table A1 Division of NMHC in the exhaust and evaporative emissions for E85 and petrol respectively (wt)
E85 Petrol E85 Petrol exhaust exhaust evaporative evaporative
Ethanol 680 0 680 0 Acetaldehyde 131 08 02 0 Ethene 99 73 24 0 Ethyne 03 28 09 0 Formaldehyde 31 17 06 0 Benzene 16 56 18 10 13 Butadiene 03 09 03 0 sum 963 191 741 10
The remaining NMHC emissions are divided as for petrol (ref) and listed in Table A2
Table A2 Division of NMHC in the exhaust and evaporative emissions for E85 and petrol respectively (wt)
E85 Petrol E85 Petrol exhaust exhaust evaporative evaporative
Ethane 02 32 10 0 Alkanes (C3+) 13 278 89 880 Alkenes (C3+) 04 90 29 95 Aromatics (C7+) 18 388 125 15 Aldehydesketones (C3+)
01 15 05 0
A comparison of emissions from ethanol and petrol fuelled cars IVL report B1962 Health risk assessment for Vaumlstra Goumltaland
29
Appendix 2 Description of the model system
A21 Atmospheric lifetimes
Table A3 gives tropospheric lifetimes with regard to reaction of ethanol formaldehyde acetaldehyde and benzene (C6H6) with OH nitrate radical (NO3) and photolysis The studied organic species are listed together with three species common in the gasoline exhaust (benzene ethene and toluene) for comparison Table 11 shows also photochemical ozone creation potential (POCP) of these species POCP is a measure of amount of ozone that is formed from a certain VOC emission relatively to other emission source which has been established to the same emission mass of ethene (Derwent et al 1996 Altenstedt et al 2000) The range represents different scenarios for VOC and NOX background concentrations Derwent et al (2007) used similar methodology to calculate POCP of different VOC sources and calculated POCP of mean road emission exhaust to be 69
Table A3 Atmospheric lifetimes of studies NMVOC species with respect to the OH- and NO3- initiated
degradation τ(OH) and τ(NO3) and with respect to the photolysis (The lifetime of a chemical species which decays in a first-order process is the time needed for a concentration of this species to decrease to 1e of its original value Statistically it represents the mean life expectancy of an excited species) The OH concentration of 1times106 moleculescm3 typical for summer troposphere was used for the lifetime calculation The NO3 concentrations of 5 and 100 ppt(V) were used for lifetime calculations as representative of rural and urban night-time 12 hrs mean concentration The studied organic species are listed together with 3 species common in the gasoline exhaust for comparison The rates of photolysis were calculated with radiation transfer model for July 58ordm latitude and integrated over 24 hours
τ(OH) τ(NO3) urbanrural τ (photolysis) POCP
hr hr hr
Ethanol 85 56 1times103 - 44 - 63
Acetaldehyde 15 47 1times103 86 68 - 80
Formaldehyde 30 194 4times103 10 18 - 55
Benzene 214 - - 23 - 47
Ethene 34 - - 100
Toluene 50 - - 30 - 67
A22 Defining of boundary concentrations for TAPM from EMEP fields
Calculation of initial concentration field for TAPM from EMEP concentration field of NO2 (as example) and EMEP mean wind vector components u_mid and v_mid Two EMEP model gridcells (i=56 j=60 and i=56 j=61) represent the TAPM model domain and concentrations from the surrounding EMEP gridcells SE-S SE-N NW-S NW-N NE NW (Figure A1) are used for calculation of boundary concentration NO2(bc) according to the following code if u_mid lt= 0 then ( isite = SE-S and jsite = SE-N) else isite = NW-S and jsite = NW-N) endif
A comparison of emissions from ethanol and petrol fuelled cars IVL report B1962 Health risk assessment for Vaumlstra Goumltaland
30
if v_mid lt= 0 then ( ksite = NE) else ksite = SW endif NO2(bc) = [(NO2(isite)u_mid(isite) + NO2(jsite)u_mid(jsite))2 + NO2(ksite)v_mid(ksite)] [(u_mid(isite) + u_mid(jsite))2 + v_mid(ksite)]
Figure A1 Gridcells covering Gothenburg domain and its boundary in EMEP model plotted on latitude-
longitude coordinates The red square represents centre of Gothenburg and the blue line the coastline EMEP i and j coordinates for the boundary gridcells are SE-S = 57-60 SE-N = 57-61 NW-S = 55-60 NW-N = 55-61 NE = 56-62 NW = 56-59 and for Gothenburg grid cells are Gbg-NE = 56-61 Gbg-SW = 56-60
A23 Atmospheric chemistry
The role of secondary chemistry in for the concentration of acetaldehyde are studied by first excluding the primary acetaldehyde emissions from the EMEP model simulations of scenarios S1 and S2 and then by excluding all NMVOC emissions from the car category with spark ignition engines The contribution from the primary acetaldehyde emissions as well as the contribution of secondary acetaldehyde formed from other NMVOC to the total acetaldehyde concentration is then obtained However the secondary chemistry is highly nonlinear due to the interactions of NMVOCs with ozone and OH and thus the results for the contribution of secondary acetaldehyde are somewhat uncertain Differences in acetaldehyde concentrations between S1 and S2 scenarios are studied with respect to contribution of primary and secondary acetaldehyde It is observed that in summer background air the monthly mean contribution of the secondary acetaldehyde is of the same magnitude as the contribution of the primary acetaldehyde to the difference between S1 and
565
57
575
58
585
105 115 125 135 145
Long
Lat
Gbg-SW
Gbg-NE
SE-S
NW-N
NW-S
SE-N
SW
NE
55-59
57-59
55-62
A comparison of emissions from ethanol and petrol fuelled cars IVL report B1962 Health risk assessment for Vaumlstra Goumltaland
31
S2 In the winter and in more polluted atmosphere (Gothenburg grid cells) the contribution from secondary acetaldehyde to the concentration difference appears to be negative due to the chemistry feedback ie the E-85 scenario has less secondary acetaldehyde than the all-petrol scenario
A comparison of S2-S1 differences in primary and secondary acetaldehyde concentrations in the background (=upwind) and Gothenburg grid cells show no increase in the secondary acetaldehyde from upwind to the Gothenburg grid cell It can thus be concluded that there is no significant contribution from secondary aldehydes on the small scale (tenths of km) Conclusion from this sensitivity study is that the secondary formaldehyde can be of importance under summer in the clean background air but that formation on the local scale is unimportant Using EMEP simulated boundary concentrations of acetaldehyde in the local scale model and simulating the primary acetaldehyde emissions will capture the most important features of acetaldehyde dispersion and chemistry in Vaumlstra Goumltaland
In the EMEP model the tail-pipe PM emissions are specified as primary particles Emissions of NOX and VOCs (and NH3 SO2) are oxidised in the atmosphere and a part is then transferred through the gas-to-particle transport to the PM as secondary PM The petrol fuelled cars emit both more primary PM and more NOX compared to the E85 cars If we compare differences in primary and secondary PM between the S1 and S2 scenarios simulated by EMEP we can directly see what part of the difference is from the tail-pipe emissions of the primary particles and what part is from the formation of the secondary PM in atmosphere (mostly from higher emissions of NOX) Table A4 shows the differences between S1 and S2 (S1-S2) of monthly PM averages for January and June (two months with low and high photochemical activities respectively) It can be seen that the higher formation of secondary PM in the S1 (all-petrol) scenario is more important than the higher tail-pipe emission of primary PM by factor 10 - 20
When we compare simulated PM differences between S1-S2 for the background air (=upwind) grid cells and for grid cells including Gothenburg (50 km x 50 km scale) we can see significant increase in primary PM in the S1 scenario from the upwind grid cells to Gothenburg (746 in winter 132 in summer) while no systematic increase can be seen for the secondary PM (-42 in winter +24 in summer) From this comparison it can be concluded that no systematic increase in secondary PM can be seen (in difference from the primary PM) on the scale of 50-100 km and we can neglect this process on the small scale However the overall change in PM concentrations due to the switch of the fuel is very small both on the large scale and on the small scale as can be seen when the differences in PM concentrations between S1 and S2 are compared to absolute PM concentrations in S1 presented in the last column of Table A4
Table A4 Differences in primary and secondary PM concentrations between the lsquoAll-petrolrsquo (S1) and lsquoE-85rsquo (S2) scenarios simulated in gridcells upwind Gothenburg and in gridcells including Gothenburg (2 50 km x 50 km gridcells)
S1-S2 Background
S1-S2 Gothenburg
Increase S1-S2 Gothenburg
S1 Background
μgm3 μgm3 μgm3 bkgnd μgm3
Prim PM10 Jan 00008 00014 00006 746 084
Jun 00008 00018 00010 1319 084
Sec PM10 Jan 00155 00148 -00006
-42 157
Jun 00080 00081 00002 24 213
The sensitivity of the used emission factors for NMHC with respect to the ozone formation in the region of the Swedish West Coast can be analysed with the help of results from studying the
A comparison of emissions from ethanol and petrol fuelled cars IVL report B1962 Health risk assessment for Vaumlstra Goumltaland
32
formation of secondary acetaldehyde In this study first all primary acetaldehyde emitted by the E85 fleet are omitted in a model simulation (S2_nopAA) and secondly all NMHC emissions from the E-85 fleet are switched off (S2_noVOC) Acetaldehyde has a somewhat higher though still comparable photochemical ozone creation potential compared to ethanol (ethanol 44-63 acetaldehyde 68-80 Altenstedt and Pleijel 2000) and this simulation will thus also give information on the sensitivity of the calculations to uncertainties in the ethanol emissions Setting the emission factor for NMHC to zero gives the sensitivity to the emission factor of total NMHC Figure A2 shows the differences in ozone concentration as a result of acetaldehyde only and the total NMHC from the E85 car fleet (S2 scenario) We can see that the effect on ozone formation is very small for the Swedish West coast The reason is that the ozone formation in this area is controlled by the availability of NOX while NMHC or rather their degradation products the peroxy radicals that serve as a lsquofuelrsquo to ozone formation are usually in excess here and further VOC emissions do not increase ozone concentrations significantly The situation looks different in areas that are more heavily polluted with NOX andor which is limited in the availability of peroxy radicals The results from this sensitivity study are fully consistent with the observed increase in ozone concentrations as a result of lower NO emissions (the so-called ozone titration) only very close to the major roads but no larger-scale decrease in ozone concentrations in the Gothenburg area or in any other communities
Figure A2 Sensitivity of the ozone formation in the 2 EMEP model grid cells covering Gothenburg (blue) and in the 6 surrounding grid cells (red see Fig A1) to changes in NMHC emission factor of the E85 fuelled cars lsquobasersquo is simulation S2 with EF for NMHC as in Table 3 lsquonoVOCrsquo is S2 with EF for all NMHC = 0 lsquonopAArsquo is S2 with EF for acetaldehyde = 0 a ndash Mean sensitivity in January absolute difference in ozone formation in ppb(V) as a result of NMHC (base-noVOC) and acetaldehyde (base-nopAA) emissions b ndash Sensitivity relative to ozone concentration in the S2-base simulation January c ndash same as a) but June d ndash same as b) but June
‐002
‐001
0
001
base‐noVOC base‐nopAA
ΔO3(ppb)
a)
0
001
002
base‐noVOC base‐nopAA
ΔO
3(ppb)
c)
‐010
‐005
000
005
base‐noVOC base‐nopAA
ΔO
3
b)
000
002
004
006
base‐noVOC base‐nopAA
ΔO
3
d)
A comparison of emissions from ethanol and petrol fuelled cars IVL report B1962 Health risk assessment for Vaumlstra Goumltaland
33
Appendix 3 Emission results
The geographically distributed NOX and acetaldehyde emissions for the Vaumlstra Goumltaland region are presented in Figures A3 and A4 respectively
Figure A3 NOX emissions for the Vaumlstra Goumltaland region for the All Petrol scenario
A comparison of emissions from ethanol and petrol fuelled cars IVL report B1962 Health risk assessment for Vaumlstra Goumltaland
34
Figure A4 Acetaldehyde emissions for the Vaumlstra Goumltaland region for the All Ethanol scenario
A comparison of emissions from ethanol and petrol fuelled cars IVL report B1962 Health risk assessment for Vaumlstra Goumltaland
35
Appendix 4 Dispersion modelling results
The difference in yearly average concentration between scenario S1 and S2 for acetaldehyde and benzene can be seen in Figure A5 and Figure A6 respectively a)
b)
Figure A5 The difference in yearly average concentrations of acetaldehyde for 2020 between the all E85 (S2) and all petrol (S1) scenarios presented as a) microgm3 and as b) percentage for the Gothenburg area
A comparison of emissions from ethanol and petrol fuelled cars IVL report B1962 Health risk assessment for Vaumlstra Goumltaland
36
a)
b) all E85 c) all petrol
Figure A6 a) the difference in yearly average concentrations (gm3) of benzene for 2020 between the all E85 (S2) and all petrol (S1) scenarios yearly means for b) all E85 and c) all petrol (note the different scales)
The difference in the calculated NOX NO2 and ozone concentrations between the two scenarios are shown in Figures A7 A8 and A9
A comparison of emissions from ethanol and petrol fuelled cars IVL report B1962 Health risk assessment for Vaumlstra Goumltaland
37
a)
b)
Figure A7 The difference in yearly average concentrations of NOX for 2020 between the all E85 (S2) and all petrol (S1) scenarios presented as a) microgm3 and as b) percentage for the Gothenburg area
A comparison of emissions from ethanol and petrol fuelled cars IVL report B1962 Health risk assessment for Vaumlstra Goumltaland
38
a)
Figure A8 The difference in yearly average concentrations of NO2 for 2020 between the all E85 (S2) and all petrol (S1) scenarios presented as a) microgm3 and as b) percentage for the Gothenburg area
A comparison of emissions from ethanol and petrol fuelled cars IVL report B1962 Health risk assessment for Vaumlstra Goumltaland
39
a)
b)
Figure A9 The difference in yearly average concentrations of ozone for 2020 between the all E85 (S2) and all petrol (S1) scenarios presented as a) microgm3 and as b) percentage for mainly the Gothenburg area
A comparison of emissions from ethanol and petrol fuelled cars IVL report B1962 Health risk assessment for Vaumlstra Goumltaland
40
Appendix 5 Detailed Exposure data
Detailed exposure data for the difference between the all E85 (S2) and the all petrol (S1) scenarios can be found in Table A5
Table A5 Exposure data for the difference between the all E85 (S2) and the all petrol (S1) scenarios
Acetaldehyde diff E-P (microgm3)
Populated weighted mean
Number of people Percentage of population
0 - 01 627198 582 01 - 02 163394 152 02 - 03 134879 125 03 - 04 88099 82 04 - 05 38686 36 05 - 06 16880 16 06 - 07 7983 07 07 - 08 1248 01 Tot 014 1078367 Benzene diff E-P (microgm3)
Populated weighted mean
Number of people Percentage of population
-03 - -02 26680 25 -02 - -01 205757 191 -01 - -0 845930 784 Tot -0074 1078367 NO2 diff E-P (microgm3) Populated weighted
mean Number of people Percentage of
population -04 - -03 7698 07 -03 - -02 50131 46 -02 - -01 296288 275 -01 - -0 724250 672 Tot -009 1078367 NOX diff E-P (microgm3) Populated weighted
mean Number of people Percentage of
population -06 - -05 7698 -05 - -04 19639 18 -04 - -03 36626 34 -03 - -02 161685 150 -02 - -01 186500 173 -01 - -0 666219 618 Tot -012 1078367 O3 diff E-P (microgm3) Populated weighted
mean Number of people Percentage of
population -02 - -01 779132 723 -01 - -0 266417 247 0 - 01 32818 30 Tot -012 1078367
Exposure data for the total levels in the two scenarios can be found in Table A6
A comparison of emissions from ethanol and petrol fuelled cars IVL report B1962 Health risk assessment for Vaumlstra Goumltaland
41
Table A6 Exposure data for the total levels in the two scenarios
Acetaldehyde tot All ethanol (microgm3)
Populated weighted mean
Number of people Percentage of population
06 - 07 568825 527 07 - 08 171845 159 08 - 09 124551 115 09 - 10 100946 94 10 - 11 59235 55 11 - 12 30559 28 12 - 13 13175 12 13 - 14 7983 07 14 - 15 1248 01 Tot 077 1078367 Acetaldehyde tot All petrol (microgm3)
Populated weighted mean
Number of people Percentage of population
05 - 06 45111 42 06 - 07 1032008 957 07 - 08 1248 01 Tot 065 1078367 Benzene tot All ethanol (microgm3)
Populated weighted mean
Number of people Percentage of population
0 - 01 1055961 98 01 - 02 22406 2 Tot 005 1078367 Benzene tot All petrol (microgm3)
Populated weighted mean
Number of people Percentage of population
0 - 01 729093 676 01 - 02 232961 216 02 - 03 94042 87 03 - 04 21023 19 04 - 05 1248 01 Tot 010 1078367 NOX tot All ethanol (microgm3)
Populated weighted mean
Number of people Percentage of population
0-10 779108 722 10-20 254658 236 20-30 28683 27 30-40 11070 10 40-50 3426 03 50-60 0 00 60-70 0 00 70-80 639 01 80-90 0 00 90-100 0 00 100-110 783 01 Tot 84 1078367 NOX tot All petrol (microgm3)
Populated weighted mean
Number of people Percentage of population
0-10 769557 714 10-20 264209 245 20-30 28683 27 30-40 11070 10 40-50 3426 03 50-60 0 00
A comparison of emissions from ethanol and petrol fuelled cars IVL report B1962 Health risk assessment for Vaumlstra Goumltaland
42
60-70 0 00 70-80 639 01 80-90 0 00 90-100 0 00 100-110 783 01 Tot 85 1078367 O3 tot All ethanol (microgm3)
Populated weighted mean
Number of people Percentage of population
40-45 1422 01 45-50 26487 25 50-55 176636 164 55-60 770370 714 60-65 103452 96 Tot 569 1078367 O3 tot All petrol (microgm3)
Populated weighted mean
Number of people Percentage of population
40-45 1422 01 45-50 20229 19 50-55 181876 169 55-60 763361 708 60-65 111479 103 Tot 570 1078367 PM25 tot All ethanol (microgm3)
Populated weighted mean
Number of people Percentage of population
1-2 0 00 2-3 885325 821 3-4 192259 178 4-5 783 01 Tot 268 1078367 PM25 tot All petrol (microgm3)
Populated weighted mean
Number of people Percentage of population
1-2 0 00 2-3 868773 806 3-4 208811 194 4-5 783 01 Tot 270 1078367
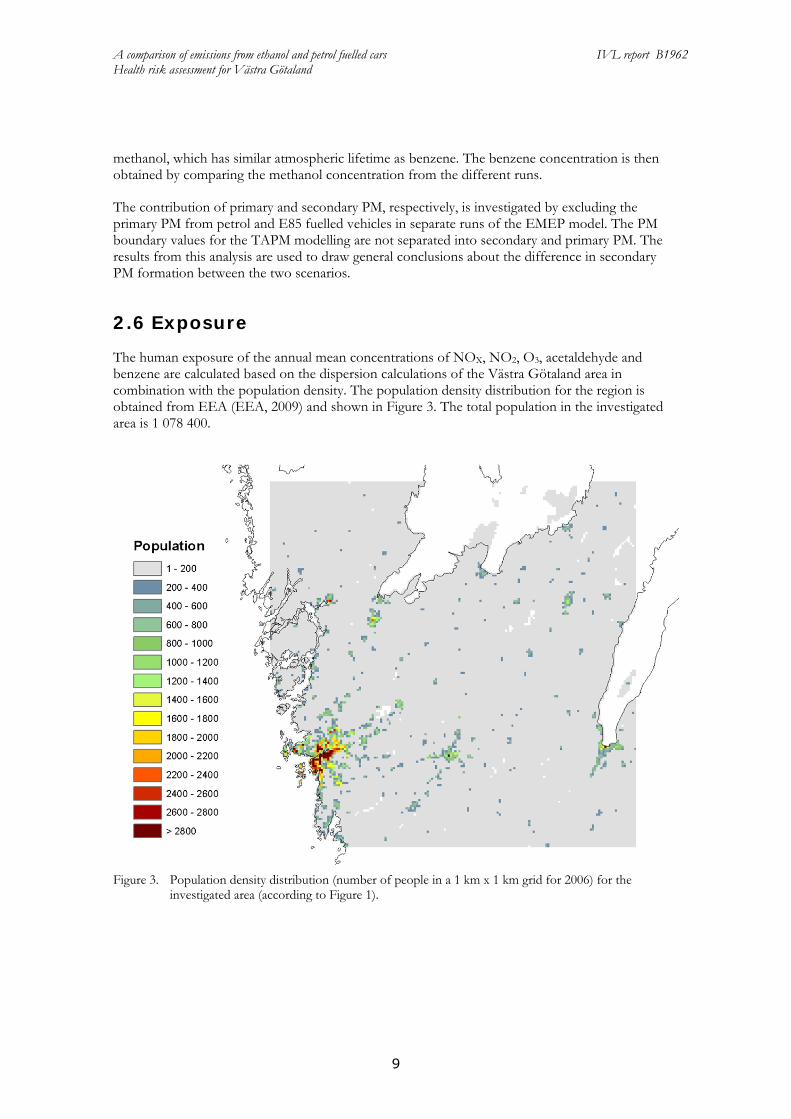
A comparison of emissions from ethanol and petrol fuelled cars IVL report B1962 Health risk assessment for Vaumlstra Goumltaland
11
For non-cancer effects the eye is the organ most sensitive to formaldehyde subjective irritation has been reported at 300-500 microgm3 which is above the odour thresholds (Wolkoff amp Nielsen 2010) Effects in the eyes and in airways occur around 600ndash1000 μgm3 Effects on lung function have not been found in controlled human exposure studies below 1 mgm3 In epidemiological studies of associations between formaldehyde and exacerbation of asthma several co-pollutants make the findings difficult to interpret An indoor air quality guideline of 100 μgm3 has been considered protective against both acute and chronic sensory irritation in the airways in the general population assuming a lognormal distribution of nasal sensory irritation (Wolkoff amp Nielsen 2010)
276 PM
In the studies of long-term exposure to PM25 and mortality like the American Cancer Society (ACS) Cohort the exposure contrast were mainly related to secondary PM why the reported relative risk approx 6 increase in all-cause mortality (in adults) per 10 μgm3 is most relevant for background secondary PM concentrations (Pope et al 1995)
277 Health Impact Assessment
To summarize the types of pollutants that are found possible to include in the health impact assessment are NOX and NO2 benzene acetaldehyde formaldehyde secondary PM and ozone The assessment is restricted to the most important and well established effects of these pollutants This means that not all types of potential health impacts are included Results should however do for a comparison of the scenarios
The impact on formaldehyde levels are not calculated why it is not included in the current assessment Relative risks from epidemiological studies of vehicle exhaust using NOX and NO2 as exposure variables may be influenced from effects of their co-pollutants mainly ultrafine particles (elemental carbon soot) CO and HCs such as formaldehyde Exhaust particles are often introduced in a relatively high background of particles from other sources Thus exhaust particles were not measured directly in the important studies of long-term exposure and effects on mortality
3 Results
31 Emission factors
The emission factors are selected from available published data both for the exhaust and the evaporative emissions In both cases values relative to petrol are used The majority of the studies have been done with both E85 and petrol making this comparison more robust
Westerholm et al (2008) tested two flexi-fuel cars with E5 E70 and E85 in the European driving cycle NEDC and in the Artemis driving cycles The former is used at two temperatures (22degC and -7degC) They report the regulated emissions greenhouse gases a number of organic compounds and particle number Graham et al (2008) present measurement results for regulated emissions greenhouse gases and a number of organic compounds from four cars with E85 and regular petrol in the FTP cycle They also made a compilation of literature data for ethanol cars Yanowitz and McCormick (2009) present an analysis of US certification testing data in order to compare emissions for E85 and petrol
A comparison of emissions from ethanol and petrol fuelled cars IVL report B1962 Health risk assessment for Vaumlstra Goumltaland
12
The results from the three studies (for flexi fuel cars) and in addition the values used by Jacobson (2007) are given in Table 2
Table 2 Emissions factors for E85 fuelled cars relative to the emission factors for petrol fuelled cars
Relative change E85 vs petrol ()
Yanowitz and McCormick (2009) (95 conf)
Graham et al (2008) (sd )
Westerlund et al (2008) (average for NEDC)
Jacobson (2007)
NOX -14 (-23 - -5) -42 (15) -38 -30 NMOG 26 (17 - 37) 12 (39) NMHC -43 (-52 - -32) -45 (24) THC -14 (-24 - -4) 2 TOG 22 CO -19 (-25 - -12) -5 (51) 1 5 PM 25 0 Formaldehyde 59 (32 - 91) 80 (44) 184 60 Acetaldehyde 2855 (1189) 1031 2000 13 Butadiene -64 (31) -74 -10 Benzene -72 (15) -71 -79 Ethanol 3950 from TOG Methane 50 43
Table 2 shows lower emissions of NOX for E85 fuelled cars relative to petrol fuelled cars from test cycles generally including cold starts The emissions of hydrocarbons are higher for petrol while the emissions of organic gases are somewhat higher for E85 The emissions of aldehydes especially acetaldehyde are much higher for E85 as are the emissions of ethanol and methane The emissions of benzene and 13-butadiene are higher with petrol It should be noted that the data in Table 2 are in general for tests performed at ambient temperatures of around 20 degC Westerlund et al (2008) report that for ambient temperatures of -7 degC the emissions of CO and NMHC may be significantly higher with E85 compared with petrol For one vehicle they also report very high NOX emissions with petrol at this lower temperature
As seen in Table 2 there are a number of different quantities when it comes to the emission of organic compounds or unburnt fuel From a chemistry point of view HC is no molecule but a notation for the sum of all compounds that are hydrocarbons thus are of the form HxCy and not containing any elements but carbon and hydrogen Total organic gases (TOG) include organic compounds containing oxygen such as alcohols and aldehydes (but not CO or CO2) Volatile organic compounds (VOC) means carbon containing organic compounds present in the gaseous state at ambient temperature Non-methane hydrocarbons (NMHC) means HC minus the methane mass NMTOG and NMVOC are defined in the corresponding way1
1 When it comes to exhaust gas regulations the definitions differ somewhat In the US THC is defined as the signal obtained from a FID (Flame Ionisation Detector) instrument calibrated on propane This means that alcohols and aldehydes contribute to THC but to a lower extent since their responses in a FID instrument are lower than for hydrocarbons TOG is defined in the US regulations as THC + the mass of alcohols (eg methanol) and carbonyls (eg formaldehyde) measured separately NMHC is equal to THC ndash rCH4CH4 ndashralcAlc where the CH4-concentration is measured by gas chromatography and a FID calibrated with methane Alc is the alcohol concentration and rCH4curren and rAlc are the respective FIDresponse functions NMOG means TOG - CH4 and VOC is TOG - CH4 - C2H6 In the regulations it is stated that also a number of other non-ozone forming organic compounds eg acetone should be subtracted but these are present in very low concentrations in engine exhaust Note that there is actually a double counting of aldehydes in NMOG since they contribute to a certain extent to the NMHC value and then are added using values from separate measurements
A comparison of emissions from ethanol and petrol fuelled cars IVL report B1962 Health risk assessment for Vaumlstra Goumltaland
13
There will be emission limits for both THC and NMHC in also the future For petrol cars with low methane emissions the challenge will be to meet the limit for NMHC For E85 cars with higher methane emissions the challenge will be to meet the THC limit Thus it is reasonable that the emissions of NMHC from E85 cars will be lower than for petrol cars
In the modelling presented here the emission factors from Graham et al (2008) are used with some exceptions as will be discussed The reason is that that study comprises a compilation of a relatively large number of tests For CO the emission factor is set to the same value for E85 and petrol since the differences are small and within the uncertainty For particle emissions the studies cited in Table 2 give little information Instead data from Ericsson et al (2008) are used indicating that the primary PM emission using E85 is about 65 of that when using petrol For NOX the emission for E85 is set to 58 of that for petrol
The emission factors for NMHC (physical emission in gkm) including ethanol are in this study set to the same value for E85 as for petrol This is in line with the data for NMOG reported by Graham showing only small differences It is also reasonable considering that the car producers optimize emissions to meet the future emission legislation in Europe for NMHC and THC i e the Euro 6 standards that apply from September 2014 For petrol with low CH4 emissions the NMHC value will be limiting and this is on 68 mgkm For E85 with higher CH4 emissions the THC value of 100 mgkm will be limiting When considering the FID response as a measure of emission instead of physical emission about 50 of the THC comes from NMHC for E85 cars However the FID response is low for ethanol which means that the physical NMHC emission is about 25 higher Considering these factors the emissions of NMHC (physical) for E85 can be expected to be around 50 mgkm 125 = 625 mgkm which is about the same as for petrol The methane emission for E85 is set to 142 times the value for petrol following Lipman and Delucchi (2002) Further also the differences in the evaporate emissions are considered as is described in Appendix 1
The emissions factors for petrol cars are taken from the Artemis model (Andreacute 2005) The distribution of NMHC for petrol cars is from Passant (2002) The resulting emission factors used to obtain the emissions scenarios are presented in Table 3
In Europe THC is defined as the signal from a propane calibrated FID and thus contains oxygen containing compounds although the response factors for the latter are lower The FID instrument gives the number of molecules and in order to calculate the mass the EU regulations use the densities obtained from assuming the molecular formulas C1H274O0385 (209 gmole) for E85 and C1H189O0016 (1415 gmole) for petrol This thus compensates for the lower response factor for ethanol and acetaldehyde NMHC is obtained by subtracting the concentration of CH4 (times the FID response factor) measured separately
A comparison of emissions from ethanol and petrol fuelled cars IVL report B1962 Health risk assessment for Vaumlstra Goumltaland
14
Table 3 Emission factors (gkm) for 2020 for passenger cars (including evaporative emissions but excluding wear particle emissions) used in the modelling
Petrol E85 NOX 0112 0065 CO 179 174 PM 00013 00008 CH4 0013 0018 NMHC 033 028
division of NMHC Ethanol 00000 01898 Acetaldehyde 00025 00299 Ethene 00244 00237 Ethyne 00094 00011 Formaldehyde 00057 00072 Benzene 00187 00045 13 Butadiene 00030 00009 Ethane 00107 00009 Alkanes C3+ 00928 00076 Alkenes C3+ 00301 00025 Aromatics C7+ 01297 00106 Aldehydesketones C3+ 00051 00004
sum NMHC 03321 02792
32 Emissions
The emissions from road traffic vary between the two scenarios due to the differences in the emission factors From the EMEP modelling the total emissions from road traffic in the different scenarios are calculated for the countries included In Figure 4 emissions of NOX NMVOC and PM in the S2 (E-85) scenario relative to the S1 (all-petrol) scenario are shown for these countries The relative change is larger for countries with a high fraction of petrol cars relative to diesel cars (since the latter are the same in the two scenarios) such as Russia and Ukraine The relative change is smallest for PM emissions due to the very small contribution of the exhaust particles from petrol fuelled cars compared to the contribution from diesel vehicles and wear particles
A comparison of emissions from ethanol and petrol fuelled cars IVL report B1962 Health risk assessment for Vaumlstra Goumltaland
15
Figure 4 National emissions of NOX NMVOC and PM from the road traffic sector in E85 scenario (S2)
relative to lsquoall-petrolrsquo scenario (S1)
An important difference in the emissions between the scenarios lies in the speciation of the NMVOC emissions Figure 5 shows this speciation of NMVOCs for all road traffic emission categories used in this study The two rightmost bars in Figure 5 show the NMVOC speciation for Swedish road traffic emissions for the two scenarios S1 and S2 Comparison with Figure4 shows that the relative changes between the two scenarios are much larger for some individual NMVOC species that for the total NMVOC emissions Since the NMVOC emissions from traffic in Sweden are dominated by the emissions from petrol cars (about 85 of the road traffic emissions of NMVOC comes from petrol cars) the variations in NMVOC speciation between petrol and E85
0
02
04
06
08
1
NOx
0
02
04
06
08
1
NMVOC
0
02
04
06
08
1
Aus
tria
Bel
arus
Bel
gium
Bos
-Her
cB
ulga
riaC
roat
iaC
ypru
sC
zech
Rep
Den
mar
kE
ston
iaFi
nlan
dFr
ance
Ger
man
yG
reec
eH
unga
ryIr
elan
dIt
aly
Lat
via
Lith
uani
aL
uxem
bour
gM
alta
Net
herla
nds
Nor
way
Pola
ndPo
rtug
alR
oman
iaR
ussi
a_E
uro
Slov
ak R
epSl
oven
iaSp
ain
Swed
enSw
itzer
land
Tur
key
Ukr
aine
UK
PM
A comparison of emissions from ethanol and petrol fuelled cars IVL report B1962 Health risk assessment for Vaumlstra Goumltaland
16
will have a significant impact on the total road traffic NMVOC speciation As can be seen in Figure 5 scenario S1 is dominated by alkanes and aromatics while scenario S2 is dominated by ethanol It can also be noted that S1 contains a significant emission of benzene which is much lower in S2 while the opposite is true for acetaldehyde
Figure 5 Distribution of hydrocarbon species in NMVOC emissions from individual road traffic emission
categories as defined in emission scenarios in this study and from the whole road traffic emission sector in Sweden for scenarios S1 (All petrol) and S2 (All E85)
Figure 6 shows a map of the EMEP domain with emissions of acetaldehyde for the two studied scenarios as an example of the geographical distribution of emissions
Figure 6 Gridded emissions of acetaldehyde for the year 2020 (in tonnes per grid cell (50 km x 50 km)
and year) a ndash lsquoAll petrol scenario b ndash lsquoAll E85 scenariorsquo
As mentioned the emissions from road traffic in the Vaumlstra Goumltaland region are calculated in a 500 m x 500 m grid Figure 7 shows the emissions of NOX for 2005 as obtained from the database and the projected emissions for 2020 with a mixed use of E85 and petrol This can be considered as the base case for the emissions in 2020 It can be seen that the emissions decrease over the period which is due to reduction in NOX emissions factors as older vehicles are replaced by newer models (the traffic actually increases from a total of 754x109 vehicle-kilometres in 2005 to 937x109
0
20
40
60
80
100
Pet
rol e
xh
Pet
rol e
vap
E-8
5 ex
h
E-8
5 ev
ap
Pet
rol M
C
Die
sel L
DV
Die
sel H
DV
Roa
d Sw
eden
S1
Roa
d Sw
eden
S2
m
ass
Ethane
Alkanes C3+
Ethene
13 Butadiene
Alkenes C3+
Ethyne
Benzene
Aromatics C7+
Formaldehyde
Acetaldehyde
Aldket C3+
Ethanol
A comparison of emissions from ethanol and petrol fuelled cars IVL report B1962 Health risk assessment for Vaumlstra Goumltaland
17
vehicle-kilometres in 2020) The major roads in the region are clearly visible as well as the larger cities (especially Gothenburg)
Figure 7 Emissions of NOX (kgyear for a 500 m x 500 m grid cell) in the Vaumlstra Goumltaland region for 2005
and for 2020 for the base case
In Table 4 the traffic emissions for NOX benzene acetaldehyde ethanol and PM10 for the Vaumlstra Goumltaland region are shown for the four different emissions scenarios The emissions of NOX and benzene are reduced between 2005 and 2020 for the base case while the emissions of ethanol and acetaldehyde increase due to an expected increase in the use of ethanol fuel The NOX emissions for S1 are somewhat higher than for S2 due to the higher NOX emissions factor for petrol compared with E85
Table 4 Emissions from traffic for the Vaumlstra Goumltaland region in four different emission scenarios (in tonnesyear)
Substance base 2005 base 2020 S1 S2 NOX 13 243 4 843 4 954 4 631 Benzene 2 833 927 1 201 386 Acetaldehyde 628 1 074 305 2 595 Ethanol 192 5 192 0 15 400 PM10 1 324 486 483 476
33 Dispersion modelling
Resulting concentrations from calculations of the S1 and S2 scenarios with the EMEP model are used to provide input of primary and secondary air pollutants for the calculations with the TAPM model for the Vaumlstra Goumltaland region Concentrations of NOX NMVOC PM25 PM10 acetaldehyde ethanol and benzene are therefore calculated as boundary conditions for the Vaumlstra Goumltaland region In addition sensitivity studies are performed to investigate the role of formation of secondary acetaldehyde and secondary particulate matter (see Appendix 2) Time series analysis of the TAPM and EMEP model results of the S1 and S2 scenarios are presented in Figure 8
A comparison of emissions from ethanol and petrol fuelled cars IVL report B1962 Health risk assessment for Vaumlstra Goumltaland
18
a)
b)
Figure 8 Time series analyses of S1 and S2 scenarios for the EMEP and TAPM modelled concentrations of NOX and ozone at an urban background site in Gothenburg (TAPM) and in EMEP model grid cells including Gothenburg city (50 km x 50 km)
Concentrations of NOX and ozone at an urban background site in Gothenburg (TAPM) and in the 50 km x 50 km EMEP grid cells including Gothenburg are compared for one summer and one winter month Due to the well-known process of ozone titration by freshly emitted nitrogen monoxide (Seinfeld and Pandis 1998) the concentration of ozone often decreases in urban areas This phenomenon is expected to be captured by the fine-gridded TAPM model but not necessarily by the courser scale of the EMEP model Figure 8 shows the generally higher NOX levels in the small grid cell of the TAPM model in urban background location comparing to those in the large EMEP grid cell while the opposite is observed for the ozone concentrations (Remember that the boundary concentrations for TAPM are obtained from the EMEP model and they are thus the same in both cases) This indeed shows that local scale emissions and processes contribute to locally increased levels of NOX in urban areas both for the summer and the winter cases For ozone where there of course are no primary emissions the situation is the opposite where instead the result is decreased concentration levels at urban sites on a local scale The influence of the
A comparison of emissions from ethanol and petrol fuelled cars IVL report B1962 Health risk assessment for Vaumlstra Goumltaland
19
NMHC emissions from the passenger cars is studied in a sensitivity analysis (see Appendix 23) and it is found to have only a small influence on the ozone levels
To illustrate the results of the different scenario calculations the geographically distributed concentrations are presented as the difference in yearly average concentrations between the all E85 (S2) and all petrol (S1) scenarios both as microgm3 and sometimes as percentage of the difference to scenario S1 (see Appendix 3)
The difference in yearly average concentrations between scenario S1 and S2 for acetaldehyde and benzene can be seen in Figures 9 and 10 respectively The increase in acetaldehyde concentration resulting from a switch from petrol to E85 is up to about 05 gm3 or 80 in the central parts of the largest urban area of the region Gothenburg Outside this area the relative increase is about 10 for the other urban areas and less than that for the rural areas This large relative increase (see map in Appendix 4) is a result of the relatively high emissions of acetaldehyde from E85 fuelled cars For benzene the situation is opposite In the scenarios for 2020 the concentration of benzene decreases by up to a few tenths of gm3 as a result of a switch from petrol to E85 For benzene the relative change is not calculated
Figure 9 The difference in yearly average concentrations of acetaldehyde for 2020 between the all E85 (S2) and all petrol (S1) scenarios (microgm3)
A comparison of emissions from ethanol and petrol fuelled cars IVL report B1962 Health risk assessment for Vaumlstra Goumltaland
20
Figure 10 The difference in yearly average concentrations (gm3) of benzene for 2020 between the all E85 (S2) and all petrol (S1) scenarios
The difference in the calculated NOX NO2 and ozone concentrations between the two scenarios are shown in Appendix 4 The change in NOX concentration between the two scenarios only represents a small fraction of the total NOX concentration This is because the emissions of NOX from petrol cars are relatively low compared with the contribution from diesel engines and other sources Thus the resulting decrease in the NOX concentration with E85 is only up to 3 For ozone there is a small increase of about 01 microgm3 of E85 in the central areas of Gothenburg where there is relatively high traffic intensity (see Appendix 4 Figure A9) In the rest of the region there is a small decrease in the ozone concentration in the E85 scenario
34 Exposure
The resulting concentrations from the dispersion modelling together with the population density distribution are used to assess the exposure to acetaldehyde benzene NO2 NOX and ozone for the two scenarios S1 and S2 The exposure to PM25 is very similar for the two scenarios (the difference in concentration between scenarios S2 and S1 is only about -002 gm3 Table 5 shows the population weighted mean exposure both as total concentrations and as the difference between the two scenarios Detailed exposure results can be found in Appendix 5 It can be seen that the exposure to all the pollutants in Table 5 with the exception of acetaldehyde are somewhat lower for the all E85 scenario (S2) than for the all petrol scenario (S1) However the effect on health also
A comparison of emissions from ethanol and petrol fuelled cars IVL report B1962 Health risk assessment for Vaumlstra Goumltaland
21
depends on the level of the dose-response functions For example if the level of concentration is low in a populated area but the dose-response function is high the effect of even a low concentration increase can become important The increase in exposure from S1 to S2 (S2-S1) calculated as percentage of the population exposed to increased mean concentrations of pollutants is presented in Figure 11
Table 5 Populated weighted mean exposure (gm3)
S1 S2 S2-S1 Acetaldehyde 065 077 014 Benzene 01 005 -007 NOX 85 84 -012 Ozone 570 569 -012 PM25 270 268 -002
Increased concentrations Decreased concentrations Both increased and
decreased conc
Figure 11 The relative exposure (S2-S1) calculated as percentage of the population
In Figure 11 it is clear that the only pollutant that does not show an improvement regarding air quality and thus the health risks when modelling a switch from petrol to E85 is acetaldehyde For all pollutants except for ozone the changes of concentration levels observed between the scenarios are within the urban areas but for ozone there are also differences in rural areas
According to the data in Figure 11 about 14 of the population in the Vaumlstra Goumltaland region will be exposed to 03-08 microgm3 higher concentration levels of acetaldehyde in scenario S2 relative to S1 From Figure 9 it can be seen that the majority of these people live within the Gothenburg area Further about 28 of the population will be exposed to increased levels of between 01 to 03 microgm3 mainly in the suburban areas and rural surroundings of Gothenburg but also in some of the smaller cities in the region Outside the urban areas the concentration difference is lower than 01 microgm3
In the S2 scenario relative to the S1 scenario the population is exposed to decreased concentration levels of benzene and NOX This is mainly true also for O3 but with an exception for the central
A comparison of emissions from ethanol and petrol fuelled cars IVL report B1962 Health risk assessment for Vaumlstra Goumltaland
22
parts of Gothenburg where the concentration actually increases (see Appendix 4 Figure 7A) resulting in that 3 (blue area in Figure 11 for O3) of the population will be exposed to higher concentrations of O3 For the rest of the area there are decreased concentrations of ozone upon a switch to E85
The largest differences are again in the central parts of Gothenburg where about 20 of the population is being exposed to a lower benzene concentration of 01-03 microgm3 This also means that concerning benzene the majority (78) of the population have none or very low influence from a change to ethanol fuel
The largest effect on exposure difference is seen for NOX where just over 20 of the population has its exposure decreased with 03-05 microgm3 (in the central parts of Gothenburg) In the suburbs the decrease is between 01-02 microgm3 lower Along the largest roads there is a small but visible improvement on a yearly basis of 01 microgm3
For PM25 there is a difference in the populated weighted mean exposure of 002 gm3 between the scenarios with a lower value for the all-E85 case (see also Appendix 5)
35 Impact on health in Vaumlstra Goumltaland
351 NO2 and NOX
The impact of long-term exposure on mortality was estimated using the relative risk from the Norwegian cohort study (Nafstad et al 2004) reporting a relative risk of 08 increase per microgm3 increase in NOX however without adjustment for particle concentrations Assuming this effect on the total mortality and a typical baseline mortality of 1000 deaths per 100 000 person years a decrease in the population mean exposure of 012 microgm3 would correspond to approximately 104 less preterm deaths per year However for the present case this number is highly uncertain since the exposure to substances normally associated with changes in NOX exposure may here change in different ways since the relation between different exhaust components varies between the scenarios
The impact of long-term exposure on asthma incidence (new cases) in adults has been estimated using results from the Swedish RHINE Study Cohorts (Modig et al 2009) with very similar results in the ECRHS Study corresponding to approx 4 increase per microgm3 increase in NO2 From the RHINE Study the incidence can be estimated to 03 per year (proportion of adults developing the disease) with children and elderly excluded this means around 1500 adult cases per year A reduction of 009 microgm3 corresponds to 54 avoided new cases of adult asthma per year However also NO2 in the asthma study may have been mainly an indicator of vehicle exhaust
352 Ozone
The impact of long-term exposure on respiratory mortality has been reported to be approx 02 per microgm3 increase in the summer concentration when studied in the large ACS Cohort (Jerret et al 2009) Assuming this effect on the total population and a typical baseline respiratory mortality of 100 deaths per 100 000 person years a decrease in the population mean exposure of 012 microgm3 corresponds to approximately 03 less preterm deaths per year
A comparison of emissions from ethanol and petrol fuelled cars IVL report B1962 Health risk assessment for Vaumlstra Goumltaland
23
353 Acetaldehyde
According to US EPA (1999) a lifetime risk for cancer of 0000002 per microgm3 is to be assumed for this potential human carcinogen An increase in the population mean exposure of 012 microgm3 corresponds to 026 cases more per year in the current population
354 Benzene
According to US EPA (1999) a lifetime risk for cancer (leukaemia) of 00000022-00000078 per microgm3 is to be assumed for this human carcinogen A decrease in the population mean exposure of 0074 microgm3 corresponds to approximately 03 cases less per year in the current population (assuming 0000004 per microgm3)
355 PM25
In CAFEacute and other impact assessments a relative risk of 6 increase in all-cause mortality per 10 microgm3 has usually been assumed Assuming this effect on the total mortality and a typical baseline mortality of 1000 deaths per 100 000 person years a decrease in the population mean exposure of 002 microgm3 corresponds to approximately 13 less preterm deaths per year
4 Discussion
In this study the health risks from a large introduction of E85 to replace petrol is analysed in scenario studies for 2020 for the Vaumlstra Goumltaland region It is found that the change in pollutant concentration exposure and health risks are small between the two scenarios It should be emphasized that the study only considers vehicle emissions and does not take into account effects from the fuel production
The emissions of NOX in the model are somewhat lower from E85 fuelled cars than from petrol fuelled cars This is in line with the emission factors used by Jacobson (2007) The nitrogen oxides are key substances in the atmospheric reactions determining the concentrations of ozone in air NOX is involved in the formation of ozone but close to the NO source the ozone concentration is lowered due to the rapid reactions between NO and O3 forming NO2 If NO is released in an environment with already high NO concentration it may result in lowering of ozone levels on the regional scale In the present study the ozone concentrations calculated are somewhat lower for the E85 scenario than for the petrol scenario
The health risk analysis shows that the main difference between the scenarios is due to the lower concentration of NOX However it may have been other exhaust components than NOX such as exhaust particles that were behind the reported association with mortality In cases when NOX is not a good indicator of exhaust particle emissions and their toxicity our results may be misleading This should be studied further Neglecting the effects of the changes in NOX exposure the total difference between the scenarios sums up to 16 preterm deaths per year with lower values for the E85 scenario while it would sum up to 12 less preterm deaths for the E85 scenario if the effect related to NOX were included Since there are no similar studier for the effect on mortality among those younger than 30-50 years of age we assume the same relative effect on mortality in all ages This makes only a small difference since the large majority of deaths occur in older groups
A comparison of emissions from ethanol and petrol fuelled cars IVL report B1962 Health risk assessment for Vaumlstra Goumltaland
24
The opposite result for the ozone concentration was obtained by Jacobson The reason for this discrepancy is that the Jacobson study concerns Los Angeles a region with high concentrations of pollutants while the study here concerns the Vaumlstra Goumltaland region with much less dense traffic and also lower concentrations of pollutants importantly NOX It is not unlikely that the effect that Jacobson report also would be found for large parts of Europe with higher traffic densities than in the Vaumlstra Goumltaland region
It is worth to emphasize that the major negative health effect in the Jacobson (2007) study is attributed to the increase in ozone concentration that is a result of the decrease of the NO emissions from E85 cars Directly after the emission NO reacts with ozone resulting in drop of the ozone concentration the so-called ozone titration commonly observed in many cities This NO does however form even higher quantities of ozone further downwind contributing to the general increase in the background ozone levels It is also precursor of NO2 secondary PM and other toxic species as eg PAN and hence reductions in NO emissions are never regarded as disbeneficial from the environmental viewpoint
There are of course several sources of uncertainties that influence the results of this study Since the main results concern differences between the two scenarios several of these factors loose on importance for the conclusions This comprises uncertainties in meteorology in future traffic volumes and in the population density distribution However there are some uncertainties that remain important The emission factors for E85 fuelled cars are much less characterised than what they are for petrol cars The emission of particles from E85 fuelled cars is especially uncertain with only very few published results Also the emissions of NMHC are somewhat uncertain and may be higher for E85 at lower ambient temperatures However the sensitivity analysis performed shows that for the studied region the NMHC emissions only have a small influence on the ozone concentrations
5 Conclusions
In this study the impact of tailpipe and evaporative emissions from E85 fuelled cars on air pollution and health risks are calculated and compared with petrol fuelled cars The scenario calculations for the Vaumlstra Goumltaland Region give data on emissions pollutant concentrations exposure and a health risk evaluation
The differences in emission factors between E85 and petrol lies in the emissions of PM and NOX which are about 65 and 58 for E85 relative petrol respectively Also the speciation of the emitted hydrocarbons is significantly different with large emissions of acetaldehyde and ethanol from E85 and large emissions of benzene higher aromatics alkanes and alkenes from petrol
These differences in emission factors reflect in differences in emissions The emission calculations for all Swedish road traffic show a decrease for the E85 scenario relative to the petrol scenario of 65 for NOX 34 for PM25 67 for benzene For acetaldehyde there is an increase of 770
The differences obtained from the TAPM modelling show decreased levels of NOX ozone and benzene with E85 and increased levels of acetaldehyde For the latter the increase may be up to 80 while NOX and ozone show decreases of up to a few per cent and a few tenths of per cent respectively
A comparison of emissions from ethanol and petrol fuelled cars IVL report B1962 Health risk assessment for Vaumlstra Goumltaland
25
The health risk assessment shows decreased health risks in the E85 scenario relative the all-petrol scenario due to the increased NOX exposure correlated with both preterm deaths and asthma However NOX may be mainly an exhaust indicator Smaller effects are expected from the changes in ozone acetaldehyde and benzene exposure The overall difference considering the exposure to PM acetaldehyde benzene and ozone is 16 preterm deaths with lower values for the E85 scenario
6 Acknowledgements
Saab Automobile The Swedish Transport Administration and The Foundation for the Swedish Environmental Research Institute are gratefully acknowledged for financial contribution
Magnus Ekstroumlm and Maria Holmstroumlm at Saab and Martin Juneholm at the Swedish Transport Administration are acknowledged for their most valuable input to the study
David Simpson Norwegian Meteorological Institute EMEP MSC-W Norway and Dept Radio amp Space Science Chalmers Univ Technol Sweden is gratefully acknowledged for help with implementation of the Unified EMEP model
A comparison of emissions from ethanol and petrol fuelled cars IVL report B1962 Health risk assessment for Vaumlstra Goumltaland
26
7 References
Altenstedt J Pleijel K 2000 An alternative approach to photochemical ozone creation potentials under European conditions J Air amp Waste Manage Assoc 50 1023 ndash 1036
Andre J-M (2005) Vehicle emission measurement collection of the ARTEMIS datatbase Artemis 3312 report Available from httpwwwinretsfrurltepublicationspublications-pdfJoumardA3312reportJMALTE0504pdf
Bachand A MMundt K A Mundt D JMontgomery R R Epidemiological studies of formaldehyde exposure and risk of leukemia and nasopharyngeal cancer A meta-analysis Critical Reviews in Toxicology 2010 40(2) 85ndash100
Beane Freeman L E Blair A Lubin J H Stewart P A Hayes R B Hoover R N Hauptmann M Mortality from lymphohematopoietic malignancies among workers in formaldehyde industries The National Cancer Institute Cohort J Natl Cancer Inst 2009101751ndash761
Bosetti C McLaughlin J K Tarone R E Pira E LaVecchia C Formaldehyde and cancer risk A quantitative review of cohort studies through 2006 Ann Oncol 20081929ndash43
ConcaweJRC Well-to-wheel studies httpiesjrceceuropaeuwtwhtml
Derwent R G Jenkin M E Saunders S M 1996 Photchemical ozone creation potentials for a large number of reactive hydrocarbons under European conditions Atmos Environ 30 181 ndash 199
Derwent RG Jenkin ME Passant NR Pilling MJ 2007 Photochemical ozone creation potentials (POCPs) for different emission sources of organic compounds under European conditions estimated with a Master Chemical Mechanism Atmos Env 41 2570ndash2579
EEA Copenhagen 2009 wwweeaeuropaeudata-and-mapsdatapopulation-density-disaggregated-with-corine-land-cover-2000-2
Ericsson P Holmstroumlm M Amberntsson-Carlsson A Ohlson C Skoglundh M Andersson B Carlsson P-A 2008 Characterization of particulate emissions and methodologhy for oxidation of particulates from non-diesel combustion ystems SAE Technical Paper Series 2008-01-1746
GAINS 2010 httpgainsiiasaacatindexphpgains-europe
Graham LA Belisle SL Baas C-L Emissions from light duty gasoline vehicles operating on low blend ethanol gasoline and E85 Atmospheric Environment 42 4498 (2008)
Haskew H M Thomas P E Liberty F 2006 Fuel Permeation From Automotive Systems E0 E6 E10 E20 And E85 Final Report CRC Project No E-65-3 Coordinating Research Council Inc 3650 Mansell RoadSuite 140Alpharetta GA 30022
HEI Air Toxics Review Panel (2007) Mobile-Source Air Toxics A Critical Review of the Literature on Exposure and Health Effects HEI Special Report 16 Health Effects Institute Boston USA
Hurley P TAPM v 4 User Manual 2008 CSIRO ISBN 978-1-921424-73-1
IARC (2006) IARC Monographs on the Evaluation of Carcinogenic Risks to Humans Wood Dusts and Formaldehyde Lyon World Health Organization International Agency for Research on Cancer Lyon France 8837ndash325
Jacobson M Z Effects of Ethanol (E85) versus Gasoline Vehicles on Cancer and Mortality in the United States Environ Sci Technol 2007414150-4157
A comparison of emissions from ethanol and petrol fuelled cars IVL report B1962 Health risk assessment for Vaumlstra Goumltaland
27
Jerret M Burnett R T Pope C A Ito K Thurston G Krewski D Shi Y Calle E Thun M Long-Term Ozone Exposure and Mortality N Engl J Med 20093601085-95
Lipman T E Delucchi M A 2002 Emissions of nitrous oxide and methane from conventional and alternative fuel motor vehicles Climate Change 53 477
Modig L Toreacuten K Janson C Jarvholm B Forsberg B Vehicle exhaust outside the home and onset of asthma among adults Eur Respir J 2009 Jun33(6)1261-7
Nafstad P Haheim L L Wisloff T Gram F Oftedal B Holme I Hjermann I Leren P Urban air pollution and mortality in a cohort of Norwegian men Environ Health Perspect 2004112(5)610-5
OEHHA (1999) Air Toxics Hot Spots Program Risk Assessment Guidelines Part II Technical Support Document for Describing Available Cancer Potency Factors Prepared by the Air Toxicology and Epidemiology Section Office of Environmental Health Hazard Assessment April 1999
Passant NR (2002) Speciation of UK emissions of non-methane volatile organic compounds AEAT report AEATENVR0545 Issue 1 Culham UK
Pope CA III Thun MJ Namboodiri MM Dockery DW Evans JS Speizer FE Heath CJ Particulate air pollution as a predictor of mortality in a prospective study of US adults Am J Resp Crit Care Med 1995 151 669-674
Seinfeld J H and Pandis SN (1998) Atmospheric Chemistry and Physics From Air Pollution to Climate Change John Wiley amp Sons New YorkSimpson D Fagerli H Jonson JE Tsyro S Wind P Tuovinen J -P 2003 Transboundary acidification and eutrophication and ground level ozone in Europe Unified EMEP Model Description EMEP Status Report 12003 Part I EMEPMSC-W Report The Norwegian Meteorological Institute Oslo Norway
US EPA (1999) httpwwwepagovttnatwnata1999nsata1999
Vestreng V et al 2004 Inventory Review 2004 Emission data reported to CLRTAP and the NEC Directive EMEPEEA Joint Review Report EMEPMSC-W Note 1
Westerholm R Ahlvik P Karlsson HL An exhaust characterisation study based on regulated and unregulated emissions from bi-fuel and flexi-fuel light-duty passanger cars fuelled by petrol (E5) bioethanol (E70 E75) and biogas tested at ambient temperatures of +22degC and -7degC 2008
Wolkoff P Nielsen G D Non-cancer effects of formaldehyde and relevance for setting an indoor air guideline Environment International 201036788ndash799
Yanowitz J McCormick RL Effect of E85 on tailpipe emissions from light-duty vehicles J Air amp Waste Manage Assoc 59 172 (2009)
A comparison of emissions from ethanol and petrol fuelled cars IVL report B1962 Health risk assessment for Vaumlstra Goumltaland
28
Appendix 1 Evaporate emissions of NMHC
The following assumptions are done for evaporative emissions The NMHC emissions from E85 are reduced relative to petrol by 45 Methane emissions are zero and the split of NMHC species is 68 ethanol and the remaining 32 is divided in the same way as evaporative emissions for petrol The estimates by Graham et al (2008) are missing evaporative emission data however these assumptions agrees very well with measurements of evaporative emissions due to fuel permeation reported by Haskew et al (2006) where NMHC emissions are reported to be reduced by 50 for E85 fuel compared to petrol Haskew et al also presents the NMHC split to species with 60 ethanol This number agrees quite well with our assumption of 68 NMHC being ethanol NMHC in exhaust and evaporative emissions are thus divided as in Table A1
Table A1 Division of NMHC in the exhaust and evaporative emissions for E85 and petrol respectively (wt)
E85 Petrol E85 Petrol exhaust exhaust evaporative evaporative
Ethanol 680 0 680 0 Acetaldehyde 131 08 02 0 Ethene 99 73 24 0 Ethyne 03 28 09 0 Formaldehyde 31 17 06 0 Benzene 16 56 18 10 13 Butadiene 03 09 03 0 sum 963 191 741 10
The remaining NMHC emissions are divided as for petrol (ref) and listed in Table A2
Table A2 Division of NMHC in the exhaust and evaporative emissions for E85 and petrol respectively (wt)
E85 Petrol E85 Petrol exhaust exhaust evaporative evaporative
Ethane 02 32 10 0 Alkanes (C3+) 13 278 89 880 Alkenes (C3+) 04 90 29 95 Aromatics (C7+) 18 388 125 15 Aldehydesketones (C3+)
01 15 05 0
A comparison of emissions from ethanol and petrol fuelled cars IVL report B1962 Health risk assessment for Vaumlstra Goumltaland
29
Appendix 2 Description of the model system
A21 Atmospheric lifetimes
Table A3 gives tropospheric lifetimes with regard to reaction of ethanol formaldehyde acetaldehyde and benzene (C6H6) with OH nitrate radical (NO3) and photolysis The studied organic species are listed together with three species common in the gasoline exhaust (benzene ethene and toluene) for comparison Table 11 shows also photochemical ozone creation potential (POCP) of these species POCP is a measure of amount of ozone that is formed from a certain VOC emission relatively to other emission source which has been established to the same emission mass of ethene (Derwent et al 1996 Altenstedt et al 2000) The range represents different scenarios for VOC and NOX background concentrations Derwent et al (2007) used similar methodology to calculate POCP of different VOC sources and calculated POCP of mean road emission exhaust to be 69
Table A3 Atmospheric lifetimes of studies NMVOC species with respect to the OH- and NO3- initiated
degradation τ(OH) and τ(NO3) and with respect to the photolysis (The lifetime of a chemical species which decays in a first-order process is the time needed for a concentration of this species to decrease to 1e of its original value Statistically it represents the mean life expectancy of an excited species) The OH concentration of 1times106 moleculescm3 typical for summer troposphere was used for the lifetime calculation The NO3 concentrations of 5 and 100 ppt(V) were used for lifetime calculations as representative of rural and urban night-time 12 hrs mean concentration The studied organic species are listed together with 3 species common in the gasoline exhaust for comparison The rates of photolysis were calculated with radiation transfer model for July 58ordm latitude and integrated over 24 hours
τ(OH) τ(NO3) urbanrural τ (photolysis) POCP
hr hr hr
Ethanol 85 56 1times103 - 44 - 63
Acetaldehyde 15 47 1times103 86 68 - 80
Formaldehyde 30 194 4times103 10 18 - 55
Benzene 214 - - 23 - 47
Ethene 34 - - 100
Toluene 50 - - 30 - 67
A22 Defining of boundary concentrations for TAPM from EMEP fields
Calculation of initial concentration field for TAPM from EMEP concentration field of NO2 (as example) and EMEP mean wind vector components u_mid and v_mid Two EMEP model gridcells (i=56 j=60 and i=56 j=61) represent the TAPM model domain and concentrations from the surrounding EMEP gridcells SE-S SE-N NW-S NW-N NE NW (Figure A1) are used for calculation of boundary concentration NO2(bc) according to the following code if u_mid lt= 0 then ( isite = SE-S and jsite = SE-N) else isite = NW-S and jsite = NW-N) endif
A comparison of emissions from ethanol and petrol fuelled cars IVL report B1962 Health risk assessment for Vaumlstra Goumltaland
30
if v_mid lt= 0 then ( ksite = NE) else ksite = SW endif NO2(bc) = [(NO2(isite)u_mid(isite) + NO2(jsite)u_mid(jsite))2 + NO2(ksite)v_mid(ksite)] [(u_mid(isite) + u_mid(jsite))2 + v_mid(ksite)]
Figure A1 Gridcells covering Gothenburg domain and its boundary in EMEP model plotted on latitude-
longitude coordinates The red square represents centre of Gothenburg and the blue line the coastline EMEP i and j coordinates for the boundary gridcells are SE-S = 57-60 SE-N = 57-61 NW-S = 55-60 NW-N = 55-61 NE = 56-62 NW = 56-59 and for Gothenburg grid cells are Gbg-NE = 56-61 Gbg-SW = 56-60
A23 Atmospheric chemistry
The role of secondary chemistry in for the concentration of acetaldehyde are studied by first excluding the primary acetaldehyde emissions from the EMEP model simulations of scenarios S1 and S2 and then by excluding all NMVOC emissions from the car category with spark ignition engines The contribution from the primary acetaldehyde emissions as well as the contribution of secondary acetaldehyde formed from other NMVOC to the total acetaldehyde concentration is then obtained However the secondary chemistry is highly nonlinear due to the interactions of NMVOCs with ozone and OH and thus the results for the contribution of secondary acetaldehyde are somewhat uncertain Differences in acetaldehyde concentrations between S1 and S2 scenarios are studied with respect to contribution of primary and secondary acetaldehyde It is observed that in summer background air the monthly mean contribution of the secondary acetaldehyde is of the same magnitude as the contribution of the primary acetaldehyde to the difference between S1 and
565
57
575
58
585
105 115 125 135 145
Long
Lat
Gbg-SW
Gbg-NE
SE-S
NW-N
NW-S
SE-N
SW
NE
55-59
57-59
55-62
A comparison of emissions from ethanol and petrol fuelled cars IVL report B1962 Health risk assessment for Vaumlstra Goumltaland
31
S2 In the winter and in more polluted atmosphere (Gothenburg grid cells) the contribution from secondary acetaldehyde to the concentration difference appears to be negative due to the chemistry feedback ie the E-85 scenario has less secondary acetaldehyde than the all-petrol scenario
A comparison of S2-S1 differences in primary and secondary acetaldehyde concentrations in the background (=upwind) and Gothenburg grid cells show no increase in the secondary acetaldehyde from upwind to the Gothenburg grid cell It can thus be concluded that there is no significant contribution from secondary aldehydes on the small scale (tenths of km) Conclusion from this sensitivity study is that the secondary formaldehyde can be of importance under summer in the clean background air but that formation on the local scale is unimportant Using EMEP simulated boundary concentrations of acetaldehyde in the local scale model and simulating the primary acetaldehyde emissions will capture the most important features of acetaldehyde dispersion and chemistry in Vaumlstra Goumltaland
In the EMEP model the tail-pipe PM emissions are specified as primary particles Emissions of NOX and VOCs (and NH3 SO2) are oxidised in the atmosphere and a part is then transferred through the gas-to-particle transport to the PM as secondary PM The petrol fuelled cars emit both more primary PM and more NOX compared to the E85 cars If we compare differences in primary and secondary PM between the S1 and S2 scenarios simulated by EMEP we can directly see what part of the difference is from the tail-pipe emissions of the primary particles and what part is from the formation of the secondary PM in atmosphere (mostly from higher emissions of NOX) Table A4 shows the differences between S1 and S2 (S1-S2) of monthly PM averages for January and June (two months with low and high photochemical activities respectively) It can be seen that the higher formation of secondary PM in the S1 (all-petrol) scenario is more important than the higher tail-pipe emission of primary PM by factor 10 - 20
When we compare simulated PM differences between S1-S2 for the background air (=upwind) grid cells and for grid cells including Gothenburg (50 km x 50 km scale) we can see significant increase in primary PM in the S1 scenario from the upwind grid cells to Gothenburg (746 in winter 132 in summer) while no systematic increase can be seen for the secondary PM (-42 in winter +24 in summer) From this comparison it can be concluded that no systematic increase in secondary PM can be seen (in difference from the primary PM) on the scale of 50-100 km and we can neglect this process on the small scale However the overall change in PM concentrations due to the switch of the fuel is very small both on the large scale and on the small scale as can be seen when the differences in PM concentrations between S1 and S2 are compared to absolute PM concentrations in S1 presented in the last column of Table A4
Table A4 Differences in primary and secondary PM concentrations between the lsquoAll-petrolrsquo (S1) and lsquoE-85rsquo (S2) scenarios simulated in gridcells upwind Gothenburg and in gridcells including Gothenburg (2 50 km x 50 km gridcells)
S1-S2 Background
S1-S2 Gothenburg
Increase S1-S2 Gothenburg
S1 Background
μgm3 μgm3 μgm3 bkgnd μgm3
Prim PM10 Jan 00008 00014 00006 746 084
Jun 00008 00018 00010 1319 084
Sec PM10 Jan 00155 00148 -00006
-42 157
Jun 00080 00081 00002 24 213
The sensitivity of the used emission factors for NMHC with respect to the ozone formation in the region of the Swedish West Coast can be analysed with the help of results from studying the
A comparison of emissions from ethanol and petrol fuelled cars IVL report B1962 Health risk assessment for Vaumlstra Goumltaland
32
formation of secondary acetaldehyde In this study first all primary acetaldehyde emitted by the E85 fleet are omitted in a model simulation (S2_nopAA) and secondly all NMHC emissions from the E-85 fleet are switched off (S2_noVOC) Acetaldehyde has a somewhat higher though still comparable photochemical ozone creation potential compared to ethanol (ethanol 44-63 acetaldehyde 68-80 Altenstedt and Pleijel 2000) and this simulation will thus also give information on the sensitivity of the calculations to uncertainties in the ethanol emissions Setting the emission factor for NMHC to zero gives the sensitivity to the emission factor of total NMHC Figure A2 shows the differences in ozone concentration as a result of acetaldehyde only and the total NMHC from the E85 car fleet (S2 scenario) We can see that the effect on ozone formation is very small for the Swedish West coast The reason is that the ozone formation in this area is controlled by the availability of NOX while NMHC or rather their degradation products the peroxy radicals that serve as a lsquofuelrsquo to ozone formation are usually in excess here and further VOC emissions do not increase ozone concentrations significantly The situation looks different in areas that are more heavily polluted with NOX andor which is limited in the availability of peroxy radicals The results from this sensitivity study are fully consistent with the observed increase in ozone concentrations as a result of lower NO emissions (the so-called ozone titration) only very close to the major roads but no larger-scale decrease in ozone concentrations in the Gothenburg area or in any other communities
Figure A2 Sensitivity of the ozone formation in the 2 EMEP model grid cells covering Gothenburg (blue) and in the 6 surrounding grid cells (red see Fig A1) to changes in NMHC emission factor of the E85 fuelled cars lsquobasersquo is simulation S2 with EF for NMHC as in Table 3 lsquonoVOCrsquo is S2 with EF for all NMHC = 0 lsquonopAArsquo is S2 with EF for acetaldehyde = 0 a ndash Mean sensitivity in January absolute difference in ozone formation in ppb(V) as a result of NMHC (base-noVOC) and acetaldehyde (base-nopAA) emissions b ndash Sensitivity relative to ozone concentration in the S2-base simulation January c ndash same as a) but June d ndash same as b) but June
‐002
‐001
0
001
base‐noVOC base‐nopAA
ΔO3(ppb)
a)
0
001
002
base‐noVOC base‐nopAA
ΔO
3(ppb)
c)
‐010
‐005
000
005
base‐noVOC base‐nopAA
ΔO
3
b)
000
002
004
006
base‐noVOC base‐nopAA
ΔO
3
d)
A comparison of emissions from ethanol and petrol fuelled cars IVL report B1962 Health risk assessment for Vaumlstra Goumltaland
33
Appendix 3 Emission results
The geographically distributed NOX and acetaldehyde emissions for the Vaumlstra Goumltaland region are presented in Figures A3 and A4 respectively
Figure A3 NOX emissions for the Vaumlstra Goumltaland region for the All Petrol scenario
A comparison of emissions from ethanol and petrol fuelled cars IVL report B1962 Health risk assessment for Vaumlstra Goumltaland
34
Figure A4 Acetaldehyde emissions for the Vaumlstra Goumltaland region for the All Ethanol scenario
A comparison of emissions from ethanol and petrol fuelled cars IVL report B1962 Health risk assessment for Vaumlstra Goumltaland
35
Appendix 4 Dispersion modelling results
The difference in yearly average concentration between scenario S1 and S2 for acetaldehyde and benzene can be seen in Figure A5 and Figure A6 respectively a)
b)
Figure A5 The difference in yearly average concentrations of acetaldehyde for 2020 between the all E85 (S2) and all petrol (S1) scenarios presented as a) microgm3 and as b) percentage for the Gothenburg area
A comparison of emissions from ethanol and petrol fuelled cars IVL report B1962 Health risk assessment for Vaumlstra Goumltaland
36
a)
b) all E85 c) all petrol
Figure A6 a) the difference in yearly average concentrations (gm3) of benzene for 2020 between the all E85 (S2) and all petrol (S1) scenarios yearly means for b) all E85 and c) all petrol (note the different scales)
The difference in the calculated NOX NO2 and ozone concentrations between the two scenarios are shown in Figures A7 A8 and A9
A comparison of emissions from ethanol and petrol fuelled cars IVL report B1962 Health risk assessment for Vaumlstra Goumltaland
37
a)
b)
Figure A7 The difference in yearly average concentrations of NOX for 2020 between the all E85 (S2) and all petrol (S1) scenarios presented as a) microgm3 and as b) percentage for the Gothenburg area
A comparison of emissions from ethanol and petrol fuelled cars IVL report B1962 Health risk assessment for Vaumlstra Goumltaland
38
a)
Figure A8 The difference in yearly average concentrations of NO2 for 2020 between the all E85 (S2) and all petrol (S1) scenarios presented as a) microgm3 and as b) percentage for the Gothenburg area
A comparison of emissions from ethanol and petrol fuelled cars IVL report B1962 Health risk assessment for Vaumlstra Goumltaland
39
a)
b)
Figure A9 The difference in yearly average concentrations of ozone for 2020 between the all E85 (S2) and all petrol (S1) scenarios presented as a) microgm3 and as b) percentage for mainly the Gothenburg area
A comparison of emissions from ethanol and petrol fuelled cars IVL report B1962 Health risk assessment for Vaumlstra Goumltaland
40
Appendix 5 Detailed Exposure data
Detailed exposure data for the difference between the all E85 (S2) and the all petrol (S1) scenarios can be found in Table A5
Table A5 Exposure data for the difference between the all E85 (S2) and the all petrol (S1) scenarios
Acetaldehyde diff E-P (microgm3)
Populated weighted mean
Number of people Percentage of population
0 - 01 627198 582 01 - 02 163394 152 02 - 03 134879 125 03 - 04 88099 82 04 - 05 38686 36 05 - 06 16880 16 06 - 07 7983 07 07 - 08 1248 01 Tot 014 1078367 Benzene diff E-P (microgm3)
Populated weighted mean
Number of people Percentage of population
-03 - -02 26680 25 -02 - -01 205757 191 -01 - -0 845930 784 Tot -0074 1078367 NO2 diff E-P (microgm3) Populated weighted
mean Number of people Percentage of
population -04 - -03 7698 07 -03 - -02 50131 46 -02 - -01 296288 275 -01 - -0 724250 672 Tot -009 1078367 NOX diff E-P (microgm3) Populated weighted
mean Number of people Percentage of
population -06 - -05 7698 -05 - -04 19639 18 -04 - -03 36626 34 -03 - -02 161685 150 -02 - -01 186500 173 -01 - -0 666219 618 Tot -012 1078367 O3 diff E-P (microgm3) Populated weighted
mean Number of people Percentage of
population -02 - -01 779132 723 -01 - -0 266417 247 0 - 01 32818 30 Tot -012 1078367
Exposure data for the total levels in the two scenarios can be found in Table A6
A comparison of emissions from ethanol and petrol fuelled cars IVL report B1962 Health risk assessment for Vaumlstra Goumltaland
41
Table A6 Exposure data for the total levels in the two scenarios
Acetaldehyde tot All ethanol (microgm3)
Populated weighted mean
Number of people Percentage of population
06 - 07 568825 527 07 - 08 171845 159 08 - 09 124551 115 09 - 10 100946 94 10 - 11 59235 55 11 - 12 30559 28 12 - 13 13175 12 13 - 14 7983 07 14 - 15 1248 01 Tot 077 1078367 Acetaldehyde tot All petrol (microgm3)
Populated weighted mean
Number of people Percentage of population
05 - 06 45111 42 06 - 07 1032008 957 07 - 08 1248 01 Tot 065 1078367 Benzene tot All ethanol (microgm3)
Populated weighted mean
Number of people Percentage of population
0 - 01 1055961 98 01 - 02 22406 2 Tot 005 1078367 Benzene tot All petrol (microgm3)
Populated weighted mean
Number of people Percentage of population
0 - 01 729093 676 01 - 02 232961 216 02 - 03 94042 87 03 - 04 21023 19 04 - 05 1248 01 Tot 010 1078367 NOX tot All ethanol (microgm3)
Populated weighted mean
Number of people Percentage of population
0-10 779108 722 10-20 254658 236 20-30 28683 27 30-40 11070 10 40-50 3426 03 50-60 0 00 60-70 0 00 70-80 639 01 80-90 0 00 90-100 0 00 100-110 783 01 Tot 84 1078367 NOX tot All petrol (microgm3)
Populated weighted mean
Number of people Percentage of population
0-10 769557 714 10-20 264209 245 20-30 28683 27 30-40 11070 10 40-50 3426 03 50-60 0 00
A comparison of emissions from ethanol and petrol fuelled cars IVL report B1962 Health risk assessment for Vaumlstra Goumltaland
42
60-70 0 00 70-80 639 01 80-90 0 00 90-100 0 00 100-110 783 01 Tot 85 1078367 O3 tot All ethanol (microgm3)
Populated weighted mean
Number of people Percentage of population
40-45 1422 01 45-50 26487 25 50-55 176636 164 55-60 770370 714 60-65 103452 96 Tot 569 1078367 O3 tot All petrol (microgm3)
Populated weighted mean
Number of people Percentage of population
40-45 1422 01 45-50 20229 19 50-55 181876 169 55-60 763361 708 60-65 111479 103 Tot 570 1078367 PM25 tot All ethanol (microgm3)
Populated weighted mean
Number of people Percentage of population
1-2 0 00 2-3 885325 821 3-4 192259 178 4-5 783 01 Tot 268 1078367 PM25 tot All petrol (microgm3)
Populated weighted mean
Number of people Percentage of population
1-2 0 00 2-3 868773 806 3-4 208811 194 4-5 783 01 Tot 270 1078367
A comparison of emissions from ethanol and petrol fuelled cars IVL report B1962 Health risk assessment for Vaumlstra Goumltaland
13
There will be emission limits for both THC and NMHC in also the future For petrol cars with low methane emissions the challenge will be to meet the limit for NMHC For E85 cars with higher methane emissions the challenge will be to meet the THC limit Thus it is reasonable that the emissions of NMHC from E85 cars will be lower than for petrol cars
In the modelling presented here the emission factors from Graham et al (2008) are used with some exceptions as will be discussed The reason is that that study comprises a compilation of a relatively large number of tests For CO the emission factor is set to the same value for E85 and petrol since the differences are small and within the uncertainty For particle emissions the studies cited in Table 2 give little information Instead data from Ericsson et al (2008) are used indicating that the primary PM emission using E85 is about 65 of that when using petrol For NOX the emission for E85 is set to 58 of that for petrol
The emission factors for NMHC (physical emission in gkm) including ethanol are in this study set to the same value for E85 as for petrol This is in line with the data for NMOG reported by Graham showing only small differences It is also reasonable considering that the car producers optimize emissions to meet the future emission legislation in Europe for NMHC and THC i e the Euro 6 standards that apply from September 2014 For petrol with low CH4 emissions the NMHC value will be limiting and this is on 68 mgkm For E85 with higher CH4 emissions the THC value of 100 mgkm will be limiting When considering the FID response as a measure of emission instead of physical emission about 50 of the THC comes from NMHC for E85 cars However the FID response is low for ethanol which means that the physical NMHC emission is about 25 higher Considering these factors the emissions of NMHC (physical) for E85 can be expected to be around 50 mgkm 125 = 625 mgkm which is about the same as for petrol The methane emission for E85 is set to 142 times the value for petrol following Lipman and Delucchi (2002) Further also the differences in the evaporate emissions are considered as is described in Appendix 1
The emissions factors for petrol cars are taken from the Artemis model (Andreacute 2005) The distribution of NMHC for petrol cars is from Passant (2002) The resulting emission factors used to obtain the emissions scenarios are presented in Table 3
In Europe THC is defined as the signal from a propane calibrated FID and thus contains oxygen containing compounds although the response factors for the latter are lower The FID instrument gives the number of molecules and in order to calculate the mass the EU regulations use the densities obtained from assuming the molecular formulas C1H274O0385 (209 gmole) for E85 and C1H189O0016 (1415 gmole) for petrol This thus compensates for the lower response factor for ethanol and acetaldehyde NMHC is obtained by subtracting the concentration of CH4 (times the FID response factor) measured separately
A comparison of emissions from ethanol and petrol fuelled cars IVL report B1962 Health risk assessment for Vaumlstra Goumltaland
14
Table 3 Emission factors (gkm) for 2020 for passenger cars (including evaporative emissions but excluding wear particle emissions) used in the modelling
Petrol E85 NOX 0112 0065 CO 179 174 PM 00013 00008 CH4 0013 0018 NMHC 033 028
division of NMHC Ethanol 00000 01898 Acetaldehyde 00025 00299 Ethene 00244 00237 Ethyne 00094 00011 Formaldehyde 00057 00072 Benzene 00187 00045 13 Butadiene 00030 00009 Ethane 00107 00009 Alkanes C3+ 00928 00076 Alkenes C3+ 00301 00025 Aromatics C7+ 01297 00106 Aldehydesketones C3+ 00051 00004
sum NMHC 03321 02792
32 Emissions
The emissions from road traffic vary between the two scenarios due to the differences in the emission factors From the EMEP modelling the total emissions from road traffic in the different scenarios are calculated for the countries included In Figure 4 emissions of NOX NMVOC and PM in the S2 (E-85) scenario relative to the S1 (all-petrol) scenario are shown for these countries The relative change is larger for countries with a high fraction of petrol cars relative to diesel cars (since the latter are the same in the two scenarios) such as Russia and Ukraine The relative change is smallest for PM emissions due to the very small contribution of the exhaust particles from petrol fuelled cars compared to the contribution from diesel vehicles and wear particles
A comparison of emissions from ethanol and petrol fuelled cars IVL report B1962 Health risk assessment for Vaumlstra Goumltaland
15
Figure 4 National emissions of NOX NMVOC and PM from the road traffic sector in E85 scenario (S2)
relative to lsquoall-petrolrsquo scenario (S1)
An important difference in the emissions between the scenarios lies in the speciation of the NMVOC emissions Figure 5 shows this speciation of NMVOCs for all road traffic emission categories used in this study The two rightmost bars in Figure 5 show the NMVOC speciation for Swedish road traffic emissions for the two scenarios S1 and S2 Comparison with Figure4 shows that the relative changes between the two scenarios are much larger for some individual NMVOC species that for the total NMVOC emissions Since the NMVOC emissions from traffic in Sweden are dominated by the emissions from petrol cars (about 85 of the road traffic emissions of NMVOC comes from petrol cars) the variations in NMVOC speciation between petrol and E85
0
02
04
06
08
1
NOx
0
02
04
06
08
1
NMVOC
0
02
04
06
08
1
Aus
tria
Bel
arus
Bel
gium
Bos
-Her
cB
ulga
riaC
roat
iaC
ypru
sC
zech
Rep
Den
mar
kE
ston
iaFi
nlan
dFr
ance
Ger
man
yG
reec
eH
unga
ryIr
elan
dIt
aly
Lat
via
Lith
uani
aL
uxem
bour
gM
alta
Net
herla
nds
Nor
way
Pola
ndPo
rtug
alR
oman
iaR
ussi
a_E
uro
Slov
ak R
epSl
oven
iaSp
ain
Swed
enSw
itzer
land
Tur
key
Ukr
aine
UK
PM
A comparison of emissions from ethanol and petrol fuelled cars IVL report B1962 Health risk assessment for Vaumlstra Goumltaland
16
will have a significant impact on the total road traffic NMVOC speciation As can be seen in Figure 5 scenario S1 is dominated by alkanes and aromatics while scenario S2 is dominated by ethanol It can also be noted that S1 contains a significant emission of benzene which is much lower in S2 while the opposite is true for acetaldehyde
Figure 5 Distribution of hydrocarbon species in NMVOC emissions from individual road traffic emission
categories as defined in emission scenarios in this study and from the whole road traffic emission sector in Sweden for scenarios S1 (All petrol) and S2 (All E85)
Figure 6 shows a map of the EMEP domain with emissions of acetaldehyde for the two studied scenarios as an example of the geographical distribution of emissions
Figure 6 Gridded emissions of acetaldehyde for the year 2020 (in tonnes per grid cell (50 km x 50 km)
and year) a ndash lsquoAll petrol scenario b ndash lsquoAll E85 scenariorsquo
As mentioned the emissions from road traffic in the Vaumlstra Goumltaland region are calculated in a 500 m x 500 m grid Figure 7 shows the emissions of NOX for 2005 as obtained from the database and the projected emissions for 2020 with a mixed use of E85 and petrol This can be considered as the base case for the emissions in 2020 It can be seen that the emissions decrease over the period which is due to reduction in NOX emissions factors as older vehicles are replaced by newer models (the traffic actually increases from a total of 754x109 vehicle-kilometres in 2005 to 937x109
0
20
40
60
80
100
Pet
rol e
xh
Pet
rol e
vap
E-8
5 ex
h
E-8
5 ev
ap
Pet
rol M
C
Die
sel L
DV
Die
sel H
DV
Roa
d Sw
eden
S1
Roa
d Sw
eden
S2
m
ass
Ethane
Alkanes C3+
Ethene
13 Butadiene
Alkenes C3+
Ethyne
Benzene
Aromatics C7+
Formaldehyde
Acetaldehyde
Aldket C3+
Ethanol
A comparison of emissions from ethanol and petrol fuelled cars IVL report B1962 Health risk assessment for Vaumlstra Goumltaland
17
vehicle-kilometres in 2020) The major roads in the region are clearly visible as well as the larger cities (especially Gothenburg)
Figure 7 Emissions of NOX (kgyear for a 500 m x 500 m grid cell) in the Vaumlstra Goumltaland region for 2005
and for 2020 for the base case
In Table 4 the traffic emissions for NOX benzene acetaldehyde ethanol and PM10 for the Vaumlstra Goumltaland region are shown for the four different emissions scenarios The emissions of NOX and benzene are reduced between 2005 and 2020 for the base case while the emissions of ethanol and acetaldehyde increase due to an expected increase in the use of ethanol fuel The NOX emissions for S1 are somewhat higher than for S2 due to the higher NOX emissions factor for petrol compared with E85
Table 4 Emissions from traffic for the Vaumlstra Goumltaland region in four different emission scenarios (in tonnesyear)
Substance base 2005 base 2020 S1 S2 NOX 13 243 4 843 4 954 4 631 Benzene 2 833 927 1 201 386 Acetaldehyde 628 1 074 305 2 595 Ethanol 192 5 192 0 15 400 PM10 1 324 486 483 476
33 Dispersion modelling
Resulting concentrations from calculations of the S1 and S2 scenarios with the EMEP model are used to provide input of primary and secondary air pollutants for the calculations with the TAPM model for the Vaumlstra Goumltaland region Concentrations of NOX NMVOC PM25 PM10 acetaldehyde ethanol and benzene are therefore calculated as boundary conditions for the Vaumlstra Goumltaland region In addition sensitivity studies are performed to investigate the role of formation of secondary acetaldehyde and secondary particulate matter (see Appendix 2) Time series analysis of the TAPM and EMEP model results of the S1 and S2 scenarios are presented in Figure 8
A comparison of emissions from ethanol and petrol fuelled cars IVL report B1962 Health risk assessment for Vaumlstra Goumltaland
18
a)
b)
Figure 8 Time series analyses of S1 and S2 scenarios for the EMEP and TAPM modelled concentrations of NOX and ozone at an urban background site in Gothenburg (TAPM) and in EMEP model grid cells including Gothenburg city (50 km x 50 km)
Concentrations of NOX and ozone at an urban background site in Gothenburg (TAPM) and in the 50 km x 50 km EMEP grid cells including Gothenburg are compared for one summer and one winter month Due to the well-known process of ozone titration by freshly emitted nitrogen monoxide (Seinfeld and Pandis 1998) the concentration of ozone often decreases in urban areas This phenomenon is expected to be captured by the fine-gridded TAPM model but not necessarily by the courser scale of the EMEP model Figure 8 shows the generally higher NOX levels in the small grid cell of the TAPM model in urban background location comparing to those in the large EMEP grid cell while the opposite is observed for the ozone concentrations (Remember that the boundary concentrations for TAPM are obtained from the EMEP model and they are thus the same in both cases) This indeed shows that local scale emissions and processes contribute to locally increased levels of NOX in urban areas both for the summer and the winter cases For ozone where there of course are no primary emissions the situation is the opposite where instead the result is decreased concentration levels at urban sites on a local scale The influence of the
A comparison of emissions from ethanol and petrol fuelled cars IVL report B1962 Health risk assessment for Vaumlstra Goumltaland
19
NMHC emissions from the passenger cars is studied in a sensitivity analysis (see Appendix 23) and it is found to have only a small influence on the ozone levels
To illustrate the results of the different scenario calculations the geographically distributed concentrations are presented as the difference in yearly average concentrations between the all E85 (S2) and all petrol (S1) scenarios both as microgm3 and sometimes as percentage of the difference to scenario S1 (see Appendix 3)
The difference in yearly average concentrations between scenario S1 and S2 for acetaldehyde and benzene can be seen in Figures 9 and 10 respectively The increase in acetaldehyde concentration resulting from a switch from petrol to E85 is up to about 05 gm3 or 80 in the central parts of the largest urban area of the region Gothenburg Outside this area the relative increase is about 10 for the other urban areas and less than that for the rural areas This large relative increase (see map in Appendix 4) is a result of the relatively high emissions of acetaldehyde from E85 fuelled cars For benzene the situation is opposite In the scenarios for 2020 the concentration of benzene decreases by up to a few tenths of gm3 as a result of a switch from petrol to E85 For benzene the relative change is not calculated
Figure 9 The difference in yearly average concentrations of acetaldehyde for 2020 between the all E85 (S2) and all petrol (S1) scenarios (microgm3)
A comparison of emissions from ethanol and petrol fuelled cars IVL report B1962 Health risk assessment for Vaumlstra Goumltaland
20
Figure 10 The difference in yearly average concentrations (gm3) of benzene for 2020 between the all E85 (S2) and all petrol (S1) scenarios
The difference in the calculated NOX NO2 and ozone concentrations between the two scenarios are shown in Appendix 4 The change in NOX concentration between the two scenarios only represents a small fraction of the total NOX concentration This is because the emissions of NOX from petrol cars are relatively low compared with the contribution from diesel engines and other sources Thus the resulting decrease in the NOX concentration with E85 is only up to 3 For ozone there is a small increase of about 01 microgm3 of E85 in the central areas of Gothenburg where there is relatively high traffic intensity (see Appendix 4 Figure A9) In the rest of the region there is a small decrease in the ozone concentration in the E85 scenario
34 Exposure
The resulting concentrations from the dispersion modelling together with the population density distribution are used to assess the exposure to acetaldehyde benzene NO2 NOX and ozone for the two scenarios S1 and S2 The exposure to PM25 is very similar for the two scenarios (the difference in concentration between scenarios S2 and S1 is only about -002 gm3 Table 5 shows the population weighted mean exposure both as total concentrations and as the difference between the two scenarios Detailed exposure results can be found in Appendix 5 It can be seen that the exposure to all the pollutants in Table 5 with the exception of acetaldehyde are somewhat lower for the all E85 scenario (S2) than for the all petrol scenario (S1) However the effect on health also
A comparison of emissions from ethanol and petrol fuelled cars IVL report B1962 Health risk assessment for Vaumlstra Goumltaland
21
depends on the level of the dose-response functions For example if the level of concentration is low in a populated area but the dose-response function is high the effect of even a low concentration increase can become important The increase in exposure from S1 to S2 (S2-S1) calculated as percentage of the population exposed to increased mean concentrations of pollutants is presented in Figure 11
Table 5 Populated weighted mean exposure (gm3)
S1 S2 S2-S1 Acetaldehyde 065 077 014 Benzene 01 005 -007 NOX 85 84 -012 Ozone 570 569 -012 PM25 270 268 -002
Increased concentrations Decreased concentrations Both increased and
decreased conc
Figure 11 The relative exposure (S2-S1) calculated as percentage of the population
In Figure 11 it is clear that the only pollutant that does not show an improvement regarding air quality and thus the health risks when modelling a switch from petrol to E85 is acetaldehyde For all pollutants except for ozone the changes of concentration levels observed between the scenarios are within the urban areas but for ozone there are also differences in rural areas
According to the data in Figure 11 about 14 of the population in the Vaumlstra Goumltaland region will be exposed to 03-08 microgm3 higher concentration levels of acetaldehyde in scenario S2 relative to S1 From Figure 9 it can be seen that the majority of these people live within the Gothenburg area Further about 28 of the population will be exposed to increased levels of between 01 to 03 microgm3 mainly in the suburban areas and rural surroundings of Gothenburg but also in some of the smaller cities in the region Outside the urban areas the concentration difference is lower than 01 microgm3
In the S2 scenario relative to the S1 scenario the population is exposed to decreased concentration levels of benzene and NOX This is mainly true also for O3 but with an exception for the central
A comparison of emissions from ethanol and petrol fuelled cars IVL report B1962 Health risk assessment for Vaumlstra Goumltaland
22
parts of Gothenburg where the concentration actually increases (see Appendix 4 Figure 7A) resulting in that 3 (blue area in Figure 11 for O3) of the population will be exposed to higher concentrations of O3 For the rest of the area there are decreased concentrations of ozone upon a switch to E85
The largest differences are again in the central parts of Gothenburg where about 20 of the population is being exposed to a lower benzene concentration of 01-03 microgm3 This also means that concerning benzene the majority (78) of the population have none or very low influence from a change to ethanol fuel
The largest effect on exposure difference is seen for NOX where just over 20 of the population has its exposure decreased with 03-05 microgm3 (in the central parts of Gothenburg) In the suburbs the decrease is between 01-02 microgm3 lower Along the largest roads there is a small but visible improvement on a yearly basis of 01 microgm3
For PM25 there is a difference in the populated weighted mean exposure of 002 gm3 between the scenarios with a lower value for the all-E85 case (see also Appendix 5)
35 Impact on health in Vaumlstra Goumltaland
351 NO2 and NOX
The impact of long-term exposure on mortality was estimated using the relative risk from the Norwegian cohort study (Nafstad et al 2004) reporting a relative risk of 08 increase per microgm3 increase in NOX however without adjustment for particle concentrations Assuming this effect on the total mortality and a typical baseline mortality of 1000 deaths per 100 000 person years a decrease in the population mean exposure of 012 microgm3 would correspond to approximately 104 less preterm deaths per year However for the present case this number is highly uncertain since the exposure to substances normally associated with changes in NOX exposure may here change in different ways since the relation between different exhaust components varies between the scenarios
The impact of long-term exposure on asthma incidence (new cases) in adults has been estimated using results from the Swedish RHINE Study Cohorts (Modig et al 2009) with very similar results in the ECRHS Study corresponding to approx 4 increase per microgm3 increase in NO2 From the RHINE Study the incidence can be estimated to 03 per year (proportion of adults developing the disease) with children and elderly excluded this means around 1500 adult cases per year A reduction of 009 microgm3 corresponds to 54 avoided new cases of adult asthma per year However also NO2 in the asthma study may have been mainly an indicator of vehicle exhaust
352 Ozone
The impact of long-term exposure on respiratory mortality has been reported to be approx 02 per microgm3 increase in the summer concentration when studied in the large ACS Cohort (Jerret et al 2009) Assuming this effect on the total population and a typical baseline respiratory mortality of 100 deaths per 100 000 person years a decrease in the population mean exposure of 012 microgm3 corresponds to approximately 03 less preterm deaths per year
A comparison of emissions from ethanol and petrol fuelled cars IVL report B1962 Health risk assessment for Vaumlstra Goumltaland
23
353 Acetaldehyde
According to US EPA (1999) a lifetime risk for cancer of 0000002 per microgm3 is to be assumed for this potential human carcinogen An increase in the population mean exposure of 012 microgm3 corresponds to 026 cases more per year in the current population
354 Benzene
According to US EPA (1999) a lifetime risk for cancer (leukaemia) of 00000022-00000078 per microgm3 is to be assumed for this human carcinogen A decrease in the population mean exposure of 0074 microgm3 corresponds to approximately 03 cases less per year in the current population (assuming 0000004 per microgm3)
355 PM25
In CAFEacute and other impact assessments a relative risk of 6 increase in all-cause mortality per 10 microgm3 has usually been assumed Assuming this effect on the total mortality and a typical baseline mortality of 1000 deaths per 100 000 person years a decrease in the population mean exposure of 002 microgm3 corresponds to approximately 13 less preterm deaths per year
4 Discussion
In this study the health risks from a large introduction of E85 to replace petrol is analysed in scenario studies for 2020 for the Vaumlstra Goumltaland region It is found that the change in pollutant concentration exposure and health risks are small between the two scenarios It should be emphasized that the study only considers vehicle emissions and does not take into account effects from the fuel production
The emissions of NOX in the model are somewhat lower from E85 fuelled cars than from petrol fuelled cars This is in line with the emission factors used by Jacobson (2007) The nitrogen oxides are key substances in the atmospheric reactions determining the concentrations of ozone in air NOX is involved in the formation of ozone but close to the NO source the ozone concentration is lowered due to the rapid reactions between NO and O3 forming NO2 If NO is released in an environment with already high NO concentration it may result in lowering of ozone levels on the regional scale In the present study the ozone concentrations calculated are somewhat lower for the E85 scenario than for the petrol scenario
The health risk analysis shows that the main difference between the scenarios is due to the lower concentration of NOX However it may have been other exhaust components than NOX such as exhaust particles that were behind the reported association with mortality In cases when NOX is not a good indicator of exhaust particle emissions and their toxicity our results may be misleading This should be studied further Neglecting the effects of the changes in NOX exposure the total difference between the scenarios sums up to 16 preterm deaths per year with lower values for the E85 scenario while it would sum up to 12 less preterm deaths for the E85 scenario if the effect related to NOX were included Since there are no similar studier for the effect on mortality among those younger than 30-50 years of age we assume the same relative effect on mortality in all ages This makes only a small difference since the large majority of deaths occur in older groups
A comparison of emissions from ethanol and petrol fuelled cars IVL report B1962 Health risk assessment for Vaumlstra Goumltaland
24
The opposite result for the ozone concentration was obtained by Jacobson The reason for this discrepancy is that the Jacobson study concerns Los Angeles a region with high concentrations of pollutants while the study here concerns the Vaumlstra Goumltaland region with much less dense traffic and also lower concentrations of pollutants importantly NOX It is not unlikely that the effect that Jacobson report also would be found for large parts of Europe with higher traffic densities than in the Vaumlstra Goumltaland region
It is worth to emphasize that the major negative health effect in the Jacobson (2007) study is attributed to the increase in ozone concentration that is a result of the decrease of the NO emissions from E85 cars Directly after the emission NO reacts with ozone resulting in drop of the ozone concentration the so-called ozone titration commonly observed in many cities This NO does however form even higher quantities of ozone further downwind contributing to the general increase in the background ozone levels It is also precursor of NO2 secondary PM and other toxic species as eg PAN and hence reductions in NO emissions are never regarded as disbeneficial from the environmental viewpoint
There are of course several sources of uncertainties that influence the results of this study Since the main results concern differences between the two scenarios several of these factors loose on importance for the conclusions This comprises uncertainties in meteorology in future traffic volumes and in the population density distribution However there are some uncertainties that remain important The emission factors for E85 fuelled cars are much less characterised than what they are for petrol cars The emission of particles from E85 fuelled cars is especially uncertain with only very few published results Also the emissions of NMHC are somewhat uncertain and may be higher for E85 at lower ambient temperatures However the sensitivity analysis performed shows that for the studied region the NMHC emissions only have a small influence on the ozone concentrations
5 Conclusions
In this study the impact of tailpipe and evaporative emissions from E85 fuelled cars on air pollution and health risks are calculated and compared with petrol fuelled cars The scenario calculations for the Vaumlstra Goumltaland Region give data on emissions pollutant concentrations exposure and a health risk evaluation
The differences in emission factors between E85 and petrol lies in the emissions of PM and NOX which are about 65 and 58 for E85 relative petrol respectively Also the speciation of the emitted hydrocarbons is significantly different with large emissions of acetaldehyde and ethanol from E85 and large emissions of benzene higher aromatics alkanes and alkenes from petrol
These differences in emission factors reflect in differences in emissions The emission calculations for all Swedish road traffic show a decrease for the E85 scenario relative to the petrol scenario of 65 for NOX 34 for PM25 67 for benzene For acetaldehyde there is an increase of 770
The differences obtained from the TAPM modelling show decreased levels of NOX ozone and benzene with E85 and increased levels of acetaldehyde For the latter the increase may be up to 80 while NOX and ozone show decreases of up to a few per cent and a few tenths of per cent respectively
A comparison of emissions from ethanol and petrol fuelled cars IVL report B1962 Health risk assessment for Vaumlstra Goumltaland
25
The health risk assessment shows decreased health risks in the E85 scenario relative the all-petrol scenario due to the increased NOX exposure correlated with both preterm deaths and asthma However NOX may be mainly an exhaust indicator Smaller effects are expected from the changes in ozone acetaldehyde and benzene exposure The overall difference considering the exposure to PM acetaldehyde benzene and ozone is 16 preterm deaths with lower values for the E85 scenario
6 Acknowledgements
Saab Automobile The Swedish Transport Administration and The Foundation for the Swedish Environmental Research Institute are gratefully acknowledged for financial contribution
Magnus Ekstroumlm and Maria Holmstroumlm at Saab and Martin Juneholm at the Swedish Transport Administration are acknowledged for their most valuable input to the study
David Simpson Norwegian Meteorological Institute EMEP MSC-W Norway and Dept Radio amp Space Science Chalmers Univ Technol Sweden is gratefully acknowledged for help with implementation of the Unified EMEP model
A comparison of emissions from ethanol and petrol fuelled cars IVL report B1962 Health risk assessment for Vaumlstra Goumltaland
26
7 References
Altenstedt J Pleijel K 2000 An alternative approach to photochemical ozone creation potentials under European conditions J Air amp Waste Manage Assoc 50 1023 ndash 1036
Andre J-M (2005) Vehicle emission measurement collection of the ARTEMIS datatbase Artemis 3312 report Available from httpwwwinretsfrurltepublicationspublications-pdfJoumardA3312reportJMALTE0504pdf
Bachand A MMundt K A Mundt D JMontgomery R R Epidemiological studies of formaldehyde exposure and risk of leukemia and nasopharyngeal cancer A meta-analysis Critical Reviews in Toxicology 2010 40(2) 85ndash100
Beane Freeman L E Blair A Lubin J H Stewart P A Hayes R B Hoover R N Hauptmann M Mortality from lymphohematopoietic malignancies among workers in formaldehyde industries The National Cancer Institute Cohort J Natl Cancer Inst 2009101751ndash761
Bosetti C McLaughlin J K Tarone R E Pira E LaVecchia C Formaldehyde and cancer risk A quantitative review of cohort studies through 2006 Ann Oncol 20081929ndash43
ConcaweJRC Well-to-wheel studies httpiesjrceceuropaeuwtwhtml
Derwent R G Jenkin M E Saunders S M 1996 Photchemical ozone creation potentials for a large number of reactive hydrocarbons under European conditions Atmos Environ 30 181 ndash 199
Derwent RG Jenkin ME Passant NR Pilling MJ 2007 Photochemical ozone creation potentials (POCPs) for different emission sources of organic compounds under European conditions estimated with a Master Chemical Mechanism Atmos Env 41 2570ndash2579
EEA Copenhagen 2009 wwweeaeuropaeudata-and-mapsdatapopulation-density-disaggregated-with-corine-land-cover-2000-2
Ericsson P Holmstroumlm M Amberntsson-Carlsson A Ohlson C Skoglundh M Andersson B Carlsson P-A 2008 Characterization of particulate emissions and methodologhy for oxidation of particulates from non-diesel combustion ystems SAE Technical Paper Series 2008-01-1746
GAINS 2010 httpgainsiiasaacatindexphpgains-europe
Graham LA Belisle SL Baas C-L Emissions from light duty gasoline vehicles operating on low blend ethanol gasoline and E85 Atmospheric Environment 42 4498 (2008)
Haskew H M Thomas P E Liberty F 2006 Fuel Permeation From Automotive Systems E0 E6 E10 E20 And E85 Final Report CRC Project No E-65-3 Coordinating Research Council Inc 3650 Mansell RoadSuite 140Alpharetta GA 30022
HEI Air Toxics Review Panel (2007) Mobile-Source Air Toxics A Critical Review of the Literature on Exposure and Health Effects HEI Special Report 16 Health Effects Institute Boston USA
Hurley P TAPM v 4 User Manual 2008 CSIRO ISBN 978-1-921424-73-1
IARC (2006) IARC Monographs on the Evaluation of Carcinogenic Risks to Humans Wood Dusts and Formaldehyde Lyon World Health Organization International Agency for Research on Cancer Lyon France 8837ndash325
Jacobson M Z Effects of Ethanol (E85) versus Gasoline Vehicles on Cancer and Mortality in the United States Environ Sci Technol 2007414150-4157
A comparison of emissions from ethanol and petrol fuelled cars IVL report B1962 Health risk assessment for Vaumlstra Goumltaland
27
Jerret M Burnett R T Pope C A Ito K Thurston G Krewski D Shi Y Calle E Thun M Long-Term Ozone Exposure and Mortality N Engl J Med 20093601085-95
Lipman T E Delucchi M A 2002 Emissions of nitrous oxide and methane from conventional and alternative fuel motor vehicles Climate Change 53 477
Modig L Toreacuten K Janson C Jarvholm B Forsberg B Vehicle exhaust outside the home and onset of asthma among adults Eur Respir J 2009 Jun33(6)1261-7
Nafstad P Haheim L L Wisloff T Gram F Oftedal B Holme I Hjermann I Leren P Urban air pollution and mortality in a cohort of Norwegian men Environ Health Perspect 2004112(5)610-5
OEHHA (1999) Air Toxics Hot Spots Program Risk Assessment Guidelines Part II Technical Support Document for Describing Available Cancer Potency Factors Prepared by the Air Toxicology and Epidemiology Section Office of Environmental Health Hazard Assessment April 1999
Passant NR (2002) Speciation of UK emissions of non-methane volatile organic compounds AEAT report AEATENVR0545 Issue 1 Culham UK
Pope CA III Thun MJ Namboodiri MM Dockery DW Evans JS Speizer FE Heath CJ Particulate air pollution as a predictor of mortality in a prospective study of US adults Am J Resp Crit Care Med 1995 151 669-674
Seinfeld J H and Pandis SN (1998) Atmospheric Chemistry and Physics From Air Pollution to Climate Change John Wiley amp Sons New YorkSimpson D Fagerli H Jonson JE Tsyro S Wind P Tuovinen J -P 2003 Transboundary acidification and eutrophication and ground level ozone in Europe Unified EMEP Model Description EMEP Status Report 12003 Part I EMEPMSC-W Report The Norwegian Meteorological Institute Oslo Norway
US EPA (1999) httpwwwepagovttnatwnata1999nsata1999
Vestreng V et al 2004 Inventory Review 2004 Emission data reported to CLRTAP and the NEC Directive EMEPEEA Joint Review Report EMEPMSC-W Note 1
Westerholm R Ahlvik P Karlsson HL An exhaust characterisation study based on regulated and unregulated emissions from bi-fuel and flexi-fuel light-duty passanger cars fuelled by petrol (E5) bioethanol (E70 E75) and biogas tested at ambient temperatures of +22degC and -7degC 2008
Wolkoff P Nielsen G D Non-cancer effects of formaldehyde and relevance for setting an indoor air guideline Environment International 201036788ndash799
Yanowitz J McCormick RL Effect of E85 on tailpipe emissions from light-duty vehicles J Air amp Waste Manage Assoc 59 172 (2009)
A comparison of emissions from ethanol and petrol fuelled cars IVL report B1962 Health risk assessment for Vaumlstra Goumltaland
28
Appendix 1 Evaporate emissions of NMHC
The following assumptions are done for evaporative emissions The NMHC emissions from E85 are reduced relative to petrol by 45 Methane emissions are zero and the split of NMHC species is 68 ethanol and the remaining 32 is divided in the same way as evaporative emissions for petrol The estimates by Graham et al (2008) are missing evaporative emission data however these assumptions agrees very well with measurements of evaporative emissions due to fuel permeation reported by Haskew et al (2006) where NMHC emissions are reported to be reduced by 50 for E85 fuel compared to petrol Haskew et al also presents the NMHC split to species with 60 ethanol This number agrees quite well with our assumption of 68 NMHC being ethanol NMHC in exhaust and evaporative emissions are thus divided as in Table A1
Table A1 Division of NMHC in the exhaust and evaporative emissions for E85 and petrol respectively (wt)
E85 Petrol E85 Petrol exhaust exhaust evaporative evaporative
Ethanol 680 0 680 0 Acetaldehyde 131 08 02 0 Ethene 99 73 24 0 Ethyne 03 28 09 0 Formaldehyde 31 17 06 0 Benzene 16 56 18 10 13 Butadiene 03 09 03 0 sum 963 191 741 10
The remaining NMHC emissions are divided as for petrol (ref) and listed in Table A2
Table A2 Division of NMHC in the exhaust and evaporative emissions for E85 and petrol respectively (wt)
E85 Petrol E85 Petrol exhaust exhaust evaporative evaporative
Ethane 02 32 10 0 Alkanes (C3+) 13 278 89 880 Alkenes (C3+) 04 90 29 95 Aromatics (C7+) 18 388 125 15 Aldehydesketones (C3+)
01 15 05 0
A comparison of emissions from ethanol and petrol fuelled cars IVL report B1962 Health risk assessment for Vaumlstra Goumltaland
29
Appendix 2 Description of the model system
A21 Atmospheric lifetimes
Table A3 gives tropospheric lifetimes with regard to reaction of ethanol formaldehyde acetaldehyde and benzene (C6H6) with OH nitrate radical (NO3) and photolysis The studied organic species are listed together with three species common in the gasoline exhaust (benzene ethene and toluene) for comparison Table 11 shows also photochemical ozone creation potential (POCP) of these species POCP is a measure of amount of ozone that is formed from a certain VOC emission relatively to other emission source which has been established to the same emission mass of ethene (Derwent et al 1996 Altenstedt et al 2000) The range represents different scenarios for VOC and NOX background concentrations Derwent et al (2007) used similar methodology to calculate POCP of different VOC sources and calculated POCP of mean road emission exhaust to be 69
Table A3 Atmospheric lifetimes of studies NMVOC species with respect to the OH- and NO3- initiated
degradation τ(OH) and τ(NO3) and with respect to the photolysis (The lifetime of a chemical species which decays in a first-order process is the time needed for a concentration of this species to decrease to 1e of its original value Statistically it represents the mean life expectancy of an excited species) The OH concentration of 1times106 moleculescm3 typical for summer troposphere was used for the lifetime calculation The NO3 concentrations of 5 and 100 ppt(V) were used for lifetime calculations as representative of rural and urban night-time 12 hrs mean concentration The studied organic species are listed together with 3 species common in the gasoline exhaust for comparison The rates of photolysis were calculated with radiation transfer model for July 58ordm latitude and integrated over 24 hours
τ(OH) τ(NO3) urbanrural τ (photolysis) POCP
hr hr hr
Ethanol 85 56 1times103 - 44 - 63
Acetaldehyde 15 47 1times103 86 68 - 80
Formaldehyde 30 194 4times103 10 18 - 55
Benzene 214 - - 23 - 47
Ethene 34 - - 100
Toluene 50 - - 30 - 67
A22 Defining of boundary concentrations for TAPM from EMEP fields
Calculation of initial concentration field for TAPM from EMEP concentration field of NO2 (as example) and EMEP mean wind vector components u_mid and v_mid Two EMEP model gridcells (i=56 j=60 and i=56 j=61) represent the TAPM model domain and concentrations from the surrounding EMEP gridcells SE-S SE-N NW-S NW-N NE NW (Figure A1) are used for calculation of boundary concentration NO2(bc) according to the following code if u_mid lt= 0 then ( isite = SE-S and jsite = SE-N) else isite = NW-S and jsite = NW-N) endif
A comparison of emissions from ethanol and petrol fuelled cars IVL report B1962 Health risk assessment for Vaumlstra Goumltaland
30
if v_mid lt= 0 then ( ksite = NE) else ksite = SW endif NO2(bc) = [(NO2(isite)u_mid(isite) + NO2(jsite)u_mid(jsite))2 + NO2(ksite)v_mid(ksite)] [(u_mid(isite) + u_mid(jsite))2 + v_mid(ksite)]
Figure A1 Gridcells covering Gothenburg domain and its boundary in EMEP model plotted on latitude-
longitude coordinates The red square represents centre of Gothenburg and the blue line the coastline EMEP i and j coordinates for the boundary gridcells are SE-S = 57-60 SE-N = 57-61 NW-S = 55-60 NW-N = 55-61 NE = 56-62 NW = 56-59 and for Gothenburg grid cells are Gbg-NE = 56-61 Gbg-SW = 56-60
A23 Atmospheric chemistry
The role of secondary chemistry in for the concentration of acetaldehyde are studied by first excluding the primary acetaldehyde emissions from the EMEP model simulations of scenarios S1 and S2 and then by excluding all NMVOC emissions from the car category with spark ignition engines The contribution from the primary acetaldehyde emissions as well as the contribution of secondary acetaldehyde formed from other NMVOC to the total acetaldehyde concentration is then obtained However the secondary chemistry is highly nonlinear due to the interactions of NMVOCs with ozone and OH and thus the results for the contribution of secondary acetaldehyde are somewhat uncertain Differences in acetaldehyde concentrations between S1 and S2 scenarios are studied with respect to contribution of primary and secondary acetaldehyde It is observed that in summer background air the monthly mean contribution of the secondary acetaldehyde is of the same magnitude as the contribution of the primary acetaldehyde to the difference between S1 and
565
57
575
58
585
105 115 125 135 145
Long
Lat
Gbg-SW
Gbg-NE
SE-S
NW-N
NW-S
SE-N
SW
NE
55-59
57-59
55-62
A comparison of emissions from ethanol and petrol fuelled cars IVL report B1962 Health risk assessment for Vaumlstra Goumltaland
31
S2 In the winter and in more polluted atmosphere (Gothenburg grid cells) the contribution from secondary acetaldehyde to the concentration difference appears to be negative due to the chemistry feedback ie the E-85 scenario has less secondary acetaldehyde than the all-petrol scenario
A comparison of S2-S1 differences in primary and secondary acetaldehyde concentrations in the background (=upwind) and Gothenburg grid cells show no increase in the secondary acetaldehyde from upwind to the Gothenburg grid cell It can thus be concluded that there is no significant contribution from secondary aldehydes on the small scale (tenths of km) Conclusion from this sensitivity study is that the secondary formaldehyde can be of importance under summer in the clean background air but that formation on the local scale is unimportant Using EMEP simulated boundary concentrations of acetaldehyde in the local scale model and simulating the primary acetaldehyde emissions will capture the most important features of acetaldehyde dispersion and chemistry in Vaumlstra Goumltaland
In the EMEP model the tail-pipe PM emissions are specified as primary particles Emissions of NOX and VOCs (and NH3 SO2) are oxidised in the atmosphere and a part is then transferred through the gas-to-particle transport to the PM as secondary PM The petrol fuelled cars emit both more primary PM and more NOX compared to the E85 cars If we compare differences in primary and secondary PM between the S1 and S2 scenarios simulated by EMEP we can directly see what part of the difference is from the tail-pipe emissions of the primary particles and what part is from the formation of the secondary PM in atmosphere (mostly from higher emissions of NOX) Table A4 shows the differences between S1 and S2 (S1-S2) of monthly PM averages for January and June (two months with low and high photochemical activities respectively) It can be seen that the higher formation of secondary PM in the S1 (all-petrol) scenario is more important than the higher tail-pipe emission of primary PM by factor 10 - 20
When we compare simulated PM differences between S1-S2 for the background air (=upwind) grid cells and for grid cells including Gothenburg (50 km x 50 km scale) we can see significant increase in primary PM in the S1 scenario from the upwind grid cells to Gothenburg (746 in winter 132 in summer) while no systematic increase can be seen for the secondary PM (-42 in winter +24 in summer) From this comparison it can be concluded that no systematic increase in secondary PM can be seen (in difference from the primary PM) on the scale of 50-100 km and we can neglect this process on the small scale However the overall change in PM concentrations due to the switch of the fuel is very small both on the large scale and on the small scale as can be seen when the differences in PM concentrations between S1 and S2 are compared to absolute PM concentrations in S1 presented in the last column of Table A4
Table A4 Differences in primary and secondary PM concentrations between the lsquoAll-petrolrsquo (S1) and lsquoE-85rsquo (S2) scenarios simulated in gridcells upwind Gothenburg and in gridcells including Gothenburg (2 50 km x 50 km gridcells)
S1-S2 Background
S1-S2 Gothenburg
Increase S1-S2 Gothenburg
S1 Background
μgm3 μgm3 μgm3 bkgnd μgm3
Prim PM10 Jan 00008 00014 00006 746 084
Jun 00008 00018 00010 1319 084
Sec PM10 Jan 00155 00148 -00006
-42 157
Jun 00080 00081 00002 24 213
The sensitivity of the used emission factors for NMHC with respect to the ozone formation in the region of the Swedish West Coast can be analysed with the help of results from studying the
A comparison of emissions from ethanol and petrol fuelled cars IVL report B1962 Health risk assessment for Vaumlstra Goumltaland
32
formation of secondary acetaldehyde In this study first all primary acetaldehyde emitted by the E85 fleet are omitted in a model simulation (S2_nopAA) and secondly all NMHC emissions from the E-85 fleet are switched off (S2_noVOC) Acetaldehyde has a somewhat higher though still comparable photochemical ozone creation potential compared to ethanol (ethanol 44-63 acetaldehyde 68-80 Altenstedt and Pleijel 2000) and this simulation will thus also give information on the sensitivity of the calculations to uncertainties in the ethanol emissions Setting the emission factor for NMHC to zero gives the sensitivity to the emission factor of total NMHC Figure A2 shows the differences in ozone concentration as a result of acetaldehyde only and the total NMHC from the E85 car fleet (S2 scenario) We can see that the effect on ozone formation is very small for the Swedish West coast The reason is that the ozone formation in this area is controlled by the availability of NOX while NMHC or rather their degradation products the peroxy radicals that serve as a lsquofuelrsquo to ozone formation are usually in excess here and further VOC emissions do not increase ozone concentrations significantly The situation looks different in areas that are more heavily polluted with NOX andor which is limited in the availability of peroxy radicals The results from this sensitivity study are fully consistent with the observed increase in ozone concentrations as a result of lower NO emissions (the so-called ozone titration) only very close to the major roads but no larger-scale decrease in ozone concentrations in the Gothenburg area or in any other communities
Figure A2 Sensitivity of the ozone formation in the 2 EMEP model grid cells covering Gothenburg (blue) and in the 6 surrounding grid cells (red see Fig A1) to changes in NMHC emission factor of the E85 fuelled cars lsquobasersquo is simulation S2 with EF for NMHC as in Table 3 lsquonoVOCrsquo is S2 with EF for all NMHC = 0 lsquonopAArsquo is S2 with EF for acetaldehyde = 0 a ndash Mean sensitivity in January absolute difference in ozone formation in ppb(V) as a result of NMHC (base-noVOC) and acetaldehyde (base-nopAA) emissions b ndash Sensitivity relative to ozone concentration in the S2-base simulation January c ndash same as a) but June d ndash same as b) but June
‐002
‐001
0
001
base‐noVOC base‐nopAA
ΔO3(ppb)
a)
0
001
002
base‐noVOC base‐nopAA
ΔO
3(ppb)
c)
‐010
‐005
000
005
base‐noVOC base‐nopAA
ΔO
3
b)
000
002
004
006
base‐noVOC base‐nopAA
ΔO
3
d)
A comparison of emissions from ethanol and petrol fuelled cars IVL report B1962 Health risk assessment for Vaumlstra Goumltaland
33
Appendix 3 Emission results
The geographically distributed NOX and acetaldehyde emissions for the Vaumlstra Goumltaland region are presented in Figures A3 and A4 respectively
Figure A3 NOX emissions for the Vaumlstra Goumltaland region for the All Petrol scenario
A comparison of emissions from ethanol and petrol fuelled cars IVL report B1962 Health risk assessment for Vaumlstra Goumltaland
34
Figure A4 Acetaldehyde emissions for the Vaumlstra Goumltaland region for the All Ethanol scenario
A comparison of emissions from ethanol and petrol fuelled cars IVL report B1962 Health risk assessment for Vaumlstra Goumltaland
35
Appendix 4 Dispersion modelling results
The difference in yearly average concentration between scenario S1 and S2 for acetaldehyde and benzene can be seen in Figure A5 and Figure A6 respectively a)
b)
Figure A5 The difference in yearly average concentrations of acetaldehyde for 2020 between the all E85 (S2) and all petrol (S1) scenarios presented as a) microgm3 and as b) percentage for the Gothenburg area
A comparison of emissions from ethanol and petrol fuelled cars IVL report B1962 Health risk assessment for Vaumlstra Goumltaland
36
a)
b) all E85 c) all petrol
Figure A6 a) the difference in yearly average concentrations (gm3) of benzene for 2020 between the all E85 (S2) and all petrol (S1) scenarios yearly means for b) all E85 and c) all petrol (note the different scales)
The difference in the calculated NOX NO2 and ozone concentrations between the two scenarios are shown in Figures A7 A8 and A9
A comparison of emissions from ethanol and petrol fuelled cars IVL report B1962 Health risk assessment for Vaumlstra Goumltaland
37
a)
b)
Figure A7 The difference in yearly average concentrations of NOX for 2020 between the all E85 (S2) and all petrol (S1) scenarios presented as a) microgm3 and as b) percentage for the Gothenburg area
A comparison of emissions from ethanol and petrol fuelled cars IVL report B1962 Health risk assessment for Vaumlstra Goumltaland
38
a)
Figure A8 The difference in yearly average concentrations of NO2 for 2020 between the all E85 (S2) and all petrol (S1) scenarios presented as a) microgm3 and as b) percentage for the Gothenburg area
A comparison of emissions from ethanol and petrol fuelled cars IVL report B1962 Health risk assessment for Vaumlstra Goumltaland
39
a)
b)
Figure A9 The difference in yearly average concentrations of ozone for 2020 between the all E85 (S2) and all petrol (S1) scenarios presented as a) microgm3 and as b) percentage for mainly the Gothenburg area
A comparison of emissions from ethanol and petrol fuelled cars IVL report B1962 Health risk assessment for Vaumlstra Goumltaland
40
Appendix 5 Detailed Exposure data
Detailed exposure data for the difference between the all E85 (S2) and the all petrol (S1) scenarios can be found in Table A5
Table A5 Exposure data for the difference between the all E85 (S2) and the all petrol (S1) scenarios
Acetaldehyde diff E-P (microgm3)
Populated weighted mean
Number of people Percentage of population
0 - 01 627198 582 01 - 02 163394 152 02 - 03 134879 125 03 - 04 88099 82 04 - 05 38686 36 05 - 06 16880 16 06 - 07 7983 07 07 - 08 1248 01 Tot 014 1078367 Benzene diff E-P (microgm3)
Populated weighted mean
Number of people Percentage of population
-03 - -02 26680 25 -02 - -01 205757 191 -01 - -0 845930 784 Tot -0074 1078367 NO2 diff E-P (microgm3) Populated weighted
mean Number of people Percentage of
population -04 - -03 7698 07 -03 - -02 50131 46 -02 - -01 296288 275 -01 - -0 724250 672 Tot -009 1078367 NOX diff E-P (microgm3) Populated weighted
mean Number of people Percentage of
population -06 - -05 7698 -05 - -04 19639 18 -04 - -03 36626 34 -03 - -02 161685 150 -02 - -01 186500 173 -01 - -0 666219 618 Tot -012 1078367 O3 diff E-P (microgm3) Populated weighted
mean Number of people Percentage of
population -02 - -01 779132 723 -01 - -0 266417 247 0 - 01 32818 30 Tot -012 1078367
Exposure data for the total levels in the two scenarios can be found in Table A6
A comparison of emissions from ethanol and petrol fuelled cars IVL report B1962 Health risk assessment for Vaumlstra Goumltaland
41
Table A6 Exposure data for the total levels in the two scenarios
Acetaldehyde tot All ethanol (microgm3)
Populated weighted mean
Number of people Percentage of population
06 - 07 568825 527 07 - 08 171845 159 08 - 09 124551 115 09 - 10 100946 94 10 - 11 59235 55 11 - 12 30559 28 12 - 13 13175 12 13 - 14 7983 07 14 - 15 1248 01 Tot 077 1078367 Acetaldehyde tot All petrol (microgm3)
Populated weighted mean
Number of people Percentage of population
05 - 06 45111 42 06 - 07 1032008 957 07 - 08 1248 01 Tot 065 1078367 Benzene tot All ethanol (microgm3)
Populated weighted mean
Number of people Percentage of population
0 - 01 1055961 98 01 - 02 22406 2 Tot 005 1078367 Benzene tot All petrol (microgm3)
Populated weighted mean
Number of people Percentage of population
0 - 01 729093 676 01 - 02 232961 216 02 - 03 94042 87 03 - 04 21023 19 04 - 05 1248 01 Tot 010 1078367 NOX tot All ethanol (microgm3)
Populated weighted mean
Number of people Percentage of population
0-10 779108 722 10-20 254658 236 20-30 28683 27 30-40 11070 10 40-50 3426 03 50-60 0 00 60-70 0 00 70-80 639 01 80-90 0 00 90-100 0 00 100-110 783 01 Tot 84 1078367 NOX tot All petrol (microgm3)
Populated weighted mean
Number of people Percentage of population
0-10 769557 714 10-20 264209 245 20-30 28683 27 30-40 11070 10 40-50 3426 03 50-60 0 00
A comparison of emissions from ethanol and petrol fuelled cars IVL report B1962 Health risk assessment for Vaumlstra Goumltaland
42
60-70 0 00 70-80 639 01 80-90 0 00 90-100 0 00 100-110 783 01 Tot 85 1078367 O3 tot All ethanol (microgm3)
Populated weighted mean
Number of people Percentage of population
40-45 1422 01 45-50 26487 25 50-55 176636 164 55-60 770370 714 60-65 103452 96 Tot 569 1078367 O3 tot All petrol (microgm3)
Populated weighted mean
Number of people Percentage of population
40-45 1422 01 45-50 20229 19 50-55 181876 169 55-60 763361 708 60-65 111479 103 Tot 570 1078367 PM25 tot All ethanol (microgm3)
Populated weighted mean
Number of people Percentage of population
1-2 0 00 2-3 885325 821 3-4 192259 178 4-5 783 01 Tot 268 1078367 PM25 tot All petrol (microgm3)
Populated weighted mean
Number of people Percentage of population
1-2 0 00 2-3 868773 806 3-4 208811 194 4-5 783 01 Tot 270 1078367
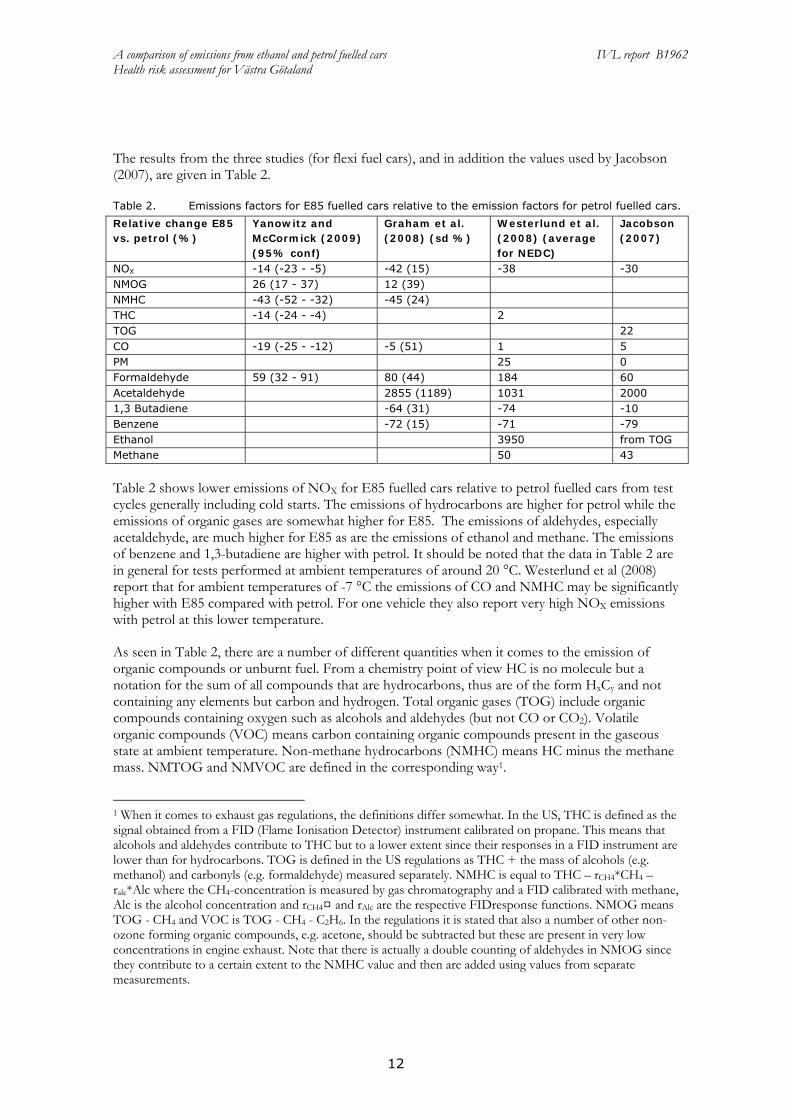
A comparison of emissions from ethanol and petrol fuelled cars IVL report B1962 Health risk assessment for Vaumlstra Goumltaland
14
Table 3 Emission factors (gkm) for 2020 for passenger cars (including evaporative emissions but excluding wear particle emissions) used in the modelling
Petrol E85 NOX 0112 0065 CO 179 174 PM 00013 00008 CH4 0013 0018 NMHC 033 028
division of NMHC Ethanol 00000 01898 Acetaldehyde 00025 00299 Ethene 00244 00237 Ethyne 00094 00011 Formaldehyde 00057 00072 Benzene 00187 00045 13 Butadiene 00030 00009 Ethane 00107 00009 Alkanes C3+ 00928 00076 Alkenes C3+ 00301 00025 Aromatics C7+ 01297 00106 Aldehydesketones C3+ 00051 00004
sum NMHC 03321 02792
32 Emissions
The emissions from road traffic vary between the two scenarios due to the differences in the emission factors From the EMEP modelling the total emissions from road traffic in the different scenarios are calculated for the countries included In Figure 4 emissions of NOX NMVOC and PM in the S2 (E-85) scenario relative to the S1 (all-petrol) scenario are shown for these countries The relative change is larger for countries with a high fraction of petrol cars relative to diesel cars (since the latter are the same in the two scenarios) such as Russia and Ukraine The relative change is smallest for PM emissions due to the very small contribution of the exhaust particles from petrol fuelled cars compared to the contribution from diesel vehicles and wear particles
A comparison of emissions from ethanol and petrol fuelled cars IVL report B1962 Health risk assessment for Vaumlstra Goumltaland
15
Figure 4 National emissions of NOX NMVOC and PM from the road traffic sector in E85 scenario (S2)
relative to lsquoall-petrolrsquo scenario (S1)
An important difference in the emissions between the scenarios lies in the speciation of the NMVOC emissions Figure 5 shows this speciation of NMVOCs for all road traffic emission categories used in this study The two rightmost bars in Figure 5 show the NMVOC speciation for Swedish road traffic emissions for the two scenarios S1 and S2 Comparison with Figure4 shows that the relative changes between the two scenarios are much larger for some individual NMVOC species that for the total NMVOC emissions Since the NMVOC emissions from traffic in Sweden are dominated by the emissions from petrol cars (about 85 of the road traffic emissions of NMVOC comes from petrol cars) the variations in NMVOC speciation between petrol and E85
0
02
04
06
08
1
NOx
0
02
04
06
08
1
NMVOC
0
02
04
06
08
1
Aus
tria
Bel
arus
Bel
gium
Bos
-Her
cB
ulga
riaC
roat
iaC
ypru
sC
zech
Rep
Den
mar
kE
ston
iaFi
nlan
dFr
ance
Ger
man
yG
reec
eH
unga
ryIr
elan
dIt
aly
Lat
via
Lith
uani
aL
uxem
bour
gM
alta
Net
herla
nds
Nor
way
Pola
ndPo
rtug
alR
oman
iaR
ussi
a_E
uro
Slov
ak R
epSl
oven
iaSp
ain
Swed
enSw
itzer
land
Tur
key
Ukr
aine
UK
PM
A comparison of emissions from ethanol and petrol fuelled cars IVL report B1962 Health risk assessment for Vaumlstra Goumltaland
16
will have a significant impact on the total road traffic NMVOC speciation As can be seen in Figure 5 scenario S1 is dominated by alkanes and aromatics while scenario S2 is dominated by ethanol It can also be noted that S1 contains a significant emission of benzene which is much lower in S2 while the opposite is true for acetaldehyde
Figure 5 Distribution of hydrocarbon species in NMVOC emissions from individual road traffic emission
categories as defined in emission scenarios in this study and from the whole road traffic emission sector in Sweden for scenarios S1 (All petrol) and S2 (All E85)
Figure 6 shows a map of the EMEP domain with emissions of acetaldehyde for the two studied scenarios as an example of the geographical distribution of emissions
Figure 6 Gridded emissions of acetaldehyde for the year 2020 (in tonnes per grid cell (50 km x 50 km)
and year) a ndash lsquoAll petrol scenario b ndash lsquoAll E85 scenariorsquo
As mentioned the emissions from road traffic in the Vaumlstra Goumltaland region are calculated in a 500 m x 500 m grid Figure 7 shows the emissions of NOX for 2005 as obtained from the database and the projected emissions for 2020 with a mixed use of E85 and petrol This can be considered as the base case for the emissions in 2020 It can be seen that the emissions decrease over the period which is due to reduction in NOX emissions factors as older vehicles are replaced by newer models (the traffic actually increases from a total of 754x109 vehicle-kilometres in 2005 to 937x109
0
20
40
60
80
100
Pet
rol e
xh
Pet
rol e
vap
E-8
5 ex
h
E-8
5 ev
ap
Pet
rol M
C
Die
sel L
DV
Die
sel H
DV
Roa
d Sw
eden
S1
Roa
d Sw
eden
S2
m
ass
Ethane
Alkanes C3+
Ethene
13 Butadiene
Alkenes C3+
Ethyne
Benzene
Aromatics C7+
Formaldehyde
Acetaldehyde
Aldket C3+
Ethanol
A comparison of emissions from ethanol and petrol fuelled cars IVL report B1962 Health risk assessment for Vaumlstra Goumltaland
17
vehicle-kilometres in 2020) The major roads in the region are clearly visible as well as the larger cities (especially Gothenburg)
Figure 7 Emissions of NOX (kgyear for a 500 m x 500 m grid cell) in the Vaumlstra Goumltaland region for 2005
and for 2020 for the base case
In Table 4 the traffic emissions for NOX benzene acetaldehyde ethanol and PM10 for the Vaumlstra Goumltaland region are shown for the four different emissions scenarios The emissions of NOX and benzene are reduced between 2005 and 2020 for the base case while the emissions of ethanol and acetaldehyde increase due to an expected increase in the use of ethanol fuel The NOX emissions for S1 are somewhat higher than for S2 due to the higher NOX emissions factor for petrol compared with E85
Table 4 Emissions from traffic for the Vaumlstra Goumltaland region in four different emission scenarios (in tonnesyear)
Substance base 2005 base 2020 S1 S2 NOX 13 243 4 843 4 954 4 631 Benzene 2 833 927 1 201 386 Acetaldehyde 628 1 074 305 2 595 Ethanol 192 5 192 0 15 400 PM10 1 324 486 483 476
33 Dispersion modelling
Resulting concentrations from calculations of the S1 and S2 scenarios with the EMEP model are used to provide input of primary and secondary air pollutants for the calculations with the TAPM model for the Vaumlstra Goumltaland region Concentrations of NOX NMVOC PM25 PM10 acetaldehyde ethanol and benzene are therefore calculated as boundary conditions for the Vaumlstra Goumltaland region In addition sensitivity studies are performed to investigate the role of formation of secondary acetaldehyde and secondary particulate matter (see Appendix 2) Time series analysis of the TAPM and EMEP model results of the S1 and S2 scenarios are presented in Figure 8
A comparison of emissions from ethanol and petrol fuelled cars IVL report B1962 Health risk assessment for Vaumlstra Goumltaland
18
a)
b)
Figure 8 Time series analyses of S1 and S2 scenarios for the EMEP and TAPM modelled concentrations of NOX and ozone at an urban background site in Gothenburg (TAPM) and in EMEP model grid cells including Gothenburg city (50 km x 50 km)
Concentrations of NOX and ozone at an urban background site in Gothenburg (TAPM) and in the 50 km x 50 km EMEP grid cells including Gothenburg are compared for one summer and one winter month Due to the well-known process of ozone titration by freshly emitted nitrogen monoxide (Seinfeld and Pandis 1998) the concentration of ozone often decreases in urban areas This phenomenon is expected to be captured by the fine-gridded TAPM model but not necessarily by the courser scale of the EMEP model Figure 8 shows the generally higher NOX levels in the small grid cell of the TAPM model in urban background location comparing to those in the large EMEP grid cell while the opposite is observed for the ozone concentrations (Remember that the boundary concentrations for TAPM are obtained from the EMEP model and they are thus the same in both cases) This indeed shows that local scale emissions and processes contribute to locally increased levels of NOX in urban areas both for the summer and the winter cases For ozone where there of course are no primary emissions the situation is the opposite where instead the result is decreased concentration levels at urban sites on a local scale The influence of the
A comparison of emissions from ethanol and petrol fuelled cars IVL report B1962 Health risk assessment for Vaumlstra Goumltaland
19
NMHC emissions from the passenger cars is studied in a sensitivity analysis (see Appendix 23) and it is found to have only a small influence on the ozone levels
To illustrate the results of the different scenario calculations the geographically distributed concentrations are presented as the difference in yearly average concentrations between the all E85 (S2) and all petrol (S1) scenarios both as microgm3 and sometimes as percentage of the difference to scenario S1 (see Appendix 3)
The difference in yearly average concentrations between scenario S1 and S2 for acetaldehyde and benzene can be seen in Figures 9 and 10 respectively The increase in acetaldehyde concentration resulting from a switch from petrol to E85 is up to about 05 gm3 or 80 in the central parts of the largest urban area of the region Gothenburg Outside this area the relative increase is about 10 for the other urban areas and less than that for the rural areas This large relative increase (see map in Appendix 4) is a result of the relatively high emissions of acetaldehyde from E85 fuelled cars For benzene the situation is opposite In the scenarios for 2020 the concentration of benzene decreases by up to a few tenths of gm3 as a result of a switch from petrol to E85 For benzene the relative change is not calculated
Figure 9 The difference in yearly average concentrations of acetaldehyde for 2020 between the all E85 (S2) and all petrol (S1) scenarios (microgm3)
A comparison of emissions from ethanol and petrol fuelled cars IVL report B1962 Health risk assessment for Vaumlstra Goumltaland
20
Figure 10 The difference in yearly average concentrations (gm3) of benzene for 2020 between the all E85 (S2) and all petrol (S1) scenarios
The difference in the calculated NOX NO2 and ozone concentrations between the two scenarios are shown in Appendix 4 The change in NOX concentration between the two scenarios only represents a small fraction of the total NOX concentration This is because the emissions of NOX from petrol cars are relatively low compared with the contribution from diesel engines and other sources Thus the resulting decrease in the NOX concentration with E85 is only up to 3 For ozone there is a small increase of about 01 microgm3 of E85 in the central areas of Gothenburg where there is relatively high traffic intensity (see Appendix 4 Figure A9) In the rest of the region there is a small decrease in the ozone concentration in the E85 scenario
34 Exposure
The resulting concentrations from the dispersion modelling together with the population density distribution are used to assess the exposure to acetaldehyde benzene NO2 NOX and ozone for the two scenarios S1 and S2 The exposure to PM25 is very similar for the two scenarios (the difference in concentration between scenarios S2 and S1 is only about -002 gm3 Table 5 shows the population weighted mean exposure both as total concentrations and as the difference between the two scenarios Detailed exposure results can be found in Appendix 5 It can be seen that the exposure to all the pollutants in Table 5 with the exception of acetaldehyde are somewhat lower for the all E85 scenario (S2) than for the all petrol scenario (S1) However the effect on health also
A comparison of emissions from ethanol and petrol fuelled cars IVL report B1962 Health risk assessment for Vaumlstra Goumltaland
21
depends on the level of the dose-response functions For example if the level of concentration is low in a populated area but the dose-response function is high the effect of even a low concentration increase can become important The increase in exposure from S1 to S2 (S2-S1) calculated as percentage of the population exposed to increased mean concentrations of pollutants is presented in Figure 11
Table 5 Populated weighted mean exposure (gm3)
S1 S2 S2-S1 Acetaldehyde 065 077 014 Benzene 01 005 -007 NOX 85 84 -012 Ozone 570 569 -012 PM25 270 268 -002
Increased concentrations Decreased concentrations Both increased and
decreased conc
Figure 11 The relative exposure (S2-S1) calculated as percentage of the population
In Figure 11 it is clear that the only pollutant that does not show an improvement regarding air quality and thus the health risks when modelling a switch from petrol to E85 is acetaldehyde For all pollutants except for ozone the changes of concentration levels observed between the scenarios are within the urban areas but for ozone there are also differences in rural areas
According to the data in Figure 11 about 14 of the population in the Vaumlstra Goumltaland region will be exposed to 03-08 microgm3 higher concentration levels of acetaldehyde in scenario S2 relative to S1 From Figure 9 it can be seen that the majority of these people live within the Gothenburg area Further about 28 of the population will be exposed to increased levels of between 01 to 03 microgm3 mainly in the suburban areas and rural surroundings of Gothenburg but also in some of the smaller cities in the region Outside the urban areas the concentration difference is lower than 01 microgm3
In the S2 scenario relative to the S1 scenario the population is exposed to decreased concentration levels of benzene and NOX This is mainly true also for O3 but with an exception for the central
A comparison of emissions from ethanol and petrol fuelled cars IVL report B1962 Health risk assessment for Vaumlstra Goumltaland
22
parts of Gothenburg where the concentration actually increases (see Appendix 4 Figure 7A) resulting in that 3 (blue area in Figure 11 for O3) of the population will be exposed to higher concentrations of O3 For the rest of the area there are decreased concentrations of ozone upon a switch to E85
The largest differences are again in the central parts of Gothenburg where about 20 of the population is being exposed to a lower benzene concentration of 01-03 microgm3 This also means that concerning benzene the majority (78) of the population have none or very low influence from a change to ethanol fuel
The largest effect on exposure difference is seen for NOX where just over 20 of the population has its exposure decreased with 03-05 microgm3 (in the central parts of Gothenburg) In the suburbs the decrease is between 01-02 microgm3 lower Along the largest roads there is a small but visible improvement on a yearly basis of 01 microgm3
For PM25 there is a difference in the populated weighted mean exposure of 002 gm3 between the scenarios with a lower value for the all-E85 case (see also Appendix 5)
35 Impact on health in Vaumlstra Goumltaland
351 NO2 and NOX
The impact of long-term exposure on mortality was estimated using the relative risk from the Norwegian cohort study (Nafstad et al 2004) reporting a relative risk of 08 increase per microgm3 increase in NOX however without adjustment for particle concentrations Assuming this effect on the total mortality and a typical baseline mortality of 1000 deaths per 100 000 person years a decrease in the population mean exposure of 012 microgm3 would correspond to approximately 104 less preterm deaths per year However for the present case this number is highly uncertain since the exposure to substances normally associated with changes in NOX exposure may here change in different ways since the relation between different exhaust components varies between the scenarios
The impact of long-term exposure on asthma incidence (new cases) in adults has been estimated using results from the Swedish RHINE Study Cohorts (Modig et al 2009) with very similar results in the ECRHS Study corresponding to approx 4 increase per microgm3 increase in NO2 From the RHINE Study the incidence can be estimated to 03 per year (proportion of adults developing the disease) with children and elderly excluded this means around 1500 adult cases per year A reduction of 009 microgm3 corresponds to 54 avoided new cases of adult asthma per year However also NO2 in the asthma study may have been mainly an indicator of vehicle exhaust
352 Ozone
The impact of long-term exposure on respiratory mortality has been reported to be approx 02 per microgm3 increase in the summer concentration when studied in the large ACS Cohort (Jerret et al 2009) Assuming this effect on the total population and a typical baseline respiratory mortality of 100 deaths per 100 000 person years a decrease in the population mean exposure of 012 microgm3 corresponds to approximately 03 less preterm deaths per year
A comparison of emissions from ethanol and petrol fuelled cars IVL report B1962 Health risk assessment for Vaumlstra Goumltaland
23
353 Acetaldehyde
According to US EPA (1999) a lifetime risk for cancer of 0000002 per microgm3 is to be assumed for this potential human carcinogen An increase in the population mean exposure of 012 microgm3 corresponds to 026 cases more per year in the current population
354 Benzene
According to US EPA (1999) a lifetime risk for cancer (leukaemia) of 00000022-00000078 per microgm3 is to be assumed for this human carcinogen A decrease in the population mean exposure of 0074 microgm3 corresponds to approximately 03 cases less per year in the current population (assuming 0000004 per microgm3)
355 PM25
In CAFEacute and other impact assessments a relative risk of 6 increase in all-cause mortality per 10 microgm3 has usually been assumed Assuming this effect on the total mortality and a typical baseline mortality of 1000 deaths per 100 000 person years a decrease in the population mean exposure of 002 microgm3 corresponds to approximately 13 less preterm deaths per year
4 Discussion
In this study the health risks from a large introduction of E85 to replace petrol is analysed in scenario studies for 2020 for the Vaumlstra Goumltaland region It is found that the change in pollutant concentration exposure and health risks are small between the two scenarios It should be emphasized that the study only considers vehicle emissions and does not take into account effects from the fuel production
The emissions of NOX in the model are somewhat lower from E85 fuelled cars than from petrol fuelled cars This is in line with the emission factors used by Jacobson (2007) The nitrogen oxides are key substances in the atmospheric reactions determining the concentrations of ozone in air NOX is involved in the formation of ozone but close to the NO source the ozone concentration is lowered due to the rapid reactions between NO and O3 forming NO2 If NO is released in an environment with already high NO concentration it may result in lowering of ozone levels on the regional scale In the present study the ozone concentrations calculated are somewhat lower for the E85 scenario than for the petrol scenario
The health risk analysis shows that the main difference between the scenarios is due to the lower concentration of NOX However it may have been other exhaust components than NOX such as exhaust particles that were behind the reported association with mortality In cases when NOX is not a good indicator of exhaust particle emissions and their toxicity our results may be misleading This should be studied further Neglecting the effects of the changes in NOX exposure the total difference between the scenarios sums up to 16 preterm deaths per year with lower values for the E85 scenario while it would sum up to 12 less preterm deaths for the E85 scenario if the effect related to NOX were included Since there are no similar studier for the effect on mortality among those younger than 30-50 years of age we assume the same relative effect on mortality in all ages This makes only a small difference since the large majority of deaths occur in older groups
A comparison of emissions from ethanol and petrol fuelled cars IVL report B1962 Health risk assessment for Vaumlstra Goumltaland
24
The opposite result for the ozone concentration was obtained by Jacobson The reason for this discrepancy is that the Jacobson study concerns Los Angeles a region with high concentrations of pollutants while the study here concerns the Vaumlstra Goumltaland region with much less dense traffic and also lower concentrations of pollutants importantly NOX It is not unlikely that the effect that Jacobson report also would be found for large parts of Europe with higher traffic densities than in the Vaumlstra Goumltaland region
It is worth to emphasize that the major negative health effect in the Jacobson (2007) study is attributed to the increase in ozone concentration that is a result of the decrease of the NO emissions from E85 cars Directly after the emission NO reacts with ozone resulting in drop of the ozone concentration the so-called ozone titration commonly observed in many cities This NO does however form even higher quantities of ozone further downwind contributing to the general increase in the background ozone levels It is also precursor of NO2 secondary PM and other toxic species as eg PAN and hence reductions in NO emissions are never regarded as disbeneficial from the environmental viewpoint
There are of course several sources of uncertainties that influence the results of this study Since the main results concern differences between the two scenarios several of these factors loose on importance for the conclusions This comprises uncertainties in meteorology in future traffic volumes and in the population density distribution However there are some uncertainties that remain important The emission factors for E85 fuelled cars are much less characterised than what they are for petrol cars The emission of particles from E85 fuelled cars is especially uncertain with only very few published results Also the emissions of NMHC are somewhat uncertain and may be higher for E85 at lower ambient temperatures However the sensitivity analysis performed shows that for the studied region the NMHC emissions only have a small influence on the ozone concentrations
5 Conclusions
In this study the impact of tailpipe and evaporative emissions from E85 fuelled cars on air pollution and health risks are calculated and compared with petrol fuelled cars The scenario calculations for the Vaumlstra Goumltaland Region give data on emissions pollutant concentrations exposure and a health risk evaluation
The differences in emission factors between E85 and petrol lies in the emissions of PM and NOX which are about 65 and 58 for E85 relative petrol respectively Also the speciation of the emitted hydrocarbons is significantly different with large emissions of acetaldehyde and ethanol from E85 and large emissions of benzene higher aromatics alkanes and alkenes from petrol
These differences in emission factors reflect in differences in emissions The emission calculations for all Swedish road traffic show a decrease for the E85 scenario relative to the petrol scenario of 65 for NOX 34 for PM25 67 for benzene For acetaldehyde there is an increase of 770
The differences obtained from the TAPM modelling show decreased levels of NOX ozone and benzene with E85 and increased levels of acetaldehyde For the latter the increase may be up to 80 while NOX and ozone show decreases of up to a few per cent and a few tenths of per cent respectively
A comparison of emissions from ethanol and petrol fuelled cars IVL report B1962 Health risk assessment for Vaumlstra Goumltaland
25
The health risk assessment shows decreased health risks in the E85 scenario relative the all-petrol scenario due to the increased NOX exposure correlated with both preterm deaths and asthma However NOX may be mainly an exhaust indicator Smaller effects are expected from the changes in ozone acetaldehyde and benzene exposure The overall difference considering the exposure to PM acetaldehyde benzene and ozone is 16 preterm deaths with lower values for the E85 scenario
6 Acknowledgements
Saab Automobile The Swedish Transport Administration and The Foundation for the Swedish Environmental Research Institute are gratefully acknowledged for financial contribution
Magnus Ekstroumlm and Maria Holmstroumlm at Saab and Martin Juneholm at the Swedish Transport Administration are acknowledged for their most valuable input to the study
David Simpson Norwegian Meteorological Institute EMEP MSC-W Norway and Dept Radio amp Space Science Chalmers Univ Technol Sweden is gratefully acknowledged for help with implementation of the Unified EMEP model
A comparison of emissions from ethanol and petrol fuelled cars IVL report B1962 Health risk assessment for Vaumlstra Goumltaland
26
7 References
Altenstedt J Pleijel K 2000 An alternative approach to photochemical ozone creation potentials under European conditions J Air amp Waste Manage Assoc 50 1023 ndash 1036
Andre J-M (2005) Vehicle emission measurement collection of the ARTEMIS datatbase Artemis 3312 report Available from httpwwwinretsfrurltepublicationspublications-pdfJoumardA3312reportJMALTE0504pdf
Bachand A MMundt K A Mundt D JMontgomery R R Epidemiological studies of formaldehyde exposure and risk of leukemia and nasopharyngeal cancer A meta-analysis Critical Reviews in Toxicology 2010 40(2) 85ndash100
Beane Freeman L E Blair A Lubin J H Stewart P A Hayes R B Hoover R N Hauptmann M Mortality from lymphohematopoietic malignancies among workers in formaldehyde industries The National Cancer Institute Cohort J Natl Cancer Inst 2009101751ndash761
Bosetti C McLaughlin J K Tarone R E Pira E LaVecchia C Formaldehyde and cancer risk A quantitative review of cohort studies through 2006 Ann Oncol 20081929ndash43
ConcaweJRC Well-to-wheel studies httpiesjrceceuropaeuwtwhtml
Derwent R G Jenkin M E Saunders S M 1996 Photchemical ozone creation potentials for a large number of reactive hydrocarbons under European conditions Atmos Environ 30 181 ndash 199
Derwent RG Jenkin ME Passant NR Pilling MJ 2007 Photochemical ozone creation potentials (POCPs) for different emission sources of organic compounds under European conditions estimated with a Master Chemical Mechanism Atmos Env 41 2570ndash2579
EEA Copenhagen 2009 wwweeaeuropaeudata-and-mapsdatapopulation-density-disaggregated-with-corine-land-cover-2000-2
Ericsson P Holmstroumlm M Amberntsson-Carlsson A Ohlson C Skoglundh M Andersson B Carlsson P-A 2008 Characterization of particulate emissions and methodologhy for oxidation of particulates from non-diesel combustion ystems SAE Technical Paper Series 2008-01-1746
GAINS 2010 httpgainsiiasaacatindexphpgains-europe
Graham LA Belisle SL Baas C-L Emissions from light duty gasoline vehicles operating on low blend ethanol gasoline and E85 Atmospheric Environment 42 4498 (2008)
Haskew H M Thomas P E Liberty F 2006 Fuel Permeation From Automotive Systems E0 E6 E10 E20 And E85 Final Report CRC Project No E-65-3 Coordinating Research Council Inc 3650 Mansell RoadSuite 140Alpharetta GA 30022
HEI Air Toxics Review Panel (2007) Mobile-Source Air Toxics A Critical Review of the Literature on Exposure and Health Effects HEI Special Report 16 Health Effects Institute Boston USA
Hurley P TAPM v 4 User Manual 2008 CSIRO ISBN 978-1-921424-73-1
IARC (2006) IARC Monographs on the Evaluation of Carcinogenic Risks to Humans Wood Dusts and Formaldehyde Lyon World Health Organization International Agency for Research on Cancer Lyon France 8837ndash325
Jacobson M Z Effects of Ethanol (E85) versus Gasoline Vehicles on Cancer and Mortality in the United States Environ Sci Technol 2007414150-4157
A comparison of emissions from ethanol and petrol fuelled cars IVL report B1962 Health risk assessment for Vaumlstra Goumltaland
27
Jerret M Burnett R T Pope C A Ito K Thurston G Krewski D Shi Y Calle E Thun M Long-Term Ozone Exposure and Mortality N Engl J Med 20093601085-95
Lipman T E Delucchi M A 2002 Emissions of nitrous oxide and methane from conventional and alternative fuel motor vehicles Climate Change 53 477
Modig L Toreacuten K Janson C Jarvholm B Forsberg B Vehicle exhaust outside the home and onset of asthma among adults Eur Respir J 2009 Jun33(6)1261-7
Nafstad P Haheim L L Wisloff T Gram F Oftedal B Holme I Hjermann I Leren P Urban air pollution and mortality in a cohort of Norwegian men Environ Health Perspect 2004112(5)610-5
OEHHA (1999) Air Toxics Hot Spots Program Risk Assessment Guidelines Part II Technical Support Document for Describing Available Cancer Potency Factors Prepared by the Air Toxicology and Epidemiology Section Office of Environmental Health Hazard Assessment April 1999
Passant NR (2002) Speciation of UK emissions of non-methane volatile organic compounds AEAT report AEATENVR0545 Issue 1 Culham UK
Pope CA III Thun MJ Namboodiri MM Dockery DW Evans JS Speizer FE Heath CJ Particulate air pollution as a predictor of mortality in a prospective study of US adults Am J Resp Crit Care Med 1995 151 669-674
Seinfeld J H and Pandis SN (1998) Atmospheric Chemistry and Physics From Air Pollution to Climate Change John Wiley amp Sons New YorkSimpson D Fagerli H Jonson JE Tsyro S Wind P Tuovinen J -P 2003 Transboundary acidification and eutrophication and ground level ozone in Europe Unified EMEP Model Description EMEP Status Report 12003 Part I EMEPMSC-W Report The Norwegian Meteorological Institute Oslo Norway
US EPA (1999) httpwwwepagovttnatwnata1999nsata1999
Vestreng V et al 2004 Inventory Review 2004 Emission data reported to CLRTAP and the NEC Directive EMEPEEA Joint Review Report EMEPMSC-W Note 1
Westerholm R Ahlvik P Karlsson HL An exhaust characterisation study based on regulated and unregulated emissions from bi-fuel and flexi-fuel light-duty passanger cars fuelled by petrol (E5) bioethanol (E70 E75) and biogas tested at ambient temperatures of +22degC and -7degC 2008
Wolkoff P Nielsen G D Non-cancer effects of formaldehyde and relevance for setting an indoor air guideline Environment International 201036788ndash799
Yanowitz J McCormick RL Effect of E85 on tailpipe emissions from light-duty vehicles J Air amp Waste Manage Assoc 59 172 (2009)
A comparison of emissions from ethanol and petrol fuelled cars IVL report B1962 Health risk assessment for Vaumlstra Goumltaland
28
Appendix 1 Evaporate emissions of NMHC
The following assumptions are done for evaporative emissions The NMHC emissions from E85 are reduced relative to petrol by 45 Methane emissions are zero and the split of NMHC species is 68 ethanol and the remaining 32 is divided in the same way as evaporative emissions for petrol The estimates by Graham et al (2008) are missing evaporative emission data however these assumptions agrees very well with measurements of evaporative emissions due to fuel permeation reported by Haskew et al (2006) where NMHC emissions are reported to be reduced by 50 for E85 fuel compared to petrol Haskew et al also presents the NMHC split to species with 60 ethanol This number agrees quite well with our assumption of 68 NMHC being ethanol NMHC in exhaust and evaporative emissions are thus divided as in Table A1
Table A1 Division of NMHC in the exhaust and evaporative emissions for E85 and petrol respectively (wt)
E85 Petrol E85 Petrol exhaust exhaust evaporative evaporative
Ethanol 680 0 680 0 Acetaldehyde 131 08 02 0 Ethene 99 73 24 0 Ethyne 03 28 09 0 Formaldehyde 31 17 06 0 Benzene 16 56 18 10 13 Butadiene 03 09 03 0 sum 963 191 741 10
The remaining NMHC emissions are divided as for petrol (ref) and listed in Table A2
Table A2 Division of NMHC in the exhaust and evaporative emissions for E85 and petrol respectively (wt)
E85 Petrol E85 Petrol exhaust exhaust evaporative evaporative
Ethane 02 32 10 0 Alkanes (C3+) 13 278 89 880 Alkenes (C3+) 04 90 29 95 Aromatics (C7+) 18 388 125 15 Aldehydesketones (C3+)
01 15 05 0
A comparison of emissions from ethanol and petrol fuelled cars IVL report B1962 Health risk assessment for Vaumlstra Goumltaland
29
Appendix 2 Description of the model system
A21 Atmospheric lifetimes
Table A3 gives tropospheric lifetimes with regard to reaction of ethanol formaldehyde acetaldehyde and benzene (C6H6) with OH nitrate radical (NO3) and photolysis The studied organic species are listed together with three species common in the gasoline exhaust (benzene ethene and toluene) for comparison Table 11 shows also photochemical ozone creation potential (POCP) of these species POCP is a measure of amount of ozone that is formed from a certain VOC emission relatively to other emission source which has been established to the same emission mass of ethene (Derwent et al 1996 Altenstedt et al 2000) The range represents different scenarios for VOC and NOX background concentrations Derwent et al (2007) used similar methodology to calculate POCP of different VOC sources and calculated POCP of mean road emission exhaust to be 69
Table A3 Atmospheric lifetimes of studies NMVOC species with respect to the OH- and NO3- initiated
degradation τ(OH) and τ(NO3) and with respect to the photolysis (The lifetime of a chemical species which decays in a first-order process is the time needed for a concentration of this species to decrease to 1e of its original value Statistically it represents the mean life expectancy of an excited species) The OH concentration of 1times106 moleculescm3 typical for summer troposphere was used for the lifetime calculation The NO3 concentrations of 5 and 100 ppt(V) were used for lifetime calculations as representative of rural and urban night-time 12 hrs mean concentration The studied organic species are listed together with 3 species common in the gasoline exhaust for comparison The rates of photolysis were calculated with radiation transfer model for July 58ordm latitude and integrated over 24 hours
τ(OH) τ(NO3) urbanrural τ (photolysis) POCP
hr hr hr
Ethanol 85 56 1times103 - 44 - 63
Acetaldehyde 15 47 1times103 86 68 - 80
Formaldehyde 30 194 4times103 10 18 - 55
Benzene 214 - - 23 - 47
Ethene 34 - - 100
Toluene 50 - - 30 - 67
A22 Defining of boundary concentrations for TAPM from EMEP fields
Calculation of initial concentration field for TAPM from EMEP concentration field of NO2 (as example) and EMEP mean wind vector components u_mid and v_mid Two EMEP model gridcells (i=56 j=60 and i=56 j=61) represent the TAPM model domain and concentrations from the surrounding EMEP gridcells SE-S SE-N NW-S NW-N NE NW (Figure A1) are used for calculation of boundary concentration NO2(bc) according to the following code if u_mid lt= 0 then ( isite = SE-S and jsite = SE-N) else isite = NW-S and jsite = NW-N) endif
A comparison of emissions from ethanol and petrol fuelled cars IVL report B1962 Health risk assessment for Vaumlstra Goumltaland
30
if v_mid lt= 0 then ( ksite = NE) else ksite = SW endif NO2(bc) = [(NO2(isite)u_mid(isite) + NO2(jsite)u_mid(jsite))2 + NO2(ksite)v_mid(ksite)] [(u_mid(isite) + u_mid(jsite))2 + v_mid(ksite)]
Figure A1 Gridcells covering Gothenburg domain and its boundary in EMEP model plotted on latitude-
longitude coordinates The red square represents centre of Gothenburg and the blue line the coastline EMEP i and j coordinates for the boundary gridcells are SE-S = 57-60 SE-N = 57-61 NW-S = 55-60 NW-N = 55-61 NE = 56-62 NW = 56-59 and for Gothenburg grid cells are Gbg-NE = 56-61 Gbg-SW = 56-60
A23 Atmospheric chemistry
The role of secondary chemistry in for the concentration of acetaldehyde are studied by first excluding the primary acetaldehyde emissions from the EMEP model simulations of scenarios S1 and S2 and then by excluding all NMVOC emissions from the car category with spark ignition engines The contribution from the primary acetaldehyde emissions as well as the contribution of secondary acetaldehyde formed from other NMVOC to the total acetaldehyde concentration is then obtained However the secondary chemistry is highly nonlinear due to the interactions of NMVOCs with ozone and OH and thus the results for the contribution of secondary acetaldehyde are somewhat uncertain Differences in acetaldehyde concentrations between S1 and S2 scenarios are studied with respect to contribution of primary and secondary acetaldehyde It is observed that in summer background air the monthly mean contribution of the secondary acetaldehyde is of the same magnitude as the contribution of the primary acetaldehyde to the difference between S1 and
565
57
575
58
585
105 115 125 135 145
Long
Lat
Gbg-SW
Gbg-NE
SE-S
NW-N
NW-S
SE-N
SW
NE
55-59
57-59
55-62
A comparison of emissions from ethanol and petrol fuelled cars IVL report B1962 Health risk assessment for Vaumlstra Goumltaland
31
S2 In the winter and in more polluted atmosphere (Gothenburg grid cells) the contribution from secondary acetaldehyde to the concentration difference appears to be negative due to the chemistry feedback ie the E-85 scenario has less secondary acetaldehyde than the all-petrol scenario
A comparison of S2-S1 differences in primary and secondary acetaldehyde concentrations in the background (=upwind) and Gothenburg grid cells show no increase in the secondary acetaldehyde from upwind to the Gothenburg grid cell It can thus be concluded that there is no significant contribution from secondary aldehydes on the small scale (tenths of km) Conclusion from this sensitivity study is that the secondary formaldehyde can be of importance under summer in the clean background air but that formation on the local scale is unimportant Using EMEP simulated boundary concentrations of acetaldehyde in the local scale model and simulating the primary acetaldehyde emissions will capture the most important features of acetaldehyde dispersion and chemistry in Vaumlstra Goumltaland
In the EMEP model the tail-pipe PM emissions are specified as primary particles Emissions of NOX and VOCs (and NH3 SO2) are oxidised in the atmosphere and a part is then transferred through the gas-to-particle transport to the PM as secondary PM The petrol fuelled cars emit both more primary PM and more NOX compared to the E85 cars If we compare differences in primary and secondary PM between the S1 and S2 scenarios simulated by EMEP we can directly see what part of the difference is from the tail-pipe emissions of the primary particles and what part is from the formation of the secondary PM in atmosphere (mostly from higher emissions of NOX) Table A4 shows the differences between S1 and S2 (S1-S2) of monthly PM averages for January and June (two months with low and high photochemical activities respectively) It can be seen that the higher formation of secondary PM in the S1 (all-petrol) scenario is more important than the higher tail-pipe emission of primary PM by factor 10 - 20
When we compare simulated PM differences between S1-S2 for the background air (=upwind) grid cells and for grid cells including Gothenburg (50 km x 50 km scale) we can see significant increase in primary PM in the S1 scenario from the upwind grid cells to Gothenburg (746 in winter 132 in summer) while no systematic increase can be seen for the secondary PM (-42 in winter +24 in summer) From this comparison it can be concluded that no systematic increase in secondary PM can be seen (in difference from the primary PM) on the scale of 50-100 km and we can neglect this process on the small scale However the overall change in PM concentrations due to the switch of the fuel is very small both on the large scale and on the small scale as can be seen when the differences in PM concentrations between S1 and S2 are compared to absolute PM concentrations in S1 presented in the last column of Table A4
Table A4 Differences in primary and secondary PM concentrations between the lsquoAll-petrolrsquo (S1) and lsquoE-85rsquo (S2) scenarios simulated in gridcells upwind Gothenburg and in gridcells including Gothenburg (2 50 km x 50 km gridcells)
S1-S2 Background
S1-S2 Gothenburg
Increase S1-S2 Gothenburg
S1 Background
μgm3 μgm3 μgm3 bkgnd μgm3
Prim PM10 Jan 00008 00014 00006 746 084
Jun 00008 00018 00010 1319 084
Sec PM10 Jan 00155 00148 -00006
-42 157
Jun 00080 00081 00002 24 213
The sensitivity of the used emission factors for NMHC with respect to the ozone formation in the region of the Swedish West Coast can be analysed with the help of results from studying the
A comparison of emissions from ethanol and petrol fuelled cars IVL report B1962 Health risk assessment for Vaumlstra Goumltaland
32
formation of secondary acetaldehyde In this study first all primary acetaldehyde emitted by the E85 fleet are omitted in a model simulation (S2_nopAA) and secondly all NMHC emissions from the E-85 fleet are switched off (S2_noVOC) Acetaldehyde has a somewhat higher though still comparable photochemical ozone creation potential compared to ethanol (ethanol 44-63 acetaldehyde 68-80 Altenstedt and Pleijel 2000) and this simulation will thus also give information on the sensitivity of the calculations to uncertainties in the ethanol emissions Setting the emission factor for NMHC to zero gives the sensitivity to the emission factor of total NMHC Figure A2 shows the differences in ozone concentration as a result of acetaldehyde only and the total NMHC from the E85 car fleet (S2 scenario) We can see that the effect on ozone formation is very small for the Swedish West coast The reason is that the ozone formation in this area is controlled by the availability of NOX while NMHC or rather their degradation products the peroxy radicals that serve as a lsquofuelrsquo to ozone formation are usually in excess here and further VOC emissions do not increase ozone concentrations significantly The situation looks different in areas that are more heavily polluted with NOX andor which is limited in the availability of peroxy radicals The results from this sensitivity study are fully consistent with the observed increase in ozone concentrations as a result of lower NO emissions (the so-called ozone titration) only very close to the major roads but no larger-scale decrease in ozone concentrations in the Gothenburg area or in any other communities
Figure A2 Sensitivity of the ozone formation in the 2 EMEP model grid cells covering Gothenburg (blue) and in the 6 surrounding grid cells (red see Fig A1) to changes in NMHC emission factor of the E85 fuelled cars lsquobasersquo is simulation S2 with EF for NMHC as in Table 3 lsquonoVOCrsquo is S2 with EF for all NMHC = 0 lsquonopAArsquo is S2 with EF for acetaldehyde = 0 a ndash Mean sensitivity in January absolute difference in ozone formation in ppb(V) as a result of NMHC (base-noVOC) and acetaldehyde (base-nopAA) emissions b ndash Sensitivity relative to ozone concentration in the S2-base simulation January c ndash same as a) but June d ndash same as b) but June
‐002
‐001
0
001
base‐noVOC base‐nopAA
ΔO3(ppb)
a)
0
001
002
base‐noVOC base‐nopAA
ΔO
3(ppb)
c)
‐010
‐005
000
005
base‐noVOC base‐nopAA
ΔO
3
b)
000
002
004
006
base‐noVOC base‐nopAA
ΔO
3
d)
A comparison of emissions from ethanol and petrol fuelled cars IVL report B1962 Health risk assessment for Vaumlstra Goumltaland
33
Appendix 3 Emission results
The geographically distributed NOX and acetaldehyde emissions for the Vaumlstra Goumltaland region are presented in Figures A3 and A4 respectively
Figure A3 NOX emissions for the Vaumlstra Goumltaland region for the All Petrol scenario
A comparison of emissions from ethanol and petrol fuelled cars IVL report B1962 Health risk assessment for Vaumlstra Goumltaland
34
Figure A4 Acetaldehyde emissions for the Vaumlstra Goumltaland region for the All Ethanol scenario
A comparison of emissions from ethanol and petrol fuelled cars IVL report B1962 Health risk assessment for Vaumlstra Goumltaland
35
Appendix 4 Dispersion modelling results
The difference in yearly average concentration between scenario S1 and S2 for acetaldehyde and benzene can be seen in Figure A5 and Figure A6 respectively a)
b)
Figure A5 The difference in yearly average concentrations of acetaldehyde for 2020 between the all E85 (S2) and all petrol (S1) scenarios presented as a) microgm3 and as b) percentage for the Gothenburg area
A comparison of emissions from ethanol and petrol fuelled cars IVL report B1962 Health risk assessment for Vaumlstra Goumltaland
36
a)
b) all E85 c) all petrol
Figure A6 a) the difference in yearly average concentrations (gm3) of benzene for 2020 between the all E85 (S2) and all petrol (S1) scenarios yearly means for b) all E85 and c) all petrol (note the different scales)
The difference in the calculated NOX NO2 and ozone concentrations between the two scenarios are shown in Figures A7 A8 and A9
A comparison of emissions from ethanol and petrol fuelled cars IVL report B1962 Health risk assessment for Vaumlstra Goumltaland
37
a)
b)
Figure A7 The difference in yearly average concentrations of NOX for 2020 between the all E85 (S2) and all petrol (S1) scenarios presented as a) microgm3 and as b) percentage for the Gothenburg area
A comparison of emissions from ethanol and petrol fuelled cars IVL report B1962 Health risk assessment for Vaumlstra Goumltaland
38
a)
Figure A8 The difference in yearly average concentrations of NO2 for 2020 between the all E85 (S2) and all petrol (S1) scenarios presented as a) microgm3 and as b) percentage for the Gothenburg area
A comparison of emissions from ethanol and petrol fuelled cars IVL report B1962 Health risk assessment for Vaumlstra Goumltaland
39
a)
b)
Figure A9 The difference in yearly average concentrations of ozone for 2020 between the all E85 (S2) and all petrol (S1) scenarios presented as a) microgm3 and as b) percentage for mainly the Gothenburg area
A comparison of emissions from ethanol and petrol fuelled cars IVL report B1962 Health risk assessment for Vaumlstra Goumltaland
40
Appendix 5 Detailed Exposure data
Detailed exposure data for the difference between the all E85 (S2) and the all petrol (S1) scenarios can be found in Table A5
Table A5 Exposure data for the difference between the all E85 (S2) and the all petrol (S1) scenarios
Acetaldehyde diff E-P (microgm3)
Populated weighted mean
Number of people Percentage of population
0 - 01 627198 582 01 - 02 163394 152 02 - 03 134879 125 03 - 04 88099 82 04 - 05 38686 36 05 - 06 16880 16 06 - 07 7983 07 07 - 08 1248 01 Tot 014 1078367 Benzene diff E-P (microgm3)
Populated weighted mean
Number of people Percentage of population
-03 - -02 26680 25 -02 - -01 205757 191 -01 - -0 845930 784 Tot -0074 1078367 NO2 diff E-P (microgm3) Populated weighted
mean Number of people Percentage of
population -04 - -03 7698 07 -03 - -02 50131 46 -02 - -01 296288 275 -01 - -0 724250 672 Tot -009 1078367 NOX diff E-P (microgm3) Populated weighted
mean Number of people Percentage of
population -06 - -05 7698 -05 - -04 19639 18 -04 - -03 36626 34 -03 - -02 161685 150 -02 - -01 186500 173 -01 - -0 666219 618 Tot -012 1078367 O3 diff E-P (microgm3) Populated weighted
mean Number of people Percentage of
population -02 - -01 779132 723 -01 - -0 266417 247 0 - 01 32818 30 Tot -012 1078367
Exposure data for the total levels in the two scenarios can be found in Table A6
A comparison of emissions from ethanol and petrol fuelled cars IVL report B1962 Health risk assessment for Vaumlstra Goumltaland
41
Table A6 Exposure data for the total levels in the two scenarios
Acetaldehyde tot All ethanol (microgm3)
Populated weighted mean
Number of people Percentage of population
06 - 07 568825 527 07 - 08 171845 159 08 - 09 124551 115 09 - 10 100946 94 10 - 11 59235 55 11 - 12 30559 28 12 - 13 13175 12 13 - 14 7983 07 14 - 15 1248 01 Tot 077 1078367 Acetaldehyde tot All petrol (microgm3)
Populated weighted mean
Number of people Percentage of population
05 - 06 45111 42 06 - 07 1032008 957 07 - 08 1248 01 Tot 065 1078367 Benzene tot All ethanol (microgm3)
Populated weighted mean
Number of people Percentage of population
0 - 01 1055961 98 01 - 02 22406 2 Tot 005 1078367 Benzene tot All petrol (microgm3)
Populated weighted mean
Number of people Percentage of population
0 - 01 729093 676 01 - 02 232961 216 02 - 03 94042 87 03 - 04 21023 19 04 - 05 1248 01 Tot 010 1078367 NOX tot All ethanol (microgm3)
Populated weighted mean
Number of people Percentage of population
0-10 779108 722 10-20 254658 236 20-30 28683 27 30-40 11070 10 40-50 3426 03 50-60 0 00 60-70 0 00 70-80 639 01 80-90 0 00 90-100 0 00 100-110 783 01 Tot 84 1078367 NOX tot All petrol (microgm3)
Populated weighted mean
Number of people Percentage of population
0-10 769557 714 10-20 264209 245 20-30 28683 27 30-40 11070 10 40-50 3426 03 50-60 0 00
A comparison of emissions from ethanol and petrol fuelled cars IVL report B1962 Health risk assessment for Vaumlstra Goumltaland
42
60-70 0 00 70-80 639 01 80-90 0 00 90-100 0 00 100-110 783 01 Tot 85 1078367 O3 tot All ethanol (microgm3)
Populated weighted mean
Number of people Percentage of population
40-45 1422 01 45-50 26487 25 50-55 176636 164 55-60 770370 714 60-65 103452 96 Tot 569 1078367 O3 tot All petrol (microgm3)
Populated weighted mean
Number of people Percentage of population
40-45 1422 01 45-50 20229 19 50-55 181876 169 55-60 763361 708 60-65 111479 103 Tot 570 1078367 PM25 tot All ethanol (microgm3)
Populated weighted mean
Number of people Percentage of population
1-2 0 00 2-3 885325 821 3-4 192259 178 4-5 783 01 Tot 268 1078367 PM25 tot All petrol (microgm3)
Populated weighted mean
Number of people Percentage of population
1-2 0 00 2-3 868773 806 3-4 208811 194 4-5 783 01 Tot 270 1078367
A comparison of emissions from ethanol and petrol fuelled cars IVL report B1962 Health risk assessment for Vaumlstra Goumltaland
15
Figure 4 National emissions of NOX NMVOC and PM from the road traffic sector in E85 scenario (S2)
relative to lsquoall-petrolrsquo scenario (S1)
An important difference in the emissions between the scenarios lies in the speciation of the NMVOC emissions Figure 5 shows this speciation of NMVOCs for all road traffic emission categories used in this study The two rightmost bars in Figure 5 show the NMVOC speciation for Swedish road traffic emissions for the two scenarios S1 and S2 Comparison with Figure4 shows that the relative changes between the two scenarios are much larger for some individual NMVOC species that for the total NMVOC emissions Since the NMVOC emissions from traffic in Sweden are dominated by the emissions from petrol cars (about 85 of the road traffic emissions of NMVOC comes from petrol cars) the variations in NMVOC speciation between petrol and E85
0
02
04
06
08
1
NOx
0
02
04
06
08
1
NMVOC
0
02
04
06
08
1
Aus
tria
Bel
arus
Bel
gium
Bos
-Her
cB
ulga
riaC
roat
iaC
ypru
sC
zech
Rep
Den
mar
kE
ston
iaFi
nlan
dFr
ance
Ger
man
yG
reec
eH
unga
ryIr
elan
dIt
aly
Lat
via
Lith
uani
aL
uxem
bour
gM
alta
Net
herla
nds
Nor
way
Pola
ndPo
rtug
alR
oman
iaR
ussi
a_E
uro
Slov
ak R
epSl
oven
iaSp
ain
Swed
enSw
itzer
land
Tur
key
Ukr
aine
UK
PM
A comparison of emissions from ethanol and petrol fuelled cars IVL report B1962 Health risk assessment for Vaumlstra Goumltaland
16
will have a significant impact on the total road traffic NMVOC speciation As can be seen in Figure 5 scenario S1 is dominated by alkanes and aromatics while scenario S2 is dominated by ethanol It can also be noted that S1 contains a significant emission of benzene which is much lower in S2 while the opposite is true for acetaldehyde
Figure 5 Distribution of hydrocarbon species in NMVOC emissions from individual road traffic emission
categories as defined in emission scenarios in this study and from the whole road traffic emission sector in Sweden for scenarios S1 (All petrol) and S2 (All E85)
Figure 6 shows a map of the EMEP domain with emissions of acetaldehyde for the two studied scenarios as an example of the geographical distribution of emissions
Figure 6 Gridded emissions of acetaldehyde for the year 2020 (in tonnes per grid cell (50 km x 50 km)
and year) a ndash lsquoAll petrol scenario b ndash lsquoAll E85 scenariorsquo
As mentioned the emissions from road traffic in the Vaumlstra Goumltaland region are calculated in a 500 m x 500 m grid Figure 7 shows the emissions of NOX for 2005 as obtained from the database and the projected emissions for 2020 with a mixed use of E85 and petrol This can be considered as the base case for the emissions in 2020 It can be seen that the emissions decrease over the period which is due to reduction in NOX emissions factors as older vehicles are replaced by newer models (the traffic actually increases from a total of 754x109 vehicle-kilometres in 2005 to 937x109
0
20
40
60
80
100
Pet
rol e
xh
Pet
rol e
vap
E-8
5 ex
h
E-8
5 ev
ap
Pet
rol M
C
Die
sel L
DV
Die
sel H
DV
Roa
d Sw
eden
S1
Roa
d Sw
eden
S2
m
ass
Ethane
Alkanes C3+
Ethene
13 Butadiene
Alkenes C3+
Ethyne
Benzene
Aromatics C7+
Formaldehyde
Acetaldehyde
Aldket C3+
Ethanol
A comparison of emissions from ethanol and petrol fuelled cars IVL report B1962 Health risk assessment for Vaumlstra Goumltaland
17
vehicle-kilometres in 2020) The major roads in the region are clearly visible as well as the larger cities (especially Gothenburg)
Figure 7 Emissions of NOX (kgyear for a 500 m x 500 m grid cell) in the Vaumlstra Goumltaland region for 2005
and for 2020 for the base case
In Table 4 the traffic emissions for NOX benzene acetaldehyde ethanol and PM10 for the Vaumlstra Goumltaland region are shown for the four different emissions scenarios The emissions of NOX and benzene are reduced between 2005 and 2020 for the base case while the emissions of ethanol and acetaldehyde increase due to an expected increase in the use of ethanol fuel The NOX emissions for S1 are somewhat higher than for S2 due to the higher NOX emissions factor for petrol compared with E85
Table 4 Emissions from traffic for the Vaumlstra Goumltaland region in four different emission scenarios (in tonnesyear)
Substance base 2005 base 2020 S1 S2 NOX 13 243 4 843 4 954 4 631 Benzene 2 833 927 1 201 386 Acetaldehyde 628 1 074 305 2 595 Ethanol 192 5 192 0 15 400 PM10 1 324 486 483 476
33 Dispersion modelling
Resulting concentrations from calculations of the S1 and S2 scenarios with the EMEP model are used to provide input of primary and secondary air pollutants for the calculations with the TAPM model for the Vaumlstra Goumltaland region Concentrations of NOX NMVOC PM25 PM10 acetaldehyde ethanol and benzene are therefore calculated as boundary conditions for the Vaumlstra Goumltaland region In addition sensitivity studies are performed to investigate the role of formation of secondary acetaldehyde and secondary particulate matter (see Appendix 2) Time series analysis of the TAPM and EMEP model results of the S1 and S2 scenarios are presented in Figure 8
A comparison of emissions from ethanol and petrol fuelled cars IVL report B1962 Health risk assessment for Vaumlstra Goumltaland
18
a)
b)
Figure 8 Time series analyses of S1 and S2 scenarios for the EMEP and TAPM modelled concentrations of NOX and ozone at an urban background site in Gothenburg (TAPM) and in EMEP model grid cells including Gothenburg city (50 km x 50 km)
Concentrations of NOX and ozone at an urban background site in Gothenburg (TAPM) and in the 50 km x 50 km EMEP grid cells including Gothenburg are compared for one summer and one winter month Due to the well-known process of ozone titration by freshly emitted nitrogen monoxide (Seinfeld and Pandis 1998) the concentration of ozone often decreases in urban areas This phenomenon is expected to be captured by the fine-gridded TAPM model but not necessarily by the courser scale of the EMEP model Figure 8 shows the generally higher NOX levels in the small grid cell of the TAPM model in urban background location comparing to those in the large EMEP grid cell while the opposite is observed for the ozone concentrations (Remember that the boundary concentrations for TAPM are obtained from the EMEP model and they are thus the same in both cases) This indeed shows that local scale emissions and processes contribute to locally increased levels of NOX in urban areas both for the summer and the winter cases For ozone where there of course are no primary emissions the situation is the opposite where instead the result is decreased concentration levels at urban sites on a local scale The influence of the
A comparison of emissions from ethanol and petrol fuelled cars IVL report B1962 Health risk assessment for Vaumlstra Goumltaland
19
NMHC emissions from the passenger cars is studied in a sensitivity analysis (see Appendix 23) and it is found to have only a small influence on the ozone levels
To illustrate the results of the different scenario calculations the geographically distributed concentrations are presented as the difference in yearly average concentrations between the all E85 (S2) and all petrol (S1) scenarios both as microgm3 and sometimes as percentage of the difference to scenario S1 (see Appendix 3)
The difference in yearly average concentrations between scenario S1 and S2 for acetaldehyde and benzene can be seen in Figures 9 and 10 respectively The increase in acetaldehyde concentration resulting from a switch from petrol to E85 is up to about 05 gm3 or 80 in the central parts of the largest urban area of the region Gothenburg Outside this area the relative increase is about 10 for the other urban areas and less than that for the rural areas This large relative increase (see map in Appendix 4) is a result of the relatively high emissions of acetaldehyde from E85 fuelled cars For benzene the situation is opposite In the scenarios for 2020 the concentration of benzene decreases by up to a few tenths of gm3 as a result of a switch from petrol to E85 For benzene the relative change is not calculated
Figure 9 The difference in yearly average concentrations of acetaldehyde for 2020 between the all E85 (S2) and all petrol (S1) scenarios (microgm3)
A comparison of emissions from ethanol and petrol fuelled cars IVL report B1962 Health risk assessment for Vaumlstra Goumltaland
20
Figure 10 The difference in yearly average concentrations (gm3) of benzene for 2020 between the all E85 (S2) and all petrol (S1) scenarios
The difference in the calculated NOX NO2 and ozone concentrations between the two scenarios are shown in Appendix 4 The change in NOX concentration between the two scenarios only represents a small fraction of the total NOX concentration This is because the emissions of NOX from petrol cars are relatively low compared with the contribution from diesel engines and other sources Thus the resulting decrease in the NOX concentration with E85 is only up to 3 For ozone there is a small increase of about 01 microgm3 of E85 in the central areas of Gothenburg where there is relatively high traffic intensity (see Appendix 4 Figure A9) In the rest of the region there is a small decrease in the ozone concentration in the E85 scenario
34 Exposure
The resulting concentrations from the dispersion modelling together with the population density distribution are used to assess the exposure to acetaldehyde benzene NO2 NOX and ozone for the two scenarios S1 and S2 The exposure to PM25 is very similar for the two scenarios (the difference in concentration between scenarios S2 and S1 is only about -002 gm3 Table 5 shows the population weighted mean exposure both as total concentrations and as the difference between the two scenarios Detailed exposure results can be found in Appendix 5 It can be seen that the exposure to all the pollutants in Table 5 with the exception of acetaldehyde are somewhat lower for the all E85 scenario (S2) than for the all petrol scenario (S1) However the effect on health also
A comparison of emissions from ethanol and petrol fuelled cars IVL report B1962 Health risk assessment for Vaumlstra Goumltaland
21
depends on the level of the dose-response functions For example if the level of concentration is low in a populated area but the dose-response function is high the effect of even a low concentration increase can become important The increase in exposure from S1 to S2 (S2-S1) calculated as percentage of the population exposed to increased mean concentrations of pollutants is presented in Figure 11
Table 5 Populated weighted mean exposure (gm3)
S1 S2 S2-S1 Acetaldehyde 065 077 014 Benzene 01 005 -007 NOX 85 84 -012 Ozone 570 569 -012 PM25 270 268 -002
Increased concentrations Decreased concentrations Both increased and
decreased conc
Figure 11 The relative exposure (S2-S1) calculated as percentage of the population
In Figure 11 it is clear that the only pollutant that does not show an improvement regarding air quality and thus the health risks when modelling a switch from petrol to E85 is acetaldehyde For all pollutants except for ozone the changes of concentration levels observed between the scenarios are within the urban areas but for ozone there are also differences in rural areas
According to the data in Figure 11 about 14 of the population in the Vaumlstra Goumltaland region will be exposed to 03-08 microgm3 higher concentration levels of acetaldehyde in scenario S2 relative to S1 From Figure 9 it can be seen that the majority of these people live within the Gothenburg area Further about 28 of the population will be exposed to increased levels of between 01 to 03 microgm3 mainly in the suburban areas and rural surroundings of Gothenburg but also in some of the smaller cities in the region Outside the urban areas the concentration difference is lower than 01 microgm3
In the S2 scenario relative to the S1 scenario the population is exposed to decreased concentration levels of benzene and NOX This is mainly true also for O3 but with an exception for the central
A comparison of emissions from ethanol and petrol fuelled cars IVL report B1962 Health risk assessment for Vaumlstra Goumltaland
22
parts of Gothenburg where the concentration actually increases (see Appendix 4 Figure 7A) resulting in that 3 (blue area in Figure 11 for O3) of the population will be exposed to higher concentrations of O3 For the rest of the area there are decreased concentrations of ozone upon a switch to E85
The largest differences are again in the central parts of Gothenburg where about 20 of the population is being exposed to a lower benzene concentration of 01-03 microgm3 This also means that concerning benzene the majority (78) of the population have none or very low influence from a change to ethanol fuel
The largest effect on exposure difference is seen for NOX where just over 20 of the population has its exposure decreased with 03-05 microgm3 (in the central parts of Gothenburg) In the suburbs the decrease is between 01-02 microgm3 lower Along the largest roads there is a small but visible improvement on a yearly basis of 01 microgm3
For PM25 there is a difference in the populated weighted mean exposure of 002 gm3 between the scenarios with a lower value for the all-E85 case (see also Appendix 5)
35 Impact on health in Vaumlstra Goumltaland
351 NO2 and NOX
The impact of long-term exposure on mortality was estimated using the relative risk from the Norwegian cohort study (Nafstad et al 2004) reporting a relative risk of 08 increase per microgm3 increase in NOX however without adjustment for particle concentrations Assuming this effect on the total mortality and a typical baseline mortality of 1000 deaths per 100 000 person years a decrease in the population mean exposure of 012 microgm3 would correspond to approximately 104 less preterm deaths per year However for the present case this number is highly uncertain since the exposure to substances normally associated with changes in NOX exposure may here change in different ways since the relation between different exhaust components varies between the scenarios
The impact of long-term exposure on asthma incidence (new cases) in adults has been estimated using results from the Swedish RHINE Study Cohorts (Modig et al 2009) with very similar results in the ECRHS Study corresponding to approx 4 increase per microgm3 increase in NO2 From the RHINE Study the incidence can be estimated to 03 per year (proportion of adults developing the disease) with children and elderly excluded this means around 1500 adult cases per year A reduction of 009 microgm3 corresponds to 54 avoided new cases of adult asthma per year However also NO2 in the asthma study may have been mainly an indicator of vehicle exhaust
352 Ozone
The impact of long-term exposure on respiratory mortality has been reported to be approx 02 per microgm3 increase in the summer concentration when studied in the large ACS Cohort (Jerret et al 2009) Assuming this effect on the total population and a typical baseline respiratory mortality of 100 deaths per 100 000 person years a decrease in the population mean exposure of 012 microgm3 corresponds to approximately 03 less preterm deaths per year
A comparison of emissions from ethanol and petrol fuelled cars IVL report B1962 Health risk assessment for Vaumlstra Goumltaland
23
353 Acetaldehyde
According to US EPA (1999) a lifetime risk for cancer of 0000002 per microgm3 is to be assumed for this potential human carcinogen An increase in the population mean exposure of 012 microgm3 corresponds to 026 cases more per year in the current population
354 Benzene
According to US EPA (1999) a lifetime risk for cancer (leukaemia) of 00000022-00000078 per microgm3 is to be assumed for this human carcinogen A decrease in the population mean exposure of 0074 microgm3 corresponds to approximately 03 cases less per year in the current population (assuming 0000004 per microgm3)
355 PM25
In CAFEacute and other impact assessments a relative risk of 6 increase in all-cause mortality per 10 microgm3 has usually been assumed Assuming this effect on the total mortality and a typical baseline mortality of 1000 deaths per 100 000 person years a decrease in the population mean exposure of 002 microgm3 corresponds to approximately 13 less preterm deaths per year
4 Discussion
In this study the health risks from a large introduction of E85 to replace petrol is analysed in scenario studies for 2020 for the Vaumlstra Goumltaland region It is found that the change in pollutant concentration exposure and health risks are small between the two scenarios It should be emphasized that the study only considers vehicle emissions and does not take into account effects from the fuel production
The emissions of NOX in the model are somewhat lower from E85 fuelled cars than from petrol fuelled cars This is in line with the emission factors used by Jacobson (2007) The nitrogen oxides are key substances in the atmospheric reactions determining the concentrations of ozone in air NOX is involved in the formation of ozone but close to the NO source the ozone concentration is lowered due to the rapid reactions between NO and O3 forming NO2 If NO is released in an environment with already high NO concentration it may result in lowering of ozone levels on the regional scale In the present study the ozone concentrations calculated are somewhat lower for the E85 scenario than for the petrol scenario
The health risk analysis shows that the main difference between the scenarios is due to the lower concentration of NOX However it may have been other exhaust components than NOX such as exhaust particles that were behind the reported association with mortality In cases when NOX is not a good indicator of exhaust particle emissions and their toxicity our results may be misleading This should be studied further Neglecting the effects of the changes in NOX exposure the total difference between the scenarios sums up to 16 preterm deaths per year with lower values for the E85 scenario while it would sum up to 12 less preterm deaths for the E85 scenario if the effect related to NOX were included Since there are no similar studier for the effect on mortality among those younger than 30-50 years of age we assume the same relative effect on mortality in all ages This makes only a small difference since the large majority of deaths occur in older groups
A comparison of emissions from ethanol and petrol fuelled cars IVL report B1962 Health risk assessment for Vaumlstra Goumltaland
24
The opposite result for the ozone concentration was obtained by Jacobson The reason for this discrepancy is that the Jacobson study concerns Los Angeles a region with high concentrations of pollutants while the study here concerns the Vaumlstra Goumltaland region with much less dense traffic and also lower concentrations of pollutants importantly NOX It is not unlikely that the effect that Jacobson report also would be found for large parts of Europe with higher traffic densities than in the Vaumlstra Goumltaland region
It is worth to emphasize that the major negative health effect in the Jacobson (2007) study is attributed to the increase in ozone concentration that is a result of the decrease of the NO emissions from E85 cars Directly after the emission NO reacts with ozone resulting in drop of the ozone concentration the so-called ozone titration commonly observed in many cities This NO does however form even higher quantities of ozone further downwind contributing to the general increase in the background ozone levels It is also precursor of NO2 secondary PM and other toxic species as eg PAN and hence reductions in NO emissions are never regarded as disbeneficial from the environmental viewpoint
There are of course several sources of uncertainties that influence the results of this study Since the main results concern differences between the two scenarios several of these factors loose on importance for the conclusions This comprises uncertainties in meteorology in future traffic volumes and in the population density distribution However there are some uncertainties that remain important The emission factors for E85 fuelled cars are much less characterised than what they are for petrol cars The emission of particles from E85 fuelled cars is especially uncertain with only very few published results Also the emissions of NMHC are somewhat uncertain and may be higher for E85 at lower ambient temperatures However the sensitivity analysis performed shows that for the studied region the NMHC emissions only have a small influence on the ozone concentrations
5 Conclusions
In this study the impact of tailpipe and evaporative emissions from E85 fuelled cars on air pollution and health risks are calculated and compared with petrol fuelled cars The scenario calculations for the Vaumlstra Goumltaland Region give data on emissions pollutant concentrations exposure and a health risk evaluation
The differences in emission factors between E85 and petrol lies in the emissions of PM and NOX which are about 65 and 58 for E85 relative petrol respectively Also the speciation of the emitted hydrocarbons is significantly different with large emissions of acetaldehyde and ethanol from E85 and large emissions of benzene higher aromatics alkanes and alkenes from petrol
These differences in emission factors reflect in differences in emissions The emission calculations for all Swedish road traffic show a decrease for the E85 scenario relative to the petrol scenario of 65 for NOX 34 for PM25 67 for benzene For acetaldehyde there is an increase of 770
The differences obtained from the TAPM modelling show decreased levels of NOX ozone and benzene with E85 and increased levels of acetaldehyde For the latter the increase may be up to 80 while NOX and ozone show decreases of up to a few per cent and a few tenths of per cent respectively
A comparison of emissions from ethanol and petrol fuelled cars IVL report B1962 Health risk assessment for Vaumlstra Goumltaland
25
The health risk assessment shows decreased health risks in the E85 scenario relative the all-petrol scenario due to the increased NOX exposure correlated with both preterm deaths and asthma However NOX may be mainly an exhaust indicator Smaller effects are expected from the changes in ozone acetaldehyde and benzene exposure The overall difference considering the exposure to PM acetaldehyde benzene and ozone is 16 preterm deaths with lower values for the E85 scenario
6 Acknowledgements
Saab Automobile The Swedish Transport Administration and The Foundation for the Swedish Environmental Research Institute are gratefully acknowledged for financial contribution
Magnus Ekstroumlm and Maria Holmstroumlm at Saab and Martin Juneholm at the Swedish Transport Administration are acknowledged for their most valuable input to the study
David Simpson Norwegian Meteorological Institute EMEP MSC-W Norway and Dept Radio amp Space Science Chalmers Univ Technol Sweden is gratefully acknowledged for help with implementation of the Unified EMEP model
A comparison of emissions from ethanol and petrol fuelled cars IVL report B1962 Health risk assessment for Vaumlstra Goumltaland
26
7 References
Altenstedt J Pleijel K 2000 An alternative approach to photochemical ozone creation potentials under European conditions J Air amp Waste Manage Assoc 50 1023 ndash 1036
Andre J-M (2005) Vehicle emission measurement collection of the ARTEMIS datatbase Artemis 3312 report Available from httpwwwinretsfrurltepublicationspublications-pdfJoumardA3312reportJMALTE0504pdf
Bachand A MMundt K A Mundt D JMontgomery R R Epidemiological studies of formaldehyde exposure and risk of leukemia and nasopharyngeal cancer A meta-analysis Critical Reviews in Toxicology 2010 40(2) 85ndash100
Beane Freeman L E Blair A Lubin J H Stewart P A Hayes R B Hoover R N Hauptmann M Mortality from lymphohematopoietic malignancies among workers in formaldehyde industries The National Cancer Institute Cohort J Natl Cancer Inst 2009101751ndash761
Bosetti C McLaughlin J K Tarone R E Pira E LaVecchia C Formaldehyde and cancer risk A quantitative review of cohort studies through 2006 Ann Oncol 20081929ndash43
ConcaweJRC Well-to-wheel studies httpiesjrceceuropaeuwtwhtml
Derwent R G Jenkin M E Saunders S M 1996 Photchemical ozone creation potentials for a large number of reactive hydrocarbons under European conditions Atmos Environ 30 181 ndash 199
Derwent RG Jenkin ME Passant NR Pilling MJ 2007 Photochemical ozone creation potentials (POCPs) for different emission sources of organic compounds under European conditions estimated with a Master Chemical Mechanism Atmos Env 41 2570ndash2579
EEA Copenhagen 2009 wwweeaeuropaeudata-and-mapsdatapopulation-density-disaggregated-with-corine-land-cover-2000-2
Ericsson P Holmstroumlm M Amberntsson-Carlsson A Ohlson C Skoglundh M Andersson B Carlsson P-A 2008 Characterization of particulate emissions and methodologhy for oxidation of particulates from non-diesel combustion ystems SAE Technical Paper Series 2008-01-1746
GAINS 2010 httpgainsiiasaacatindexphpgains-europe
Graham LA Belisle SL Baas C-L Emissions from light duty gasoline vehicles operating on low blend ethanol gasoline and E85 Atmospheric Environment 42 4498 (2008)
Haskew H M Thomas P E Liberty F 2006 Fuel Permeation From Automotive Systems E0 E6 E10 E20 And E85 Final Report CRC Project No E-65-3 Coordinating Research Council Inc 3650 Mansell RoadSuite 140Alpharetta GA 30022
HEI Air Toxics Review Panel (2007) Mobile-Source Air Toxics A Critical Review of the Literature on Exposure and Health Effects HEI Special Report 16 Health Effects Institute Boston USA
Hurley P TAPM v 4 User Manual 2008 CSIRO ISBN 978-1-921424-73-1
IARC (2006) IARC Monographs on the Evaluation of Carcinogenic Risks to Humans Wood Dusts and Formaldehyde Lyon World Health Organization International Agency for Research on Cancer Lyon France 8837ndash325
Jacobson M Z Effects of Ethanol (E85) versus Gasoline Vehicles on Cancer and Mortality in the United States Environ Sci Technol 2007414150-4157
A comparison of emissions from ethanol and petrol fuelled cars IVL report B1962 Health risk assessment for Vaumlstra Goumltaland
27
Jerret M Burnett R T Pope C A Ito K Thurston G Krewski D Shi Y Calle E Thun M Long-Term Ozone Exposure and Mortality N Engl J Med 20093601085-95
Lipman T E Delucchi M A 2002 Emissions of nitrous oxide and methane from conventional and alternative fuel motor vehicles Climate Change 53 477
Modig L Toreacuten K Janson C Jarvholm B Forsberg B Vehicle exhaust outside the home and onset of asthma among adults Eur Respir J 2009 Jun33(6)1261-7
Nafstad P Haheim L L Wisloff T Gram F Oftedal B Holme I Hjermann I Leren P Urban air pollution and mortality in a cohort of Norwegian men Environ Health Perspect 2004112(5)610-5
OEHHA (1999) Air Toxics Hot Spots Program Risk Assessment Guidelines Part II Technical Support Document for Describing Available Cancer Potency Factors Prepared by the Air Toxicology and Epidemiology Section Office of Environmental Health Hazard Assessment April 1999
Passant NR (2002) Speciation of UK emissions of non-methane volatile organic compounds AEAT report AEATENVR0545 Issue 1 Culham UK
Pope CA III Thun MJ Namboodiri MM Dockery DW Evans JS Speizer FE Heath CJ Particulate air pollution as a predictor of mortality in a prospective study of US adults Am J Resp Crit Care Med 1995 151 669-674
Seinfeld J H and Pandis SN (1998) Atmospheric Chemistry and Physics From Air Pollution to Climate Change John Wiley amp Sons New YorkSimpson D Fagerli H Jonson JE Tsyro S Wind P Tuovinen J -P 2003 Transboundary acidification and eutrophication and ground level ozone in Europe Unified EMEP Model Description EMEP Status Report 12003 Part I EMEPMSC-W Report The Norwegian Meteorological Institute Oslo Norway
US EPA (1999) httpwwwepagovttnatwnata1999nsata1999
Vestreng V et al 2004 Inventory Review 2004 Emission data reported to CLRTAP and the NEC Directive EMEPEEA Joint Review Report EMEPMSC-W Note 1
Westerholm R Ahlvik P Karlsson HL An exhaust characterisation study based on regulated and unregulated emissions from bi-fuel and flexi-fuel light-duty passanger cars fuelled by petrol (E5) bioethanol (E70 E75) and biogas tested at ambient temperatures of +22degC and -7degC 2008
Wolkoff P Nielsen G D Non-cancer effects of formaldehyde and relevance for setting an indoor air guideline Environment International 201036788ndash799
Yanowitz J McCormick RL Effect of E85 on tailpipe emissions from light-duty vehicles J Air amp Waste Manage Assoc 59 172 (2009)
A comparison of emissions from ethanol and petrol fuelled cars IVL report B1962 Health risk assessment for Vaumlstra Goumltaland
28
Appendix 1 Evaporate emissions of NMHC
The following assumptions are done for evaporative emissions The NMHC emissions from E85 are reduced relative to petrol by 45 Methane emissions are zero and the split of NMHC species is 68 ethanol and the remaining 32 is divided in the same way as evaporative emissions for petrol The estimates by Graham et al (2008) are missing evaporative emission data however these assumptions agrees very well with measurements of evaporative emissions due to fuel permeation reported by Haskew et al (2006) where NMHC emissions are reported to be reduced by 50 for E85 fuel compared to petrol Haskew et al also presents the NMHC split to species with 60 ethanol This number agrees quite well with our assumption of 68 NMHC being ethanol NMHC in exhaust and evaporative emissions are thus divided as in Table A1
Table A1 Division of NMHC in the exhaust and evaporative emissions for E85 and petrol respectively (wt)
E85 Petrol E85 Petrol exhaust exhaust evaporative evaporative
Ethanol 680 0 680 0 Acetaldehyde 131 08 02 0 Ethene 99 73 24 0 Ethyne 03 28 09 0 Formaldehyde 31 17 06 0 Benzene 16 56 18 10 13 Butadiene 03 09 03 0 sum 963 191 741 10
The remaining NMHC emissions are divided as for petrol (ref) and listed in Table A2
Table A2 Division of NMHC in the exhaust and evaporative emissions for E85 and petrol respectively (wt)
E85 Petrol E85 Petrol exhaust exhaust evaporative evaporative
Ethane 02 32 10 0 Alkanes (C3+) 13 278 89 880 Alkenes (C3+) 04 90 29 95 Aromatics (C7+) 18 388 125 15 Aldehydesketones (C3+)
01 15 05 0
A comparison of emissions from ethanol and petrol fuelled cars IVL report B1962 Health risk assessment for Vaumlstra Goumltaland
29
Appendix 2 Description of the model system
A21 Atmospheric lifetimes
Table A3 gives tropospheric lifetimes with regard to reaction of ethanol formaldehyde acetaldehyde and benzene (C6H6) with OH nitrate radical (NO3) and photolysis The studied organic species are listed together with three species common in the gasoline exhaust (benzene ethene and toluene) for comparison Table 11 shows also photochemical ozone creation potential (POCP) of these species POCP is a measure of amount of ozone that is formed from a certain VOC emission relatively to other emission source which has been established to the same emission mass of ethene (Derwent et al 1996 Altenstedt et al 2000) The range represents different scenarios for VOC and NOX background concentrations Derwent et al (2007) used similar methodology to calculate POCP of different VOC sources and calculated POCP of mean road emission exhaust to be 69
Table A3 Atmospheric lifetimes of studies NMVOC species with respect to the OH- and NO3- initiated
degradation τ(OH) and τ(NO3) and with respect to the photolysis (The lifetime of a chemical species which decays in a first-order process is the time needed for a concentration of this species to decrease to 1e of its original value Statistically it represents the mean life expectancy of an excited species) The OH concentration of 1times106 moleculescm3 typical for summer troposphere was used for the lifetime calculation The NO3 concentrations of 5 and 100 ppt(V) were used for lifetime calculations as representative of rural and urban night-time 12 hrs mean concentration The studied organic species are listed together with 3 species common in the gasoline exhaust for comparison The rates of photolysis were calculated with radiation transfer model for July 58ordm latitude and integrated over 24 hours
τ(OH) τ(NO3) urbanrural τ (photolysis) POCP
hr hr hr
Ethanol 85 56 1times103 - 44 - 63
Acetaldehyde 15 47 1times103 86 68 - 80
Formaldehyde 30 194 4times103 10 18 - 55
Benzene 214 - - 23 - 47
Ethene 34 - - 100
Toluene 50 - - 30 - 67
A22 Defining of boundary concentrations for TAPM from EMEP fields
Calculation of initial concentration field for TAPM from EMEP concentration field of NO2 (as example) and EMEP mean wind vector components u_mid and v_mid Two EMEP model gridcells (i=56 j=60 and i=56 j=61) represent the TAPM model domain and concentrations from the surrounding EMEP gridcells SE-S SE-N NW-S NW-N NE NW (Figure A1) are used for calculation of boundary concentration NO2(bc) according to the following code if u_mid lt= 0 then ( isite = SE-S and jsite = SE-N) else isite = NW-S and jsite = NW-N) endif
A comparison of emissions from ethanol and petrol fuelled cars IVL report B1962 Health risk assessment for Vaumlstra Goumltaland
30
if v_mid lt= 0 then ( ksite = NE) else ksite = SW endif NO2(bc) = [(NO2(isite)u_mid(isite) + NO2(jsite)u_mid(jsite))2 + NO2(ksite)v_mid(ksite)] [(u_mid(isite) + u_mid(jsite))2 + v_mid(ksite)]
Figure A1 Gridcells covering Gothenburg domain and its boundary in EMEP model plotted on latitude-
longitude coordinates The red square represents centre of Gothenburg and the blue line the coastline EMEP i and j coordinates for the boundary gridcells are SE-S = 57-60 SE-N = 57-61 NW-S = 55-60 NW-N = 55-61 NE = 56-62 NW = 56-59 and for Gothenburg grid cells are Gbg-NE = 56-61 Gbg-SW = 56-60
A23 Atmospheric chemistry
The role of secondary chemistry in for the concentration of acetaldehyde are studied by first excluding the primary acetaldehyde emissions from the EMEP model simulations of scenarios S1 and S2 and then by excluding all NMVOC emissions from the car category with spark ignition engines The contribution from the primary acetaldehyde emissions as well as the contribution of secondary acetaldehyde formed from other NMVOC to the total acetaldehyde concentration is then obtained However the secondary chemistry is highly nonlinear due to the interactions of NMVOCs with ozone and OH and thus the results for the contribution of secondary acetaldehyde are somewhat uncertain Differences in acetaldehyde concentrations between S1 and S2 scenarios are studied with respect to contribution of primary and secondary acetaldehyde It is observed that in summer background air the monthly mean contribution of the secondary acetaldehyde is of the same magnitude as the contribution of the primary acetaldehyde to the difference between S1 and
565
57
575
58
585
105 115 125 135 145
Long
Lat
Gbg-SW
Gbg-NE
SE-S
NW-N
NW-S
SE-N
SW
NE
55-59
57-59
55-62
A comparison of emissions from ethanol and petrol fuelled cars IVL report B1962 Health risk assessment for Vaumlstra Goumltaland
31
S2 In the winter and in more polluted atmosphere (Gothenburg grid cells) the contribution from secondary acetaldehyde to the concentration difference appears to be negative due to the chemistry feedback ie the E-85 scenario has less secondary acetaldehyde than the all-petrol scenario
A comparison of S2-S1 differences in primary and secondary acetaldehyde concentrations in the background (=upwind) and Gothenburg grid cells show no increase in the secondary acetaldehyde from upwind to the Gothenburg grid cell It can thus be concluded that there is no significant contribution from secondary aldehydes on the small scale (tenths of km) Conclusion from this sensitivity study is that the secondary formaldehyde can be of importance under summer in the clean background air but that formation on the local scale is unimportant Using EMEP simulated boundary concentrations of acetaldehyde in the local scale model and simulating the primary acetaldehyde emissions will capture the most important features of acetaldehyde dispersion and chemistry in Vaumlstra Goumltaland
In the EMEP model the tail-pipe PM emissions are specified as primary particles Emissions of NOX and VOCs (and NH3 SO2) are oxidised in the atmosphere and a part is then transferred through the gas-to-particle transport to the PM as secondary PM The petrol fuelled cars emit both more primary PM and more NOX compared to the E85 cars If we compare differences in primary and secondary PM between the S1 and S2 scenarios simulated by EMEP we can directly see what part of the difference is from the tail-pipe emissions of the primary particles and what part is from the formation of the secondary PM in atmosphere (mostly from higher emissions of NOX) Table A4 shows the differences between S1 and S2 (S1-S2) of monthly PM averages for January and June (two months with low and high photochemical activities respectively) It can be seen that the higher formation of secondary PM in the S1 (all-petrol) scenario is more important than the higher tail-pipe emission of primary PM by factor 10 - 20
When we compare simulated PM differences between S1-S2 for the background air (=upwind) grid cells and for grid cells including Gothenburg (50 km x 50 km scale) we can see significant increase in primary PM in the S1 scenario from the upwind grid cells to Gothenburg (746 in winter 132 in summer) while no systematic increase can be seen for the secondary PM (-42 in winter +24 in summer) From this comparison it can be concluded that no systematic increase in secondary PM can be seen (in difference from the primary PM) on the scale of 50-100 km and we can neglect this process on the small scale However the overall change in PM concentrations due to the switch of the fuel is very small both on the large scale and on the small scale as can be seen when the differences in PM concentrations between S1 and S2 are compared to absolute PM concentrations in S1 presented in the last column of Table A4
Table A4 Differences in primary and secondary PM concentrations between the lsquoAll-petrolrsquo (S1) and lsquoE-85rsquo (S2) scenarios simulated in gridcells upwind Gothenburg and in gridcells including Gothenburg (2 50 km x 50 km gridcells)
S1-S2 Background
S1-S2 Gothenburg
Increase S1-S2 Gothenburg
S1 Background
μgm3 μgm3 μgm3 bkgnd μgm3
Prim PM10 Jan 00008 00014 00006 746 084
Jun 00008 00018 00010 1319 084
Sec PM10 Jan 00155 00148 -00006
-42 157
Jun 00080 00081 00002 24 213
The sensitivity of the used emission factors for NMHC with respect to the ozone formation in the region of the Swedish West Coast can be analysed with the help of results from studying the
A comparison of emissions from ethanol and petrol fuelled cars IVL report B1962 Health risk assessment for Vaumlstra Goumltaland
32
formation of secondary acetaldehyde In this study first all primary acetaldehyde emitted by the E85 fleet are omitted in a model simulation (S2_nopAA) and secondly all NMHC emissions from the E-85 fleet are switched off (S2_noVOC) Acetaldehyde has a somewhat higher though still comparable photochemical ozone creation potential compared to ethanol (ethanol 44-63 acetaldehyde 68-80 Altenstedt and Pleijel 2000) and this simulation will thus also give information on the sensitivity of the calculations to uncertainties in the ethanol emissions Setting the emission factor for NMHC to zero gives the sensitivity to the emission factor of total NMHC Figure A2 shows the differences in ozone concentration as a result of acetaldehyde only and the total NMHC from the E85 car fleet (S2 scenario) We can see that the effect on ozone formation is very small for the Swedish West coast The reason is that the ozone formation in this area is controlled by the availability of NOX while NMHC or rather their degradation products the peroxy radicals that serve as a lsquofuelrsquo to ozone formation are usually in excess here and further VOC emissions do not increase ozone concentrations significantly The situation looks different in areas that are more heavily polluted with NOX andor which is limited in the availability of peroxy radicals The results from this sensitivity study are fully consistent with the observed increase in ozone concentrations as a result of lower NO emissions (the so-called ozone titration) only very close to the major roads but no larger-scale decrease in ozone concentrations in the Gothenburg area or in any other communities
Figure A2 Sensitivity of the ozone formation in the 2 EMEP model grid cells covering Gothenburg (blue) and in the 6 surrounding grid cells (red see Fig A1) to changes in NMHC emission factor of the E85 fuelled cars lsquobasersquo is simulation S2 with EF for NMHC as in Table 3 lsquonoVOCrsquo is S2 with EF for all NMHC = 0 lsquonopAArsquo is S2 with EF for acetaldehyde = 0 a ndash Mean sensitivity in January absolute difference in ozone formation in ppb(V) as a result of NMHC (base-noVOC) and acetaldehyde (base-nopAA) emissions b ndash Sensitivity relative to ozone concentration in the S2-base simulation January c ndash same as a) but June d ndash same as b) but June
‐002
‐001
0
001
base‐noVOC base‐nopAA
ΔO3(ppb)
a)
0
001
002
base‐noVOC base‐nopAA
ΔO
3(ppb)
c)
‐010
‐005
000
005
base‐noVOC base‐nopAA
ΔO
3
b)
000
002
004
006
base‐noVOC base‐nopAA
ΔO
3
d)
A comparison of emissions from ethanol and petrol fuelled cars IVL report B1962 Health risk assessment for Vaumlstra Goumltaland
33
Appendix 3 Emission results
The geographically distributed NOX and acetaldehyde emissions for the Vaumlstra Goumltaland region are presented in Figures A3 and A4 respectively
Figure A3 NOX emissions for the Vaumlstra Goumltaland region for the All Petrol scenario
A comparison of emissions from ethanol and petrol fuelled cars IVL report B1962 Health risk assessment for Vaumlstra Goumltaland
34
Figure A4 Acetaldehyde emissions for the Vaumlstra Goumltaland region for the All Ethanol scenario
A comparison of emissions from ethanol and petrol fuelled cars IVL report B1962 Health risk assessment for Vaumlstra Goumltaland
35
Appendix 4 Dispersion modelling results
The difference in yearly average concentration between scenario S1 and S2 for acetaldehyde and benzene can be seen in Figure A5 and Figure A6 respectively a)
b)
Figure A5 The difference in yearly average concentrations of acetaldehyde for 2020 between the all E85 (S2) and all petrol (S1) scenarios presented as a) microgm3 and as b) percentage for the Gothenburg area
A comparison of emissions from ethanol and petrol fuelled cars IVL report B1962 Health risk assessment for Vaumlstra Goumltaland
36
a)
b) all E85 c) all petrol
Figure A6 a) the difference in yearly average concentrations (gm3) of benzene for 2020 between the all E85 (S2) and all petrol (S1) scenarios yearly means for b) all E85 and c) all petrol (note the different scales)
The difference in the calculated NOX NO2 and ozone concentrations between the two scenarios are shown in Figures A7 A8 and A9
A comparison of emissions from ethanol and petrol fuelled cars IVL report B1962 Health risk assessment for Vaumlstra Goumltaland
37
a)
b)
Figure A7 The difference in yearly average concentrations of NOX for 2020 between the all E85 (S2) and all petrol (S1) scenarios presented as a) microgm3 and as b) percentage for the Gothenburg area
A comparison of emissions from ethanol and petrol fuelled cars IVL report B1962 Health risk assessment for Vaumlstra Goumltaland
38
a)
Figure A8 The difference in yearly average concentrations of NO2 for 2020 between the all E85 (S2) and all petrol (S1) scenarios presented as a) microgm3 and as b) percentage for the Gothenburg area
A comparison of emissions from ethanol and petrol fuelled cars IVL report B1962 Health risk assessment for Vaumlstra Goumltaland
39
a)
b)
Figure A9 The difference in yearly average concentrations of ozone for 2020 between the all E85 (S2) and all petrol (S1) scenarios presented as a) microgm3 and as b) percentage for mainly the Gothenburg area
A comparison of emissions from ethanol and petrol fuelled cars IVL report B1962 Health risk assessment for Vaumlstra Goumltaland
40
Appendix 5 Detailed Exposure data
Detailed exposure data for the difference between the all E85 (S2) and the all petrol (S1) scenarios can be found in Table A5
Table A5 Exposure data for the difference between the all E85 (S2) and the all petrol (S1) scenarios
Acetaldehyde diff E-P (microgm3)
Populated weighted mean
Number of people Percentage of population
0 - 01 627198 582 01 - 02 163394 152 02 - 03 134879 125 03 - 04 88099 82 04 - 05 38686 36 05 - 06 16880 16 06 - 07 7983 07 07 - 08 1248 01 Tot 014 1078367 Benzene diff E-P (microgm3)
Populated weighted mean
Number of people Percentage of population
-03 - -02 26680 25 -02 - -01 205757 191 -01 - -0 845930 784 Tot -0074 1078367 NO2 diff E-P (microgm3) Populated weighted
mean Number of people Percentage of
population -04 - -03 7698 07 -03 - -02 50131 46 -02 - -01 296288 275 -01 - -0 724250 672 Tot -009 1078367 NOX diff E-P (microgm3) Populated weighted
mean Number of people Percentage of
population -06 - -05 7698 -05 - -04 19639 18 -04 - -03 36626 34 -03 - -02 161685 150 -02 - -01 186500 173 -01 - -0 666219 618 Tot -012 1078367 O3 diff E-P (microgm3) Populated weighted
mean Number of people Percentage of
population -02 - -01 779132 723 -01 - -0 266417 247 0 - 01 32818 30 Tot -012 1078367
Exposure data for the total levels in the two scenarios can be found in Table A6
A comparison of emissions from ethanol and petrol fuelled cars IVL report B1962 Health risk assessment for Vaumlstra Goumltaland
41
Table A6 Exposure data for the total levels in the two scenarios
Acetaldehyde tot All ethanol (microgm3)
Populated weighted mean
Number of people Percentage of population
06 - 07 568825 527 07 - 08 171845 159 08 - 09 124551 115 09 - 10 100946 94 10 - 11 59235 55 11 - 12 30559 28 12 - 13 13175 12 13 - 14 7983 07 14 - 15 1248 01 Tot 077 1078367 Acetaldehyde tot All petrol (microgm3)
Populated weighted mean
Number of people Percentage of population
05 - 06 45111 42 06 - 07 1032008 957 07 - 08 1248 01 Tot 065 1078367 Benzene tot All ethanol (microgm3)
Populated weighted mean
Number of people Percentage of population
0 - 01 1055961 98 01 - 02 22406 2 Tot 005 1078367 Benzene tot All petrol (microgm3)
Populated weighted mean
Number of people Percentage of population
0 - 01 729093 676 01 - 02 232961 216 02 - 03 94042 87 03 - 04 21023 19 04 - 05 1248 01 Tot 010 1078367 NOX tot All ethanol (microgm3)
Populated weighted mean
Number of people Percentage of population
0-10 779108 722 10-20 254658 236 20-30 28683 27 30-40 11070 10 40-50 3426 03 50-60 0 00 60-70 0 00 70-80 639 01 80-90 0 00 90-100 0 00 100-110 783 01 Tot 84 1078367 NOX tot All petrol (microgm3)
Populated weighted mean
Number of people Percentage of population
0-10 769557 714 10-20 264209 245 20-30 28683 27 30-40 11070 10 40-50 3426 03 50-60 0 00
A comparison of emissions from ethanol and petrol fuelled cars IVL report B1962 Health risk assessment for Vaumlstra Goumltaland
42
60-70 0 00 70-80 639 01 80-90 0 00 90-100 0 00 100-110 783 01 Tot 85 1078367 O3 tot All ethanol (microgm3)
Populated weighted mean
Number of people Percentage of population
40-45 1422 01 45-50 26487 25 50-55 176636 164 55-60 770370 714 60-65 103452 96 Tot 569 1078367 O3 tot All petrol (microgm3)
Populated weighted mean
Number of people Percentage of population
40-45 1422 01 45-50 20229 19 50-55 181876 169 55-60 763361 708 60-65 111479 103 Tot 570 1078367 PM25 tot All ethanol (microgm3)
Populated weighted mean
Number of people Percentage of population
1-2 0 00 2-3 885325 821 3-4 192259 178 4-5 783 01 Tot 268 1078367 PM25 tot All petrol (microgm3)
Populated weighted mean
Number of people Percentage of population
1-2 0 00 2-3 868773 806 3-4 208811 194 4-5 783 01 Tot 270 1078367
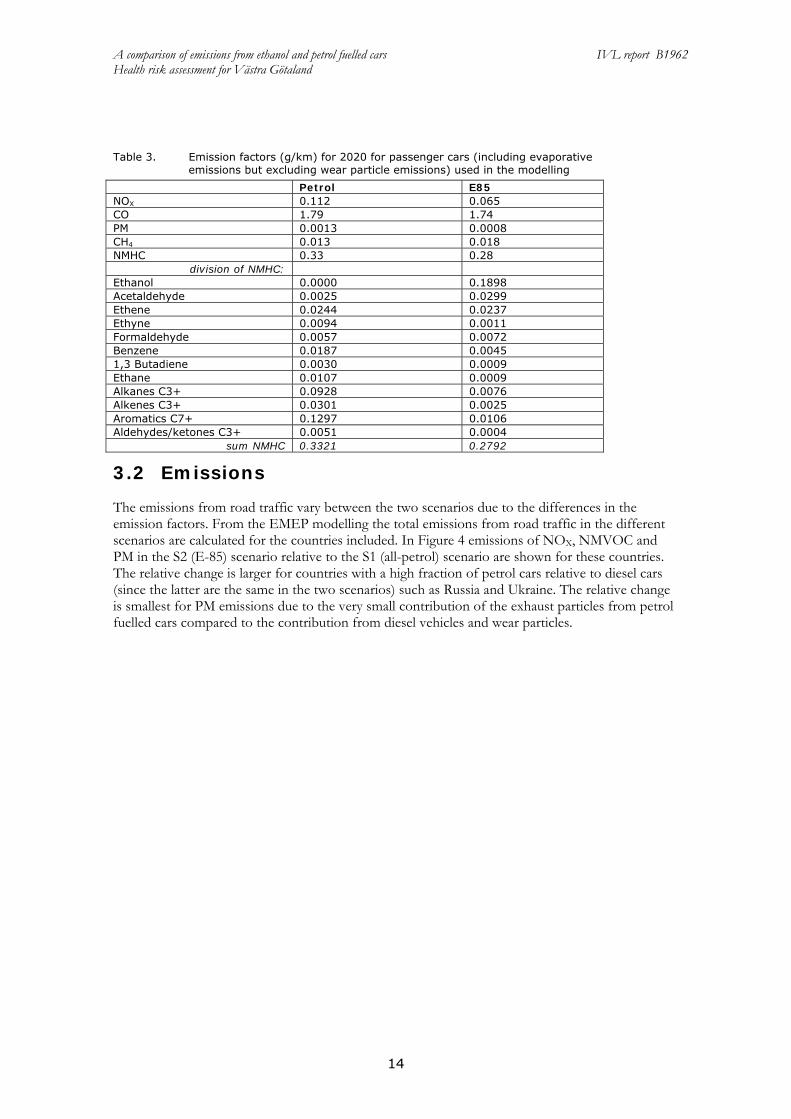
A comparison of emissions from ethanol and petrol fuelled cars IVL report B1962 Health risk assessment for Vaumlstra Goumltaland
16
will have a significant impact on the total road traffic NMVOC speciation As can be seen in Figure 5 scenario S1 is dominated by alkanes and aromatics while scenario S2 is dominated by ethanol It can also be noted that S1 contains a significant emission of benzene which is much lower in S2 while the opposite is true for acetaldehyde
Figure 5 Distribution of hydrocarbon species in NMVOC emissions from individual road traffic emission
categories as defined in emission scenarios in this study and from the whole road traffic emission sector in Sweden for scenarios S1 (All petrol) and S2 (All E85)
Figure 6 shows a map of the EMEP domain with emissions of acetaldehyde for the two studied scenarios as an example of the geographical distribution of emissions
Figure 6 Gridded emissions of acetaldehyde for the year 2020 (in tonnes per grid cell (50 km x 50 km)
and year) a ndash lsquoAll petrol scenario b ndash lsquoAll E85 scenariorsquo
As mentioned the emissions from road traffic in the Vaumlstra Goumltaland region are calculated in a 500 m x 500 m grid Figure 7 shows the emissions of NOX for 2005 as obtained from the database and the projected emissions for 2020 with a mixed use of E85 and petrol This can be considered as the base case for the emissions in 2020 It can be seen that the emissions decrease over the period which is due to reduction in NOX emissions factors as older vehicles are replaced by newer models (the traffic actually increases from a total of 754x109 vehicle-kilometres in 2005 to 937x109
0
20
40
60
80
100
Pet
rol e
xh
Pet
rol e
vap
E-8
5 ex
h
E-8
5 ev
ap
Pet
rol M
C
Die
sel L
DV
Die
sel H
DV
Roa
d Sw
eden
S1
Roa
d Sw
eden
S2
m
ass
Ethane
Alkanes C3+
Ethene
13 Butadiene
Alkenes C3+
Ethyne
Benzene
Aromatics C7+
Formaldehyde
Acetaldehyde
Aldket C3+
Ethanol
A comparison of emissions from ethanol and petrol fuelled cars IVL report B1962 Health risk assessment for Vaumlstra Goumltaland
17
vehicle-kilometres in 2020) The major roads in the region are clearly visible as well as the larger cities (especially Gothenburg)
Figure 7 Emissions of NOX (kgyear for a 500 m x 500 m grid cell) in the Vaumlstra Goumltaland region for 2005
and for 2020 for the base case
In Table 4 the traffic emissions for NOX benzene acetaldehyde ethanol and PM10 for the Vaumlstra Goumltaland region are shown for the four different emissions scenarios The emissions of NOX and benzene are reduced between 2005 and 2020 for the base case while the emissions of ethanol and acetaldehyde increase due to an expected increase in the use of ethanol fuel The NOX emissions for S1 are somewhat higher than for S2 due to the higher NOX emissions factor for petrol compared with E85
Table 4 Emissions from traffic for the Vaumlstra Goumltaland region in four different emission scenarios (in tonnesyear)
Substance base 2005 base 2020 S1 S2 NOX 13 243 4 843 4 954 4 631 Benzene 2 833 927 1 201 386 Acetaldehyde 628 1 074 305 2 595 Ethanol 192 5 192 0 15 400 PM10 1 324 486 483 476
33 Dispersion modelling
Resulting concentrations from calculations of the S1 and S2 scenarios with the EMEP model are used to provide input of primary and secondary air pollutants for the calculations with the TAPM model for the Vaumlstra Goumltaland region Concentrations of NOX NMVOC PM25 PM10 acetaldehyde ethanol and benzene are therefore calculated as boundary conditions for the Vaumlstra Goumltaland region In addition sensitivity studies are performed to investigate the role of formation of secondary acetaldehyde and secondary particulate matter (see Appendix 2) Time series analysis of the TAPM and EMEP model results of the S1 and S2 scenarios are presented in Figure 8
A comparison of emissions from ethanol and petrol fuelled cars IVL report B1962 Health risk assessment for Vaumlstra Goumltaland
18
a)
b)
Figure 8 Time series analyses of S1 and S2 scenarios for the EMEP and TAPM modelled concentrations of NOX and ozone at an urban background site in Gothenburg (TAPM) and in EMEP model grid cells including Gothenburg city (50 km x 50 km)
Concentrations of NOX and ozone at an urban background site in Gothenburg (TAPM) and in the 50 km x 50 km EMEP grid cells including Gothenburg are compared for one summer and one winter month Due to the well-known process of ozone titration by freshly emitted nitrogen monoxide (Seinfeld and Pandis 1998) the concentration of ozone often decreases in urban areas This phenomenon is expected to be captured by the fine-gridded TAPM model but not necessarily by the courser scale of the EMEP model Figure 8 shows the generally higher NOX levels in the small grid cell of the TAPM model in urban background location comparing to those in the large EMEP grid cell while the opposite is observed for the ozone concentrations (Remember that the boundary concentrations for TAPM are obtained from the EMEP model and they are thus the same in both cases) This indeed shows that local scale emissions and processes contribute to locally increased levels of NOX in urban areas both for the summer and the winter cases For ozone where there of course are no primary emissions the situation is the opposite where instead the result is decreased concentration levels at urban sites on a local scale The influence of the
A comparison of emissions from ethanol and petrol fuelled cars IVL report B1962 Health risk assessment for Vaumlstra Goumltaland
19
NMHC emissions from the passenger cars is studied in a sensitivity analysis (see Appendix 23) and it is found to have only a small influence on the ozone levels
To illustrate the results of the different scenario calculations the geographically distributed concentrations are presented as the difference in yearly average concentrations between the all E85 (S2) and all petrol (S1) scenarios both as microgm3 and sometimes as percentage of the difference to scenario S1 (see Appendix 3)
The difference in yearly average concentrations between scenario S1 and S2 for acetaldehyde and benzene can be seen in Figures 9 and 10 respectively The increase in acetaldehyde concentration resulting from a switch from petrol to E85 is up to about 05 gm3 or 80 in the central parts of the largest urban area of the region Gothenburg Outside this area the relative increase is about 10 for the other urban areas and less than that for the rural areas This large relative increase (see map in Appendix 4) is a result of the relatively high emissions of acetaldehyde from E85 fuelled cars For benzene the situation is opposite In the scenarios for 2020 the concentration of benzene decreases by up to a few tenths of gm3 as a result of a switch from petrol to E85 For benzene the relative change is not calculated
Figure 9 The difference in yearly average concentrations of acetaldehyde for 2020 between the all E85 (S2) and all petrol (S1) scenarios (microgm3)
A comparison of emissions from ethanol and petrol fuelled cars IVL report B1962 Health risk assessment for Vaumlstra Goumltaland
20
Figure 10 The difference in yearly average concentrations (gm3) of benzene for 2020 between the all E85 (S2) and all petrol (S1) scenarios
The difference in the calculated NOX NO2 and ozone concentrations between the two scenarios are shown in Appendix 4 The change in NOX concentration between the two scenarios only represents a small fraction of the total NOX concentration This is because the emissions of NOX from petrol cars are relatively low compared with the contribution from diesel engines and other sources Thus the resulting decrease in the NOX concentration with E85 is only up to 3 For ozone there is a small increase of about 01 microgm3 of E85 in the central areas of Gothenburg where there is relatively high traffic intensity (see Appendix 4 Figure A9) In the rest of the region there is a small decrease in the ozone concentration in the E85 scenario
34 Exposure
The resulting concentrations from the dispersion modelling together with the population density distribution are used to assess the exposure to acetaldehyde benzene NO2 NOX and ozone for the two scenarios S1 and S2 The exposure to PM25 is very similar for the two scenarios (the difference in concentration between scenarios S2 and S1 is only about -002 gm3 Table 5 shows the population weighted mean exposure both as total concentrations and as the difference between the two scenarios Detailed exposure results can be found in Appendix 5 It can be seen that the exposure to all the pollutants in Table 5 with the exception of acetaldehyde are somewhat lower for the all E85 scenario (S2) than for the all petrol scenario (S1) However the effect on health also
A comparison of emissions from ethanol and petrol fuelled cars IVL report B1962 Health risk assessment for Vaumlstra Goumltaland
21
depends on the level of the dose-response functions For example if the level of concentration is low in a populated area but the dose-response function is high the effect of even a low concentration increase can become important The increase in exposure from S1 to S2 (S2-S1) calculated as percentage of the population exposed to increased mean concentrations of pollutants is presented in Figure 11
Table 5 Populated weighted mean exposure (gm3)
S1 S2 S2-S1 Acetaldehyde 065 077 014 Benzene 01 005 -007 NOX 85 84 -012 Ozone 570 569 -012 PM25 270 268 -002
Increased concentrations Decreased concentrations Both increased and
decreased conc
Figure 11 The relative exposure (S2-S1) calculated as percentage of the population
In Figure 11 it is clear that the only pollutant that does not show an improvement regarding air quality and thus the health risks when modelling a switch from petrol to E85 is acetaldehyde For all pollutants except for ozone the changes of concentration levels observed between the scenarios are within the urban areas but for ozone there are also differences in rural areas
According to the data in Figure 11 about 14 of the population in the Vaumlstra Goumltaland region will be exposed to 03-08 microgm3 higher concentration levels of acetaldehyde in scenario S2 relative to S1 From Figure 9 it can be seen that the majority of these people live within the Gothenburg area Further about 28 of the population will be exposed to increased levels of between 01 to 03 microgm3 mainly in the suburban areas and rural surroundings of Gothenburg but also in some of the smaller cities in the region Outside the urban areas the concentration difference is lower than 01 microgm3
In the S2 scenario relative to the S1 scenario the population is exposed to decreased concentration levels of benzene and NOX This is mainly true also for O3 but with an exception for the central
A comparison of emissions from ethanol and petrol fuelled cars IVL report B1962 Health risk assessment for Vaumlstra Goumltaland
22
parts of Gothenburg where the concentration actually increases (see Appendix 4 Figure 7A) resulting in that 3 (blue area in Figure 11 for O3) of the population will be exposed to higher concentrations of O3 For the rest of the area there are decreased concentrations of ozone upon a switch to E85
The largest differences are again in the central parts of Gothenburg where about 20 of the population is being exposed to a lower benzene concentration of 01-03 microgm3 This also means that concerning benzene the majority (78) of the population have none or very low influence from a change to ethanol fuel
The largest effect on exposure difference is seen for NOX where just over 20 of the population has its exposure decreased with 03-05 microgm3 (in the central parts of Gothenburg) In the suburbs the decrease is between 01-02 microgm3 lower Along the largest roads there is a small but visible improvement on a yearly basis of 01 microgm3
For PM25 there is a difference in the populated weighted mean exposure of 002 gm3 between the scenarios with a lower value for the all-E85 case (see also Appendix 5)
35 Impact on health in Vaumlstra Goumltaland
351 NO2 and NOX
The impact of long-term exposure on mortality was estimated using the relative risk from the Norwegian cohort study (Nafstad et al 2004) reporting a relative risk of 08 increase per microgm3 increase in NOX however without adjustment for particle concentrations Assuming this effect on the total mortality and a typical baseline mortality of 1000 deaths per 100 000 person years a decrease in the population mean exposure of 012 microgm3 would correspond to approximately 104 less preterm deaths per year However for the present case this number is highly uncertain since the exposure to substances normally associated with changes in NOX exposure may here change in different ways since the relation between different exhaust components varies between the scenarios
The impact of long-term exposure on asthma incidence (new cases) in adults has been estimated using results from the Swedish RHINE Study Cohorts (Modig et al 2009) with very similar results in the ECRHS Study corresponding to approx 4 increase per microgm3 increase in NO2 From the RHINE Study the incidence can be estimated to 03 per year (proportion of adults developing the disease) with children and elderly excluded this means around 1500 adult cases per year A reduction of 009 microgm3 corresponds to 54 avoided new cases of adult asthma per year However also NO2 in the asthma study may have been mainly an indicator of vehicle exhaust
352 Ozone
The impact of long-term exposure on respiratory mortality has been reported to be approx 02 per microgm3 increase in the summer concentration when studied in the large ACS Cohort (Jerret et al 2009) Assuming this effect on the total population and a typical baseline respiratory mortality of 100 deaths per 100 000 person years a decrease in the population mean exposure of 012 microgm3 corresponds to approximately 03 less preterm deaths per year
A comparison of emissions from ethanol and petrol fuelled cars IVL report B1962 Health risk assessment for Vaumlstra Goumltaland
23
353 Acetaldehyde
According to US EPA (1999) a lifetime risk for cancer of 0000002 per microgm3 is to be assumed for this potential human carcinogen An increase in the population mean exposure of 012 microgm3 corresponds to 026 cases more per year in the current population
354 Benzene
According to US EPA (1999) a lifetime risk for cancer (leukaemia) of 00000022-00000078 per microgm3 is to be assumed for this human carcinogen A decrease in the population mean exposure of 0074 microgm3 corresponds to approximately 03 cases less per year in the current population (assuming 0000004 per microgm3)
355 PM25
In CAFEacute and other impact assessments a relative risk of 6 increase in all-cause mortality per 10 microgm3 has usually been assumed Assuming this effect on the total mortality and a typical baseline mortality of 1000 deaths per 100 000 person years a decrease in the population mean exposure of 002 microgm3 corresponds to approximately 13 less preterm deaths per year
4 Discussion
In this study the health risks from a large introduction of E85 to replace petrol is analysed in scenario studies for 2020 for the Vaumlstra Goumltaland region It is found that the change in pollutant concentration exposure and health risks are small between the two scenarios It should be emphasized that the study only considers vehicle emissions and does not take into account effects from the fuel production
The emissions of NOX in the model are somewhat lower from E85 fuelled cars than from petrol fuelled cars This is in line with the emission factors used by Jacobson (2007) The nitrogen oxides are key substances in the atmospheric reactions determining the concentrations of ozone in air NOX is involved in the formation of ozone but close to the NO source the ozone concentration is lowered due to the rapid reactions between NO and O3 forming NO2 If NO is released in an environment with already high NO concentration it may result in lowering of ozone levels on the regional scale In the present study the ozone concentrations calculated are somewhat lower for the E85 scenario than for the petrol scenario
The health risk analysis shows that the main difference between the scenarios is due to the lower concentration of NOX However it may have been other exhaust components than NOX such as exhaust particles that were behind the reported association with mortality In cases when NOX is not a good indicator of exhaust particle emissions and their toxicity our results may be misleading This should be studied further Neglecting the effects of the changes in NOX exposure the total difference between the scenarios sums up to 16 preterm deaths per year with lower values for the E85 scenario while it would sum up to 12 less preterm deaths for the E85 scenario if the effect related to NOX were included Since there are no similar studier for the effect on mortality among those younger than 30-50 years of age we assume the same relative effect on mortality in all ages This makes only a small difference since the large majority of deaths occur in older groups
A comparison of emissions from ethanol and petrol fuelled cars IVL report B1962 Health risk assessment for Vaumlstra Goumltaland
24
The opposite result for the ozone concentration was obtained by Jacobson The reason for this discrepancy is that the Jacobson study concerns Los Angeles a region with high concentrations of pollutants while the study here concerns the Vaumlstra Goumltaland region with much less dense traffic and also lower concentrations of pollutants importantly NOX It is not unlikely that the effect that Jacobson report also would be found for large parts of Europe with higher traffic densities than in the Vaumlstra Goumltaland region
It is worth to emphasize that the major negative health effect in the Jacobson (2007) study is attributed to the increase in ozone concentration that is a result of the decrease of the NO emissions from E85 cars Directly after the emission NO reacts with ozone resulting in drop of the ozone concentration the so-called ozone titration commonly observed in many cities This NO does however form even higher quantities of ozone further downwind contributing to the general increase in the background ozone levels It is also precursor of NO2 secondary PM and other toxic species as eg PAN and hence reductions in NO emissions are never regarded as disbeneficial from the environmental viewpoint
There are of course several sources of uncertainties that influence the results of this study Since the main results concern differences between the two scenarios several of these factors loose on importance for the conclusions This comprises uncertainties in meteorology in future traffic volumes and in the population density distribution However there are some uncertainties that remain important The emission factors for E85 fuelled cars are much less characterised than what they are for petrol cars The emission of particles from E85 fuelled cars is especially uncertain with only very few published results Also the emissions of NMHC are somewhat uncertain and may be higher for E85 at lower ambient temperatures However the sensitivity analysis performed shows that for the studied region the NMHC emissions only have a small influence on the ozone concentrations
5 Conclusions
In this study the impact of tailpipe and evaporative emissions from E85 fuelled cars on air pollution and health risks are calculated and compared with petrol fuelled cars The scenario calculations for the Vaumlstra Goumltaland Region give data on emissions pollutant concentrations exposure and a health risk evaluation
The differences in emission factors between E85 and petrol lies in the emissions of PM and NOX which are about 65 and 58 for E85 relative petrol respectively Also the speciation of the emitted hydrocarbons is significantly different with large emissions of acetaldehyde and ethanol from E85 and large emissions of benzene higher aromatics alkanes and alkenes from petrol
These differences in emission factors reflect in differences in emissions The emission calculations for all Swedish road traffic show a decrease for the E85 scenario relative to the petrol scenario of 65 for NOX 34 for PM25 67 for benzene For acetaldehyde there is an increase of 770
The differences obtained from the TAPM modelling show decreased levels of NOX ozone and benzene with E85 and increased levels of acetaldehyde For the latter the increase may be up to 80 while NOX and ozone show decreases of up to a few per cent and a few tenths of per cent respectively
A comparison of emissions from ethanol and petrol fuelled cars IVL report B1962 Health risk assessment for Vaumlstra Goumltaland
25
The health risk assessment shows decreased health risks in the E85 scenario relative the all-petrol scenario due to the increased NOX exposure correlated with both preterm deaths and asthma However NOX may be mainly an exhaust indicator Smaller effects are expected from the changes in ozone acetaldehyde and benzene exposure The overall difference considering the exposure to PM acetaldehyde benzene and ozone is 16 preterm deaths with lower values for the E85 scenario
6 Acknowledgements
Saab Automobile The Swedish Transport Administration and The Foundation for the Swedish Environmental Research Institute are gratefully acknowledged for financial contribution
Magnus Ekstroumlm and Maria Holmstroumlm at Saab and Martin Juneholm at the Swedish Transport Administration are acknowledged for their most valuable input to the study
David Simpson Norwegian Meteorological Institute EMEP MSC-W Norway and Dept Radio amp Space Science Chalmers Univ Technol Sweden is gratefully acknowledged for help with implementation of the Unified EMEP model
A comparison of emissions from ethanol and petrol fuelled cars IVL report B1962 Health risk assessment for Vaumlstra Goumltaland
26
7 References
Altenstedt J Pleijel K 2000 An alternative approach to photochemical ozone creation potentials under European conditions J Air amp Waste Manage Assoc 50 1023 ndash 1036
Andre J-M (2005) Vehicle emission measurement collection of the ARTEMIS datatbase Artemis 3312 report Available from httpwwwinretsfrurltepublicationspublications-pdfJoumardA3312reportJMALTE0504pdf
Bachand A MMundt K A Mundt D JMontgomery R R Epidemiological studies of formaldehyde exposure and risk of leukemia and nasopharyngeal cancer A meta-analysis Critical Reviews in Toxicology 2010 40(2) 85ndash100
Beane Freeman L E Blair A Lubin J H Stewart P A Hayes R B Hoover R N Hauptmann M Mortality from lymphohematopoietic malignancies among workers in formaldehyde industries The National Cancer Institute Cohort J Natl Cancer Inst 2009101751ndash761
Bosetti C McLaughlin J K Tarone R E Pira E LaVecchia C Formaldehyde and cancer risk A quantitative review of cohort studies through 2006 Ann Oncol 20081929ndash43
ConcaweJRC Well-to-wheel studies httpiesjrceceuropaeuwtwhtml
Derwent R G Jenkin M E Saunders S M 1996 Photchemical ozone creation potentials for a large number of reactive hydrocarbons under European conditions Atmos Environ 30 181 ndash 199
Derwent RG Jenkin ME Passant NR Pilling MJ 2007 Photochemical ozone creation potentials (POCPs) for different emission sources of organic compounds under European conditions estimated with a Master Chemical Mechanism Atmos Env 41 2570ndash2579
EEA Copenhagen 2009 wwweeaeuropaeudata-and-mapsdatapopulation-density-disaggregated-with-corine-land-cover-2000-2
Ericsson P Holmstroumlm M Amberntsson-Carlsson A Ohlson C Skoglundh M Andersson B Carlsson P-A 2008 Characterization of particulate emissions and methodologhy for oxidation of particulates from non-diesel combustion ystems SAE Technical Paper Series 2008-01-1746
GAINS 2010 httpgainsiiasaacatindexphpgains-europe
Graham LA Belisle SL Baas C-L Emissions from light duty gasoline vehicles operating on low blend ethanol gasoline and E85 Atmospheric Environment 42 4498 (2008)
Haskew H M Thomas P E Liberty F 2006 Fuel Permeation From Automotive Systems E0 E6 E10 E20 And E85 Final Report CRC Project No E-65-3 Coordinating Research Council Inc 3650 Mansell RoadSuite 140Alpharetta GA 30022
HEI Air Toxics Review Panel (2007) Mobile-Source Air Toxics A Critical Review of the Literature on Exposure and Health Effects HEI Special Report 16 Health Effects Institute Boston USA
Hurley P TAPM v 4 User Manual 2008 CSIRO ISBN 978-1-921424-73-1
IARC (2006) IARC Monographs on the Evaluation of Carcinogenic Risks to Humans Wood Dusts and Formaldehyde Lyon World Health Organization International Agency for Research on Cancer Lyon France 8837ndash325
Jacobson M Z Effects of Ethanol (E85) versus Gasoline Vehicles on Cancer and Mortality in the United States Environ Sci Technol 2007414150-4157
A comparison of emissions from ethanol and petrol fuelled cars IVL report B1962 Health risk assessment for Vaumlstra Goumltaland
27
Jerret M Burnett R T Pope C A Ito K Thurston G Krewski D Shi Y Calle E Thun M Long-Term Ozone Exposure and Mortality N Engl J Med 20093601085-95
Lipman T E Delucchi M A 2002 Emissions of nitrous oxide and methane from conventional and alternative fuel motor vehicles Climate Change 53 477
Modig L Toreacuten K Janson C Jarvholm B Forsberg B Vehicle exhaust outside the home and onset of asthma among adults Eur Respir J 2009 Jun33(6)1261-7
Nafstad P Haheim L L Wisloff T Gram F Oftedal B Holme I Hjermann I Leren P Urban air pollution and mortality in a cohort of Norwegian men Environ Health Perspect 2004112(5)610-5
OEHHA (1999) Air Toxics Hot Spots Program Risk Assessment Guidelines Part II Technical Support Document for Describing Available Cancer Potency Factors Prepared by the Air Toxicology and Epidemiology Section Office of Environmental Health Hazard Assessment April 1999
Passant NR (2002) Speciation of UK emissions of non-methane volatile organic compounds AEAT report AEATENVR0545 Issue 1 Culham UK
Pope CA III Thun MJ Namboodiri MM Dockery DW Evans JS Speizer FE Heath CJ Particulate air pollution as a predictor of mortality in a prospective study of US adults Am J Resp Crit Care Med 1995 151 669-674
Seinfeld J H and Pandis SN (1998) Atmospheric Chemistry and Physics From Air Pollution to Climate Change John Wiley amp Sons New YorkSimpson D Fagerli H Jonson JE Tsyro S Wind P Tuovinen J -P 2003 Transboundary acidification and eutrophication and ground level ozone in Europe Unified EMEP Model Description EMEP Status Report 12003 Part I EMEPMSC-W Report The Norwegian Meteorological Institute Oslo Norway
US EPA (1999) httpwwwepagovttnatwnata1999nsata1999
Vestreng V et al 2004 Inventory Review 2004 Emission data reported to CLRTAP and the NEC Directive EMEPEEA Joint Review Report EMEPMSC-W Note 1
Westerholm R Ahlvik P Karlsson HL An exhaust characterisation study based on regulated and unregulated emissions from bi-fuel and flexi-fuel light-duty passanger cars fuelled by petrol (E5) bioethanol (E70 E75) and biogas tested at ambient temperatures of +22degC and -7degC 2008
Wolkoff P Nielsen G D Non-cancer effects of formaldehyde and relevance for setting an indoor air guideline Environment International 201036788ndash799
Yanowitz J McCormick RL Effect of E85 on tailpipe emissions from light-duty vehicles J Air amp Waste Manage Assoc 59 172 (2009)
A comparison of emissions from ethanol and petrol fuelled cars IVL report B1962 Health risk assessment for Vaumlstra Goumltaland
28
Appendix 1 Evaporate emissions of NMHC
The following assumptions are done for evaporative emissions The NMHC emissions from E85 are reduced relative to petrol by 45 Methane emissions are zero and the split of NMHC species is 68 ethanol and the remaining 32 is divided in the same way as evaporative emissions for petrol The estimates by Graham et al (2008) are missing evaporative emission data however these assumptions agrees very well with measurements of evaporative emissions due to fuel permeation reported by Haskew et al (2006) where NMHC emissions are reported to be reduced by 50 for E85 fuel compared to petrol Haskew et al also presents the NMHC split to species with 60 ethanol This number agrees quite well with our assumption of 68 NMHC being ethanol NMHC in exhaust and evaporative emissions are thus divided as in Table A1
Table A1 Division of NMHC in the exhaust and evaporative emissions for E85 and petrol respectively (wt)
E85 Petrol E85 Petrol exhaust exhaust evaporative evaporative
Ethanol 680 0 680 0 Acetaldehyde 131 08 02 0 Ethene 99 73 24 0 Ethyne 03 28 09 0 Formaldehyde 31 17 06 0 Benzene 16 56 18 10 13 Butadiene 03 09 03 0 sum 963 191 741 10
The remaining NMHC emissions are divided as for petrol (ref) and listed in Table A2
Table A2 Division of NMHC in the exhaust and evaporative emissions for E85 and petrol respectively (wt)
E85 Petrol E85 Petrol exhaust exhaust evaporative evaporative
Ethane 02 32 10 0 Alkanes (C3+) 13 278 89 880 Alkenes (C3+) 04 90 29 95 Aromatics (C7+) 18 388 125 15 Aldehydesketones (C3+)
01 15 05 0
A comparison of emissions from ethanol and petrol fuelled cars IVL report B1962 Health risk assessment for Vaumlstra Goumltaland
29
Appendix 2 Description of the model system
A21 Atmospheric lifetimes
Table A3 gives tropospheric lifetimes with regard to reaction of ethanol formaldehyde acetaldehyde and benzene (C6H6) with OH nitrate radical (NO3) and photolysis The studied organic species are listed together with three species common in the gasoline exhaust (benzene ethene and toluene) for comparison Table 11 shows also photochemical ozone creation potential (POCP) of these species POCP is a measure of amount of ozone that is formed from a certain VOC emission relatively to other emission source which has been established to the same emission mass of ethene (Derwent et al 1996 Altenstedt et al 2000) The range represents different scenarios for VOC and NOX background concentrations Derwent et al (2007) used similar methodology to calculate POCP of different VOC sources and calculated POCP of mean road emission exhaust to be 69
Table A3 Atmospheric lifetimes of studies NMVOC species with respect to the OH- and NO3- initiated
degradation τ(OH) and τ(NO3) and with respect to the photolysis (The lifetime of a chemical species which decays in a first-order process is the time needed for a concentration of this species to decrease to 1e of its original value Statistically it represents the mean life expectancy of an excited species) The OH concentration of 1times106 moleculescm3 typical for summer troposphere was used for the lifetime calculation The NO3 concentrations of 5 and 100 ppt(V) were used for lifetime calculations as representative of rural and urban night-time 12 hrs mean concentration The studied organic species are listed together with 3 species common in the gasoline exhaust for comparison The rates of photolysis were calculated with radiation transfer model for July 58ordm latitude and integrated over 24 hours
τ(OH) τ(NO3) urbanrural τ (photolysis) POCP
hr hr hr
Ethanol 85 56 1times103 - 44 - 63
Acetaldehyde 15 47 1times103 86 68 - 80
Formaldehyde 30 194 4times103 10 18 - 55
Benzene 214 - - 23 - 47
Ethene 34 - - 100
Toluene 50 - - 30 - 67
A22 Defining of boundary concentrations for TAPM from EMEP fields
Calculation of initial concentration field for TAPM from EMEP concentration field of NO2 (as example) and EMEP mean wind vector components u_mid and v_mid Two EMEP model gridcells (i=56 j=60 and i=56 j=61) represent the TAPM model domain and concentrations from the surrounding EMEP gridcells SE-S SE-N NW-S NW-N NE NW (Figure A1) are used for calculation of boundary concentration NO2(bc) according to the following code if u_mid lt= 0 then ( isite = SE-S and jsite = SE-N) else isite = NW-S and jsite = NW-N) endif
A comparison of emissions from ethanol and petrol fuelled cars IVL report B1962 Health risk assessment for Vaumlstra Goumltaland
30
if v_mid lt= 0 then ( ksite = NE) else ksite = SW endif NO2(bc) = [(NO2(isite)u_mid(isite) + NO2(jsite)u_mid(jsite))2 + NO2(ksite)v_mid(ksite)] [(u_mid(isite) + u_mid(jsite))2 + v_mid(ksite)]
Figure A1 Gridcells covering Gothenburg domain and its boundary in EMEP model plotted on latitude-
longitude coordinates The red square represents centre of Gothenburg and the blue line the coastline EMEP i and j coordinates for the boundary gridcells are SE-S = 57-60 SE-N = 57-61 NW-S = 55-60 NW-N = 55-61 NE = 56-62 NW = 56-59 and for Gothenburg grid cells are Gbg-NE = 56-61 Gbg-SW = 56-60
A23 Atmospheric chemistry
The role of secondary chemistry in for the concentration of acetaldehyde are studied by first excluding the primary acetaldehyde emissions from the EMEP model simulations of scenarios S1 and S2 and then by excluding all NMVOC emissions from the car category with spark ignition engines The contribution from the primary acetaldehyde emissions as well as the contribution of secondary acetaldehyde formed from other NMVOC to the total acetaldehyde concentration is then obtained However the secondary chemistry is highly nonlinear due to the interactions of NMVOCs with ozone and OH and thus the results for the contribution of secondary acetaldehyde are somewhat uncertain Differences in acetaldehyde concentrations between S1 and S2 scenarios are studied with respect to contribution of primary and secondary acetaldehyde It is observed that in summer background air the monthly mean contribution of the secondary acetaldehyde is of the same magnitude as the contribution of the primary acetaldehyde to the difference between S1 and
565
57
575
58
585
105 115 125 135 145
Long
Lat
Gbg-SW
Gbg-NE
SE-S
NW-N
NW-S
SE-N
SW
NE
55-59
57-59
55-62
A comparison of emissions from ethanol and petrol fuelled cars IVL report B1962 Health risk assessment for Vaumlstra Goumltaland
31
S2 In the winter and in more polluted atmosphere (Gothenburg grid cells) the contribution from secondary acetaldehyde to the concentration difference appears to be negative due to the chemistry feedback ie the E-85 scenario has less secondary acetaldehyde than the all-petrol scenario
A comparison of S2-S1 differences in primary and secondary acetaldehyde concentrations in the background (=upwind) and Gothenburg grid cells show no increase in the secondary acetaldehyde from upwind to the Gothenburg grid cell It can thus be concluded that there is no significant contribution from secondary aldehydes on the small scale (tenths of km) Conclusion from this sensitivity study is that the secondary formaldehyde can be of importance under summer in the clean background air but that formation on the local scale is unimportant Using EMEP simulated boundary concentrations of acetaldehyde in the local scale model and simulating the primary acetaldehyde emissions will capture the most important features of acetaldehyde dispersion and chemistry in Vaumlstra Goumltaland
In the EMEP model the tail-pipe PM emissions are specified as primary particles Emissions of NOX and VOCs (and NH3 SO2) are oxidised in the atmosphere and a part is then transferred through the gas-to-particle transport to the PM as secondary PM The petrol fuelled cars emit both more primary PM and more NOX compared to the E85 cars If we compare differences in primary and secondary PM between the S1 and S2 scenarios simulated by EMEP we can directly see what part of the difference is from the tail-pipe emissions of the primary particles and what part is from the formation of the secondary PM in atmosphere (mostly from higher emissions of NOX) Table A4 shows the differences between S1 and S2 (S1-S2) of monthly PM averages for January and June (two months with low and high photochemical activities respectively) It can be seen that the higher formation of secondary PM in the S1 (all-petrol) scenario is more important than the higher tail-pipe emission of primary PM by factor 10 - 20
When we compare simulated PM differences between S1-S2 for the background air (=upwind) grid cells and for grid cells including Gothenburg (50 km x 50 km scale) we can see significant increase in primary PM in the S1 scenario from the upwind grid cells to Gothenburg (746 in winter 132 in summer) while no systematic increase can be seen for the secondary PM (-42 in winter +24 in summer) From this comparison it can be concluded that no systematic increase in secondary PM can be seen (in difference from the primary PM) on the scale of 50-100 km and we can neglect this process on the small scale However the overall change in PM concentrations due to the switch of the fuel is very small both on the large scale and on the small scale as can be seen when the differences in PM concentrations between S1 and S2 are compared to absolute PM concentrations in S1 presented in the last column of Table A4
Table A4 Differences in primary and secondary PM concentrations between the lsquoAll-petrolrsquo (S1) and lsquoE-85rsquo (S2) scenarios simulated in gridcells upwind Gothenburg and in gridcells including Gothenburg (2 50 km x 50 km gridcells)
S1-S2 Background
S1-S2 Gothenburg
Increase S1-S2 Gothenburg
S1 Background
μgm3 μgm3 μgm3 bkgnd μgm3
Prim PM10 Jan 00008 00014 00006 746 084
Jun 00008 00018 00010 1319 084
Sec PM10 Jan 00155 00148 -00006
-42 157
Jun 00080 00081 00002 24 213
The sensitivity of the used emission factors for NMHC with respect to the ozone formation in the region of the Swedish West Coast can be analysed with the help of results from studying the
A comparison of emissions from ethanol and petrol fuelled cars IVL report B1962 Health risk assessment for Vaumlstra Goumltaland
32
formation of secondary acetaldehyde In this study first all primary acetaldehyde emitted by the E85 fleet are omitted in a model simulation (S2_nopAA) and secondly all NMHC emissions from the E-85 fleet are switched off (S2_noVOC) Acetaldehyde has a somewhat higher though still comparable photochemical ozone creation potential compared to ethanol (ethanol 44-63 acetaldehyde 68-80 Altenstedt and Pleijel 2000) and this simulation will thus also give information on the sensitivity of the calculations to uncertainties in the ethanol emissions Setting the emission factor for NMHC to zero gives the sensitivity to the emission factor of total NMHC Figure A2 shows the differences in ozone concentration as a result of acetaldehyde only and the total NMHC from the E85 car fleet (S2 scenario) We can see that the effect on ozone formation is very small for the Swedish West coast The reason is that the ozone formation in this area is controlled by the availability of NOX while NMHC or rather their degradation products the peroxy radicals that serve as a lsquofuelrsquo to ozone formation are usually in excess here and further VOC emissions do not increase ozone concentrations significantly The situation looks different in areas that are more heavily polluted with NOX andor which is limited in the availability of peroxy radicals The results from this sensitivity study are fully consistent with the observed increase in ozone concentrations as a result of lower NO emissions (the so-called ozone titration) only very close to the major roads but no larger-scale decrease in ozone concentrations in the Gothenburg area or in any other communities
Figure A2 Sensitivity of the ozone formation in the 2 EMEP model grid cells covering Gothenburg (blue) and in the 6 surrounding grid cells (red see Fig A1) to changes in NMHC emission factor of the E85 fuelled cars lsquobasersquo is simulation S2 with EF for NMHC as in Table 3 lsquonoVOCrsquo is S2 with EF for all NMHC = 0 lsquonopAArsquo is S2 with EF for acetaldehyde = 0 a ndash Mean sensitivity in January absolute difference in ozone formation in ppb(V) as a result of NMHC (base-noVOC) and acetaldehyde (base-nopAA) emissions b ndash Sensitivity relative to ozone concentration in the S2-base simulation January c ndash same as a) but June d ndash same as b) but June
‐002
‐001
0
001
base‐noVOC base‐nopAA
ΔO3(ppb)
a)
0
001
002
base‐noVOC base‐nopAA
ΔO
3(ppb)
c)
‐010
‐005
000
005
base‐noVOC base‐nopAA
ΔO
3
b)
000
002
004
006
base‐noVOC base‐nopAA
ΔO
3
d)
A comparison of emissions from ethanol and petrol fuelled cars IVL report B1962 Health risk assessment for Vaumlstra Goumltaland
33
Appendix 3 Emission results
The geographically distributed NOX and acetaldehyde emissions for the Vaumlstra Goumltaland region are presented in Figures A3 and A4 respectively
Figure A3 NOX emissions for the Vaumlstra Goumltaland region for the All Petrol scenario
A comparison of emissions from ethanol and petrol fuelled cars IVL report B1962 Health risk assessment for Vaumlstra Goumltaland
34
Figure A4 Acetaldehyde emissions for the Vaumlstra Goumltaland region for the All Ethanol scenario
A comparison of emissions from ethanol and petrol fuelled cars IVL report B1962 Health risk assessment for Vaumlstra Goumltaland
35
Appendix 4 Dispersion modelling results
The difference in yearly average concentration between scenario S1 and S2 for acetaldehyde and benzene can be seen in Figure A5 and Figure A6 respectively a)
b)
Figure A5 The difference in yearly average concentrations of acetaldehyde for 2020 between the all E85 (S2) and all petrol (S1) scenarios presented as a) microgm3 and as b) percentage for the Gothenburg area
A comparison of emissions from ethanol and petrol fuelled cars IVL report B1962 Health risk assessment for Vaumlstra Goumltaland
36
a)
b) all E85 c) all petrol
Figure A6 a) the difference in yearly average concentrations (gm3) of benzene for 2020 between the all E85 (S2) and all petrol (S1) scenarios yearly means for b) all E85 and c) all petrol (note the different scales)
The difference in the calculated NOX NO2 and ozone concentrations between the two scenarios are shown in Figures A7 A8 and A9
A comparison of emissions from ethanol and petrol fuelled cars IVL report B1962 Health risk assessment for Vaumlstra Goumltaland
37
a)
b)
Figure A7 The difference in yearly average concentrations of NOX for 2020 between the all E85 (S2) and all petrol (S1) scenarios presented as a) microgm3 and as b) percentage for the Gothenburg area
A comparison of emissions from ethanol and petrol fuelled cars IVL report B1962 Health risk assessment for Vaumlstra Goumltaland
38
a)
Figure A8 The difference in yearly average concentrations of NO2 for 2020 between the all E85 (S2) and all petrol (S1) scenarios presented as a) microgm3 and as b) percentage for the Gothenburg area
A comparison of emissions from ethanol and petrol fuelled cars IVL report B1962 Health risk assessment for Vaumlstra Goumltaland
39
a)
b)
Figure A9 The difference in yearly average concentrations of ozone for 2020 between the all E85 (S2) and all petrol (S1) scenarios presented as a) microgm3 and as b) percentage for mainly the Gothenburg area
A comparison of emissions from ethanol and petrol fuelled cars IVL report B1962 Health risk assessment for Vaumlstra Goumltaland
40
Appendix 5 Detailed Exposure data
Detailed exposure data for the difference between the all E85 (S2) and the all petrol (S1) scenarios can be found in Table A5
Table A5 Exposure data for the difference between the all E85 (S2) and the all petrol (S1) scenarios
Acetaldehyde diff E-P (microgm3)
Populated weighted mean
Number of people Percentage of population
0 - 01 627198 582 01 - 02 163394 152 02 - 03 134879 125 03 - 04 88099 82 04 - 05 38686 36 05 - 06 16880 16 06 - 07 7983 07 07 - 08 1248 01 Tot 014 1078367 Benzene diff E-P (microgm3)
Populated weighted mean
Number of people Percentage of population
-03 - -02 26680 25 -02 - -01 205757 191 -01 - -0 845930 784 Tot -0074 1078367 NO2 diff E-P (microgm3) Populated weighted
mean Number of people Percentage of
population -04 - -03 7698 07 -03 - -02 50131 46 -02 - -01 296288 275 -01 - -0 724250 672 Tot -009 1078367 NOX diff E-P (microgm3) Populated weighted
mean Number of people Percentage of
population -06 - -05 7698 -05 - -04 19639 18 -04 - -03 36626 34 -03 - -02 161685 150 -02 - -01 186500 173 -01 - -0 666219 618 Tot -012 1078367 O3 diff E-P (microgm3) Populated weighted
mean Number of people Percentage of
population -02 - -01 779132 723 -01 - -0 266417 247 0 - 01 32818 30 Tot -012 1078367
Exposure data for the total levels in the two scenarios can be found in Table A6
A comparison of emissions from ethanol and petrol fuelled cars IVL report B1962 Health risk assessment for Vaumlstra Goumltaland
41
Table A6 Exposure data for the total levels in the two scenarios
Acetaldehyde tot All ethanol (microgm3)
Populated weighted mean
Number of people Percentage of population
06 - 07 568825 527 07 - 08 171845 159 08 - 09 124551 115 09 - 10 100946 94 10 - 11 59235 55 11 - 12 30559 28 12 - 13 13175 12 13 - 14 7983 07 14 - 15 1248 01 Tot 077 1078367 Acetaldehyde tot All petrol (microgm3)
Populated weighted mean
Number of people Percentage of population
05 - 06 45111 42 06 - 07 1032008 957 07 - 08 1248 01 Tot 065 1078367 Benzene tot All ethanol (microgm3)
Populated weighted mean
Number of people Percentage of population
0 - 01 1055961 98 01 - 02 22406 2 Tot 005 1078367 Benzene tot All petrol (microgm3)
Populated weighted mean
Number of people Percentage of population
0 - 01 729093 676 01 - 02 232961 216 02 - 03 94042 87 03 - 04 21023 19 04 - 05 1248 01 Tot 010 1078367 NOX tot All ethanol (microgm3)
Populated weighted mean
Number of people Percentage of population
0-10 779108 722 10-20 254658 236 20-30 28683 27 30-40 11070 10 40-50 3426 03 50-60 0 00 60-70 0 00 70-80 639 01 80-90 0 00 90-100 0 00 100-110 783 01 Tot 84 1078367 NOX tot All petrol (microgm3)
Populated weighted mean
Number of people Percentage of population
0-10 769557 714 10-20 264209 245 20-30 28683 27 30-40 11070 10 40-50 3426 03 50-60 0 00
A comparison of emissions from ethanol and petrol fuelled cars IVL report B1962 Health risk assessment for Vaumlstra Goumltaland
42
60-70 0 00 70-80 639 01 80-90 0 00 90-100 0 00 100-110 783 01 Tot 85 1078367 O3 tot All ethanol (microgm3)
Populated weighted mean
Number of people Percentage of population
40-45 1422 01 45-50 26487 25 50-55 176636 164 55-60 770370 714 60-65 103452 96 Tot 569 1078367 O3 tot All petrol (microgm3)
Populated weighted mean
Number of people Percentage of population
40-45 1422 01 45-50 20229 19 50-55 181876 169 55-60 763361 708 60-65 111479 103 Tot 570 1078367 PM25 tot All ethanol (microgm3)
Populated weighted mean
Number of people Percentage of population
1-2 0 00 2-3 885325 821 3-4 192259 178 4-5 783 01 Tot 268 1078367 PM25 tot All petrol (microgm3)
Populated weighted mean
Number of people Percentage of population
1-2 0 00 2-3 868773 806 3-4 208811 194 4-5 783 01 Tot 270 1078367
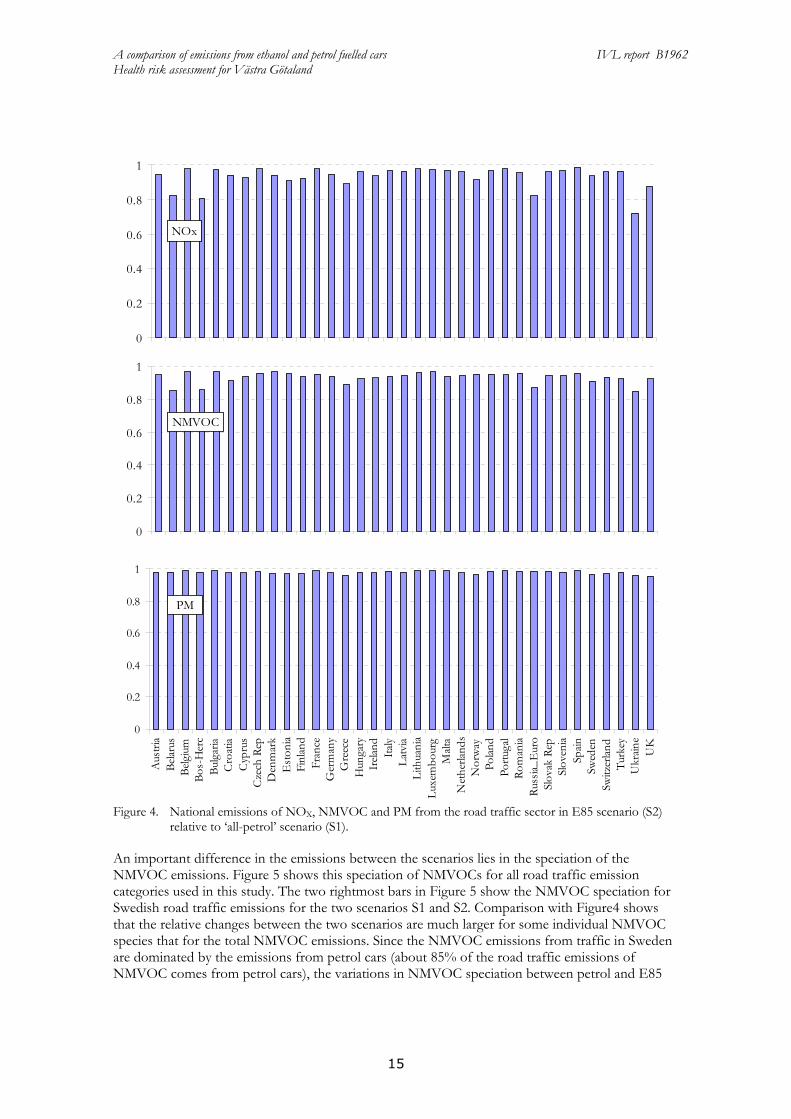
A comparison of emissions from ethanol and petrol fuelled cars IVL report B1962 Health risk assessment for Vaumlstra Goumltaland
17
vehicle-kilometres in 2020) The major roads in the region are clearly visible as well as the larger cities (especially Gothenburg)
Figure 7 Emissions of NOX (kgyear for a 500 m x 500 m grid cell) in the Vaumlstra Goumltaland region for 2005
and for 2020 for the base case
In Table 4 the traffic emissions for NOX benzene acetaldehyde ethanol and PM10 for the Vaumlstra Goumltaland region are shown for the four different emissions scenarios The emissions of NOX and benzene are reduced between 2005 and 2020 for the base case while the emissions of ethanol and acetaldehyde increase due to an expected increase in the use of ethanol fuel The NOX emissions for S1 are somewhat higher than for S2 due to the higher NOX emissions factor for petrol compared with E85
Table 4 Emissions from traffic for the Vaumlstra Goumltaland region in four different emission scenarios (in tonnesyear)
Substance base 2005 base 2020 S1 S2 NOX 13 243 4 843 4 954 4 631 Benzene 2 833 927 1 201 386 Acetaldehyde 628 1 074 305 2 595 Ethanol 192 5 192 0 15 400 PM10 1 324 486 483 476
33 Dispersion modelling
Resulting concentrations from calculations of the S1 and S2 scenarios with the EMEP model are used to provide input of primary and secondary air pollutants for the calculations with the TAPM model for the Vaumlstra Goumltaland region Concentrations of NOX NMVOC PM25 PM10 acetaldehyde ethanol and benzene are therefore calculated as boundary conditions for the Vaumlstra Goumltaland region In addition sensitivity studies are performed to investigate the role of formation of secondary acetaldehyde and secondary particulate matter (see Appendix 2) Time series analysis of the TAPM and EMEP model results of the S1 and S2 scenarios are presented in Figure 8
A comparison of emissions from ethanol and petrol fuelled cars IVL report B1962 Health risk assessment for Vaumlstra Goumltaland
18
a)
b)
Figure 8 Time series analyses of S1 and S2 scenarios for the EMEP and TAPM modelled concentrations of NOX and ozone at an urban background site in Gothenburg (TAPM) and in EMEP model grid cells including Gothenburg city (50 km x 50 km)
Concentrations of NOX and ozone at an urban background site in Gothenburg (TAPM) and in the 50 km x 50 km EMEP grid cells including Gothenburg are compared for one summer and one winter month Due to the well-known process of ozone titration by freshly emitted nitrogen monoxide (Seinfeld and Pandis 1998) the concentration of ozone often decreases in urban areas This phenomenon is expected to be captured by the fine-gridded TAPM model but not necessarily by the courser scale of the EMEP model Figure 8 shows the generally higher NOX levels in the small grid cell of the TAPM model in urban background location comparing to those in the large EMEP grid cell while the opposite is observed for the ozone concentrations (Remember that the boundary concentrations for TAPM are obtained from the EMEP model and they are thus the same in both cases) This indeed shows that local scale emissions and processes contribute to locally increased levels of NOX in urban areas both for the summer and the winter cases For ozone where there of course are no primary emissions the situation is the opposite where instead the result is decreased concentration levels at urban sites on a local scale The influence of the
A comparison of emissions from ethanol and petrol fuelled cars IVL report B1962 Health risk assessment for Vaumlstra Goumltaland
19
NMHC emissions from the passenger cars is studied in a sensitivity analysis (see Appendix 23) and it is found to have only a small influence on the ozone levels
To illustrate the results of the different scenario calculations the geographically distributed concentrations are presented as the difference in yearly average concentrations between the all E85 (S2) and all petrol (S1) scenarios both as microgm3 and sometimes as percentage of the difference to scenario S1 (see Appendix 3)
The difference in yearly average concentrations between scenario S1 and S2 for acetaldehyde and benzene can be seen in Figures 9 and 10 respectively The increase in acetaldehyde concentration resulting from a switch from petrol to E85 is up to about 05 gm3 or 80 in the central parts of the largest urban area of the region Gothenburg Outside this area the relative increase is about 10 for the other urban areas and less than that for the rural areas This large relative increase (see map in Appendix 4) is a result of the relatively high emissions of acetaldehyde from E85 fuelled cars For benzene the situation is opposite In the scenarios for 2020 the concentration of benzene decreases by up to a few tenths of gm3 as a result of a switch from petrol to E85 For benzene the relative change is not calculated
Figure 9 The difference in yearly average concentrations of acetaldehyde for 2020 between the all E85 (S2) and all petrol (S1) scenarios (microgm3)
A comparison of emissions from ethanol and petrol fuelled cars IVL report B1962 Health risk assessment for Vaumlstra Goumltaland
20
Figure 10 The difference in yearly average concentrations (gm3) of benzene for 2020 between the all E85 (S2) and all petrol (S1) scenarios
The difference in the calculated NOX NO2 and ozone concentrations between the two scenarios are shown in Appendix 4 The change in NOX concentration between the two scenarios only represents a small fraction of the total NOX concentration This is because the emissions of NOX from petrol cars are relatively low compared with the contribution from diesel engines and other sources Thus the resulting decrease in the NOX concentration with E85 is only up to 3 For ozone there is a small increase of about 01 microgm3 of E85 in the central areas of Gothenburg where there is relatively high traffic intensity (see Appendix 4 Figure A9) In the rest of the region there is a small decrease in the ozone concentration in the E85 scenario
34 Exposure
The resulting concentrations from the dispersion modelling together with the population density distribution are used to assess the exposure to acetaldehyde benzene NO2 NOX and ozone for the two scenarios S1 and S2 The exposure to PM25 is very similar for the two scenarios (the difference in concentration between scenarios S2 and S1 is only about -002 gm3 Table 5 shows the population weighted mean exposure both as total concentrations and as the difference between the two scenarios Detailed exposure results can be found in Appendix 5 It can be seen that the exposure to all the pollutants in Table 5 with the exception of acetaldehyde are somewhat lower for the all E85 scenario (S2) than for the all petrol scenario (S1) However the effect on health also
A comparison of emissions from ethanol and petrol fuelled cars IVL report B1962 Health risk assessment for Vaumlstra Goumltaland
21
depends on the level of the dose-response functions For example if the level of concentration is low in a populated area but the dose-response function is high the effect of even a low concentration increase can become important The increase in exposure from S1 to S2 (S2-S1) calculated as percentage of the population exposed to increased mean concentrations of pollutants is presented in Figure 11
Table 5 Populated weighted mean exposure (gm3)
S1 S2 S2-S1 Acetaldehyde 065 077 014 Benzene 01 005 -007 NOX 85 84 -012 Ozone 570 569 -012 PM25 270 268 -002
Increased concentrations Decreased concentrations Both increased and
decreased conc
Figure 11 The relative exposure (S2-S1) calculated as percentage of the population
In Figure 11 it is clear that the only pollutant that does not show an improvement regarding air quality and thus the health risks when modelling a switch from petrol to E85 is acetaldehyde For all pollutants except for ozone the changes of concentration levels observed between the scenarios are within the urban areas but for ozone there are also differences in rural areas
According to the data in Figure 11 about 14 of the population in the Vaumlstra Goumltaland region will be exposed to 03-08 microgm3 higher concentration levels of acetaldehyde in scenario S2 relative to S1 From Figure 9 it can be seen that the majority of these people live within the Gothenburg area Further about 28 of the population will be exposed to increased levels of between 01 to 03 microgm3 mainly in the suburban areas and rural surroundings of Gothenburg but also in some of the smaller cities in the region Outside the urban areas the concentration difference is lower than 01 microgm3
In the S2 scenario relative to the S1 scenario the population is exposed to decreased concentration levels of benzene and NOX This is mainly true also for O3 but with an exception for the central
A comparison of emissions from ethanol and petrol fuelled cars IVL report B1962 Health risk assessment for Vaumlstra Goumltaland
22
parts of Gothenburg where the concentration actually increases (see Appendix 4 Figure 7A) resulting in that 3 (blue area in Figure 11 for O3) of the population will be exposed to higher concentrations of O3 For the rest of the area there are decreased concentrations of ozone upon a switch to E85
The largest differences are again in the central parts of Gothenburg where about 20 of the population is being exposed to a lower benzene concentration of 01-03 microgm3 This also means that concerning benzene the majority (78) of the population have none or very low influence from a change to ethanol fuel
The largest effect on exposure difference is seen for NOX where just over 20 of the population has its exposure decreased with 03-05 microgm3 (in the central parts of Gothenburg) In the suburbs the decrease is between 01-02 microgm3 lower Along the largest roads there is a small but visible improvement on a yearly basis of 01 microgm3
For PM25 there is a difference in the populated weighted mean exposure of 002 gm3 between the scenarios with a lower value for the all-E85 case (see also Appendix 5)
35 Impact on health in Vaumlstra Goumltaland
351 NO2 and NOX
The impact of long-term exposure on mortality was estimated using the relative risk from the Norwegian cohort study (Nafstad et al 2004) reporting a relative risk of 08 increase per microgm3 increase in NOX however without adjustment for particle concentrations Assuming this effect on the total mortality and a typical baseline mortality of 1000 deaths per 100 000 person years a decrease in the population mean exposure of 012 microgm3 would correspond to approximately 104 less preterm deaths per year However for the present case this number is highly uncertain since the exposure to substances normally associated with changes in NOX exposure may here change in different ways since the relation between different exhaust components varies between the scenarios
The impact of long-term exposure on asthma incidence (new cases) in adults has been estimated using results from the Swedish RHINE Study Cohorts (Modig et al 2009) with very similar results in the ECRHS Study corresponding to approx 4 increase per microgm3 increase in NO2 From the RHINE Study the incidence can be estimated to 03 per year (proportion of adults developing the disease) with children and elderly excluded this means around 1500 adult cases per year A reduction of 009 microgm3 corresponds to 54 avoided new cases of adult asthma per year However also NO2 in the asthma study may have been mainly an indicator of vehicle exhaust
352 Ozone
The impact of long-term exposure on respiratory mortality has been reported to be approx 02 per microgm3 increase in the summer concentration when studied in the large ACS Cohort (Jerret et al 2009) Assuming this effect on the total population and a typical baseline respiratory mortality of 100 deaths per 100 000 person years a decrease in the population mean exposure of 012 microgm3 corresponds to approximately 03 less preterm deaths per year
A comparison of emissions from ethanol and petrol fuelled cars IVL report B1962 Health risk assessment for Vaumlstra Goumltaland
23
353 Acetaldehyde
According to US EPA (1999) a lifetime risk for cancer of 0000002 per microgm3 is to be assumed for this potential human carcinogen An increase in the population mean exposure of 012 microgm3 corresponds to 026 cases more per year in the current population
354 Benzene
According to US EPA (1999) a lifetime risk for cancer (leukaemia) of 00000022-00000078 per microgm3 is to be assumed for this human carcinogen A decrease in the population mean exposure of 0074 microgm3 corresponds to approximately 03 cases less per year in the current population (assuming 0000004 per microgm3)
355 PM25
In CAFEacute and other impact assessments a relative risk of 6 increase in all-cause mortality per 10 microgm3 has usually been assumed Assuming this effect on the total mortality and a typical baseline mortality of 1000 deaths per 100 000 person years a decrease in the population mean exposure of 002 microgm3 corresponds to approximately 13 less preterm deaths per year
4 Discussion
In this study the health risks from a large introduction of E85 to replace petrol is analysed in scenario studies for 2020 for the Vaumlstra Goumltaland region It is found that the change in pollutant concentration exposure and health risks are small between the two scenarios It should be emphasized that the study only considers vehicle emissions and does not take into account effects from the fuel production
The emissions of NOX in the model are somewhat lower from E85 fuelled cars than from petrol fuelled cars This is in line with the emission factors used by Jacobson (2007) The nitrogen oxides are key substances in the atmospheric reactions determining the concentrations of ozone in air NOX is involved in the formation of ozone but close to the NO source the ozone concentration is lowered due to the rapid reactions between NO and O3 forming NO2 If NO is released in an environment with already high NO concentration it may result in lowering of ozone levels on the regional scale In the present study the ozone concentrations calculated are somewhat lower for the E85 scenario than for the petrol scenario
The health risk analysis shows that the main difference between the scenarios is due to the lower concentration of NOX However it may have been other exhaust components than NOX such as exhaust particles that were behind the reported association with mortality In cases when NOX is not a good indicator of exhaust particle emissions and their toxicity our results may be misleading This should be studied further Neglecting the effects of the changes in NOX exposure the total difference between the scenarios sums up to 16 preterm deaths per year with lower values for the E85 scenario while it would sum up to 12 less preterm deaths for the E85 scenario if the effect related to NOX were included Since there are no similar studier for the effect on mortality among those younger than 30-50 years of age we assume the same relative effect on mortality in all ages This makes only a small difference since the large majority of deaths occur in older groups
A comparison of emissions from ethanol and petrol fuelled cars IVL report B1962 Health risk assessment for Vaumlstra Goumltaland
24
The opposite result for the ozone concentration was obtained by Jacobson The reason for this discrepancy is that the Jacobson study concerns Los Angeles a region with high concentrations of pollutants while the study here concerns the Vaumlstra Goumltaland region with much less dense traffic and also lower concentrations of pollutants importantly NOX It is not unlikely that the effect that Jacobson report also would be found for large parts of Europe with higher traffic densities than in the Vaumlstra Goumltaland region
It is worth to emphasize that the major negative health effect in the Jacobson (2007) study is attributed to the increase in ozone concentration that is a result of the decrease of the NO emissions from E85 cars Directly after the emission NO reacts with ozone resulting in drop of the ozone concentration the so-called ozone titration commonly observed in many cities This NO does however form even higher quantities of ozone further downwind contributing to the general increase in the background ozone levels It is also precursor of NO2 secondary PM and other toxic species as eg PAN and hence reductions in NO emissions are never regarded as disbeneficial from the environmental viewpoint
There are of course several sources of uncertainties that influence the results of this study Since the main results concern differences between the two scenarios several of these factors loose on importance for the conclusions This comprises uncertainties in meteorology in future traffic volumes and in the population density distribution However there are some uncertainties that remain important The emission factors for E85 fuelled cars are much less characterised than what they are for petrol cars The emission of particles from E85 fuelled cars is especially uncertain with only very few published results Also the emissions of NMHC are somewhat uncertain and may be higher for E85 at lower ambient temperatures However the sensitivity analysis performed shows that for the studied region the NMHC emissions only have a small influence on the ozone concentrations
5 Conclusions
In this study the impact of tailpipe and evaporative emissions from E85 fuelled cars on air pollution and health risks are calculated and compared with petrol fuelled cars The scenario calculations for the Vaumlstra Goumltaland Region give data on emissions pollutant concentrations exposure and a health risk evaluation
The differences in emission factors between E85 and petrol lies in the emissions of PM and NOX which are about 65 and 58 for E85 relative petrol respectively Also the speciation of the emitted hydrocarbons is significantly different with large emissions of acetaldehyde and ethanol from E85 and large emissions of benzene higher aromatics alkanes and alkenes from petrol
These differences in emission factors reflect in differences in emissions The emission calculations for all Swedish road traffic show a decrease for the E85 scenario relative to the petrol scenario of 65 for NOX 34 for PM25 67 for benzene For acetaldehyde there is an increase of 770
The differences obtained from the TAPM modelling show decreased levels of NOX ozone and benzene with E85 and increased levels of acetaldehyde For the latter the increase may be up to 80 while NOX and ozone show decreases of up to a few per cent and a few tenths of per cent respectively
A comparison of emissions from ethanol and petrol fuelled cars IVL report B1962 Health risk assessment for Vaumlstra Goumltaland
25
The health risk assessment shows decreased health risks in the E85 scenario relative the all-petrol scenario due to the increased NOX exposure correlated with both preterm deaths and asthma However NOX may be mainly an exhaust indicator Smaller effects are expected from the changes in ozone acetaldehyde and benzene exposure The overall difference considering the exposure to PM acetaldehyde benzene and ozone is 16 preterm deaths with lower values for the E85 scenario
6 Acknowledgements
Saab Automobile The Swedish Transport Administration and The Foundation for the Swedish Environmental Research Institute are gratefully acknowledged for financial contribution
Magnus Ekstroumlm and Maria Holmstroumlm at Saab and Martin Juneholm at the Swedish Transport Administration are acknowledged for their most valuable input to the study
David Simpson Norwegian Meteorological Institute EMEP MSC-W Norway and Dept Radio amp Space Science Chalmers Univ Technol Sweden is gratefully acknowledged for help with implementation of the Unified EMEP model
A comparison of emissions from ethanol and petrol fuelled cars IVL report B1962 Health risk assessment for Vaumlstra Goumltaland
26
7 References
Altenstedt J Pleijel K 2000 An alternative approach to photochemical ozone creation potentials under European conditions J Air amp Waste Manage Assoc 50 1023 ndash 1036
Andre J-M (2005) Vehicle emission measurement collection of the ARTEMIS datatbase Artemis 3312 report Available from httpwwwinretsfrurltepublicationspublications-pdfJoumardA3312reportJMALTE0504pdf
Bachand A MMundt K A Mundt D JMontgomery R R Epidemiological studies of formaldehyde exposure and risk of leukemia and nasopharyngeal cancer A meta-analysis Critical Reviews in Toxicology 2010 40(2) 85ndash100
Beane Freeman L E Blair A Lubin J H Stewart P A Hayes R B Hoover R N Hauptmann M Mortality from lymphohematopoietic malignancies among workers in formaldehyde industries The National Cancer Institute Cohort J Natl Cancer Inst 2009101751ndash761
Bosetti C McLaughlin J K Tarone R E Pira E LaVecchia C Formaldehyde and cancer risk A quantitative review of cohort studies through 2006 Ann Oncol 20081929ndash43
ConcaweJRC Well-to-wheel studies httpiesjrceceuropaeuwtwhtml
Derwent R G Jenkin M E Saunders S M 1996 Photchemical ozone creation potentials for a large number of reactive hydrocarbons under European conditions Atmos Environ 30 181 ndash 199
Derwent RG Jenkin ME Passant NR Pilling MJ 2007 Photochemical ozone creation potentials (POCPs) for different emission sources of organic compounds under European conditions estimated with a Master Chemical Mechanism Atmos Env 41 2570ndash2579
EEA Copenhagen 2009 wwweeaeuropaeudata-and-mapsdatapopulation-density-disaggregated-with-corine-land-cover-2000-2
Ericsson P Holmstroumlm M Amberntsson-Carlsson A Ohlson C Skoglundh M Andersson B Carlsson P-A 2008 Characterization of particulate emissions and methodologhy for oxidation of particulates from non-diesel combustion ystems SAE Technical Paper Series 2008-01-1746
GAINS 2010 httpgainsiiasaacatindexphpgains-europe
Graham LA Belisle SL Baas C-L Emissions from light duty gasoline vehicles operating on low blend ethanol gasoline and E85 Atmospheric Environment 42 4498 (2008)
Haskew H M Thomas P E Liberty F 2006 Fuel Permeation From Automotive Systems E0 E6 E10 E20 And E85 Final Report CRC Project No E-65-3 Coordinating Research Council Inc 3650 Mansell RoadSuite 140Alpharetta GA 30022
HEI Air Toxics Review Panel (2007) Mobile-Source Air Toxics A Critical Review of the Literature on Exposure and Health Effects HEI Special Report 16 Health Effects Institute Boston USA
Hurley P TAPM v 4 User Manual 2008 CSIRO ISBN 978-1-921424-73-1
IARC (2006) IARC Monographs on the Evaluation of Carcinogenic Risks to Humans Wood Dusts and Formaldehyde Lyon World Health Organization International Agency for Research on Cancer Lyon France 8837ndash325
Jacobson M Z Effects of Ethanol (E85) versus Gasoline Vehicles on Cancer and Mortality in the United States Environ Sci Technol 2007414150-4157
A comparison of emissions from ethanol and petrol fuelled cars IVL report B1962 Health risk assessment for Vaumlstra Goumltaland
27
Jerret M Burnett R T Pope C A Ito K Thurston G Krewski D Shi Y Calle E Thun M Long-Term Ozone Exposure and Mortality N Engl J Med 20093601085-95
Lipman T E Delucchi M A 2002 Emissions of nitrous oxide and methane from conventional and alternative fuel motor vehicles Climate Change 53 477
Modig L Toreacuten K Janson C Jarvholm B Forsberg B Vehicle exhaust outside the home and onset of asthma among adults Eur Respir J 2009 Jun33(6)1261-7
Nafstad P Haheim L L Wisloff T Gram F Oftedal B Holme I Hjermann I Leren P Urban air pollution and mortality in a cohort of Norwegian men Environ Health Perspect 2004112(5)610-5
OEHHA (1999) Air Toxics Hot Spots Program Risk Assessment Guidelines Part II Technical Support Document for Describing Available Cancer Potency Factors Prepared by the Air Toxicology and Epidemiology Section Office of Environmental Health Hazard Assessment April 1999
Passant NR (2002) Speciation of UK emissions of non-methane volatile organic compounds AEAT report AEATENVR0545 Issue 1 Culham UK
Pope CA III Thun MJ Namboodiri MM Dockery DW Evans JS Speizer FE Heath CJ Particulate air pollution as a predictor of mortality in a prospective study of US adults Am J Resp Crit Care Med 1995 151 669-674
Seinfeld J H and Pandis SN (1998) Atmospheric Chemistry and Physics From Air Pollution to Climate Change John Wiley amp Sons New YorkSimpson D Fagerli H Jonson JE Tsyro S Wind P Tuovinen J -P 2003 Transboundary acidification and eutrophication and ground level ozone in Europe Unified EMEP Model Description EMEP Status Report 12003 Part I EMEPMSC-W Report The Norwegian Meteorological Institute Oslo Norway
US EPA (1999) httpwwwepagovttnatwnata1999nsata1999
Vestreng V et al 2004 Inventory Review 2004 Emission data reported to CLRTAP and the NEC Directive EMEPEEA Joint Review Report EMEPMSC-W Note 1
Westerholm R Ahlvik P Karlsson HL An exhaust characterisation study based on regulated and unregulated emissions from bi-fuel and flexi-fuel light-duty passanger cars fuelled by petrol (E5) bioethanol (E70 E75) and biogas tested at ambient temperatures of +22degC and -7degC 2008
Wolkoff P Nielsen G D Non-cancer effects of formaldehyde and relevance for setting an indoor air guideline Environment International 201036788ndash799
Yanowitz J McCormick RL Effect of E85 on tailpipe emissions from light-duty vehicles J Air amp Waste Manage Assoc 59 172 (2009)
A comparison of emissions from ethanol and petrol fuelled cars IVL report B1962 Health risk assessment for Vaumlstra Goumltaland
28
Appendix 1 Evaporate emissions of NMHC
The following assumptions are done for evaporative emissions The NMHC emissions from E85 are reduced relative to petrol by 45 Methane emissions are zero and the split of NMHC species is 68 ethanol and the remaining 32 is divided in the same way as evaporative emissions for petrol The estimates by Graham et al (2008) are missing evaporative emission data however these assumptions agrees very well with measurements of evaporative emissions due to fuel permeation reported by Haskew et al (2006) where NMHC emissions are reported to be reduced by 50 for E85 fuel compared to petrol Haskew et al also presents the NMHC split to species with 60 ethanol This number agrees quite well with our assumption of 68 NMHC being ethanol NMHC in exhaust and evaporative emissions are thus divided as in Table A1
Table A1 Division of NMHC in the exhaust and evaporative emissions for E85 and petrol respectively (wt)
E85 Petrol E85 Petrol exhaust exhaust evaporative evaporative
Ethanol 680 0 680 0 Acetaldehyde 131 08 02 0 Ethene 99 73 24 0 Ethyne 03 28 09 0 Formaldehyde 31 17 06 0 Benzene 16 56 18 10 13 Butadiene 03 09 03 0 sum 963 191 741 10
The remaining NMHC emissions are divided as for petrol (ref) and listed in Table A2
Table A2 Division of NMHC in the exhaust and evaporative emissions for E85 and petrol respectively (wt)
E85 Petrol E85 Petrol exhaust exhaust evaporative evaporative
Ethane 02 32 10 0 Alkanes (C3+) 13 278 89 880 Alkenes (C3+) 04 90 29 95 Aromatics (C7+) 18 388 125 15 Aldehydesketones (C3+)
01 15 05 0
A comparison of emissions from ethanol and petrol fuelled cars IVL report B1962 Health risk assessment for Vaumlstra Goumltaland
29
Appendix 2 Description of the model system
A21 Atmospheric lifetimes
Table A3 gives tropospheric lifetimes with regard to reaction of ethanol formaldehyde acetaldehyde and benzene (C6H6) with OH nitrate radical (NO3) and photolysis The studied organic species are listed together with three species common in the gasoline exhaust (benzene ethene and toluene) for comparison Table 11 shows also photochemical ozone creation potential (POCP) of these species POCP is a measure of amount of ozone that is formed from a certain VOC emission relatively to other emission source which has been established to the same emission mass of ethene (Derwent et al 1996 Altenstedt et al 2000) The range represents different scenarios for VOC and NOX background concentrations Derwent et al (2007) used similar methodology to calculate POCP of different VOC sources and calculated POCP of mean road emission exhaust to be 69
Table A3 Atmospheric lifetimes of studies NMVOC species with respect to the OH- and NO3- initiated
degradation τ(OH) and τ(NO3) and with respect to the photolysis (The lifetime of a chemical species which decays in a first-order process is the time needed for a concentration of this species to decrease to 1e of its original value Statistically it represents the mean life expectancy of an excited species) The OH concentration of 1times106 moleculescm3 typical for summer troposphere was used for the lifetime calculation The NO3 concentrations of 5 and 100 ppt(V) were used for lifetime calculations as representative of rural and urban night-time 12 hrs mean concentration The studied organic species are listed together with 3 species common in the gasoline exhaust for comparison The rates of photolysis were calculated with radiation transfer model for July 58ordm latitude and integrated over 24 hours
τ(OH) τ(NO3) urbanrural τ (photolysis) POCP
hr hr hr
Ethanol 85 56 1times103 - 44 - 63
Acetaldehyde 15 47 1times103 86 68 - 80
Formaldehyde 30 194 4times103 10 18 - 55
Benzene 214 - - 23 - 47
Ethene 34 - - 100
Toluene 50 - - 30 - 67
A22 Defining of boundary concentrations for TAPM from EMEP fields
Calculation of initial concentration field for TAPM from EMEP concentration field of NO2 (as example) and EMEP mean wind vector components u_mid and v_mid Two EMEP model gridcells (i=56 j=60 and i=56 j=61) represent the TAPM model domain and concentrations from the surrounding EMEP gridcells SE-S SE-N NW-S NW-N NE NW (Figure A1) are used for calculation of boundary concentration NO2(bc) according to the following code if u_mid lt= 0 then ( isite = SE-S and jsite = SE-N) else isite = NW-S and jsite = NW-N) endif
A comparison of emissions from ethanol and petrol fuelled cars IVL report B1962 Health risk assessment for Vaumlstra Goumltaland
30
if v_mid lt= 0 then ( ksite = NE) else ksite = SW endif NO2(bc) = [(NO2(isite)u_mid(isite) + NO2(jsite)u_mid(jsite))2 + NO2(ksite)v_mid(ksite)] [(u_mid(isite) + u_mid(jsite))2 + v_mid(ksite)]
Figure A1 Gridcells covering Gothenburg domain and its boundary in EMEP model plotted on latitude-
longitude coordinates The red square represents centre of Gothenburg and the blue line the coastline EMEP i and j coordinates for the boundary gridcells are SE-S = 57-60 SE-N = 57-61 NW-S = 55-60 NW-N = 55-61 NE = 56-62 NW = 56-59 and for Gothenburg grid cells are Gbg-NE = 56-61 Gbg-SW = 56-60
A23 Atmospheric chemistry
The role of secondary chemistry in for the concentration of acetaldehyde are studied by first excluding the primary acetaldehyde emissions from the EMEP model simulations of scenarios S1 and S2 and then by excluding all NMVOC emissions from the car category with spark ignition engines The contribution from the primary acetaldehyde emissions as well as the contribution of secondary acetaldehyde formed from other NMVOC to the total acetaldehyde concentration is then obtained However the secondary chemistry is highly nonlinear due to the interactions of NMVOCs with ozone and OH and thus the results for the contribution of secondary acetaldehyde are somewhat uncertain Differences in acetaldehyde concentrations between S1 and S2 scenarios are studied with respect to contribution of primary and secondary acetaldehyde It is observed that in summer background air the monthly mean contribution of the secondary acetaldehyde is of the same magnitude as the contribution of the primary acetaldehyde to the difference between S1 and
565
57
575
58
585
105 115 125 135 145
Long
Lat
Gbg-SW
Gbg-NE
SE-S
NW-N
NW-S
SE-N
SW
NE
55-59
57-59
55-62
A comparison of emissions from ethanol and petrol fuelled cars IVL report B1962 Health risk assessment for Vaumlstra Goumltaland
31
S2 In the winter and in more polluted atmosphere (Gothenburg grid cells) the contribution from secondary acetaldehyde to the concentration difference appears to be negative due to the chemistry feedback ie the E-85 scenario has less secondary acetaldehyde than the all-petrol scenario
A comparison of S2-S1 differences in primary and secondary acetaldehyde concentrations in the background (=upwind) and Gothenburg grid cells show no increase in the secondary acetaldehyde from upwind to the Gothenburg grid cell It can thus be concluded that there is no significant contribution from secondary aldehydes on the small scale (tenths of km) Conclusion from this sensitivity study is that the secondary formaldehyde can be of importance under summer in the clean background air but that formation on the local scale is unimportant Using EMEP simulated boundary concentrations of acetaldehyde in the local scale model and simulating the primary acetaldehyde emissions will capture the most important features of acetaldehyde dispersion and chemistry in Vaumlstra Goumltaland
In the EMEP model the tail-pipe PM emissions are specified as primary particles Emissions of NOX and VOCs (and NH3 SO2) are oxidised in the atmosphere and a part is then transferred through the gas-to-particle transport to the PM as secondary PM The petrol fuelled cars emit both more primary PM and more NOX compared to the E85 cars If we compare differences in primary and secondary PM between the S1 and S2 scenarios simulated by EMEP we can directly see what part of the difference is from the tail-pipe emissions of the primary particles and what part is from the formation of the secondary PM in atmosphere (mostly from higher emissions of NOX) Table A4 shows the differences between S1 and S2 (S1-S2) of monthly PM averages for January and June (two months with low and high photochemical activities respectively) It can be seen that the higher formation of secondary PM in the S1 (all-petrol) scenario is more important than the higher tail-pipe emission of primary PM by factor 10 - 20
When we compare simulated PM differences between S1-S2 for the background air (=upwind) grid cells and for grid cells including Gothenburg (50 km x 50 km scale) we can see significant increase in primary PM in the S1 scenario from the upwind grid cells to Gothenburg (746 in winter 132 in summer) while no systematic increase can be seen for the secondary PM (-42 in winter +24 in summer) From this comparison it can be concluded that no systematic increase in secondary PM can be seen (in difference from the primary PM) on the scale of 50-100 km and we can neglect this process on the small scale However the overall change in PM concentrations due to the switch of the fuel is very small both on the large scale and on the small scale as can be seen when the differences in PM concentrations between S1 and S2 are compared to absolute PM concentrations in S1 presented in the last column of Table A4
Table A4 Differences in primary and secondary PM concentrations between the lsquoAll-petrolrsquo (S1) and lsquoE-85rsquo (S2) scenarios simulated in gridcells upwind Gothenburg and in gridcells including Gothenburg (2 50 km x 50 km gridcells)
S1-S2 Background
S1-S2 Gothenburg
Increase S1-S2 Gothenburg
S1 Background
μgm3 μgm3 μgm3 bkgnd μgm3
Prim PM10 Jan 00008 00014 00006 746 084
Jun 00008 00018 00010 1319 084
Sec PM10 Jan 00155 00148 -00006
-42 157
Jun 00080 00081 00002 24 213
The sensitivity of the used emission factors for NMHC with respect to the ozone formation in the region of the Swedish West Coast can be analysed with the help of results from studying the
A comparison of emissions from ethanol and petrol fuelled cars IVL report B1962 Health risk assessment for Vaumlstra Goumltaland
32
formation of secondary acetaldehyde In this study first all primary acetaldehyde emitted by the E85 fleet are omitted in a model simulation (S2_nopAA) and secondly all NMHC emissions from the E-85 fleet are switched off (S2_noVOC) Acetaldehyde has a somewhat higher though still comparable photochemical ozone creation potential compared to ethanol (ethanol 44-63 acetaldehyde 68-80 Altenstedt and Pleijel 2000) and this simulation will thus also give information on the sensitivity of the calculations to uncertainties in the ethanol emissions Setting the emission factor for NMHC to zero gives the sensitivity to the emission factor of total NMHC Figure A2 shows the differences in ozone concentration as a result of acetaldehyde only and the total NMHC from the E85 car fleet (S2 scenario) We can see that the effect on ozone formation is very small for the Swedish West coast The reason is that the ozone formation in this area is controlled by the availability of NOX while NMHC or rather their degradation products the peroxy radicals that serve as a lsquofuelrsquo to ozone formation are usually in excess here and further VOC emissions do not increase ozone concentrations significantly The situation looks different in areas that are more heavily polluted with NOX andor which is limited in the availability of peroxy radicals The results from this sensitivity study are fully consistent with the observed increase in ozone concentrations as a result of lower NO emissions (the so-called ozone titration) only very close to the major roads but no larger-scale decrease in ozone concentrations in the Gothenburg area or in any other communities
Figure A2 Sensitivity of the ozone formation in the 2 EMEP model grid cells covering Gothenburg (blue) and in the 6 surrounding grid cells (red see Fig A1) to changes in NMHC emission factor of the E85 fuelled cars lsquobasersquo is simulation S2 with EF for NMHC as in Table 3 lsquonoVOCrsquo is S2 with EF for all NMHC = 0 lsquonopAArsquo is S2 with EF for acetaldehyde = 0 a ndash Mean sensitivity in January absolute difference in ozone formation in ppb(V) as a result of NMHC (base-noVOC) and acetaldehyde (base-nopAA) emissions b ndash Sensitivity relative to ozone concentration in the S2-base simulation January c ndash same as a) but June d ndash same as b) but June
‐002
‐001
0
001
base‐noVOC base‐nopAA
ΔO3(ppb)
a)
0
001
002
base‐noVOC base‐nopAA
ΔO
3(ppb)
c)
‐010
‐005
000
005
base‐noVOC base‐nopAA
ΔO
3
b)
000
002
004
006
base‐noVOC base‐nopAA
ΔO
3
d)
A comparison of emissions from ethanol and petrol fuelled cars IVL report B1962 Health risk assessment for Vaumlstra Goumltaland
33
Appendix 3 Emission results
The geographically distributed NOX and acetaldehyde emissions for the Vaumlstra Goumltaland region are presented in Figures A3 and A4 respectively
Figure A3 NOX emissions for the Vaumlstra Goumltaland region for the All Petrol scenario
A comparison of emissions from ethanol and petrol fuelled cars IVL report B1962 Health risk assessment for Vaumlstra Goumltaland
34
Figure A4 Acetaldehyde emissions for the Vaumlstra Goumltaland region for the All Ethanol scenario
A comparison of emissions from ethanol and petrol fuelled cars IVL report B1962 Health risk assessment for Vaumlstra Goumltaland
35
Appendix 4 Dispersion modelling results
The difference in yearly average concentration between scenario S1 and S2 for acetaldehyde and benzene can be seen in Figure A5 and Figure A6 respectively a)
b)
Figure A5 The difference in yearly average concentrations of acetaldehyde for 2020 between the all E85 (S2) and all petrol (S1) scenarios presented as a) microgm3 and as b) percentage for the Gothenburg area
A comparison of emissions from ethanol and petrol fuelled cars IVL report B1962 Health risk assessment for Vaumlstra Goumltaland
36
a)
b) all E85 c) all petrol
Figure A6 a) the difference in yearly average concentrations (gm3) of benzene for 2020 between the all E85 (S2) and all petrol (S1) scenarios yearly means for b) all E85 and c) all petrol (note the different scales)
The difference in the calculated NOX NO2 and ozone concentrations between the two scenarios are shown in Figures A7 A8 and A9
A comparison of emissions from ethanol and petrol fuelled cars IVL report B1962 Health risk assessment for Vaumlstra Goumltaland
37
a)
b)
Figure A7 The difference in yearly average concentrations of NOX for 2020 between the all E85 (S2) and all petrol (S1) scenarios presented as a) microgm3 and as b) percentage for the Gothenburg area
A comparison of emissions from ethanol and petrol fuelled cars IVL report B1962 Health risk assessment for Vaumlstra Goumltaland
38
a)
Figure A8 The difference in yearly average concentrations of NO2 for 2020 between the all E85 (S2) and all petrol (S1) scenarios presented as a) microgm3 and as b) percentage for the Gothenburg area
A comparison of emissions from ethanol and petrol fuelled cars IVL report B1962 Health risk assessment for Vaumlstra Goumltaland
39
a)
b)
Figure A9 The difference in yearly average concentrations of ozone for 2020 between the all E85 (S2) and all petrol (S1) scenarios presented as a) microgm3 and as b) percentage for mainly the Gothenburg area
A comparison of emissions from ethanol and petrol fuelled cars IVL report B1962 Health risk assessment for Vaumlstra Goumltaland
40
Appendix 5 Detailed Exposure data
Detailed exposure data for the difference between the all E85 (S2) and the all petrol (S1) scenarios can be found in Table A5
Table A5 Exposure data for the difference between the all E85 (S2) and the all petrol (S1) scenarios
Acetaldehyde diff E-P (microgm3)
Populated weighted mean
Number of people Percentage of population
0 - 01 627198 582 01 - 02 163394 152 02 - 03 134879 125 03 - 04 88099 82 04 - 05 38686 36 05 - 06 16880 16 06 - 07 7983 07 07 - 08 1248 01 Tot 014 1078367 Benzene diff E-P (microgm3)
Populated weighted mean
Number of people Percentage of population
-03 - -02 26680 25 -02 - -01 205757 191 -01 - -0 845930 784 Tot -0074 1078367 NO2 diff E-P (microgm3) Populated weighted
mean Number of people Percentage of
population -04 - -03 7698 07 -03 - -02 50131 46 -02 - -01 296288 275 -01 - -0 724250 672 Tot -009 1078367 NOX diff E-P (microgm3) Populated weighted
mean Number of people Percentage of
population -06 - -05 7698 -05 - -04 19639 18 -04 - -03 36626 34 -03 - -02 161685 150 -02 - -01 186500 173 -01 - -0 666219 618 Tot -012 1078367 O3 diff E-P (microgm3) Populated weighted
mean Number of people Percentage of
population -02 - -01 779132 723 -01 - -0 266417 247 0 - 01 32818 30 Tot -012 1078367
Exposure data for the total levels in the two scenarios can be found in Table A6
A comparison of emissions from ethanol and petrol fuelled cars IVL report B1962 Health risk assessment for Vaumlstra Goumltaland
41
Table A6 Exposure data for the total levels in the two scenarios
Acetaldehyde tot All ethanol (microgm3)
Populated weighted mean
Number of people Percentage of population
06 - 07 568825 527 07 - 08 171845 159 08 - 09 124551 115 09 - 10 100946 94 10 - 11 59235 55 11 - 12 30559 28 12 - 13 13175 12 13 - 14 7983 07 14 - 15 1248 01 Tot 077 1078367 Acetaldehyde tot All petrol (microgm3)
Populated weighted mean
Number of people Percentage of population
05 - 06 45111 42 06 - 07 1032008 957 07 - 08 1248 01 Tot 065 1078367 Benzene tot All ethanol (microgm3)
Populated weighted mean
Number of people Percentage of population
0 - 01 1055961 98 01 - 02 22406 2 Tot 005 1078367 Benzene tot All petrol (microgm3)
Populated weighted mean
Number of people Percentage of population
0 - 01 729093 676 01 - 02 232961 216 02 - 03 94042 87 03 - 04 21023 19 04 - 05 1248 01 Tot 010 1078367 NOX tot All ethanol (microgm3)
Populated weighted mean
Number of people Percentage of population
0-10 779108 722 10-20 254658 236 20-30 28683 27 30-40 11070 10 40-50 3426 03 50-60 0 00 60-70 0 00 70-80 639 01 80-90 0 00 90-100 0 00 100-110 783 01 Tot 84 1078367 NOX tot All petrol (microgm3)
Populated weighted mean
Number of people Percentage of population
0-10 769557 714 10-20 264209 245 20-30 28683 27 30-40 11070 10 40-50 3426 03 50-60 0 00
A comparison of emissions from ethanol and petrol fuelled cars IVL report B1962 Health risk assessment for Vaumlstra Goumltaland
42
60-70 0 00 70-80 639 01 80-90 0 00 90-100 0 00 100-110 783 01 Tot 85 1078367 O3 tot All ethanol (microgm3)
Populated weighted mean
Number of people Percentage of population
40-45 1422 01 45-50 26487 25 50-55 176636 164 55-60 770370 714 60-65 103452 96 Tot 569 1078367 O3 tot All petrol (microgm3)
Populated weighted mean
Number of people Percentage of population
40-45 1422 01 45-50 20229 19 50-55 181876 169 55-60 763361 708 60-65 111479 103 Tot 570 1078367 PM25 tot All ethanol (microgm3)
Populated weighted mean
Number of people Percentage of population
1-2 0 00 2-3 885325 821 3-4 192259 178 4-5 783 01 Tot 268 1078367 PM25 tot All petrol (microgm3)
Populated weighted mean
Number of people Percentage of population
1-2 0 00 2-3 868773 806 3-4 208811 194 4-5 783 01 Tot 270 1078367
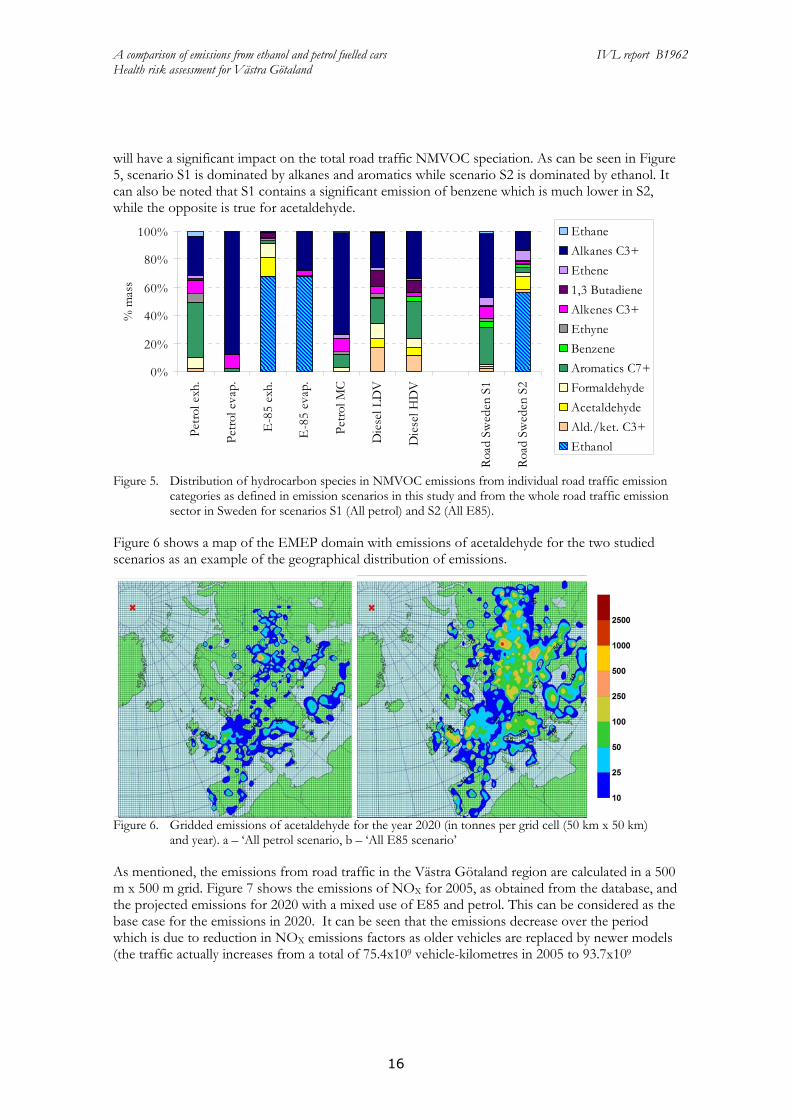
A comparison of emissions from ethanol and petrol fuelled cars IVL report B1962 Health risk assessment for Vaumlstra Goumltaland
18
a)
b)
Figure 8 Time series analyses of S1 and S2 scenarios for the EMEP and TAPM modelled concentrations of NOX and ozone at an urban background site in Gothenburg (TAPM) and in EMEP model grid cells including Gothenburg city (50 km x 50 km)
Concentrations of NOX and ozone at an urban background site in Gothenburg (TAPM) and in the 50 km x 50 km EMEP grid cells including Gothenburg are compared for one summer and one winter month Due to the well-known process of ozone titration by freshly emitted nitrogen monoxide (Seinfeld and Pandis 1998) the concentration of ozone often decreases in urban areas This phenomenon is expected to be captured by the fine-gridded TAPM model but not necessarily by the courser scale of the EMEP model Figure 8 shows the generally higher NOX levels in the small grid cell of the TAPM model in urban background location comparing to those in the large EMEP grid cell while the opposite is observed for the ozone concentrations (Remember that the boundary concentrations for TAPM are obtained from the EMEP model and they are thus the same in both cases) This indeed shows that local scale emissions and processes contribute to locally increased levels of NOX in urban areas both for the summer and the winter cases For ozone where there of course are no primary emissions the situation is the opposite where instead the result is decreased concentration levels at urban sites on a local scale The influence of the
A comparison of emissions from ethanol and petrol fuelled cars IVL report B1962 Health risk assessment for Vaumlstra Goumltaland
19
NMHC emissions from the passenger cars is studied in a sensitivity analysis (see Appendix 23) and it is found to have only a small influence on the ozone levels
To illustrate the results of the different scenario calculations the geographically distributed concentrations are presented as the difference in yearly average concentrations between the all E85 (S2) and all petrol (S1) scenarios both as microgm3 and sometimes as percentage of the difference to scenario S1 (see Appendix 3)
The difference in yearly average concentrations between scenario S1 and S2 for acetaldehyde and benzene can be seen in Figures 9 and 10 respectively The increase in acetaldehyde concentration resulting from a switch from petrol to E85 is up to about 05 gm3 or 80 in the central parts of the largest urban area of the region Gothenburg Outside this area the relative increase is about 10 for the other urban areas and less than that for the rural areas This large relative increase (see map in Appendix 4) is a result of the relatively high emissions of acetaldehyde from E85 fuelled cars For benzene the situation is opposite In the scenarios for 2020 the concentration of benzene decreases by up to a few tenths of gm3 as a result of a switch from petrol to E85 For benzene the relative change is not calculated
Figure 9 The difference in yearly average concentrations of acetaldehyde for 2020 between the all E85 (S2) and all petrol (S1) scenarios (microgm3)
A comparison of emissions from ethanol and petrol fuelled cars IVL report B1962 Health risk assessment for Vaumlstra Goumltaland
20
Figure 10 The difference in yearly average concentrations (gm3) of benzene for 2020 between the all E85 (S2) and all petrol (S1) scenarios
The difference in the calculated NOX NO2 and ozone concentrations between the two scenarios are shown in Appendix 4 The change in NOX concentration between the two scenarios only represents a small fraction of the total NOX concentration This is because the emissions of NOX from petrol cars are relatively low compared with the contribution from diesel engines and other sources Thus the resulting decrease in the NOX concentration with E85 is only up to 3 For ozone there is a small increase of about 01 microgm3 of E85 in the central areas of Gothenburg where there is relatively high traffic intensity (see Appendix 4 Figure A9) In the rest of the region there is a small decrease in the ozone concentration in the E85 scenario
34 Exposure
The resulting concentrations from the dispersion modelling together with the population density distribution are used to assess the exposure to acetaldehyde benzene NO2 NOX and ozone for the two scenarios S1 and S2 The exposure to PM25 is very similar for the two scenarios (the difference in concentration between scenarios S2 and S1 is only about -002 gm3 Table 5 shows the population weighted mean exposure both as total concentrations and as the difference between the two scenarios Detailed exposure results can be found in Appendix 5 It can be seen that the exposure to all the pollutants in Table 5 with the exception of acetaldehyde are somewhat lower for the all E85 scenario (S2) than for the all petrol scenario (S1) However the effect on health also
A comparison of emissions from ethanol and petrol fuelled cars IVL report B1962 Health risk assessment for Vaumlstra Goumltaland
21
depends on the level of the dose-response functions For example if the level of concentration is low in a populated area but the dose-response function is high the effect of even a low concentration increase can become important The increase in exposure from S1 to S2 (S2-S1) calculated as percentage of the population exposed to increased mean concentrations of pollutants is presented in Figure 11
Table 5 Populated weighted mean exposure (gm3)
S1 S2 S2-S1 Acetaldehyde 065 077 014 Benzene 01 005 -007 NOX 85 84 -012 Ozone 570 569 -012 PM25 270 268 -002
Increased concentrations Decreased concentrations Both increased and
decreased conc
Figure 11 The relative exposure (S2-S1) calculated as percentage of the population
In Figure 11 it is clear that the only pollutant that does not show an improvement regarding air quality and thus the health risks when modelling a switch from petrol to E85 is acetaldehyde For all pollutants except for ozone the changes of concentration levels observed between the scenarios are within the urban areas but for ozone there are also differences in rural areas
According to the data in Figure 11 about 14 of the population in the Vaumlstra Goumltaland region will be exposed to 03-08 microgm3 higher concentration levels of acetaldehyde in scenario S2 relative to S1 From Figure 9 it can be seen that the majority of these people live within the Gothenburg area Further about 28 of the population will be exposed to increased levels of between 01 to 03 microgm3 mainly in the suburban areas and rural surroundings of Gothenburg but also in some of the smaller cities in the region Outside the urban areas the concentration difference is lower than 01 microgm3
In the S2 scenario relative to the S1 scenario the population is exposed to decreased concentration levels of benzene and NOX This is mainly true also for O3 but with an exception for the central
A comparison of emissions from ethanol and petrol fuelled cars IVL report B1962 Health risk assessment for Vaumlstra Goumltaland
22
parts of Gothenburg where the concentration actually increases (see Appendix 4 Figure 7A) resulting in that 3 (blue area in Figure 11 for O3) of the population will be exposed to higher concentrations of O3 For the rest of the area there are decreased concentrations of ozone upon a switch to E85
The largest differences are again in the central parts of Gothenburg where about 20 of the population is being exposed to a lower benzene concentration of 01-03 microgm3 This also means that concerning benzene the majority (78) of the population have none or very low influence from a change to ethanol fuel
The largest effect on exposure difference is seen for NOX where just over 20 of the population has its exposure decreased with 03-05 microgm3 (in the central parts of Gothenburg) In the suburbs the decrease is between 01-02 microgm3 lower Along the largest roads there is a small but visible improvement on a yearly basis of 01 microgm3
For PM25 there is a difference in the populated weighted mean exposure of 002 gm3 between the scenarios with a lower value for the all-E85 case (see also Appendix 5)
35 Impact on health in Vaumlstra Goumltaland
351 NO2 and NOX
The impact of long-term exposure on mortality was estimated using the relative risk from the Norwegian cohort study (Nafstad et al 2004) reporting a relative risk of 08 increase per microgm3 increase in NOX however without adjustment for particle concentrations Assuming this effect on the total mortality and a typical baseline mortality of 1000 deaths per 100 000 person years a decrease in the population mean exposure of 012 microgm3 would correspond to approximately 104 less preterm deaths per year However for the present case this number is highly uncertain since the exposure to substances normally associated with changes in NOX exposure may here change in different ways since the relation between different exhaust components varies between the scenarios
The impact of long-term exposure on asthma incidence (new cases) in adults has been estimated using results from the Swedish RHINE Study Cohorts (Modig et al 2009) with very similar results in the ECRHS Study corresponding to approx 4 increase per microgm3 increase in NO2 From the RHINE Study the incidence can be estimated to 03 per year (proportion of adults developing the disease) with children and elderly excluded this means around 1500 adult cases per year A reduction of 009 microgm3 corresponds to 54 avoided new cases of adult asthma per year However also NO2 in the asthma study may have been mainly an indicator of vehicle exhaust
352 Ozone
The impact of long-term exposure on respiratory mortality has been reported to be approx 02 per microgm3 increase in the summer concentration when studied in the large ACS Cohort (Jerret et al 2009) Assuming this effect on the total population and a typical baseline respiratory mortality of 100 deaths per 100 000 person years a decrease in the population mean exposure of 012 microgm3 corresponds to approximately 03 less preterm deaths per year
A comparison of emissions from ethanol and petrol fuelled cars IVL report B1962 Health risk assessment for Vaumlstra Goumltaland
23
353 Acetaldehyde
According to US EPA (1999) a lifetime risk for cancer of 0000002 per microgm3 is to be assumed for this potential human carcinogen An increase in the population mean exposure of 012 microgm3 corresponds to 026 cases more per year in the current population
354 Benzene
According to US EPA (1999) a lifetime risk for cancer (leukaemia) of 00000022-00000078 per microgm3 is to be assumed for this human carcinogen A decrease in the population mean exposure of 0074 microgm3 corresponds to approximately 03 cases less per year in the current population (assuming 0000004 per microgm3)
355 PM25
In CAFEacute and other impact assessments a relative risk of 6 increase in all-cause mortality per 10 microgm3 has usually been assumed Assuming this effect on the total mortality and a typical baseline mortality of 1000 deaths per 100 000 person years a decrease in the population mean exposure of 002 microgm3 corresponds to approximately 13 less preterm deaths per year
4 Discussion
In this study the health risks from a large introduction of E85 to replace petrol is analysed in scenario studies for 2020 for the Vaumlstra Goumltaland region It is found that the change in pollutant concentration exposure and health risks are small between the two scenarios It should be emphasized that the study only considers vehicle emissions and does not take into account effects from the fuel production
The emissions of NOX in the model are somewhat lower from E85 fuelled cars than from petrol fuelled cars This is in line with the emission factors used by Jacobson (2007) The nitrogen oxides are key substances in the atmospheric reactions determining the concentrations of ozone in air NOX is involved in the formation of ozone but close to the NO source the ozone concentration is lowered due to the rapid reactions between NO and O3 forming NO2 If NO is released in an environment with already high NO concentration it may result in lowering of ozone levels on the regional scale In the present study the ozone concentrations calculated are somewhat lower for the E85 scenario than for the petrol scenario
The health risk analysis shows that the main difference between the scenarios is due to the lower concentration of NOX However it may have been other exhaust components than NOX such as exhaust particles that were behind the reported association with mortality In cases when NOX is not a good indicator of exhaust particle emissions and their toxicity our results may be misleading This should be studied further Neglecting the effects of the changes in NOX exposure the total difference between the scenarios sums up to 16 preterm deaths per year with lower values for the E85 scenario while it would sum up to 12 less preterm deaths for the E85 scenario if the effect related to NOX were included Since there are no similar studier for the effect on mortality among those younger than 30-50 years of age we assume the same relative effect on mortality in all ages This makes only a small difference since the large majority of deaths occur in older groups
A comparison of emissions from ethanol and petrol fuelled cars IVL report B1962 Health risk assessment for Vaumlstra Goumltaland
24
The opposite result for the ozone concentration was obtained by Jacobson The reason for this discrepancy is that the Jacobson study concerns Los Angeles a region with high concentrations of pollutants while the study here concerns the Vaumlstra Goumltaland region with much less dense traffic and also lower concentrations of pollutants importantly NOX It is not unlikely that the effect that Jacobson report also would be found for large parts of Europe with higher traffic densities than in the Vaumlstra Goumltaland region
It is worth to emphasize that the major negative health effect in the Jacobson (2007) study is attributed to the increase in ozone concentration that is a result of the decrease of the NO emissions from E85 cars Directly after the emission NO reacts with ozone resulting in drop of the ozone concentration the so-called ozone titration commonly observed in many cities This NO does however form even higher quantities of ozone further downwind contributing to the general increase in the background ozone levels It is also precursor of NO2 secondary PM and other toxic species as eg PAN and hence reductions in NO emissions are never regarded as disbeneficial from the environmental viewpoint
There are of course several sources of uncertainties that influence the results of this study Since the main results concern differences between the two scenarios several of these factors loose on importance for the conclusions This comprises uncertainties in meteorology in future traffic volumes and in the population density distribution However there are some uncertainties that remain important The emission factors for E85 fuelled cars are much less characterised than what they are for petrol cars The emission of particles from E85 fuelled cars is especially uncertain with only very few published results Also the emissions of NMHC are somewhat uncertain and may be higher for E85 at lower ambient temperatures However the sensitivity analysis performed shows that for the studied region the NMHC emissions only have a small influence on the ozone concentrations
5 Conclusions
In this study the impact of tailpipe and evaporative emissions from E85 fuelled cars on air pollution and health risks are calculated and compared with petrol fuelled cars The scenario calculations for the Vaumlstra Goumltaland Region give data on emissions pollutant concentrations exposure and a health risk evaluation
The differences in emission factors between E85 and petrol lies in the emissions of PM and NOX which are about 65 and 58 for E85 relative petrol respectively Also the speciation of the emitted hydrocarbons is significantly different with large emissions of acetaldehyde and ethanol from E85 and large emissions of benzene higher aromatics alkanes and alkenes from petrol
These differences in emission factors reflect in differences in emissions The emission calculations for all Swedish road traffic show a decrease for the E85 scenario relative to the petrol scenario of 65 for NOX 34 for PM25 67 for benzene For acetaldehyde there is an increase of 770
The differences obtained from the TAPM modelling show decreased levels of NOX ozone and benzene with E85 and increased levels of acetaldehyde For the latter the increase may be up to 80 while NOX and ozone show decreases of up to a few per cent and a few tenths of per cent respectively
A comparison of emissions from ethanol and petrol fuelled cars IVL report B1962 Health risk assessment for Vaumlstra Goumltaland
25
The health risk assessment shows decreased health risks in the E85 scenario relative the all-petrol scenario due to the increased NOX exposure correlated with both preterm deaths and asthma However NOX may be mainly an exhaust indicator Smaller effects are expected from the changes in ozone acetaldehyde and benzene exposure The overall difference considering the exposure to PM acetaldehyde benzene and ozone is 16 preterm deaths with lower values for the E85 scenario
6 Acknowledgements
Saab Automobile The Swedish Transport Administration and The Foundation for the Swedish Environmental Research Institute are gratefully acknowledged for financial contribution
Magnus Ekstroumlm and Maria Holmstroumlm at Saab and Martin Juneholm at the Swedish Transport Administration are acknowledged for their most valuable input to the study
David Simpson Norwegian Meteorological Institute EMEP MSC-W Norway and Dept Radio amp Space Science Chalmers Univ Technol Sweden is gratefully acknowledged for help with implementation of the Unified EMEP model
A comparison of emissions from ethanol and petrol fuelled cars IVL report B1962 Health risk assessment for Vaumlstra Goumltaland
26
7 References
Altenstedt J Pleijel K 2000 An alternative approach to photochemical ozone creation potentials under European conditions J Air amp Waste Manage Assoc 50 1023 ndash 1036
Andre J-M (2005) Vehicle emission measurement collection of the ARTEMIS datatbase Artemis 3312 report Available from httpwwwinretsfrurltepublicationspublications-pdfJoumardA3312reportJMALTE0504pdf
Bachand A MMundt K A Mundt D JMontgomery R R Epidemiological studies of formaldehyde exposure and risk of leukemia and nasopharyngeal cancer A meta-analysis Critical Reviews in Toxicology 2010 40(2) 85ndash100
Beane Freeman L E Blair A Lubin J H Stewart P A Hayes R B Hoover R N Hauptmann M Mortality from lymphohematopoietic malignancies among workers in formaldehyde industries The National Cancer Institute Cohort J Natl Cancer Inst 2009101751ndash761
Bosetti C McLaughlin J K Tarone R E Pira E LaVecchia C Formaldehyde and cancer risk A quantitative review of cohort studies through 2006 Ann Oncol 20081929ndash43
ConcaweJRC Well-to-wheel studies httpiesjrceceuropaeuwtwhtml
Derwent R G Jenkin M E Saunders S M 1996 Photchemical ozone creation potentials for a large number of reactive hydrocarbons under European conditions Atmos Environ 30 181 ndash 199
Derwent RG Jenkin ME Passant NR Pilling MJ 2007 Photochemical ozone creation potentials (POCPs) for different emission sources of organic compounds under European conditions estimated with a Master Chemical Mechanism Atmos Env 41 2570ndash2579
EEA Copenhagen 2009 wwweeaeuropaeudata-and-mapsdatapopulation-density-disaggregated-with-corine-land-cover-2000-2
Ericsson P Holmstroumlm M Amberntsson-Carlsson A Ohlson C Skoglundh M Andersson B Carlsson P-A 2008 Characterization of particulate emissions and methodologhy for oxidation of particulates from non-diesel combustion ystems SAE Technical Paper Series 2008-01-1746
GAINS 2010 httpgainsiiasaacatindexphpgains-europe
Graham LA Belisle SL Baas C-L Emissions from light duty gasoline vehicles operating on low blend ethanol gasoline and E85 Atmospheric Environment 42 4498 (2008)
Haskew H M Thomas P E Liberty F 2006 Fuel Permeation From Automotive Systems E0 E6 E10 E20 And E85 Final Report CRC Project No E-65-3 Coordinating Research Council Inc 3650 Mansell RoadSuite 140Alpharetta GA 30022
HEI Air Toxics Review Panel (2007) Mobile-Source Air Toxics A Critical Review of the Literature on Exposure and Health Effects HEI Special Report 16 Health Effects Institute Boston USA
Hurley P TAPM v 4 User Manual 2008 CSIRO ISBN 978-1-921424-73-1
IARC (2006) IARC Monographs on the Evaluation of Carcinogenic Risks to Humans Wood Dusts and Formaldehyde Lyon World Health Organization International Agency for Research on Cancer Lyon France 8837ndash325
Jacobson M Z Effects of Ethanol (E85) versus Gasoline Vehicles on Cancer and Mortality in the United States Environ Sci Technol 2007414150-4157
A comparison of emissions from ethanol and petrol fuelled cars IVL report B1962 Health risk assessment for Vaumlstra Goumltaland
27
Jerret M Burnett R T Pope C A Ito K Thurston G Krewski D Shi Y Calle E Thun M Long-Term Ozone Exposure and Mortality N Engl J Med 20093601085-95
Lipman T E Delucchi M A 2002 Emissions of nitrous oxide and methane from conventional and alternative fuel motor vehicles Climate Change 53 477
Modig L Toreacuten K Janson C Jarvholm B Forsberg B Vehicle exhaust outside the home and onset of asthma among adults Eur Respir J 2009 Jun33(6)1261-7
Nafstad P Haheim L L Wisloff T Gram F Oftedal B Holme I Hjermann I Leren P Urban air pollution and mortality in a cohort of Norwegian men Environ Health Perspect 2004112(5)610-5
OEHHA (1999) Air Toxics Hot Spots Program Risk Assessment Guidelines Part II Technical Support Document for Describing Available Cancer Potency Factors Prepared by the Air Toxicology and Epidemiology Section Office of Environmental Health Hazard Assessment April 1999
Passant NR (2002) Speciation of UK emissions of non-methane volatile organic compounds AEAT report AEATENVR0545 Issue 1 Culham UK
Pope CA III Thun MJ Namboodiri MM Dockery DW Evans JS Speizer FE Heath CJ Particulate air pollution as a predictor of mortality in a prospective study of US adults Am J Resp Crit Care Med 1995 151 669-674
Seinfeld J H and Pandis SN (1998) Atmospheric Chemistry and Physics From Air Pollution to Climate Change John Wiley amp Sons New YorkSimpson D Fagerli H Jonson JE Tsyro S Wind P Tuovinen J -P 2003 Transboundary acidification and eutrophication and ground level ozone in Europe Unified EMEP Model Description EMEP Status Report 12003 Part I EMEPMSC-W Report The Norwegian Meteorological Institute Oslo Norway
US EPA (1999) httpwwwepagovttnatwnata1999nsata1999
Vestreng V et al 2004 Inventory Review 2004 Emission data reported to CLRTAP and the NEC Directive EMEPEEA Joint Review Report EMEPMSC-W Note 1
Westerholm R Ahlvik P Karlsson HL An exhaust characterisation study based on regulated and unregulated emissions from bi-fuel and flexi-fuel light-duty passanger cars fuelled by petrol (E5) bioethanol (E70 E75) and biogas tested at ambient temperatures of +22degC and -7degC 2008
Wolkoff P Nielsen G D Non-cancer effects of formaldehyde and relevance for setting an indoor air guideline Environment International 201036788ndash799
Yanowitz J McCormick RL Effect of E85 on tailpipe emissions from light-duty vehicles J Air amp Waste Manage Assoc 59 172 (2009)
A comparison of emissions from ethanol and petrol fuelled cars IVL report B1962 Health risk assessment for Vaumlstra Goumltaland
28
Appendix 1 Evaporate emissions of NMHC
The following assumptions are done for evaporative emissions The NMHC emissions from E85 are reduced relative to petrol by 45 Methane emissions are zero and the split of NMHC species is 68 ethanol and the remaining 32 is divided in the same way as evaporative emissions for petrol The estimates by Graham et al (2008) are missing evaporative emission data however these assumptions agrees very well with measurements of evaporative emissions due to fuel permeation reported by Haskew et al (2006) where NMHC emissions are reported to be reduced by 50 for E85 fuel compared to petrol Haskew et al also presents the NMHC split to species with 60 ethanol This number agrees quite well with our assumption of 68 NMHC being ethanol NMHC in exhaust and evaporative emissions are thus divided as in Table A1
Table A1 Division of NMHC in the exhaust and evaporative emissions for E85 and petrol respectively (wt)
E85 Petrol E85 Petrol exhaust exhaust evaporative evaporative
Ethanol 680 0 680 0 Acetaldehyde 131 08 02 0 Ethene 99 73 24 0 Ethyne 03 28 09 0 Formaldehyde 31 17 06 0 Benzene 16 56 18 10 13 Butadiene 03 09 03 0 sum 963 191 741 10
The remaining NMHC emissions are divided as for petrol (ref) and listed in Table A2
Table A2 Division of NMHC in the exhaust and evaporative emissions for E85 and petrol respectively (wt)
E85 Petrol E85 Petrol exhaust exhaust evaporative evaporative
Ethane 02 32 10 0 Alkanes (C3+) 13 278 89 880 Alkenes (C3+) 04 90 29 95 Aromatics (C7+) 18 388 125 15 Aldehydesketones (C3+)
01 15 05 0
A comparison of emissions from ethanol and petrol fuelled cars IVL report B1962 Health risk assessment for Vaumlstra Goumltaland
29
Appendix 2 Description of the model system
A21 Atmospheric lifetimes
Table A3 gives tropospheric lifetimes with regard to reaction of ethanol formaldehyde acetaldehyde and benzene (C6H6) with OH nitrate radical (NO3) and photolysis The studied organic species are listed together with three species common in the gasoline exhaust (benzene ethene and toluene) for comparison Table 11 shows also photochemical ozone creation potential (POCP) of these species POCP is a measure of amount of ozone that is formed from a certain VOC emission relatively to other emission source which has been established to the same emission mass of ethene (Derwent et al 1996 Altenstedt et al 2000) The range represents different scenarios for VOC and NOX background concentrations Derwent et al (2007) used similar methodology to calculate POCP of different VOC sources and calculated POCP of mean road emission exhaust to be 69
Table A3 Atmospheric lifetimes of studies NMVOC species with respect to the OH- and NO3- initiated
degradation τ(OH) and τ(NO3) and with respect to the photolysis (The lifetime of a chemical species which decays in a first-order process is the time needed for a concentration of this species to decrease to 1e of its original value Statistically it represents the mean life expectancy of an excited species) The OH concentration of 1times106 moleculescm3 typical for summer troposphere was used for the lifetime calculation The NO3 concentrations of 5 and 100 ppt(V) were used for lifetime calculations as representative of rural and urban night-time 12 hrs mean concentration The studied organic species are listed together with 3 species common in the gasoline exhaust for comparison The rates of photolysis were calculated with radiation transfer model for July 58ordm latitude and integrated over 24 hours
τ(OH) τ(NO3) urbanrural τ (photolysis) POCP
hr hr hr
Ethanol 85 56 1times103 - 44 - 63
Acetaldehyde 15 47 1times103 86 68 - 80
Formaldehyde 30 194 4times103 10 18 - 55
Benzene 214 - - 23 - 47
Ethene 34 - - 100
Toluene 50 - - 30 - 67
A22 Defining of boundary concentrations for TAPM from EMEP fields
Calculation of initial concentration field for TAPM from EMEP concentration field of NO2 (as example) and EMEP mean wind vector components u_mid and v_mid Two EMEP model gridcells (i=56 j=60 and i=56 j=61) represent the TAPM model domain and concentrations from the surrounding EMEP gridcells SE-S SE-N NW-S NW-N NE NW (Figure A1) are used for calculation of boundary concentration NO2(bc) according to the following code if u_mid lt= 0 then ( isite = SE-S and jsite = SE-N) else isite = NW-S and jsite = NW-N) endif
A comparison of emissions from ethanol and petrol fuelled cars IVL report B1962 Health risk assessment for Vaumlstra Goumltaland
30
if v_mid lt= 0 then ( ksite = NE) else ksite = SW endif NO2(bc) = [(NO2(isite)u_mid(isite) + NO2(jsite)u_mid(jsite))2 + NO2(ksite)v_mid(ksite)] [(u_mid(isite) + u_mid(jsite))2 + v_mid(ksite)]
Figure A1 Gridcells covering Gothenburg domain and its boundary in EMEP model plotted on latitude-
longitude coordinates The red square represents centre of Gothenburg and the blue line the coastline EMEP i and j coordinates for the boundary gridcells are SE-S = 57-60 SE-N = 57-61 NW-S = 55-60 NW-N = 55-61 NE = 56-62 NW = 56-59 and for Gothenburg grid cells are Gbg-NE = 56-61 Gbg-SW = 56-60
A23 Atmospheric chemistry
The role of secondary chemistry in for the concentration of acetaldehyde are studied by first excluding the primary acetaldehyde emissions from the EMEP model simulations of scenarios S1 and S2 and then by excluding all NMVOC emissions from the car category with spark ignition engines The contribution from the primary acetaldehyde emissions as well as the contribution of secondary acetaldehyde formed from other NMVOC to the total acetaldehyde concentration is then obtained However the secondary chemistry is highly nonlinear due to the interactions of NMVOCs with ozone and OH and thus the results for the contribution of secondary acetaldehyde are somewhat uncertain Differences in acetaldehyde concentrations between S1 and S2 scenarios are studied with respect to contribution of primary and secondary acetaldehyde It is observed that in summer background air the monthly mean contribution of the secondary acetaldehyde is of the same magnitude as the contribution of the primary acetaldehyde to the difference between S1 and
565
57
575
58
585
105 115 125 135 145
Long
Lat
Gbg-SW
Gbg-NE
SE-S
NW-N
NW-S
SE-N
SW
NE
55-59
57-59
55-62
A comparison of emissions from ethanol and petrol fuelled cars IVL report B1962 Health risk assessment for Vaumlstra Goumltaland
31
S2 In the winter and in more polluted atmosphere (Gothenburg grid cells) the contribution from secondary acetaldehyde to the concentration difference appears to be negative due to the chemistry feedback ie the E-85 scenario has less secondary acetaldehyde than the all-petrol scenario
A comparison of S2-S1 differences in primary and secondary acetaldehyde concentrations in the background (=upwind) and Gothenburg grid cells show no increase in the secondary acetaldehyde from upwind to the Gothenburg grid cell It can thus be concluded that there is no significant contribution from secondary aldehydes on the small scale (tenths of km) Conclusion from this sensitivity study is that the secondary formaldehyde can be of importance under summer in the clean background air but that formation on the local scale is unimportant Using EMEP simulated boundary concentrations of acetaldehyde in the local scale model and simulating the primary acetaldehyde emissions will capture the most important features of acetaldehyde dispersion and chemistry in Vaumlstra Goumltaland
In the EMEP model the tail-pipe PM emissions are specified as primary particles Emissions of NOX and VOCs (and NH3 SO2) are oxidised in the atmosphere and a part is then transferred through the gas-to-particle transport to the PM as secondary PM The petrol fuelled cars emit both more primary PM and more NOX compared to the E85 cars If we compare differences in primary and secondary PM between the S1 and S2 scenarios simulated by EMEP we can directly see what part of the difference is from the tail-pipe emissions of the primary particles and what part is from the formation of the secondary PM in atmosphere (mostly from higher emissions of NOX) Table A4 shows the differences between S1 and S2 (S1-S2) of monthly PM averages for January and June (two months with low and high photochemical activities respectively) It can be seen that the higher formation of secondary PM in the S1 (all-petrol) scenario is more important than the higher tail-pipe emission of primary PM by factor 10 - 20
When we compare simulated PM differences between S1-S2 for the background air (=upwind) grid cells and for grid cells including Gothenburg (50 km x 50 km scale) we can see significant increase in primary PM in the S1 scenario from the upwind grid cells to Gothenburg (746 in winter 132 in summer) while no systematic increase can be seen for the secondary PM (-42 in winter +24 in summer) From this comparison it can be concluded that no systematic increase in secondary PM can be seen (in difference from the primary PM) on the scale of 50-100 km and we can neglect this process on the small scale However the overall change in PM concentrations due to the switch of the fuel is very small both on the large scale and on the small scale as can be seen when the differences in PM concentrations between S1 and S2 are compared to absolute PM concentrations in S1 presented in the last column of Table A4
Table A4 Differences in primary and secondary PM concentrations between the lsquoAll-petrolrsquo (S1) and lsquoE-85rsquo (S2) scenarios simulated in gridcells upwind Gothenburg and in gridcells including Gothenburg (2 50 km x 50 km gridcells)
S1-S2 Background
S1-S2 Gothenburg
Increase S1-S2 Gothenburg
S1 Background
μgm3 μgm3 μgm3 bkgnd μgm3
Prim PM10 Jan 00008 00014 00006 746 084
Jun 00008 00018 00010 1319 084
Sec PM10 Jan 00155 00148 -00006
-42 157
Jun 00080 00081 00002 24 213
The sensitivity of the used emission factors for NMHC with respect to the ozone formation in the region of the Swedish West Coast can be analysed with the help of results from studying the
A comparison of emissions from ethanol and petrol fuelled cars IVL report B1962 Health risk assessment for Vaumlstra Goumltaland
32
formation of secondary acetaldehyde In this study first all primary acetaldehyde emitted by the E85 fleet are omitted in a model simulation (S2_nopAA) and secondly all NMHC emissions from the E-85 fleet are switched off (S2_noVOC) Acetaldehyde has a somewhat higher though still comparable photochemical ozone creation potential compared to ethanol (ethanol 44-63 acetaldehyde 68-80 Altenstedt and Pleijel 2000) and this simulation will thus also give information on the sensitivity of the calculations to uncertainties in the ethanol emissions Setting the emission factor for NMHC to zero gives the sensitivity to the emission factor of total NMHC Figure A2 shows the differences in ozone concentration as a result of acetaldehyde only and the total NMHC from the E85 car fleet (S2 scenario) We can see that the effect on ozone formation is very small for the Swedish West coast The reason is that the ozone formation in this area is controlled by the availability of NOX while NMHC or rather their degradation products the peroxy radicals that serve as a lsquofuelrsquo to ozone formation are usually in excess here and further VOC emissions do not increase ozone concentrations significantly The situation looks different in areas that are more heavily polluted with NOX andor which is limited in the availability of peroxy radicals The results from this sensitivity study are fully consistent with the observed increase in ozone concentrations as a result of lower NO emissions (the so-called ozone titration) only very close to the major roads but no larger-scale decrease in ozone concentrations in the Gothenburg area or in any other communities
Figure A2 Sensitivity of the ozone formation in the 2 EMEP model grid cells covering Gothenburg (blue) and in the 6 surrounding grid cells (red see Fig A1) to changes in NMHC emission factor of the E85 fuelled cars lsquobasersquo is simulation S2 with EF for NMHC as in Table 3 lsquonoVOCrsquo is S2 with EF for all NMHC = 0 lsquonopAArsquo is S2 with EF for acetaldehyde = 0 a ndash Mean sensitivity in January absolute difference in ozone formation in ppb(V) as a result of NMHC (base-noVOC) and acetaldehyde (base-nopAA) emissions b ndash Sensitivity relative to ozone concentration in the S2-base simulation January c ndash same as a) but June d ndash same as b) but June
‐002
‐001
0
001
base‐noVOC base‐nopAA
ΔO3(ppb)
a)
0
001
002
base‐noVOC base‐nopAA
ΔO
3(ppb)
c)
‐010
‐005
000
005
base‐noVOC base‐nopAA
ΔO
3
b)
000
002
004
006
base‐noVOC base‐nopAA
ΔO
3
d)
A comparison of emissions from ethanol and petrol fuelled cars IVL report B1962 Health risk assessment for Vaumlstra Goumltaland
33
Appendix 3 Emission results
The geographically distributed NOX and acetaldehyde emissions for the Vaumlstra Goumltaland region are presented in Figures A3 and A4 respectively
Figure A3 NOX emissions for the Vaumlstra Goumltaland region for the All Petrol scenario
A comparison of emissions from ethanol and petrol fuelled cars IVL report B1962 Health risk assessment for Vaumlstra Goumltaland
34
Figure A4 Acetaldehyde emissions for the Vaumlstra Goumltaland region for the All Ethanol scenario
A comparison of emissions from ethanol and petrol fuelled cars IVL report B1962 Health risk assessment for Vaumlstra Goumltaland
35
Appendix 4 Dispersion modelling results
The difference in yearly average concentration between scenario S1 and S2 for acetaldehyde and benzene can be seen in Figure A5 and Figure A6 respectively a)
b)
Figure A5 The difference in yearly average concentrations of acetaldehyde for 2020 between the all E85 (S2) and all petrol (S1) scenarios presented as a) microgm3 and as b) percentage for the Gothenburg area
A comparison of emissions from ethanol and petrol fuelled cars IVL report B1962 Health risk assessment for Vaumlstra Goumltaland
36
a)
b) all E85 c) all petrol
Figure A6 a) the difference in yearly average concentrations (gm3) of benzene for 2020 between the all E85 (S2) and all petrol (S1) scenarios yearly means for b) all E85 and c) all petrol (note the different scales)
The difference in the calculated NOX NO2 and ozone concentrations between the two scenarios are shown in Figures A7 A8 and A9
A comparison of emissions from ethanol and petrol fuelled cars IVL report B1962 Health risk assessment for Vaumlstra Goumltaland
37
a)
b)
Figure A7 The difference in yearly average concentrations of NOX for 2020 between the all E85 (S2) and all petrol (S1) scenarios presented as a) microgm3 and as b) percentage for the Gothenburg area
A comparison of emissions from ethanol and petrol fuelled cars IVL report B1962 Health risk assessment for Vaumlstra Goumltaland
38
a)
Figure A8 The difference in yearly average concentrations of NO2 for 2020 between the all E85 (S2) and all petrol (S1) scenarios presented as a) microgm3 and as b) percentage for the Gothenburg area
A comparison of emissions from ethanol and petrol fuelled cars IVL report B1962 Health risk assessment for Vaumlstra Goumltaland
39
a)
b)
Figure A9 The difference in yearly average concentrations of ozone for 2020 between the all E85 (S2) and all petrol (S1) scenarios presented as a) microgm3 and as b) percentage for mainly the Gothenburg area
A comparison of emissions from ethanol and petrol fuelled cars IVL report B1962 Health risk assessment for Vaumlstra Goumltaland
40
Appendix 5 Detailed Exposure data
Detailed exposure data for the difference between the all E85 (S2) and the all petrol (S1) scenarios can be found in Table A5
Table A5 Exposure data for the difference between the all E85 (S2) and the all petrol (S1) scenarios
Acetaldehyde diff E-P (microgm3)
Populated weighted mean
Number of people Percentage of population
0 - 01 627198 582 01 - 02 163394 152 02 - 03 134879 125 03 - 04 88099 82 04 - 05 38686 36 05 - 06 16880 16 06 - 07 7983 07 07 - 08 1248 01 Tot 014 1078367 Benzene diff E-P (microgm3)
Populated weighted mean
Number of people Percentage of population
-03 - -02 26680 25 -02 - -01 205757 191 -01 - -0 845930 784 Tot -0074 1078367 NO2 diff E-P (microgm3) Populated weighted
mean Number of people Percentage of
population -04 - -03 7698 07 -03 - -02 50131 46 -02 - -01 296288 275 -01 - -0 724250 672 Tot -009 1078367 NOX diff E-P (microgm3) Populated weighted
mean Number of people Percentage of
population -06 - -05 7698 -05 - -04 19639 18 -04 - -03 36626 34 -03 - -02 161685 150 -02 - -01 186500 173 -01 - -0 666219 618 Tot -012 1078367 O3 diff E-P (microgm3) Populated weighted
mean Number of people Percentage of
population -02 - -01 779132 723 -01 - -0 266417 247 0 - 01 32818 30 Tot -012 1078367
Exposure data for the total levels in the two scenarios can be found in Table A6
A comparison of emissions from ethanol and petrol fuelled cars IVL report B1962 Health risk assessment for Vaumlstra Goumltaland
41
Table A6 Exposure data for the total levels in the two scenarios
Acetaldehyde tot All ethanol (microgm3)
Populated weighted mean
Number of people Percentage of population
06 - 07 568825 527 07 - 08 171845 159 08 - 09 124551 115 09 - 10 100946 94 10 - 11 59235 55 11 - 12 30559 28 12 - 13 13175 12 13 - 14 7983 07 14 - 15 1248 01 Tot 077 1078367 Acetaldehyde tot All petrol (microgm3)
Populated weighted mean
Number of people Percentage of population
05 - 06 45111 42 06 - 07 1032008 957 07 - 08 1248 01 Tot 065 1078367 Benzene tot All ethanol (microgm3)
Populated weighted mean
Number of people Percentage of population
0 - 01 1055961 98 01 - 02 22406 2 Tot 005 1078367 Benzene tot All petrol (microgm3)
Populated weighted mean
Number of people Percentage of population
0 - 01 729093 676 01 - 02 232961 216 02 - 03 94042 87 03 - 04 21023 19 04 - 05 1248 01 Tot 010 1078367 NOX tot All ethanol (microgm3)
Populated weighted mean
Number of people Percentage of population
0-10 779108 722 10-20 254658 236 20-30 28683 27 30-40 11070 10 40-50 3426 03 50-60 0 00 60-70 0 00 70-80 639 01 80-90 0 00 90-100 0 00 100-110 783 01 Tot 84 1078367 NOX tot All petrol (microgm3)
Populated weighted mean
Number of people Percentage of population
0-10 769557 714 10-20 264209 245 20-30 28683 27 30-40 11070 10 40-50 3426 03 50-60 0 00
A comparison of emissions from ethanol and petrol fuelled cars IVL report B1962 Health risk assessment for Vaumlstra Goumltaland
42
60-70 0 00 70-80 639 01 80-90 0 00 90-100 0 00 100-110 783 01 Tot 85 1078367 O3 tot All ethanol (microgm3)
Populated weighted mean
Number of people Percentage of population
40-45 1422 01 45-50 26487 25 50-55 176636 164 55-60 770370 714 60-65 103452 96 Tot 569 1078367 O3 tot All petrol (microgm3)
Populated weighted mean
Number of people Percentage of population
40-45 1422 01 45-50 20229 19 50-55 181876 169 55-60 763361 708 60-65 111479 103 Tot 570 1078367 PM25 tot All ethanol (microgm3)
Populated weighted mean
Number of people Percentage of population
1-2 0 00 2-3 885325 821 3-4 192259 178 4-5 783 01 Tot 268 1078367 PM25 tot All petrol (microgm3)
Populated weighted mean
Number of people Percentage of population
1-2 0 00 2-3 868773 806 3-4 208811 194 4-5 783 01 Tot 270 1078367
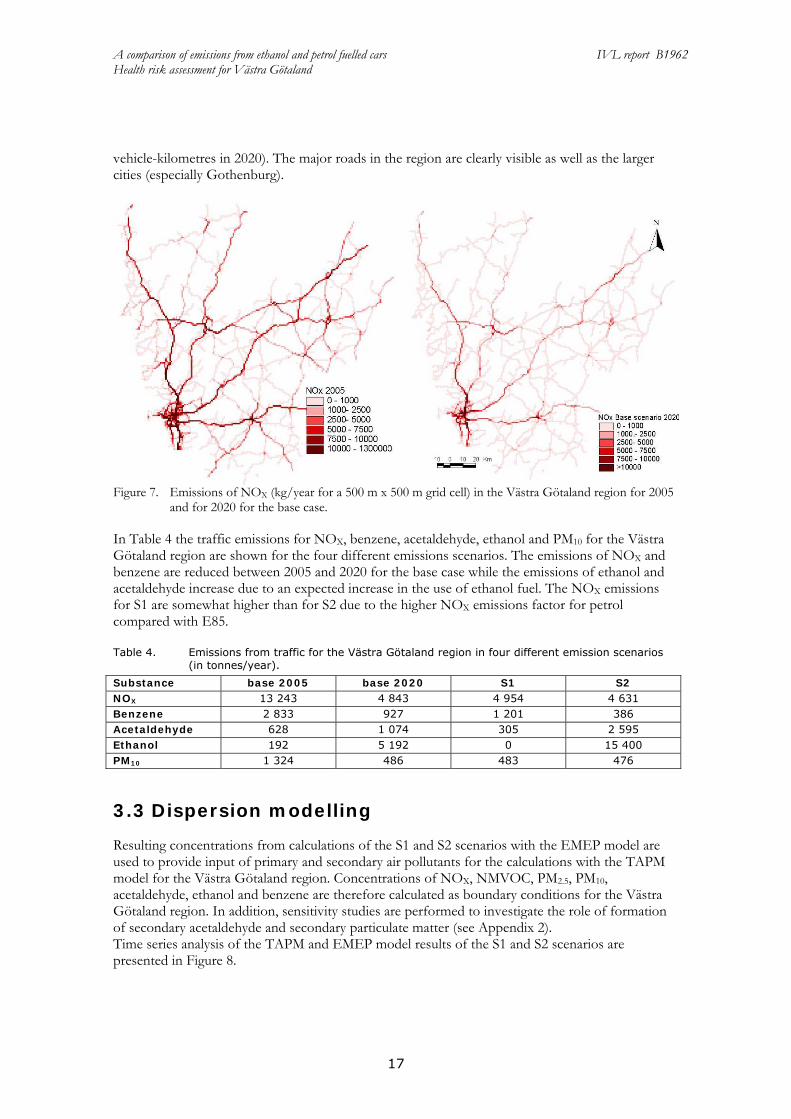
A comparison of emissions from ethanol and petrol fuelled cars IVL report B1962 Health risk assessment for Vaumlstra Goumltaland
19
NMHC emissions from the passenger cars is studied in a sensitivity analysis (see Appendix 23) and it is found to have only a small influence on the ozone levels
To illustrate the results of the different scenario calculations the geographically distributed concentrations are presented as the difference in yearly average concentrations between the all E85 (S2) and all petrol (S1) scenarios both as microgm3 and sometimes as percentage of the difference to scenario S1 (see Appendix 3)
The difference in yearly average concentrations between scenario S1 and S2 for acetaldehyde and benzene can be seen in Figures 9 and 10 respectively The increase in acetaldehyde concentration resulting from a switch from petrol to E85 is up to about 05 gm3 or 80 in the central parts of the largest urban area of the region Gothenburg Outside this area the relative increase is about 10 for the other urban areas and less than that for the rural areas This large relative increase (see map in Appendix 4) is a result of the relatively high emissions of acetaldehyde from E85 fuelled cars For benzene the situation is opposite In the scenarios for 2020 the concentration of benzene decreases by up to a few tenths of gm3 as a result of a switch from petrol to E85 For benzene the relative change is not calculated
Figure 9 The difference in yearly average concentrations of acetaldehyde for 2020 between the all E85 (S2) and all petrol (S1) scenarios (microgm3)
A comparison of emissions from ethanol and petrol fuelled cars IVL report B1962 Health risk assessment for Vaumlstra Goumltaland
20
Figure 10 The difference in yearly average concentrations (gm3) of benzene for 2020 between the all E85 (S2) and all petrol (S1) scenarios
The difference in the calculated NOX NO2 and ozone concentrations between the two scenarios are shown in Appendix 4 The change in NOX concentration between the two scenarios only represents a small fraction of the total NOX concentration This is because the emissions of NOX from petrol cars are relatively low compared with the contribution from diesel engines and other sources Thus the resulting decrease in the NOX concentration with E85 is only up to 3 For ozone there is a small increase of about 01 microgm3 of E85 in the central areas of Gothenburg where there is relatively high traffic intensity (see Appendix 4 Figure A9) In the rest of the region there is a small decrease in the ozone concentration in the E85 scenario
34 Exposure
The resulting concentrations from the dispersion modelling together with the population density distribution are used to assess the exposure to acetaldehyde benzene NO2 NOX and ozone for the two scenarios S1 and S2 The exposure to PM25 is very similar for the two scenarios (the difference in concentration between scenarios S2 and S1 is only about -002 gm3 Table 5 shows the population weighted mean exposure both as total concentrations and as the difference between the two scenarios Detailed exposure results can be found in Appendix 5 It can be seen that the exposure to all the pollutants in Table 5 with the exception of acetaldehyde are somewhat lower for the all E85 scenario (S2) than for the all petrol scenario (S1) However the effect on health also
A comparison of emissions from ethanol and petrol fuelled cars IVL report B1962 Health risk assessment for Vaumlstra Goumltaland
21
depends on the level of the dose-response functions For example if the level of concentration is low in a populated area but the dose-response function is high the effect of even a low concentration increase can become important The increase in exposure from S1 to S2 (S2-S1) calculated as percentage of the population exposed to increased mean concentrations of pollutants is presented in Figure 11
Table 5 Populated weighted mean exposure (gm3)
S1 S2 S2-S1 Acetaldehyde 065 077 014 Benzene 01 005 -007 NOX 85 84 -012 Ozone 570 569 -012 PM25 270 268 -002
Increased concentrations Decreased concentrations Both increased and
decreased conc
Figure 11 The relative exposure (S2-S1) calculated as percentage of the population
In Figure 11 it is clear that the only pollutant that does not show an improvement regarding air quality and thus the health risks when modelling a switch from petrol to E85 is acetaldehyde For all pollutants except for ozone the changes of concentration levels observed between the scenarios are within the urban areas but for ozone there are also differences in rural areas
According to the data in Figure 11 about 14 of the population in the Vaumlstra Goumltaland region will be exposed to 03-08 microgm3 higher concentration levels of acetaldehyde in scenario S2 relative to S1 From Figure 9 it can be seen that the majority of these people live within the Gothenburg area Further about 28 of the population will be exposed to increased levels of between 01 to 03 microgm3 mainly in the suburban areas and rural surroundings of Gothenburg but also in some of the smaller cities in the region Outside the urban areas the concentration difference is lower than 01 microgm3
In the S2 scenario relative to the S1 scenario the population is exposed to decreased concentration levels of benzene and NOX This is mainly true also for O3 but with an exception for the central
A comparison of emissions from ethanol and petrol fuelled cars IVL report B1962 Health risk assessment for Vaumlstra Goumltaland
22
parts of Gothenburg where the concentration actually increases (see Appendix 4 Figure 7A) resulting in that 3 (blue area in Figure 11 for O3) of the population will be exposed to higher concentrations of O3 For the rest of the area there are decreased concentrations of ozone upon a switch to E85
The largest differences are again in the central parts of Gothenburg where about 20 of the population is being exposed to a lower benzene concentration of 01-03 microgm3 This also means that concerning benzene the majority (78) of the population have none or very low influence from a change to ethanol fuel
The largest effect on exposure difference is seen for NOX where just over 20 of the population has its exposure decreased with 03-05 microgm3 (in the central parts of Gothenburg) In the suburbs the decrease is between 01-02 microgm3 lower Along the largest roads there is a small but visible improvement on a yearly basis of 01 microgm3
For PM25 there is a difference in the populated weighted mean exposure of 002 gm3 between the scenarios with a lower value for the all-E85 case (see also Appendix 5)
35 Impact on health in Vaumlstra Goumltaland
351 NO2 and NOX
The impact of long-term exposure on mortality was estimated using the relative risk from the Norwegian cohort study (Nafstad et al 2004) reporting a relative risk of 08 increase per microgm3 increase in NOX however without adjustment for particle concentrations Assuming this effect on the total mortality and a typical baseline mortality of 1000 deaths per 100 000 person years a decrease in the population mean exposure of 012 microgm3 would correspond to approximately 104 less preterm deaths per year However for the present case this number is highly uncertain since the exposure to substances normally associated with changes in NOX exposure may here change in different ways since the relation between different exhaust components varies between the scenarios
The impact of long-term exposure on asthma incidence (new cases) in adults has been estimated using results from the Swedish RHINE Study Cohorts (Modig et al 2009) with very similar results in the ECRHS Study corresponding to approx 4 increase per microgm3 increase in NO2 From the RHINE Study the incidence can be estimated to 03 per year (proportion of adults developing the disease) with children and elderly excluded this means around 1500 adult cases per year A reduction of 009 microgm3 corresponds to 54 avoided new cases of adult asthma per year However also NO2 in the asthma study may have been mainly an indicator of vehicle exhaust
352 Ozone
The impact of long-term exposure on respiratory mortality has been reported to be approx 02 per microgm3 increase in the summer concentration when studied in the large ACS Cohort (Jerret et al 2009) Assuming this effect on the total population and a typical baseline respiratory mortality of 100 deaths per 100 000 person years a decrease in the population mean exposure of 012 microgm3 corresponds to approximately 03 less preterm deaths per year
A comparison of emissions from ethanol and petrol fuelled cars IVL report B1962 Health risk assessment for Vaumlstra Goumltaland
23
353 Acetaldehyde
According to US EPA (1999) a lifetime risk for cancer of 0000002 per microgm3 is to be assumed for this potential human carcinogen An increase in the population mean exposure of 012 microgm3 corresponds to 026 cases more per year in the current population
354 Benzene
According to US EPA (1999) a lifetime risk for cancer (leukaemia) of 00000022-00000078 per microgm3 is to be assumed for this human carcinogen A decrease in the population mean exposure of 0074 microgm3 corresponds to approximately 03 cases less per year in the current population (assuming 0000004 per microgm3)
355 PM25
In CAFEacute and other impact assessments a relative risk of 6 increase in all-cause mortality per 10 microgm3 has usually been assumed Assuming this effect on the total mortality and a typical baseline mortality of 1000 deaths per 100 000 person years a decrease in the population mean exposure of 002 microgm3 corresponds to approximately 13 less preterm deaths per year
4 Discussion
In this study the health risks from a large introduction of E85 to replace petrol is analysed in scenario studies for 2020 for the Vaumlstra Goumltaland region It is found that the change in pollutant concentration exposure and health risks are small between the two scenarios It should be emphasized that the study only considers vehicle emissions and does not take into account effects from the fuel production
The emissions of NOX in the model are somewhat lower from E85 fuelled cars than from petrol fuelled cars This is in line with the emission factors used by Jacobson (2007) The nitrogen oxides are key substances in the atmospheric reactions determining the concentrations of ozone in air NOX is involved in the formation of ozone but close to the NO source the ozone concentration is lowered due to the rapid reactions between NO and O3 forming NO2 If NO is released in an environment with already high NO concentration it may result in lowering of ozone levels on the regional scale In the present study the ozone concentrations calculated are somewhat lower for the E85 scenario than for the petrol scenario
The health risk analysis shows that the main difference between the scenarios is due to the lower concentration of NOX However it may have been other exhaust components than NOX such as exhaust particles that were behind the reported association with mortality In cases when NOX is not a good indicator of exhaust particle emissions and their toxicity our results may be misleading This should be studied further Neglecting the effects of the changes in NOX exposure the total difference between the scenarios sums up to 16 preterm deaths per year with lower values for the E85 scenario while it would sum up to 12 less preterm deaths for the E85 scenario if the effect related to NOX were included Since there are no similar studier for the effect on mortality among those younger than 30-50 years of age we assume the same relative effect on mortality in all ages This makes only a small difference since the large majority of deaths occur in older groups
A comparison of emissions from ethanol and petrol fuelled cars IVL report B1962 Health risk assessment for Vaumlstra Goumltaland
24
The opposite result for the ozone concentration was obtained by Jacobson The reason for this discrepancy is that the Jacobson study concerns Los Angeles a region with high concentrations of pollutants while the study here concerns the Vaumlstra Goumltaland region with much less dense traffic and also lower concentrations of pollutants importantly NOX It is not unlikely that the effect that Jacobson report also would be found for large parts of Europe with higher traffic densities than in the Vaumlstra Goumltaland region
It is worth to emphasize that the major negative health effect in the Jacobson (2007) study is attributed to the increase in ozone concentration that is a result of the decrease of the NO emissions from E85 cars Directly after the emission NO reacts with ozone resulting in drop of the ozone concentration the so-called ozone titration commonly observed in many cities This NO does however form even higher quantities of ozone further downwind contributing to the general increase in the background ozone levels It is also precursor of NO2 secondary PM and other toxic species as eg PAN and hence reductions in NO emissions are never regarded as disbeneficial from the environmental viewpoint
There are of course several sources of uncertainties that influence the results of this study Since the main results concern differences between the two scenarios several of these factors loose on importance for the conclusions This comprises uncertainties in meteorology in future traffic volumes and in the population density distribution However there are some uncertainties that remain important The emission factors for E85 fuelled cars are much less characterised than what they are for petrol cars The emission of particles from E85 fuelled cars is especially uncertain with only very few published results Also the emissions of NMHC are somewhat uncertain and may be higher for E85 at lower ambient temperatures However the sensitivity analysis performed shows that for the studied region the NMHC emissions only have a small influence on the ozone concentrations
5 Conclusions
In this study the impact of tailpipe and evaporative emissions from E85 fuelled cars on air pollution and health risks are calculated and compared with petrol fuelled cars The scenario calculations for the Vaumlstra Goumltaland Region give data on emissions pollutant concentrations exposure and a health risk evaluation
The differences in emission factors between E85 and petrol lies in the emissions of PM and NOX which are about 65 and 58 for E85 relative petrol respectively Also the speciation of the emitted hydrocarbons is significantly different with large emissions of acetaldehyde and ethanol from E85 and large emissions of benzene higher aromatics alkanes and alkenes from petrol
These differences in emission factors reflect in differences in emissions The emission calculations for all Swedish road traffic show a decrease for the E85 scenario relative to the petrol scenario of 65 for NOX 34 for PM25 67 for benzene For acetaldehyde there is an increase of 770
The differences obtained from the TAPM modelling show decreased levels of NOX ozone and benzene with E85 and increased levels of acetaldehyde For the latter the increase may be up to 80 while NOX and ozone show decreases of up to a few per cent and a few tenths of per cent respectively
A comparison of emissions from ethanol and petrol fuelled cars IVL report B1962 Health risk assessment for Vaumlstra Goumltaland
25
The health risk assessment shows decreased health risks in the E85 scenario relative the all-petrol scenario due to the increased NOX exposure correlated with both preterm deaths and asthma However NOX may be mainly an exhaust indicator Smaller effects are expected from the changes in ozone acetaldehyde and benzene exposure The overall difference considering the exposure to PM acetaldehyde benzene and ozone is 16 preterm deaths with lower values for the E85 scenario
6 Acknowledgements
Saab Automobile The Swedish Transport Administration and The Foundation for the Swedish Environmental Research Institute are gratefully acknowledged for financial contribution
Magnus Ekstroumlm and Maria Holmstroumlm at Saab and Martin Juneholm at the Swedish Transport Administration are acknowledged for their most valuable input to the study
David Simpson Norwegian Meteorological Institute EMEP MSC-W Norway and Dept Radio amp Space Science Chalmers Univ Technol Sweden is gratefully acknowledged for help with implementation of the Unified EMEP model
A comparison of emissions from ethanol and petrol fuelled cars IVL report B1962 Health risk assessment for Vaumlstra Goumltaland
26
7 References
Altenstedt J Pleijel K 2000 An alternative approach to photochemical ozone creation potentials under European conditions J Air amp Waste Manage Assoc 50 1023 ndash 1036
Andre J-M (2005) Vehicle emission measurement collection of the ARTEMIS datatbase Artemis 3312 report Available from httpwwwinretsfrurltepublicationspublications-pdfJoumardA3312reportJMALTE0504pdf
Bachand A MMundt K A Mundt D JMontgomery R R Epidemiological studies of formaldehyde exposure and risk of leukemia and nasopharyngeal cancer A meta-analysis Critical Reviews in Toxicology 2010 40(2) 85ndash100
Beane Freeman L E Blair A Lubin J H Stewart P A Hayes R B Hoover R N Hauptmann M Mortality from lymphohematopoietic malignancies among workers in formaldehyde industries The National Cancer Institute Cohort J Natl Cancer Inst 2009101751ndash761
Bosetti C McLaughlin J K Tarone R E Pira E LaVecchia C Formaldehyde and cancer risk A quantitative review of cohort studies through 2006 Ann Oncol 20081929ndash43
ConcaweJRC Well-to-wheel studies httpiesjrceceuropaeuwtwhtml
Derwent R G Jenkin M E Saunders S M 1996 Photchemical ozone creation potentials for a large number of reactive hydrocarbons under European conditions Atmos Environ 30 181 ndash 199
Derwent RG Jenkin ME Passant NR Pilling MJ 2007 Photochemical ozone creation potentials (POCPs) for different emission sources of organic compounds under European conditions estimated with a Master Chemical Mechanism Atmos Env 41 2570ndash2579
EEA Copenhagen 2009 wwweeaeuropaeudata-and-mapsdatapopulation-density-disaggregated-with-corine-land-cover-2000-2
Ericsson P Holmstroumlm M Amberntsson-Carlsson A Ohlson C Skoglundh M Andersson B Carlsson P-A 2008 Characterization of particulate emissions and methodologhy for oxidation of particulates from non-diesel combustion ystems SAE Technical Paper Series 2008-01-1746
GAINS 2010 httpgainsiiasaacatindexphpgains-europe
Graham LA Belisle SL Baas C-L Emissions from light duty gasoline vehicles operating on low blend ethanol gasoline and E85 Atmospheric Environment 42 4498 (2008)
Haskew H M Thomas P E Liberty F 2006 Fuel Permeation From Automotive Systems E0 E6 E10 E20 And E85 Final Report CRC Project No E-65-3 Coordinating Research Council Inc 3650 Mansell RoadSuite 140Alpharetta GA 30022
HEI Air Toxics Review Panel (2007) Mobile-Source Air Toxics A Critical Review of the Literature on Exposure and Health Effects HEI Special Report 16 Health Effects Institute Boston USA
Hurley P TAPM v 4 User Manual 2008 CSIRO ISBN 978-1-921424-73-1
IARC (2006) IARC Monographs on the Evaluation of Carcinogenic Risks to Humans Wood Dusts and Formaldehyde Lyon World Health Organization International Agency for Research on Cancer Lyon France 8837ndash325
Jacobson M Z Effects of Ethanol (E85) versus Gasoline Vehicles on Cancer and Mortality in the United States Environ Sci Technol 2007414150-4157
A comparison of emissions from ethanol and petrol fuelled cars IVL report B1962 Health risk assessment for Vaumlstra Goumltaland
27
Jerret M Burnett R T Pope C A Ito K Thurston G Krewski D Shi Y Calle E Thun M Long-Term Ozone Exposure and Mortality N Engl J Med 20093601085-95
Lipman T E Delucchi M A 2002 Emissions of nitrous oxide and methane from conventional and alternative fuel motor vehicles Climate Change 53 477
Modig L Toreacuten K Janson C Jarvholm B Forsberg B Vehicle exhaust outside the home and onset of asthma among adults Eur Respir J 2009 Jun33(6)1261-7
Nafstad P Haheim L L Wisloff T Gram F Oftedal B Holme I Hjermann I Leren P Urban air pollution and mortality in a cohort of Norwegian men Environ Health Perspect 2004112(5)610-5
OEHHA (1999) Air Toxics Hot Spots Program Risk Assessment Guidelines Part II Technical Support Document for Describing Available Cancer Potency Factors Prepared by the Air Toxicology and Epidemiology Section Office of Environmental Health Hazard Assessment April 1999
Passant NR (2002) Speciation of UK emissions of non-methane volatile organic compounds AEAT report AEATENVR0545 Issue 1 Culham UK
Pope CA III Thun MJ Namboodiri MM Dockery DW Evans JS Speizer FE Heath CJ Particulate air pollution as a predictor of mortality in a prospective study of US adults Am J Resp Crit Care Med 1995 151 669-674
Seinfeld J H and Pandis SN (1998) Atmospheric Chemistry and Physics From Air Pollution to Climate Change John Wiley amp Sons New YorkSimpson D Fagerli H Jonson JE Tsyro S Wind P Tuovinen J -P 2003 Transboundary acidification and eutrophication and ground level ozone in Europe Unified EMEP Model Description EMEP Status Report 12003 Part I EMEPMSC-W Report The Norwegian Meteorological Institute Oslo Norway
US EPA (1999) httpwwwepagovttnatwnata1999nsata1999
Vestreng V et al 2004 Inventory Review 2004 Emission data reported to CLRTAP and the NEC Directive EMEPEEA Joint Review Report EMEPMSC-W Note 1
Westerholm R Ahlvik P Karlsson HL An exhaust characterisation study based on regulated and unregulated emissions from bi-fuel and flexi-fuel light-duty passanger cars fuelled by petrol (E5) bioethanol (E70 E75) and biogas tested at ambient temperatures of +22degC and -7degC 2008
Wolkoff P Nielsen G D Non-cancer effects of formaldehyde and relevance for setting an indoor air guideline Environment International 201036788ndash799
Yanowitz J McCormick RL Effect of E85 on tailpipe emissions from light-duty vehicles J Air amp Waste Manage Assoc 59 172 (2009)
A comparison of emissions from ethanol and petrol fuelled cars IVL report B1962 Health risk assessment for Vaumlstra Goumltaland
28
Appendix 1 Evaporate emissions of NMHC
The following assumptions are done for evaporative emissions The NMHC emissions from E85 are reduced relative to petrol by 45 Methane emissions are zero and the split of NMHC species is 68 ethanol and the remaining 32 is divided in the same way as evaporative emissions for petrol The estimates by Graham et al (2008) are missing evaporative emission data however these assumptions agrees very well with measurements of evaporative emissions due to fuel permeation reported by Haskew et al (2006) where NMHC emissions are reported to be reduced by 50 for E85 fuel compared to petrol Haskew et al also presents the NMHC split to species with 60 ethanol This number agrees quite well with our assumption of 68 NMHC being ethanol NMHC in exhaust and evaporative emissions are thus divided as in Table A1
Table A1 Division of NMHC in the exhaust and evaporative emissions for E85 and petrol respectively (wt)
E85 Petrol E85 Petrol exhaust exhaust evaporative evaporative
Ethanol 680 0 680 0 Acetaldehyde 131 08 02 0 Ethene 99 73 24 0 Ethyne 03 28 09 0 Formaldehyde 31 17 06 0 Benzene 16 56 18 10 13 Butadiene 03 09 03 0 sum 963 191 741 10
The remaining NMHC emissions are divided as for petrol (ref) and listed in Table A2
Table A2 Division of NMHC in the exhaust and evaporative emissions for E85 and petrol respectively (wt)
E85 Petrol E85 Petrol exhaust exhaust evaporative evaporative
Ethane 02 32 10 0 Alkanes (C3+) 13 278 89 880 Alkenes (C3+) 04 90 29 95 Aromatics (C7+) 18 388 125 15 Aldehydesketones (C3+)
01 15 05 0
A comparison of emissions from ethanol and petrol fuelled cars IVL report B1962 Health risk assessment for Vaumlstra Goumltaland
29
Appendix 2 Description of the model system
A21 Atmospheric lifetimes
Table A3 gives tropospheric lifetimes with regard to reaction of ethanol formaldehyde acetaldehyde and benzene (C6H6) with OH nitrate radical (NO3) and photolysis The studied organic species are listed together with three species common in the gasoline exhaust (benzene ethene and toluene) for comparison Table 11 shows also photochemical ozone creation potential (POCP) of these species POCP is a measure of amount of ozone that is formed from a certain VOC emission relatively to other emission source which has been established to the same emission mass of ethene (Derwent et al 1996 Altenstedt et al 2000) The range represents different scenarios for VOC and NOX background concentrations Derwent et al (2007) used similar methodology to calculate POCP of different VOC sources and calculated POCP of mean road emission exhaust to be 69
Table A3 Atmospheric lifetimes of studies NMVOC species with respect to the OH- and NO3- initiated
degradation τ(OH) and τ(NO3) and with respect to the photolysis (The lifetime of a chemical species which decays in a first-order process is the time needed for a concentration of this species to decrease to 1e of its original value Statistically it represents the mean life expectancy of an excited species) The OH concentration of 1times106 moleculescm3 typical for summer troposphere was used for the lifetime calculation The NO3 concentrations of 5 and 100 ppt(V) were used for lifetime calculations as representative of rural and urban night-time 12 hrs mean concentration The studied organic species are listed together with 3 species common in the gasoline exhaust for comparison The rates of photolysis were calculated with radiation transfer model for July 58ordm latitude and integrated over 24 hours
τ(OH) τ(NO3) urbanrural τ (photolysis) POCP
hr hr hr
Ethanol 85 56 1times103 - 44 - 63
Acetaldehyde 15 47 1times103 86 68 - 80
Formaldehyde 30 194 4times103 10 18 - 55
Benzene 214 - - 23 - 47
Ethene 34 - - 100
Toluene 50 - - 30 - 67
A22 Defining of boundary concentrations for TAPM from EMEP fields
Calculation of initial concentration field for TAPM from EMEP concentration field of NO2 (as example) and EMEP mean wind vector components u_mid and v_mid Two EMEP model gridcells (i=56 j=60 and i=56 j=61) represent the TAPM model domain and concentrations from the surrounding EMEP gridcells SE-S SE-N NW-S NW-N NE NW (Figure A1) are used for calculation of boundary concentration NO2(bc) according to the following code if u_mid lt= 0 then ( isite = SE-S and jsite = SE-N) else isite = NW-S and jsite = NW-N) endif
A comparison of emissions from ethanol and petrol fuelled cars IVL report B1962 Health risk assessment for Vaumlstra Goumltaland
30
if v_mid lt= 0 then ( ksite = NE) else ksite = SW endif NO2(bc) = [(NO2(isite)u_mid(isite) + NO2(jsite)u_mid(jsite))2 + NO2(ksite)v_mid(ksite)] [(u_mid(isite) + u_mid(jsite))2 + v_mid(ksite)]
Figure A1 Gridcells covering Gothenburg domain and its boundary in EMEP model plotted on latitude-
longitude coordinates The red square represents centre of Gothenburg and the blue line the coastline EMEP i and j coordinates for the boundary gridcells are SE-S = 57-60 SE-N = 57-61 NW-S = 55-60 NW-N = 55-61 NE = 56-62 NW = 56-59 and for Gothenburg grid cells are Gbg-NE = 56-61 Gbg-SW = 56-60
A23 Atmospheric chemistry
The role of secondary chemistry in for the concentration of acetaldehyde are studied by first excluding the primary acetaldehyde emissions from the EMEP model simulations of scenarios S1 and S2 and then by excluding all NMVOC emissions from the car category with spark ignition engines The contribution from the primary acetaldehyde emissions as well as the contribution of secondary acetaldehyde formed from other NMVOC to the total acetaldehyde concentration is then obtained However the secondary chemistry is highly nonlinear due to the interactions of NMVOCs with ozone and OH and thus the results for the contribution of secondary acetaldehyde are somewhat uncertain Differences in acetaldehyde concentrations between S1 and S2 scenarios are studied with respect to contribution of primary and secondary acetaldehyde It is observed that in summer background air the monthly mean contribution of the secondary acetaldehyde is of the same magnitude as the contribution of the primary acetaldehyde to the difference between S1 and
565
57
575
58
585
105 115 125 135 145
Long
Lat
Gbg-SW
Gbg-NE
SE-S
NW-N
NW-S
SE-N
SW
NE
55-59
57-59
55-62
A comparison of emissions from ethanol and petrol fuelled cars IVL report B1962 Health risk assessment for Vaumlstra Goumltaland
31
S2 In the winter and in more polluted atmosphere (Gothenburg grid cells) the contribution from secondary acetaldehyde to the concentration difference appears to be negative due to the chemistry feedback ie the E-85 scenario has less secondary acetaldehyde than the all-petrol scenario
A comparison of S2-S1 differences in primary and secondary acetaldehyde concentrations in the background (=upwind) and Gothenburg grid cells show no increase in the secondary acetaldehyde from upwind to the Gothenburg grid cell It can thus be concluded that there is no significant contribution from secondary aldehydes on the small scale (tenths of km) Conclusion from this sensitivity study is that the secondary formaldehyde can be of importance under summer in the clean background air but that formation on the local scale is unimportant Using EMEP simulated boundary concentrations of acetaldehyde in the local scale model and simulating the primary acetaldehyde emissions will capture the most important features of acetaldehyde dispersion and chemistry in Vaumlstra Goumltaland
In the EMEP model the tail-pipe PM emissions are specified as primary particles Emissions of NOX and VOCs (and NH3 SO2) are oxidised in the atmosphere and a part is then transferred through the gas-to-particle transport to the PM as secondary PM The petrol fuelled cars emit both more primary PM and more NOX compared to the E85 cars If we compare differences in primary and secondary PM between the S1 and S2 scenarios simulated by EMEP we can directly see what part of the difference is from the tail-pipe emissions of the primary particles and what part is from the formation of the secondary PM in atmosphere (mostly from higher emissions of NOX) Table A4 shows the differences between S1 and S2 (S1-S2) of monthly PM averages for January and June (two months with low and high photochemical activities respectively) It can be seen that the higher formation of secondary PM in the S1 (all-petrol) scenario is more important than the higher tail-pipe emission of primary PM by factor 10 - 20
When we compare simulated PM differences between S1-S2 for the background air (=upwind) grid cells and for grid cells including Gothenburg (50 km x 50 km scale) we can see significant increase in primary PM in the S1 scenario from the upwind grid cells to Gothenburg (746 in winter 132 in summer) while no systematic increase can be seen for the secondary PM (-42 in winter +24 in summer) From this comparison it can be concluded that no systematic increase in secondary PM can be seen (in difference from the primary PM) on the scale of 50-100 km and we can neglect this process on the small scale However the overall change in PM concentrations due to the switch of the fuel is very small both on the large scale and on the small scale as can be seen when the differences in PM concentrations between S1 and S2 are compared to absolute PM concentrations in S1 presented in the last column of Table A4
Table A4 Differences in primary and secondary PM concentrations between the lsquoAll-petrolrsquo (S1) and lsquoE-85rsquo (S2) scenarios simulated in gridcells upwind Gothenburg and in gridcells including Gothenburg (2 50 km x 50 km gridcells)
S1-S2 Background
S1-S2 Gothenburg
Increase S1-S2 Gothenburg
S1 Background
μgm3 μgm3 μgm3 bkgnd μgm3
Prim PM10 Jan 00008 00014 00006 746 084
Jun 00008 00018 00010 1319 084
Sec PM10 Jan 00155 00148 -00006
-42 157
Jun 00080 00081 00002 24 213
The sensitivity of the used emission factors for NMHC with respect to the ozone formation in the region of the Swedish West Coast can be analysed with the help of results from studying the
A comparison of emissions from ethanol and petrol fuelled cars IVL report B1962 Health risk assessment for Vaumlstra Goumltaland
32
formation of secondary acetaldehyde In this study first all primary acetaldehyde emitted by the E85 fleet are omitted in a model simulation (S2_nopAA) and secondly all NMHC emissions from the E-85 fleet are switched off (S2_noVOC) Acetaldehyde has a somewhat higher though still comparable photochemical ozone creation potential compared to ethanol (ethanol 44-63 acetaldehyde 68-80 Altenstedt and Pleijel 2000) and this simulation will thus also give information on the sensitivity of the calculations to uncertainties in the ethanol emissions Setting the emission factor for NMHC to zero gives the sensitivity to the emission factor of total NMHC Figure A2 shows the differences in ozone concentration as a result of acetaldehyde only and the total NMHC from the E85 car fleet (S2 scenario) We can see that the effect on ozone formation is very small for the Swedish West coast The reason is that the ozone formation in this area is controlled by the availability of NOX while NMHC or rather their degradation products the peroxy radicals that serve as a lsquofuelrsquo to ozone formation are usually in excess here and further VOC emissions do not increase ozone concentrations significantly The situation looks different in areas that are more heavily polluted with NOX andor which is limited in the availability of peroxy radicals The results from this sensitivity study are fully consistent with the observed increase in ozone concentrations as a result of lower NO emissions (the so-called ozone titration) only very close to the major roads but no larger-scale decrease in ozone concentrations in the Gothenburg area or in any other communities
Figure A2 Sensitivity of the ozone formation in the 2 EMEP model grid cells covering Gothenburg (blue) and in the 6 surrounding grid cells (red see Fig A1) to changes in NMHC emission factor of the E85 fuelled cars lsquobasersquo is simulation S2 with EF for NMHC as in Table 3 lsquonoVOCrsquo is S2 with EF for all NMHC = 0 lsquonopAArsquo is S2 with EF for acetaldehyde = 0 a ndash Mean sensitivity in January absolute difference in ozone formation in ppb(V) as a result of NMHC (base-noVOC) and acetaldehyde (base-nopAA) emissions b ndash Sensitivity relative to ozone concentration in the S2-base simulation January c ndash same as a) but June d ndash same as b) but June
‐002
‐001
0
001
base‐noVOC base‐nopAA
ΔO3(ppb)
a)
0
001
002
base‐noVOC base‐nopAA
ΔO
3(ppb)
c)
‐010
‐005
000
005
base‐noVOC base‐nopAA
ΔO
3
b)
000
002
004
006
base‐noVOC base‐nopAA
ΔO
3
d)
A comparison of emissions from ethanol and petrol fuelled cars IVL report B1962 Health risk assessment for Vaumlstra Goumltaland
33
Appendix 3 Emission results
The geographically distributed NOX and acetaldehyde emissions for the Vaumlstra Goumltaland region are presented in Figures A3 and A4 respectively
Figure A3 NOX emissions for the Vaumlstra Goumltaland region for the All Petrol scenario
A comparison of emissions from ethanol and petrol fuelled cars IVL report B1962 Health risk assessment for Vaumlstra Goumltaland
34
Figure A4 Acetaldehyde emissions for the Vaumlstra Goumltaland region for the All Ethanol scenario
A comparison of emissions from ethanol and petrol fuelled cars IVL report B1962 Health risk assessment for Vaumlstra Goumltaland
35
Appendix 4 Dispersion modelling results
The difference in yearly average concentration between scenario S1 and S2 for acetaldehyde and benzene can be seen in Figure A5 and Figure A6 respectively a)
b)
Figure A5 The difference in yearly average concentrations of acetaldehyde for 2020 between the all E85 (S2) and all petrol (S1) scenarios presented as a) microgm3 and as b) percentage for the Gothenburg area
A comparison of emissions from ethanol and petrol fuelled cars IVL report B1962 Health risk assessment for Vaumlstra Goumltaland
36
a)
b) all E85 c) all petrol
Figure A6 a) the difference in yearly average concentrations (gm3) of benzene for 2020 between the all E85 (S2) and all petrol (S1) scenarios yearly means for b) all E85 and c) all petrol (note the different scales)
The difference in the calculated NOX NO2 and ozone concentrations between the two scenarios are shown in Figures A7 A8 and A9
A comparison of emissions from ethanol and petrol fuelled cars IVL report B1962 Health risk assessment for Vaumlstra Goumltaland
37
a)
b)
Figure A7 The difference in yearly average concentrations of NOX for 2020 between the all E85 (S2) and all petrol (S1) scenarios presented as a) microgm3 and as b) percentage for the Gothenburg area
A comparison of emissions from ethanol and petrol fuelled cars IVL report B1962 Health risk assessment for Vaumlstra Goumltaland
38
a)
Figure A8 The difference in yearly average concentrations of NO2 for 2020 between the all E85 (S2) and all petrol (S1) scenarios presented as a) microgm3 and as b) percentage for the Gothenburg area
A comparison of emissions from ethanol and petrol fuelled cars IVL report B1962 Health risk assessment for Vaumlstra Goumltaland
39
a)
b)
Figure A9 The difference in yearly average concentrations of ozone for 2020 between the all E85 (S2) and all petrol (S1) scenarios presented as a) microgm3 and as b) percentage for mainly the Gothenburg area
A comparison of emissions from ethanol and petrol fuelled cars IVL report B1962 Health risk assessment for Vaumlstra Goumltaland
40
Appendix 5 Detailed Exposure data
Detailed exposure data for the difference between the all E85 (S2) and the all petrol (S1) scenarios can be found in Table A5
Table A5 Exposure data for the difference between the all E85 (S2) and the all petrol (S1) scenarios
Acetaldehyde diff E-P (microgm3)
Populated weighted mean
Number of people Percentage of population
0 - 01 627198 582 01 - 02 163394 152 02 - 03 134879 125 03 - 04 88099 82 04 - 05 38686 36 05 - 06 16880 16 06 - 07 7983 07 07 - 08 1248 01 Tot 014 1078367 Benzene diff E-P (microgm3)
Populated weighted mean
Number of people Percentage of population
-03 - -02 26680 25 -02 - -01 205757 191 -01 - -0 845930 784 Tot -0074 1078367 NO2 diff E-P (microgm3) Populated weighted
mean Number of people Percentage of
population -04 - -03 7698 07 -03 - -02 50131 46 -02 - -01 296288 275 -01 - -0 724250 672 Tot -009 1078367 NOX diff E-P (microgm3) Populated weighted
mean Number of people Percentage of
population -06 - -05 7698 -05 - -04 19639 18 -04 - -03 36626 34 -03 - -02 161685 150 -02 - -01 186500 173 -01 - -0 666219 618 Tot -012 1078367 O3 diff E-P (microgm3) Populated weighted
mean Number of people Percentage of
population -02 - -01 779132 723 -01 - -0 266417 247 0 - 01 32818 30 Tot -012 1078367
Exposure data for the total levels in the two scenarios can be found in Table A6
A comparison of emissions from ethanol and petrol fuelled cars IVL report B1962 Health risk assessment for Vaumlstra Goumltaland
41
Table A6 Exposure data for the total levels in the two scenarios
Acetaldehyde tot All ethanol (microgm3)
Populated weighted mean
Number of people Percentage of population
06 - 07 568825 527 07 - 08 171845 159 08 - 09 124551 115 09 - 10 100946 94 10 - 11 59235 55 11 - 12 30559 28 12 - 13 13175 12 13 - 14 7983 07 14 - 15 1248 01 Tot 077 1078367 Acetaldehyde tot All petrol (microgm3)
Populated weighted mean
Number of people Percentage of population
05 - 06 45111 42 06 - 07 1032008 957 07 - 08 1248 01 Tot 065 1078367 Benzene tot All ethanol (microgm3)
Populated weighted mean
Number of people Percentage of population
0 - 01 1055961 98 01 - 02 22406 2 Tot 005 1078367 Benzene tot All petrol (microgm3)
Populated weighted mean
Number of people Percentage of population
0 - 01 729093 676 01 - 02 232961 216 02 - 03 94042 87 03 - 04 21023 19 04 - 05 1248 01 Tot 010 1078367 NOX tot All ethanol (microgm3)
Populated weighted mean
Number of people Percentage of population
0-10 779108 722 10-20 254658 236 20-30 28683 27 30-40 11070 10 40-50 3426 03 50-60 0 00 60-70 0 00 70-80 639 01 80-90 0 00 90-100 0 00 100-110 783 01 Tot 84 1078367 NOX tot All petrol (microgm3)
Populated weighted mean
Number of people Percentage of population
0-10 769557 714 10-20 264209 245 20-30 28683 27 30-40 11070 10 40-50 3426 03 50-60 0 00
A comparison of emissions from ethanol and petrol fuelled cars IVL report B1962 Health risk assessment for Vaumlstra Goumltaland
42
60-70 0 00 70-80 639 01 80-90 0 00 90-100 0 00 100-110 783 01 Tot 85 1078367 O3 tot All ethanol (microgm3)
Populated weighted mean
Number of people Percentage of population
40-45 1422 01 45-50 26487 25 50-55 176636 164 55-60 770370 714 60-65 103452 96 Tot 569 1078367 O3 tot All petrol (microgm3)
Populated weighted mean
Number of people Percentage of population
40-45 1422 01 45-50 20229 19 50-55 181876 169 55-60 763361 708 60-65 111479 103 Tot 570 1078367 PM25 tot All ethanol (microgm3)
Populated weighted mean
Number of people Percentage of population
1-2 0 00 2-3 885325 821 3-4 192259 178 4-5 783 01 Tot 268 1078367 PM25 tot All petrol (microgm3)
Populated weighted mean
Number of people Percentage of population
1-2 0 00 2-3 868773 806 3-4 208811 194 4-5 783 01 Tot 270 1078367
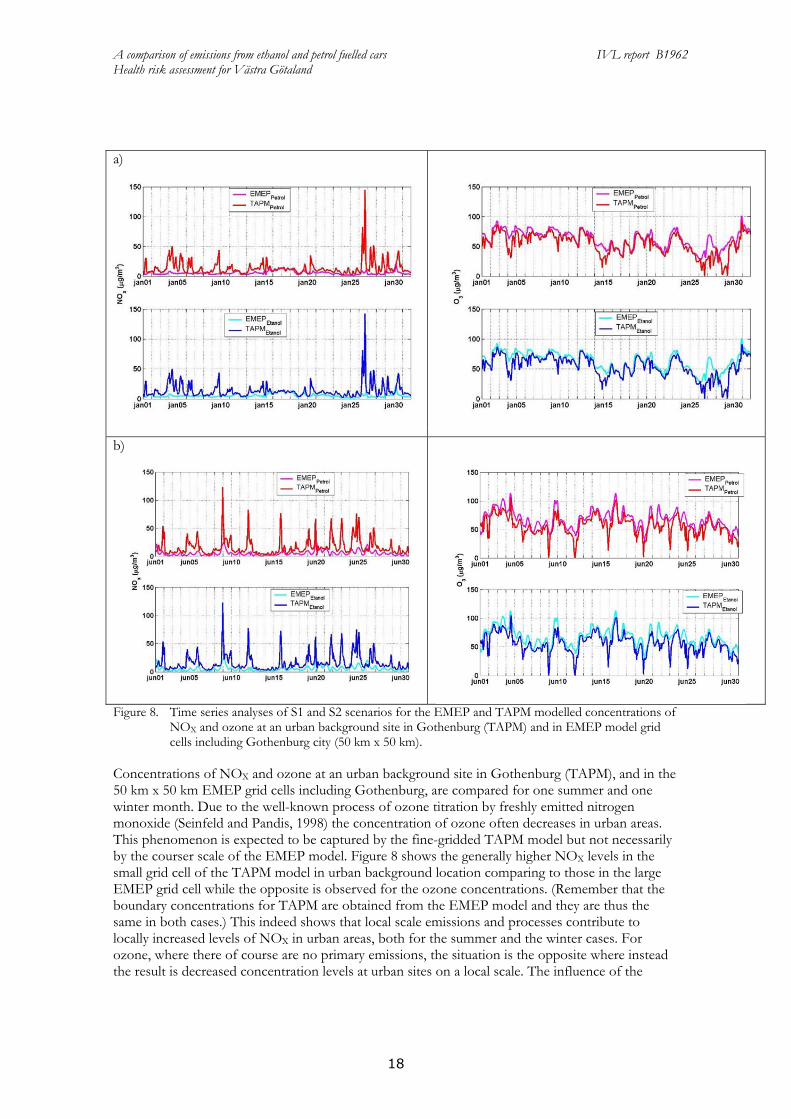
A comparison of emissions from ethanol and petrol fuelled cars IVL report B1962 Health risk assessment for Vaumlstra Goumltaland
20
Figure 10 The difference in yearly average concentrations (gm3) of benzene for 2020 between the all E85 (S2) and all petrol (S1) scenarios
The difference in the calculated NOX NO2 and ozone concentrations between the two scenarios are shown in Appendix 4 The change in NOX concentration between the two scenarios only represents a small fraction of the total NOX concentration This is because the emissions of NOX from petrol cars are relatively low compared with the contribution from diesel engines and other sources Thus the resulting decrease in the NOX concentration with E85 is only up to 3 For ozone there is a small increase of about 01 microgm3 of E85 in the central areas of Gothenburg where there is relatively high traffic intensity (see Appendix 4 Figure A9) In the rest of the region there is a small decrease in the ozone concentration in the E85 scenario
34 Exposure
The resulting concentrations from the dispersion modelling together with the population density distribution are used to assess the exposure to acetaldehyde benzene NO2 NOX and ozone for the two scenarios S1 and S2 The exposure to PM25 is very similar for the two scenarios (the difference in concentration between scenarios S2 and S1 is only about -002 gm3 Table 5 shows the population weighted mean exposure both as total concentrations and as the difference between the two scenarios Detailed exposure results can be found in Appendix 5 It can be seen that the exposure to all the pollutants in Table 5 with the exception of acetaldehyde are somewhat lower for the all E85 scenario (S2) than for the all petrol scenario (S1) However the effect on health also
A comparison of emissions from ethanol and petrol fuelled cars IVL report B1962 Health risk assessment for Vaumlstra Goumltaland
21
depends on the level of the dose-response functions For example if the level of concentration is low in a populated area but the dose-response function is high the effect of even a low concentration increase can become important The increase in exposure from S1 to S2 (S2-S1) calculated as percentage of the population exposed to increased mean concentrations of pollutants is presented in Figure 11
Table 5 Populated weighted mean exposure (gm3)
S1 S2 S2-S1 Acetaldehyde 065 077 014 Benzene 01 005 -007 NOX 85 84 -012 Ozone 570 569 -012 PM25 270 268 -002
Increased concentrations Decreased concentrations Both increased and
decreased conc
Figure 11 The relative exposure (S2-S1) calculated as percentage of the population
In Figure 11 it is clear that the only pollutant that does not show an improvement regarding air quality and thus the health risks when modelling a switch from petrol to E85 is acetaldehyde For all pollutants except for ozone the changes of concentration levels observed between the scenarios are within the urban areas but for ozone there are also differences in rural areas
According to the data in Figure 11 about 14 of the population in the Vaumlstra Goumltaland region will be exposed to 03-08 microgm3 higher concentration levels of acetaldehyde in scenario S2 relative to S1 From Figure 9 it can be seen that the majority of these people live within the Gothenburg area Further about 28 of the population will be exposed to increased levels of between 01 to 03 microgm3 mainly in the suburban areas and rural surroundings of Gothenburg but also in some of the smaller cities in the region Outside the urban areas the concentration difference is lower than 01 microgm3
In the S2 scenario relative to the S1 scenario the population is exposed to decreased concentration levels of benzene and NOX This is mainly true also for O3 but with an exception for the central
A comparison of emissions from ethanol and petrol fuelled cars IVL report B1962 Health risk assessment for Vaumlstra Goumltaland
22
parts of Gothenburg where the concentration actually increases (see Appendix 4 Figure 7A) resulting in that 3 (blue area in Figure 11 for O3) of the population will be exposed to higher concentrations of O3 For the rest of the area there are decreased concentrations of ozone upon a switch to E85
The largest differences are again in the central parts of Gothenburg where about 20 of the population is being exposed to a lower benzene concentration of 01-03 microgm3 This also means that concerning benzene the majority (78) of the population have none or very low influence from a change to ethanol fuel
The largest effect on exposure difference is seen for NOX where just over 20 of the population has its exposure decreased with 03-05 microgm3 (in the central parts of Gothenburg) In the suburbs the decrease is between 01-02 microgm3 lower Along the largest roads there is a small but visible improvement on a yearly basis of 01 microgm3
For PM25 there is a difference in the populated weighted mean exposure of 002 gm3 between the scenarios with a lower value for the all-E85 case (see also Appendix 5)
35 Impact on health in Vaumlstra Goumltaland
351 NO2 and NOX
The impact of long-term exposure on mortality was estimated using the relative risk from the Norwegian cohort study (Nafstad et al 2004) reporting a relative risk of 08 increase per microgm3 increase in NOX however without adjustment for particle concentrations Assuming this effect on the total mortality and a typical baseline mortality of 1000 deaths per 100 000 person years a decrease in the population mean exposure of 012 microgm3 would correspond to approximately 104 less preterm deaths per year However for the present case this number is highly uncertain since the exposure to substances normally associated with changes in NOX exposure may here change in different ways since the relation between different exhaust components varies between the scenarios
The impact of long-term exposure on asthma incidence (new cases) in adults has been estimated using results from the Swedish RHINE Study Cohorts (Modig et al 2009) with very similar results in the ECRHS Study corresponding to approx 4 increase per microgm3 increase in NO2 From the RHINE Study the incidence can be estimated to 03 per year (proportion of adults developing the disease) with children and elderly excluded this means around 1500 adult cases per year A reduction of 009 microgm3 corresponds to 54 avoided new cases of adult asthma per year However also NO2 in the asthma study may have been mainly an indicator of vehicle exhaust
352 Ozone
The impact of long-term exposure on respiratory mortality has been reported to be approx 02 per microgm3 increase in the summer concentration when studied in the large ACS Cohort (Jerret et al 2009) Assuming this effect on the total population and a typical baseline respiratory mortality of 100 deaths per 100 000 person years a decrease in the population mean exposure of 012 microgm3 corresponds to approximately 03 less preterm deaths per year
A comparison of emissions from ethanol and petrol fuelled cars IVL report B1962 Health risk assessment for Vaumlstra Goumltaland
23
353 Acetaldehyde
According to US EPA (1999) a lifetime risk for cancer of 0000002 per microgm3 is to be assumed for this potential human carcinogen An increase in the population mean exposure of 012 microgm3 corresponds to 026 cases more per year in the current population
354 Benzene
According to US EPA (1999) a lifetime risk for cancer (leukaemia) of 00000022-00000078 per microgm3 is to be assumed for this human carcinogen A decrease in the population mean exposure of 0074 microgm3 corresponds to approximately 03 cases less per year in the current population (assuming 0000004 per microgm3)
355 PM25
In CAFEacute and other impact assessments a relative risk of 6 increase in all-cause mortality per 10 microgm3 has usually been assumed Assuming this effect on the total mortality and a typical baseline mortality of 1000 deaths per 100 000 person years a decrease in the population mean exposure of 002 microgm3 corresponds to approximately 13 less preterm deaths per year
4 Discussion
In this study the health risks from a large introduction of E85 to replace petrol is analysed in scenario studies for 2020 for the Vaumlstra Goumltaland region It is found that the change in pollutant concentration exposure and health risks are small between the two scenarios It should be emphasized that the study only considers vehicle emissions and does not take into account effects from the fuel production
The emissions of NOX in the model are somewhat lower from E85 fuelled cars than from petrol fuelled cars This is in line with the emission factors used by Jacobson (2007) The nitrogen oxides are key substances in the atmospheric reactions determining the concentrations of ozone in air NOX is involved in the formation of ozone but close to the NO source the ozone concentration is lowered due to the rapid reactions between NO and O3 forming NO2 If NO is released in an environment with already high NO concentration it may result in lowering of ozone levels on the regional scale In the present study the ozone concentrations calculated are somewhat lower for the E85 scenario than for the petrol scenario
The health risk analysis shows that the main difference between the scenarios is due to the lower concentration of NOX However it may have been other exhaust components than NOX such as exhaust particles that were behind the reported association with mortality In cases when NOX is not a good indicator of exhaust particle emissions and their toxicity our results may be misleading This should be studied further Neglecting the effects of the changes in NOX exposure the total difference between the scenarios sums up to 16 preterm deaths per year with lower values for the E85 scenario while it would sum up to 12 less preterm deaths for the E85 scenario if the effect related to NOX were included Since there are no similar studier for the effect on mortality among those younger than 30-50 years of age we assume the same relative effect on mortality in all ages This makes only a small difference since the large majority of deaths occur in older groups
A comparison of emissions from ethanol and petrol fuelled cars IVL report B1962 Health risk assessment for Vaumlstra Goumltaland
24
The opposite result for the ozone concentration was obtained by Jacobson The reason for this discrepancy is that the Jacobson study concerns Los Angeles a region with high concentrations of pollutants while the study here concerns the Vaumlstra Goumltaland region with much less dense traffic and also lower concentrations of pollutants importantly NOX It is not unlikely that the effect that Jacobson report also would be found for large parts of Europe with higher traffic densities than in the Vaumlstra Goumltaland region
It is worth to emphasize that the major negative health effect in the Jacobson (2007) study is attributed to the increase in ozone concentration that is a result of the decrease of the NO emissions from E85 cars Directly after the emission NO reacts with ozone resulting in drop of the ozone concentration the so-called ozone titration commonly observed in many cities This NO does however form even higher quantities of ozone further downwind contributing to the general increase in the background ozone levels It is also precursor of NO2 secondary PM and other toxic species as eg PAN and hence reductions in NO emissions are never regarded as disbeneficial from the environmental viewpoint
There are of course several sources of uncertainties that influence the results of this study Since the main results concern differences between the two scenarios several of these factors loose on importance for the conclusions This comprises uncertainties in meteorology in future traffic volumes and in the population density distribution However there are some uncertainties that remain important The emission factors for E85 fuelled cars are much less characterised than what they are for petrol cars The emission of particles from E85 fuelled cars is especially uncertain with only very few published results Also the emissions of NMHC are somewhat uncertain and may be higher for E85 at lower ambient temperatures However the sensitivity analysis performed shows that for the studied region the NMHC emissions only have a small influence on the ozone concentrations
5 Conclusions
In this study the impact of tailpipe and evaporative emissions from E85 fuelled cars on air pollution and health risks are calculated and compared with petrol fuelled cars The scenario calculations for the Vaumlstra Goumltaland Region give data on emissions pollutant concentrations exposure and a health risk evaluation
The differences in emission factors between E85 and petrol lies in the emissions of PM and NOX which are about 65 and 58 for E85 relative petrol respectively Also the speciation of the emitted hydrocarbons is significantly different with large emissions of acetaldehyde and ethanol from E85 and large emissions of benzene higher aromatics alkanes and alkenes from petrol
These differences in emission factors reflect in differences in emissions The emission calculations for all Swedish road traffic show a decrease for the E85 scenario relative to the petrol scenario of 65 for NOX 34 for PM25 67 for benzene For acetaldehyde there is an increase of 770
The differences obtained from the TAPM modelling show decreased levels of NOX ozone and benzene with E85 and increased levels of acetaldehyde For the latter the increase may be up to 80 while NOX and ozone show decreases of up to a few per cent and a few tenths of per cent respectively
A comparison of emissions from ethanol and petrol fuelled cars IVL report B1962 Health risk assessment for Vaumlstra Goumltaland
25
The health risk assessment shows decreased health risks in the E85 scenario relative the all-petrol scenario due to the increased NOX exposure correlated with both preterm deaths and asthma However NOX may be mainly an exhaust indicator Smaller effects are expected from the changes in ozone acetaldehyde and benzene exposure The overall difference considering the exposure to PM acetaldehyde benzene and ozone is 16 preterm deaths with lower values for the E85 scenario
6 Acknowledgements
Saab Automobile The Swedish Transport Administration and The Foundation for the Swedish Environmental Research Institute are gratefully acknowledged for financial contribution
Magnus Ekstroumlm and Maria Holmstroumlm at Saab and Martin Juneholm at the Swedish Transport Administration are acknowledged for their most valuable input to the study
David Simpson Norwegian Meteorological Institute EMEP MSC-W Norway and Dept Radio amp Space Science Chalmers Univ Technol Sweden is gratefully acknowledged for help with implementation of the Unified EMEP model
A comparison of emissions from ethanol and petrol fuelled cars IVL report B1962 Health risk assessment for Vaumlstra Goumltaland
26
7 References
Altenstedt J Pleijel K 2000 An alternative approach to photochemical ozone creation potentials under European conditions J Air amp Waste Manage Assoc 50 1023 ndash 1036
Andre J-M (2005) Vehicle emission measurement collection of the ARTEMIS datatbase Artemis 3312 report Available from httpwwwinretsfrurltepublicationspublications-pdfJoumardA3312reportJMALTE0504pdf
Bachand A MMundt K A Mundt D JMontgomery R R Epidemiological studies of formaldehyde exposure and risk of leukemia and nasopharyngeal cancer A meta-analysis Critical Reviews in Toxicology 2010 40(2) 85ndash100
Beane Freeman L E Blair A Lubin J H Stewart P A Hayes R B Hoover R N Hauptmann M Mortality from lymphohematopoietic malignancies among workers in formaldehyde industries The National Cancer Institute Cohort J Natl Cancer Inst 2009101751ndash761
Bosetti C McLaughlin J K Tarone R E Pira E LaVecchia C Formaldehyde and cancer risk A quantitative review of cohort studies through 2006 Ann Oncol 20081929ndash43
ConcaweJRC Well-to-wheel studies httpiesjrceceuropaeuwtwhtml
Derwent R G Jenkin M E Saunders S M 1996 Photchemical ozone creation potentials for a large number of reactive hydrocarbons under European conditions Atmos Environ 30 181 ndash 199
Derwent RG Jenkin ME Passant NR Pilling MJ 2007 Photochemical ozone creation potentials (POCPs) for different emission sources of organic compounds under European conditions estimated with a Master Chemical Mechanism Atmos Env 41 2570ndash2579
EEA Copenhagen 2009 wwweeaeuropaeudata-and-mapsdatapopulation-density-disaggregated-with-corine-land-cover-2000-2
Ericsson P Holmstroumlm M Amberntsson-Carlsson A Ohlson C Skoglundh M Andersson B Carlsson P-A 2008 Characterization of particulate emissions and methodologhy for oxidation of particulates from non-diesel combustion ystems SAE Technical Paper Series 2008-01-1746
GAINS 2010 httpgainsiiasaacatindexphpgains-europe
Graham LA Belisle SL Baas C-L Emissions from light duty gasoline vehicles operating on low blend ethanol gasoline and E85 Atmospheric Environment 42 4498 (2008)
Haskew H M Thomas P E Liberty F 2006 Fuel Permeation From Automotive Systems E0 E6 E10 E20 And E85 Final Report CRC Project No E-65-3 Coordinating Research Council Inc 3650 Mansell RoadSuite 140Alpharetta GA 30022
HEI Air Toxics Review Panel (2007) Mobile-Source Air Toxics A Critical Review of the Literature on Exposure and Health Effects HEI Special Report 16 Health Effects Institute Boston USA
Hurley P TAPM v 4 User Manual 2008 CSIRO ISBN 978-1-921424-73-1
IARC (2006) IARC Monographs on the Evaluation of Carcinogenic Risks to Humans Wood Dusts and Formaldehyde Lyon World Health Organization International Agency for Research on Cancer Lyon France 8837ndash325
Jacobson M Z Effects of Ethanol (E85) versus Gasoline Vehicles on Cancer and Mortality in the United States Environ Sci Technol 2007414150-4157
A comparison of emissions from ethanol and petrol fuelled cars IVL report B1962 Health risk assessment for Vaumlstra Goumltaland
27
Jerret M Burnett R T Pope C A Ito K Thurston G Krewski D Shi Y Calle E Thun M Long-Term Ozone Exposure and Mortality N Engl J Med 20093601085-95
Lipman T E Delucchi M A 2002 Emissions of nitrous oxide and methane from conventional and alternative fuel motor vehicles Climate Change 53 477
Modig L Toreacuten K Janson C Jarvholm B Forsberg B Vehicle exhaust outside the home and onset of asthma among adults Eur Respir J 2009 Jun33(6)1261-7
Nafstad P Haheim L L Wisloff T Gram F Oftedal B Holme I Hjermann I Leren P Urban air pollution and mortality in a cohort of Norwegian men Environ Health Perspect 2004112(5)610-5
OEHHA (1999) Air Toxics Hot Spots Program Risk Assessment Guidelines Part II Technical Support Document for Describing Available Cancer Potency Factors Prepared by the Air Toxicology and Epidemiology Section Office of Environmental Health Hazard Assessment April 1999
Passant NR (2002) Speciation of UK emissions of non-methane volatile organic compounds AEAT report AEATENVR0545 Issue 1 Culham UK
Pope CA III Thun MJ Namboodiri MM Dockery DW Evans JS Speizer FE Heath CJ Particulate air pollution as a predictor of mortality in a prospective study of US adults Am J Resp Crit Care Med 1995 151 669-674
Seinfeld J H and Pandis SN (1998) Atmospheric Chemistry and Physics From Air Pollution to Climate Change John Wiley amp Sons New YorkSimpson D Fagerli H Jonson JE Tsyro S Wind P Tuovinen J -P 2003 Transboundary acidification and eutrophication and ground level ozone in Europe Unified EMEP Model Description EMEP Status Report 12003 Part I EMEPMSC-W Report The Norwegian Meteorological Institute Oslo Norway
US EPA (1999) httpwwwepagovttnatwnata1999nsata1999
Vestreng V et al 2004 Inventory Review 2004 Emission data reported to CLRTAP and the NEC Directive EMEPEEA Joint Review Report EMEPMSC-W Note 1
Westerholm R Ahlvik P Karlsson HL An exhaust characterisation study based on regulated and unregulated emissions from bi-fuel and flexi-fuel light-duty passanger cars fuelled by petrol (E5) bioethanol (E70 E75) and biogas tested at ambient temperatures of +22degC and -7degC 2008
Wolkoff P Nielsen G D Non-cancer effects of formaldehyde and relevance for setting an indoor air guideline Environment International 201036788ndash799
Yanowitz J McCormick RL Effect of E85 on tailpipe emissions from light-duty vehicles J Air amp Waste Manage Assoc 59 172 (2009)
A comparison of emissions from ethanol and petrol fuelled cars IVL report B1962 Health risk assessment for Vaumlstra Goumltaland
28
Appendix 1 Evaporate emissions of NMHC
The following assumptions are done for evaporative emissions The NMHC emissions from E85 are reduced relative to petrol by 45 Methane emissions are zero and the split of NMHC species is 68 ethanol and the remaining 32 is divided in the same way as evaporative emissions for petrol The estimates by Graham et al (2008) are missing evaporative emission data however these assumptions agrees very well with measurements of evaporative emissions due to fuel permeation reported by Haskew et al (2006) where NMHC emissions are reported to be reduced by 50 for E85 fuel compared to petrol Haskew et al also presents the NMHC split to species with 60 ethanol This number agrees quite well with our assumption of 68 NMHC being ethanol NMHC in exhaust and evaporative emissions are thus divided as in Table A1
Table A1 Division of NMHC in the exhaust and evaporative emissions for E85 and petrol respectively (wt)
E85 Petrol E85 Petrol exhaust exhaust evaporative evaporative
Ethanol 680 0 680 0 Acetaldehyde 131 08 02 0 Ethene 99 73 24 0 Ethyne 03 28 09 0 Formaldehyde 31 17 06 0 Benzene 16 56 18 10 13 Butadiene 03 09 03 0 sum 963 191 741 10
The remaining NMHC emissions are divided as for petrol (ref) and listed in Table A2
Table A2 Division of NMHC in the exhaust and evaporative emissions for E85 and petrol respectively (wt)
E85 Petrol E85 Petrol exhaust exhaust evaporative evaporative
Ethane 02 32 10 0 Alkanes (C3+) 13 278 89 880 Alkenes (C3+) 04 90 29 95 Aromatics (C7+) 18 388 125 15 Aldehydesketones (C3+)
01 15 05 0
A comparison of emissions from ethanol and petrol fuelled cars IVL report B1962 Health risk assessment for Vaumlstra Goumltaland
29
Appendix 2 Description of the model system
A21 Atmospheric lifetimes
Table A3 gives tropospheric lifetimes with regard to reaction of ethanol formaldehyde acetaldehyde and benzene (C6H6) with OH nitrate radical (NO3) and photolysis The studied organic species are listed together with three species common in the gasoline exhaust (benzene ethene and toluene) for comparison Table 11 shows also photochemical ozone creation potential (POCP) of these species POCP is a measure of amount of ozone that is formed from a certain VOC emission relatively to other emission source which has been established to the same emission mass of ethene (Derwent et al 1996 Altenstedt et al 2000) The range represents different scenarios for VOC and NOX background concentrations Derwent et al (2007) used similar methodology to calculate POCP of different VOC sources and calculated POCP of mean road emission exhaust to be 69
Table A3 Atmospheric lifetimes of studies NMVOC species with respect to the OH- and NO3- initiated
degradation τ(OH) and τ(NO3) and with respect to the photolysis (The lifetime of a chemical species which decays in a first-order process is the time needed for a concentration of this species to decrease to 1e of its original value Statistically it represents the mean life expectancy of an excited species) The OH concentration of 1times106 moleculescm3 typical for summer troposphere was used for the lifetime calculation The NO3 concentrations of 5 and 100 ppt(V) were used for lifetime calculations as representative of rural and urban night-time 12 hrs mean concentration The studied organic species are listed together with 3 species common in the gasoline exhaust for comparison The rates of photolysis were calculated with radiation transfer model for July 58ordm latitude and integrated over 24 hours
τ(OH) τ(NO3) urbanrural τ (photolysis) POCP
hr hr hr
Ethanol 85 56 1times103 - 44 - 63
Acetaldehyde 15 47 1times103 86 68 - 80
Formaldehyde 30 194 4times103 10 18 - 55
Benzene 214 - - 23 - 47
Ethene 34 - - 100
Toluene 50 - - 30 - 67
A22 Defining of boundary concentrations for TAPM from EMEP fields
Calculation of initial concentration field for TAPM from EMEP concentration field of NO2 (as example) and EMEP mean wind vector components u_mid and v_mid Two EMEP model gridcells (i=56 j=60 and i=56 j=61) represent the TAPM model domain and concentrations from the surrounding EMEP gridcells SE-S SE-N NW-S NW-N NE NW (Figure A1) are used for calculation of boundary concentration NO2(bc) according to the following code if u_mid lt= 0 then ( isite = SE-S and jsite = SE-N) else isite = NW-S and jsite = NW-N) endif
A comparison of emissions from ethanol and petrol fuelled cars IVL report B1962 Health risk assessment for Vaumlstra Goumltaland
30
if v_mid lt= 0 then ( ksite = NE) else ksite = SW endif NO2(bc) = [(NO2(isite)u_mid(isite) + NO2(jsite)u_mid(jsite))2 + NO2(ksite)v_mid(ksite)] [(u_mid(isite) + u_mid(jsite))2 + v_mid(ksite)]
Figure A1 Gridcells covering Gothenburg domain and its boundary in EMEP model plotted on latitude-
longitude coordinates The red square represents centre of Gothenburg and the blue line the coastline EMEP i and j coordinates for the boundary gridcells are SE-S = 57-60 SE-N = 57-61 NW-S = 55-60 NW-N = 55-61 NE = 56-62 NW = 56-59 and for Gothenburg grid cells are Gbg-NE = 56-61 Gbg-SW = 56-60
A23 Atmospheric chemistry
The role of secondary chemistry in for the concentration of acetaldehyde are studied by first excluding the primary acetaldehyde emissions from the EMEP model simulations of scenarios S1 and S2 and then by excluding all NMVOC emissions from the car category with spark ignition engines The contribution from the primary acetaldehyde emissions as well as the contribution of secondary acetaldehyde formed from other NMVOC to the total acetaldehyde concentration is then obtained However the secondary chemistry is highly nonlinear due to the interactions of NMVOCs with ozone and OH and thus the results for the contribution of secondary acetaldehyde are somewhat uncertain Differences in acetaldehyde concentrations between S1 and S2 scenarios are studied with respect to contribution of primary and secondary acetaldehyde It is observed that in summer background air the monthly mean contribution of the secondary acetaldehyde is of the same magnitude as the contribution of the primary acetaldehyde to the difference between S1 and
565
57
575
58
585
105 115 125 135 145
Long
Lat
Gbg-SW
Gbg-NE
SE-S
NW-N
NW-S
SE-N
SW
NE
55-59
57-59
55-62
A comparison of emissions from ethanol and petrol fuelled cars IVL report B1962 Health risk assessment for Vaumlstra Goumltaland
31
S2 In the winter and in more polluted atmosphere (Gothenburg grid cells) the contribution from secondary acetaldehyde to the concentration difference appears to be negative due to the chemistry feedback ie the E-85 scenario has less secondary acetaldehyde than the all-petrol scenario
A comparison of S2-S1 differences in primary and secondary acetaldehyde concentrations in the background (=upwind) and Gothenburg grid cells show no increase in the secondary acetaldehyde from upwind to the Gothenburg grid cell It can thus be concluded that there is no significant contribution from secondary aldehydes on the small scale (tenths of km) Conclusion from this sensitivity study is that the secondary formaldehyde can be of importance under summer in the clean background air but that formation on the local scale is unimportant Using EMEP simulated boundary concentrations of acetaldehyde in the local scale model and simulating the primary acetaldehyde emissions will capture the most important features of acetaldehyde dispersion and chemistry in Vaumlstra Goumltaland
In the EMEP model the tail-pipe PM emissions are specified as primary particles Emissions of NOX and VOCs (and NH3 SO2) are oxidised in the atmosphere and a part is then transferred through the gas-to-particle transport to the PM as secondary PM The petrol fuelled cars emit both more primary PM and more NOX compared to the E85 cars If we compare differences in primary and secondary PM between the S1 and S2 scenarios simulated by EMEP we can directly see what part of the difference is from the tail-pipe emissions of the primary particles and what part is from the formation of the secondary PM in atmosphere (mostly from higher emissions of NOX) Table A4 shows the differences between S1 and S2 (S1-S2) of monthly PM averages for January and June (two months with low and high photochemical activities respectively) It can be seen that the higher formation of secondary PM in the S1 (all-petrol) scenario is more important than the higher tail-pipe emission of primary PM by factor 10 - 20
When we compare simulated PM differences between S1-S2 for the background air (=upwind) grid cells and for grid cells including Gothenburg (50 km x 50 km scale) we can see significant increase in primary PM in the S1 scenario from the upwind grid cells to Gothenburg (746 in winter 132 in summer) while no systematic increase can be seen for the secondary PM (-42 in winter +24 in summer) From this comparison it can be concluded that no systematic increase in secondary PM can be seen (in difference from the primary PM) on the scale of 50-100 km and we can neglect this process on the small scale However the overall change in PM concentrations due to the switch of the fuel is very small both on the large scale and on the small scale as can be seen when the differences in PM concentrations between S1 and S2 are compared to absolute PM concentrations in S1 presented in the last column of Table A4
Table A4 Differences in primary and secondary PM concentrations between the lsquoAll-petrolrsquo (S1) and lsquoE-85rsquo (S2) scenarios simulated in gridcells upwind Gothenburg and in gridcells including Gothenburg (2 50 km x 50 km gridcells)
S1-S2 Background
S1-S2 Gothenburg
Increase S1-S2 Gothenburg
S1 Background
μgm3 μgm3 μgm3 bkgnd μgm3
Prim PM10 Jan 00008 00014 00006 746 084
Jun 00008 00018 00010 1319 084
Sec PM10 Jan 00155 00148 -00006
-42 157
Jun 00080 00081 00002 24 213
The sensitivity of the used emission factors for NMHC with respect to the ozone formation in the region of the Swedish West Coast can be analysed with the help of results from studying the
A comparison of emissions from ethanol and petrol fuelled cars IVL report B1962 Health risk assessment for Vaumlstra Goumltaland
32
formation of secondary acetaldehyde In this study first all primary acetaldehyde emitted by the E85 fleet are omitted in a model simulation (S2_nopAA) and secondly all NMHC emissions from the E-85 fleet are switched off (S2_noVOC) Acetaldehyde has a somewhat higher though still comparable photochemical ozone creation potential compared to ethanol (ethanol 44-63 acetaldehyde 68-80 Altenstedt and Pleijel 2000) and this simulation will thus also give information on the sensitivity of the calculations to uncertainties in the ethanol emissions Setting the emission factor for NMHC to zero gives the sensitivity to the emission factor of total NMHC Figure A2 shows the differences in ozone concentration as a result of acetaldehyde only and the total NMHC from the E85 car fleet (S2 scenario) We can see that the effect on ozone formation is very small for the Swedish West coast The reason is that the ozone formation in this area is controlled by the availability of NOX while NMHC or rather their degradation products the peroxy radicals that serve as a lsquofuelrsquo to ozone formation are usually in excess here and further VOC emissions do not increase ozone concentrations significantly The situation looks different in areas that are more heavily polluted with NOX andor which is limited in the availability of peroxy radicals The results from this sensitivity study are fully consistent with the observed increase in ozone concentrations as a result of lower NO emissions (the so-called ozone titration) only very close to the major roads but no larger-scale decrease in ozone concentrations in the Gothenburg area or in any other communities
Figure A2 Sensitivity of the ozone formation in the 2 EMEP model grid cells covering Gothenburg (blue) and in the 6 surrounding grid cells (red see Fig A1) to changes in NMHC emission factor of the E85 fuelled cars lsquobasersquo is simulation S2 with EF for NMHC as in Table 3 lsquonoVOCrsquo is S2 with EF for all NMHC = 0 lsquonopAArsquo is S2 with EF for acetaldehyde = 0 a ndash Mean sensitivity in January absolute difference in ozone formation in ppb(V) as a result of NMHC (base-noVOC) and acetaldehyde (base-nopAA) emissions b ndash Sensitivity relative to ozone concentration in the S2-base simulation January c ndash same as a) but June d ndash same as b) but June
‐002
‐001
0
001
base‐noVOC base‐nopAA
ΔO3(ppb)
a)
0
001
002
base‐noVOC base‐nopAA
ΔO
3(ppb)
c)
‐010
‐005
000
005
base‐noVOC base‐nopAA
ΔO
3
b)
000
002
004
006
base‐noVOC base‐nopAA
ΔO
3
d)
A comparison of emissions from ethanol and petrol fuelled cars IVL report B1962 Health risk assessment for Vaumlstra Goumltaland
33
Appendix 3 Emission results
The geographically distributed NOX and acetaldehyde emissions for the Vaumlstra Goumltaland region are presented in Figures A3 and A4 respectively
Figure A3 NOX emissions for the Vaumlstra Goumltaland region for the All Petrol scenario
A comparison of emissions from ethanol and petrol fuelled cars IVL report B1962 Health risk assessment for Vaumlstra Goumltaland
34
Figure A4 Acetaldehyde emissions for the Vaumlstra Goumltaland region for the All Ethanol scenario
A comparison of emissions from ethanol and petrol fuelled cars IVL report B1962 Health risk assessment for Vaumlstra Goumltaland
35
Appendix 4 Dispersion modelling results
The difference in yearly average concentration between scenario S1 and S2 for acetaldehyde and benzene can be seen in Figure A5 and Figure A6 respectively a)
b)
Figure A5 The difference in yearly average concentrations of acetaldehyde for 2020 between the all E85 (S2) and all petrol (S1) scenarios presented as a) microgm3 and as b) percentage for the Gothenburg area
A comparison of emissions from ethanol and petrol fuelled cars IVL report B1962 Health risk assessment for Vaumlstra Goumltaland
36
a)
b) all E85 c) all petrol
Figure A6 a) the difference in yearly average concentrations (gm3) of benzene for 2020 between the all E85 (S2) and all petrol (S1) scenarios yearly means for b) all E85 and c) all petrol (note the different scales)
The difference in the calculated NOX NO2 and ozone concentrations between the two scenarios are shown in Figures A7 A8 and A9
A comparison of emissions from ethanol and petrol fuelled cars IVL report B1962 Health risk assessment for Vaumlstra Goumltaland
37
a)
b)
Figure A7 The difference in yearly average concentrations of NOX for 2020 between the all E85 (S2) and all petrol (S1) scenarios presented as a) microgm3 and as b) percentage for the Gothenburg area
A comparison of emissions from ethanol and petrol fuelled cars IVL report B1962 Health risk assessment for Vaumlstra Goumltaland
38
a)
Figure A8 The difference in yearly average concentrations of NO2 for 2020 between the all E85 (S2) and all petrol (S1) scenarios presented as a) microgm3 and as b) percentage for the Gothenburg area
A comparison of emissions from ethanol and petrol fuelled cars IVL report B1962 Health risk assessment for Vaumlstra Goumltaland
39
a)
b)
Figure A9 The difference in yearly average concentrations of ozone for 2020 between the all E85 (S2) and all petrol (S1) scenarios presented as a) microgm3 and as b) percentage for mainly the Gothenburg area
A comparison of emissions from ethanol and petrol fuelled cars IVL report B1962 Health risk assessment for Vaumlstra Goumltaland
40
Appendix 5 Detailed Exposure data
Detailed exposure data for the difference between the all E85 (S2) and the all petrol (S1) scenarios can be found in Table A5
Table A5 Exposure data for the difference between the all E85 (S2) and the all petrol (S1) scenarios
Acetaldehyde diff E-P (microgm3)
Populated weighted mean
Number of people Percentage of population
0 - 01 627198 582 01 - 02 163394 152 02 - 03 134879 125 03 - 04 88099 82 04 - 05 38686 36 05 - 06 16880 16 06 - 07 7983 07 07 - 08 1248 01 Tot 014 1078367 Benzene diff E-P (microgm3)
Populated weighted mean
Number of people Percentage of population
-03 - -02 26680 25 -02 - -01 205757 191 -01 - -0 845930 784 Tot -0074 1078367 NO2 diff E-P (microgm3) Populated weighted
mean Number of people Percentage of
population -04 - -03 7698 07 -03 - -02 50131 46 -02 - -01 296288 275 -01 - -0 724250 672 Tot -009 1078367 NOX diff E-P (microgm3) Populated weighted
mean Number of people Percentage of
population -06 - -05 7698 -05 - -04 19639 18 -04 - -03 36626 34 -03 - -02 161685 150 -02 - -01 186500 173 -01 - -0 666219 618 Tot -012 1078367 O3 diff E-P (microgm3) Populated weighted
mean Number of people Percentage of
population -02 - -01 779132 723 -01 - -0 266417 247 0 - 01 32818 30 Tot -012 1078367
Exposure data for the total levels in the two scenarios can be found in Table A6
A comparison of emissions from ethanol and petrol fuelled cars IVL report B1962 Health risk assessment for Vaumlstra Goumltaland
41
Table A6 Exposure data for the total levels in the two scenarios
Acetaldehyde tot All ethanol (microgm3)
Populated weighted mean
Number of people Percentage of population
06 - 07 568825 527 07 - 08 171845 159 08 - 09 124551 115 09 - 10 100946 94 10 - 11 59235 55 11 - 12 30559 28 12 - 13 13175 12 13 - 14 7983 07 14 - 15 1248 01 Tot 077 1078367 Acetaldehyde tot All petrol (microgm3)
Populated weighted mean
Number of people Percentage of population
05 - 06 45111 42 06 - 07 1032008 957 07 - 08 1248 01 Tot 065 1078367 Benzene tot All ethanol (microgm3)
Populated weighted mean
Number of people Percentage of population
0 - 01 1055961 98 01 - 02 22406 2 Tot 005 1078367 Benzene tot All petrol (microgm3)
Populated weighted mean
Number of people Percentage of population
0 - 01 729093 676 01 - 02 232961 216 02 - 03 94042 87 03 - 04 21023 19 04 - 05 1248 01 Tot 010 1078367 NOX tot All ethanol (microgm3)
Populated weighted mean
Number of people Percentage of population
0-10 779108 722 10-20 254658 236 20-30 28683 27 30-40 11070 10 40-50 3426 03 50-60 0 00 60-70 0 00 70-80 639 01 80-90 0 00 90-100 0 00 100-110 783 01 Tot 84 1078367 NOX tot All petrol (microgm3)
Populated weighted mean
Number of people Percentage of population
0-10 769557 714 10-20 264209 245 20-30 28683 27 30-40 11070 10 40-50 3426 03 50-60 0 00
A comparison of emissions from ethanol and petrol fuelled cars IVL report B1962 Health risk assessment for Vaumlstra Goumltaland
42
60-70 0 00 70-80 639 01 80-90 0 00 90-100 0 00 100-110 783 01 Tot 85 1078367 O3 tot All ethanol (microgm3)
Populated weighted mean
Number of people Percentage of population
40-45 1422 01 45-50 26487 25 50-55 176636 164 55-60 770370 714 60-65 103452 96 Tot 569 1078367 O3 tot All petrol (microgm3)
Populated weighted mean
Number of people Percentage of population
40-45 1422 01 45-50 20229 19 50-55 181876 169 55-60 763361 708 60-65 111479 103 Tot 570 1078367 PM25 tot All ethanol (microgm3)
Populated weighted mean
Number of people Percentage of population
1-2 0 00 2-3 885325 821 3-4 192259 178 4-5 783 01 Tot 268 1078367 PM25 tot All petrol (microgm3)
Populated weighted mean
Number of people Percentage of population
1-2 0 00 2-3 868773 806 3-4 208811 194 4-5 783 01 Tot 270 1078367
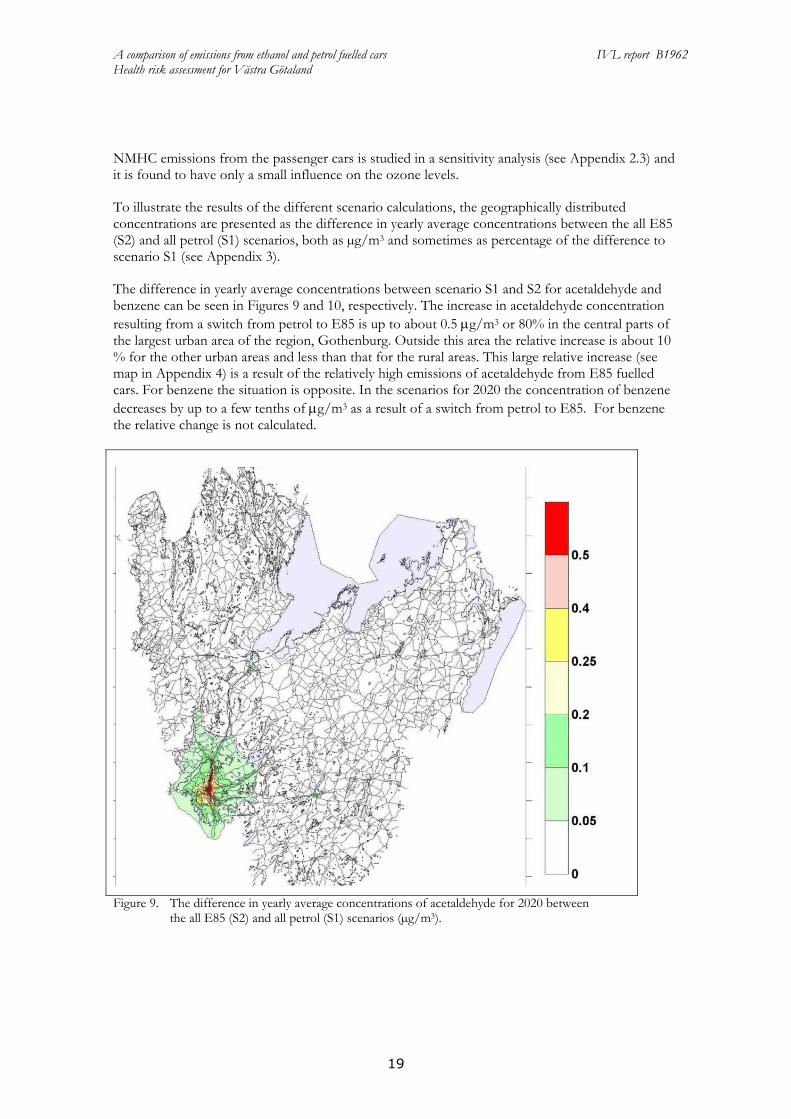
A comparison of emissions from ethanol and petrol fuelled cars IVL report B1962 Health risk assessment for Vaumlstra Goumltaland
21
depends on the level of the dose-response functions For example if the level of concentration is low in a populated area but the dose-response function is high the effect of even a low concentration increase can become important The increase in exposure from S1 to S2 (S2-S1) calculated as percentage of the population exposed to increased mean concentrations of pollutants is presented in Figure 11
Table 5 Populated weighted mean exposure (gm3)
S1 S2 S2-S1 Acetaldehyde 065 077 014 Benzene 01 005 -007 NOX 85 84 -012 Ozone 570 569 -012 PM25 270 268 -002
Increased concentrations Decreased concentrations Both increased and
decreased conc
Figure 11 The relative exposure (S2-S1) calculated as percentage of the population
In Figure 11 it is clear that the only pollutant that does not show an improvement regarding air quality and thus the health risks when modelling a switch from petrol to E85 is acetaldehyde For all pollutants except for ozone the changes of concentration levels observed between the scenarios are within the urban areas but for ozone there are also differences in rural areas
According to the data in Figure 11 about 14 of the population in the Vaumlstra Goumltaland region will be exposed to 03-08 microgm3 higher concentration levels of acetaldehyde in scenario S2 relative to S1 From Figure 9 it can be seen that the majority of these people live within the Gothenburg area Further about 28 of the population will be exposed to increased levels of between 01 to 03 microgm3 mainly in the suburban areas and rural surroundings of Gothenburg but also in some of the smaller cities in the region Outside the urban areas the concentration difference is lower than 01 microgm3
In the S2 scenario relative to the S1 scenario the population is exposed to decreased concentration levels of benzene and NOX This is mainly true also for O3 but with an exception for the central
A comparison of emissions from ethanol and petrol fuelled cars IVL report B1962 Health risk assessment for Vaumlstra Goumltaland
22
parts of Gothenburg where the concentration actually increases (see Appendix 4 Figure 7A) resulting in that 3 (blue area in Figure 11 for O3) of the population will be exposed to higher concentrations of O3 For the rest of the area there are decreased concentrations of ozone upon a switch to E85
The largest differences are again in the central parts of Gothenburg where about 20 of the population is being exposed to a lower benzene concentration of 01-03 microgm3 This also means that concerning benzene the majority (78) of the population have none or very low influence from a change to ethanol fuel
The largest effect on exposure difference is seen for NOX where just over 20 of the population has its exposure decreased with 03-05 microgm3 (in the central parts of Gothenburg) In the suburbs the decrease is between 01-02 microgm3 lower Along the largest roads there is a small but visible improvement on a yearly basis of 01 microgm3
For PM25 there is a difference in the populated weighted mean exposure of 002 gm3 between the scenarios with a lower value for the all-E85 case (see also Appendix 5)
35 Impact on health in Vaumlstra Goumltaland
351 NO2 and NOX
The impact of long-term exposure on mortality was estimated using the relative risk from the Norwegian cohort study (Nafstad et al 2004) reporting a relative risk of 08 increase per microgm3 increase in NOX however without adjustment for particle concentrations Assuming this effect on the total mortality and a typical baseline mortality of 1000 deaths per 100 000 person years a decrease in the population mean exposure of 012 microgm3 would correspond to approximately 104 less preterm deaths per year However for the present case this number is highly uncertain since the exposure to substances normally associated with changes in NOX exposure may here change in different ways since the relation between different exhaust components varies between the scenarios
The impact of long-term exposure on asthma incidence (new cases) in adults has been estimated using results from the Swedish RHINE Study Cohorts (Modig et al 2009) with very similar results in the ECRHS Study corresponding to approx 4 increase per microgm3 increase in NO2 From the RHINE Study the incidence can be estimated to 03 per year (proportion of adults developing the disease) with children and elderly excluded this means around 1500 adult cases per year A reduction of 009 microgm3 corresponds to 54 avoided new cases of adult asthma per year However also NO2 in the asthma study may have been mainly an indicator of vehicle exhaust
352 Ozone
The impact of long-term exposure on respiratory mortality has been reported to be approx 02 per microgm3 increase in the summer concentration when studied in the large ACS Cohort (Jerret et al 2009) Assuming this effect on the total population and a typical baseline respiratory mortality of 100 deaths per 100 000 person years a decrease in the population mean exposure of 012 microgm3 corresponds to approximately 03 less preterm deaths per year
A comparison of emissions from ethanol and petrol fuelled cars IVL report B1962 Health risk assessment for Vaumlstra Goumltaland
23
353 Acetaldehyde
According to US EPA (1999) a lifetime risk for cancer of 0000002 per microgm3 is to be assumed for this potential human carcinogen An increase in the population mean exposure of 012 microgm3 corresponds to 026 cases more per year in the current population
354 Benzene
According to US EPA (1999) a lifetime risk for cancer (leukaemia) of 00000022-00000078 per microgm3 is to be assumed for this human carcinogen A decrease in the population mean exposure of 0074 microgm3 corresponds to approximately 03 cases less per year in the current population (assuming 0000004 per microgm3)
355 PM25
In CAFEacute and other impact assessments a relative risk of 6 increase in all-cause mortality per 10 microgm3 has usually been assumed Assuming this effect on the total mortality and a typical baseline mortality of 1000 deaths per 100 000 person years a decrease in the population mean exposure of 002 microgm3 corresponds to approximately 13 less preterm deaths per year
4 Discussion
In this study the health risks from a large introduction of E85 to replace petrol is analysed in scenario studies for 2020 for the Vaumlstra Goumltaland region It is found that the change in pollutant concentration exposure and health risks are small between the two scenarios It should be emphasized that the study only considers vehicle emissions and does not take into account effects from the fuel production
The emissions of NOX in the model are somewhat lower from E85 fuelled cars than from petrol fuelled cars This is in line with the emission factors used by Jacobson (2007) The nitrogen oxides are key substances in the atmospheric reactions determining the concentrations of ozone in air NOX is involved in the formation of ozone but close to the NO source the ozone concentration is lowered due to the rapid reactions between NO and O3 forming NO2 If NO is released in an environment with already high NO concentration it may result in lowering of ozone levels on the regional scale In the present study the ozone concentrations calculated are somewhat lower for the E85 scenario than for the petrol scenario
The health risk analysis shows that the main difference between the scenarios is due to the lower concentration of NOX However it may have been other exhaust components than NOX such as exhaust particles that were behind the reported association with mortality In cases when NOX is not a good indicator of exhaust particle emissions and their toxicity our results may be misleading This should be studied further Neglecting the effects of the changes in NOX exposure the total difference between the scenarios sums up to 16 preterm deaths per year with lower values for the E85 scenario while it would sum up to 12 less preterm deaths for the E85 scenario if the effect related to NOX were included Since there are no similar studier for the effect on mortality among those younger than 30-50 years of age we assume the same relative effect on mortality in all ages This makes only a small difference since the large majority of deaths occur in older groups
A comparison of emissions from ethanol and petrol fuelled cars IVL report B1962 Health risk assessment for Vaumlstra Goumltaland
24
The opposite result for the ozone concentration was obtained by Jacobson The reason for this discrepancy is that the Jacobson study concerns Los Angeles a region with high concentrations of pollutants while the study here concerns the Vaumlstra Goumltaland region with much less dense traffic and also lower concentrations of pollutants importantly NOX It is not unlikely that the effect that Jacobson report also would be found for large parts of Europe with higher traffic densities than in the Vaumlstra Goumltaland region
It is worth to emphasize that the major negative health effect in the Jacobson (2007) study is attributed to the increase in ozone concentration that is a result of the decrease of the NO emissions from E85 cars Directly after the emission NO reacts with ozone resulting in drop of the ozone concentration the so-called ozone titration commonly observed in many cities This NO does however form even higher quantities of ozone further downwind contributing to the general increase in the background ozone levels It is also precursor of NO2 secondary PM and other toxic species as eg PAN and hence reductions in NO emissions are never regarded as disbeneficial from the environmental viewpoint
There are of course several sources of uncertainties that influence the results of this study Since the main results concern differences between the two scenarios several of these factors loose on importance for the conclusions This comprises uncertainties in meteorology in future traffic volumes and in the population density distribution However there are some uncertainties that remain important The emission factors for E85 fuelled cars are much less characterised than what they are for petrol cars The emission of particles from E85 fuelled cars is especially uncertain with only very few published results Also the emissions of NMHC are somewhat uncertain and may be higher for E85 at lower ambient temperatures However the sensitivity analysis performed shows that for the studied region the NMHC emissions only have a small influence on the ozone concentrations
5 Conclusions
In this study the impact of tailpipe and evaporative emissions from E85 fuelled cars on air pollution and health risks are calculated and compared with petrol fuelled cars The scenario calculations for the Vaumlstra Goumltaland Region give data on emissions pollutant concentrations exposure and a health risk evaluation
The differences in emission factors between E85 and petrol lies in the emissions of PM and NOX which are about 65 and 58 for E85 relative petrol respectively Also the speciation of the emitted hydrocarbons is significantly different with large emissions of acetaldehyde and ethanol from E85 and large emissions of benzene higher aromatics alkanes and alkenes from petrol
These differences in emission factors reflect in differences in emissions The emission calculations for all Swedish road traffic show a decrease for the E85 scenario relative to the petrol scenario of 65 for NOX 34 for PM25 67 for benzene For acetaldehyde there is an increase of 770
The differences obtained from the TAPM modelling show decreased levels of NOX ozone and benzene with E85 and increased levels of acetaldehyde For the latter the increase may be up to 80 while NOX and ozone show decreases of up to a few per cent and a few tenths of per cent respectively
A comparison of emissions from ethanol and petrol fuelled cars IVL report B1962 Health risk assessment for Vaumlstra Goumltaland
25
The health risk assessment shows decreased health risks in the E85 scenario relative the all-petrol scenario due to the increased NOX exposure correlated with both preterm deaths and asthma However NOX may be mainly an exhaust indicator Smaller effects are expected from the changes in ozone acetaldehyde and benzene exposure The overall difference considering the exposure to PM acetaldehyde benzene and ozone is 16 preterm deaths with lower values for the E85 scenario
6 Acknowledgements
Saab Automobile The Swedish Transport Administration and The Foundation for the Swedish Environmental Research Institute are gratefully acknowledged for financial contribution
Magnus Ekstroumlm and Maria Holmstroumlm at Saab and Martin Juneholm at the Swedish Transport Administration are acknowledged for their most valuable input to the study
David Simpson Norwegian Meteorological Institute EMEP MSC-W Norway and Dept Radio amp Space Science Chalmers Univ Technol Sweden is gratefully acknowledged for help with implementation of the Unified EMEP model
A comparison of emissions from ethanol and petrol fuelled cars IVL report B1962 Health risk assessment for Vaumlstra Goumltaland
26
7 References
Altenstedt J Pleijel K 2000 An alternative approach to photochemical ozone creation potentials under European conditions J Air amp Waste Manage Assoc 50 1023 ndash 1036
Andre J-M (2005) Vehicle emission measurement collection of the ARTEMIS datatbase Artemis 3312 report Available from httpwwwinretsfrurltepublicationspublications-pdfJoumardA3312reportJMALTE0504pdf
Bachand A MMundt K A Mundt D JMontgomery R R Epidemiological studies of formaldehyde exposure and risk of leukemia and nasopharyngeal cancer A meta-analysis Critical Reviews in Toxicology 2010 40(2) 85ndash100
Beane Freeman L E Blair A Lubin J H Stewart P A Hayes R B Hoover R N Hauptmann M Mortality from lymphohematopoietic malignancies among workers in formaldehyde industries The National Cancer Institute Cohort J Natl Cancer Inst 2009101751ndash761
Bosetti C McLaughlin J K Tarone R E Pira E LaVecchia C Formaldehyde and cancer risk A quantitative review of cohort studies through 2006 Ann Oncol 20081929ndash43
ConcaweJRC Well-to-wheel studies httpiesjrceceuropaeuwtwhtml
Derwent R G Jenkin M E Saunders S M 1996 Photchemical ozone creation potentials for a large number of reactive hydrocarbons under European conditions Atmos Environ 30 181 ndash 199
Derwent RG Jenkin ME Passant NR Pilling MJ 2007 Photochemical ozone creation potentials (POCPs) for different emission sources of organic compounds under European conditions estimated with a Master Chemical Mechanism Atmos Env 41 2570ndash2579
EEA Copenhagen 2009 wwweeaeuropaeudata-and-mapsdatapopulation-density-disaggregated-with-corine-land-cover-2000-2
Ericsson P Holmstroumlm M Amberntsson-Carlsson A Ohlson C Skoglundh M Andersson B Carlsson P-A 2008 Characterization of particulate emissions and methodologhy for oxidation of particulates from non-diesel combustion ystems SAE Technical Paper Series 2008-01-1746
GAINS 2010 httpgainsiiasaacatindexphpgains-europe
Graham LA Belisle SL Baas C-L Emissions from light duty gasoline vehicles operating on low blend ethanol gasoline and E85 Atmospheric Environment 42 4498 (2008)
Haskew H M Thomas P E Liberty F 2006 Fuel Permeation From Automotive Systems E0 E6 E10 E20 And E85 Final Report CRC Project No E-65-3 Coordinating Research Council Inc 3650 Mansell RoadSuite 140Alpharetta GA 30022
HEI Air Toxics Review Panel (2007) Mobile-Source Air Toxics A Critical Review of the Literature on Exposure and Health Effects HEI Special Report 16 Health Effects Institute Boston USA
Hurley P TAPM v 4 User Manual 2008 CSIRO ISBN 978-1-921424-73-1
IARC (2006) IARC Monographs on the Evaluation of Carcinogenic Risks to Humans Wood Dusts and Formaldehyde Lyon World Health Organization International Agency for Research on Cancer Lyon France 8837ndash325
Jacobson M Z Effects of Ethanol (E85) versus Gasoline Vehicles on Cancer and Mortality in the United States Environ Sci Technol 2007414150-4157
A comparison of emissions from ethanol and petrol fuelled cars IVL report B1962 Health risk assessment for Vaumlstra Goumltaland
27
Jerret M Burnett R T Pope C A Ito K Thurston G Krewski D Shi Y Calle E Thun M Long-Term Ozone Exposure and Mortality N Engl J Med 20093601085-95
Lipman T E Delucchi M A 2002 Emissions of nitrous oxide and methane from conventional and alternative fuel motor vehicles Climate Change 53 477
Modig L Toreacuten K Janson C Jarvholm B Forsberg B Vehicle exhaust outside the home and onset of asthma among adults Eur Respir J 2009 Jun33(6)1261-7
Nafstad P Haheim L L Wisloff T Gram F Oftedal B Holme I Hjermann I Leren P Urban air pollution and mortality in a cohort of Norwegian men Environ Health Perspect 2004112(5)610-5
OEHHA (1999) Air Toxics Hot Spots Program Risk Assessment Guidelines Part II Technical Support Document for Describing Available Cancer Potency Factors Prepared by the Air Toxicology and Epidemiology Section Office of Environmental Health Hazard Assessment April 1999
Passant NR (2002) Speciation of UK emissions of non-methane volatile organic compounds AEAT report AEATENVR0545 Issue 1 Culham UK
Pope CA III Thun MJ Namboodiri MM Dockery DW Evans JS Speizer FE Heath CJ Particulate air pollution as a predictor of mortality in a prospective study of US adults Am J Resp Crit Care Med 1995 151 669-674
Seinfeld J H and Pandis SN (1998) Atmospheric Chemistry and Physics From Air Pollution to Climate Change John Wiley amp Sons New YorkSimpson D Fagerli H Jonson JE Tsyro S Wind P Tuovinen J -P 2003 Transboundary acidification and eutrophication and ground level ozone in Europe Unified EMEP Model Description EMEP Status Report 12003 Part I EMEPMSC-W Report The Norwegian Meteorological Institute Oslo Norway
US EPA (1999) httpwwwepagovttnatwnata1999nsata1999
Vestreng V et al 2004 Inventory Review 2004 Emission data reported to CLRTAP and the NEC Directive EMEPEEA Joint Review Report EMEPMSC-W Note 1
Westerholm R Ahlvik P Karlsson HL An exhaust characterisation study based on regulated and unregulated emissions from bi-fuel and flexi-fuel light-duty passanger cars fuelled by petrol (E5) bioethanol (E70 E75) and biogas tested at ambient temperatures of +22degC and -7degC 2008
Wolkoff P Nielsen G D Non-cancer effects of formaldehyde and relevance for setting an indoor air guideline Environment International 201036788ndash799
Yanowitz J McCormick RL Effect of E85 on tailpipe emissions from light-duty vehicles J Air amp Waste Manage Assoc 59 172 (2009)
A comparison of emissions from ethanol and petrol fuelled cars IVL report B1962 Health risk assessment for Vaumlstra Goumltaland
28
Appendix 1 Evaporate emissions of NMHC
The following assumptions are done for evaporative emissions The NMHC emissions from E85 are reduced relative to petrol by 45 Methane emissions are zero and the split of NMHC species is 68 ethanol and the remaining 32 is divided in the same way as evaporative emissions for petrol The estimates by Graham et al (2008) are missing evaporative emission data however these assumptions agrees very well with measurements of evaporative emissions due to fuel permeation reported by Haskew et al (2006) where NMHC emissions are reported to be reduced by 50 for E85 fuel compared to petrol Haskew et al also presents the NMHC split to species with 60 ethanol This number agrees quite well with our assumption of 68 NMHC being ethanol NMHC in exhaust and evaporative emissions are thus divided as in Table A1
Table A1 Division of NMHC in the exhaust and evaporative emissions for E85 and petrol respectively (wt)
E85 Petrol E85 Petrol exhaust exhaust evaporative evaporative
Ethanol 680 0 680 0 Acetaldehyde 131 08 02 0 Ethene 99 73 24 0 Ethyne 03 28 09 0 Formaldehyde 31 17 06 0 Benzene 16 56 18 10 13 Butadiene 03 09 03 0 sum 963 191 741 10
The remaining NMHC emissions are divided as for petrol (ref) and listed in Table A2
Table A2 Division of NMHC in the exhaust and evaporative emissions for E85 and petrol respectively (wt)
E85 Petrol E85 Petrol exhaust exhaust evaporative evaporative
Ethane 02 32 10 0 Alkanes (C3+) 13 278 89 880 Alkenes (C3+) 04 90 29 95 Aromatics (C7+) 18 388 125 15 Aldehydesketones (C3+)
01 15 05 0
A comparison of emissions from ethanol and petrol fuelled cars IVL report B1962 Health risk assessment for Vaumlstra Goumltaland
29
Appendix 2 Description of the model system
A21 Atmospheric lifetimes
Table A3 gives tropospheric lifetimes with regard to reaction of ethanol formaldehyde acetaldehyde and benzene (C6H6) with OH nitrate radical (NO3) and photolysis The studied organic species are listed together with three species common in the gasoline exhaust (benzene ethene and toluene) for comparison Table 11 shows also photochemical ozone creation potential (POCP) of these species POCP is a measure of amount of ozone that is formed from a certain VOC emission relatively to other emission source which has been established to the same emission mass of ethene (Derwent et al 1996 Altenstedt et al 2000) The range represents different scenarios for VOC and NOX background concentrations Derwent et al (2007) used similar methodology to calculate POCP of different VOC sources and calculated POCP of mean road emission exhaust to be 69
Table A3 Atmospheric lifetimes of studies NMVOC species with respect to the OH- and NO3- initiated
degradation τ(OH) and τ(NO3) and with respect to the photolysis (The lifetime of a chemical species which decays in a first-order process is the time needed for a concentration of this species to decrease to 1e of its original value Statistically it represents the mean life expectancy of an excited species) The OH concentration of 1times106 moleculescm3 typical for summer troposphere was used for the lifetime calculation The NO3 concentrations of 5 and 100 ppt(V) were used for lifetime calculations as representative of rural and urban night-time 12 hrs mean concentration The studied organic species are listed together with 3 species common in the gasoline exhaust for comparison The rates of photolysis were calculated with radiation transfer model for July 58ordm latitude and integrated over 24 hours
τ(OH) τ(NO3) urbanrural τ (photolysis) POCP
hr hr hr
Ethanol 85 56 1times103 - 44 - 63
Acetaldehyde 15 47 1times103 86 68 - 80
Formaldehyde 30 194 4times103 10 18 - 55
Benzene 214 - - 23 - 47
Ethene 34 - - 100
Toluene 50 - - 30 - 67
A22 Defining of boundary concentrations for TAPM from EMEP fields
Calculation of initial concentration field for TAPM from EMEP concentration field of NO2 (as example) and EMEP mean wind vector components u_mid and v_mid Two EMEP model gridcells (i=56 j=60 and i=56 j=61) represent the TAPM model domain and concentrations from the surrounding EMEP gridcells SE-S SE-N NW-S NW-N NE NW (Figure A1) are used for calculation of boundary concentration NO2(bc) according to the following code if u_mid lt= 0 then ( isite = SE-S and jsite = SE-N) else isite = NW-S and jsite = NW-N) endif
A comparison of emissions from ethanol and petrol fuelled cars IVL report B1962 Health risk assessment for Vaumlstra Goumltaland
30
if v_mid lt= 0 then ( ksite = NE) else ksite = SW endif NO2(bc) = [(NO2(isite)u_mid(isite) + NO2(jsite)u_mid(jsite))2 + NO2(ksite)v_mid(ksite)] [(u_mid(isite) + u_mid(jsite))2 + v_mid(ksite)]
Figure A1 Gridcells covering Gothenburg domain and its boundary in EMEP model plotted on latitude-
longitude coordinates The red square represents centre of Gothenburg and the blue line the coastline EMEP i and j coordinates for the boundary gridcells are SE-S = 57-60 SE-N = 57-61 NW-S = 55-60 NW-N = 55-61 NE = 56-62 NW = 56-59 and for Gothenburg grid cells are Gbg-NE = 56-61 Gbg-SW = 56-60
A23 Atmospheric chemistry
The role of secondary chemistry in for the concentration of acetaldehyde are studied by first excluding the primary acetaldehyde emissions from the EMEP model simulations of scenarios S1 and S2 and then by excluding all NMVOC emissions from the car category with spark ignition engines The contribution from the primary acetaldehyde emissions as well as the contribution of secondary acetaldehyde formed from other NMVOC to the total acetaldehyde concentration is then obtained However the secondary chemistry is highly nonlinear due to the interactions of NMVOCs with ozone and OH and thus the results for the contribution of secondary acetaldehyde are somewhat uncertain Differences in acetaldehyde concentrations between S1 and S2 scenarios are studied with respect to contribution of primary and secondary acetaldehyde It is observed that in summer background air the monthly mean contribution of the secondary acetaldehyde is of the same magnitude as the contribution of the primary acetaldehyde to the difference between S1 and
565
57
575
58
585
105 115 125 135 145
Long
Lat
Gbg-SW
Gbg-NE
SE-S
NW-N
NW-S
SE-N
SW
NE
55-59
57-59
55-62
A comparison of emissions from ethanol and petrol fuelled cars IVL report B1962 Health risk assessment for Vaumlstra Goumltaland
31
S2 In the winter and in more polluted atmosphere (Gothenburg grid cells) the contribution from secondary acetaldehyde to the concentration difference appears to be negative due to the chemistry feedback ie the E-85 scenario has less secondary acetaldehyde than the all-petrol scenario
A comparison of S2-S1 differences in primary and secondary acetaldehyde concentrations in the background (=upwind) and Gothenburg grid cells show no increase in the secondary acetaldehyde from upwind to the Gothenburg grid cell It can thus be concluded that there is no significant contribution from secondary aldehydes on the small scale (tenths of km) Conclusion from this sensitivity study is that the secondary formaldehyde can be of importance under summer in the clean background air but that formation on the local scale is unimportant Using EMEP simulated boundary concentrations of acetaldehyde in the local scale model and simulating the primary acetaldehyde emissions will capture the most important features of acetaldehyde dispersion and chemistry in Vaumlstra Goumltaland
In the EMEP model the tail-pipe PM emissions are specified as primary particles Emissions of NOX and VOCs (and NH3 SO2) are oxidised in the atmosphere and a part is then transferred through the gas-to-particle transport to the PM as secondary PM The petrol fuelled cars emit both more primary PM and more NOX compared to the E85 cars If we compare differences in primary and secondary PM between the S1 and S2 scenarios simulated by EMEP we can directly see what part of the difference is from the tail-pipe emissions of the primary particles and what part is from the formation of the secondary PM in atmosphere (mostly from higher emissions of NOX) Table A4 shows the differences between S1 and S2 (S1-S2) of monthly PM averages for January and June (two months with low and high photochemical activities respectively) It can be seen that the higher formation of secondary PM in the S1 (all-petrol) scenario is more important than the higher tail-pipe emission of primary PM by factor 10 - 20
When we compare simulated PM differences between S1-S2 for the background air (=upwind) grid cells and for grid cells including Gothenburg (50 km x 50 km scale) we can see significant increase in primary PM in the S1 scenario from the upwind grid cells to Gothenburg (746 in winter 132 in summer) while no systematic increase can be seen for the secondary PM (-42 in winter +24 in summer) From this comparison it can be concluded that no systematic increase in secondary PM can be seen (in difference from the primary PM) on the scale of 50-100 km and we can neglect this process on the small scale However the overall change in PM concentrations due to the switch of the fuel is very small both on the large scale and on the small scale as can be seen when the differences in PM concentrations between S1 and S2 are compared to absolute PM concentrations in S1 presented in the last column of Table A4
Table A4 Differences in primary and secondary PM concentrations between the lsquoAll-petrolrsquo (S1) and lsquoE-85rsquo (S2) scenarios simulated in gridcells upwind Gothenburg and in gridcells including Gothenburg (2 50 km x 50 km gridcells)
S1-S2 Background
S1-S2 Gothenburg
Increase S1-S2 Gothenburg
S1 Background
μgm3 μgm3 μgm3 bkgnd μgm3
Prim PM10 Jan 00008 00014 00006 746 084
Jun 00008 00018 00010 1319 084
Sec PM10 Jan 00155 00148 -00006
-42 157
Jun 00080 00081 00002 24 213
The sensitivity of the used emission factors for NMHC with respect to the ozone formation in the region of the Swedish West Coast can be analysed with the help of results from studying the
A comparison of emissions from ethanol and petrol fuelled cars IVL report B1962 Health risk assessment for Vaumlstra Goumltaland
32
formation of secondary acetaldehyde In this study first all primary acetaldehyde emitted by the E85 fleet are omitted in a model simulation (S2_nopAA) and secondly all NMHC emissions from the E-85 fleet are switched off (S2_noVOC) Acetaldehyde has a somewhat higher though still comparable photochemical ozone creation potential compared to ethanol (ethanol 44-63 acetaldehyde 68-80 Altenstedt and Pleijel 2000) and this simulation will thus also give information on the sensitivity of the calculations to uncertainties in the ethanol emissions Setting the emission factor for NMHC to zero gives the sensitivity to the emission factor of total NMHC Figure A2 shows the differences in ozone concentration as a result of acetaldehyde only and the total NMHC from the E85 car fleet (S2 scenario) We can see that the effect on ozone formation is very small for the Swedish West coast The reason is that the ozone formation in this area is controlled by the availability of NOX while NMHC or rather their degradation products the peroxy radicals that serve as a lsquofuelrsquo to ozone formation are usually in excess here and further VOC emissions do not increase ozone concentrations significantly The situation looks different in areas that are more heavily polluted with NOX andor which is limited in the availability of peroxy radicals The results from this sensitivity study are fully consistent with the observed increase in ozone concentrations as a result of lower NO emissions (the so-called ozone titration) only very close to the major roads but no larger-scale decrease in ozone concentrations in the Gothenburg area or in any other communities
Figure A2 Sensitivity of the ozone formation in the 2 EMEP model grid cells covering Gothenburg (blue) and in the 6 surrounding grid cells (red see Fig A1) to changes in NMHC emission factor of the E85 fuelled cars lsquobasersquo is simulation S2 with EF for NMHC as in Table 3 lsquonoVOCrsquo is S2 with EF for all NMHC = 0 lsquonopAArsquo is S2 with EF for acetaldehyde = 0 a ndash Mean sensitivity in January absolute difference in ozone formation in ppb(V) as a result of NMHC (base-noVOC) and acetaldehyde (base-nopAA) emissions b ndash Sensitivity relative to ozone concentration in the S2-base simulation January c ndash same as a) but June d ndash same as b) but June
‐002
‐001
0
001
base‐noVOC base‐nopAA
ΔO3(ppb)
a)
0
001
002
base‐noVOC base‐nopAA
ΔO
3(ppb)
c)
‐010
‐005
000
005
base‐noVOC base‐nopAA
ΔO
3
b)
000
002
004
006
base‐noVOC base‐nopAA
ΔO
3
d)
A comparison of emissions from ethanol and petrol fuelled cars IVL report B1962 Health risk assessment for Vaumlstra Goumltaland
33
Appendix 3 Emission results
The geographically distributed NOX and acetaldehyde emissions for the Vaumlstra Goumltaland region are presented in Figures A3 and A4 respectively
Figure A3 NOX emissions for the Vaumlstra Goumltaland region for the All Petrol scenario
A comparison of emissions from ethanol and petrol fuelled cars IVL report B1962 Health risk assessment for Vaumlstra Goumltaland
34
Figure A4 Acetaldehyde emissions for the Vaumlstra Goumltaland region for the All Ethanol scenario
A comparison of emissions from ethanol and petrol fuelled cars IVL report B1962 Health risk assessment for Vaumlstra Goumltaland
35
Appendix 4 Dispersion modelling results
The difference in yearly average concentration between scenario S1 and S2 for acetaldehyde and benzene can be seen in Figure A5 and Figure A6 respectively a)
b)
Figure A5 The difference in yearly average concentrations of acetaldehyde for 2020 between the all E85 (S2) and all petrol (S1) scenarios presented as a) microgm3 and as b) percentage for the Gothenburg area
A comparison of emissions from ethanol and petrol fuelled cars IVL report B1962 Health risk assessment for Vaumlstra Goumltaland
36
a)
b) all E85 c) all petrol
Figure A6 a) the difference in yearly average concentrations (gm3) of benzene for 2020 between the all E85 (S2) and all petrol (S1) scenarios yearly means for b) all E85 and c) all petrol (note the different scales)
The difference in the calculated NOX NO2 and ozone concentrations between the two scenarios are shown in Figures A7 A8 and A9
A comparison of emissions from ethanol and petrol fuelled cars IVL report B1962 Health risk assessment for Vaumlstra Goumltaland
37
a)
b)
Figure A7 The difference in yearly average concentrations of NOX for 2020 between the all E85 (S2) and all petrol (S1) scenarios presented as a) microgm3 and as b) percentage for the Gothenburg area
A comparison of emissions from ethanol and petrol fuelled cars IVL report B1962 Health risk assessment for Vaumlstra Goumltaland
38
a)
Figure A8 The difference in yearly average concentrations of NO2 for 2020 between the all E85 (S2) and all petrol (S1) scenarios presented as a) microgm3 and as b) percentage for the Gothenburg area
A comparison of emissions from ethanol and petrol fuelled cars IVL report B1962 Health risk assessment for Vaumlstra Goumltaland
39
a)
b)
Figure A9 The difference in yearly average concentrations of ozone for 2020 between the all E85 (S2) and all petrol (S1) scenarios presented as a) microgm3 and as b) percentage for mainly the Gothenburg area
A comparison of emissions from ethanol and petrol fuelled cars IVL report B1962 Health risk assessment for Vaumlstra Goumltaland
40
Appendix 5 Detailed Exposure data
Detailed exposure data for the difference between the all E85 (S2) and the all petrol (S1) scenarios can be found in Table A5
Table A5 Exposure data for the difference between the all E85 (S2) and the all petrol (S1) scenarios
Acetaldehyde diff E-P (microgm3)
Populated weighted mean
Number of people Percentage of population
0 - 01 627198 582 01 - 02 163394 152 02 - 03 134879 125 03 - 04 88099 82 04 - 05 38686 36 05 - 06 16880 16 06 - 07 7983 07 07 - 08 1248 01 Tot 014 1078367 Benzene diff E-P (microgm3)
Populated weighted mean
Number of people Percentage of population
-03 - -02 26680 25 -02 - -01 205757 191 -01 - -0 845930 784 Tot -0074 1078367 NO2 diff E-P (microgm3) Populated weighted
mean Number of people Percentage of
population -04 - -03 7698 07 -03 - -02 50131 46 -02 - -01 296288 275 -01 - -0 724250 672 Tot -009 1078367 NOX diff E-P (microgm3) Populated weighted
mean Number of people Percentage of
population -06 - -05 7698 -05 - -04 19639 18 -04 - -03 36626 34 -03 - -02 161685 150 -02 - -01 186500 173 -01 - -0 666219 618 Tot -012 1078367 O3 diff E-P (microgm3) Populated weighted
mean Number of people Percentage of
population -02 - -01 779132 723 -01 - -0 266417 247 0 - 01 32818 30 Tot -012 1078367
Exposure data for the total levels in the two scenarios can be found in Table A6
A comparison of emissions from ethanol and petrol fuelled cars IVL report B1962 Health risk assessment for Vaumlstra Goumltaland
41
Table A6 Exposure data for the total levels in the two scenarios
Acetaldehyde tot All ethanol (microgm3)
Populated weighted mean
Number of people Percentage of population
06 - 07 568825 527 07 - 08 171845 159 08 - 09 124551 115 09 - 10 100946 94 10 - 11 59235 55 11 - 12 30559 28 12 - 13 13175 12 13 - 14 7983 07 14 - 15 1248 01 Tot 077 1078367 Acetaldehyde tot All petrol (microgm3)
Populated weighted mean
Number of people Percentage of population
05 - 06 45111 42 06 - 07 1032008 957 07 - 08 1248 01 Tot 065 1078367 Benzene tot All ethanol (microgm3)
Populated weighted mean
Number of people Percentage of population
0 - 01 1055961 98 01 - 02 22406 2 Tot 005 1078367 Benzene tot All petrol (microgm3)
Populated weighted mean
Number of people Percentage of population
0 - 01 729093 676 01 - 02 232961 216 02 - 03 94042 87 03 - 04 21023 19 04 - 05 1248 01 Tot 010 1078367 NOX tot All ethanol (microgm3)
Populated weighted mean
Number of people Percentage of population
0-10 779108 722 10-20 254658 236 20-30 28683 27 30-40 11070 10 40-50 3426 03 50-60 0 00 60-70 0 00 70-80 639 01 80-90 0 00 90-100 0 00 100-110 783 01 Tot 84 1078367 NOX tot All petrol (microgm3)
Populated weighted mean
Number of people Percentage of population
0-10 769557 714 10-20 264209 245 20-30 28683 27 30-40 11070 10 40-50 3426 03 50-60 0 00
A comparison of emissions from ethanol and petrol fuelled cars IVL report B1962 Health risk assessment for Vaumlstra Goumltaland
42
60-70 0 00 70-80 639 01 80-90 0 00 90-100 0 00 100-110 783 01 Tot 85 1078367 O3 tot All ethanol (microgm3)
Populated weighted mean
Number of people Percentage of population
40-45 1422 01 45-50 26487 25 50-55 176636 164 55-60 770370 714 60-65 103452 96 Tot 569 1078367 O3 tot All petrol (microgm3)
Populated weighted mean
Number of people Percentage of population
40-45 1422 01 45-50 20229 19 50-55 181876 169 55-60 763361 708 60-65 111479 103 Tot 570 1078367 PM25 tot All ethanol (microgm3)
Populated weighted mean
Number of people Percentage of population
1-2 0 00 2-3 885325 821 3-4 192259 178 4-5 783 01 Tot 268 1078367 PM25 tot All petrol (microgm3)
Populated weighted mean
Number of people Percentage of population
1-2 0 00 2-3 868773 806 3-4 208811 194 4-5 783 01 Tot 270 1078367
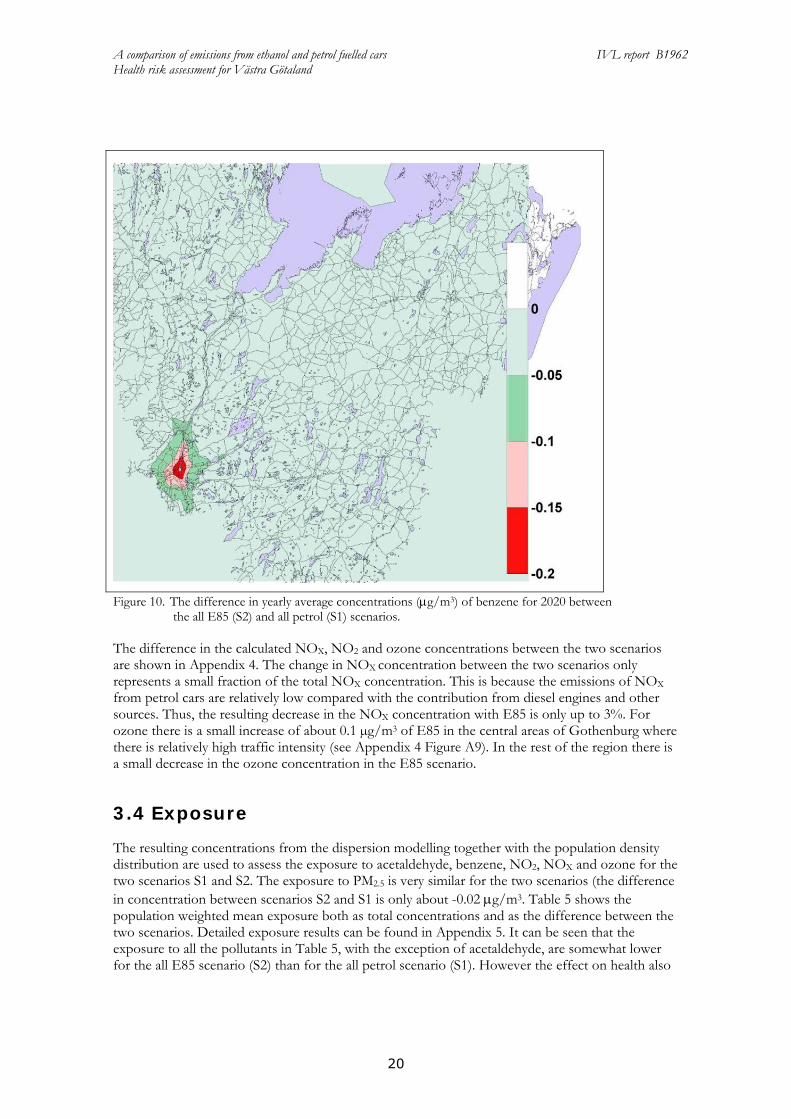
A comparison of emissions from ethanol and petrol fuelled cars IVL report B1962 Health risk assessment for Vaumlstra Goumltaland
23
353 Acetaldehyde
According to US EPA (1999) a lifetime risk for cancer of 0000002 per microgm3 is to be assumed for this potential human carcinogen An increase in the population mean exposure of 012 microgm3 corresponds to 026 cases more per year in the current population
354 Benzene
According to US EPA (1999) a lifetime risk for cancer (leukaemia) of 00000022-00000078 per microgm3 is to be assumed for this human carcinogen A decrease in the population mean exposure of 0074 microgm3 corresponds to approximately 03 cases less per year in the current population (assuming 0000004 per microgm3)
355 PM25
In CAFEacute and other impact assessments a relative risk of 6 increase in all-cause mortality per 10 microgm3 has usually been assumed Assuming this effect on the total mortality and a typical baseline mortality of 1000 deaths per 100 000 person years a decrease in the population mean exposure of 002 microgm3 corresponds to approximately 13 less preterm deaths per year
4 Discussion
In this study the health risks from a large introduction of E85 to replace petrol is analysed in scenario studies for 2020 for the Vaumlstra Goumltaland region It is found that the change in pollutant concentration exposure and health risks are small between the two scenarios It should be emphasized that the study only considers vehicle emissions and does not take into account effects from the fuel production
The emissions of NOX in the model are somewhat lower from E85 fuelled cars than from petrol fuelled cars This is in line with the emission factors used by Jacobson (2007) The nitrogen oxides are key substances in the atmospheric reactions determining the concentrations of ozone in air NOX is involved in the formation of ozone but close to the NO source the ozone concentration is lowered due to the rapid reactions between NO and O3 forming NO2 If NO is released in an environment with already high NO concentration it may result in lowering of ozone levels on the regional scale In the present study the ozone concentrations calculated are somewhat lower for the E85 scenario than for the petrol scenario
The health risk analysis shows that the main difference between the scenarios is due to the lower concentration of NOX However it may have been other exhaust components than NOX such as exhaust particles that were behind the reported association with mortality In cases when NOX is not a good indicator of exhaust particle emissions and their toxicity our results may be misleading This should be studied further Neglecting the effects of the changes in NOX exposure the total difference between the scenarios sums up to 16 preterm deaths per year with lower values for the E85 scenario while it would sum up to 12 less preterm deaths for the E85 scenario if the effect related to NOX were included Since there are no similar studier for the effect on mortality among those younger than 30-50 years of age we assume the same relative effect on mortality in all ages This makes only a small difference since the large majority of deaths occur in older groups
A comparison of emissions from ethanol and petrol fuelled cars IVL report B1962 Health risk assessment for Vaumlstra Goumltaland
24
The opposite result for the ozone concentration was obtained by Jacobson The reason for this discrepancy is that the Jacobson study concerns Los Angeles a region with high concentrations of pollutants while the study here concerns the Vaumlstra Goumltaland region with much less dense traffic and also lower concentrations of pollutants importantly NOX It is not unlikely that the effect that Jacobson report also would be found for large parts of Europe with higher traffic densities than in the Vaumlstra Goumltaland region
It is worth to emphasize that the major negative health effect in the Jacobson (2007) study is attributed to the increase in ozone concentration that is a result of the decrease of the NO emissions from E85 cars Directly after the emission NO reacts with ozone resulting in drop of the ozone concentration the so-called ozone titration commonly observed in many cities This NO does however form even higher quantities of ozone further downwind contributing to the general increase in the background ozone levels It is also precursor of NO2 secondary PM and other toxic species as eg PAN and hence reductions in NO emissions are never regarded as disbeneficial from the environmental viewpoint
There are of course several sources of uncertainties that influence the results of this study Since the main results concern differences between the two scenarios several of these factors loose on importance for the conclusions This comprises uncertainties in meteorology in future traffic volumes and in the population density distribution However there are some uncertainties that remain important The emission factors for E85 fuelled cars are much less characterised than what they are for petrol cars The emission of particles from E85 fuelled cars is especially uncertain with only very few published results Also the emissions of NMHC are somewhat uncertain and may be higher for E85 at lower ambient temperatures However the sensitivity analysis performed shows that for the studied region the NMHC emissions only have a small influence on the ozone concentrations
5 Conclusions
In this study the impact of tailpipe and evaporative emissions from E85 fuelled cars on air pollution and health risks are calculated and compared with petrol fuelled cars The scenario calculations for the Vaumlstra Goumltaland Region give data on emissions pollutant concentrations exposure and a health risk evaluation
The differences in emission factors between E85 and petrol lies in the emissions of PM and NOX which are about 65 and 58 for E85 relative petrol respectively Also the speciation of the emitted hydrocarbons is significantly different with large emissions of acetaldehyde and ethanol from E85 and large emissions of benzene higher aromatics alkanes and alkenes from petrol
These differences in emission factors reflect in differences in emissions The emission calculations for all Swedish road traffic show a decrease for the E85 scenario relative to the petrol scenario of 65 for NOX 34 for PM25 67 for benzene For acetaldehyde there is an increase of 770
The differences obtained from the TAPM modelling show decreased levels of NOX ozone and benzene with E85 and increased levels of acetaldehyde For the latter the increase may be up to 80 while NOX and ozone show decreases of up to a few per cent and a few tenths of per cent respectively
A comparison of emissions from ethanol and petrol fuelled cars IVL report B1962 Health risk assessment for Vaumlstra Goumltaland
25
The health risk assessment shows decreased health risks in the E85 scenario relative the all-petrol scenario due to the increased NOX exposure correlated with both preterm deaths and asthma However NOX may be mainly an exhaust indicator Smaller effects are expected from the changes in ozone acetaldehyde and benzene exposure The overall difference considering the exposure to PM acetaldehyde benzene and ozone is 16 preterm deaths with lower values for the E85 scenario
6 Acknowledgements
Saab Automobile The Swedish Transport Administration and The Foundation for the Swedish Environmental Research Institute are gratefully acknowledged for financial contribution
Magnus Ekstroumlm and Maria Holmstroumlm at Saab and Martin Juneholm at the Swedish Transport Administration are acknowledged for their most valuable input to the study
David Simpson Norwegian Meteorological Institute EMEP MSC-W Norway and Dept Radio amp Space Science Chalmers Univ Technol Sweden is gratefully acknowledged for help with implementation of the Unified EMEP model
A comparison of emissions from ethanol and petrol fuelled cars IVL report B1962 Health risk assessment for Vaumlstra Goumltaland
26
7 References
Altenstedt J Pleijel K 2000 An alternative approach to photochemical ozone creation potentials under European conditions J Air amp Waste Manage Assoc 50 1023 ndash 1036
Andre J-M (2005) Vehicle emission measurement collection of the ARTEMIS datatbase Artemis 3312 report Available from httpwwwinretsfrurltepublicationspublications-pdfJoumardA3312reportJMALTE0504pdf
Bachand A MMundt K A Mundt D JMontgomery R R Epidemiological studies of formaldehyde exposure and risk of leukemia and nasopharyngeal cancer A meta-analysis Critical Reviews in Toxicology 2010 40(2) 85ndash100
Beane Freeman L E Blair A Lubin J H Stewart P A Hayes R B Hoover R N Hauptmann M Mortality from lymphohematopoietic malignancies among workers in formaldehyde industries The National Cancer Institute Cohort J Natl Cancer Inst 2009101751ndash761
Bosetti C McLaughlin J K Tarone R E Pira E LaVecchia C Formaldehyde and cancer risk A quantitative review of cohort studies through 2006 Ann Oncol 20081929ndash43
ConcaweJRC Well-to-wheel studies httpiesjrceceuropaeuwtwhtml
Derwent R G Jenkin M E Saunders S M 1996 Photchemical ozone creation potentials for a large number of reactive hydrocarbons under European conditions Atmos Environ 30 181 ndash 199
Derwent RG Jenkin ME Passant NR Pilling MJ 2007 Photochemical ozone creation potentials (POCPs) for different emission sources of organic compounds under European conditions estimated with a Master Chemical Mechanism Atmos Env 41 2570ndash2579
EEA Copenhagen 2009 wwweeaeuropaeudata-and-mapsdatapopulation-density-disaggregated-with-corine-land-cover-2000-2
Ericsson P Holmstroumlm M Amberntsson-Carlsson A Ohlson C Skoglundh M Andersson B Carlsson P-A 2008 Characterization of particulate emissions and methodologhy for oxidation of particulates from non-diesel combustion ystems SAE Technical Paper Series 2008-01-1746
GAINS 2010 httpgainsiiasaacatindexphpgains-europe
Graham LA Belisle SL Baas C-L Emissions from light duty gasoline vehicles operating on low blend ethanol gasoline and E85 Atmospheric Environment 42 4498 (2008)
Haskew H M Thomas P E Liberty F 2006 Fuel Permeation From Automotive Systems E0 E6 E10 E20 And E85 Final Report CRC Project No E-65-3 Coordinating Research Council Inc 3650 Mansell RoadSuite 140Alpharetta GA 30022
HEI Air Toxics Review Panel (2007) Mobile-Source Air Toxics A Critical Review of the Literature on Exposure and Health Effects HEI Special Report 16 Health Effects Institute Boston USA
Hurley P TAPM v 4 User Manual 2008 CSIRO ISBN 978-1-921424-73-1
IARC (2006) IARC Monographs on the Evaluation of Carcinogenic Risks to Humans Wood Dusts and Formaldehyde Lyon World Health Organization International Agency for Research on Cancer Lyon France 8837ndash325
Jacobson M Z Effects of Ethanol (E85) versus Gasoline Vehicles on Cancer and Mortality in the United States Environ Sci Technol 2007414150-4157
A comparison of emissions from ethanol and petrol fuelled cars IVL report B1962 Health risk assessment for Vaumlstra Goumltaland
27
Jerret M Burnett R T Pope C A Ito K Thurston G Krewski D Shi Y Calle E Thun M Long-Term Ozone Exposure and Mortality N Engl J Med 20093601085-95
Lipman T E Delucchi M A 2002 Emissions of nitrous oxide and methane from conventional and alternative fuel motor vehicles Climate Change 53 477
Modig L Toreacuten K Janson C Jarvholm B Forsberg B Vehicle exhaust outside the home and onset of asthma among adults Eur Respir J 2009 Jun33(6)1261-7
Nafstad P Haheim L L Wisloff T Gram F Oftedal B Holme I Hjermann I Leren P Urban air pollution and mortality in a cohort of Norwegian men Environ Health Perspect 2004112(5)610-5
OEHHA (1999) Air Toxics Hot Spots Program Risk Assessment Guidelines Part II Technical Support Document for Describing Available Cancer Potency Factors Prepared by the Air Toxicology and Epidemiology Section Office of Environmental Health Hazard Assessment April 1999
Passant NR (2002) Speciation of UK emissions of non-methane volatile organic compounds AEAT report AEATENVR0545 Issue 1 Culham UK
Pope CA III Thun MJ Namboodiri MM Dockery DW Evans JS Speizer FE Heath CJ Particulate air pollution as a predictor of mortality in a prospective study of US adults Am J Resp Crit Care Med 1995 151 669-674
Seinfeld J H and Pandis SN (1998) Atmospheric Chemistry and Physics From Air Pollution to Climate Change John Wiley amp Sons New YorkSimpson D Fagerli H Jonson JE Tsyro S Wind P Tuovinen J -P 2003 Transboundary acidification and eutrophication and ground level ozone in Europe Unified EMEP Model Description EMEP Status Report 12003 Part I EMEPMSC-W Report The Norwegian Meteorological Institute Oslo Norway
US EPA (1999) httpwwwepagovttnatwnata1999nsata1999
Vestreng V et al 2004 Inventory Review 2004 Emission data reported to CLRTAP and the NEC Directive EMEPEEA Joint Review Report EMEPMSC-W Note 1
Westerholm R Ahlvik P Karlsson HL An exhaust characterisation study based on regulated and unregulated emissions from bi-fuel and flexi-fuel light-duty passanger cars fuelled by petrol (E5) bioethanol (E70 E75) and biogas tested at ambient temperatures of +22degC and -7degC 2008
Wolkoff P Nielsen G D Non-cancer effects of formaldehyde and relevance for setting an indoor air guideline Environment International 201036788ndash799
Yanowitz J McCormick RL Effect of E85 on tailpipe emissions from light-duty vehicles J Air amp Waste Manage Assoc 59 172 (2009)
A comparison of emissions from ethanol and petrol fuelled cars IVL report B1962 Health risk assessment for Vaumlstra Goumltaland
28
Appendix 1 Evaporate emissions of NMHC
The following assumptions are done for evaporative emissions The NMHC emissions from E85 are reduced relative to petrol by 45 Methane emissions are zero and the split of NMHC species is 68 ethanol and the remaining 32 is divided in the same way as evaporative emissions for petrol The estimates by Graham et al (2008) are missing evaporative emission data however these assumptions agrees very well with measurements of evaporative emissions due to fuel permeation reported by Haskew et al (2006) where NMHC emissions are reported to be reduced by 50 for E85 fuel compared to petrol Haskew et al also presents the NMHC split to species with 60 ethanol This number agrees quite well with our assumption of 68 NMHC being ethanol NMHC in exhaust and evaporative emissions are thus divided as in Table A1
Table A1 Division of NMHC in the exhaust and evaporative emissions for E85 and petrol respectively (wt)
E85 Petrol E85 Petrol exhaust exhaust evaporative evaporative
Ethanol 680 0 680 0 Acetaldehyde 131 08 02 0 Ethene 99 73 24 0 Ethyne 03 28 09 0 Formaldehyde 31 17 06 0 Benzene 16 56 18 10 13 Butadiene 03 09 03 0 sum 963 191 741 10
The remaining NMHC emissions are divided as for petrol (ref) and listed in Table A2
Table A2 Division of NMHC in the exhaust and evaporative emissions for E85 and petrol respectively (wt)
E85 Petrol E85 Petrol exhaust exhaust evaporative evaporative
Ethane 02 32 10 0 Alkanes (C3+) 13 278 89 880 Alkenes (C3+) 04 90 29 95 Aromatics (C7+) 18 388 125 15 Aldehydesketones (C3+)
01 15 05 0
A comparison of emissions from ethanol and petrol fuelled cars IVL report B1962 Health risk assessment for Vaumlstra Goumltaland
29
Appendix 2 Description of the model system
A21 Atmospheric lifetimes
Table A3 gives tropospheric lifetimes with regard to reaction of ethanol formaldehyde acetaldehyde and benzene (C6H6) with OH nitrate radical (NO3) and photolysis The studied organic species are listed together with three species common in the gasoline exhaust (benzene ethene and toluene) for comparison Table 11 shows also photochemical ozone creation potential (POCP) of these species POCP is a measure of amount of ozone that is formed from a certain VOC emission relatively to other emission source which has been established to the same emission mass of ethene (Derwent et al 1996 Altenstedt et al 2000) The range represents different scenarios for VOC and NOX background concentrations Derwent et al (2007) used similar methodology to calculate POCP of different VOC sources and calculated POCP of mean road emission exhaust to be 69
Table A3 Atmospheric lifetimes of studies NMVOC species with respect to the OH- and NO3- initiated
degradation τ(OH) and τ(NO3) and with respect to the photolysis (The lifetime of a chemical species which decays in a first-order process is the time needed for a concentration of this species to decrease to 1e of its original value Statistically it represents the mean life expectancy of an excited species) The OH concentration of 1times106 moleculescm3 typical for summer troposphere was used for the lifetime calculation The NO3 concentrations of 5 and 100 ppt(V) were used for lifetime calculations as representative of rural and urban night-time 12 hrs mean concentration The studied organic species are listed together with 3 species common in the gasoline exhaust for comparison The rates of photolysis were calculated with radiation transfer model for July 58ordm latitude and integrated over 24 hours
τ(OH) τ(NO3) urbanrural τ (photolysis) POCP
hr hr hr
Ethanol 85 56 1times103 - 44 - 63
Acetaldehyde 15 47 1times103 86 68 - 80
Formaldehyde 30 194 4times103 10 18 - 55
Benzene 214 - - 23 - 47
Ethene 34 - - 100
Toluene 50 - - 30 - 67
A22 Defining of boundary concentrations for TAPM from EMEP fields
Calculation of initial concentration field for TAPM from EMEP concentration field of NO2 (as example) and EMEP mean wind vector components u_mid and v_mid Two EMEP model gridcells (i=56 j=60 and i=56 j=61) represent the TAPM model domain and concentrations from the surrounding EMEP gridcells SE-S SE-N NW-S NW-N NE NW (Figure A1) are used for calculation of boundary concentration NO2(bc) according to the following code if u_mid lt= 0 then ( isite = SE-S and jsite = SE-N) else isite = NW-S and jsite = NW-N) endif
A comparison of emissions from ethanol and petrol fuelled cars IVL report B1962 Health risk assessment for Vaumlstra Goumltaland
30
if v_mid lt= 0 then ( ksite = NE) else ksite = SW endif NO2(bc) = [(NO2(isite)u_mid(isite) + NO2(jsite)u_mid(jsite))2 + NO2(ksite)v_mid(ksite)] [(u_mid(isite) + u_mid(jsite))2 + v_mid(ksite)]
Figure A1 Gridcells covering Gothenburg domain and its boundary in EMEP model plotted on latitude-
longitude coordinates The red square represents centre of Gothenburg and the blue line the coastline EMEP i and j coordinates for the boundary gridcells are SE-S = 57-60 SE-N = 57-61 NW-S = 55-60 NW-N = 55-61 NE = 56-62 NW = 56-59 and for Gothenburg grid cells are Gbg-NE = 56-61 Gbg-SW = 56-60
A23 Atmospheric chemistry
The role of secondary chemistry in for the concentration of acetaldehyde are studied by first excluding the primary acetaldehyde emissions from the EMEP model simulations of scenarios S1 and S2 and then by excluding all NMVOC emissions from the car category with spark ignition engines The contribution from the primary acetaldehyde emissions as well as the contribution of secondary acetaldehyde formed from other NMVOC to the total acetaldehyde concentration is then obtained However the secondary chemistry is highly nonlinear due to the interactions of NMVOCs with ozone and OH and thus the results for the contribution of secondary acetaldehyde are somewhat uncertain Differences in acetaldehyde concentrations between S1 and S2 scenarios are studied with respect to contribution of primary and secondary acetaldehyde It is observed that in summer background air the monthly mean contribution of the secondary acetaldehyde is of the same magnitude as the contribution of the primary acetaldehyde to the difference between S1 and
565
57
575
58
585
105 115 125 135 145
Long
Lat
Gbg-SW
Gbg-NE
SE-S
NW-N
NW-S
SE-N
SW
NE
55-59
57-59
55-62
A comparison of emissions from ethanol and petrol fuelled cars IVL report B1962 Health risk assessment for Vaumlstra Goumltaland
31
S2 In the winter and in more polluted atmosphere (Gothenburg grid cells) the contribution from secondary acetaldehyde to the concentration difference appears to be negative due to the chemistry feedback ie the E-85 scenario has less secondary acetaldehyde than the all-petrol scenario
A comparison of S2-S1 differences in primary and secondary acetaldehyde concentrations in the background (=upwind) and Gothenburg grid cells show no increase in the secondary acetaldehyde from upwind to the Gothenburg grid cell It can thus be concluded that there is no significant contribution from secondary aldehydes on the small scale (tenths of km) Conclusion from this sensitivity study is that the secondary formaldehyde can be of importance under summer in the clean background air but that formation on the local scale is unimportant Using EMEP simulated boundary concentrations of acetaldehyde in the local scale model and simulating the primary acetaldehyde emissions will capture the most important features of acetaldehyde dispersion and chemistry in Vaumlstra Goumltaland
In the EMEP model the tail-pipe PM emissions are specified as primary particles Emissions of NOX and VOCs (and NH3 SO2) are oxidised in the atmosphere and a part is then transferred through the gas-to-particle transport to the PM as secondary PM The petrol fuelled cars emit both more primary PM and more NOX compared to the E85 cars If we compare differences in primary and secondary PM between the S1 and S2 scenarios simulated by EMEP we can directly see what part of the difference is from the tail-pipe emissions of the primary particles and what part is from the formation of the secondary PM in atmosphere (mostly from higher emissions of NOX) Table A4 shows the differences between S1 and S2 (S1-S2) of monthly PM averages for January and June (two months with low and high photochemical activities respectively) It can be seen that the higher formation of secondary PM in the S1 (all-petrol) scenario is more important than the higher tail-pipe emission of primary PM by factor 10 - 20
When we compare simulated PM differences between S1-S2 for the background air (=upwind) grid cells and for grid cells including Gothenburg (50 km x 50 km scale) we can see significant increase in primary PM in the S1 scenario from the upwind grid cells to Gothenburg (746 in winter 132 in summer) while no systematic increase can be seen for the secondary PM (-42 in winter +24 in summer) From this comparison it can be concluded that no systematic increase in secondary PM can be seen (in difference from the primary PM) on the scale of 50-100 km and we can neglect this process on the small scale However the overall change in PM concentrations due to the switch of the fuel is very small both on the large scale and on the small scale as can be seen when the differences in PM concentrations between S1 and S2 are compared to absolute PM concentrations in S1 presented in the last column of Table A4
Table A4 Differences in primary and secondary PM concentrations between the lsquoAll-petrolrsquo (S1) and lsquoE-85rsquo (S2) scenarios simulated in gridcells upwind Gothenburg and in gridcells including Gothenburg (2 50 km x 50 km gridcells)
S1-S2 Background
S1-S2 Gothenburg
Increase S1-S2 Gothenburg
S1 Background
μgm3 μgm3 μgm3 bkgnd μgm3
Prim PM10 Jan 00008 00014 00006 746 084
Jun 00008 00018 00010 1319 084
Sec PM10 Jan 00155 00148 -00006
-42 157
Jun 00080 00081 00002 24 213
The sensitivity of the used emission factors for NMHC with respect to the ozone formation in the region of the Swedish West Coast can be analysed with the help of results from studying the
A comparison of emissions from ethanol and petrol fuelled cars IVL report B1962 Health risk assessment for Vaumlstra Goumltaland
32
formation of secondary acetaldehyde In this study first all primary acetaldehyde emitted by the E85 fleet are omitted in a model simulation (S2_nopAA) and secondly all NMHC emissions from the E-85 fleet are switched off (S2_noVOC) Acetaldehyde has a somewhat higher though still comparable photochemical ozone creation potential compared to ethanol (ethanol 44-63 acetaldehyde 68-80 Altenstedt and Pleijel 2000) and this simulation will thus also give information on the sensitivity of the calculations to uncertainties in the ethanol emissions Setting the emission factor for NMHC to zero gives the sensitivity to the emission factor of total NMHC Figure A2 shows the differences in ozone concentration as a result of acetaldehyde only and the total NMHC from the E85 car fleet (S2 scenario) We can see that the effect on ozone formation is very small for the Swedish West coast The reason is that the ozone formation in this area is controlled by the availability of NOX while NMHC or rather their degradation products the peroxy radicals that serve as a lsquofuelrsquo to ozone formation are usually in excess here and further VOC emissions do not increase ozone concentrations significantly The situation looks different in areas that are more heavily polluted with NOX andor which is limited in the availability of peroxy radicals The results from this sensitivity study are fully consistent with the observed increase in ozone concentrations as a result of lower NO emissions (the so-called ozone titration) only very close to the major roads but no larger-scale decrease in ozone concentrations in the Gothenburg area or in any other communities
Figure A2 Sensitivity of the ozone formation in the 2 EMEP model grid cells covering Gothenburg (blue) and in the 6 surrounding grid cells (red see Fig A1) to changes in NMHC emission factor of the E85 fuelled cars lsquobasersquo is simulation S2 with EF for NMHC as in Table 3 lsquonoVOCrsquo is S2 with EF for all NMHC = 0 lsquonopAArsquo is S2 with EF for acetaldehyde = 0 a ndash Mean sensitivity in January absolute difference in ozone formation in ppb(V) as a result of NMHC (base-noVOC) and acetaldehyde (base-nopAA) emissions b ndash Sensitivity relative to ozone concentration in the S2-base simulation January c ndash same as a) but June d ndash same as b) but June
‐002
‐001
0
001
base‐noVOC base‐nopAA
ΔO3(ppb)
a)
0
001
002
base‐noVOC base‐nopAA
ΔO
3(ppb)
c)
‐010
‐005
000
005
base‐noVOC base‐nopAA
ΔO
3
b)
000
002
004
006
base‐noVOC base‐nopAA
ΔO
3
d)
A comparison of emissions from ethanol and petrol fuelled cars IVL report B1962 Health risk assessment for Vaumlstra Goumltaland
33
Appendix 3 Emission results
The geographically distributed NOX and acetaldehyde emissions for the Vaumlstra Goumltaland region are presented in Figures A3 and A4 respectively
Figure A3 NOX emissions for the Vaumlstra Goumltaland region for the All Petrol scenario
A comparison of emissions from ethanol and petrol fuelled cars IVL report B1962 Health risk assessment for Vaumlstra Goumltaland
34
Figure A4 Acetaldehyde emissions for the Vaumlstra Goumltaland region for the All Ethanol scenario
A comparison of emissions from ethanol and petrol fuelled cars IVL report B1962 Health risk assessment for Vaumlstra Goumltaland
35
Appendix 4 Dispersion modelling results
The difference in yearly average concentration between scenario S1 and S2 for acetaldehyde and benzene can be seen in Figure A5 and Figure A6 respectively a)
b)
Figure A5 The difference in yearly average concentrations of acetaldehyde for 2020 between the all E85 (S2) and all petrol (S1) scenarios presented as a) microgm3 and as b) percentage for the Gothenburg area
A comparison of emissions from ethanol and petrol fuelled cars IVL report B1962 Health risk assessment for Vaumlstra Goumltaland
36
a)
b) all E85 c) all petrol
Figure A6 a) the difference in yearly average concentrations (gm3) of benzene for 2020 between the all E85 (S2) and all petrol (S1) scenarios yearly means for b) all E85 and c) all petrol (note the different scales)
The difference in the calculated NOX NO2 and ozone concentrations between the two scenarios are shown in Figures A7 A8 and A9
A comparison of emissions from ethanol and petrol fuelled cars IVL report B1962 Health risk assessment for Vaumlstra Goumltaland
37
a)
b)
Figure A7 The difference in yearly average concentrations of NOX for 2020 between the all E85 (S2) and all petrol (S1) scenarios presented as a) microgm3 and as b) percentage for the Gothenburg area
A comparison of emissions from ethanol and petrol fuelled cars IVL report B1962 Health risk assessment for Vaumlstra Goumltaland
38
a)
Figure A8 The difference in yearly average concentrations of NO2 for 2020 between the all E85 (S2) and all petrol (S1) scenarios presented as a) microgm3 and as b) percentage for the Gothenburg area
A comparison of emissions from ethanol and petrol fuelled cars IVL report B1962 Health risk assessment for Vaumlstra Goumltaland
39
a)
b)
Figure A9 The difference in yearly average concentrations of ozone for 2020 between the all E85 (S2) and all petrol (S1) scenarios presented as a) microgm3 and as b) percentage for mainly the Gothenburg area
A comparison of emissions from ethanol and petrol fuelled cars IVL report B1962 Health risk assessment for Vaumlstra Goumltaland
40
Appendix 5 Detailed Exposure data
Detailed exposure data for the difference between the all E85 (S2) and the all petrol (S1) scenarios can be found in Table A5
Table A5 Exposure data for the difference between the all E85 (S2) and the all petrol (S1) scenarios
Acetaldehyde diff E-P (microgm3)
Populated weighted mean
Number of people Percentage of population
0 - 01 627198 582 01 - 02 163394 152 02 - 03 134879 125 03 - 04 88099 82 04 - 05 38686 36 05 - 06 16880 16 06 - 07 7983 07 07 - 08 1248 01 Tot 014 1078367 Benzene diff E-P (microgm3)
Populated weighted mean
Number of people Percentage of population
-03 - -02 26680 25 -02 - -01 205757 191 -01 - -0 845930 784 Tot -0074 1078367 NO2 diff E-P (microgm3) Populated weighted
mean Number of people Percentage of
population -04 - -03 7698 07 -03 - -02 50131 46 -02 - -01 296288 275 -01 - -0 724250 672 Tot -009 1078367 NOX diff E-P (microgm3) Populated weighted
mean Number of people Percentage of
population -06 - -05 7698 -05 - -04 19639 18 -04 - -03 36626 34 -03 - -02 161685 150 -02 - -01 186500 173 -01 - -0 666219 618 Tot -012 1078367 O3 diff E-P (microgm3) Populated weighted
mean Number of people Percentage of
population -02 - -01 779132 723 -01 - -0 266417 247 0 - 01 32818 30 Tot -012 1078367
Exposure data for the total levels in the two scenarios can be found in Table A6
A comparison of emissions from ethanol and petrol fuelled cars IVL report B1962 Health risk assessment for Vaumlstra Goumltaland
41
Table A6 Exposure data for the total levels in the two scenarios
Acetaldehyde tot All ethanol (microgm3)
Populated weighted mean
Number of people Percentage of population
06 - 07 568825 527 07 - 08 171845 159 08 - 09 124551 115 09 - 10 100946 94 10 - 11 59235 55 11 - 12 30559 28 12 - 13 13175 12 13 - 14 7983 07 14 - 15 1248 01 Tot 077 1078367 Acetaldehyde tot All petrol (microgm3)
Populated weighted mean
Number of people Percentage of population
05 - 06 45111 42 06 - 07 1032008 957 07 - 08 1248 01 Tot 065 1078367 Benzene tot All ethanol (microgm3)
Populated weighted mean
Number of people Percentage of population
0 - 01 1055961 98 01 - 02 22406 2 Tot 005 1078367 Benzene tot All petrol (microgm3)
Populated weighted mean
Number of people Percentage of population
0 - 01 729093 676 01 - 02 232961 216 02 - 03 94042 87 03 - 04 21023 19 04 - 05 1248 01 Tot 010 1078367 NOX tot All ethanol (microgm3)
Populated weighted mean
Number of people Percentage of population
0-10 779108 722 10-20 254658 236 20-30 28683 27 30-40 11070 10 40-50 3426 03 50-60 0 00 60-70 0 00 70-80 639 01 80-90 0 00 90-100 0 00 100-110 783 01 Tot 84 1078367 NOX tot All petrol (microgm3)
Populated weighted mean
Number of people Percentage of population
0-10 769557 714 10-20 264209 245 20-30 28683 27 30-40 11070 10 40-50 3426 03 50-60 0 00
A comparison of emissions from ethanol and petrol fuelled cars IVL report B1962 Health risk assessment for Vaumlstra Goumltaland
42
60-70 0 00 70-80 639 01 80-90 0 00 90-100 0 00 100-110 783 01 Tot 85 1078367 O3 tot All ethanol (microgm3)
Populated weighted mean
Number of people Percentage of population
40-45 1422 01 45-50 26487 25 50-55 176636 164 55-60 770370 714 60-65 103452 96 Tot 569 1078367 O3 tot All petrol (microgm3)
Populated weighted mean
Number of people Percentage of population
40-45 1422 01 45-50 20229 19 50-55 181876 169 55-60 763361 708 60-65 111479 103 Tot 570 1078367 PM25 tot All ethanol (microgm3)
Populated weighted mean
Number of people Percentage of population
1-2 0 00 2-3 885325 821 3-4 192259 178 4-5 783 01 Tot 268 1078367 PM25 tot All petrol (microgm3)
Populated weighted mean
Number of people Percentage of population
1-2 0 00 2-3 868773 806 3-4 208811 194 4-5 783 01 Tot 270 1078367
A comparison of emissions from ethanol and petrol fuelled cars IVL report B1962 Health risk assessment for Vaumlstra Goumltaland
24
The opposite result for the ozone concentration was obtained by Jacobson The reason for this discrepancy is that the Jacobson study concerns Los Angeles a region with high concentrations of pollutants while the study here concerns the Vaumlstra Goumltaland region with much less dense traffic and also lower concentrations of pollutants importantly NOX It is not unlikely that the effect that Jacobson report also would be found for large parts of Europe with higher traffic densities than in the Vaumlstra Goumltaland region
It is worth to emphasize that the major negative health effect in the Jacobson (2007) study is attributed to the increase in ozone concentration that is a result of the decrease of the NO emissions from E85 cars Directly after the emission NO reacts with ozone resulting in drop of the ozone concentration the so-called ozone titration commonly observed in many cities This NO does however form even higher quantities of ozone further downwind contributing to the general increase in the background ozone levels It is also precursor of NO2 secondary PM and other toxic species as eg PAN and hence reductions in NO emissions are never regarded as disbeneficial from the environmental viewpoint
There are of course several sources of uncertainties that influence the results of this study Since the main results concern differences between the two scenarios several of these factors loose on importance for the conclusions This comprises uncertainties in meteorology in future traffic volumes and in the population density distribution However there are some uncertainties that remain important The emission factors for E85 fuelled cars are much less characterised than what they are for petrol cars The emission of particles from E85 fuelled cars is especially uncertain with only very few published results Also the emissions of NMHC are somewhat uncertain and may be higher for E85 at lower ambient temperatures However the sensitivity analysis performed shows that for the studied region the NMHC emissions only have a small influence on the ozone concentrations
5 Conclusions
In this study the impact of tailpipe and evaporative emissions from E85 fuelled cars on air pollution and health risks are calculated and compared with petrol fuelled cars The scenario calculations for the Vaumlstra Goumltaland Region give data on emissions pollutant concentrations exposure and a health risk evaluation
The differences in emission factors between E85 and petrol lies in the emissions of PM and NOX which are about 65 and 58 for E85 relative petrol respectively Also the speciation of the emitted hydrocarbons is significantly different with large emissions of acetaldehyde and ethanol from E85 and large emissions of benzene higher aromatics alkanes and alkenes from petrol
These differences in emission factors reflect in differences in emissions The emission calculations for all Swedish road traffic show a decrease for the E85 scenario relative to the petrol scenario of 65 for NOX 34 for PM25 67 for benzene For acetaldehyde there is an increase of 770
The differences obtained from the TAPM modelling show decreased levels of NOX ozone and benzene with E85 and increased levels of acetaldehyde For the latter the increase may be up to 80 while NOX and ozone show decreases of up to a few per cent and a few tenths of per cent respectively
A comparison of emissions from ethanol and petrol fuelled cars IVL report B1962 Health risk assessment for Vaumlstra Goumltaland
25
The health risk assessment shows decreased health risks in the E85 scenario relative the all-petrol scenario due to the increased NOX exposure correlated with both preterm deaths and asthma However NOX may be mainly an exhaust indicator Smaller effects are expected from the changes in ozone acetaldehyde and benzene exposure The overall difference considering the exposure to PM acetaldehyde benzene and ozone is 16 preterm deaths with lower values for the E85 scenario
6 Acknowledgements
Saab Automobile The Swedish Transport Administration and The Foundation for the Swedish Environmental Research Institute are gratefully acknowledged for financial contribution
Magnus Ekstroumlm and Maria Holmstroumlm at Saab and Martin Juneholm at the Swedish Transport Administration are acknowledged for their most valuable input to the study
David Simpson Norwegian Meteorological Institute EMEP MSC-W Norway and Dept Radio amp Space Science Chalmers Univ Technol Sweden is gratefully acknowledged for help with implementation of the Unified EMEP model
A comparison of emissions from ethanol and petrol fuelled cars IVL report B1962 Health risk assessment for Vaumlstra Goumltaland
26
7 References
Altenstedt J Pleijel K 2000 An alternative approach to photochemical ozone creation potentials under European conditions J Air amp Waste Manage Assoc 50 1023 ndash 1036
Andre J-M (2005) Vehicle emission measurement collection of the ARTEMIS datatbase Artemis 3312 report Available from httpwwwinretsfrurltepublicationspublications-pdfJoumardA3312reportJMALTE0504pdf
Bachand A MMundt K A Mundt D JMontgomery R R Epidemiological studies of formaldehyde exposure and risk of leukemia and nasopharyngeal cancer A meta-analysis Critical Reviews in Toxicology 2010 40(2) 85ndash100
Beane Freeman L E Blair A Lubin J H Stewart P A Hayes R B Hoover R N Hauptmann M Mortality from lymphohematopoietic malignancies among workers in formaldehyde industries The National Cancer Institute Cohort J Natl Cancer Inst 2009101751ndash761
Bosetti C McLaughlin J K Tarone R E Pira E LaVecchia C Formaldehyde and cancer risk A quantitative review of cohort studies through 2006 Ann Oncol 20081929ndash43
ConcaweJRC Well-to-wheel studies httpiesjrceceuropaeuwtwhtml
Derwent R G Jenkin M E Saunders S M 1996 Photchemical ozone creation potentials for a large number of reactive hydrocarbons under European conditions Atmos Environ 30 181 ndash 199
Derwent RG Jenkin ME Passant NR Pilling MJ 2007 Photochemical ozone creation potentials (POCPs) for different emission sources of organic compounds under European conditions estimated with a Master Chemical Mechanism Atmos Env 41 2570ndash2579
EEA Copenhagen 2009 wwweeaeuropaeudata-and-mapsdatapopulation-density-disaggregated-with-corine-land-cover-2000-2
Ericsson P Holmstroumlm M Amberntsson-Carlsson A Ohlson C Skoglundh M Andersson B Carlsson P-A 2008 Characterization of particulate emissions and methodologhy for oxidation of particulates from non-diesel combustion ystems SAE Technical Paper Series 2008-01-1746
GAINS 2010 httpgainsiiasaacatindexphpgains-europe
Graham LA Belisle SL Baas C-L Emissions from light duty gasoline vehicles operating on low blend ethanol gasoline and E85 Atmospheric Environment 42 4498 (2008)
Haskew H M Thomas P E Liberty F 2006 Fuel Permeation From Automotive Systems E0 E6 E10 E20 And E85 Final Report CRC Project No E-65-3 Coordinating Research Council Inc 3650 Mansell RoadSuite 140Alpharetta GA 30022
HEI Air Toxics Review Panel (2007) Mobile-Source Air Toxics A Critical Review of the Literature on Exposure and Health Effects HEI Special Report 16 Health Effects Institute Boston USA
Hurley P TAPM v 4 User Manual 2008 CSIRO ISBN 978-1-921424-73-1
IARC (2006) IARC Monographs on the Evaluation of Carcinogenic Risks to Humans Wood Dusts and Formaldehyde Lyon World Health Organization International Agency for Research on Cancer Lyon France 8837ndash325
Jacobson M Z Effects of Ethanol (E85) versus Gasoline Vehicles on Cancer and Mortality in the United States Environ Sci Technol 2007414150-4157
A comparison of emissions from ethanol and petrol fuelled cars IVL report B1962 Health risk assessment for Vaumlstra Goumltaland
27
Jerret M Burnett R T Pope C A Ito K Thurston G Krewski D Shi Y Calle E Thun M Long-Term Ozone Exposure and Mortality N Engl J Med 20093601085-95
Lipman T E Delucchi M A 2002 Emissions of nitrous oxide and methane from conventional and alternative fuel motor vehicles Climate Change 53 477
Modig L Toreacuten K Janson C Jarvholm B Forsberg B Vehicle exhaust outside the home and onset of asthma among adults Eur Respir J 2009 Jun33(6)1261-7
Nafstad P Haheim L L Wisloff T Gram F Oftedal B Holme I Hjermann I Leren P Urban air pollution and mortality in a cohort of Norwegian men Environ Health Perspect 2004112(5)610-5
OEHHA (1999) Air Toxics Hot Spots Program Risk Assessment Guidelines Part II Technical Support Document for Describing Available Cancer Potency Factors Prepared by the Air Toxicology and Epidemiology Section Office of Environmental Health Hazard Assessment April 1999
Passant NR (2002) Speciation of UK emissions of non-methane volatile organic compounds AEAT report AEATENVR0545 Issue 1 Culham UK
Pope CA III Thun MJ Namboodiri MM Dockery DW Evans JS Speizer FE Heath CJ Particulate air pollution as a predictor of mortality in a prospective study of US adults Am J Resp Crit Care Med 1995 151 669-674
Seinfeld J H and Pandis SN (1998) Atmospheric Chemistry and Physics From Air Pollution to Climate Change John Wiley amp Sons New YorkSimpson D Fagerli H Jonson JE Tsyro S Wind P Tuovinen J -P 2003 Transboundary acidification and eutrophication and ground level ozone in Europe Unified EMEP Model Description EMEP Status Report 12003 Part I EMEPMSC-W Report The Norwegian Meteorological Institute Oslo Norway
US EPA (1999) httpwwwepagovttnatwnata1999nsata1999
Vestreng V et al 2004 Inventory Review 2004 Emission data reported to CLRTAP and the NEC Directive EMEPEEA Joint Review Report EMEPMSC-W Note 1
Westerholm R Ahlvik P Karlsson HL An exhaust characterisation study based on regulated and unregulated emissions from bi-fuel and flexi-fuel light-duty passanger cars fuelled by petrol (E5) bioethanol (E70 E75) and biogas tested at ambient temperatures of +22degC and -7degC 2008
Wolkoff P Nielsen G D Non-cancer effects of formaldehyde and relevance for setting an indoor air guideline Environment International 201036788ndash799
Yanowitz J McCormick RL Effect of E85 on tailpipe emissions from light-duty vehicles J Air amp Waste Manage Assoc 59 172 (2009)
A comparison of emissions from ethanol and petrol fuelled cars IVL report B1962 Health risk assessment for Vaumlstra Goumltaland
28
Appendix 1 Evaporate emissions of NMHC
The following assumptions are done for evaporative emissions The NMHC emissions from E85 are reduced relative to petrol by 45 Methane emissions are zero and the split of NMHC species is 68 ethanol and the remaining 32 is divided in the same way as evaporative emissions for petrol The estimates by Graham et al (2008) are missing evaporative emission data however these assumptions agrees very well with measurements of evaporative emissions due to fuel permeation reported by Haskew et al (2006) where NMHC emissions are reported to be reduced by 50 for E85 fuel compared to petrol Haskew et al also presents the NMHC split to species with 60 ethanol This number agrees quite well with our assumption of 68 NMHC being ethanol NMHC in exhaust and evaporative emissions are thus divided as in Table A1
Table A1 Division of NMHC in the exhaust and evaporative emissions for E85 and petrol respectively (wt)
E85 Petrol E85 Petrol exhaust exhaust evaporative evaporative
Ethanol 680 0 680 0 Acetaldehyde 131 08 02 0 Ethene 99 73 24 0 Ethyne 03 28 09 0 Formaldehyde 31 17 06 0 Benzene 16 56 18 10 13 Butadiene 03 09 03 0 sum 963 191 741 10
The remaining NMHC emissions are divided as for petrol (ref) and listed in Table A2
Table A2 Division of NMHC in the exhaust and evaporative emissions for E85 and petrol respectively (wt)
E85 Petrol E85 Petrol exhaust exhaust evaporative evaporative
Ethane 02 32 10 0 Alkanes (C3+) 13 278 89 880 Alkenes (C3+) 04 90 29 95 Aromatics (C7+) 18 388 125 15 Aldehydesketones (C3+)
01 15 05 0
A comparison of emissions from ethanol and petrol fuelled cars IVL report B1962 Health risk assessment for Vaumlstra Goumltaland
29
Appendix 2 Description of the model system
A21 Atmospheric lifetimes
Table A3 gives tropospheric lifetimes with regard to reaction of ethanol formaldehyde acetaldehyde and benzene (C6H6) with OH nitrate radical (NO3) and photolysis The studied organic species are listed together with three species common in the gasoline exhaust (benzene ethene and toluene) for comparison Table 11 shows also photochemical ozone creation potential (POCP) of these species POCP is a measure of amount of ozone that is formed from a certain VOC emission relatively to other emission source which has been established to the same emission mass of ethene (Derwent et al 1996 Altenstedt et al 2000) The range represents different scenarios for VOC and NOX background concentrations Derwent et al (2007) used similar methodology to calculate POCP of different VOC sources and calculated POCP of mean road emission exhaust to be 69
Table A3 Atmospheric lifetimes of studies NMVOC species with respect to the OH- and NO3- initiated
degradation τ(OH) and τ(NO3) and with respect to the photolysis (The lifetime of a chemical species which decays in a first-order process is the time needed for a concentration of this species to decrease to 1e of its original value Statistically it represents the mean life expectancy of an excited species) The OH concentration of 1times106 moleculescm3 typical for summer troposphere was used for the lifetime calculation The NO3 concentrations of 5 and 100 ppt(V) were used for lifetime calculations as representative of rural and urban night-time 12 hrs mean concentration The studied organic species are listed together with 3 species common in the gasoline exhaust for comparison The rates of photolysis were calculated with radiation transfer model for July 58ordm latitude and integrated over 24 hours
τ(OH) τ(NO3) urbanrural τ (photolysis) POCP
hr hr hr
Ethanol 85 56 1times103 - 44 - 63
Acetaldehyde 15 47 1times103 86 68 - 80
Formaldehyde 30 194 4times103 10 18 - 55
Benzene 214 - - 23 - 47
Ethene 34 - - 100
Toluene 50 - - 30 - 67
A22 Defining of boundary concentrations for TAPM from EMEP fields
Calculation of initial concentration field for TAPM from EMEP concentration field of NO2 (as example) and EMEP mean wind vector components u_mid and v_mid Two EMEP model gridcells (i=56 j=60 and i=56 j=61) represent the TAPM model domain and concentrations from the surrounding EMEP gridcells SE-S SE-N NW-S NW-N NE NW (Figure A1) are used for calculation of boundary concentration NO2(bc) according to the following code if u_mid lt= 0 then ( isite = SE-S and jsite = SE-N) else isite = NW-S and jsite = NW-N) endif
A comparison of emissions from ethanol and petrol fuelled cars IVL report B1962 Health risk assessment for Vaumlstra Goumltaland
30
if v_mid lt= 0 then ( ksite = NE) else ksite = SW endif NO2(bc) = [(NO2(isite)u_mid(isite) + NO2(jsite)u_mid(jsite))2 + NO2(ksite)v_mid(ksite)] [(u_mid(isite) + u_mid(jsite))2 + v_mid(ksite)]
Figure A1 Gridcells covering Gothenburg domain and its boundary in EMEP model plotted on latitude-
longitude coordinates The red square represents centre of Gothenburg and the blue line the coastline EMEP i and j coordinates for the boundary gridcells are SE-S = 57-60 SE-N = 57-61 NW-S = 55-60 NW-N = 55-61 NE = 56-62 NW = 56-59 and for Gothenburg grid cells are Gbg-NE = 56-61 Gbg-SW = 56-60
A23 Atmospheric chemistry
The role of secondary chemistry in for the concentration of acetaldehyde are studied by first excluding the primary acetaldehyde emissions from the EMEP model simulations of scenarios S1 and S2 and then by excluding all NMVOC emissions from the car category with spark ignition engines The contribution from the primary acetaldehyde emissions as well as the contribution of secondary acetaldehyde formed from other NMVOC to the total acetaldehyde concentration is then obtained However the secondary chemistry is highly nonlinear due to the interactions of NMVOCs with ozone and OH and thus the results for the contribution of secondary acetaldehyde are somewhat uncertain Differences in acetaldehyde concentrations between S1 and S2 scenarios are studied with respect to contribution of primary and secondary acetaldehyde It is observed that in summer background air the monthly mean contribution of the secondary acetaldehyde is of the same magnitude as the contribution of the primary acetaldehyde to the difference between S1 and
565
57
575
58
585
105 115 125 135 145
Long
Lat
Gbg-SW
Gbg-NE
SE-S
NW-N
NW-S
SE-N
SW
NE
55-59
57-59
55-62
A comparison of emissions from ethanol and petrol fuelled cars IVL report B1962 Health risk assessment for Vaumlstra Goumltaland
31
S2 In the winter and in more polluted atmosphere (Gothenburg grid cells) the contribution from secondary acetaldehyde to the concentration difference appears to be negative due to the chemistry feedback ie the E-85 scenario has less secondary acetaldehyde than the all-petrol scenario
A comparison of S2-S1 differences in primary and secondary acetaldehyde concentrations in the background (=upwind) and Gothenburg grid cells show no increase in the secondary acetaldehyde from upwind to the Gothenburg grid cell It can thus be concluded that there is no significant contribution from secondary aldehydes on the small scale (tenths of km) Conclusion from this sensitivity study is that the secondary formaldehyde can be of importance under summer in the clean background air but that formation on the local scale is unimportant Using EMEP simulated boundary concentrations of acetaldehyde in the local scale model and simulating the primary acetaldehyde emissions will capture the most important features of acetaldehyde dispersion and chemistry in Vaumlstra Goumltaland
In the EMEP model the tail-pipe PM emissions are specified as primary particles Emissions of NOX and VOCs (and NH3 SO2) are oxidised in the atmosphere and a part is then transferred through the gas-to-particle transport to the PM as secondary PM The petrol fuelled cars emit both more primary PM and more NOX compared to the E85 cars If we compare differences in primary and secondary PM between the S1 and S2 scenarios simulated by EMEP we can directly see what part of the difference is from the tail-pipe emissions of the primary particles and what part is from the formation of the secondary PM in atmosphere (mostly from higher emissions of NOX) Table A4 shows the differences between S1 and S2 (S1-S2) of monthly PM averages for January and June (two months with low and high photochemical activities respectively) It can be seen that the higher formation of secondary PM in the S1 (all-petrol) scenario is more important than the higher tail-pipe emission of primary PM by factor 10 - 20
When we compare simulated PM differences between S1-S2 for the background air (=upwind) grid cells and for grid cells including Gothenburg (50 km x 50 km scale) we can see significant increase in primary PM in the S1 scenario from the upwind grid cells to Gothenburg (746 in winter 132 in summer) while no systematic increase can be seen for the secondary PM (-42 in winter +24 in summer) From this comparison it can be concluded that no systematic increase in secondary PM can be seen (in difference from the primary PM) on the scale of 50-100 km and we can neglect this process on the small scale However the overall change in PM concentrations due to the switch of the fuel is very small both on the large scale and on the small scale as can be seen when the differences in PM concentrations between S1 and S2 are compared to absolute PM concentrations in S1 presented in the last column of Table A4
Table A4 Differences in primary and secondary PM concentrations between the lsquoAll-petrolrsquo (S1) and lsquoE-85rsquo (S2) scenarios simulated in gridcells upwind Gothenburg and in gridcells including Gothenburg (2 50 km x 50 km gridcells)
S1-S2 Background
S1-S2 Gothenburg
Increase S1-S2 Gothenburg
S1 Background
μgm3 μgm3 μgm3 bkgnd μgm3
Prim PM10 Jan 00008 00014 00006 746 084
Jun 00008 00018 00010 1319 084
Sec PM10 Jan 00155 00148 -00006
-42 157
Jun 00080 00081 00002 24 213
The sensitivity of the used emission factors for NMHC with respect to the ozone formation in the region of the Swedish West Coast can be analysed with the help of results from studying the
A comparison of emissions from ethanol and petrol fuelled cars IVL report B1962 Health risk assessment for Vaumlstra Goumltaland
32
formation of secondary acetaldehyde In this study first all primary acetaldehyde emitted by the E85 fleet are omitted in a model simulation (S2_nopAA) and secondly all NMHC emissions from the E-85 fleet are switched off (S2_noVOC) Acetaldehyde has a somewhat higher though still comparable photochemical ozone creation potential compared to ethanol (ethanol 44-63 acetaldehyde 68-80 Altenstedt and Pleijel 2000) and this simulation will thus also give information on the sensitivity of the calculations to uncertainties in the ethanol emissions Setting the emission factor for NMHC to zero gives the sensitivity to the emission factor of total NMHC Figure A2 shows the differences in ozone concentration as a result of acetaldehyde only and the total NMHC from the E85 car fleet (S2 scenario) We can see that the effect on ozone formation is very small for the Swedish West coast The reason is that the ozone formation in this area is controlled by the availability of NOX while NMHC or rather their degradation products the peroxy radicals that serve as a lsquofuelrsquo to ozone formation are usually in excess here and further VOC emissions do not increase ozone concentrations significantly The situation looks different in areas that are more heavily polluted with NOX andor which is limited in the availability of peroxy radicals The results from this sensitivity study are fully consistent with the observed increase in ozone concentrations as a result of lower NO emissions (the so-called ozone titration) only very close to the major roads but no larger-scale decrease in ozone concentrations in the Gothenburg area or in any other communities
Figure A2 Sensitivity of the ozone formation in the 2 EMEP model grid cells covering Gothenburg (blue) and in the 6 surrounding grid cells (red see Fig A1) to changes in NMHC emission factor of the E85 fuelled cars lsquobasersquo is simulation S2 with EF for NMHC as in Table 3 lsquonoVOCrsquo is S2 with EF for all NMHC = 0 lsquonopAArsquo is S2 with EF for acetaldehyde = 0 a ndash Mean sensitivity in January absolute difference in ozone formation in ppb(V) as a result of NMHC (base-noVOC) and acetaldehyde (base-nopAA) emissions b ndash Sensitivity relative to ozone concentration in the S2-base simulation January c ndash same as a) but June d ndash same as b) but June
‐002
‐001
0
001
base‐noVOC base‐nopAA
ΔO3(ppb)
a)
0
001
002
base‐noVOC base‐nopAA
ΔO
3(ppb)
c)
‐010
‐005
000
005
base‐noVOC base‐nopAA
ΔO
3
b)
000
002
004
006
base‐noVOC base‐nopAA
ΔO
3
d)
A comparison of emissions from ethanol and petrol fuelled cars IVL report B1962 Health risk assessment for Vaumlstra Goumltaland
33
Appendix 3 Emission results
The geographically distributed NOX and acetaldehyde emissions for the Vaumlstra Goumltaland region are presented in Figures A3 and A4 respectively
Figure A3 NOX emissions for the Vaumlstra Goumltaland region for the All Petrol scenario
A comparison of emissions from ethanol and petrol fuelled cars IVL report B1962 Health risk assessment for Vaumlstra Goumltaland
34
Figure A4 Acetaldehyde emissions for the Vaumlstra Goumltaland region for the All Ethanol scenario
A comparison of emissions from ethanol and petrol fuelled cars IVL report B1962 Health risk assessment for Vaumlstra Goumltaland
35
Appendix 4 Dispersion modelling results
The difference in yearly average concentration between scenario S1 and S2 for acetaldehyde and benzene can be seen in Figure A5 and Figure A6 respectively a)
b)
Figure A5 The difference in yearly average concentrations of acetaldehyde for 2020 between the all E85 (S2) and all petrol (S1) scenarios presented as a) microgm3 and as b) percentage for the Gothenburg area
A comparison of emissions from ethanol and petrol fuelled cars IVL report B1962 Health risk assessment for Vaumlstra Goumltaland
36
a)
b) all E85 c) all petrol
Figure A6 a) the difference in yearly average concentrations (gm3) of benzene for 2020 between the all E85 (S2) and all petrol (S1) scenarios yearly means for b) all E85 and c) all petrol (note the different scales)
The difference in the calculated NOX NO2 and ozone concentrations between the two scenarios are shown in Figures A7 A8 and A9
A comparison of emissions from ethanol and petrol fuelled cars IVL report B1962 Health risk assessment for Vaumlstra Goumltaland
37
a)
b)
Figure A7 The difference in yearly average concentrations of NOX for 2020 between the all E85 (S2) and all petrol (S1) scenarios presented as a) microgm3 and as b) percentage for the Gothenburg area
A comparison of emissions from ethanol and petrol fuelled cars IVL report B1962 Health risk assessment for Vaumlstra Goumltaland
38
a)
Figure A8 The difference in yearly average concentrations of NO2 for 2020 between the all E85 (S2) and all petrol (S1) scenarios presented as a) microgm3 and as b) percentage for the Gothenburg area
A comparison of emissions from ethanol and petrol fuelled cars IVL report B1962 Health risk assessment for Vaumlstra Goumltaland
39
a)
b)
Figure A9 The difference in yearly average concentrations of ozone for 2020 between the all E85 (S2) and all petrol (S1) scenarios presented as a) microgm3 and as b) percentage for mainly the Gothenburg area
A comparison of emissions from ethanol and petrol fuelled cars IVL report B1962 Health risk assessment for Vaumlstra Goumltaland
40
Appendix 5 Detailed Exposure data
Detailed exposure data for the difference between the all E85 (S2) and the all petrol (S1) scenarios can be found in Table A5
Table A5 Exposure data for the difference between the all E85 (S2) and the all petrol (S1) scenarios
Acetaldehyde diff E-P (microgm3)
Populated weighted mean
Number of people Percentage of population
0 - 01 627198 582 01 - 02 163394 152 02 - 03 134879 125 03 - 04 88099 82 04 - 05 38686 36 05 - 06 16880 16 06 - 07 7983 07 07 - 08 1248 01 Tot 014 1078367 Benzene diff E-P (microgm3)
Populated weighted mean
Number of people Percentage of population
-03 - -02 26680 25 -02 - -01 205757 191 -01 - -0 845930 784 Tot -0074 1078367 NO2 diff E-P (microgm3) Populated weighted
mean Number of people Percentage of
population -04 - -03 7698 07 -03 - -02 50131 46 -02 - -01 296288 275 -01 - -0 724250 672 Tot -009 1078367 NOX diff E-P (microgm3) Populated weighted
mean Number of people Percentage of
population -06 - -05 7698 -05 - -04 19639 18 -04 - -03 36626 34 -03 - -02 161685 150 -02 - -01 186500 173 -01 - -0 666219 618 Tot -012 1078367 O3 diff E-P (microgm3) Populated weighted
mean Number of people Percentage of
population -02 - -01 779132 723 -01 - -0 266417 247 0 - 01 32818 30 Tot -012 1078367
Exposure data for the total levels in the two scenarios can be found in Table A6
A comparison of emissions from ethanol and petrol fuelled cars IVL report B1962 Health risk assessment for Vaumlstra Goumltaland
41
Table A6 Exposure data for the total levels in the two scenarios
Acetaldehyde tot All ethanol (microgm3)
Populated weighted mean
Number of people Percentage of population
06 - 07 568825 527 07 - 08 171845 159 08 - 09 124551 115 09 - 10 100946 94 10 - 11 59235 55 11 - 12 30559 28 12 - 13 13175 12 13 - 14 7983 07 14 - 15 1248 01 Tot 077 1078367 Acetaldehyde tot All petrol (microgm3)
Populated weighted mean
Number of people Percentage of population
05 - 06 45111 42 06 - 07 1032008 957 07 - 08 1248 01 Tot 065 1078367 Benzene tot All ethanol (microgm3)
Populated weighted mean
Number of people Percentage of population
0 - 01 1055961 98 01 - 02 22406 2 Tot 005 1078367 Benzene tot All petrol (microgm3)
Populated weighted mean
Number of people Percentage of population
0 - 01 729093 676 01 - 02 232961 216 02 - 03 94042 87 03 - 04 21023 19 04 - 05 1248 01 Tot 010 1078367 NOX tot All ethanol (microgm3)
Populated weighted mean
Number of people Percentage of population
0-10 779108 722 10-20 254658 236 20-30 28683 27 30-40 11070 10 40-50 3426 03 50-60 0 00 60-70 0 00 70-80 639 01 80-90 0 00 90-100 0 00 100-110 783 01 Tot 84 1078367 NOX tot All petrol (microgm3)
Populated weighted mean
Number of people Percentage of population
0-10 769557 714 10-20 264209 245 20-30 28683 27 30-40 11070 10 40-50 3426 03 50-60 0 00
A comparison of emissions from ethanol and petrol fuelled cars IVL report B1962 Health risk assessment for Vaumlstra Goumltaland
42
60-70 0 00 70-80 639 01 80-90 0 00 90-100 0 00 100-110 783 01 Tot 85 1078367 O3 tot All ethanol (microgm3)
Populated weighted mean
Number of people Percentage of population
40-45 1422 01 45-50 26487 25 50-55 176636 164 55-60 770370 714 60-65 103452 96 Tot 569 1078367 O3 tot All petrol (microgm3)
Populated weighted mean
Number of people Percentage of population
40-45 1422 01 45-50 20229 19 50-55 181876 169 55-60 763361 708 60-65 111479 103 Tot 570 1078367 PM25 tot All ethanol (microgm3)
Populated weighted mean
Number of people Percentage of population
1-2 0 00 2-3 885325 821 3-4 192259 178 4-5 783 01 Tot 268 1078367 PM25 tot All petrol (microgm3)
Populated weighted mean
Number of people Percentage of population
1-2 0 00 2-3 868773 806 3-4 208811 194 4-5 783 01 Tot 270 1078367

A comparison of emissions from ethanol and petrol fuelled cars IVL report B1962 Health risk assessment for Vaumlstra Goumltaland
25
The health risk assessment shows decreased health risks in the E85 scenario relative the all-petrol scenario due to the increased NOX exposure correlated with both preterm deaths and asthma However NOX may be mainly an exhaust indicator Smaller effects are expected from the changes in ozone acetaldehyde and benzene exposure The overall difference considering the exposure to PM acetaldehyde benzene and ozone is 16 preterm deaths with lower values for the E85 scenario
6 Acknowledgements
Saab Automobile The Swedish Transport Administration and The Foundation for the Swedish Environmental Research Institute are gratefully acknowledged for financial contribution
Magnus Ekstroumlm and Maria Holmstroumlm at Saab and Martin Juneholm at the Swedish Transport Administration are acknowledged for their most valuable input to the study
David Simpson Norwegian Meteorological Institute EMEP MSC-W Norway and Dept Radio amp Space Science Chalmers Univ Technol Sweden is gratefully acknowledged for help with implementation of the Unified EMEP model
A comparison of emissions from ethanol and petrol fuelled cars IVL report B1962 Health risk assessment for Vaumlstra Goumltaland
26
7 References
Altenstedt J Pleijel K 2000 An alternative approach to photochemical ozone creation potentials under European conditions J Air amp Waste Manage Assoc 50 1023 ndash 1036
Andre J-M (2005) Vehicle emission measurement collection of the ARTEMIS datatbase Artemis 3312 report Available from httpwwwinretsfrurltepublicationspublications-pdfJoumardA3312reportJMALTE0504pdf
Bachand A MMundt K A Mundt D JMontgomery R R Epidemiological studies of formaldehyde exposure and risk of leukemia and nasopharyngeal cancer A meta-analysis Critical Reviews in Toxicology 2010 40(2) 85ndash100
Beane Freeman L E Blair A Lubin J H Stewart P A Hayes R B Hoover R N Hauptmann M Mortality from lymphohematopoietic malignancies among workers in formaldehyde industries The National Cancer Institute Cohort J Natl Cancer Inst 2009101751ndash761
Bosetti C McLaughlin J K Tarone R E Pira E LaVecchia C Formaldehyde and cancer risk A quantitative review of cohort studies through 2006 Ann Oncol 20081929ndash43
ConcaweJRC Well-to-wheel studies httpiesjrceceuropaeuwtwhtml
Derwent R G Jenkin M E Saunders S M 1996 Photchemical ozone creation potentials for a large number of reactive hydrocarbons under European conditions Atmos Environ 30 181 ndash 199
Derwent RG Jenkin ME Passant NR Pilling MJ 2007 Photochemical ozone creation potentials (POCPs) for different emission sources of organic compounds under European conditions estimated with a Master Chemical Mechanism Atmos Env 41 2570ndash2579
EEA Copenhagen 2009 wwweeaeuropaeudata-and-mapsdatapopulation-density-disaggregated-with-corine-land-cover-2000-2
Ericsson P Holmstroumlm M Amberntsson-Carlsson A Ohlson C Skoglundh M Andersson B Carlsson P-A 2008 Characterization of particulate emissions and methodologhy for oxidation of particulates from non-diesel combustion ystems SAE Technical Paper Series 2008-01-1746
GAINS 2010 httpgainsiiasaacatindexphpgains-europe
Graham LA Belisle SL Baas C-L Emissions from light duty gasoline vehicles operating on low blend ethanol gasoline and E85 Atmospheric Environment 42 4498 (2008)
Haskew H M Thomas P E Liberty F 2006 Fuel Permeation From Automotive Systems E0 E6 E10 E20 And E85 Final Report CRC Project No E-65-3 Coordinating Research Council Inc 3650 Mansell RoadSuite 140Alpharetta GA 30022
HEI Air Toxics Review Panel (2007) Mobile-Source Air Toxics A Critical Review of the Literature on Exposure and Health Effects HEI Special Report 16 Health Effects Institute Boston USA
Hurley P TAPM v 4 User Manual 2008 CSIRO ISBN 978-1-921424-73-1
IARC (2006) IARC Monographs on the Evaluation of Carcinogenic Risks to Humans Wood Dusts and Formaldehyde Lyon World Health Organization International Agency for Research on Cancer Lyon France 8837ndash325
Jacobson M Z Effects of Ethanol (E85) versus Gasoline Vehicles on Cancer and Mortality in the United States Environ Sci Technol 2007414150-4157
A comparison of emissions from ethanol and petrol fuelled cars IVL report B1962 Health risk assessment for Vaumlstra Goumltaland
27
Jerret M Burnett R T Pope C A Ito K Thurston G Krewski D Shi Y Calle E Thun M Long-Term Ozone Exposure and Mortality N Engl J Med 20093601085-95
Lipman T E Delucchi M A 2002 Emissions of nitrous oxide and methane from conventional and alternative fuel motor vehicles Climate Change 53 477
Modig L Toreacuten K Janson C Jarvholm B Forsberg B Vehicle exhaust outside the home and onset of asthma among adults Eur Respir J 2009 Jun33(6)1261-7
Nafstad P Haheim L L Wisloff T Gram F Oftedal B Holme I Hjermann I Leren P Urban air pollution and mortality in a cohort of Norwegian men Environ Health Perspect 2004112(5)610-5
OEHHA (1999) Air Toxics Hot Spots Program Risk Assessment Guidelines Part II Technical Support Document for Describing Available Cancer Potency Factors Prepared by the Air Toxicology and Epidemiology Section Office of Environmental Health Hazard Assessment April 1999
Passant NR (2002) Speciation of UK emissions of non-methane volatile organic compounds AEAT report AEATENVR0545 Issue 1 Culham UK
Pope CA III Thun MJ Namboodiri MM Dockery DW Evans JS Speizer FE Heath CJ Particulate air pollution as a predictor of mortality in a prospective study of US adults Am J Resp Crit Care Med 1995 151 669-674
Seinfeld J H and Pandis SN (1998) Atmospheric Chemistry and Physics From Air Pollution to Climate Change John Wiley amp Sons New YorkSimpson D Fagerli H Jonson JE Tsyro S Wind P Tuovinen J -P 2003 Transboundary acidification and eutrophication and ground level ozone in Europe Unified EMEP Model Description EMEP Status Report 12003 Part I EMEPMSC-W Report The Norwegian Meteorological Institute Oslo Norway
US EPA (1999) httpwwwepagovttnatwnata1999nsata1999
Vestreng V et al 2004 Inventory Review 2004 Emission data reported to CLRTAP and the NEC Directive EMEPEEA Joint Review Report EMEPMSC-W Note 1
Westerholm R Ahlvik P Karlsson HL An exhaust characterisation study based on regulated and unregulated emissions from bi-fuel and flexi-fuel light-duty passanger cars fuelled by petrol (E5) bioethanol (E70 E75) and biogas tested at ambient temperatures of +22degC and -7degC 2008
Wolkoff P Nielsen G D Non-cancer effects of formaldehyde and relevance for setting an indoor air guideline Environment International 201036788ndash799
Yanowitz J McCormick RL Effect of E85 on tailpipe emissions from light-duty vehicles J Air amp Waste Manage Assoc 59 172 (2009)
A comparison of emissions from ethanol and petrol fuelled cars IVL report B1962 Health risk assessment for Vaumlstra Goumltaland
28
Appendix 1 Evaporate emissions of NMHC
The following assumptions are done for evaporative emissions The NMHC emissions from E85 are reduced relative to petrol by 45 Methane emissions are zero and the split of NMHC species is 68 ethanol and the remaining 32 is divided in the same way as evaporative emissions for petrol The estimates by Graham et al (2008) are missing evaporative emission data however these assumptions agrees very well with measurements of evaporative emissions due to fuel permeation reported by Haskew et al (2006) where NMHC emissions are reported to be reduced by 50 for E85 fuel compared to petrol Haskew et al also presents the NMHC split to species with 60 ethanol This number agrees quite well with our assumption of 68 NMHC being ethanol NMHC in exhaust and evaporative emissions are thus divided as in Table A1
Table A1 Division of NMHC in the exhaust and evaporative emissions for E85 and petrol respectively (wt)
E85 Petrol E85 Petrol exhaust exhaust evaporative evaporative
Ethanol 680 0 680 0 Acetaldehyde 131 08 02 0 Ethene 99 73 24 0 Ethyne 03 28 09 0 Formaldehyde 31 17 06 0 Benzene 16 56 18 10 13 Butadiene 03 09 03 0 sum 963 191 741 10
The remaining NMHC emissions are divided as for petrol (ref) and listed in Table A2
Table A2 Division of NMHC in the exhaust and evaporative emissions for E85 and petrol respectively (wt)
E85 Petrol E85 Petrol exhaust exhaust evaporative evaporative
Ethane 02 32 10 0 Alkanes (C3+) 13 278 89 880 Alkenes (C3+) 04 90 29 95 Aromatics (C7+) 18 388 125 15 Aldehydesketones (C3+)
01 15 05 0
A comparison of emissions from ethanol and petrol fuelled cars IVL report B1962 Health risk assessment for Vaumlstra Goumltaland
29
Appendix 2 Description of the model system
A21 Atmospheric lifetimes
Table A3 gives tropospheric lifetimes with regard to reaction of ethanol formaldehyde acetaldehyde and benzene (C6H6) with OH nitrate radical (NO3) and photolysis The studied organic species are listed together with three species common in the gasoline exhaust (benzene ethene and toluene) for comparison Table 11 shows also photochemical ozone creation potential (POCP) of these species POCP is a measure of amount of ozone that is formed from a certain VOC emission relatively to other emission source which has been established to the same emission mass of ethene (Derwent et al 1996 Altenstedt et al 2000) The range represents different scenarios for VOC and NOX background concentrations Derwent et al (2007) used similar methodology to calculate POCP of different VOC sources and calculated POCP of mean road emission exhaust to be 69
Table A3 Atmospheric lifetimes of studies NMVOC species with respect to the OH- and NO3- initiated
degradation τ(OH) and τ(NO3) and with respect to the photolysis (The lifetime of a chemical species which decays in a first-order process is the time needed for a concentration of this species to decrease to 1e of its original value Statistically it represents the mean life expectancy of an excited species) The OH concentration of 1times106 moleculescm3 typical for summer troposphere was used for the lifetime calculation The NO3 concentrations of 5 and 100 ppt(V) were used for lifetime calculations as representative of rural and urban night-time 12 hrs mean concentration The studied organic species are listed together with 3 species common in the gasoline exhaust for comparison The rates of photolysis were calculated with radiation transfer model for July 58ordm latitude and integrated over 24 hours
τ(OH) τ(NO3) urbanrural τ (photolysis) POCP
hr hr hr
Ethanol 85 56 1times103 - 44 - 63
Acetaldehyde 15 47 1times103 86 68 - 80
Formaldehyde 30 194 4times103 10 18 - 55
Benzene 214 - - 23 - 47
Ethene 34 - - 100
Toluene 50 - - 30 - 67
A22 Defining of boundary concentrations for TAPM from EMEP fields
Calculation of initial concentration field for TAPM from EMEP concentration field of NO2 (as example) and EMEP mean wind vector components u_mid and v_mid Two EMEP model gridcells (i=56 j=60 and i=56 j=61) represent the TAPM model domain and concentrations from the surrounding EMEP gridcells SE-S SE-N NW-S NW-N NE NW (Figure A1) are used for calculation of boundary concentration NO2(bc) according to the following code if u_mid lt= 0 then ( isite = SE-S and jsite = SE-N) else isite = NW-S and jsite = NW-N) endif
A comparison of emissions from ethanol and petrol fuelled cars IVL report B1962 Health risk assessment for Vaumlstra Goumltaland
30
if v_mid lt= 0 then ( ksite = NE) else ksite = SW endif NO2(bc) = [(NO2(isite)u_mid(isite) + NO2(jsite)u_mid(jsite))2 + NO2(ksite)v_mid(ksite)] [(u_mid(isite) + u_mid(jsite))2 + v_mid(ksite)]
Figure A1 Gridcells covering Gothenburg domain and its boundary in EMEP model plotted on latitude-
longitude coordinates The red square represents centre of Gothenburg and the blue line the coastline EMEP i and j coordinates for the boundary gridcells are SE-S = 57-60 SE-N = 57-61 NW-S = 55-60 NW-N = 55-61 NE = 56-62 NW = 56-59 and for Gothenburg grid cells are Gbg-NE = 56-61 Gbg-SW = 56-60
A23 Atmospheric chemistry
The role of secondary chemistry in for the concentration of acetaldehyde are studied by first excluding the primary acetaldehyde emissions from the EMEP model simulations of scenarios S1 and S2 and then by excluding all NMVOC emissions from the car category with spark ignition engines The contribution from the primary acetaldehyde emissions as well as the contribution of secondary acetaldehyde formed from other NMVOC to the total acetaldehyde concentration is then obtained However the secondary chemistry is highly nonlinear due to the interactions of NMVOCs with ozone and OH and thus the results for the contribution of secondary acetaldehyde are somewhat uncertain Differences in acetaldehyde concentrations between S1 and S2 scenarios are studied with respect to contribution of primary and secondary acetaldehyde It is observed that in summer background air the monthly mean contribution of the secondary acetaldehyde is of the same magnitude as the contribution of the primary acetaldehyde to the difference between S1 and
565
57
575
58
585
105 115 125 135 145
Long
Lat
Gbg-SW
Gbg-NE
SE-S
NW-N
NW-S
SE-N
SW
NE
55-59
57-59
55-62
A comparison of emissions from ethanol and petrol fuelled cars IVL report B1962 Health risk assessment for Vaumlstra Goumltaland
31
S2 In the winter and in more polluted atmosphere (Gothenburg grid cells) the contribution from secondary acetaldehyde to the concentration difference appears to be negative due to the chemistry feedback ie the E-85 scenario has less secondary acetaldehyde than the all-petrol scenario
A comparison of S2-S1 differences in primary and secondary acetaldehyde concentrations in the background (=upwind) and Gothenburg grid cells show no increase in the secondary acetaldehyde from upwind to the Gothenburg grid cell It can thus be concluded that there is no significant contribution from secondary aldehydes on the small scale (tenths of km) Conclusion from this sensitivity study is that the secondary formaldehyde can be of importance under summer in the clean background air but that formation on the local scale is unimportant Using EMEP simulated boundary concentrations of acetaldehyde in the local scale model and simulating the primary acetaldehyde emissions will capture the most important features of acetaldehyde dispersion and chemistry in Vaumlstra Goumltaland
In the EMEP model the tail-pipe PM emissions are specified as primary particles Emissions of NOX and VOCs (and NH3 SO2) are oxidised in the atmosphere and a part is then transferred through the gas-to-particle transport to the PM as secondary PM The petrol fuelled cars emit both more primary PM and more NOX compared to the E85 cars If we compare differences in primary and secondary PM between the S1 and S2 scenarios simulated by EMEP we can directly see what part of the difference is from the tail-pipe emissions of the primary particles and what part is from the formation of the secondary PM in atmosphere (mostly from higher emissions of NOX) Table A4 shows the differences between S1 and S2 (S1-S2) of monthly PM averages for January and June (two months with low and high photochemical activities respectively) It can be seen that the higher formation of secondary PM in the S1 (all-petrol) scenario is more important than the higher tail-pipe emission of primary PM by factor 10 - 20
When we compare simulated PM differences between S1-S2 for the background air (=upwind) grid cells and for grid cells including Gothenburg (50 km x 50 km scale) we can see significant increase in primary PM in the S1 scenario from the upwind grid cells to Gothenburg (746 in winter 132 in summer) while no systematic increase can be seen for the secondary PM (-42 in winter +24 in summer) From this comparison it can be concluded that no systematic increase in secondary PM can be seen (in difference from the primary PM) on the scale of 50-100 km and we can neglect this process on the small scale However the overall change in PM concentrations due to the switch of the fuel is very small both on the large scale and on the small scale as can be seen when the differences in PM concentrations between S1 and S2 are compared to absolute PM concentrations in S1 presented in the last column of Table A4
Table A4 Differences in primary and secondary PM concentrations between the lsquoAll-petrolrsquo (S1) and lsquoE-85rsquo (S2) scenarios simulated in gridcells upwind Gothenburg and in gridcells including Gothenburg (2 50 km x 50 km gridcells)
S1-S2 Background
S1-S2 Gothenburg
Increase S1-S2 Gothenburg
S1 Background
μgm3 μgm3 μgm3 bkgnd μgm3
Prim PM10 Jan 00008 00014 00006 746 084
Jun 00008 00018 00010 1319 084
Sec PM10 Jan 00155 00148 -00006
-42 157
Jun 00080 00081 00002 24 213
The sensitivity of the used emission factors for NMHC with respect to the ozone formation in the region of the Swedish West Coast can be analysed with the help of results from studying the
A comparison of emissions from ethanol and petrol fuelled cars IVL report B1962 Health risk assessment for Vaumlstra Goumltaland
32
formation of secondary acetaldehyde In this study first all primary acetaldehyde emitted by the E85 fleet are omitted in a model simulation (S2_nopAA) and secondly all NMHC emissions from the E-85 fleet are switched off (S2_noVOC) Acetaldehyde has a somewhat higher though still comparable photochemical ozone creation potential compared to ethanol (ethanol 44-63 acetaldehyde 68-80 Altenstedt and Pleijel 2000) and this simulation will thus also give information on the sensitivity of the calculations to uncertainties in the ethanol emissions Setting the emission factor for NMHC to zero gives the sensitivity to the emission factor of total NMHC Figure A2 shows the differences in ozone concentration as a result of acetaldehyde only and the total NMHC from the E85 car fleet (S2 scenario) We can see that the effect on ozone formation is very small for the Swedish West coast The reason is that the ozone formation in this area is controlled by the availability of NOX while NMHC or rather their degradation products the peroxy radicals that serve as a lsquofuelrsquo to ozone formation are usually in excess here and further VOC emissions do not increase ozone concentrations significantly The situation looks different in areas that are more heavily polluted with NOX andor which is limited in the availability of peroxy radicals The results from this sensitivity study are fully consistent with the observed increase in ozone concentrations as a result of lower NO emissions (the so-called ozone titration) only very close to the major roads but no larger-scale decrease in ozone concentrations in the Gothenburg area or in any other communities
Figure A2 Sensitivity of the ozone formation in the 2 EMEP model grid cells covering Gothenburg (blue) and in the 6 surrounding grid cells (red see Fig A1) to changes in NMHC emission factor of the E85 fuelled cars lsquobasersquo is simulation S2 with EF for NMHC as in Table 3 lsquonoVOCrsquo is S2 with EF for all NMHC = 0 lsquonopAArsquo is S2 with EF for acetaldehyde = 0 a ndash Mean sensitivity in January absolute difference in ozone formation in ppb(V) as a result of NMHC (base-noVOC) and acetaldehyde (base-nopAA) emissions b ndash Sensitivity relative to ozone concentration in the S2-base simulation January c ndash same as a) but June d ndash same as b) but June
‐002
‐001
0
001
base‐noVOC base‐nopAA
ΔO3(ppb)
a)
0
001
002
base‐noVOC base‐nopAA
ΔO
3(ppb)
c)
‐010
‐005
000
005
base‐noVOC base‐nopAA
ΔO
3
b)
000
002
004
006
base‐noVOC base‐nopAA
ΔO
3
d)
A comparison of emissions from ethanol and petrol fuelled cars IVL report B1962 Health risk assessment for Vaumlstra Goumltaland
33
Appendix 3 Emission results
The geographically distributed NOX and acetaldehyde emissions for the Vaumlstra Goumltaland region are presented in Figures A3 and A4 respectively
Figure A3 NOX emissions for the Vaumlstra Goumltaland region for the All Petrol scenario
A comparison of emissions from ethanol and petrol fuelled cars IVL report B1962 Health risk assessment for Vaumlstra Goumltaland
34
Figure A4 Acetaldehyde emissions for the Vaumlstra Goumltaland region for the All Ethanol scenario
A comparison of emissions from ethanol and petrol fuelled cars IVL report B1962 Health risk assessment for Vaumlstra Goumltaland
35
Appendix 4 Dispersion modelling results
The difference in yearly average concentration between scenario S1 and S2 for acetaldehyde and benzene can be seen in Figure A5 and Figure A6 respectively a)
b)
Figure A5 The difference in yearly average concentrations of acetaldehyde for 2020 between the all E85 (S2) and all petrol (S1) scenarios presented as a) microgm3 and as b) percentage for the Gothenburg area
A comparison of emissions from ethanol and petrol fuelled cars IVL report B1962 Health risk assessment for Vaumlstra Goumltaland
36
a)
b) all E85 c) all petrol
Figure A6 a) the difference in yearly average concentrations (gm3) of benzene for 2020 between the all E85 (S2) and all petrol (S1) scenarios yearly means for b) all E85 and c) all petrol (note the different scales)
The difference in the calculated NOX NO2 and ozone concentrations between the two scenarios are shown in Figures A7 A8 and A9
A comparison of emissions from ethanol and petrol fuelled cars IVL report B1962 Health risk assessment for Vaumlstra Goumltaland
37
a)
b)
Figure A7 The difference in yearly average concentrations of NOX for 2020 between the all E85 (S2) and all petrol (S1) scenarios presented as a) microgm3 and as b) percentage for the Gothenburg area
A comparison of emissions from ethanol and petrol fuelled cars IVL report B1962 Health risk assessment for Vaumlstra Goumltaland
38
a)
Figure A8 The difference in yearly average concentrations of NO2 for 2020 between the all E85 (S2) and all petrol (S1) scenarios presented as a) microgm3 and as b) percentage for the Gothenburg area
A comparison of emissions from ethanol and petrol fuelled cars IVL report B1962 Health risk assessment for Vaumlstra Goumltaland
39
a)
b)
Figure A9 The difference in yearly average concentrations of ozone for 2020 between the all E85 (S2) and all petrol (S1) scenarios presented as a) microgm3 and as b) percentage for mainly the Gothenburg area
A comparison of emissions from ethanol and petrol fuelled cars IVL report B1962 Health risk assessment for Vaumlstra Goumltaland
40
Appendix 5 Detailed Exposure data
Detailed exposure data for the difference between the all E85 (S2) and the all petrol (S1) scenarios can be found in Table A5
Table A5 Exposure data for the difference between the all E85 (S2) and the all petrol (S1) scenarios
Acetaldehyde diff E-P (microgm3)
Populated weighted mean
Number of people Percentage of population
0 - 01 627198 582 01 - 02 163394 152 02 - 03 134879 125 03 - 04 88099 82 04 - 05 38686 36 05 - 06 16880 16 06 - 07 7983 07 07 - 08 1248 01 Tot 014 1078367 Benzene diff E-P (microgm3)
Populated weighted mean
Number of people Percentage of population
-03 - -02 26680 25 -02 - -01 205757 191 -01 - -0 845930 784 Tot -0074 1078367 NO2 diff E-P (microgm3) Populated weighted
mean Number of people Percentage of
population -04 - -03 7698 07 -03 - -02 50131 46 -02 - -01 296288 275 -01 - -0 724250 672 Tot -009 1078367 NOX diff E-P (microgm3) Populated weighted
mean Number of people Percentage of
population -06 - -05 7698 -05 - -04 19639 18 -04 - -03 36626 34 -03 - -02 161685 150 -02 - -01 186500 173 -01 - -0 666219 618 Tot -012 1078367 O3 diff E-P (microgm3) Populated weighted
mean Number of people Percentage of
population -02 - -01 779132 723 -01 - -0 266417 247 0 - 01 32818 30 Tot -012 1078367
Exposure data for the total levels in the two scenarios can be found in Table A6
A comparison of emissions from ethanol and petrol fuelled cars IVL report B1962 Health risk assessment for Vaumlstra Goumltaland
41
Table A6 Exposure data for the total levels in the two scenarios
Acetaldehyde tot All ethanol (microgm3)
Populated weighted mean
Number of people Percentage of population
06 - 07 568825 527 07 - 08 171845 159 08 - 09 124551 115 09 - 10 100946 94 10 - 11 59235 55 11 - 12 30559 28 12 - 13 13175 12 13 - 14 7983 07 14 - 15 1248 01 Tot 077 1078367 Acetaldehyde tot All petrol (microgm3)
Populated weighted mean
Number of people Percentage of population
05 - 06 45111 42 06 - 07 1032008 957 07 - 08 1248 01 Tot 065 1078367 Benzene tot All ethanol (microgm3)
Populated weighted mean
Number of people Percentage of population
0 - 01 1055961 98 01 - 02 22406 2 Tot 005 1078367 Benzene tot All petrol (microgm3)
Populated weighted mean
Number of people Percentage of population
0 - 01 729093 676 01 - 02 232961 216 02 - 03 94042 87 03 - 04 21023 19 04 - 05 1248 01 Tot 010 1078367 NOX tot All ethanol (microgm3)
Populated weighted mean
Number of people Percentage of population
0-10 779108 722 10-20 254658 236 20-30 28683 27 30-40 11070 10 40-50 3426 03 50-60 0 00 60-70 0 00 70-80 639 01 80-90 0 00 90-100 0 00 100-110 783 01 Tot 84 1078367 NOX tot All petrol (microgm3)
Populated weighted mean
Number of people Percentage of population
0-10 769557 714 10-20 264209 245 20-30 28683 27 30-40 11070 10 40-50 3426 03 50-60 0 00
A comparison of emissions from ethanol and petrol fuelled cars IVL report B1962 Health risk assessment for Vaumlstra Goumltaland
42
60-70 0 00 70-80 639 01 80-90 0 00 90-100 0 00 100-110 783 01 Tot 85 1078367 O3 tot All ethanol (microgm3)
Populated weighted mean
Number of people Percentage of population
40-45 1422 01 45-50 26487 25 50-55 176636 164 55-60 770370 714 60-65 103452 96 Tot 569 1078367 O3 tot All petrol (microgm3)
Populated weighted mean
Number of people Percentage of population
40-45 1422 01 45-50 20229 19 50-55 181876 169 55-60 763361 708 60-65 111479 103 Tot 570 1078367 PM25 tot All ethanol (microgm3)
Populated weighted mean
Number of people Percentage of population
1-2 0 00 2-3 885325 821 3-4 192259 178 4-5 783 01 Tot 268 1078367 PM25 tot All petrol (microgm3)
Populated weighted mean
Number of people Percentage of population
1-2 0 00 2-3 868773 806 3-4 208811 194 4-5 783 01 Tot 270 1078367
A comparison of emissions from ethanol and petrol fuelled cars IVL report B1962 Health risk assessment for Vaumlstra Goumltaland
29
Appendix 2 Description of the model system
A21 Atmospheric lifetimes
Table A3 gives tropospheric lifetimes with regard to reaction of ethanol formaldehyde acetaldehyde and benzene (C6H6) with OH nitrate radical (NO3) and photolysis The studied organic species are listed together with three species common in the gasoline exhaust (benzene ethene and toluene) for comparison Table 11 shows also photochemical ozone creation potential (POCP) of these species POCP is a measure of amount of ozone that is formed from a certain VOC emission relatively to other emission source which has been established to the same emission mass of ethene (Derwent et al 1996 Altenstedt et al 2000) The range represents different scenarios for VOC and NOX background concentrations Derwent et al (2007) used similar methodology to calculate POCP of different VOC sources and calculated POCP of mean road emission exhaust to be 69
Table A3 Atmospheric lifetimes of studies NMVOC species with respect to the OH- and NO3- initiated
degradation τ(OH) and τ(NO3) and with respect to the photolysis (The lifetime of a chemical species which decays in a first-order process is the time needed for a concentration of this species to decrease to 1e of its original value Statistically it represents the mean life expectancy of an excited species) The OH concentration of 1times106 moleculescm3 typical for summer troposphere was used for the lifetime calculation The NO3 concentrations of 5 and 100 ppt(V) were used for lifetime calculations as representative of rural and urban night-time 12 hrs mean concentration The studied organic species are listed together with 3 species common in the gasoline exhaust for comparison The rates of photolysis were calculated with radiation transfer model for July 58ordm latitude and integrated over 24 hours
τ(OH) τ(NO3) urbanrural τ (photolysis) POCP
hr hr hr
Ethanol 85 56 1times103 - 44 - 63
Acetaldehyde 15 47 1times103 86 68 - 80
Formaldehyde 30 194 4times103 10 18 - 55
Benzene 214 - - 23 - 47
Ethene 34 - - 100
Toluene 50 - - 30 - 67
A22 Defining of boundary concentrations for TAPM from EMEP fields
Calculation of initial concentration field for TAPM from EMEP concentration field of NO2 (as example) and EMEP mean wind vector components u_mid and v_mid Two EMEP model gridcells (i=56 j=60 and i=56 j=61) represent the TAPM model domain and concentrations from the surrounding EMEP gridcells SE-S SE-N NW-S NW-N NE NW (Figure A1) are used for calculation of boundary concentration NO2(bc) according to the following code if u_mid lt= 0 then ( isite = SE-S and jsite = SE-N) else isite = NW-S and jsite = NW-N) endif
A comparison of emissions from ethanol and petrol fuelled cars IVL report B1962 Health risk assessment for Vaumlstra Goumltaland
30
if v_mid lt= 0 then ( ksite = NE) else ksite = SW endif NO2(bc) = [(NO2(isite)u_mid(isite) + NO2(jsite)u_mid(jsite))2 + NO2(ksite)v_mid(ksite)] [(u_mid(isite) + u_mid(jsite))2 + v_mid(ksite)]
Figure A1 Gridcells covering Gothenburg domain and its boundary in EMEP model plotted on latitude-
longitude coordinates The red square represents centre of Gothenburg and the blue line the coastline EMEP i and j coordinates for the boundary gridcells are SE-S = 57-60 SE-N = 57-61 NW-S = 55-60 NW-N = 55-61 NE = 56-62 NW = 56-59 and for Gothenburg grid cells are Gbg-NE = 56-61 Gbg-SW = 56-60
A23 Atmospheric chemistry
The role of secondary chemistry in for the concentration of acetaldehyde are studied by first excluding the primary acetaldehyde emissions from the EMEP model simulations of scenarios S1 and S2 and then by excluding all NMVOC emissions from the car category with spark ignition engines The contribution from the primary acetaldehyde emissions as well as the contribution of secondary acetaldehyde formed from other NMVOC to the total acetaldehyde concentration is then obtained However the secondary chemistry is highly nonlinear due to the interactions of NMVOCs with ozone and OH and thus the results for the contribution of secondary acetaldehyde are somewhat uncertain Differences in acetaldehyde concentrations between S1 and S2 scenarios are studied with respect to contribution of primary and secondary acetaldehyde It is observed that in summer background air the monthly mean contribution of the secondary acetaldehyde is of the same magnitude as the contribution of the primary acetaldehyde to the difference between S1 and
565
57
575
58
585
105 115 125 135 145
Long
Lat
Gbg-SW
Gbg-NE
SE-S
NW-N
NW-S
SE-N
SW
NE
55-59
57-59
55-62
A comparison of emissions from ethanol and petrol fuelled cars IVL report B1962 Health risk assessment for Vaumlstra Goumltaland
31
S2 In the winter and in more polluted atmosphere (Gothenburg grid cells) the contribution from secondary acetaldehyde to the concentration difference appears to be negative due to the chemistry feedback ie the E-85 scenario has less secondary acetaldehyde than the all-petrol scenario
A comparison of S2-S1 differences in primary and secondary acetaldehyde concentrations in the background (=upwind) and Gothenburg grid cells show no increase in the secondary acetaldehyde from upwind to the Gothenburg grid cell It can thus be concluded that there is no significant contribution from secondary aldehydes on the small scale (tenths of km) Conclusion from this sensitivity study is that the secondary formaldehyde can be of importance under summer in the clean background air but that formation on the local scale is unimportant Using EMEP simulated boundary concentrations of acetaldehyde in the local scale model and simulating the primary acetaldehyde emissions will capture the most important features of acetaldehyde dispersion and chemistry in Vaumlstra Goumltaland
In the EMEP model the tail-pipe PM emissions are specified as primary particles Emissions of NOX and VOCs (and NH3 SO2) are oxidised in the atmosphere and a part is then transferred through the gas-to-particle transport to the PM as secondary PM The petrol fuelled cars emit both more primary PM and more NOX compared to the E85 cars If we compare differences in primary and secondary PM between the S1 and S2 scenarios simulated by EMEP we can directly see what part of the difference is from the tail-pipe emissions of the primary particles and what part is from the formation of the secondary PM in atmosphere (mostly from higher emissions of NOX) Table A4 shows the differences between S1 and S2 (S1-S2) of monthly PM averages for January and June (two months with low and high photochemical activities respectively) It can be seen that the higher formation of secondary PM in the S1 (all-petrol) scenario is more important than the higher tail-pipe emission of primary PM by factor 10 - 20
When we compare simulated PM differences between S1-S2 for the background air (=upwind) grid cells and for grid cells including Gothenburg (50 km x 50 km scale) we can see significant increase in primary PM in the S1 scenario from the upwind grid cells to Gothenburg (746 in winter 132 in summer) while no systematic increase can be seen for the secondary PM (-42 in winter +24 in summer) From this comparison it can be concluded that no systematic increase in secondary PM can be seen (in difference from the primary PM) on the scale of 50-100 km and we can neglect this process on the small scale However the overall change in PM concentrations due to the switch of the fuel is very small both on the large scale and on the small scale as can be seen when the differences in PM concentrations between S1 and S2 are compared to absolute PM concentrations in S1 presented in the last column of Table A4
Table A4 Differences in primary and secondary PM concentrations between the lsquoAll-petrolrsquo (S1) and lsquoE-85rsquo (S2) scenarios simulated in gridcells upwind Gothenburg and in gridcells including Gothenburg (2 50 km x 50 km gridcells)
S1-S2 Background
S1-S2 Gothenburg
Increase S1-S2 Gothenburg
S1 Background
μgm3 μgm3 μgm3 bkgnd μgm3
Prim PM10 Jan 00008 00014 00006 746 084
Jun 00008 00018 00010 1319 084
Sec PM10 Jan 00155 00148 -00006
-42 157
Jun 00080 00081 00002 24 213
The sensitivity of the used emission factors for NMHC with respect to the ozone formation in the region of the Swedish West Coast can be analysed with the help of results from studying the
A comparison of emissions from ethanol and petrol fuelled cars IVL report B1962 Health risk assessment for Vaumlstra Goumltaland
32
formation of secondary acetaldehyde In this study first all primary acetaldehyde emitted by the E85 fleet are omitted in a model simulation (S2_nopAA) and secondly all NMHC emissions from the E-85 fleet are switched off (S2_noVOC) Acetaldehyde has a somewhat higher though still comparable photochemical ozone creation potential compared to ethanol (ethanol 44-63 acetaldehyde 68-80 Altenstedt and Pleijel 2000) and this simulation will thus also give information on the sensitivity of the calculations to uncertainties in the ethanol emissions Setting the emission factor for NMHC to zero gives the sensitivity to the emission factor of total NMHC Figure A2 shows the differences in ozone concentration as a result of acetaldehyde only and the total NMHC from the E85 car fleet (S2 scenario) We can see that the effect on ozone formation is very small for the Swedish West coast The reason is that the ozone formation in this area is controlled by the availability of NOX while NMHC or rather their degradation products the peroxy radicals that serve as a lsquofuelrsquo to ozone formation are usually in excess here and further VOC emissions do not increase ozone concentrations significantly The situation looks different in areas that are more heavily polluted with NOX andor which is limited in the availability of peroxy radicals The results from this sensitivity study are fully consistent with the observed increase in ozone concentrations as a result of lower NO emissions (the so-called ozone titration) only very close to the major roads but no larger-scale decrease in ozone concentrations in the Gothenburg area or in any other communities
Figure A2 Sensitivity of the ozone formation in the 2 EMEP model grid cells covering Gothenburg (blue) and in the 6 surrounding grid cells (red see Fig A1) to changes in NMHC emission factor of the E85 fuelled cars lsquobasersquo is simulation S2 with EF for NMHC as in Table 3 lsquonoVOCrsquo is S2 with EF for all NMHC = 0 lsquonopAArsquo is S2 with EF for acetaldehyde = 0 a ndash Mean sensitivity in January absolute difference in ozone formation in ppb(V) as a result of NMHC (base-noVOC) and acetaldehyde (base-nopAA) emissions b ndash Sensitivity relative to ozone concentration in the S2-base simulation January c ndash same as a) but June d ndash same as b) but June
‐002
‐001
0
001
base‐noVOC base‐nopAA
ΔO3(ppb)
a)
0
001
002
base‐noVOC base‐nopAA
ΔO
3(ppb)
c)
‐010
‐005
000
005
base‐noVOC base‐nopAA
ΔO
3
b)
000
002
004
006
base‐noVOC base‐nopAA
ΔO
3
d)
A comparison of emissions from ethanol and petrol fuelled cars IVL report B1962 Health risk assessment for Vaumlstra Goumltaland
33
Appendix 3 Emission results
The geographically distributed NOX and acetaldehyde emissions for the Vaumlstra Goumltaland region are presented in Figures A3 and A4 respectively
Figure A3 NOX emissions for the Vaumlstra Goumltaland region for the All Petrol scenario
A comparison of emissions from ethanol and petrol fuelled cars IVL report B1962 Health risk assessment for Vaumlstra Goumltaland
34
Figure A4 Acetaldehyde emissions for the Vaumlstra Goumltaland region for the All Ethanol scenario
A comparison of emissions from ethanol and petrol fuelled cars IVL report B1962 Health risk assessment for Vaumlstra Goumltaland
35
Appendix 4 Dispersion modelling results
The difference in yearly average concentration between scenario S1 and S2 for acetaldehyde and benzene can be seen in Figure A5 and Figure A6 respectively a)
b)
Figure A5 The difference in yearly average concentrations of acetaldehyde for 2020 between the all E85 (S2) and all petrol (S1) scenarios presented as a) microgm3 and as b) percentage for the Gothenburg area
A comparison of emissions from ethanol and petrol fuelled cars IVL report B1962 Health risk assessment for Vaumlstra Goumltaland
36
a)
b) all E85 c) all petrol
Figure A6 a) the difference in yearly average concentrations (gm3) of benzene for 2020 between the all E85 (S2) and all petrol (S1) scenarios yearly means for b) all E85 and c) all petrol (note the different scales)
The difference in the calculated NOX NO2 and ozone concentrations between the two scenarios are shown in Figures A7 A8 and A9
A comparison of emissions from ethanol and petrol fuelled cars IVL report B1962 Health risk assessment for Vaumlstra Goumltaland
37
a)
b)
Figure A7 The difference in yearly average concentrations of NOX for 2020 between the all E85 (S2) and all petrol (S1) scenarios presented as a) microgm3 and as b) percentage for the Gothenburg area
A comparison of emissions from ethanol and petrol fuelled cars IVL report B1962 Health risk assessment for Vaumlstra Goumltaland
38
a)
Figure A8 The difference in yearly average concentrations of NO2 for 2020 between the all E85 (S2) and all petrol (S1) scenarios presented as a) microgm3 and as b) percentage for the Gothenburg area
A comparison of emissions from ethanol and petrol fuelled cars IVL report B1962 Health risk assessment for Vaumlstra Goumltaland
39
a)
b)
Figure A9 The difference in yearly average concentrations of ozone for 2020 between the all E85 (S2) and all petrol (S1) scenarios presented as a) microgm3 and as b) percentage for mainly the Gothenburg area
A comparison of emissions from ethanol and petrol fuelled cars IVL report B1962 Health risk assessment for Vaumlstra Goumltaland
40
Appendix 5 Detailed Exposure data
Detailed exposure data for the difference between the all E85 (S2) and the all petrol (S1) scenarios can be found in Table A5
Table A5 Exposure data for the difference between the all E85 (S2) and the all petrol (S1) scenarios
Acetaldehyde diff E-P (microgm3)
Populated weighted mean
Number of people Percentage of population
0 - 01 627198 582 01 - 02 163394 152 02 - 03 134879 125 03 - 04 88099 82 04 - 05 38686 36 05 - 06 16880 16 06 - 07 7983 07 07 - 08 1248 01 Tot 014 1078367 Benzene diff E-P (microgm3)
Populated weighted mean
Number of people Percentage of population
-03 - -02 26680 25 -02 - -01 205757 191 -01 - -0 845930 784 Tot -0074 1078367 NO2 diff E-P (microgm3) Populated weighted
mean Number of people Percentage of
population -04 - -03 7698 07 -03 - -02 50131 46 -02 - -01 296288 275 -01 - -0 724250 672 Tot -009 1078367 NOX diff E-P (microgm3) Populated weighted
mean Number of people Percentage of
population -06 - -05 7698 -05 - -04 19639 18 -04 - -03 36626 34 -03 - -02 161685 150 -02 - -01 186500 173 -01 - -0 666219 618 Tot -012 1078367 O3 diff E-P (microgm3) Populated weighted
mean Number of people Percentage of
population -02 - -01 779132 723 -01 - -0 266417 247 0 - 01 32818 30 Tot -012 1078367
Exposure data for the total levels in the two scenarios can be found in Table A6
A comparison of emissions from ethanol and petrol fuelled cars IVL report B1962 Health risk assessment for Vaumlstra Goumltaland
41
Table A6 Exposure data for the total levels in the two scenarios
Acetaldehyde tot All ethanol (microgm3)
Populated weighted mean
Number of people Percentage of population
06 - 07 568825 527 07 - 08 171845 159 08 - 09 124551 115 09 - 10 100946 94 10 - 11 59235 55 11 - 12 30559 28 12 - 13 13175 12 13 - 14 7983 07 14 - 15 1248 01 Tot 077 1078367 Acetaldehyde tot All petrol (microgm3)
Populated weighted mean
Number of people Percentage of population
05 - 06 45111 42 06 - 07 1032008 957 07 - 08 1248 01 Tot 065 1078367 Benzene tot All ethanol (microgm3)
Populated weighted mean
Number of people Percentage of population
0 - 01 1055961 98 01 - 02 22406 2 Tot 005 1078367 Benzene tot All petrol (microgm3)
Populated weighted mean
Number of people Percentage of population
0 - 01 729093 676 01 - 02 232961 216 02 - 03 94042 87 03 - 04 21023 19 04 - 05 1248 01 Tot 010 1078367 NOX tot All ethanol (microgm3)
Populated weighted mean
Number of people Percentage of population
0-10 779108 722 10-20 254658 236 20-30 28683 27 30-40 11070 10 40-50 3426 03 50-60 0 00 60-70 0 00 70-80 639 01 80-90 0 00 90-100 0 00 100-110 783 01 Tot 84 1078367 NOX tot All petrol (microgm3)
Populated weighted mean
Number of people Percentage of population
0-10 769557 714 10-20 264209 245 20-30 28683 27 30-40 11070 10 40-50 3426 03 50-60 0 00
A comparison of emissions from ethanol and petrol fuelled cars IVL report B1962 Health risk assessment for Vaumlstra Goumltaland
42
60-70 0 00 70-80 639 01 80-90 0 00 90-100 0 00 100-110 783 01 Tot 85 1078367 O3 tot All ethanol (microgm3)
Populated weighted mean
Number of people Percentage of population
40-45 1422 01 45-50 26487 25 50-55 176636 164 55-60 770370 714 60-65 103452 96 Tot 569 1078367 O3 tot All petrol (microgm3)
Populated weighted mean
Number of people Percentage of population
40-45 1422 01 45-50 20229 19 50-55 181876 169 55-60 763361 708 60-65 111479 103 Tot 570 1078367 PM25 tot All ethanol (microgm3)
Populated weighted mean
Number of people Percentage of population
1-2 0 00 2-3 885325 821 3-4 192259 178 4-5 783 01 Tot 268 1078367 PM25 tot All petrol (microgm3)
Populated weighted mean
Number of people Percentage of population
1-2 0 00 2-3 868773 806 3-4 208811 194 4-5 783 01 Tot 270 1078367
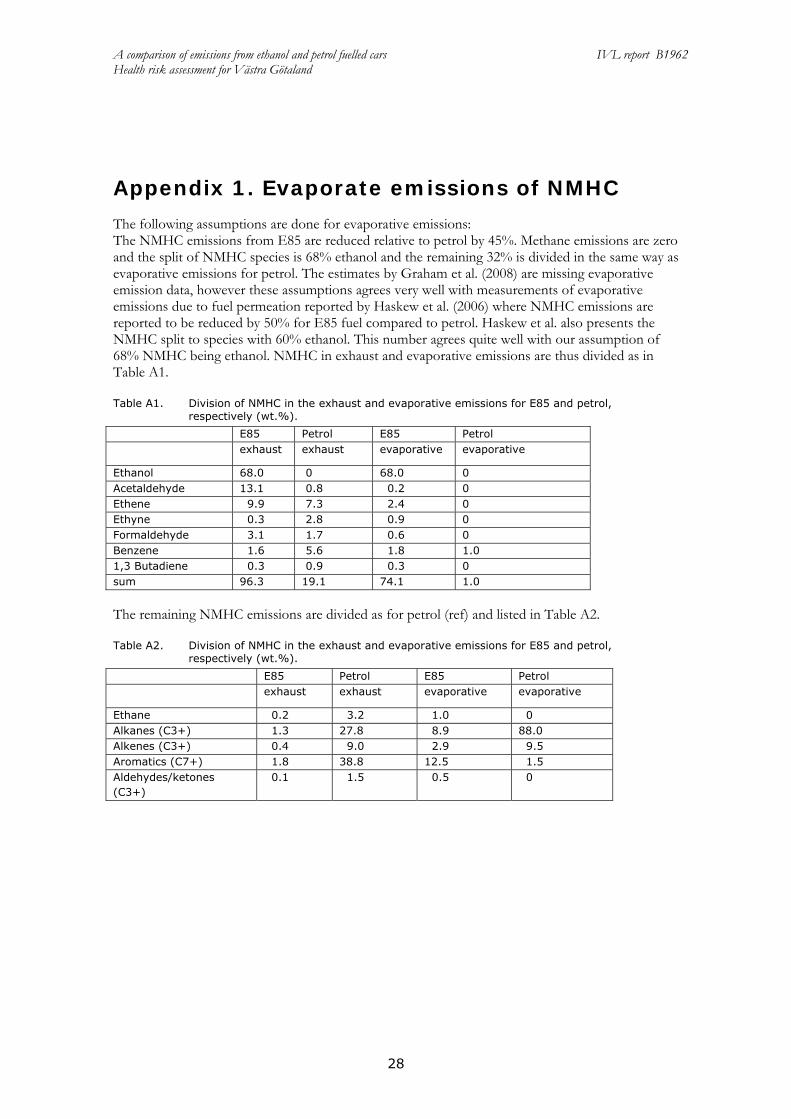
A comparison of emissions from ethanol and petrol fuelled cars IVL report B1962 Health risk assessment for Vaumlstra Goumltaland
30
if v_mid lt= 0 then ( ksite = NE) else ksite = SW endif NO2(bc) = [(NO2(isite)u_mid(isite) + NO2(jsite)u_mid(jsite))2 + NO2(ksite)v_mid(ksite)] [(u_mid(isite) + u_mid(jsite))2 + v_mid(ksite)]
Figure A1 Gridcells covering Gothenburg domain and its boundary in EMEP model plotted on latitude-
longitude coordinates The red square represents centre of Gothenburg and the blue line the coastline EMEP i and j coordinates for the boundary gridcells are SE-S = 57-60 SE-N = 57-61 NW-S = 55-60 NW-N = 55-61 NE = 56-62 NW = 56-59 and for Gothenburg grid cells are Gbg-NE = 56-61 Gbg-SW = 56-60
A23 Atmospheric chemistry
The role of secondary chemistry in for the concentration of acetaldehyde are studied by first excluding the primary acetaldehyde emissions from the EMEP model simulations of scenarios S1 and S2 and then by excluding all NMVOC emissions from the car category with spark ignition engines The contribution from the primary acetaldehyde emissions as well as the contribution of secondary acetaldehyde formed from other NMVOC to the total acetaldehyde concentration is then obtained However the secondary chemistry is highly nonlinear due to the interactions of NMVOCs with ozone and OH and thus the results for the contribution of secondary acetaldehyde are somewhat uncertain Differences in acetaldehyde concentrations between S1 and S2 scenarios are studied with respect to contribution of primary and secondary acetaldehyde It is observed that in summer background air the monthly mean contribution of the secondary acetaldehyde is of the same magnitude as the contribution of the primary acetaldehyde to the difference between S1 and
565
57
575
58
585
105 115 125 135 145
Long
Lat
Gbg-SW
Gbg-NE
SE-S
NW-N
NW-S
SE-N
SW
NE
55-59
57-59
55-62
A comparison of emissions from ethanol and petrol fuelled cars IVL report B1962 Health risk assessment for Vaumlstra Goumltaland
31
S2 In the winter and in more polluted atmosphere (Gothenburg grid cells) the contribution from secondary acetaldehyde to the concentration difference appears to be negative due to the chemistry feedback ie the E-85 scenario has less secondary acetaldehyde than the all-petrol scenario
A comparison of S2-S1 differences in primary and secondary acetaldehyde concentrations in the background (=upwind) and Gothenburg grid cells show no increase in the secondary acetaldehyde from upwind to the Gothenburg grid cell It can thus be concluded that there is no significant contribution from secondary aldehydes on the small scale (tenths of km) Conclusion from this sensitivity study is that the secondary formaldehyde can be of importance under summer in the clean background air but that formation on the local scale is unimportant Using EMEP simulated boundary concentrations of acetaldehyde in the local scale model and simulating the primary acetaldehyde emissions will capture the most important features of acetaldehyde dispersion and chemistry in Vaumlstra Goumltaland
In the EMEP model the tail-pipe PM emissions are specified as primary particles Emissions of NOX and VOCs (and NH3 SO2) are oxidised in the atmosphere and a part is then transferred through the gas-to-particle transport to the PM as secondary PM The petrol fuelled cars emit both more primary PM and more NOX compared to the E85 cars If we compare differences in primary and secondary PM between the S1 and S2 scenarios simulated by EMEP we can directly see what part of the difference is from the tail-pipe emissions of the primary particles and what part is from the formation of the secondary PM in atmosphere (mostly from higher emissions of NOX) Table A4 shows the differences between S1 and S2 (S1-S2) of monthly PM averages for January and June (two months with low and high photochemical activities respectively) It can be seen that the higher formation of secondary PM in the S1 (all-petrol) scenario is more important than the higher tail-pipe emission of primary PM by factor 10 - 20
When we compare simulated PM differences between S1-S2 for the background air (=upwind) grid cells and for grid cells including Gothenburg (50 km x 50 km scale) we can see significant increase in primary PM in the S1 scenario from the upwind grid cells to Gothenburg (746 in winter 132 in summer) while no systematic increase can be seen for the secondary PM (-42 in winter +24 in summer) From this comparison it can be concluded that no systematic increase in secondary PM can be seen (in difference from the primary PM) on the scale of 50-100 km and we can neglect this process on the small scale However the overall change in PM concentrations due to the switch of the fuel is very small both on the large scale and on the small scale as can be seen when the differences in PM concentrations between S1 and S2 are compared to absolute PM concentrations in S1 presented in the last column of Table A4
Table A4 Differences in primary and secondary PM concentrations between the lsquoAll-petrolrsquo (S1) and lsquoE-85rsquo (S2) scenarios simulated in gridcells upwind Gothenburg and in gridcells including Gothenburg (2 50 km x 50 km gridcells)
S1-S2 Background
S1-S2 Gothenburg
Increase S1-S2 Gothenburg
S1 Background
μgm3 μgm3 μgm3 bkgnd μgm3
Prim PM10 Jan 00008 00014 00006 746 084
Jun 00008 00018 00010 1319 084
Sec PM10 Jan 00155 00148 -00006
-42 157
Jun 00080 00081 00002 24 213
The sensitivity of the used emission factors for NMHC with respect to the ozone formation in the region of the Swedish West Coast can be analysed with the help of results from studying the
A comparison of emissions from ethanol and petrol fuelled cars IVL report B1962 Health risk assessment for Vaumlstra Goumltaland
32
formation of secondary acetaldehyde In this study first all primary acetaldehyde emitted by the E85 fleet are omitted in a model simulation (S2_nopAA) and secondly all NMHC emissions from the E-85 fleet are switched off (S2_noVOC) Acetaldehyde has a somewhat higher though still comparable photochemical ozone creation potential compared to ethanol (ethanol 44-63 acetaldehyde 68-80 Altenstedt and Pleijel 2000) and this simulation will thus also give information on the sensitivity of the calculations to uncertainties in the ethanol emissions Setting the emission factor for NMHC to zero gives the sensitivity to the emission factor of total NMHC Figure A2 shows the differences in ozone concentration as a result of acetaldehyde only and the total NMHC from the E85 car fleet (S2 scenario) We can see that the effect on ozone formation is very small for the Swedish West coast The reason is that the ozone formation in this area is controlled by the availability of NOX while NMHC or rather their degradation products the peroxy radicals that serve as a lsquofuelrsquo to ozone formation are usually in excess here and further VOC emissions do not increase ozone concentrations significantly The situation looks different in areas that are more heavily polluted with NOX andor which is limited in the availability of peroxy radicals The results from this sensitivity study are fully consistent with the observed increase in ozone concentrations as a result of lower NO emissions (the so-called ozone titration) only very close to the major roads but no larger-scale decrease in ozone concentrations in the Gothenburg area or in any other communities
Figure A2 Sensitivity of the ozone formation in the 2 EMEP model grid cells covering Gothenburg (blue) and in the 6 surrounding grid cells (red see Fig A1) to changes in NMHC emission factor of the E85 fuelled cars lsquobasersquo is simulation S2 with EF for NMHC as in Table 3 lsquonoVOCrsquo is S2 with EF for all NMHC = 0 lsquonopAArsquo is S2 with EF for acetaldehyde = 0 a ndash Mean sensitivity in January absolute difference in ozone formation in ppb(V) as a result of NMHC (base-noVOC) and acetaldehyde (base-nopAA) emissions b ndash Sensitivity relative to ozone concentration in the S2-base simulation January c ndash same as a) but June d ndash same as b) but June
‐002
‐001
0
001
base‐noVOC base‐nopAA
ΔO3(ppb)
a)
0
001
002
base‐noVOC base‐nopAA
ΔO
3(ppb)
c)
‐010
‐005
000
005
base‐noVOC base‐nopAA
ΔO
3
b)
000
002
004
006
base‐noVOC base‐nopAA
ΔO
3
d)
A comparison of emissions from ethanol and petrol fuelled cars IVL report B1962 Health risk assessment for Vaumlstra Goumltaland
33
Appendix 3 Emission results
The geographically distributed NOX and acetaldehyde emissions for the Vaumlstra Goumltaland region are presented in Figures A3 and A4 respectively
Figure A3 NOX emissions for the Vaumlstra Goumltaland region for the All Petrol scenario
A comparison of emissions from ethanol and petrol fuelled cars IVL report B1962 Health risk assessment for Vaumlstra Goumltaland
34
Figure A4 Acetaldehyde emissions for the Vaumlstra Goumltaland region for the All Ethanol scenario
A comparison of emissions from ethanol and petrol fuelled cars IVL report B1962 Health risk assessment for Vaumlstra Goumltaland
35
Appendix 4 Dispersion modelling results
The difference in yearly average concentration between scenario S1 and S2 for acetaldehyde and benzene can be seen in Figure A5 and Figure A6 respectively a)
b)
Figure A5 The difference in yearly average concentrations of acetaldehyde for 2020 between the all E85 (S2) and all petrol (S1) scenarios presented as a) microgm3 and as b) percentage for the Gothenburg area
A comparison of emissions from ethanol and petrol fuelled cars IVL report B1962 Health risk assessment for Vaumlstra Goumltaland
36
a)
b) all E85 c) all petrol
Figure A6 a) the difference in yearly average concentrations (gm3) of benzene for 2020 between the all E85 (S2) and all petrol (S1) scenarios yearly means for b) all E85 and c) all petrol (note the different scales)
The difference in the calculated NOX NO2 and ozone concentrations between the two scenarios are shown in Figures A7 A8 and A9
A comparison of emissions from ethanol and petrol fuelled cars IVL report B1962 Health risk assessment for Vaumlstra Goumltaland
37
a)
b)
Figure A7 The difference in yearly average concentrations of NOX for 2020 between the all E85 (S2) and all petrol (S1) scenarios presented as a) microgm3 and as b) percentage for the Gothenburg area
A comparison of emissions from ethanol and petrol fuelled cars IVL report B1962 Health risk assessment for Vaumlstra Goumltaland
38
a)
Figure A8 The difference in yearly average concentrations of NO2 for 2020 between the all E85 (S2) and all petrol (S1) scenarios presented as a) microgm3 and as b) percentage for the Gothenburg area
A comparison of emissions from ethanol and petrol fuelled cars IVL report B1962 Health risk assessment for Vaumlstra Goumltaland
39
a)
b)
Figure A9 The difference in yearly average concentrations of ozone for 2020 between the all E85 (S2) and all petrol (S1) scenarios presented as a) microgm3 and as b) percentage for mainly the Gothenburg area
A comparison of emissions from ethanol and petrol fuelled cars IVL report B1962 Health risk assessment for Vaumlstra Goumltaland
40
Appendix 5 Detailed Exposure data
Detailed exposure data for the difference between the all E85 (S2) and the all petrol (S1) scenarios can be found in Table A5
Table A5 Exposure data for the difference between the all E85 (S2) and the all petrol (S1) scenarios
Acetaldehyde diff E-P (microgm3)
Populated weighted mean
Number of people Percentage of population
0 - 01 627198 582 01 - 02 163394 152 02 - 03 134879 125 03 - 04 88099 82 04 - 05 38686 36 05 - 06 16880 16 06 - 07 7983 07 07 - 08 1248 01 Tot 014 1078367 Benzene diff E-P (microgm3)
Populated weighted mean
Number of people Percentage of population
-03 - -02 26680 25 -02 - -01 205757 191 -01 - -0 845930 784 Tot -0074 1078367 NO2 diff E-P (microgm3) Populated weighted
mean Number of people Percentage of
population -04 - -03 7698 07 -03 - -02 50131 46 -02 - -01 296288 275 -01 - -0 724250 672 Tot -009 1078367 NOX diff E-P (microgm3) Populated weighted
mean Number of people Percentage of
population -06 - -05 7698 -05 - -04 19639 18 -04 - -03 36626 34 -03 - -02 161685 150 -02 - -01 186500 173 -01 - -0 666219 618 Tot -012 1078367 O3 diff E-P (microgm3) Populated weighted
mean Number of people Percentage of
population -02 - -01 779132 723 -01 - -0 266417 247 0 - 01 32818 30 Tot -012 1078367
Exposure data for the total levels in the two scenarios can be found in Table A6
A comparison of emissions from ethanol and petrol fuelled cars IVL report B1962 Health risk assessment for Vaumlstra Goumltaland
41
Table A6 Exposure data for the total levels in the two scenarios
Acetaldehyde tot All ethanol (microgm3)
Populated weighted mean
Number of people Percentage of population
06 - 07 568825 527 07 - 08 171845 159 08 - 09 124551 115 09 - 10 100946 94 10 - 11 59235 55 11 - 12 30559 28 12 - 13 13175 12 13 - 14 7983 07 14 - 15 1248 01 Tot 077 1078367 Acetaldehyde tot All petrol (microgm3)
Populated weighted mean
Number of people Percentage of population
05 - 06 45111 42 06 - 07 1032008 957 07 - 08 1248 01 Tot 065 1078367 Benzene tot All ethanol (microgm3)
Populated weighted mean
Number of people Percentage of population
0 - 01 1055961 98 01 - 02 22406 2 Tot 005 1078367 Benzene tot All petrol (microgm3)
Populated weighted mean
Number of people Percentage of population
0 - 01 729093 676 01 - 02 232961 216 02 - 03 94042 87 03 - 04 21023 19 04 - 05 1248 01 Tot 010 1078367 NOX tot All ethanol (microgm3)
Populated weighted mean
Number of people Percentage of population
0-10 779108 722 10-20 254658 236 20-30 28683 27 30-40 11070 10 40-50 3426 03 50-60 0 00 60-70 0 00 70-80 639 01 80-90 0 00 90-100 0 00 100-110 783 01 Tot 84 1078367 NOX tot All petrol (microgm3)
Populated weighted mean
Number of people Percentage of population
0-10 769557 714 10-20 264209 245 20-30 28683 27 30-40 11070 10 40-50 3426 03 50-60 0 00
A comparison of emissions from ethanol and petrol fuelled cars IVL report B1962 Health risk assessment for Vaumlstra Goumltaland
42
60-70 0 00 70-80 639 01 80-90 0 00 90-100 0 00 100-110 783 01 Tot 85 1078367 O3 tot All ethanol (microgm3)
Populated weighted mean
Number of people Percentage of population
40-45 1422 01 45-50 26487 25 50-55 176636 164 55-60 770370 714 60-65 103452 96 Tot 569 1078367 O3 tot All petrol (microgm3)
Populated weighted mean
Number of people Percentage of population
40-45 1422 01 45-50 20229 19 50-55 181876 169 55-60 763361 708 60-65 111479 103 Tot 570 1078367 PM25 tot All ethanol (microgm3)
Populated weighted mean
Number of people Percentage of population
1-2 0 00 2-3 885325 821 3-4 192259 178 4-5 783 01 Tot 268 1078367 PM25 tot All petrol (microgm3)
Populated weighted mean
Number of people Percentage of population
1-2 0 00 2-3 868773 806 3-4 208811 194 4-5 783 01 Tot 270 1078367
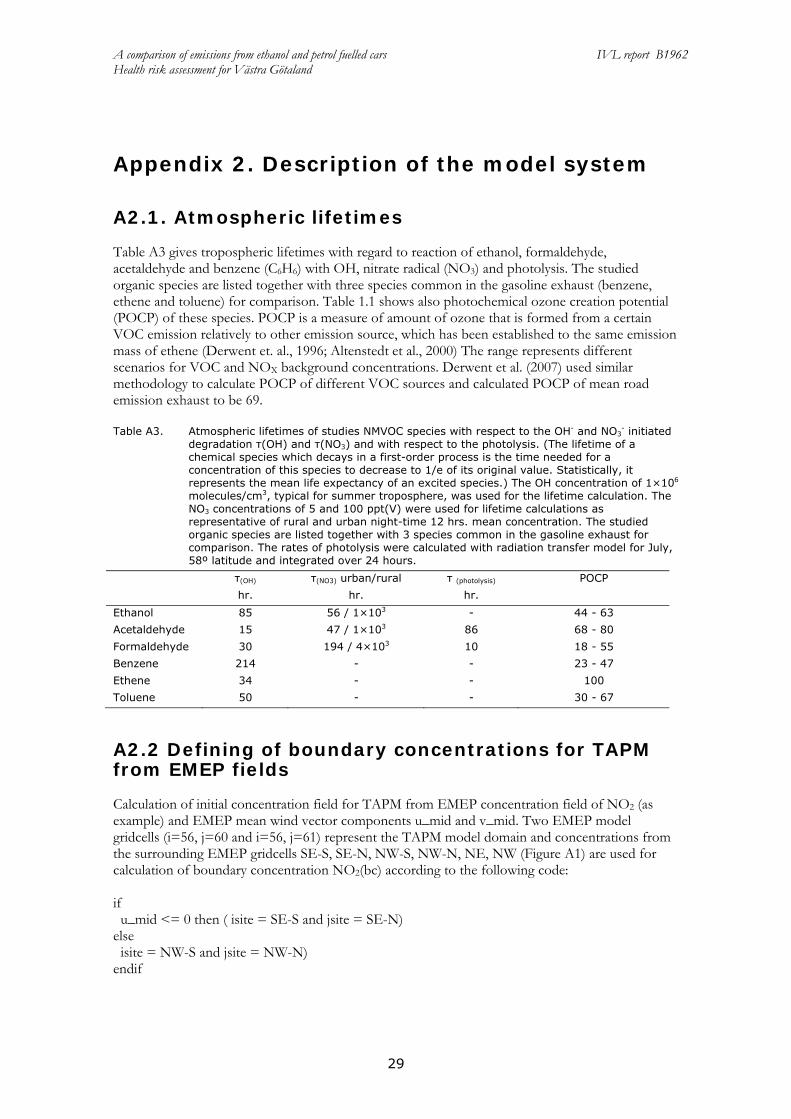
A comparison of emissions from ethanol and petrol fuelled cars IVL report B1962 Health risk assessment for Vaumlstra Goumltaland
31
S2 In the winter and in more polluted atmosphere (Gothenburg grid cells) the contribution from secondary acetaldehyde to the concentration difference appears to be negative due to the chemistry feedback ie the E-85 scenario has less secondary acetaldehyde than the all-petrol scenario
A comparison of S2-S1 differences in primary and secondary acetaldehyde concentrations in the background (=upwind) and Gothenburg grid cells show no increase in the secondary acetaldehyde from upwind to the Gothenburg grid cell It can thus be concluded that there is no significant contribution from secondary aldehydes on the small scale (tenths of km) Conclusion from this sensitivity study is that the secondary formaldehyde can be of importance under summer in the clean background air but that formation on the local scale is unimportant Using EMEP simulated boundary concentrations of acetaldehyde in the local scale model and simulating the primary acetaldehyde emissions will capture the most important features of acetaldehyde dispersion and chemistry in Vaumlstra Goumltaland
In the EMEP model the tail-pipe PM emissions are specified as primary particles Emissions of NOX and VOCs (and NH3 SO2) are oxidised in the atmosphere and a part is then transferred through the gas-to-particle transport to the PM as secondary PM The petrol fuelled cars emit both more primary PM and more NOX compared to the E85 cars If we compare differences in primary and secondary PM between the S1 and S2 scenarios simulated by EMEP we can directly see what part of the difference is from the tail-pipe emissions of the primary particles and what part is from the formation of the secondary PM in atmosphere (mostly from higher emissions of NOX) Table A4 shows the differences between S1 and S2 (S1-S2) of monthly PM averages for January and June (two months with low and high photochemical activities respectively) It can be seen that the higher formation of secondary PM in the S1 (all-petrol) scenario is more important than the higher tail-pipe emission of primary PM by factor 10 - 20
When we compare simulated PM differences between S1-S2 for the background air (=upwind) grid cells and for grid cells including Gothenburg (50 km x 50 km scale) we can see significant increase in primary PM in the S1 scenario from the upwind grid cells to Gothenburg (746 in winter 132 in summer) while no systematic increase can be seen for the secondary PM (-42 in winter +24 in summer) From this comparison it can be concluded that no systematic increase in secondary PM can be seen (in difference from the primary PM) on the scale of 50-100 km and we can neglect this process on the small scale However the overall change in PM concentrations due to the switch of the fuel is very small both on the large scale and on the small scale as can be seen when the differences in PM concentrations between S1 and S2 are compared to absolute PM concentrations in S1 presented in the last column of Table A4
Table A4 Differences in primary and secondary PM concentrations between the lsquoAll-petrolrsquo (S1) and lsquoE-85rsquo (S2) scenarios simulated in gridcells upwind Gothenburg and in gridcells including Gothenburg (2 50 km x 50 km gridcells)
S1-S2 Background
S1-S2 Gothenburg
Increase S1-S2 Gothenburg
S1 Background
μgm3 μgm3 μgm3 bkgnd μgm3
Prim PM10 Jan 00008 00014 00006 746 084
Jun 00008 00018 00010 1319 084
Sec PM10 Jan 00155 00148 -00006
-42 157
Jun 00080 00081 00002 24 213
The sensitivity of the used emission factors for NMHC with respect to the ozone formation in the region of the Swedish West Coast can be analysed with the help of results from studying the
A comparison of emissions from ethanol and petrol fuelled cars IVL report B1962 Health risk assessment for Vaumlstra Goumltaland
32
formation of secondary acetaldehyde In this study first all primary acetaldehyde emitted by the E85 fleet are omitted in a model simulation (S2_nopAA) and secondly all NMHC emissions from the E-85 fleet are switched off (S2_noVOC) Acetaldehyde has a somewhat higher though still comparable photochemical ozone creation potential compared to ethanol (ethanol 44-63 acetaldehyde 68-80 Altenstedt and Pleijel 2000) and this simulation will thus also give information on the sensitivity of the calculations to uncertainties in the ethanol emissions Setting the emission factor for NMHC to zero gives the sensitivity to the emission factor of total NMHC Figure A2 shows the differences in ozone concentration as a result of acetaldehyde only and the total NMHC from the E85 car fleet (S2 scenario) We can see that the effect on ozone formation is very small for the Swedish West coast The reason is that the ozone formation in this area is controlled by the availability of NOX while NMHC or rather their degradation products the peroxy radicals that serve as a lsquofuelrsquo to ozone formation are usually in excess here and further VOC emissions do not increase ozone concentrations significantly The situation looks different in areas that are more heavily polluted with NOX andor which is limited in the availability of peroxy radicals The results from this sensitivity study are fully consistent with the observed increase in ozone concentrations as a result of lower NO emissions (the so-called ozone titration) only very close to the major roads but no larger-scale decrease in ozone concentrations in the Gothenburg area or in any other communities
Figure A2 Sensitivity of the ozone formation in the 2 EMEP model grid cells covering Gothenburg (blue) and in the 6 surrounding grid cells (red see Fig A1) to changes in NMHC emission factor of the E85 fuelled cars lsquobasersquo is simulation S2 with EF for NMHC as in Table 3 lsquonoVOCrsquo is S2 with EF for all NMHC = 0 lsquonopAArsquo is S2 with EF for acetaldehyde = 0 a ndash Mean sensitivity in January absolute difference in ozone formation in ppb(V) as a result of NMHC (base-noVOC) and acetaldehyde (base-nopAA) emissions b ndash Sensitivity relative to ozone concentration in the S2-base simulation January c ndash same as a) but June d ndash same as b) but June
‐002
‐001
0
001
base‐noVOC base‐nopAA
ΔO3(ppb)
a)
0
001
002
base‐noVOC base‐nopAA
ΔO
3(ppb)
c)
‐010
‐005
000
005
base‐noVOC base‐nopAA
ΔO
3
b)
000
002
004
006
base‐noVOC base‐nopAA
ΔO
3
d)
A comparison of emissions from ethanol and petrol fuelled cars IVL report B1962 Health risk assessment for Vaumlstra Goumltaland
33
Appendix 3 Emission results
The geographically distributed NOX and acetaldehyde emissions for the Vaumlstra Goumltaland region are presented in Figures A3 and A4 respectively
Figure A3 NOX emissions for the Vaumlstra Goumltaland region for the All Petrol scenario
A comparison of emissions from ethanol and petrol fuelled cars IVL report B1962 Health risk assessment for Vaumlstra Goumltaland
34
Figure A4 Acetaldehyde emissions for the Vaumlstra Goumltaland region for the All Ethanol scenario
A comparison of emissions from ethanol and petrol fuelled cars IVL report B1962 Health risk assessment for Vaumlstra Goumltaland
35
Appendix 4 Dispersion modelling results
The difference in yearly average concentration between scenario S1 and S2 for acetaldehyde and benzene can be seen in Figure A5 and Figure A6 respectively a)
b)
Figure A5 The difference in yearly average concentrations of acetaldehyde for 2020 between the all E85 (S2) and all petrol (S1) scenarios presented as a) microgm3 and as b) percentage for the Gothenburg area
A comparison of emissions from ethanol and petrol fuelled cars IVL report B1962 Health risk assessment for Vaumlstra Goumltaland
36
a)
b) all E85 c) all petrol
Figure A6 a) the difference in yearly average concentrations (gm3) of benzene for 2020 between the all E85 (S2) and all petrol (S1) scenarios yearly means for b) all E85 and c) all petrol (note the different scales)
The difference in the calculated NOX NO2 and ozone concentrations between the two scenarios are shown in Figures A7 A8 and A9
A comparison of emissions from ethanol and petrol fuelled cars IVL report B1962 Health risk assessment for Vaumlstra Goumltaland
37
a)
b)
Figure A7 The difference in yearly average concentrations of NOX for 2020 between the all E85 (S2) and all petrol (S1) scenarios presented as a) microgm3 and as b) percentage for the Gothenburg area
A comparison of emissions from ethanol and petrol fuelled cars IVL report B1962 Health risk assessment for Vaumlstra Goumltaland
38
a)
Figure A8 The difference in yearly average concentrations of NO2 for 2020 between the all E85 (S2) and all petrol (S1) scenarios presented as a) microgm3 and as b) percentage for the Gothenburg area
A comparison of emissions from ethanol and petrol fuelled cars IVL report B1962 Health risk assessment for Vaumlstra Goumltaland
39
a)
b)
Figure A9 The difference in yearly average concentrations of ozone for 2020 between the all E85 (S2) and all petrol (S1) scenarios presented as a) microgm3 and as b) percentage for mainly the Gothenburg area
A comparison of emissions from ethanol and petrol fuelled cars IVL report B1962 Health risk assessment for Vaumlstra Goumltaland
40
Appendix 5 Detailed Exposure data
Detailed exposure data for the difference between the all E85 (S2) and the all petrol (S1) scenarios can be found in Table A5
Table A5 Exposure data for the difference between the all E85 (S2) and the all petrol (S1) scenarios
Acetaldehyde diff E-P (microgm3)
Populated weighted mean
Number of people Percentage of population
0 - 01 627198 582 01 - 02 163394 152 02 - 03 134879 125 03 - 04 88099 82 04 - 05 38686 36 05 - 06 16880 16 06 - 07 7983 07 07 - 08 1248 01 Tot 014 1078367 Benzene diff E-P (microgm3)
Populated weighted mean
Number of people Percentage of population
-03 - -02 26680 25 -02 - -01 205757 191 -01 - -0 845930 784 Tot -0074 1078367 NO2 diff E-P (microgm3) Populated weighted
mean Number of people Percentage of
population -04 - -03 7698 07 -03 - -02 50131 46 -02 - -01 296288 275 -01 - -0 724250 672 Tot -009 1078367 NOX diff E-P (microgm3) Populated weighted
mean Number of people Percentage of
population -06 - -05 7698 -05 - -04 19639 18 -04 - -03 36626 34 -03 - -02 161685 150 -02 - -01 186500 173 -01 - -0 666219 618 Tot -012 1078367 O3 diff E-P (microgm3) Populated weighted
mean Number of people Percentage of
population -02 - -01 779132 723 -01 - -0 266417 247 0 - 01 32818 30 Tot -012 1078367
Exposure data for the total levels in the two scenarios can be found in Table A6
A comparison of emissions from ethanol and petrol fuelled cars IVL report B1962 Health risk assessment for Vaumlstra Goumltaland
41
Table A6 Exposure data for the total levels in the two scenarios
Acetaldehyde tot All ethanol (microgm3)
Populated weighted mean
Number of people Percentage of population
06 - 07 568825 527 07 - 08 171845 159 08 - 09 124551 115 09 - 10 100946 94 10 - 11 59235 55 11 - 12 30559 28 12 - 13 13175 12 13 - 14 7983 07 14 - 15 1248 01 Tot 077 1078367 Acetaldehyde tot All petrol (microgm3)
Populated weighted mean
Number of people Percentage of population
05 - 06 45111 42 06 - 07 1032008 957 07 - 08 1248 01 Tot 065 1078367 Benzene tot All ethanol (microgm3)
Populated weighted mean
Number of people Percentage of population
0 - 01 1055961 98 01 - 02 22406 2 Tot 005 1078367 Benzene tot All petrol (microgm3)
Populated weighted mean
Number of people Percentage of population
0 - 01 729093 676 01 - 02 232961 216 02 - 03 94042 87 03 - 04 21023 19 04 - 05 1248 01 Tot 010 1078367 NOX tot All ethanol (microgm3)
Populated weighted mean
Number of people Percentage of population
0-10 779108 722 10-20 254658 236 20-30 28683 27 30-40 11070 10 40-50 3426 03 50-60 0 00 60-70 0 00 70-80 639 01 80-90 0 00 90-100 0 00 100-110 783 01 Tot 84 1078367 NOX tot All petrol (microgm3)
Populated weighted mean
Number of people Percentage of population
0-10 769557 714 10-20 264209 245 20-30 28683 27 30-40 11070 10 40-50 3426 03 50-60 0 00
A comparison of emissions from ethanol and petrol fuelled cars IVL report B1962 Health risk assessment for Vaumlstra Goumltaland
42
60-70 0 00 70-80 639 01 80-90 0 00 90-100 0 00 100-110 783 01 Tot 85 1078367 O3 tot All ethanol (microgm3)
Populated weighted mean
Number of people Percentage of population
40-45 1422 01 45-50 26487 25 50-55 176636 164 55-60 770370 714 60-65 103452 96 Tot 569 1078367 O3 tot All petrol (microgm3)
Populated weighted mean
Number of people Percentage of population
40-45 1422 01 45-50 20229 19 50-55 181876 169 55-60 763361 708 60-65 111479 103 Tot 570 1078367 PM25 tot All ethanol (microgm3)
Populated weighted mean
Number of people Percentage of population
1-2 0 00 2-3 885325 821 3-4 192259 178 4-5 783 01 Tot 268 1078367 PM25 tot All petrol (microgm3)
Populated weighted mean
Number of people Percentage of population
1-2 0 00 2-3 868773 806 3-4 208811 194 4-5 783 01 Tot 270 1078367
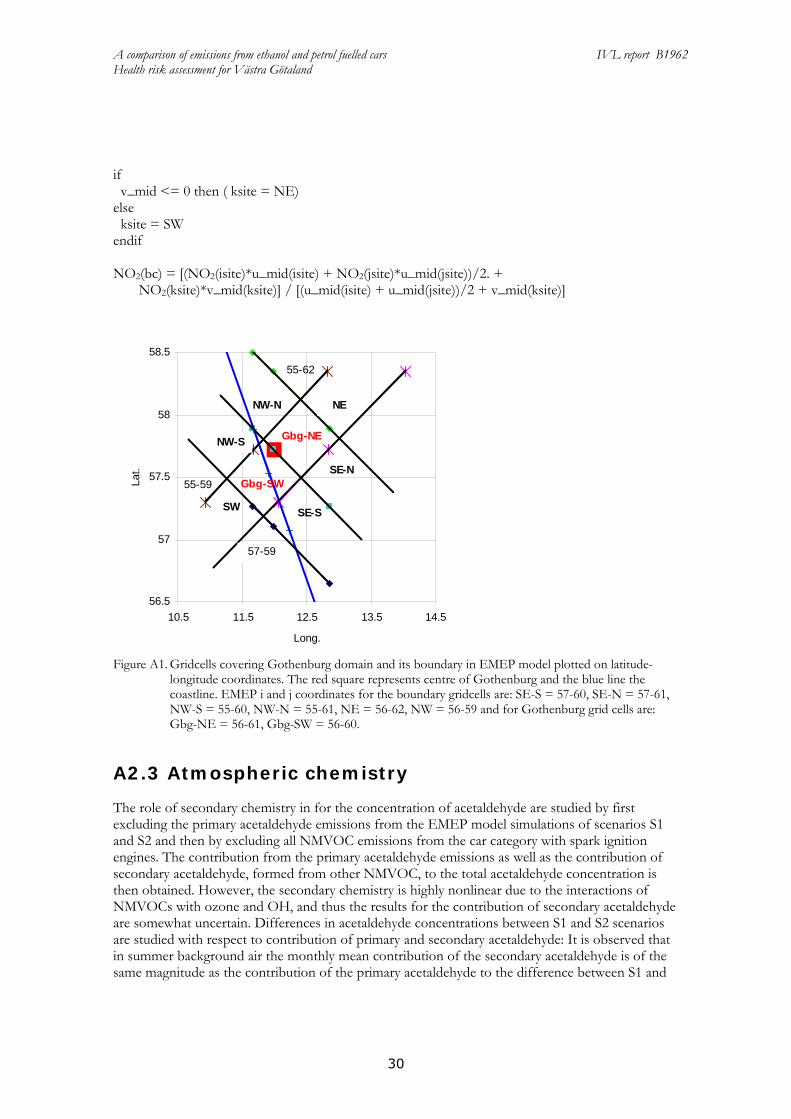
A comparison of emissions from ethanol and petrol fuelled cars IVL report B1962 Health risk assessment for Vaumlstra Goumltaland
32
formation of secondary acetaldehyde In this study first all primary acetaldehyde emitted by the E85 fleet are omitted in a model simulation (S2_nopAA) and secondly all NMHC emissions from the E-85 fleet are switched off (S2_noVOC) Acetaldehyde has a somewhat higher though still comparable photochemical ozone creation potential compared to ethanol (ethanol 44-63 acetaldehyde 68-80 Altenstedt and Pleijel 2000) and this simulation will thus also give information on the sensitivity of the calculations to uncertainties in the ethanol emissions Setting the emission factor for NMHC to zero gives the sensitivity to the emission factor of total NMHC Figure A2 shows the differences in ozone concentration as a result of acetaldehyde only and the total NMHC from the E85 car fleet (S2 scenario) We can see that the effect on ozone formation is very small for the Swedish West coast The reason is that the ozone formation in this area is controlled by the availability of NOX while NMHC or rather their degradation products the peroxy radicals that serve as a lsquofuelrsquo to ozone formation are usually in excess here and further VOC emissions do not increase ozone concentrations significantly The situation looks different in areas that are more heavily polluted with NOX andor which is limited in the availability of peroxy radicals The results from this sensitivity study are fully consistent with the observed increase in ozone concentrations as a result of lower NO emissions (the so-called ozone titration) only very close to the major roads but no larger-scale decrease in ozone concentrations in the Gothenburg area or in any other communities
Figure A2 Sensitivity of the ozone formation in the 2 EMEP model grid cells covering Gothenburg (blue) and in the 6 surrounding grid cells (red see Fig A1) to changes in NMHC emission factor of the E85 fuelled cars lsquobasersquo is simulation S2 with EF for NMHC as in Table 3 lsquonoVOCrsquo is S2 with EF for all NMHC = 0 lsquonopAArsquo is S2 with EF for acetaldehyde = 0 a ndash Mean sensitivity in January absolute difference in ozone formation in ppb(V) as a result of NMHC (base-noVOC) and acetaldehyde (base-nopAA) emissions b ndash Sensitivity relative to ozone concentration in the S2-base simulation January c ndash same as a) but June d ndash same as b) but June
‐002
‐001
0
001
base‐noVOC base‐nopAA
ΔO3(ppb)
a)
0
001
002
base‐noVOC base‐nopAA
ΔO
3(ppb)
c)
‐010
‐005
000
005
base‐noVOC base‐nopAA
ΔO
3
b)
000
002
004
006
base‐noVOC base‐nopAA
ΔO
3
d)
A comparison of emissions from ethanol and petrol fuelled cars IVL report B1962 Health risk assessment for Vaumlstra Goumltaland
33
Appendix 3 Emission results
The geographically distributed NOX and acetaldehyde emissions for the Vaumlstra Goumltaland region are presented in Figures A3 and A4 respectively
Figure A3 NOX emissions for the Vaumlstra Goumltaland region for the All Petrol scenario
A comparison of emissions from ethanol and petrol fuelled cars IVL report B1962 Health risk assessment for Vaumlstra Goumltaland
34
Figure A4 Acetaldehyde emissions for the Vaumlstra Goumltaland region for the All Ethanol scenario
A comparison of emissions from ethanol and petrol fuelled cars IVL report B1962 Health risk assessment for Vaumlstra Goumltaland
35
Appendix 4 Dispersion modelling results
The difference in yearly average concentration between scenario S1 and S2 for acetaldehyde and benzene can be seen in Figure A5 and Figure A6 respectively a)
b)
Figure A5 The difference in yearly average concentrations of acetaldehyde for 2020 between the all E85 (S2) and all petrol (S1) scenarios presented as a) microgm3 and as b) percentage for the Gothenburg area
A comparison of emissions from ethanol and petrol fuelled cars IVL report B1962 Health risk assessment for Vaumlstra Goumltaland
36
a)
b) all E85 c) all petrol
Figure A6 a) the difference in yearly average concentrations (gm3) of benzene for 2020 between the all E85 (S2) and all petrol (S1) scenarios yearly means for b) all E85 and c) all petrol (note the different scales)
The difference in the calculated NOX NO2 and ozone concentrations between the two scenarios are shown in Figures A7 A8 and A9
A comparison of emissions from ethanol and petrol fuelled cars IVL report B1962 Health risk assessment for Vaumlstra Goumltaland
37
a)
b)
Figure A7 The difference in yearly average concentrations of NOX for 2020 between the all E85 (S2) and all petrol (S1) scenarios presented as a) microgm3 and as b) percentage for the Gothenburg area
A comparison of emissions from ethanol and petrol fuelled cars IVL report B1962 Health risk assessment for Vaumlstra Goumltaland
38
a)
Figure A8 The difference in yearly average concentrations of NO2 for 2020 between the all E85 (S2) and all petrol (S1) scenarios presented as a) microgm3 and as b) percentage for the Gothenburg area
A comparison of emissions from ethanol and petrol fuelled cars IVL report B1962 Health risk assessment for Vaumlstra Goumltaland
39
a)
b)
Figure A9 The difference in yearly average concentrations of ozone for 2020 between the all E85 (S2) and all petrol (S1) scenarios presented as a) microgm3 and as b) percentage for mainly the Gothenburg area
A comparison of emissions from ethanol and petrol fuelled cars IVL report B1962 Health risk assessment for Vaumlstra Goumltaland
40
Appendix 5 Detailed Exposure data
Detailed exposure data for the difference between the all E85 (S2) and the all petrol (S1) scenarios can be found in Table A5
Table A5 Exposure data for the difference between the all E85 (S2) and the all petrol (S1) scenarios
Acetaldehyde diff E-P (microgm3)
Populated weighted mean
Number of people Percentage of population
0 - 01 627198 582 01 - 02 163394 152 02 - 03 134879 125 03 - 04 88099 82 04 - 05 38686 36 05 - 06 16880 16 06 - 07 7983 07 07 - 08 1248 01 Tot 014 1078367 Benzene diff E-P (microgm3)
Populated weighted mean
Number of people Percentage of population
-03 - -02 26680 25 -02 - -01 205757 191 -01 - -0 845930 784 Tot -0074 1078367 NO2 diff E-P (microgm3) Populated weighted
mean Number of people Percentage of
population -04 - -03 7698 07 -03 - -02 50131 46 -02 - -01 296288 275 -01 - -0 724250 672 Tot -009 1078367 NOX diff E-P (microgm3) Populated weighted
mean Number of people Percentage of
population -06 - -05 7698 -05 - -04 19639 18 -04 - -03 36626 34 -03 - -02 161685 150 -02 - -01 186500 173 -01 - -0 666219 618 Tot -012 1078367 O3 diff E-P (microgm3) Populated weighted
mean Number of people Percentage of
population -02 - -01 779132 723 -01 - -0 266417 247 0 - 01 32818 30 Tot -012 1078367
Exposure data for the total levels in the two scenarios can be found in Table A6
A comparison of emissions from ethanol and petrol fuelled cars IVL report B1962 Health risk assessment for Vaumlstra Goumltaland
41
Table A6 Exposure data for the total levels in the two scenarios
Acetaldehyde tot All ethanol (microgm3)
Populated weighted mean
Number of people Percentage of population
06 - 07 568825 527 07 - 08 171845 159 08 - 09 124551 115 09 - 10 100946 94 10 - 11 59235 55 11 - 12 30559 28 12 - 13 13175 12 13 - 14 7983 07 14 - 15 1248 01 Tot 077 1078367 Acetaldehyde tot All petrol (microgm3)
Populated weighted mean
Number of people Percentage of population
05 - 06 45111 42 06 - 07 1032008 957 07 - 08 1248 01 Tot 065 1078367 Benzene tot All ethanol (microgm3)
Populated weighted mean
Number of people Percentage of population
0 - 01 1055961 98 01 - 02 22406 2 Tot 005 1078367 Benzene tot All petrol (microgm3)
Populated weighted mean
Number of people Percentage of population
0 - 01 729093 676 01 - 02 232961 216 02 - 03 94042 87 03 - 04 21023 19 04 - 05 1248 01 Tot 010 1078367 NOX tot All ethanol (microgm3)
Populated weighted mean
Number of people Percentage of population
0-10 779108 722 10-20 254658 236 20-30 28683 27 30-40 11070 10 40-50 3426 03 50-60 0 00 60-70 0 00 70-80 639 01 80-90 0 00 90-100 0 00 100-110 783 01 Tot 84 1078367 NOX tot All petrol (microgm3)
Populated weighted mean
Number of people Percentage of population
0-10 769557 714 10-20 264209 245 20-30 28683 27 30-40 11070 10 40-50 3426 03 50-60 0 00
A comparison of emissions from ethanol and petrol fuelled cars IVL report B1962 Health risk assessment for Vaumlstra Goumltaland
42
60-70 0 00 70-80 639 01 80-90 0 00 90-100 0 00 100-110 783 01 Tot 85 1078367 O3 tot All ethanol (microgm3)
Populated weighted mean
Number of people Percentage of population
40-45 1422 01 45-50 26487 25 50-55 176636 164 55-60 770370 714 60-65 103452 96 Tot 569 1078367 O3 tot All petrol (microgm3)
Populated weighted mean
Number of people Percentage of population
40-45 1422 01 45-50 20229 19 50-55 181876 169 55-60 763361 708 60-65 111479 103 Tot 570 1078367 PM25 tot All ethanol (microgm3)
Populated weighted mean
Number of people Percentage of population
1-2 0 00 2-3 885325 821 3-4 192259 178 4-5 783 01 Tot 268 1078367 PM25 tot All petrol (microgm3)
Populated weighted mean
Number of people Percentage of population
1-2 0 00 2-3 868773 806 3-4 208811 194 4-5 783 01 Tot 270 1078367
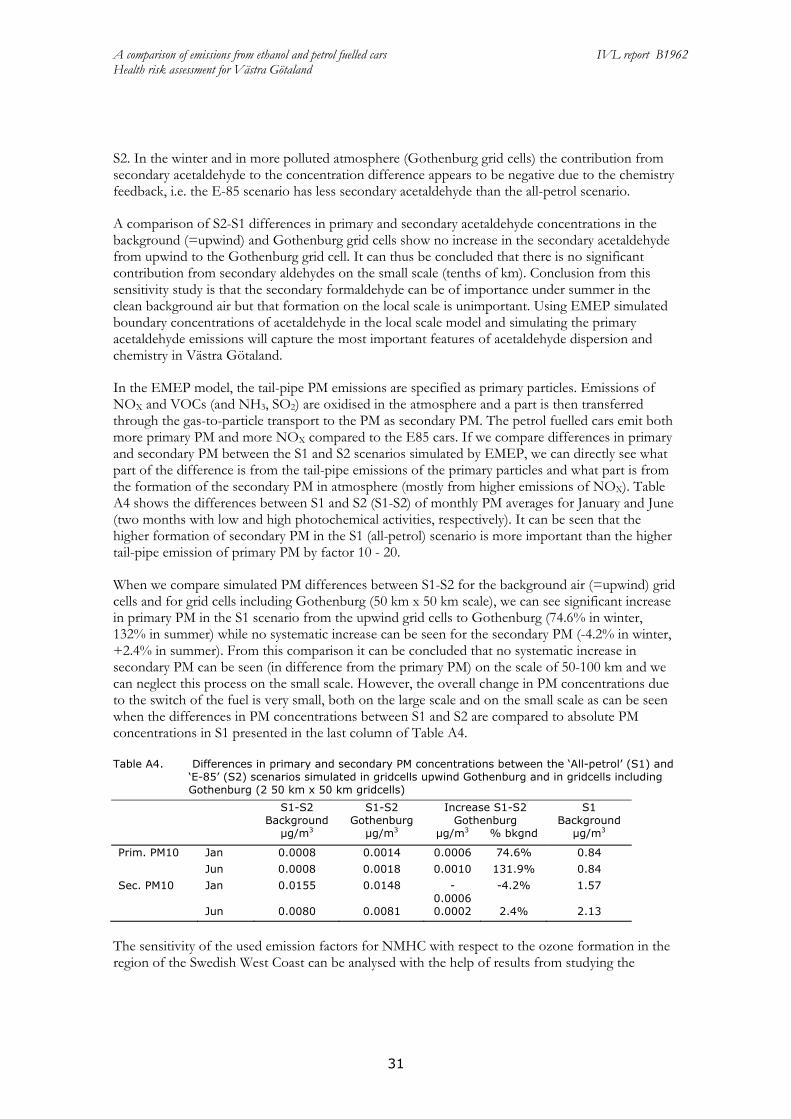
A comparison of emissions from ethanol and petrol fuelled cars IVL report B1962 Health risk assessment for Vaumlstra Goumltaland
33
Appendix 3 Emission results
The geographically distributed NOX and acetaldehyde emissions for the Vaumlstra Goumltaland region are presented in Figures A3 and A4 respectively
Figure A3 NOX emissions for the Vaumlstra Goumltaland region for the All Petrol scenario
A comparison of emissions from ethanol and petrol fuelled cars IVL report B1962 Health risk assessment for Vaumlstra Goumltaland
34
Figure A4 Acetaldehyde emissions for the Vaumlstra Goumltaland region for the All Ethanol scenario
A comparison of emissions from ethanol and petrol fuelled cars IVL report B1962 Health risk assessment for Vaumlstra Goumltaland
35
Appendix 4 Dispersion modelling results
The difference in yearly average concentration between scenario S1 and S2 for acetaldehyde and benzene can be seen in Figure A5 and Figure A6 respectively a)
b)
Figure A5 The difference in yearly average concentrations of acetaldehyde for 2020 between the all E85 (S2) and all petrol (S1) scenarios presented as a) microgm3 and as b) percentage for the Gothenburg area
A comparison of emissions from ethanol and petrol fuelled cars IVL report B1962 Health risk assessment for Vaumlstra Goumltaland
36
a)
b) all E85 c) all petrol
Figure A6 a) the difference in yearly average concentrations (gm3) of benzene for 2020 between the all E85 (S2) and all petrol (S1) scenarios yearly means for b) all E85 and c) all petrol (note the different scales)
The difference in the calculated NOX NO2 and ozone concentrations between the two scenarios are shown in Figures A7 A8 and A9
A comparison of emissions from ethanol and petrol fuelled cars IVL report B1962 Health risk assessment for Vaumlstra Goumltaland
37
a)
b)
Figure A7 The difference in yearly average concentrations of NOX for 2020 between the all E85 (S2) and all petrol (S1) scenarios presented as a) microgm3 and as b) percentage for the Gothenburg area
A comparison of emissions from ethanol and petrol fuelled cars IVL report B1962 Health risk assessment for Vaumlstra Goumltaland
38
a)
Figure A8 The difference in yearly average concentrations of NO2 for 2020 between the all E85 (S2) and all petrol (S1) scenarios presented as a) microgm3 and as b) percentage for the Gothenburg area
A comparison of emissions from ethanol and petrol fuelled cars IVL report B1962 Health risk assessment for Vaumlstra Goumltaland
39
a)
b)
Figure A9 The difference in yearly average concentrations of ozone for 2020 between the all E85 (S2) and all petrol (S1) scenarios presented as a) microgm3 and as b) percentage for mainly the Gothenburg area
A comparison of emissions from ethanol and petrol fuelled cars IVL report B1962 Health risk assessment for Vaumlstra Goumltaland
40
Appendix 5 Detailed Exposure data
Detailed exposure data for the difference between the all E85 (S2) and the all petrol (S1) scenarios can be found in Table A5
Table A5 Exposure data for the difference between the all E85 (S2) and the all petrol (S1) scenarios
Acetaldehyde diff E-P (microgm3)
Populated weighted mean
Number of people Percentage of population
0 - 01 627198 582 01 - 02 163394 152 02 - 03 134879 125 03 - 04 88099 82 04 - 05 38686 36 05 - 06 16880 16 06 - 07 7983 07 07 - 08 1248 01 Tot 014 1078367 Benzene diff E-P (microgm3)
Populated weighted mean
Number of people Percentage of population
-03 - -02 26680 25 -02 - -01 205757 191 -01 - -0 845930 784 Tot -0074 1078367 NO2 diff E-P (microgm3) Populated weighted
mean Number of people Percentage of
population -04 - -03 7698 07 -03 - -02 50131 46 -02 - -01 296288 275 -01 - -0 724250 672 Tot -009 1078367 NOX diff E-P (microgm3) Populated weighted
mean Number of people Percentage of
population -06 - -05 7698 -05 - -04 19639 18 -04 - -03 36626 34 -03 - -02 161685 150 -02 - -01 186500 173 -01 - -0 666219 618 Tot -012 1078367 O3 diff E-P (microgm3) Populated weighted
mean Number of people Percentage of
population -02 - -01 779132 723 -01 - -0 266417 247 0 - 01 32818 30 Tot -012 1078367
Exposure data for the total levels in the two scenarios can be found in Table A6
A comparison of emissions from ethanol and petrol fuelled cars IVL report B1962 Health risk assessment for Vaumlstra Goumltaland
41
Table A6 Exposure data for the total levels in the two scenarios
Acetaldehyde tot All ethanol (microgm3)
Populated weighted mean
Number of people Percentage of population
06 - 07 568825 527 07 - 08 171845 159 08 - 09 124551 115 09 - 10 100946 94 10 - 11 59235 55 11 - 12 30559 28 12 - 13 13175 12 13 - 14 7983 07 14 - 15 1248 01 Tot 077 1078367 Acetaldehyde tot All petrol (microgm3)
Populated weighted mean
Number of people Percentage of population
05 - 06 45111 42 06 - 07 1032008 957 07 - 08 1248 01 Tot 065 1078367 Benzene tot All ethanol (microgm3)
Populated weighted mean
Number of people Percentage of population
0 - 01 1055961 98 01 - 02 22406 2 Tot 005 1078367 Benzene tot All petrol (microgm3)
Populated weighted mean
Number of people Percentage of population
0 - 01 729093 676 01 - 02 232961 216 02 - 03 94042 87 03 - 04 21023 19 04 - 05 1248 01 Tot 010 1078367 NOX tot All ethanol (microgm3)
Populated weighted mean
Number of people Percentage of population
0-10 779108 722 10-20 254658 236 20-30 28683 27 30-40 11070 10 40-50 3426 03 50-60 0 00 60-70 0 00 70-80 639 01 80-90 0 00 90-100 0 00 100-110 783 01 Tot 84 1078367 NOX tot All petrol (microgm3)
Populated weighted mean
Number of people Percentage of population
0-10 769557 714 10-20 264209 245 20-30 28683 27 30-40 11070 10 40-50 3426 03 50-60 0 00
A comparison of emissions from ethanol and petrol fuelled cars IVL report B1962 Health risk assessment for Vaumlstra Goumltaland
42
60-70 0 00 70-80 639 01 80-90 0 00 90-100 0 00 100-110 783 01 Tot 85 1078367 O3 tot All ethanol (microgm3)
Populated weighted mean
Number of people Percentage of population
40-45 1422 01 45-50 26487 25 50-55 176636 164 55-60 770370 714 60-65 103452 96 Tot 569 1078367 O3 tot All petrol (microgm3)
Populated weighted mean
Number of people Percentage of population
40-45 1422 01 45-50 20229 19 50-55 181876 169 55-60 763361 708 60-65 111479 103 Tot 570 1078367 PM25 tot All ethanol (microgm3)
Populated weighted mean
Number of people Percentage of population
1-2 0 00 2-3 885325 821 3-4 192259 178 4-5 783 01 Tot 268 1078367 PM25 tot All petrol (microgm3)
Populated weighted mean
Number of people Percentage of population
1-2 0 00 2-3 868773 806 3-4 208811 194 4-5 783 01 Tot 270 1078367
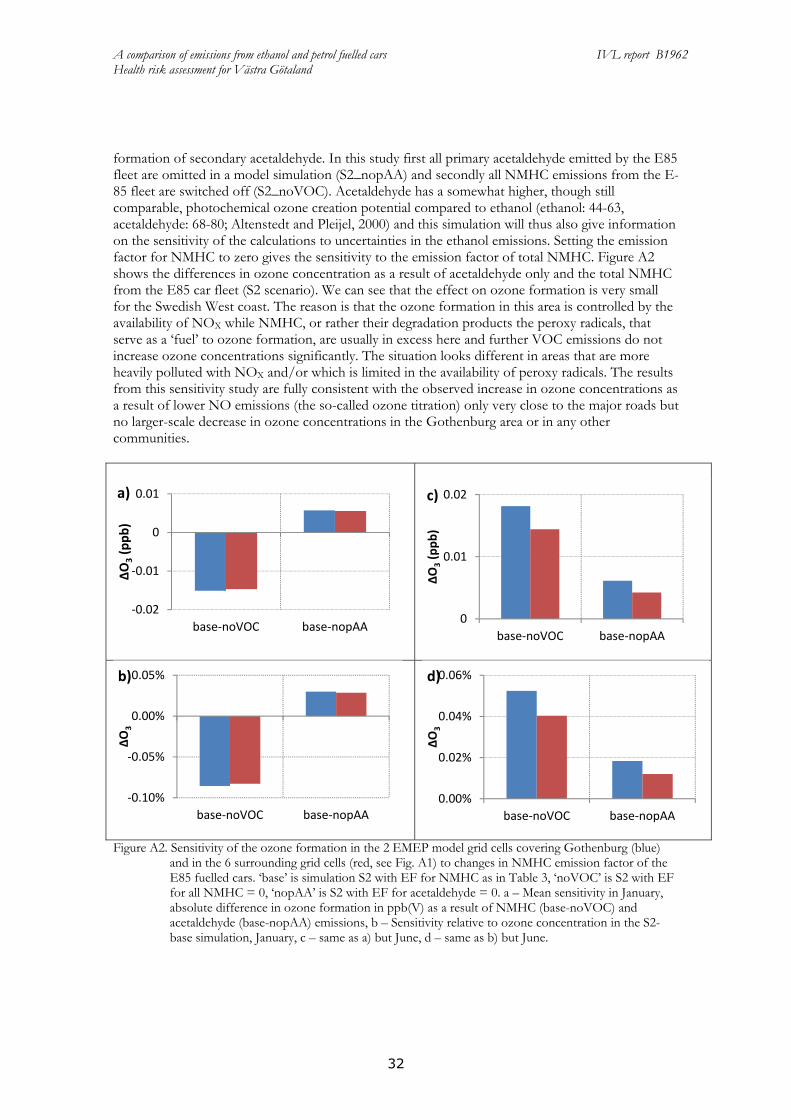
A comparison of emissions from ethanol and petrol fuelled cars IVL report B1962 Health risk assessment for Vaumlstra Goumltaland
34
Figure A4 Acetaldehyde emissions for the Vaumlstra Goumltaland region for the All Ethanol scenario
A comparison of emissions from ethanol and petrol fuelled cars IVL report B1962 Health risk assessment for Vaumlstra Goumltaland
35
Appendix 4 Dispersion modelling results
The difference in yearly average concentration between scenario S1 and S2 for acetaldehyde and benzene can be seen in Figure A5 and Figure A6 respectively a)
b)
Figure A5 The difference in yearly average concentrations of acetaldehyde for 2020 between the all E85 (S2) and all petrol (S1) scenarios presented as a) microgm3 and as b) percentage for the Gothenburg area
A comparison of emissions from ethanol and petrol fuelled cars IVL report B1962 Health risk assessment for Vaumlstra Goumltaland
36
a)
b) all E85 c) all petrol
Figure A6 a) the difference in yearly average concentrations (gm3) of benzene for 2020 between the all E85 (S2) and all petrol (S1) scenarios yearly means for b) all E85 and c) all petrol (note the different scales)
The difference in the calculated NOX NO2 and ozone concentrations between the two scenarios are shown in Figures A7 A8 and A9
A comparison of emissions from ethanol and petrol fuelled cars IVL report B1962 Health risk assessment for Vaumlstra Goumltaland
37
a)
b)
Figure A7 The difference in yearly average concentrations of NOX for 2020 between the all E85 (S2) and all petrol (S1) scenarios presented as a) microgm3 and as b) percentage for the Gothenburg area
A comparison of emissions from ethanol and petrol fuelled cars IVL report B1962 Health risk assessment for Vaumlstra Goumltaland
38
a)
Figure A8 The difference in yearly average concentrations of NO2 for 2020 between the all E85 (S2) and all petrol (S1) scenarios presented as a) microgm3 and as b) percentage for the Gothenburg area
A comparison of emissions from ethanol and petrol fuelled cars IVL report B1962 Health risk assessment for Vaumlstra Goumltaland
39
a)
b)
Figure A9 The difference in yearly average concentrations of ozone for 2020 between the all E85 (S2) and all petrol (S1) scenarios presented as a) microgm3 and as b) percentage for mainly the Gothenburg area
A comparison of emissions from ethanol and petrol fuelled cars IVL report B1962 Health risk assessment for Vaumlstra Goumltaland
40
Appendix 5 Detailed Exposure data
Detailed exposure data for the difference between the all E85 (S2) and the all petrol (S1) scenarios can be found in Table A5
Table A5 Exposure data for the difference between the all E85 (S2) and the all petrol (S1) scenarios
Acetaldehyde diff E-P (microgm3)
Populated weighted mean
Number of people Percentage of population
0 - 01 627198 582 01 - 02 163394 152 02 - 03 134879 125 03 - 04 88099 82 04 - 05 38686 36 05 - 06 16880 16 06 - 07 7983 07 07 - 08 1248 01 Tot 014 1078367 Benzene diff E-P (microgm3)
Populated weighted mean
Number of people Percentage of population
-03 - -02 26680 25 -02 - -01 205757 191 -01 - -0 845930 784 Tot -0074 1078367 NO2 diff E-P (microgm3) Populated weighted
mean Number of people Percentage of
population -04 - -03 7698 07 -03 - -02 50131 46 -02 - -01 296288 275 -01 - -0 724250 672 Tot -009 1078367 NOX diff E-P (microgm3) Populated weighted
mean Number of people Percentage of
population -06 - -05 7698 -05 - -04 19639 18 -04 - -03 36626 34 -03 - -02 161685 150 -02 - -01 186500 173 -01 - -0 666219 618 Tot -012 1078367 O3 diff E-P (microgm3) Populated weighted
mean Number of people Percentage of
population -02 - -01 779132 723 -01 - -0 266417 247 0 - 01 32818 30 Tot -012 1078367
Exposure data for the total levels in the two scenarios can be found in Table A6
A comparison of emissions from ethanol and petrol fuelled cars IVL report B1962 Health risk assessment for Vaumlstra Goumltaland
41
Table A6 Exposure data for the total levels in the two scenarios
Acetaldehyde tot All ethanol (microgm3)
Populated weighted mean
Number of people Percentage of population
06 - 07 568825 527 07 - 08 171845 159 08 - 09 124551 115 09 - 10 100946 94 10 - 11 59235 55 11 - 12 30559 28 12 - 13 13175 12 13 - 14 7983 07 14 - 15 1248 01 Tot 077 1078367 Acetaldehyde tot All petrol (microgm3)
Populated weighted mean
Number of people Percentage of population
05 - 06 45111 42 06 - 07 1032008 957 07 - 08 1248 01 Tot 065 1078367 Benzene tot All ethanol (microgm3)
Populated weighted mean
Number of people Percentage of population
0 - 01 1055961 98 01 - 02 22406 2 Tot 005 1078367 Benzene tot All petrol (microgm3)
Populated weighted mean
Number of people Percentage of population
0 - 01 729093 676 01 - 02 232961 216 02 - 03 94042 87 03 - 04 21023 19 04 - 05 1248 01 Tot 010 1078367 NOX tot All ethanol (microgm3)
Populated weighted mean
Number of people Percentage of population
0-10 779108 722 10-20 254658 236 20-30 28683 27 30-40 11070 10 40-50 3426 03 50-60 0 00 60-70 0 00 70-80 639 01 80-90 0 00 90-100 0 00 100-110 783 01 Tot 84 1078367 NOX tot All petrol (microgm3)
Populated weighted mean
Number of people Percentage of population
0-10 769557 714 10-20 264209 245 20-30 28683 27 30-40 11070 10 40-50 3426 03 50-60 0 00
A comparison of emissions from ethanol and petrol fuelled cars IVL report B1962 Health risk assessment for Vaumlstra Goumltaland
42
60-70 0 00 70-80 639 01 80-90 0 00 90-100 0 00 100-110 783 01 Tot 85 1078367 O3 tot All ethanol (microgm3)
Populated weighted mean
Number of people Percentage of population
40-45 1422 01 45-50 26487 25 50-55 176636 164 55-60 770370 714 60-65 103452 96 Tot 569 1078367 O3 tot All petrol (microgm3)
Populated weighted mean
Number of people Percentage of population
40-45 1422 01 45-50 20229 19 50-55 181876 169 55-60 763361 708 60-65 111479 103 Tot 570 1078367 PM25 tot All ethanol (microgm3)
Populated weighted mean
Number of people Percentage of population
1-2 0 00 2-3 885325 821 3-4 192259 178 4-5 783 01 Tot 268 1078367 PM25 tot All petrol (microgm3)
Populated weighted mean
Number of people Percentage of population
1-2 0 00 2-3 868773 806 3-4 208811 194 4-5 783 01 Tot 270 1078367
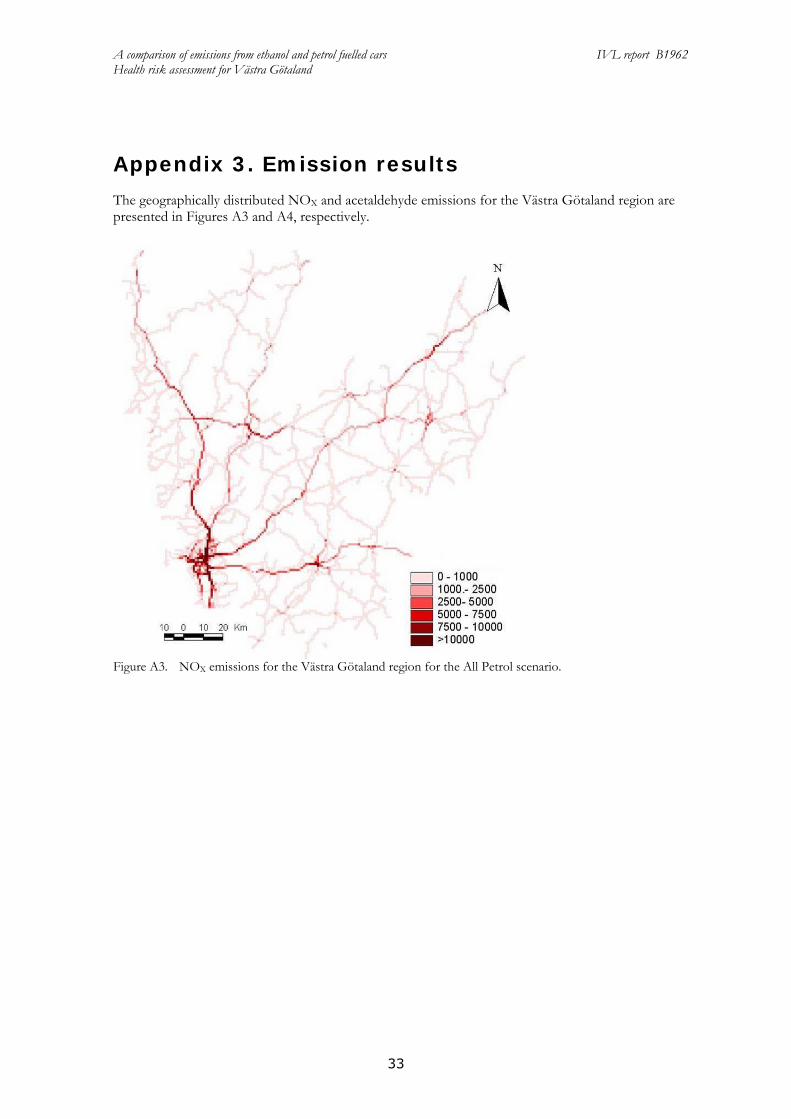
A comparison of emissions from ethanol and petrol fuelled cars IVL report B1962 Health risk assessment for Vaumlstra Goumltaland
35
Appendix 4 Dispersion modelling results
The difference in yearly average concentration between scenario S1 and S2 for acetaldehyde and benzene can be seen in Figure A5 and Figure A6 respectively a)
b)
Figure A5 The difference in yearly average concentrations of acetaldehyde for 2020 between the all E85 (S2) and all petrol (S1) scenarios presented as a) microgm3 and as b) percentage for the Gothenburg area
A comparison of emissions from ethanol and petrol fuelled cars IVL report B1962 Health risk assessment for Vaumlstra Goumltaland
36
a)
b) all E85 c) all petrol
Figure A6 a) the difference in yearly average concentrations (gm3) of benzene for 2020 between the all E85 (S2) and all petrol (S1) scenarios yearly means for b) all E85 and c) all petrol (note the different scales)
The difference in the calculated NOX NO2 and ozone concentrations between the two scenarios are shown in Figures A7 A8 and A9
A comparison of emissions from ethanol and petrol fuelled cars IVL report B1962 Health risk assessment for Vaumlstra Goumltaland
37
a)
b)
Figure A7 The difference in yearly average concentrations of NOX for 2020 between the all E85 (S2) and all petrol (S1) scenarios presented as a) microgm3 and as b) percentage for the Gothenburg area
A comparison of emissions from ethanol and petrol fuelled cars IVL report B1962 Health risk assessment for Vaumlstra Goumltaland
38
a)
Figure A8 The difference in yearly average concentrations of NO2 for 2020 between the all E85 (S2) and all petrol (S1) scenarios presented as a) microgm3 and as b) percentage for the Gothenburg area
A comparison of emissions from ethanol and petrol fuelled cars IVL report B1962 Health risk assessment for Vaumlstra Goumltaland
39
a)
b)
Figure A9 The difference in yearly average concentrations of ozone for 2020 between the all E85 (S2) and all petrol (S1) scenarios presented as a) microgm3 and as b) percentage for mainly the Gothenburg area
A comparison of emissions from ethanol and petrol fuelled cars IVL report B1962 Health risk assessment for Vaumlstra Goumltaland
40
Appendix 5 Detailed Exposure data
Detailed exposure data for the difference between the all E85 (S2) and the all petrol (S1) scenarios can be found in Table A5
Table A5 Exposure data for the difference between the all E85 (S2) and the all petrol (S1) scenarios
Acetaldehyde diff E-P (microgm3)
Populated weighted mean
Number of people Percentage of population
0 - 01 627198 582 01 - 02 163394 152 02 - 03 134879 125 03 - 04 88099 82 04 - 05 38686 36 05 - 06 16880 16 06 - 07 7983 07 07 - 08 1248 01 Tot 014 1078367 Benzene diff E-P (microgm3)
Populated weighted mean
Number of people Percentage of population
-03 - -02 26680 25 -02 - -01 205757 191 -01 - -0 845930 784 Tot -0074 1078367 NO2 diff E-P (microgm3) Populated weighted
mean Number of people Percentage of
population -04 - -03 7698 07 -03 - -02 50131 46 -02 - -01 296288 275 -01 - -0 724250 672 Tot -009 1078367 NOX diff E-P (microgm3) Populated weighted
mean Number of people Percentage of
population -06 - -05 7698 -05 - -04 19639 18 -04 - -03 36626 34 -03 - -02 161685 150 -02 - -01 186500 173 -01 - -0 666219 618 Tot -012 1078367 O3 diff E-P (microgm3) Populated weighted
mean Number of people Percentage of
population -02 - -01 779132 723 -01 - -0 266417 247 0 - 01 32818 30 Tot -012 1078367
Exposure data for the total levels in the two scenarios can be found in Table A6
A comparison of emissions from ethanol and petrol fuelled cars IVL report B1962 Health risk assessment for Vaumlstra Goumltaland
41
Table A6 Exposure data for the total levels in the two scenarios
Acetaldehyde tot All ethanol (microgm3)
Populated weighted mean
Number of people Percentage of population
06 - 07 568825 527 07 - 08 171845 159 08 - 09 124551 115 09 - 10 100946 94 10 - 11 59235 55 11 - 12 30559 28 12 - 13 13175 12 13 - 14 7983 07 14 - 15 1248 01 Tot 077 1078367 Acetaldehyde tot All petrol (microgm3)
Populated weighted mean
Number of people Percentage of population
05 - 06 45111 42 06 - 07 1032008 957 07 - 08 1248 01 Tot 065 1078367 Benzene tot All ethanol (microgm3)
Populated weighted mean
Number of people Percentage of population
0 - 01 1055961 98 01 - 02 22406 2 Tot 005 1078367 Benzene tot All petrol (microgm3)
Populated weighted mean
Number of people Percentage of population
0 - 01 729093 676 01 - 02 232961 216 02 - 03 94042 87 03 - 04 21023 19 04 - 05 1248 01 Tot 010 1078367 NOX tot All ethanol (microgm3)
Populated weighted mean
Number of people Percentage of population
0-10 779108 722 10-20 254658 236 20-30 28683 27 30-40 11070 10 40-50 3426 03 50-60 0 00 60-70 0 00 70-80 639 01 80-90 0 00 90-100 0 00 100-110 783 01 Tot 84 1078367 NOX tot All petrol (microgm3)
Populated weighted mean
Number of people Percentage of population
0-10 769557 714 10-20 264209 245 20-30 28683 27 30-40 11070 10 40-50 3426 03 50-60 0 00
A comparison of emissions from ethanol and petrol fuelled cars IVL report B1962 Health risk assessment for Vaumlstra Goumltaland
42
60-70 0 00 70-80 639 01 80-90 0 00 90-100 0 00 100-110 783 01 Tot 85 1078367 O3 tot All ethanol (microgm3)
Populated weighted mean
Number of people Percentage of population
40-45 1422 01 45-50 26487 25 50-55 176636 164 55-60 770370 714 60-65 103452 96 Tot 569 1078367 O3 tot All petrol (microgm3)
Populated weighted mean
Number of people Percentage of population
40-45 1422 01 45-50 20229 19 50-55 181876 169 55-60 763361 708 60-65 111479 103 Tot 570 1078367 PM25 tot All ethanol (microgm3)
Populated weighted mean
Number of people Percentage of population
1-2 0 00 2-3 885325 821 3-4 192259 178 4-5 783 01 Tot 268 1078367 PM25 tot All petrol (microgm3)
Populated weighted mean
Number of people Percentage of population
1-2 0 00 2-3 868773 806 3-4 208811 194 4-5 783 01 Tot 270 1078367
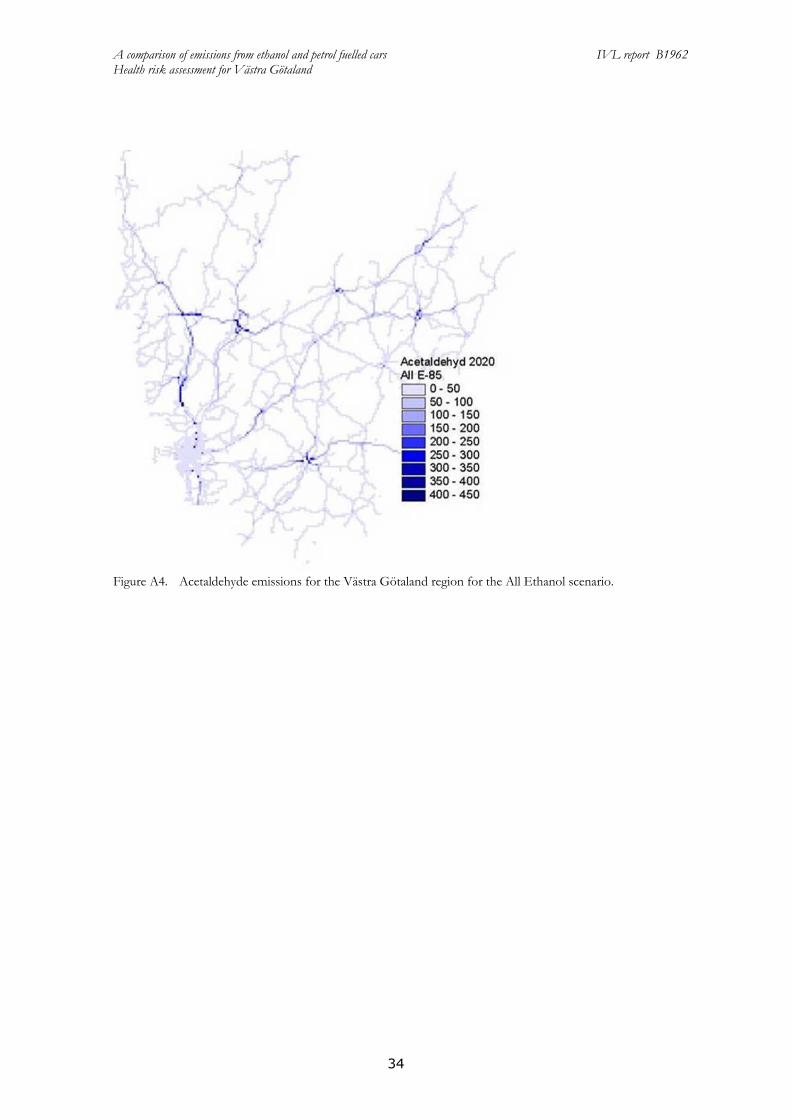
A comparison of emissions from ethanol and petrol fuelled cars IVL report B1962 Health risk assessment for Vaumlstra Goumltaland
36
a)
b) all E85 c) all petrol
Figure A6 a) the difference in yearly average concentrations (gm3) of benzene for 2020 between the all E85 (S2) and all petrol (S1) scenarios yearly means for b) all E85 and c) all petrol (note the different scales)
The difference in the calculated NOX NO2 and ozone concentrations between the two scenarios are shown in Figures A7 A8 and A9
A comparison of emissions from ethanol and petrol fuelled cars IVL report B1962 Health risk assessment for Vaumlstra Goumltaland
37
a)
b)
Figure A7 The difference in yearly average concentrations of NOX for 2020 between the all E85 (S2) and all petrol (S1) scenarios presented as a) microgm3 and as b) percentage for the Gothenburg area
A comparison of emissions from ethanol and petrol fuelled cars IVL report B1962 Health risk assessment for Vaumlstra Goumltaland
38
a)
Figure A8 The difference in yearly average concentrations of NO2 for 2020 between the all E85 (S2) and all petrol (S1) scenarios presented as a) microgm3 and as b) percentage for the Gothenburg area
A comparison of emissions from ethanol and petrol fuelled cars IVL report B1962 Health risk assessment for Vaumlstra Goumltaland
39
a)
b)
Figure A9 The difference in yearly average concentrations of ozone for 2020 between the all E85 (S2) and all petrol (S1) scenarios presented as a) microgm3 and as b) percentage for mainly the Gothenburg area
A comparison of emissions from ethanol and petrol fuelled cars IVL report B1962 Health risk assessment for Vaumlstra Goumltaland
40
Appendix 5 Detailed Exposure data
Detailed exposure data for the difference between the all E85 (S2) and the all petrol (S1) scenarios can be found in Table A5
Table A5 Exposure data for the difference between the all E85 (S2) and the all petrol (S1) scenarios
Acetaldehyde diff E-P (microgm3)
Populated weighted mean
Number of people Percentage of population
0 - 01 627198 582 01 - 02 163394 152 02 - 03 134879 125 03 - 04 88099 82 04 - 05 38686 36 05 - 06 16880 16 06 - 07 7983 07 07 - 08 1248 01 Tot 014 1078367 Benzene diff E-P (microgm3)
Populated weighted mean
Number of people Percentage of population
-03 - -02 26680 25 -02 - -01 205757 191 -01 - -0 845930 784 Tot -0074 1078367 NO2 diff E-P (microgm3) Populated weighted
mean Number of people Percentage of
population -04 - -03 7698 07 -03 - -02 50131 46 -02 - -01 296288 275 -01 - -0 724250 672 Tot -009 1078367 NOX diff E-P (microgm3) Populated weighted
mean Number of people Percentage of
population -06 - -05 7698 -05 - -04 19639 18 -04 - -03 36626 34 -03 - -02 161685 150 -02 - -01 186500 173 -01 - -0 666219 618 Tot -012 1078367 O3 diff E-P (microgm3) Populated weighted
mean Number of people Percentage of
population -02 - -01 779132 723 -01 - -0 266417 247 0 - 01 32818 30 Tot -012 1078367
Exposure data for the total levels in the two scenarios can be found in Table A6
A comparison of emissions from ethanol and petrol fuelled cars IVL report B1962 Health risk assessment for Vaumlstra Goumltaland
41
Table A6 Exposure data for the total levels in the two scenarios
Acetaldehyde tot All ethanol (microgm3)
Populated weighted mean
Number of people Percentage of population
06 - 07 568825 527 07 - 08 171845 159 08 - 09 124551 115 09 - 10 100946 94 10 - 11 59235 55 11 - 12 30559 28 12 - 13 13175 12 13 - 14 7983 07 14 - 15 1248 01 Tot 077 1078367 Acetaldehyde tot All petrol (microgm3)
Populated weighted mean
Number of people Percentage of population
05 - 06 45111 42 06 - 07 1032008 957 07 - 08 1248 01 Tot 065 1078367 Benzene tot All ethanol (microgm3)
Populated weighted mean
Number of people Percentage of population
0 - 01 1055961 98 01 - 02 22406 2 Tot 005 1078367 Benzene tot All petrol (microgm3)
Populated weighted mean
Number of people Percentage of population
0 - 01 729093 676 01 - 02 232961 216 02 - 03 94042 87 03 - 04 21023 19 04 - 05 1248 01 Tot 010 1078367 NOX tot All ethanol (microgm3)
Populated weighted mean
Number of people Percentage of population
0-10 779108 722 10-20 254658 236 20-30 28683 27 30-40 11070 10 40-50 3426 03 50-60 0 00 60-70 0 00 70-80 639 01 80-90 0 00 90-100 0 00 100-110 783 01 Tot 84 1078367 NOX tot All petrol (microgm3)
Populated weighted mean
Number of people Percentage of population
0-10 769557 714 10-20 264209 245 20-30 28683 27 30-40 11070 10 40-50 3426 03 50-60 0 00
A comparison of emissions from ethanol and petrol fuelled cars IVL report B1962 Health risk assessment for Vaumlstra Goumltaland
42
60-70 0 00 70-80 639 01 80-90 0 00 90-100 0 00 100-110 783 01 Tot 85 1078367 O3 tot All ethanol (microgm3)
Populated weighted mean
Number of people Percentage of population
40-45 1422 01 45-50 26487 25 50-55 176636 164 55-60 770370 714 60-65 103452 96 Tot 569 1078367 O3 tot All petrol (microgm3)
Populated weighted mean
Number of people Percentage of population
40-45 1422 01 45-50 20229 19 50-55 181876 169 55-60 763361 708 60-65 111479 103 Tot 570 1078367 PM25 tot All ethanol (microgm3)
Populated weighted mean
Number of people Percentage of population
1-2 0 00 2-3 885325 821 3-4 192259 178 4-5 783 01 Tot 268 1078367 PM25 tot All petrol (microgm3)
Populated weighted mean
Number of people Percentage of population
1-2 0 00 2-3 868773 806 3-4 208811 194 4-5 783 01 Tot 270 1078367
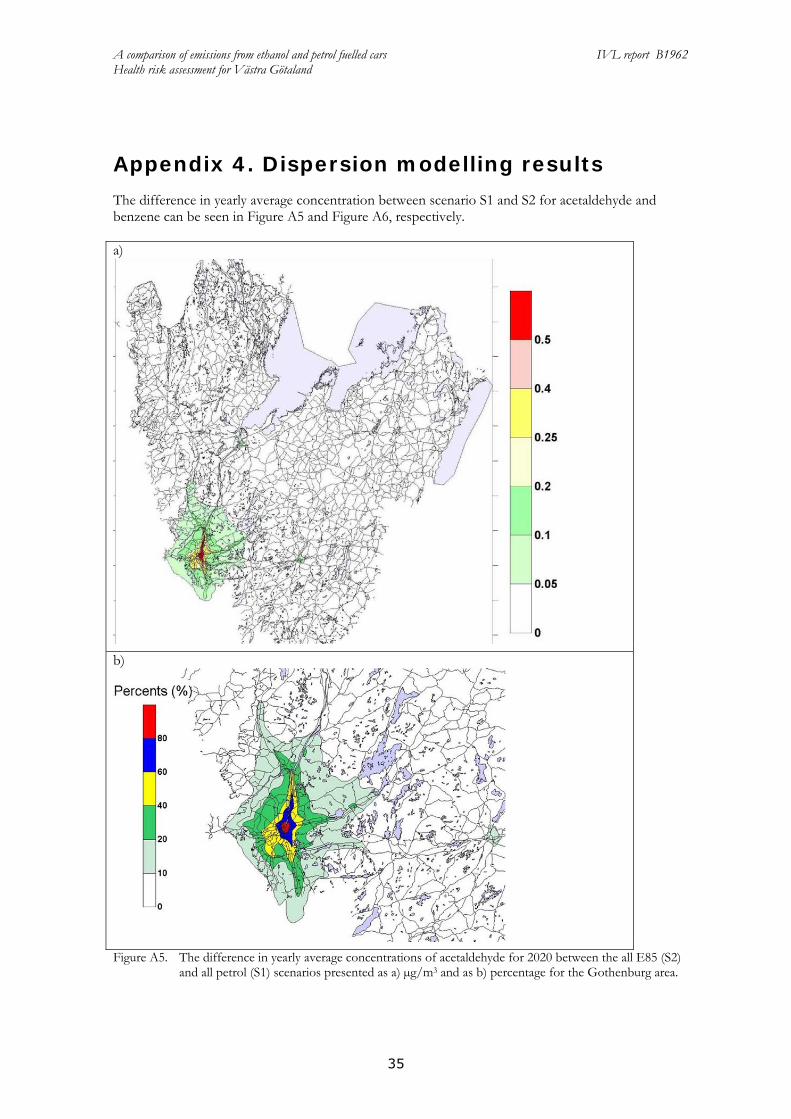
A comparison of emissions from ethanol and petrol fuelled cars IVL report B1962 Health risk assessment for Vaumlstra Goumltaland
37
a)
b)
Figure A7 The difference in yearly average concentrations of NOX for 2020 between the all E85 (S2) and all petrol (S1) scenarios presented as a) microgm3 and as b) percentage for the Gothenburg area
A comparison of emissions from ethanol and petrol fuelled cars IVL report B1962 Health risk assessment for Vaumlstra Goumltaland
38
a)
Figure A8 The difference in yearly average concentrations of NO2 for 2020 between the all E85 (S2) and all petrol (S1) scenarios presented as a) microgm3 and as b) percentage for the Gothenburg area
A comparison of emissions from ethanol and petrol fuelled cars IVL report B1962 Health risk assessment for Vaumlstra Goumltaland
39
a)
b)
Figure A9 The difference in yearly average concentrations of ozone for 2020 between the all E85 (S2) and all petrol (S1) scenarios presented as a) microgm3 and as b) percentage for mainly the Gothenburg area
A comparison of emissions from ethanol and petrol fuelled cars IVL report B1962 Health risk assessment for Vaumlstra Goumltaland
40
Appendix 5 Detailed Exposure data
Detailed exposure data for the difference between the all E85 (S2) and the all petrol (S1) scenarios can be found in Table A5
Table A5 Exposure data for the difference between the all E85 (S2) and the all petrol (S1) scenarios
Acetaldehyde diff E-P (microgm3)
Populated weighted mean
Number of people Percentage of population
0 - 01 627198 582 01 - 02 163394 152 02 - 03 134879 125 03 - 04 88099 82 04 - 05 38686 36 05 - 06 16880 16 06 - 07 7983 07 07 - 08 1248 01 Tot 014 1078367 Benzene diff E-P (microgm3)
Populated weighted mean
Number of people Percentage of population
-03 - -02 26680 25 -02 - -01 205757 191 -01 - -0 845930 784 Tot -0074 1078367 NO2 diff E-P (microgm3) Populated weighted
mean Number of people Percentage of
population -04 - -03 7698 07 -03 - -02 50131 46 -02 - -01 296288 275 -01 - -0 724250 672 Tot -009 1078367 NOX diff E-P (microgm3) Populated weighted
mean Number of people Percentage of
population -06 - -05 7698 -05 - -04 19639 18 -04 - -03 36626 34 -03 - -02 161685 150 -02 - -01 186500 173 -01 - -0 666219 618 Tot -012 1078367 O3 diff E-P (microgm3) Populated weighted
mean Number of people Percentage of
population -02 - -01 779132 723 -01 - -0 266417 247 0 - 01 32818 30 Tot -012 1078367
Exposure data for the total levels in the two scenarios can be found in Table A6
A comparison of emissions from ethanol and petrol fuelled cars IVL report B1962 Health risk assessment for Vaumlstra Goumltaland
41
Table A6 Exposure data for the total levels in the two scenarios
Acetaldehyde tot All ethanol (microgm3)
Populated weighted mean
Number of people Percentage of population
06 - 07 568825 527 07 - 08 171845 159 08 - 09 124551 115 09 - 10 100946 94 10 - 11 59235 55 11 - 12 30559 28 12 - 13 13175 12 13 - 14 7983 07 14 - 15 1248 01 Tot 077 1078367 Acetaldehyde tot All petrol (microgm3)
Populated weighted mean
Number of people Percentage of population
05 - 06 45111 42 06 - 07 1032008 957 07 - 08 1248 01 Tot 065 1078367 Benzene tot All ethanol (microgm3)
Populated weighted mean
Number of people Percentage of population
0 - 01 1055961 98 01 - 02 22406 2 Tot 005 1078367 Benzene tot All petrol (microgm3)
Populated weighted mean
Number of people Percentage of population
0 - 01 729093 676 01 - 02 232961 216 02 - 03 94042 87 03 - 04 21023 19 04 - 05 1248 01 Tot 010 1078367 NOX tot All ethanol (microgm3)
Populated weighted mean
Number of people Percentage of population
0-10 779108 722 10-20 254658 236 20-30 28683 27 30-40 11070 10 40-50 3426 03 50-60 0 00 60-70 0 00 70-80 639 01 80-90 0 00 90-100 0 00 100-110 783 01 Tot 84 1078367 NOX tot All petrol (microgm3)
Populated weighted mean
Number of people Percentage of population
0-10 769557 714 10-20 264209 245 20-30 28683 27 30-40 11070 10 40-50 3426 03 50-60 0 00
A comparison of emissions from ethanol and petrol fuelled cars IVL report B1962 Health risk assessment for Vaumlstra Goumltaland
42
60-70 0 00 70-80 639 01 80-90 0 00 90-100 0 00 100-110 783 01 Tot 85 1078367 O3 tot All ethanol (microgm3)
Populated weighted mean
Number of people Percentage of population
40-45 1422 01 45-50 26487 25 50-55 176636 164 55-60 770370 714 60-65 103452 96 Tot 569 1078367 O3 tot All petrol (microgm3)
Populated weighted mean
Number of people Percentage of population
40-45 1422 01 45-50 20229 19 50-55 181876 169 55-60 763361 708 60-65 111479 103 Tot 570 1078367 PM25 tot All ethanol (microgm3)
Populated weighted mean
Number of people Percentage of population
1-2 0 00 2-3 885325 821 3-4 192259 178 4-5 783 01 Tot 268 1078367 PM25 tot All petrol (microgm3)
Populated weighted mean
Number of people Percentage of population
1-2 0 00 2-3 868773 806 3-4 208811 194 4-5 783 01 Tot 270 1078367
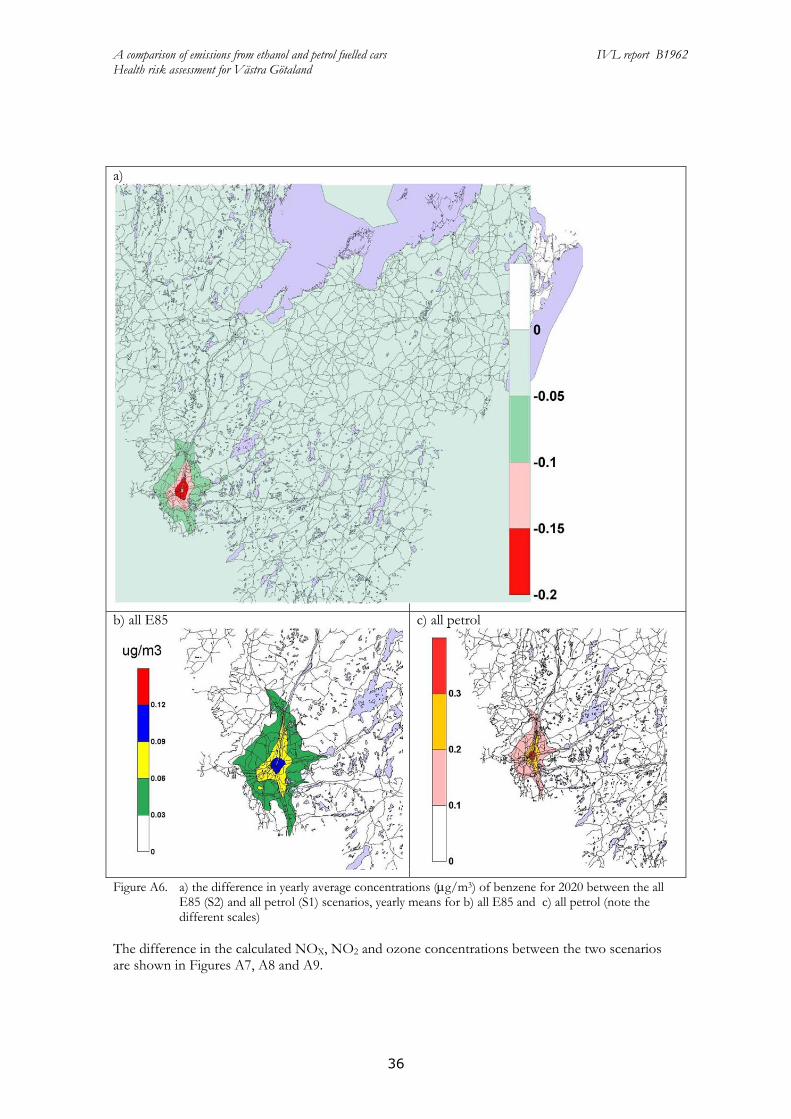
A comparison of emissions from ethanol and petrol fuelled cars IVL report B1962 Health risk assessment for Vaumlstra Goumltaland
38
a)
Figure A8 The difference in yearly average concentrations of NO2 for 2020 between the all E85 (S2) and all petrol (S1) scenarios presented as a) microgm3 and as b) percentage for the Gothenburg area
A comparison of emissions from ethanol and petrol fuelled cars IVL report B1962 Health risk assessment for Vaumlstra Goumltaland
39
a)
b)
Figure A9 The difference in yearly average concentrations of ozone for 2020 between the all E85 (S2) and all petrol (S1) scenarios presented as a) microgm3 and as b) percentage for mainly the Gothenburg area
A comparison of emissions from ethanol and petrol fuelled cars IVL report B1962 Health risk assessment for Vaumlstra Goumltaland
40
Appendix 5 Detailed Exposure data
Detailed exposure data for the difference between the all E85 (S2) and the all petrol (S1) scenarios can be found in Table A5
Table A5 Exposure data for the difference between the all E85 (S2) and the all petrol (S1) scenarios
Acetaldehyde diff E-P (microgm3)
Populated weighted mean
Number of people Percentage of population
0 - 01 627198 582 01 - 02 163394 152 02 - 03 134879 125 03 - 04 88099 82 04 - 05 38686 36 05 - 06 16880 16 06 - 07 7983 07 07 - 08 1248 01 Tot 014 1078367 Benzene diff E-P (microgm3)
Populated weighted mean
Number of people Percentage of population
-03 - -02 26680 25 -02 - -01 205757 191 -01 - -0 845930 784 Tot -0074 1078367 NO2 diff E-P (microgm3) Populated weighted
mean Number of people Percentage of
population -04 - -03 7698 07 -03 - -02 50131 46 -02 - -01 296288 275 -01 - -0 724250 672 Tot -009 1078367 NOX diff E-P (microgm3) Populated weighted
mean Number of people Percentage of
population -06 - -05 7698 -05 - -04 19639 18 -04 - -03 36626 34 -03 - -02 161685 150 -02 - -01 186500 173 -01 - -0 666219 618 Tot -012 1078367 O3 diff E-P (microgm3) Populated weighted
mean Number of people Percentage of
population -02 - -01 779132 723 -01 - -0 266417 247 0 - 01 32818 30 Tot -012 1078367
Exposure data for the total levels in the two scenarios can be found in Table A6
A comparison of emissions from ethanol and petrol fuelled cars IVL report B1962 Health risk assessment for Vaumlstra Goumltaland
41
Table A6 Exposure data for the total levels in the two scenarios
Acetaldehyde tot All ethanol (microgm3)
Populated weighted mean
Number of people Percentage of population
06 - 07 568825 527 07 - 08 171845 159 08 - 09 124551 115 09 - 10 100946 94 10 - 11 59235 55 11 - 12 30559 28 12 - 13 13175 12 13 - 14 7983 07 14 - 15 1248 01 Tot 077 1078367 Acetaldehyde tot All petrol (microgm3)
Populated weighted mean
Number of people Percentage of population
05 - 06 45111 42 06 - 07 1032008 957 07 - 08 1248 01 Tot 065 1078367 Benzene tot All ethanol (microgm3)
Populated weighted mean
Number of people Percentage of population
0 - 01 1055961 98 01 - 02 22406 2 Tot 005 1078367 Benzene tot All petrol (microgm3)
Populated weighted mean
Number of people Percentage of population
0 - 01 729093 676 01 - 02 232961 216 02 - 03 94042 87 03 - 04 21023 19 04 - 05 1248 01 Tot 010 1078367 NOX tot All ethanol (microgm3)
Populated weighted mean
Number of people Percentage of population
0-10 779108 722 10-20 254658 236 20-30 28683 27 30-40 11070 10 40-50 3426 03 50-60 0 00 60-70 0 00 70-80 639 01 80-90 0 00 90-100 0 00 100-110 783 01 Tot 84 1078367 NOX tot All petrol (microgm3)
Populated weighted mean
Number of people Percentage of population
0-10 769557 714 10-20 264209 245 20-30 28683 27 30-40 11070 10 40-50 3426 03 50-60 0 00
A comparison of emissions from ethanol and petrol fuelled cars IVL report B1962 Health risk assessment for Vaumlstra Goumltaland
42
60-70 0 00 70-80 639 01 80-90 0 00 90-100 0 00 100-110 783 01 Tot 85 1078367 O3 tot All ethanol (microgm3)
Populated weighted mean
Number of people Percentage of population
40-45 1422 01 45-50 26487 25 50-55 176636 164 55-60 770370 714 60-65 103452 96 Tot 569 1078367 O3 tot All petrol (microgm3)
Populated weighted mean
Number of people Percentage of population
40-45 1422 01 45-50 20229 19 50-55 181876 169 55-60 763361 708 60-65 111479 103 Tot 570 1078367 PM25 tot All ethanol (microgm3)
Populated weighted mean
Number of people Percentage of population
1-2 0 00 2-3 885325 821 3-4 192259 178 4-5 783 01 Tot 268 1078367 PM25 tot All petrol (microgm3)
Populated weighted mean
Number of people Percentage of population
1-2 0 00 2-3 868773 806 3-4 208811 194 4-5 783 01 Tot 270 1078367
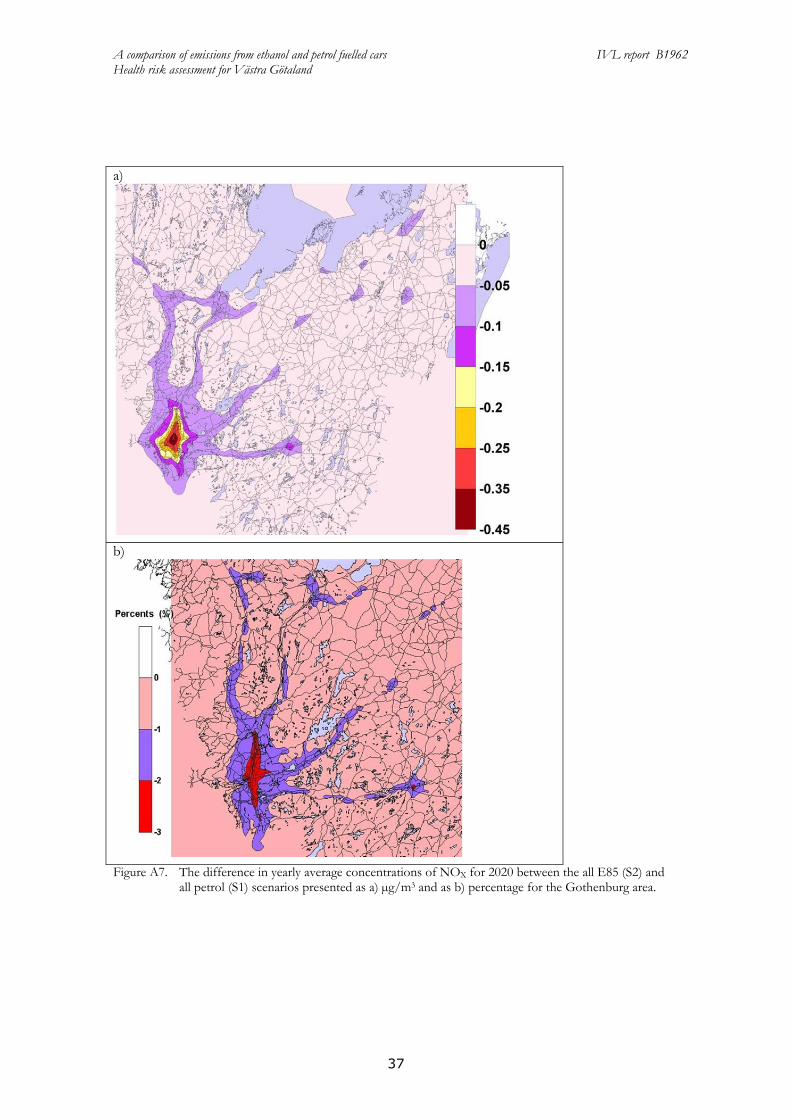
A comparison of emissions from ethanol and petrol fuelled cars IVL report B1962 Health risk assessment for Vaumlstra Goumltaland
39
a)
b)
Figure A9 The difference in yearly average concentrations of ozone for 2020 between the all E85 (S2) and all petrol (S1) scenarios presented as a) microgm3 and as b) percentage for mainly the Gothenburg area
A comparison of emissions from ethanol and petrol fuelled cars IVL report B1962 Health risk assessment for Vaumlstra Goumltaland
40
Appendix 5 Detailed Exposure data
Detailed exposure data for the difference between the all E85 (S2) and the all petrol (S1) scenarios can be found in Table A5
Table A5 Exposure data for the difference between the all E85 (S2) and the all petrol (S1) scenarios
Acetaldehyde diff E-P (microgm3)
Populated weighted mean
Number of people Percentage of population
0 - 01 627198 582 01 - 02 163394 152 02 - 03 134879 125 03 - 04 88099 82 04 - 05 38686 36 05 - 06 16880 16 06 - 07 7983 07 07 - 08 1248 01 Tot 014 1078367 Benzene diff E-P (microgm3)
Populated weighted mean
Number of people Percentage of population
-03 - -02 26680 25 -02 - -01 205757 191 -01 - -0 845930 784 Tot -0074 1078367 NO2 diff E-P (microgm3) Populated weighted
mean Number of people Percentage of
population -04 - -03 7698 07 -03 - -02 50131 46 -02 - -01 296288 275 -01 - -0 724250 672 Tot -009 1078367 NOX diff E-P (microgm3) Populated weighted
mean Number of people Percentage of
population -06 - -05 7698 -05 - -04 19639 18 -04 - -03 36626 34 -03 - -02 161685 150 -02 - -01 186500 173 -01 - -0 666219 618 Tot -012 1078367 O3 diff E-P (microgm3) Populated weighted
mean Number of people Percentage of
population -02 - -01 779132 723 -01 - -0 266417 247 0 - 01 32818 30 Tot -012 1078367
Exposure data for the total levels in the two scenarios can be found in Table A6
A comparison of emissions from ethanol and petrol fuelled cars IVL report B1962 Health risk assessment for Vaumlstra Goumltaland
41
Table A6 Exposure data for the total levels in the two scenarios
Acetaldehyde tot All ethanol (microgm3)
Populated weighted mean
Number of people Percentage of population
06 - 07 568825 527 07 - 08 171845 159 08 - 09 124551 115 09 - 10 100946 94 10 - 11 59235 55 11 - 12 30559 28 12 - 13 13175 12 13 - 14 7983 07 14 - 15 1248 01 Tot 077 1078367 Acetaldehyde tot All petrol (microgm3)
Populated weighted mean
Number of people Percentage of population
05 - 06 45111 42 06 - 07 1032008 957 07 - 08 1248 01 Tot 065 1078367 Benzene tot All ethanol (microgm3)
Populated weighted mean
Number of people Percentage of population
0 - 01 1055961 98 01 - 02 22406 2 Tot 005 1078367 Benzene tot All petrol (microgm3)
Populated weighted mean
Number of people Percentage of population
0 - 01 729093 676 01 - 02 232961 216 02 - 03 94042 87 03 - 04 21023 19 04 - 05 1248 01 Tot 010 1078367 NOX tot All ethanol (microgm3)
Populated weighted mean
Number of people Percentage of population
0-10 779108 722 10-20 254658 236 20-30 28683 27 30-40 11070 10 40-50 3426 03 50-60 0 00 60-70 0 00 70-80 639 01 80-90 0 00 90-100 0 00 100-110 783 01 Tot 84 1078367 NOX tot All petrol (microgm3)
Populated weighted mean
Number of people Percentage of population
0-10 769557 714 10-20 264209 245 20-30 28683 27 30-40 11070 10 40-50 3426 03 50-60 0 00
A comparison of emissions from ethanol and petrol fuelled cars IVL report B1962 Health risk assessment for Vaumlstra Goumltaland
42
60-70 0 00 70-80 639 01 80-90 0 00 90-100 0 00 100-110 783 01 Tot 85 1078367 O3 tot All ethanol (microgm3)
Populated weighted mean
Number of people Percentage of population
40-45 1422 01 45-50 26487 25 50-55 176636 164 55-60 770370 714 60-65 103452 96 Tot 569 1078367 O3 tot All petrol (microgm3)
Populated weighted mean
Number of people Percentage of population
40-45 1422 01 45-50 20229 19 50-55 181876 169 55-60 763361 708 60-65 111479 103 Tot 570 1078367 PM25 tot All ethanol (microgm3)
Populated weighted mean
Number of people Percentage of population
1-2 0 00 2-3 885325 821 3-4 192259 178 4-5 783 01 Tot 268 1078367 PM25 tot All petrol (microgm3)
Populated weighted mean
Number of people Percentage of population
1-2 0 00 2-3 868773 806 3-4 208811 194 4-5 783 01 Tot 270 1078367
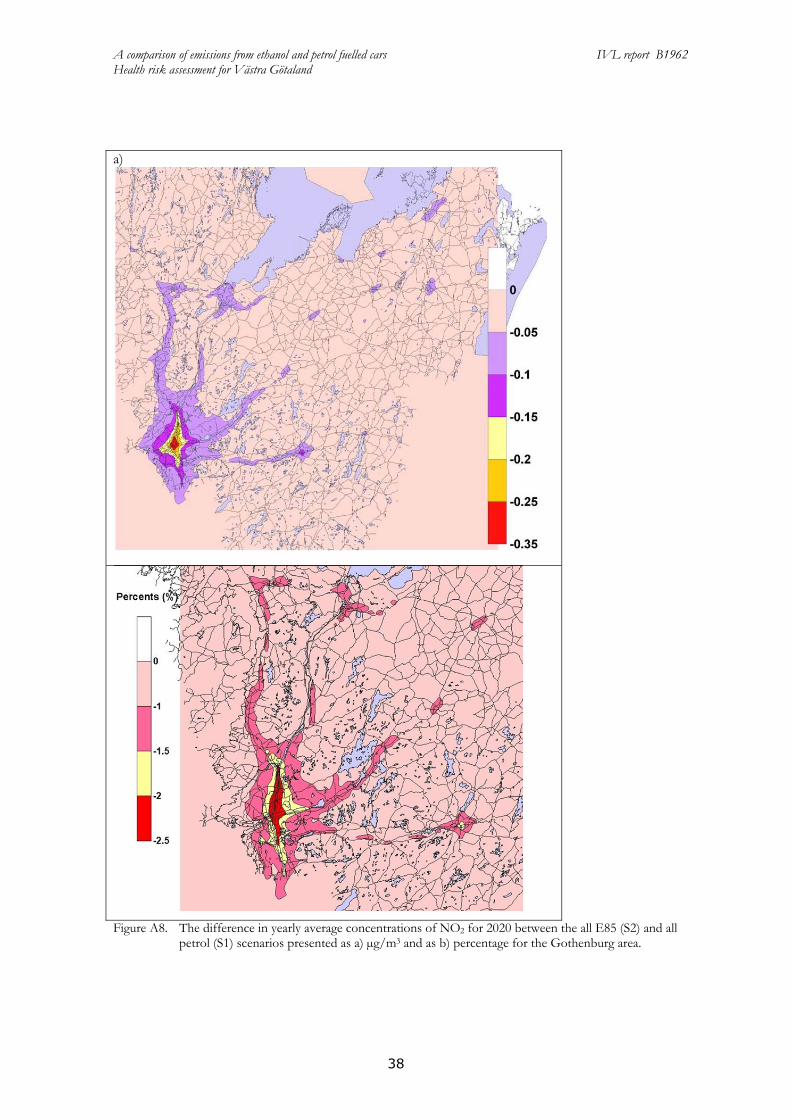
A comparison of emissions from ethanol and petrol fuelled cars IVL report B1962 Health risk assessment for Vaumlstra Goumltaland
40
Appendix 5 Detailed Exposure data
Detailed exposure data for the difference between the all E85 (S2) and the all petrol (S1) scenarios can be found in Table A5
Table A5 Exposure data for the difference between the all E85 (S2) and the all petrol (S1) scenarios
Acetaldehyde diff E-P (microgm3)
Populated weighted mean
Number of people Percentage of population
0 - 01 627198 582 01 - 02 163394 152 02 - 03 134879 125 03 - 04 88099 82 04 - 05 38686 36 05 - 06 16880 16 06 - 07 7983 07 07 - 08 1248 01 Tot 014 1078367 Benzene diff E-P (microgm3)
Populated weighted mean
Number of people Percentage of population
-03 - -02 26680 25 -02 - -01 205757 191 -01 - -0 845930 784 Tot -0074 1078367 NO2 diff E-P (microgm3) Populated weighted
mean Number of people Percentage of
population -04 - -03 7698 07 -03 - -02 50131 46 -02 - -01 296288 275 -01 - -0 724250 672 Tot -009 1078367 NOX diff E-P (microgm3) Populated weighted
mean Number of people Percentage of
population -06 - -05 7698 -05 - -04 19639 18 -04 - -03 36626 34 -03 - -02 161685 150 -02 - -01 186500 173 -01 - -0 666219 618 Tot -012 1078367 O3 diff E-P (microgm3) Populated weighted
mean Number of people Percentage of
population -02 - -01 779132 723 -01 - -0 266417 247 0 - 01 32818 30 Tot -012 1078367
Exposure data for the total levels in the two scenarios can be found in Table A6
A comparison of emissions from ethanol and petrol fuelled cars IVL report B1962 Health risk assessment for Vaumlstra Goumltaland
41
Table A6 Exposure data for the total levels in the two scenarios
Acetaldehyde tot All ethanol (microgm3)
Populated weighted mean
Number of people Percentage of population
06 - 07 568825 527 07 - 08 171845 159 08 - 09 124551 115 09 - 10 100946 94 10 - 11 59235 55 11 - 12 30559 28 12 - 13 13175 12 13 - 14 7983 07 14 - 15 1248 01 Tot 077 1078367 Acetaldehyde tot All petrol (microgm3)
Populated weighted mean
Number of people Percentage of population
05 - 06 45111 42 06 - 07 1032008 957 07 - 08 1248 01 Tot 065 1078367 Benzene tot All ethanol (microgm3)
Populated weighted mean
Number of people Percentage of population
0 - 01 1055961 98 01 - 02 22406 2 Tot 005 1078367 Benzene tot All petrol (microgm3)
Populated weighted mean
Number of people Percentage of population
0 - 01 729093 676 01 - 02 232961 216 02 - 03 94042 87 03 - 04 21023 19 04 - 05 1248 01 Tot 010 1078367 NOX tot All ethanol (microgm3)
Populated weighted mean
Number of people Percentage of population
0-10 779108 722 10-20 254658 236 20-30 28683 27 30-40 11070 10 40-50 3426 03 50-60 0 00 60-70 0 00 70-80 639 01 80-90 0 00 90-100 0 00 100-110 783 01 Tot 84 1078367 NOX tot All petrol (microgm3)
Populated weighted mean
Number of people Percentage of population
0-10 769557 714 10-20 264209 245 20-30 28683 27 30-40 11070 10 40-50 3426 03 50-60 0 00
A comparison of emissions from ethanol and petrol fuelled cars IVL report B1962 Health risk assessment for Vaumlstra Goumltaland
42
60-70 0 00 70-80 639 01 80-90 0 00 90-100 0 00 100-110 783 01 Tot 85 1078367 O3 tot All ethanol (microgm3)
Populated weighted mean
Number of people Percentage of population
40-45 1422 01 45-50 26487 25 50-55 176636 164 55-60 770370 714 60-65 103452 96 Tot 569 1078367 O3 tot All petrol (microgm3)
Populated weighted mean
Number of people Percentage of population
40-45 1422 01 45-50 20229 19 50-55 181876 169 55-60 763361 708 60-65 111479 103 Tot 570 1078367 PM25 tot All ethanol (microgm3)
Populated weighted mean
Number of people Percentage of population
1-2 0 00 2-3 885325 821 3-4 192259 178 4-5 783 01 Tot 268 1078367 PM25 tot All petrol (microgm3)
Populated weighted mean
Number of people Percentage of population
1-2 0 00 2-3 868773 806 3-4 208811 194 4-5 783 01 Tot 270 1078367
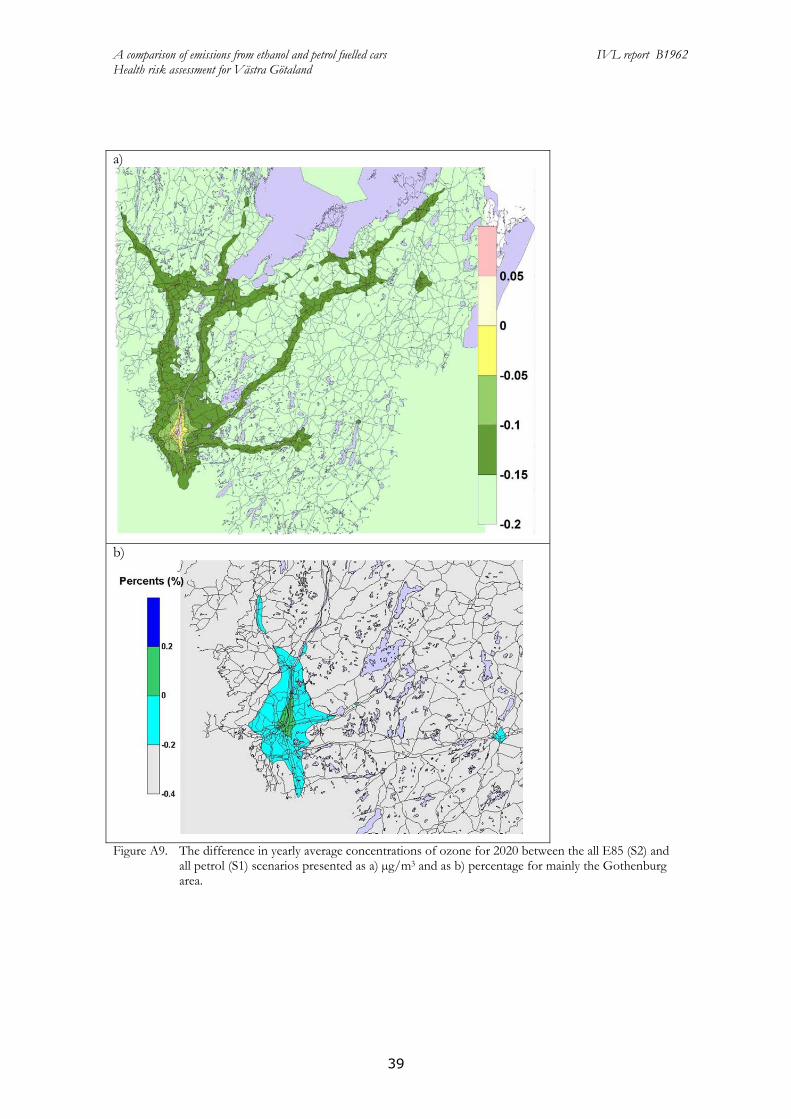
A comparison of emissions from ethanol and petrol fuelled cars IVL report B1962 Health risk assessment for Vaumlstra Goumltaland
41
Table A6 Exposure data for the total levels in the two scenarios
Acetaldehyde tot All ethanol (microgm3)
Populated weighted mean
Number of people Percentage of population
06 - 07 568825 527 07 - 08 171845 159 08 - 09 124551 115 09 - 10 100946 94 10 - 11 59235 55 11 - 12 30559 28 12 - 13 13175 12 13 - 14 7983 07 14 - 15 1248 01 Tot 077 1078367 Acetaldehyde tot All petrol (microgm3)
Populated weighted mean
Number of people Percentage of population
05 - 06 45111 42 06 - 07 1032008 957 07 - 08 1248 01 Tot 065 1078367 Benzene tot All ethanol (microgm3)
Populated weighted mean
Number of people Percentage of population
0 - 01 1055961 98 01 - 02 22406 2 Tot 005 1078367 Benzene tot All petrol (microgm3)
Populated weighted mean
Number of people Percentage of population
0 - 01 729093 676 01 - 02 232961 216 02 - 03 94042 87 03 - 04 21023 19 04 - 05 1248 01 Tot 010 1078367 NOX tot All ethanol (microgm3)
Populated weighted mean
Number of people Percentage of population
0-10 779108 722 10-20 254658 236 20-30 28683 27 30-40 11070 10 40-50 3426 03 50-60 0 00 60-70 0 00 70-80 639 01 80-90 0 00 90-100 0 00 100-110 783 01 Tot 84 1078367 NOX tot All petrol (microgm3)
Populated weighted mean
Number of people Percentage of population
0-10 769557 714 10-20 264209 245 20-30 28683 27 30-40 11070 10 40-50 3426 03 50-60 0 00
A comparison of emissions from ethanol and petrol fuelled cars IVL report B1962 Health risk assessment for Vaumlstra Goumltaland
42
60-70 0 00 70-80 639 01 80-90 0 00 90-100 0 00 100-110 783 01 Tot 85 1078367 O3 tot All ethanol (microgm3)
Populated weighted mean
Number of people Percentage of population
40-45 1422 01 45-50 26487 25 50-55 176636 164 55-60 770370 714 60-65 103452 96 Tot 569 1078367 O3 tot All petrol (microgm3)
Populated weighted mean
Number of people Percentage of population
40-45 1422 01 45-50 20229 19 50-55 181876 169 55-60 763361 708 60-65 111479 103 Tot 570 1078367 PM25 tot All ethanol (microgm3)
Populated weighted mean
Number of people Percentage of population
1-2 0 00 2-3 885325 821 3-4 192259 178 4-5 783 01 Tot 268 1078367 PM25 tot All petrol (microgm3)
Populated weighted mean
Number of people Percentage of population
1-2 0 00 2-3 868773 806 3-4 208811 194 4-5 783 01 Tot 270 1078367
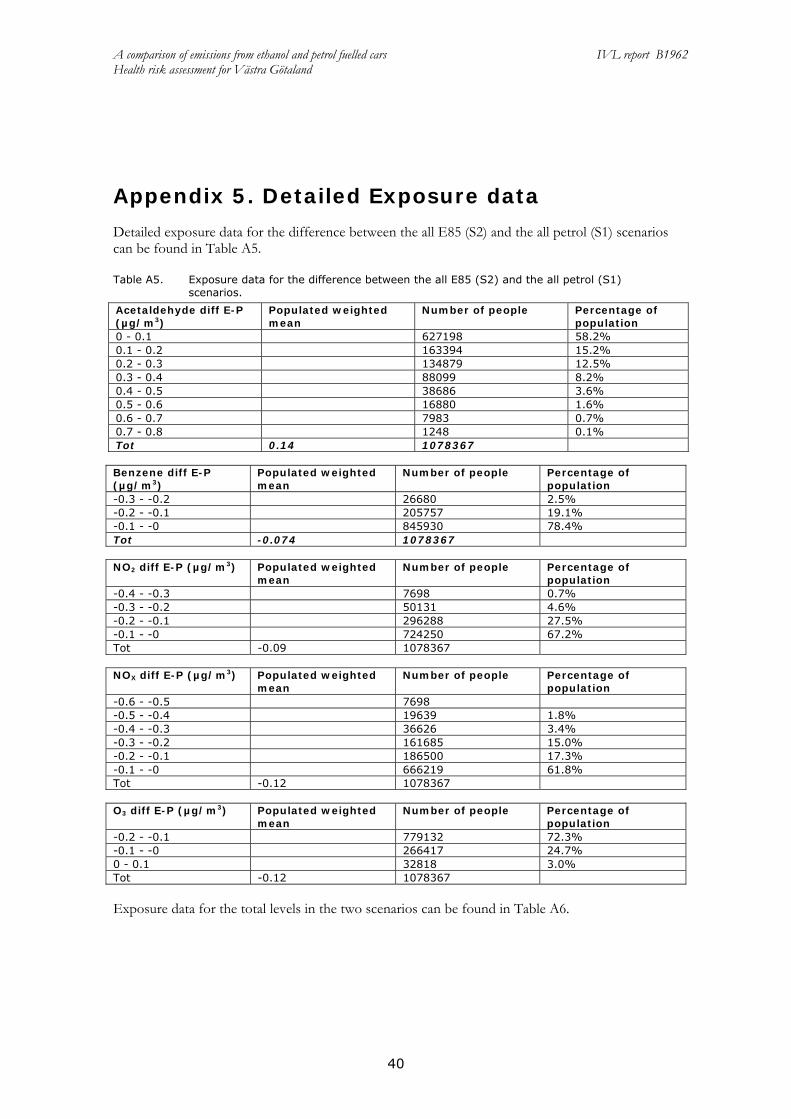
A comparison of emissions from ethanol and petrol fuelled cars IVL report B1962 Health risk assessment for Vaumlstra Goumltaland
42
60-70 0 00 70-80 639 01 80-90 0 00 90-100 0 00 100-110 783 01 Tot 85 1078367 O3 tot All ethanol (microgm3)
Populated weighted mean
Number of people Percentage of population
40-45 1422 01 45-50 26487 25 50-55 176636 164 55-60 770370 714 60-65 103452 96 Tot 569 1078367 O3 tot All petrol (microgm3)
Populated weighted mean
Number of people Percentage of population
40-45 1422 01 45-50 20229 19 50-55 181876 169 55-60 763361 708 60-65 111479 103 Tot 570 1078367 PM25 tot All ethanol (microgm3)
Populated weighted mean
Number of people Percentage of population
1-2 0 00 2-3 885325 821 3-4 192259 178 4-5 783 01 Tot 268 1078367 PM25 tot All petrol (microgm3)
Populated weighted mean
Number of people Percentage of population
1-2 0 00 2-3 868773 806 3-4 208811 194 4-5 783 01 Tot 270 1078367