A Comparison of Actuarial Financial Scenario Generators: CAS/SOA vs. AAA RBC C3 Kevin Ahlgrim, ASA,...
23
A Comparison of Actuarial A Comparison of Actuarial Financial Scenario Financial Scenario Generators: Generators: CAS/SOA vs. CAS/SOA vs. AAA RBC C3 AAA RBC C3 Kevin Ahlgrim, ASA, PhD, Illinois State Kevin Ahlgrim, ASA, PhD, Illinois State University University Steve D’Arcy, FCAS, PhD, University of Illinois Steve D’Arcy, FCAS, PhD, University of Illinois Rick Gorvett, FCAS, ARM, FRM, PhD, University of Rick Gorvett, FCAS, ARM, FRM, PhD, University of Illinois Illinois 14th AFIR Colloquium 14th AFIR Colloquium Boston Boston
-
date post
19-Dec-2015 -
Category
Documents
-
view
217 -
download
2
Transcript of A Comparison of Actuarial Financial Scenario Generators: CAS/SOA vs. AAA RBC C3 Kevin Ahlgrim, ASA,...

A Comparison of Actuarial A Comparison of Actuarial Financial Scenario Generators:Financial Scenario Generators:
CAS/SOA vs.CAS/SOA vs.AAA RBC C3AAA RBC C3
Kevin Ahlgrim, ASA, PhD, Illinois State University Kevin Ahlgrim, ASA, PhD, Illinois State University Steve D’Arcy, FCAS, PhD, University of IllinoisSteve D’Arcy, FCAS, PhD, University of Illinois
Rick Gorvett, FCAS, ARM, FRM, PhD, University of IllinoisRick Gorvett, FCAS, ARM, FRM, PhD, University of Illinois
14th AFIR Colloquium14th AFIR ColloquiumBostonBoston
November 2004November 2004

Outline of PresentationOutline of Presentation
Motivation for Financial Scenario Motivation for Financial Scenario GeneratorsGenerators
Description of economic variablesDescription of economic variables Structure of each modelStructure of each model Comparison of output Comparison of output ConclusionConclusion

MotivationMotivation Provide public access model for use in Provide public access model for use in
• DFADFA• RegulatoryRegulatory• Rating agencyRating agency• Internal management testsInternal management tests
Conduct literature reviewConduct literature review• From finance, economics, and actuarial scienceFrom finance, economics, and actuarial science
Develop financial scenario generator modelDevelop financial scenario generator model• Generate scenarios over a 50 year time horizonGenerate scenarios over a 50 year time horizon
Facilitate use of modelFacilitate use of model http://casact.org/research/econ/http://casact.org/research/econ/

Relationships Among Relationships Among Modeled Economic SeriesModeled Economic Series
Inflation Real Interest Rates
Real EstateUnemployment Nominal Interest
Lg. Stock Returns Sm. Stock ReturnsStock Dividends

Inflation (Inflation (qq)) Modeled as an Ornstein-Uhlenbeck Modeled as an Ornstein-Uhlenbeck
processprocess• One-factor, mean-revertingOne-factor, mean-reverting
dqdqtt = = qq ((qq – – qqtt) ) dtdt + + qq dB dBqq

Real Interest Rates (Real Interest Rates (rr)) Two-factor Vasicek term structure modelTwo-factor Vasicek term structure model Short-term rate (Short-term rate (rr) and long-term mean () and long-term mean (ll) are ) are
both stochastic variablesboth stochastic variables
drdrtt = = rr (l (ltt – r – rtt) dt + ) dt + rr dB dBrr
dldltt = = ll ( (ll – l – ltt) dt + ) dt + ll dB dBll

Nominal Interest RatesNominal Interest Rates Combines inflation and real interest ratesCombines inflation and real interest rates
ii = {( = {(11++qq) x () x (11++rr)} - )} - 11
where where ii = nominal interest rate = nominal interest rate
qq = inflation = inflation
rr = real interest rate = real interest rate Restriction against negative interest ratesRestriction against negative interest rates

MotivationMotivation Provide guidance for setting Risk-Based
Capital (RBC) requirements for variable products with guarantees
Focus is on• Interest rate risk• Equity risk
Recommend use of models Also provide 10,000 Pre-packaged scenarios Available at:http://www.actuary.org/life/phase2.htm

Relationships Among Relationships Among Modeled Economic SeriesModeled Economic Series
3-month U.S. Treasury yields
10-year U.S. Treasury yields
U.S. Long Term Corporate Bonds
Money Market7-year
U.S. Treasury yields
Diversified U.S. EquityDiversified
International Equity
U.S. Intermediate Term Government Bonds
Diversified Fixed Income
Diversified Balanced
Intermediate Risk EquityAggressive or
Specialized Equity
Risk-free rate r = 5.5% (effective) for all markets, roughly equal to the average 6-month U.S. Treasury yield
over the past 50 years

Nominal Interest Rates Nominal Interest Rates Three Processes For Three Time ScalesThree Processes For Three Time Scales
Long term, 10-Year Treasury YieldLong term, 10-Year Treasury Yield
Short term, 3-Month Treasury Yield Short term, 3-Month Treasury Yield
Medium-term, 7 year Treasury Yield Medium-term, 7 year Treasury Yield

Properties of the Interest Rate ModelProperties of the Interest Rate Model
WhereWhere• Z1, Z2, Z3 are normal distributions with mean 0;Z1, Z2, Z3 are normal distributions with mean 0;• αα, , ΦΦ are mean-reversion strengths; are mean-reversion strengths;• λλ, , ττ, , ξξt are regression parameters.t are regression parameters.
Lognormal distribution at time tLognormal distribution at time t• Avoid negative nominal interest rates.Avoid negative nominal interest rates.• Make the Kurtosis positive all the timeMake the Kurtosis positive all the time• Funnel of Doubt Graphs shift to the upper side.Funnel of Doubt Graphs shift to the upper side.• Variance increases faster as t increasesVariance increases faster as t increases

CAS/SOA AAA RBC C3
t
i
f (t, i) f (t, i)
i
t
0 0

Funnel of Doubt GraphsFunnel of Doubt Graphs3 Month Nominal Interest Rates (U. S. Treasury Bills) 3 Month Nominal Interest Rates (U. S. Treasury Bills)
CAS/SOA
0
0.03
0.06
0.09
0.12
0.15
0.18
0.21
0 1m 2m 3m 4m 5m 6m 7m 8m 9m 10m11m 1y 2y 3y 4y 5y 6y 7y 8y 9y 10y 15y 20y
AAA RBC C3
0
0.03
0.06
0.09
0.12
0.15
0.18
0.21
0 1m 2m 3m 4m 5m 6m 7m 8m 9m 10m11m 1y 2y 3y 4y 5y 6y 7y 8y 9y 10y 15y 20y
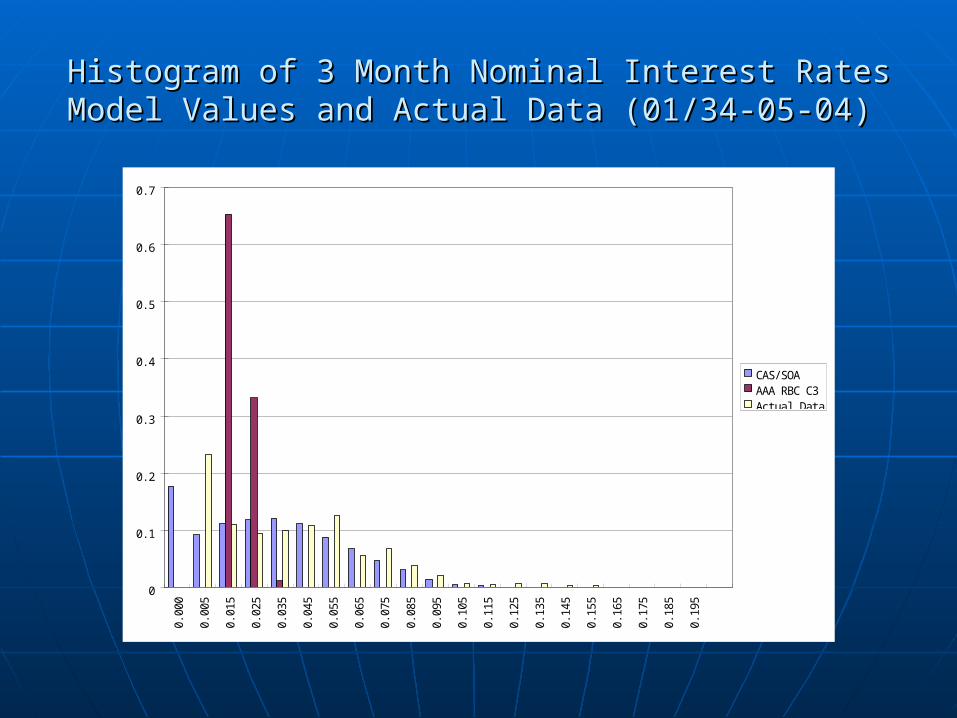
Histogram of 3 Month Nominal Interest RatesHistogram of 3 Month Nominal Interest RatesModel Values and Actual Data (01/34-05-04) Model Values and Actual Data (01/34-05-04)
0
0. 1
0. 2
0. 3
0. 4
0. 5
0. 6
0. 70.
000
0.00
5
0.01
5
0.02
5
0.03
5
0.04
5
0.05
5
0.06
5
0.07
5
0.08
5
0.09
5
0.10
5
0.11
5
0.12
5
0.13
5
0.14
5
0.15
5
0.16
5
0.17
5
0.18
5
0.19
5
CAS/ SOAAAA RBC C3Actual Data

Funnel of Doubt Graphs Funnel of Doubt Graphs 10 Year Nominal Interest Rates (U. S. Treasury Bonds)10 Year Nominal Interest Rates (U. S. Treasury Bonds)
CAS/SOA
0
0.02
0.04
0.06
0.08
0.1
0.12
0.14
0 1m 2m 3m 4m 5m 6m 7m 8m 9m 10m11m 1y 2y 3y 4y 5y 6y 7y 8y 9y 10y 15y 20y
AAA RBC C3
0
0.02
0.04
0.06
0.08
0.1
0.12
0.14
0 1m 2m 3m 4m 5m 6m 7m 8m 9m 10m11m 1y 2y 3y 4y 5y 6y 7y 8y 9y 10y 15y 20y

Histogram of 10 Year Nominal Interest RatesHistogram of 10 Year Nominal Interest RatesModel Values and Actual Data (04/53-05/04) Model Values and Actual Data (04/53-05/04)
0
0. 1
0. 2
0. 3
0. 4
0. 5
0. 60.
000
0.00
5
0.01
5
0.02
5
0.03
5
0.04
5
0.05
5
0.06
5
0.07
5
0.08
5
0.09
5
0.10
5
0.11
5
0.12
5
0.13
5
0.14
5
0.15
5
0.16
5
0.17
5
0.18
5
0.19
5
CAS/ SOAAAA RBC C3Actual Data

Equity ReturnsEquity Returns
Both models use Regime Switching Lognormal Both models use Regime Switching Lognormal Model with monthly data and 2 regimes (RSLN2)Model with monthly data and 2 regimes (RSLN2)
Model equity returns as an excess return (Model equity returns as an excess return (xxtt) over ) over the nominal interest ratethe nominal interest rate
sstt = i = itt + x + xtt
Two RegimesTwo Regimes1.1. High return, low volatility regimeHigh return, low volatility regime2.2. Low return, high volatility regimeLow return, high volatility regime
Six parametersSix parameters μμ1, 1, σσ1; 1; μμ2, 2, σσ22; ; PP12, 12, PP2121
Within Volatility Regimes Within Volatility Regimes μμ1, 1, σσ1; 1; μμ2, 2, σσ22
Transition MatrixTransition Matrix

Parameter DifferencesParameter Differences Data Sources for Maximum likelihood estimates
Parameter Differences (AAA Pre-packaged scenarios)Parameter Differences (AAA Pre-packaged scenarios)

Funnel of Doubt Graphs Funnel of Doubt Graphs Large Stock Return (US Equity)Large Stock Return (US Equity)
CAS/SOA
-0.80
-0.60
-0.40
-0.20
0.00
0.20
0.40
0.60
0.80
1.00
1.20
1.40
1y 2y 3y 4y 5y 6y 7y 8y 9y 10y 15y 20y
AAA RBC C3
-0.80
-0.60
-0.40
-0.20
0.00
0.20
0.40
0.60
0.80
1.00
1.20
1.40
1y 2y 3y 4y 5y 6y 7y 8y 9y 10y 15y 20y

Histogram of Large Stock ReturnHistogram of Large Stock ReturnModel Values and Actual Data (1872-2004)Model Values and Actual Data (1872-2004)
0
0.05
0.1
0.15
0.2
0.25-0
.75
-0.6
5
-0.5
5
-0.4
5
-0.3
5
-0.2
5
-0.1
5
-0.0
5
0.05
0.15
0.25
0.35
0.45
0.55
0.65
0.75
0.85
0.95
1.05
1.15
1.25
1.35
1.45
1.55
1.65
1.75
1.85
1.95
CAS/SOA
AAA RBC C3
Actual Data

Funnel of Doubt Graphs Funnel of Doubt Graphs Small Stock Return (Intermediate Risk Equity)Small Stock Return (Intermediate Risk Equity)
CAS/SOA
-0.80
-0.60
-0.40
-0.20
0.00
0.20
0.40
0.60
0.80
1.00
1.20
1.40
1y 2y 3y 4y 5y 6y 7y 8y 9y 10y 15y 20y
AAA RBC C3
-0.80
-0.60
-0.40
-0.20
0.00
0.20
0.40
0.60
0.80
1.00
1.20
1.40
1y 2y 3y 4y 5y 6y 7y 8y 9y 10y 15y 20y

Histogram of Small Stock ReturnHistogram of Small Stock ReturnModel Values and Actual Data (1926-2003)Model Values and Actual Data (1926-2003)
0
0.05
0.1
0.15
0.2
0.25-0
.75
-0.6
5
-0.5
5
-0.4
5
-0.3
5
-0.2
5
-0.1
5
-0.0
5
0.05
0.15
0.25
0.35
0.45
0.55
0.65
0.75
0.85
0.95
1.05
1.15
1.25
1.35
1.45
1.55
1.65
1.75
1.85
1.95
CAS/SOA
AAA RBC C3
Actual Data

ConclusionConclusion Financial models are assuming greater Financial models are assuming greater
importance for actuariesimportance for actuaries Actuaries need to understand how to apply Actuaries need to understand how to apply
these modelsthese models CAS/SOA model generates greater varianceCAS/SOA model generates greater variance AAA RBC C3 model provides returns on more AAA RBC C3 model provides returns on more
types of investmentstypes of investments Try out these modelsTry out these models Suggest additions or improvements Suggest additions or improvements Questions?Questions?