A Comparison of AC to Inverter DC Resistance Spot Welding ... · PDF fileto Inverter DC...
10
A Comparison of AC to Inverter DC Resistance Spot Welding and the Effects On Dual-Phase 600
-
Upload
nguyenthien -
Category
Documents
-
view
216 -
download
2
Transcript of A Comparison of AC to Inverter DC Resistance Spot Welding ... · PDF fileto Inverter DC...

A Comparison of AC to Inverter DC Resistance Spot Welding and the Ef fects On Dual-Phase 600
2
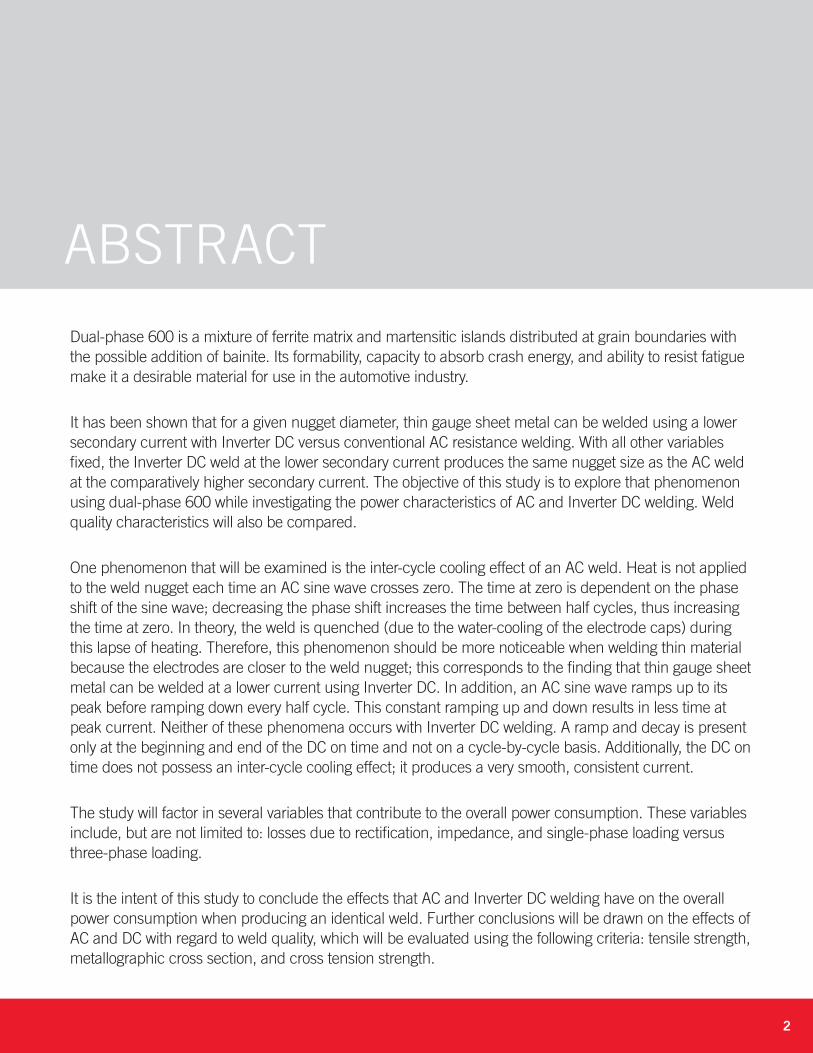
ABSTRACTDual-phase 600 is a mixture of ferrite matrix and martensitic islands distributed at grain boundaries with the possible addition of bainite. Its formability, capacity to absorb crash energy, and ability to resist fatigue make it a desirable material for use in the automotive industry.
It has been shown that for a given nugget diameter, thin gauge sheet metal can be welded using a lower secondary current with Inverter DC versus conventional AC resistance welding. With all other variables fixed, the Inverter DC weld at the lower secondary current produces the same nugget size as the AC weld at the comparatively higher secondary current. The objective of this study is to explore that phenomenon using dual-phase 600 while investigating the power characteristics of AC and Inverter DC welding. Weld quality characteristics will also be compared.
One phenomenon that will be examined is the inter-cycle cooling effect of an AC weld. Heat is not applied to the weld nugget each time an AC sine wave crosses zero. The time at zero is dependent on the phase shift of the sine wave; decreasing the phase shift increases the time between half cycles, thus increasing the time at zero. In theory, the weld is quenched (due to the water-cooling of the electrode caps) during this lapse of heating. Therefore, this phenomenon should be more noticeable when welding thin material because the electrodes are closer to the weld nugget; this corresponds to the finding that thin gauge sheet metal can be welded at a lower current using Inverter DC. In addition, an AC sine wave ramps up to its peak before ramping down every half cycle. This constant ramping up and down results in less time at peak current. Neither of these phenomena occurs with Inverter DC welding. A ramp and decay is present only at the beginning and end of the DC on time and not on a cycle-by-cycle basis. Additionally, the DC on time does not possess an inter-cycle cooling effect; it produces a very smooth, consistent current.
The study will factor in several variables that contribute to the overall power consumption. These variables include, but are not limited to: losses due to rectification, impedance, and single-phase loading versus three-phase loading.
It is the intent of this study to conclude the effects that AC and Inverter DC welding have on the overall power consumption when producing an identical weld. Further conclusions will be drawn on the effects of AC and DC with regard to weld quality, which will be evaluated using the following criteria: tensile strength, metallographic cross section, and cross tension strength.
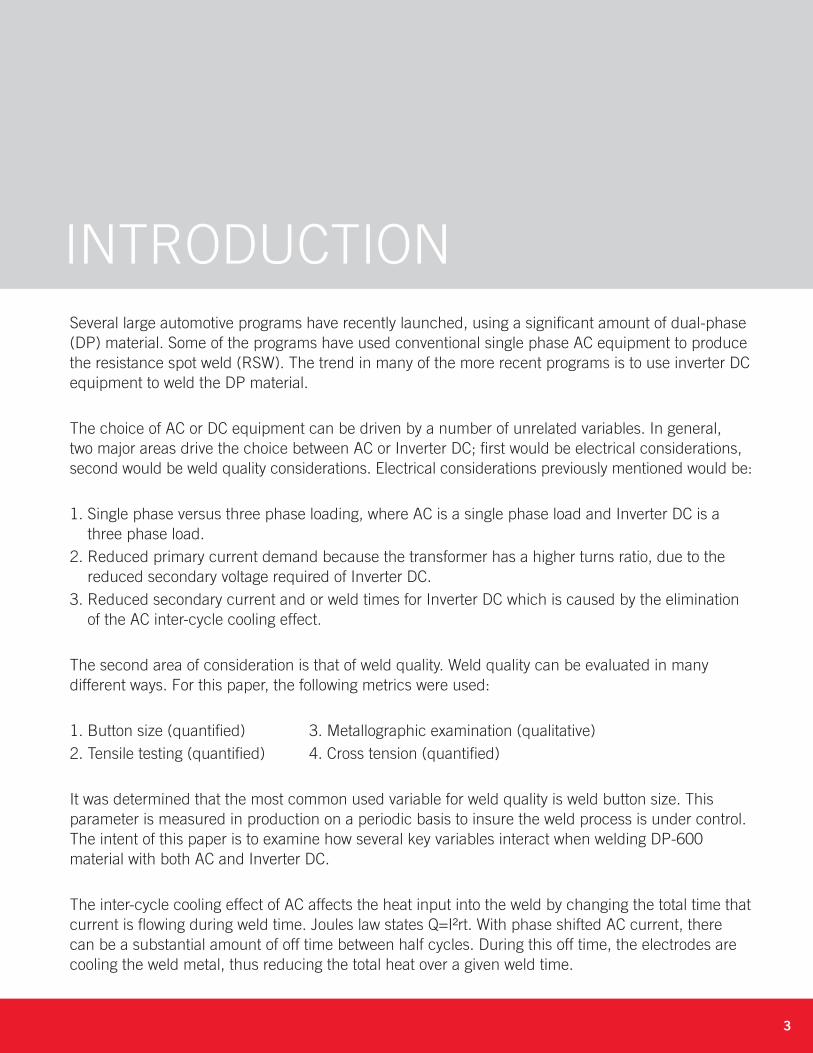
Several large automotive programs have recently launched, using a significant amount of dual-phase (DP) material. Some of the programs have used conventional single phase AC equipment to produce the resistance spot weld (RSW). The trend in many of the more recent programs is to use inverter DC equipment to weld the DP material.
The choice of AC or DC equipment can be driven by a number of unrelated variables. In general, two major areas drive the choice between AC or Inverter DC; first would be electrical considerations, second would be weld quality considerations. Electrical considerations previously mentioned would be:
1. Single phase versus three phase loading, where AC is a single phase load and Inverter DC is a three phase load.
2. Reduced primary current demand because the transformer has a higher turns ratio, due to the reduced secondary voltage required of Inverter DC.
3. Reduced secondary current and or weld times for Inverter DC which is caused by the elimination of the AC inter-cycle cooling effect.
The second area of consideration is that of weld quality. Weld quality can be evaluated in many different ways. For this paper, the following metrics were used:
1. Button size (quantified) 3. Metallographic examination (qualitative) 2. Tensile testing (quantified) 4. Cross tension (quantified) It was determined that the most common used variable for weld quality is weld button size. This parameter is measured in production on a periodic basis to insure the weld process is under control. The intent of this paper is to examine how several key variables interact when welding DP-600 material with both AC and Inverter DC.
The inter-cycle cooling effect of AC affects the heat input into the weld by changing the total time that current is flowing during weld time. Joules law states Q=I²rt. With phase shifted AC current, there can be a substantial amount of off time between half cycles. During this off time, the electrodes are cooling the weld metal, thus reducing the total heat over a given weld time.
INTRODUCTION
3
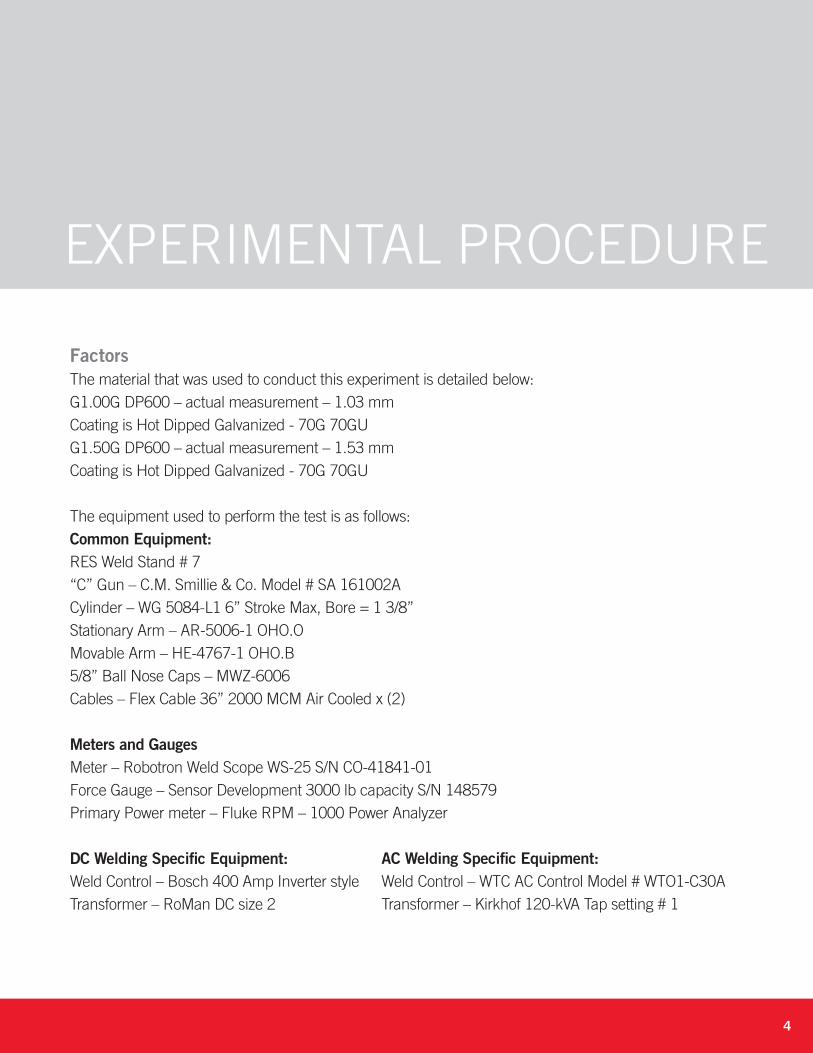
FactorsThe material that was used to conduct this experiment is detailed below:G1.00G DP600 – actual measurement – 1.03 mmCoating is Hot Dipped Galvanized - 70G 70GUG1.50G DP600 – actual measurement – 1.53 mmCoating is Hot Dipped Galvanized - 70G 70GU
The equipment used to perform the test is as follows:Common Equipment:RES Weld Stand # 7“C” Gun – C.M. Smillie & Co. Model # SA 161002ACylinder – WG 5084-L1 6” Stroke Max, Bore = 1 3/8”Stationary Arm – AR-5006-1 OHO.OMovable Arm – HE-4767-1 OHO.B5/8” Ball Nose Caps – MWZ-6006Cables – Flex Cable 36” 2000 MCM Air Cooled x (2)
Meters and GaugesMeter – Robotron Weld Scope WS-25 S/N CO-41841-01Force Gauge – Sensor Development 3000 lb capacity S/N 148579Primary Power meter – Fluke RPM – 1000 Power Analyzer
DC Welding Specific Equipment:Weld Control – Bosch 400 Amp Inverter styleTransformer – RoMan DC size 2
EXPERIMENTAL PROCEDURE
4
AC Welding Specific Equipment:Weld Control – WTC AC Control Model # WTO1-C30ATransformer – Kirkhof 120-kVA Tap setting # 1
5
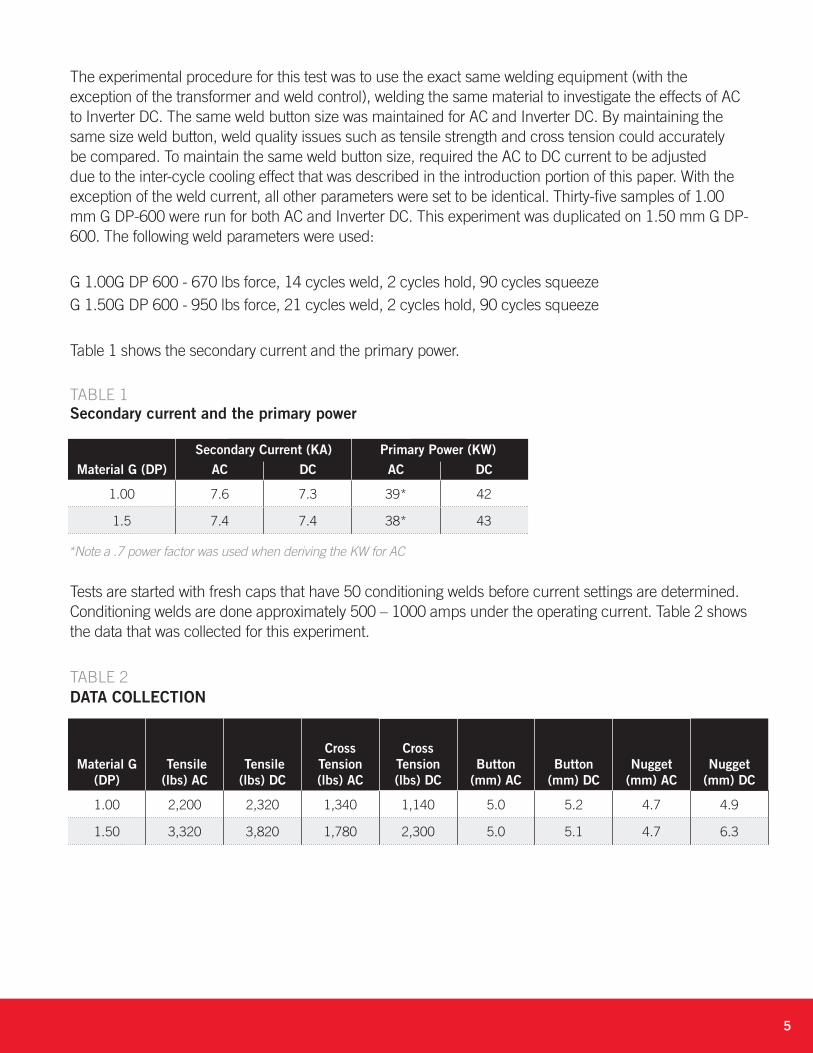
The experimental procedure for this test was to use the exact same welding equipment (with the exception of the transformer and weld control), welding the same material to investigate the effects of AC to Inverter DC. The same weld button size was maintained for AC and Inverter DC. By maintaining the same size weld button, weld quality issues such as tensile strength and cross tension could accurately be compared. To maintain the same weld button size, required the AC to DC current to be adjusted due to the inter-cycle cooling effect that was described in the introduction portion of this paper. With the exception of the weld current, all other parameters were set to be identical. Thirty-five samples of 1.00 mm G DP-600 were run for both AC and Inverter DC. This experiment was duplicated on 1.50 mm G DP-600. The following weld parameters were used:
G 1.00G DP 600 - 670 lbs force, 14 cycles weld, 2 cycles hold, 90 cycles squeezeG 1.50G DP 600 - 950 lbs force, 21 cycles weld, 2 cycles hold, 90 cycles squeeze
Table 1 shows the secondary current and the primary power.
TABLE 1Secondary current and the primary power
Tests are started with fresh caps that have 50 conditioning welds before current settings are determined. Conditioning welds are done approximately 500 – 1000 amps under the operating current. Table 2 shows the data that was collected for this experiment.
TABLE 2DATA COLLECTION
Material G (DP)
AC
DC
AC
DC
1.00 7.6 7.3 39* 42
1.5 7.4 7.4 38* 43
Secondary Current (KA) Primary Power (KW)
Material G (DP)
Tensile (lbs) AC
Tensile (lbs) DC
Cross Tension (lbs) AC
Cross Tension (lbs) DC
Button (mm) AC
Button (mm) DC
Nugget (mm) AC
Nugget (mm) DC
1.00 2,200 2,320 1,340 1,140 5.0 5.2 4.7 4.9
1.50 3,320 3,820 1,780 2,300 5.0 5.1 4.7 6.3
*Note a .7 power factor was used when deriving the KW for AC

6
Tension and Cross Tension TestingTension and Cross Tension testing procedures were performed as follows:Samples were prepared with the following parameters as shown in Figures 1 and 2. Figure 1 depicts a tensile shear coupon while Figure 2 depicts a cross tension coupon. The sample coupons followed industry convention.
FIGURE 1Detailed dimension of tensile shear coupons
FIGURE 2Detailed dimension of cross tension coupons
7
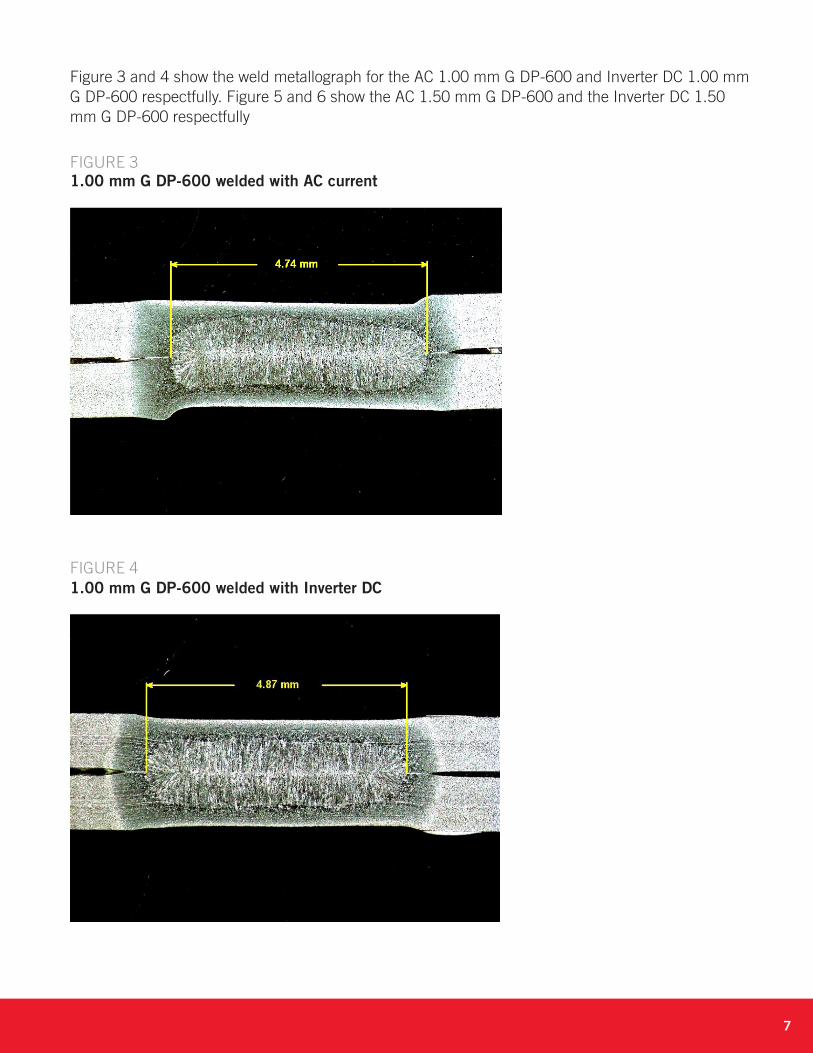
Figure 3 and 4 show the weld metallograph for the AC 1.00 mm G DP-600 and Inverter DC 1.00 mm G DP-600 respectfully. Figure 5 and 6 show the AC 1.50 mm G DP-600 and the Inverter DC 1.50 mm G DP-600 respectfully
FIGURE 31.00 mm G DP-600 welded with AC current
FIGURE 41.00 mm G DP-600 welded with Inverter DC

8
FIGURE 51.5 mm G DP-600 welded with AC current
FIGURE 61.50 mm G DP-600 Welded with Inverter DC
The electrical power analysis was performed using a Fluke RPM-1000 power analyzer. This equipment allowed us to look at the total power (from the primary) required to make a weld. With the combination of a Fluke RPM-1000 monitoring the primary and a Robotron Weld Scope WS-25 monitoring the secondary, a comparison between single phase AC and three phase Inverter DC could be made.

9
DISCUSSION
When comparing the effects of AC to Inverter DC on DP-600 material, it is not a simple matter of one being good or bad. Certain unrelated variables will ultimately drive the decision of single phase AC or Inverter DC. The electrical evaluation of AC compared to DC shows differences in two major areas. When comparing the single phase AC load to the three phase inverter load, the balance load of the three phases becomes an improvement when considering electrical distribution.. Along with a balanced three phase load, the power factor of the inverter load is approximately .99 or unity. This also is an improvement when compared to typical single phase AC with power factors ranging from .3 to .8 based on the design of the welding circuit.
Tensile Shear and Cross Tension testing helps determine the ultimate strength and the fracture mode of welded specimens. Unfortunately, the tensile shear test is a combination of tensile and shear and not pure shear. This combination of tensile and shear on the welded specimens will only affect the parent material or the heat-affected zone. This is not a good indication of weld quality but it is a good method of evaluating the consistency of the welding process used.
Cross Tension applies stresses to the weld in a direction normal to the surface of the weld. This test is a better indication of the quality of the weld then the Tensile Shear test. But again one must understand that this test does have some peeling action occurring during the test which does not apply all of the loading on the weld itself.
A metallograph is the best indication of the quality of the weld. It can be used to determine nugget size, penetration depth of the weld nugget, and porosity within the weld nugget.
For this study, the performed peel tests resulted in a consistent measured button size for the AC and Inverter DC welds. Further investigation should be considered to better understand the difference between the measured peeled button and the measured nugget on the metallograph.
CONCLUSION
When looking at the decision of using AC or Inverter DC to weld DP-600 material, the following conclusions can be drawn:
Electrical:• Inverter DC improves loading of the plant electrical system.• Inverter DC improves the power factor of the welding load.• Depending on the secondary impedance and the required turns ratio of the welding transformer,
Inverter DC will reduce the instantaneous demand on the electrical system.• With the equipment used for this experiment, only slight difference in primary power and secondary
current were measured between the AC and Inverter DC.
Weld Quality:Based on the data in Table 1, the application of AC or Inverter DC welding had no major affects on the overall quality of the weld.• The 1.00 mm G DP-600 material statistically had the same values in all tests.• The 1.50 mm G DP-600 material had an increase in load value of tensile and cross tension when
welding with Inverter DC. This could be contributed to the fact that the nugget size as measured metallographically was substantially larger than the button size. This phenomenon can not be fully explained at this time and further investigation will be required.
In summary, field experience along with this type of experiment will ultimately drive the final decision on which type of welding is best suited for the application. Current trends in automotive design indicate an increased application of thinner gauge materials. Continued evaluation will be required to understand the advantages of one RSW method verses the other as the industry moves toward thinner gauges of high strength materials.
©2017 RoMan Manufacturing
RoMan Manufacturing® | Grand Rapids, Michigan | romanmfg.com 10