A comparison between CERES OLR and OLR … comparison between CERES OLR and OLR calculated from AIRS...
27
A comparison between CERES OLR and OLR calculated from AIRS temperature & humidity for clear-sky regions J. Lee, A. E. Dessler, P. Yang Department of Atmospheric Sciences Texas A&M University
Transcript of A comparison between CERES OLR and OLR … comparison between CERES OLR and OLR calculated from AIRS...
A comparison between CERES OLR and OLR calculated from
AIRS temperature & humidity for clear-sky regions
J. Lee, A. E. Dessler, P. YangDepartment of Atmospheric Sciences
Texas A&M University

280260240220200Temperature (K)
1000 1000
800 800
600 600
400 400
200 200Pr
essu
re (
hPa)
2 4 60.1
2 4 61
2 4 610
Water vapor (g/kg)
Temperature Water vapor
2

280260240220200Temperature (K)
1000 1000
800 800
600 600
400 400
200 200Pr
essu
re (
hPa)
2 4 60.1
2 4 61
2 4 610
Water vapor (g/kg)
Temperature Water vapor
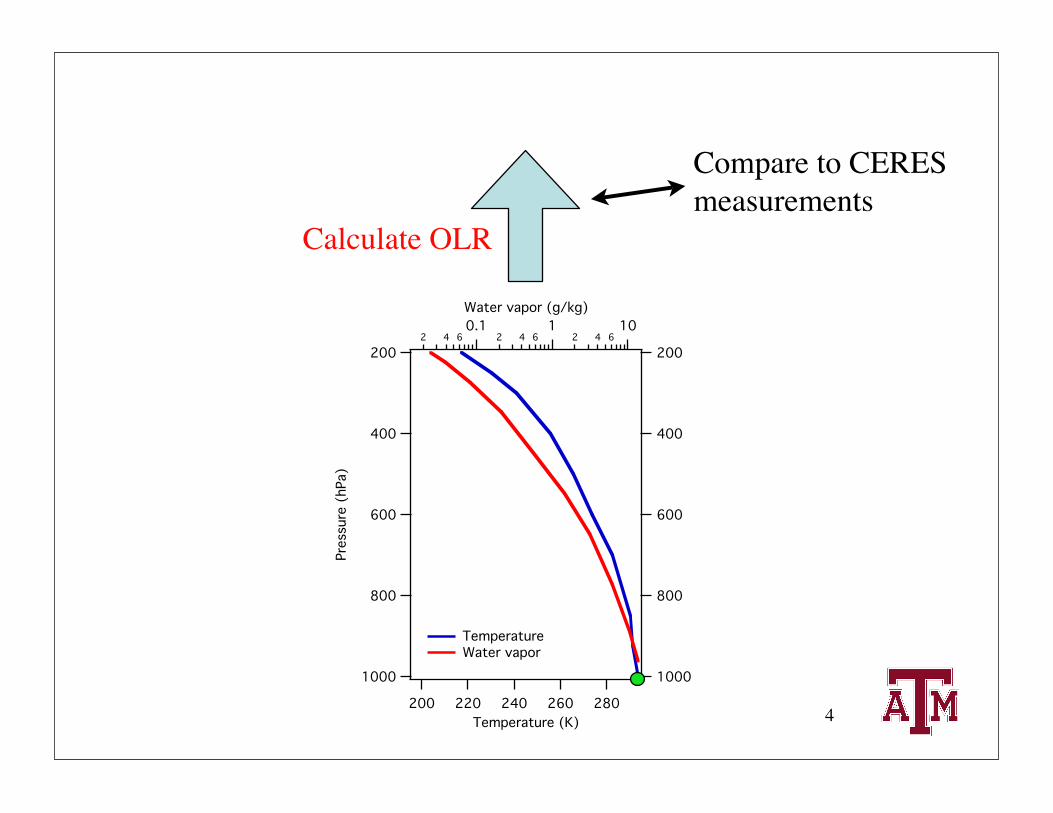
Calculate OLR
3
280260240220200Temperature (K)
1000 1000
800 800
600 600
400 400
200 200Pr
essu
re (
hPa)
2 4 60.1
2 4 61
2 4 610
Water vapor (g/kg)
Temperature Water vapor
Calculate OLR
4
Compare to CERES measurements

Methodology• Use CERES Aqua SSF edition 2a data• Consider those CERES measurements
where > 96% of the collocated MODIS cloud-mask measurements are clear
• Combine with AIRS measurements within ~20 km of the CERES measurement
• Calculate TOA flux from CERES surface skin temperature and AIRS profiles of q, T, and O3
• Nighttime, ocean, March and September 2005 5

Model Chou et al., 2001: A Thermal Infrared Radiation Parameterization for
Atmospheric Studies. NASA Tech. Memo. 104606, vol. 19, 1-55. The infrared spectrum (0~3000 cm-1) is divided into 9 bands and a
subband, in total 10 bands Using the Air Force Geophysical Laboratory HITRAN data base (1996
version) The parameterization includes the absorption due to major gaseous
absorption (water vapor, CO2, O3) and most of the minor trace gases (N2O, CH4, CFC’s) as well as clouds and aerosols.
The gaseous transmission function is computed either using the k-distribution method or the table look-up method.
Accuracy: within 1% of the high spectral-resolution line-by-line calculation In this calculation, band 9 (1900~3000 cm-1) is excluded to match with
CERES TOA flux band (50~2000 cm-1). The flux at 30 km between 1900 and 2000 cm-1 is 0.9 Wm-2 using tropical atmosphere.
Vertical atmospheric profiles from AIRS are used, including temperature, water vapor, and ozone profile
Atmosphere is divided into 100 layers from surface to 100 km and the AIRS profiles are interpolated at each level.
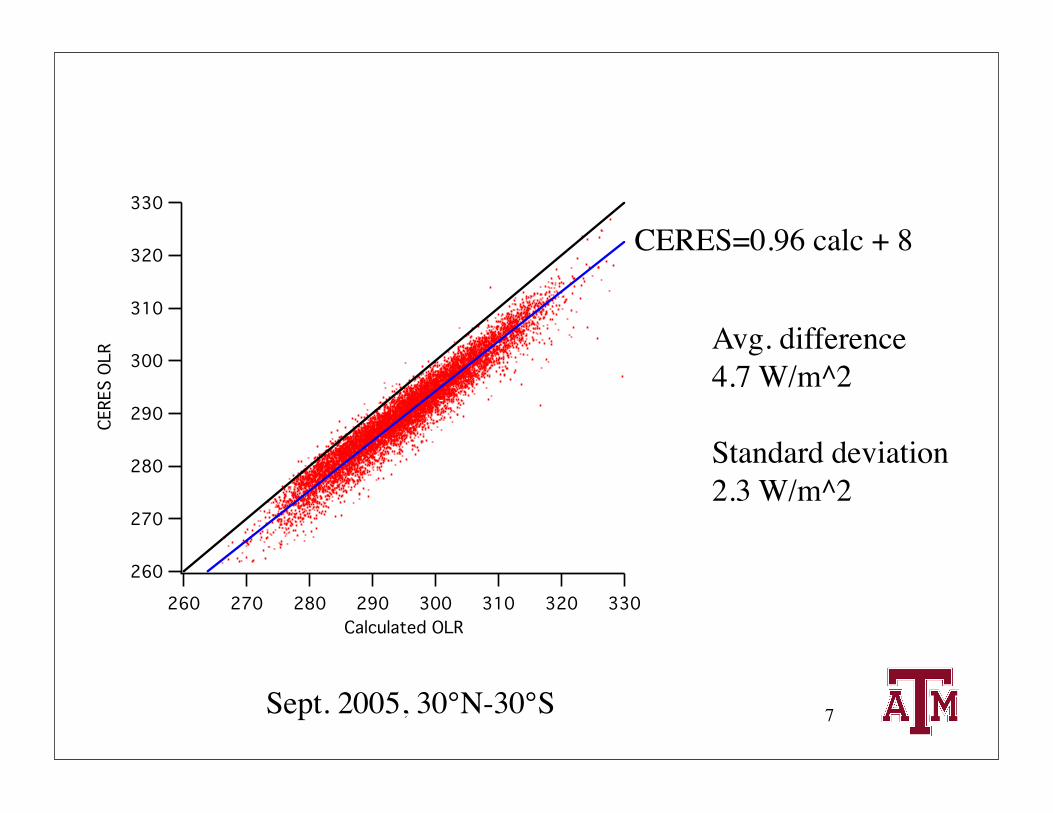
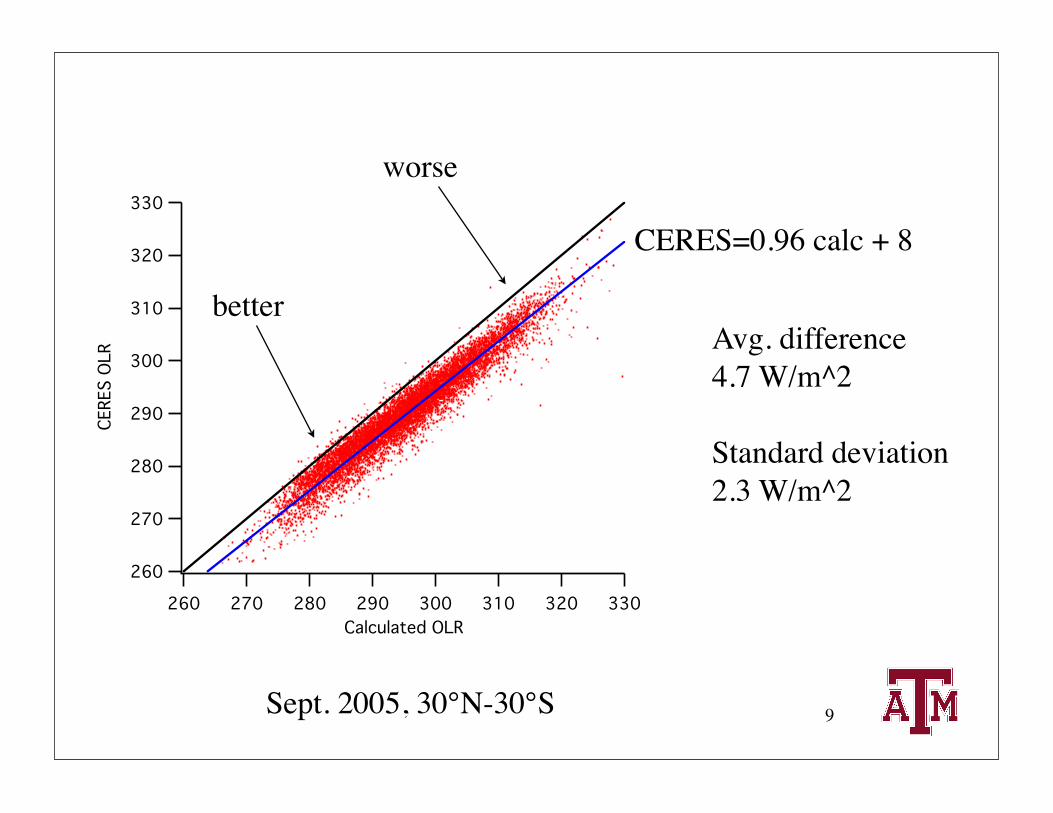
Sept. 2005, 30°N-30°S
Avg. difference4.7 W/m^2
Standard deviation2.3 W/m^2
CERES=0.96 calc + 8
7
330
320
310
300
290
280
270
260
CERE
S O
LR
330320310300290280270260Calculated OLR

8
300250200150OLR (W/m^2)
10
8
6
4
2
0
Frac
tion
of T
NTC
188 K
194 K
191 K
Dessler et al. (2006), Tropopause-level thin cirrus coverage revealed by ICESat/Geoscience Laser Altimeter System, J. Geophys. Res., 111, D08203, DOI:
10.1029/2005JD006586.
data
at t
ropo
paus
e-le
vel
Sept. 2005, 30°N-30°S
Avg. difference4.7 W/m^2
Standard deviation2.3 W/m^2
CERES=0.96 calc + 8
9
330
320
310
300
290
280
270
260
CERE
S O
LR
330320310300290280270260Calculated OLR
worse
better

10
300
298
296
294
292
290
288
286
OLR
(W
/m^2
)
304302300298296SST (K)
ERBE RS+model ceres modelj
ERBE analysisby Collins and InamdarJ. Clim., 1995
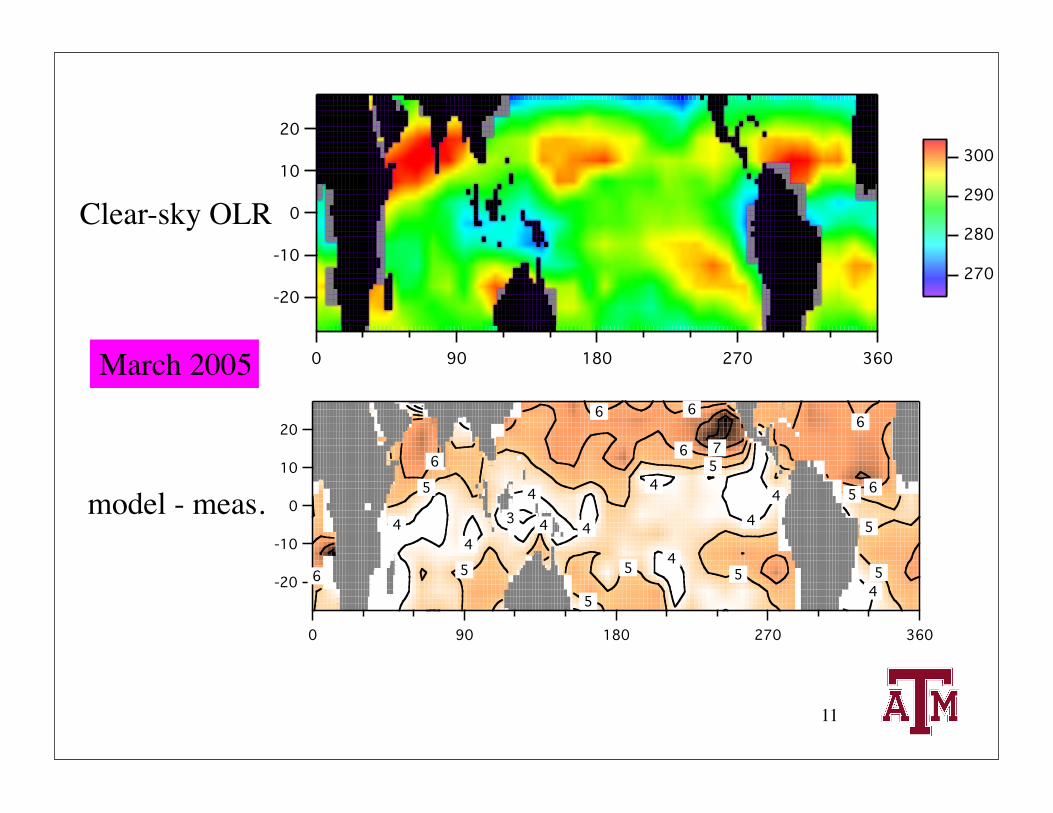
March 2005
-20
-10
0
10
20
360270180900
300
290
280
270
Clear-sky OLR
model - meas.
11
-20
-10
0
10
20
360270180900
7
6
6 6 6
6 6
6
5 5
5
5
5
5 5
5
5 4
4
4 4
4
4
4
4
4
4 3

Sept. 2005
Clear-sky OLR
model - meas.
-20
-10
0
10
20
360270180900
300
290
280
270
260
12
-20
-10
0
10
20
360270180900
7
6
6 6
6 6
6
5
5
5
5
5 5
5
5 5
4
4
4
4
4
4
4
4
3

Sept. 2005
Oct. 2003
Dessler, A.E., S.P. Palm, and J.D. Spinhirne (2006), Tropical cloud-top height distributions revealed by the Ice, Cloud, and Land Elevation Satellite (ICESat)/Geoscience Laser Altimeter System (GLAS), J. Geophys. Res., 111, D12215, DOI: 10.1029/2005JD006705.
13
-20
-10
0
10
20
360270180900
7
6
6 6
6 6
6
5
5
5
5
5 5
5
5 5
4
4
4
4
4
4
4
4
3
14
300
298
296
294
292
290
288
286
OLR
(W
/m^2
)
302300298296SST (K)
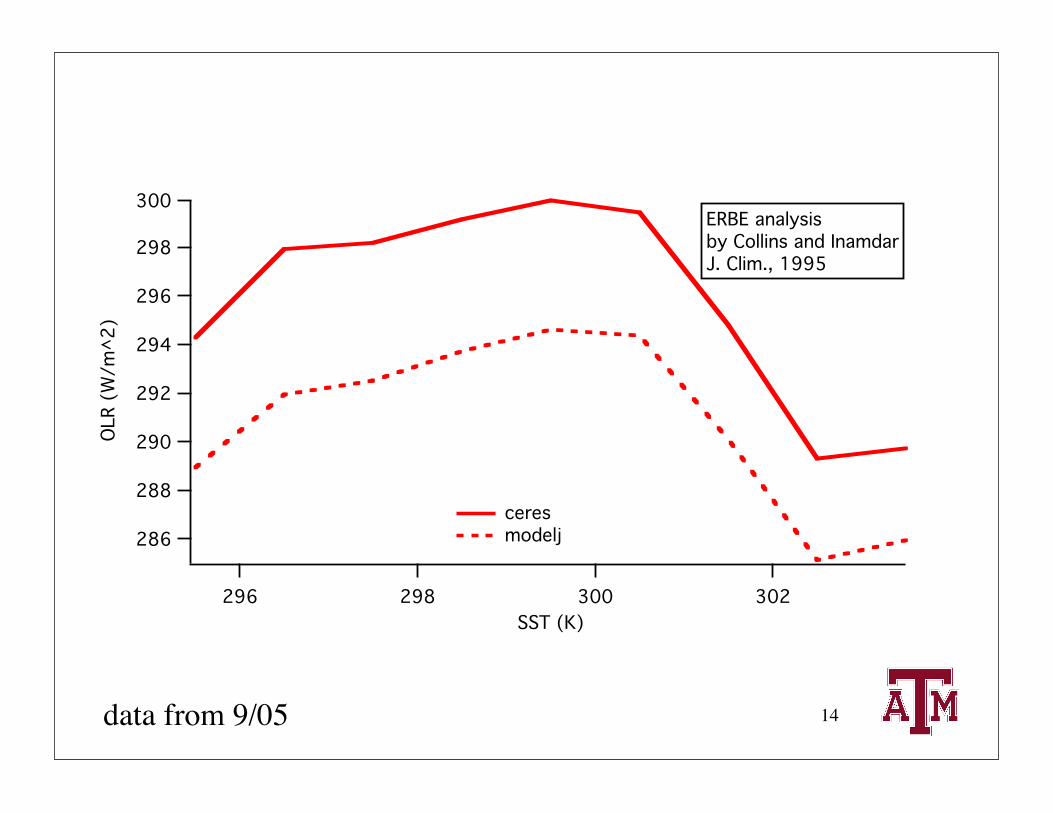
ceres modelj
ERBE analysisby Collins and InamdarJ. Clim., 1995
data from 9/05

15
300
298
296
294
292
290
288
286
OLR
(W
/m^2
)
302300298296SST (K)
ceres modelj
data from 9/05

16
Surface T 2.0
Lower Trop T 2.8
Upper Trop T 0.6
Lower Trop q -7.9
Upper Trop q -6.3
Compare to 299 to 303 K303 K OLR289.3 W/m^2
299 K OLR297.7 W/m^2
∆OLR-8.4 W/m^2
Lower Trop = 1000-500 hPa, Upper Trop = 500-100 hPa
data from 9/05
17
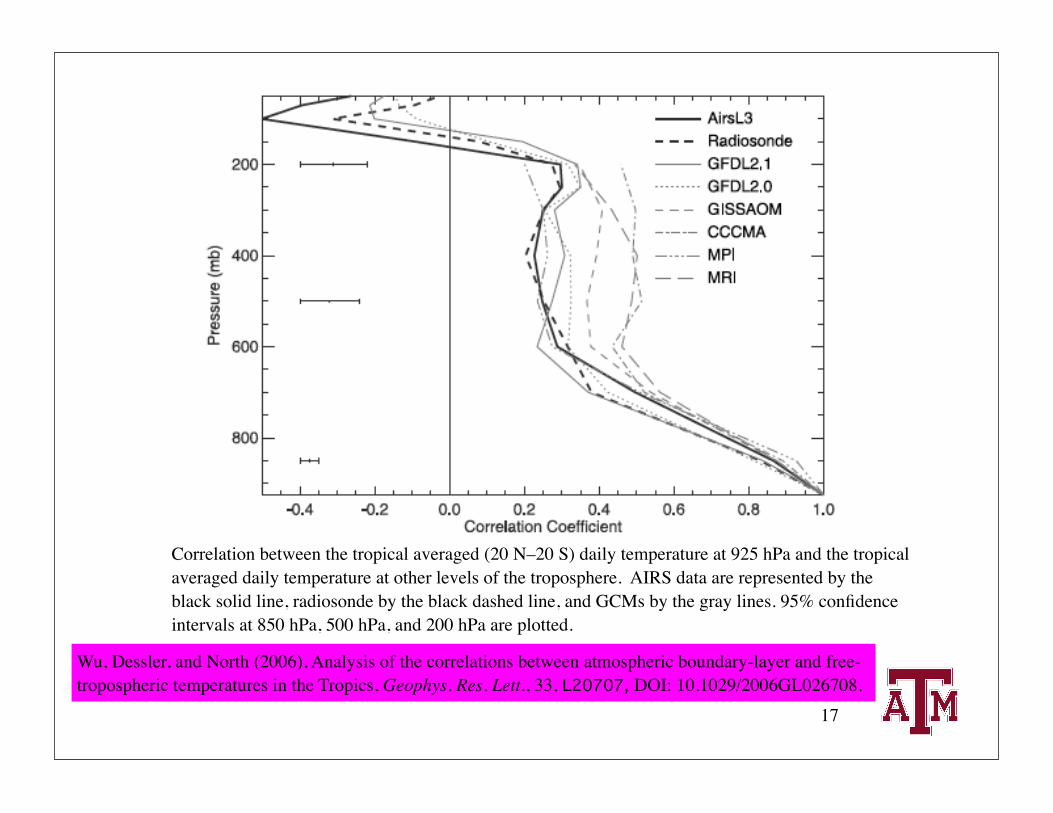
Correlation between the tropical averaged (20 N–20 S) daily temperature at 925 hPa and the tropical averaged daily temperature at other levels of the troposphere. AIRS data are represented by the black solid line, radiosonde by the black dashed line, and GCMs by the gray lines. 95% confidence intervals at 850 hPa, 500 hPa, and 200 hPa are plotted.
Wu, Dessler, and North (2006), Analysis of the correlations between atmospheric boundary-layer and free-tropospheric temperatures in the Tropics, Geophys. Res. Lett., 33, L20707, DOI: 10.1029/2006GL026708.
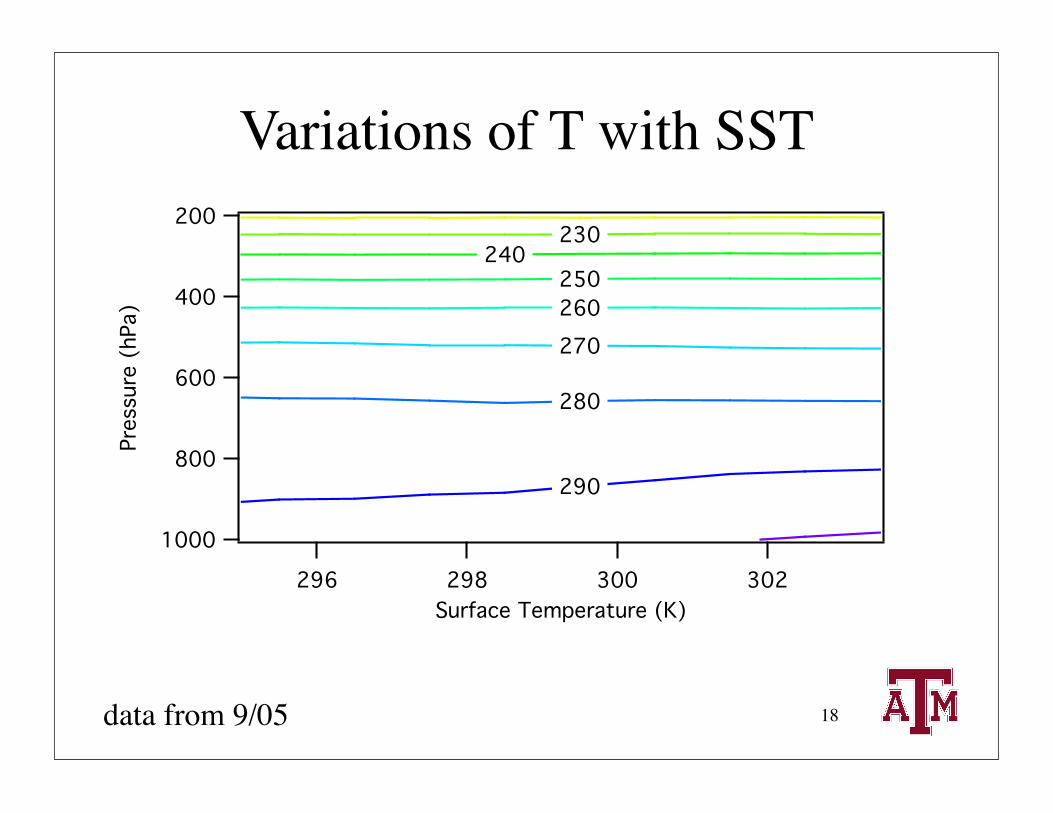
Variations of T with SST
18data from 9/05
1000
800
600
400
200
Pres
sure
(hP
a)
302300298296Surface Temperature (K)
290
280
270
260 250
240 230

Variations of q with SST
19
1000
800
600
400
200
Pres
sure
(hP
a)
302300298296Surface Temperature (K)
14 12 10 8 6
4 2
1 0.5
0.2 0.1
data from 9/05

20
300
298
296
294
292
290
288
286
OLR
(W
/m^2
)
302300298296SST (K)
ceres modelj
data from 9/05
21
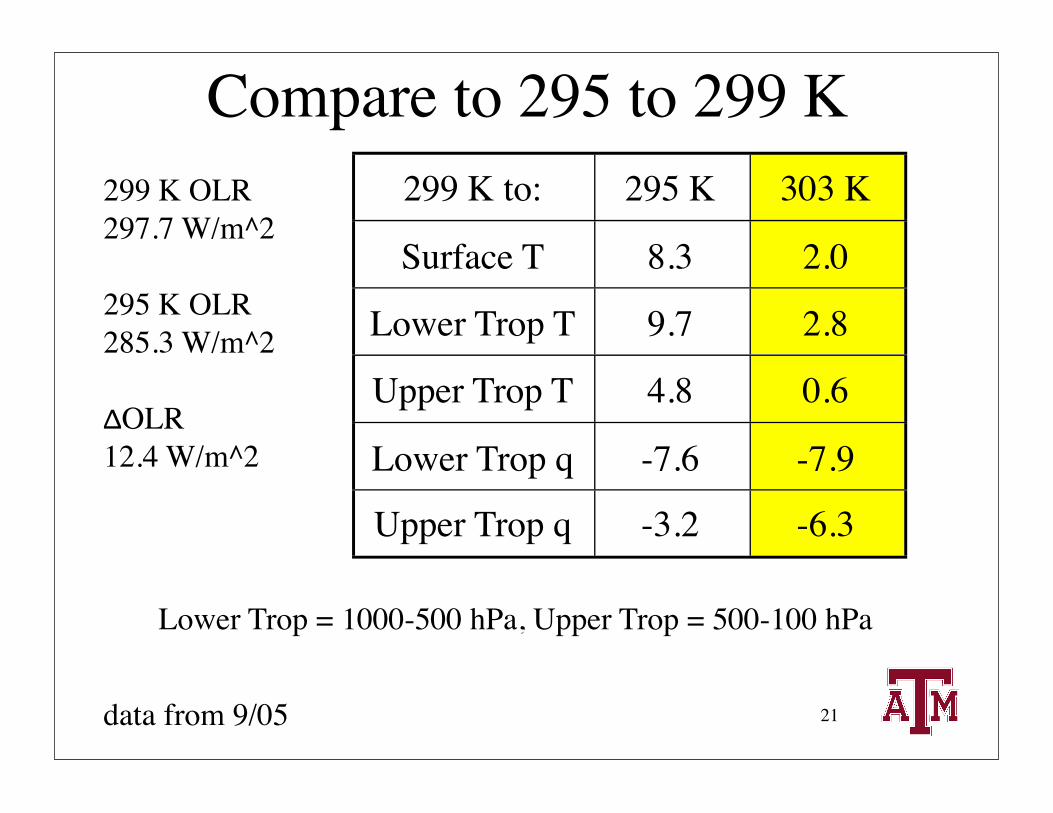
Lower Trop = 1000-500 hPa, Upper Trop = 500-100 hPa
Compare to 295 to 299 K299 K OLR297.7 W/m^2
295 K OLR285.3 W/m^2
∆OLR12.4 W/m^2
299 K to: 295 K 303 K
Surface T 8.3 2.0
Lower Trop T 9.7 2.8
Upper Trop T 4.8 0.6
Lower Trop q -7.6 -7.9
Upper Trop q -3.2 -6.3
data from 9/05

Variations of q with SST
22
1000
800
600
400
200
Pres
sure
(hP
a)
302300298296Surface Temperature (K)
14 12 10 8 6
4 2
1 0.5
0.2 0.1
data from 9/05
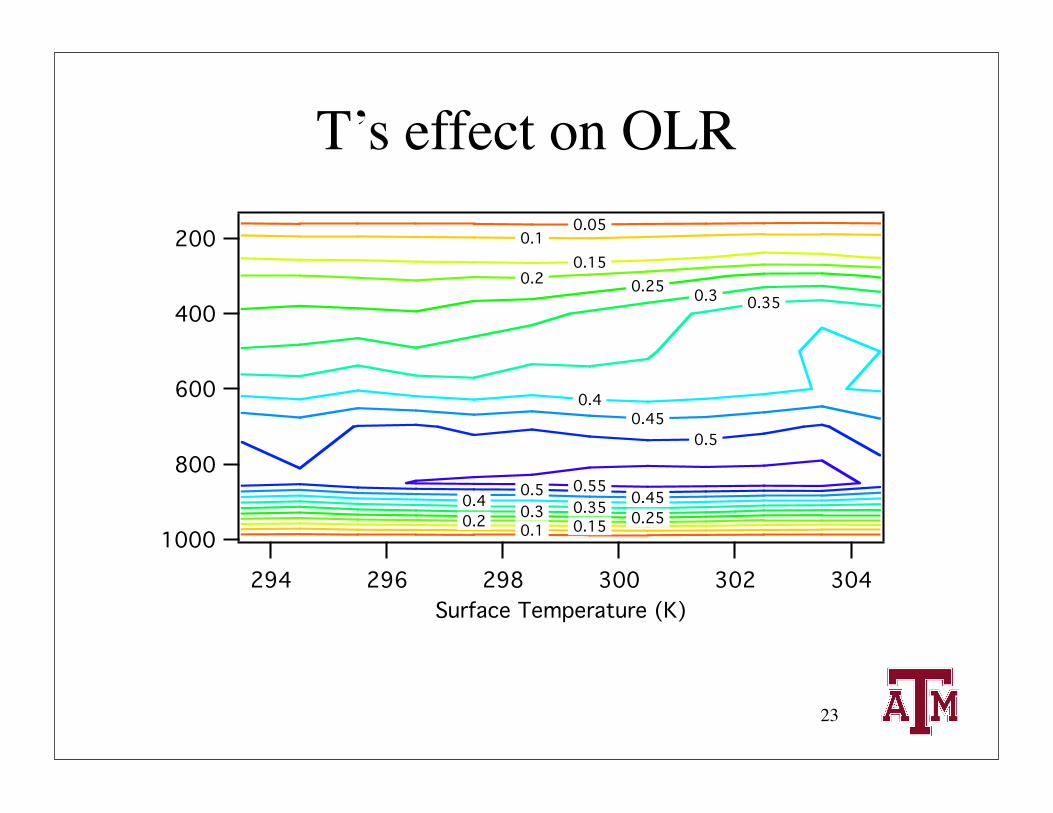
T’s effect on OLR
23
1000
800
600
400
200
304302300298296294Surface Temperature (K)
0.55
0.5
0.5
0.45
0.45
0.4
0.4
0.35
0.35
0.3
0.3
0.25
0.25
0.2
0.2
0.15
0.15
0.1
0.1
0.05
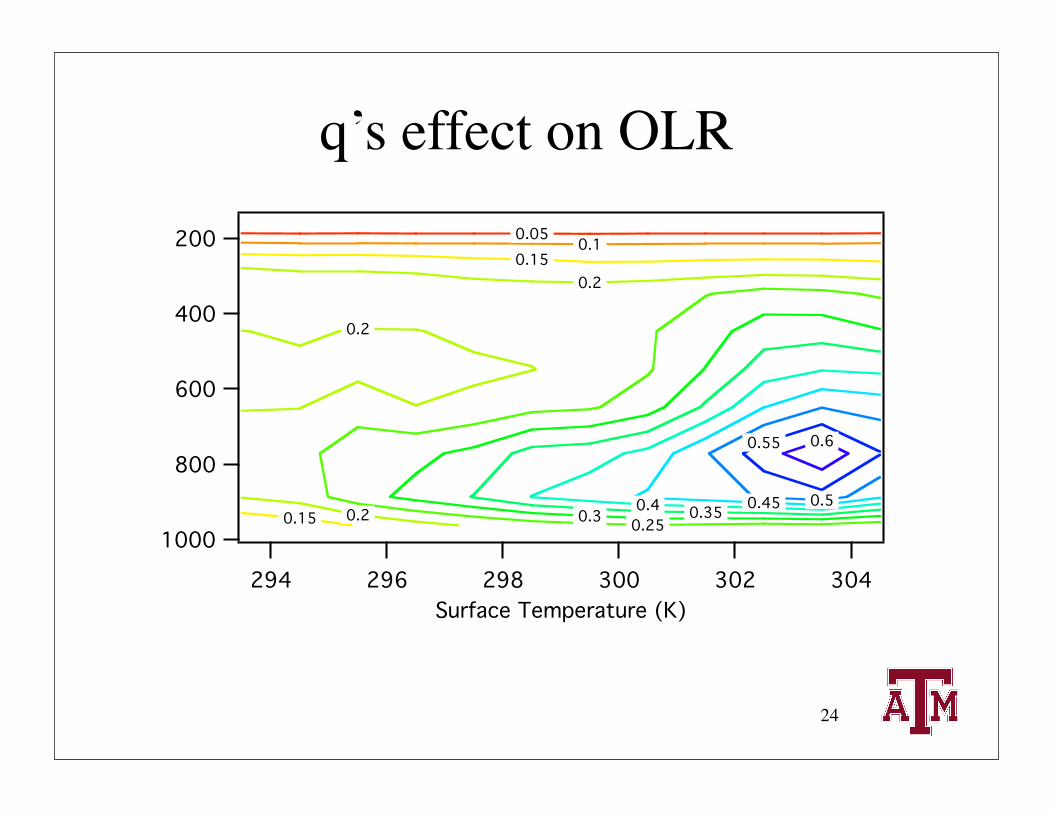
q’s effect on OLR
24
1000
800
600
400
200
304302300298296294Surface Temperature (K)
0.6 0.55
0.5 0.45 0.4 0.35 0.3 0.25
0.2
0.2
0.2
0.15
0.15
0.1 0.05

25
250
200
150
100
50
0
% p
er (g
/kg)
1.41.21.00.80.60.40.20.0H2O (g/kg)
346 hPa
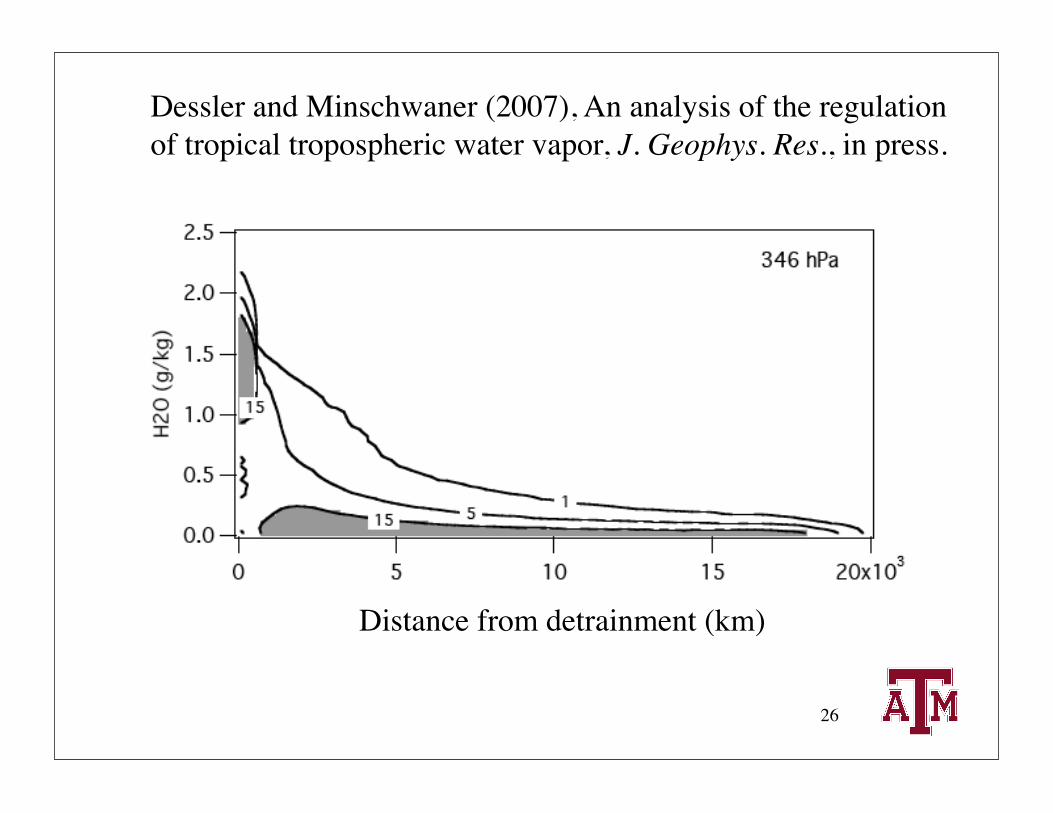
Dessler and Minschwaner (2007), An analysis of the regulation of tropical tropospheric water vapor, J. Geophys. Res., in press.
26
Distance from detrainment (km)
Dessler and Minschwaner (2007), An analysis of the regulation of tropical tropospheric water vapor, J. Geophys. Res., in press.
Conclusions• OLR calculated using AIRS measurements
agrees with CERES measurements within ~5 W/m^2– Agreement best in the deep tropics and worst in
the subtropics• We are also studying the mechanisms that
regulate clear-sky OLR• T and q are the most important factors
– T dominates below 298 K, q dominates above
27
This work was supported by a NASA EOS/IDS grant and by a NASA Aqua, Terra, ACRIM data analysis grant, both to Texas A&M


![Comparison of Anomalies and Trends of OLR as Observed ......AIRS Version 5 Zonal Mean Trends for September 2002 through August 2009 OLR [W/m 2 /yr] Global Mean=-0.12 National Aeronautics](https://static.fdocuments.in/doc/165x107/609fdaff7ebe190290188b5e/comparison-of-anomalies-and-trends-of-olr-as-observed-airs-version-5-zonal.jpg)