A Comparison Among Differently Enriched Rotifers (Brachionus Plicatilis) and Their Effect on...
17
A comparison among differently enriched rotifers (Brachionus plicatilis) and their effect on Atlantic cod (Gadus morhua) larvae early growth, survival and lipid composition A.S. GARCIA, C.C. PARRISH & J.A. BROWN Ocean Sciences Centre, Memorial University of Newfoundland, St John’s, NF, Canada Abstract We evaluated the effect of differently enriched rotifers on the early growth, survival and lipid composition of Atlantic cod larvae (Gadus morhua). The enrichments tested were: (i) Al- gaMac 2000 Ò ; (ii) AquaGrow Ò Advantage; and (iii) a com- bination of Pavlova sp. paste and AlgaMac 2000 Ò . Larvae from treatment 3 [1.50 ± 0.11 mg dry weight (dw) and 7.10 ± 0.14 dw specific growth rate (SGR)] were heavier (P ¼ 0.006) and grew faster (P ¼ 0.004) than larvae from treatment 2 (1.03 ± 0.04 mg dw and 6.29 ± 0.04 dw SGR). No significant differences were found in the final weight and SGR among larvae from treatment 1 (1.21 ± 0.07 mg dw and 6.58 ± 0.20 dw SGR) and larvae from treatments 2 and 3. The treatment 3 also resulted in the best survival at the end of the experimental period, estimated to be 3 on a scale from 1 to 5, whereas the survival estimates for the two other groups were 1–2. Larvae from the treatment 3 reached 37 days posthatch with levels of x6DPA 32-fold higher than newly hatched larvae. Differences in the larval enrichment of x6DPA may explain the differences in growth and survival of the Atlantic cod larvae. KEY WORDS KEY WORDS: Atlantic cod, enrichment, essential fatty acids, larviculture, rotifer, x6DPA Received 22 November 2006, accepted 10 April 2007 Correspondence: Alexandre Sachsida Garcia, Ocean Sciences Centre, Memorial University of Newfoundland, St John’s, NF, Canada A1C 5S7. E-mail: [email protected] Deceased September 4th 2005. Introduction Interest in the intensive production of Atlantic cod (Gadus morhua L.) in Canada began in the early 1990s, driven by a reduced supply from the wild fisheries and consequently, high market prices. In addition, there was a perceived need to develop alternate species to salmon culture, and Atlantic cod has been shown to be a suitable candidate. Since the first attempts to rear newly hatched larvae at the Aquaculture Research Development Facility (ARDF) at the Ocean Sci- ences Centre (OSC) in St John’s, NF, considerably progress has been achieved, but low survival rates through larviculture are still a challenge for the successful production of this species. The current production protocol used in New- foundland is based on use of rotifers (Brachionus plicatilis) as live-feed during the first feeding. Rotifers are well known for being poor in polyunsaturated fatty acids (PUFA). Their content of eicosapentaenoic acid (EPA, 20:5x3), docosa- hexaenoic acid (DHA, 22:6x3) and arachidonic acid (AA, 20:4x6)—considered essential fatty acids for marine fish— are normally low when compared to the levels found in copepods, the main food item in the natural diet of marine larvae (Sargent et al. 1999a; Bell et al. 2003). The nutritional aspects of rotifers have received increased attention in the past 15 years (Rainuzzo et al. 1989; Ferna´ndez-Reiriz et al. 1993; Rodrı´guez et al. 1996; Lubzens et al. 1997; Øie & Olsen 1997; Dhert et al. 2001; Ando & Kobayashi 2004; Palmtag et al. 2006) and several commercial products are now avail- able to enhance lipid, protein, and vitamin contents in rotifers (Coutteau & Sorgeloos 1997; Dhert et al. 2001; Sorgeloos et al. 2001; Harel et al. 2002). Nevertheless, only a few recent studies have compared and evaluated optimal rotifer enrichment procedures for Atlantic cod (O’Brien MacDonald et al. 2006; Park et al. 2006). Results from these studies suggest that during the rotifer phase, Atlantic cod larvae require a diet that can deliver not only high energy levels, but also phospholipids (PL), and particularly, a high DHA/EPA ratio. Other studies have shown that the enrich- ment of live-feed can affect survival rates, growth, pigmen- tation and stress resistance in marine finfish larvae Aquaculture Nutrition 2008 14; 14–30 .............................................................................................. doi: 10.1111/j.1365-2095.2007.00500.x .............................................................................................. Ó 2008 Blackwell Publishing Ltd 14
-
Upload
agatya-sara-a -
Category
Documents
-
view
223 -
download
4
Transcript of A Comparison Among Differently Enriched Rotifers (Brachionus Plicatilis) and Their Effect on...
A comparison among differently enriched rotifers (Brachionusplicatilis) and their effect on Atlantic cod (Gadus morhua)larvae early growth, survival and lipid composition
A.S. GARCIA, C.C. PARRISH & J.A. BROWN�
Ocean Sciences Centre, Memorial University of Newfoundland, St John’s, NF, Canada
Abstract
We evaluated the effect of differently enriched rotifers on the
early growth, survival and lipid composition of Atlantic cod
larvae (Gadus morhua). The enrichments tested were: (i) Al-
gaMac 2000�; (ii) AquaGrow� Advantage; and (iii) a com-
bination of Pavlova sp. paste and AlgaMac 2000�. Larvae
from treatment 3 [1.50 ± 0.11 mg dry weight (dw) and
7.10 ± 0.14 dw specific growth rate (SGR)] were heavier
(P ¼ 0.006) and grew faster (P ¼ 0.004) than larvae from
treatment 2 (1.03 ± 0.04 mg dw and 6.29 ± 0.04 dw SGR).
No significant differences were found in the final weight and
SGR among larvae from treatment 1 (1.21 ± 0.07 mg dw
and 6.58 ± 0.20 dw SGR) and larvae from treatments 2 and
3. The treatment 3 also resulted in the best survival at the end
of the experimental period, estimated to be 3 on a scale from
1 to 5, whereas the survival estimates for the two other
groups were 1–2. Larvae from the treatment 3 reached
37 days posthatch with levels of x6DPA 32-fold higher than
newly hatched larvae. Differences in the larval enrichment of
x6DPA may explain the differences in growth and survival
of the Atlantic cod larvae.
KEY WORDSKEY WORDS: Atlantic cod, enrichment, essential fatty acids,
larviculture, rotifer, x6DPA
Received 22 November 2006, accepted 10 April 2007
Correspondence: Alexandre Sachsida Garcia, Ocean Sciences Centre,
Memorial University of Newfoundland, St John’s, NF, Canada A1C 5S7.
E-mail: [email protected]
� Deceased September 4th 2005.
Introduction
Interest in the intensive production of Atlantic cod (Gadus
morhua L.) in Canada began in the early 1990s, driven by a
reduced supply from the wild fisheries and consequently, high
market prices. In addition, there was a perceived need to
develop alternate species to salmon culture, and Atlantic cod
has been shown to be a suitable candidate. Since the first
attempts to rear newly hatched larvae at the Aquaculture
Research Development Facility (ARDF) at the Ocean Sci-
ences Centre (OSC) in St John’s, NF, considerably progress
has been achieved, but low survival rates through larviculture
are still a challenge for the successful production of this
species. The current production protocol used in New-
foundland is based on use of rotifers (Brachionus plicatilis) as
live-feed during the first feeding. Rotifers are well known for
being poor in polyunsaturated fatty acids (PUFA). Their
content of eicosapentaenoic acid (EPA, 20:5x3), docosa-
hexaenoic acid (DHA, 22:6x3) and arachidonic acid (AA,
20:4x6)—considered essential fatty acids for marine fish—
are normally low when compared to the levels found in
copepods, the main food item in the natural diet of marine
larvae (Sargent et al. 1999a; Bell et al. 2003). The nutritional
aspects of rotifers have received increased attention in the
past 15 years (Rainuzzo et al. 1989; Fernandez-Reiriz et al.
1993; Rodrıguez et al. 1996; Lubzens et al. 1997; Øie & Olsen
1997; Dhert et al. 2001; Ando & Kobayashi 2004; Palmtag
et al. 2006) and several commercial products are now avail-
able to enhance lipid, protein, and vitamin contents in
rotifers (Coutteau & Sorgeloos 1997; Dhert et al. 2001;
Sorgeloos et al. 2001; Harel et al. 2002). Nevertheless, only a
few recent studies have compared and evaluated optimal
rotifer enrichment procedures for Atlantic cod (O’Brien
MacDonald et al. 2006; Park et al. 2006). Results from these
studies suggest that during the rotifer phase, Atlantic cod
larvae require a diet that can deliver not only high energy
levels, but also phospholipids (PL), and particularly, a high
DHA/EPA ratio. Other studies have shown that the enrich-
ment of live-feed can affect survival rates, growth, pigmen-
tation and stress resistance in marine finfish larvae
Aquaculture Nutrition 2008 14; 14–30. . . . . . . . . . . . . . . . . . . . . . . . . . . . . . . . . . . . . . . . . . . . . . . . . . . . . . . . . . . . . . . . . . . . . . . . . . . . . . . . . . . . . . . . . . . . . .
doi: 10.1111/j.1365-2095.2007.00500.x
. . . . . . . . . . . . . . . . . . . . . . . . . . . . . . . . . . . . . . . . . . . . . . . . . . . . . . . . . . . . . . . . . . . . . . . . . . . . . . . . . . . . . . . . . . . . . .
� 2008 Blackwell Publishing Ltd14

(Kanazawa 1997; Rodrıguez et al. 1997; Ishizaki et al. 2001;
Copeman et al. 2002; Koven et al. 2003).
Small-scale laboratory-based research produces valuable
information about the biology of new candidate species for
aquaculture production. However, this knowledge does not
always translate to success in the hatchery, because the
optimal culture conditions required for large-scale commer-
cial production often do not reflect the conditions observed
in the laboratory. To avoid this problem, the objective of the
present study was to evaluate the effects of commercial
products used for the enrichment of rotifers on the growth,
survival and lipid composition of Atlantic cod larvae reared
in a hatchery under mass production conditions.
Materials and methods
Rotifer culture
Rotifers (B. plicatilis L-strain) were cultured in 3000 L (L)
rectangular tanks on a combination of baker’s yeast
(0.5 g million)1, four times a day), live Nannochloropsis sp.
(20 L at 2–3 · 106 cells mL)1, once a day) and Nannochlor-
opsis sp. paste (10 g at 68 · 109 cells mL)1, once a day), on a
5-day cycle. From day 1 to day 3, Culture Selco� (Inve
Americas, Salt Lake City, UT, USA) was added to the cul-
ture tank (33.3 g day)1) as supplemental food. The culture
started with a volume of 900 L, a salinity of 15 g L)1 and a
density of 17 · 104 rotifers L)1; and progressively increased
in volume (final volume of 3000 L) and salinity (final salinity
25 g L)1). The final density of the culture was 13 · 104 rot-
ifers L)1. The initial temperature was 25 �C, which progres-
sively decreased to 21 �C over the 5 days of culture.
Population and egg counts were performed daily on a num-
ber per millilitre basis. After 5 days, rotifers were removed
from the tank, washed, concentrated and placed in 300-L
conical tanks for enrichment.
Rotifer enrichments
Rotifers were enriched in 300-L conical tanks at a density of
4 · 105 rotifers L)1, at 22 �C for a period of 24 h. The
enrichment products tested were: (i) AlgaMac 2000�
(Aquafauna Bio-Marine Inc., Hawthorne, CA, USA);
(ii) AquaGrow� Advantage (Advanced BioNutrition Corp.,
Columbia, MD, USA); and (iii) Instant Algae�1 (Pavlova sp.
paste) (Reed Mariculture, Campbell, CA, USA).
Enrichments were added to the rotifer tanks twice at 9:00
am and 5:00 pm, with the amounts added each time as fol-
lows: Rotifer batches for treatment 1 were enriched with
0.3 g of AlgaMac 2000 per 1 · 106 rotifers. Rotifer batches
for treatment 2 were enriched with 0.1 g of AquaGrow
Advantage per 1 · 106 rotifers. Two enrichment procedures
were used for treatment 3. In the first one, rotifers batches
were enriched with 8 mL of Pavlova sp. paste per
15 · 106rotifers (larvae morning feeding) and in the second,
rotifer batches were enriched with a combination of 8 mL of
Pavlova sp. paste and 2.25 g of AlgaMac 2000 per 15 · 106
rotifers (larvae afternoon feeding). After the enriched rotifers
were harvested, about half was supplied directly to the larvae
for the morning feeding. The remainder was set aside in
buckets containing 10 L of cold seawater and ice packs to
minimize nutritional loss until the afternoon feeding.
Larval rearing
Newly hatched cod larvae were stocked in 3000-L tanks at a
density of 50 larvae L)1 (two replicates per treatment), and
reared up to 37 days posthatch (dph), which is equivalent
to 443.2 degree-days (dd), on rotifers enriched differently.
Water management and feeding schemes followed previous
protocols outlined in Brown et al. (2003). Water temperature
ranged from 11 to 13 �C over the course of the experiment.
Lighting above the tanks was set at approximately 2000 Lux
on a 24 h photoperiod. Three different treatments were tested
using commercially available products as a single enrichment
or in combination with algae paste. The treatments tested
were: (i) AlgaMac 2000; (ii) AquaGrow Advantage; and (iii)
Pavlova sp. paste combined with AlgaMac 2000.
Larvae were fed twice a day, between 9:00 and 10:00 am,
and 4:00 and 5:00 pm. Larvae from treatment 3 were fed with
rotifers enriched with Pavlova sp. paste during the morning
and rotifers enriched with Pavlova sp. paste + AlgaMac
2000 during the afternoon. Enriched rotifers were supplied to
the larvae from 1 to 37 dph (11–443 dd) at a density of
4000 L)1.
To maintain the desired prey concentration within each
experimental tank, before each feeding, three 10 mL water
aliquots were sampled from each tank. The number of prey
in each sample was counted and the average number was
used to adjust prey concentrations as needed.
Sampling, growth and survival measurements
Pooled samples of larvae were collected at 1, 15, 30
and 37 dph (equivalent to 11, 172.3, 356.3 and 443.2 dd
1 The commercial name Instant Algae� refers to several algae species
and/or a mixture of different species, and for this reason, will be
replaced by Pavlova sp. in this paper.
A comparison among differently enriched rotifers and their effect
. . . . . . . . . . . . . . . . . . . . . . . . . . . . . . . . . . . . . . . . . . . . . . . . . . . . . . . . . . . . . . . . . . . . . . . . . . . . . . . . . . . . . . . . . . . . . .
� 2008 Blackwell Publishing Ltd Aquaculture Nutrition 14; 14–30
15

respectively) for lipid analysis (total lipids, lipid classes and
fatty acid composition). Samples of the experimental
enrichments, algae paste and enriched live-feed were collected
in triplicate for lipid analysis. Immediately before the after-
noon feeding, samples of AlgaMac 2000-enriched rotifers
and AquaGrow Advantage-enriched rotifers were collected
in triplicate for lipid analysis.
Pooled samples of larvae were collected at 1, 7, 15, 21, 30
and 37 dph (equivalent to 11, 79.8, 172.3, 243.2, 356.3 and
443.2 dd respectively) for dry weight measurements (three
replicates tank)1). Between 30 (1 dph) and 10 (37 dph) larvae
were collected on preweighed glass microfibre filters (24 mm
Ø) and rinsed with 30g L)1 ammonium formate to remove
salt. Each filter was placed on 1.5 cm2 aluminum foil and
dried at 60 �C for 48 h. Filters were then stored in a desic-
cator and re-weighed using a microbalance (UMT2, Mettler
Toledo, Switzerland). Data for standard length were ob-
tained by measuring 10 larvae per tank (20 per treatment)
with a stereomicroscope and a calibrated eyepiece microme-
tre. Growth was then calculated as specific growth rate for
dry weight [SGR; % day)1 ¼ (ln (final dry weight) ) ln
(initial dry weight)/days) · 100] and for standard length
[SGR; % day)1 ¼ (ln (final standard length))ln (initial
standard length)/days) · 100]. Unfortunately, standard
length samples from 37 dph were not available and for this
reason, SGR for standard length was calculated using data
from 32 dph (382.4 dd).
Survival measurements were based on visual observations
to reduce the stress that would be caused by handling and
counting. Therefore, a nominal scale (0–5) was used to
measure the weekly survival rates. The scale used considered
0 as total mortality (or 0% survival), 1 as poor survival, 2 as
reasonable survival, 3 as good survival, 4 as very good sur-
vival and 5 as total survival (or 100% survival). Under the
circumstances in which the present experiment was per-
formed, between 30% and 40% of survival at the end of the
rotifer phase was considered a good survival rate for Atlantic
cod larvae. Once a week, individual tanks were scored three
times with a 3-h interval among recordings. Average weekly
values were used for each treatment.
The larvae were not counted at the end of the experiment
because a subsequent study was carried out to evaluate the
effect of differently lipid-enriched Artemia sp. on the growth
and lipid composition of Atlantic cod larvae.
Lipid analysis
Lipid samples were placed in 15-mL vials, covered with
chloroform and stored under nitrogen at )20 �C until
extraction. Lipids were extracted in chloroform/methanol
according to Parrish (1998) using a modified Folch procedure
(Folch et al. 1957). Lipid classes were determined using thin
layer chromatography with flame ionization detection (TLC/
FID) with a MARK V Iatroscan (Iatron Laboratories, To-
kyo, Japan) as described by Parrish (1987). Extracts were
spotted on silica gel coated Chromarods and a three-stage
development system was used to separate lipid classes. The
first separation consisted of a 25-min and 20-min develop-
ments in 99 : 1 : 0.05 hexane/diethyl ether/formic acid. The
second separation consisted of a 40-min development in
80 : 20 : 1 hexane/diethyl ether/formic acid. The last separ-
ation consisted of two 15-min developments in 100% acetone
followed by two 10-min developments in 5 : 4 : 1 chloro-
form/methanol/water. After each separation, the rods were
scanned and three chromatograms were combined using
T-data scan software (RSS, Bemis, TN, USA). The signal
detected in millivolts was quantified using lipid standards
(Sigma-Aldrich Corp., Oakville, ON, Canada).
Total lipids were analysed for fatty acid composition. Fatty
acid methyl esters (FAME) were prepared by transesterifi-
cation with 10% BF3 in methanol at 85 �C for 1 h 30 min
(Morrison & Smith 1964; Budge & Parrish 2003). The effi-
ciency of this method for esterification of the fatty acids
present in acyl lipid classes was determined to be >90%. A
Varian model 3400 GC equipped with a Varian 8100 auto-
sampler was used for fatty acid analysis (Varian, CA, USA).
The column was an Omegawax 320 column, 30 m, 0.32 mm
internal diameter, 0.25 lm film thickness (Supelco, Belle-
fonte, PA, USA). Hydrogen was used as the carrier gas and
the flow rate was 2 mL min)1. The column temperature
profile was: 65 �C for 0.5 min, hold at 195 �C for 15 min after
increasing at 40 �C min)1 and hold at 220 �C for 0.75 min
after increasing at 2 �C min)1. The injector temperature
increased from 150 to 250 �C at 200 �C min)1. Peaks were
detected by flame ionization with the detector held at 260 �C.Fatty acid peaks were integrated using Varian Star Chro-
matography Software (Varian Canada Inc., Mississauga,
ON, Canada) (version 5.50) and identification was made
with reference to known standards (PUFA 1, PUFA 3,
BAME and 37 Component FAME Mix, Supleco Canada,
ON). Odd and branched fatty acids (OBFA) were measured
as indicators of bacterial load in rotifers and cod larvae.
Statistical analysis
Differences in growth between treatments were analysed using
an ANCOVAANCOVA (analysis of covariance). The experimental varia-
bles used for the ANCOVAANCOVA analysis were treatment, replicate
A. S. Garcia et al.
. . . . . . . . . . . . . . . . . . . . . . . . . . . . . . . . . . . . . . . . . . . . . . . . . . . . . . . . . . . . . . . . . . . . . . . . . . . . . . . . . . . . . . . . . . . . . .
� 2008 Blackwell Publishing Ltd Aquaculture Nutrition 14; 14–30
16

(tank), time and the interaction between time and treatment.
The General Linear Model (Minitab Version 13.1) (Minitab
Inc., State College, PA, USA) was employed and in all cases,
the effect of tanks was not significant. Data from different
replicates from the same treatment were pooled. Lipid classes
and fatty acid composition were analysed using one-way
ANOVAANOVAs with Tukey’s multiple comparison test to compare
differences (StatView�; SAS Institute, Cary, NC, USA). All
data were tested for normality, homogeneity and independ-
ence to satisfy the assumptions of ANCOVAANCOVA and ANOVAANOVA. When
necessary, randomization was employed to recompute new
P-values. The randomization method employed, generated a
new frequency distribution of F-ratios based on repeated
random sampling of the response variable, using a thousand
runs. The observedF-ratiowas compared to the new frequency
distribution of F-ratios to calculate the new probability level.
The new probability was calculated based on the proportion of
the new frequency distribution ofF-ratios that is more extreme
than the observed F-ratio (two tail test). Linear regression was
used to describe the relationship between larval dry weight
and the concentration of selected fatty acids per individual
larva. Significance was set at a ¼ 0.05 for all analyses.
Results
Total lipid, lipid class and fatty acid composition of
the enrichments tested
Among the enrichments tested, AlgaMac 2000 had the
highest total lipid concentration (204.3 ± 3.4 mg g)1 dw),
4.3-fold higher than the Pavlova sp. paste and 1.2-fold higher
than AquaGrow Advantage (F2,6 ¼ 255.3, P < 0.0001)
(Table 1). AlgaMac 2000 also had a twofold higher triacyl-
glycerol (TAG) percentage than the Pavlova sp. paste, while
AquaGrow Advantage was slightly, but significantly lower in
TAG than AlgaMac 2000 (F2,6 ¼ 230.3, P < 0.0001). On the
other hand, the PL percentage in the Pavlova sp. paste was
4.7-fold higher than in AlgaMac 2000, and 1.9-fold higher
than in AquaGrow Advantage (F2,6 ¼ 71.7, P < 0.0001). In
AquaGrow Advantage, the sterol (ST) percentage was
6.6-fold higher than in AlgaMac 2000, and fivefold higher
than in the Pavlova sp. paste (F2,6 ¼ 292.7, P < 0.0001).
AlgaMac 2000 had the highest sum of saturated fatty acids
(RSFA) and the lowest sum of polyunsaturated fatty acids
(RPUFA) among the products tested (F2,6 ¼ 209.7,
P < 0.0001 and F2,6 ¼ 24.85, P < 0.0012 respectively).
AlgaMac 2000 and Pavlova sp. paste had similar percentages
of AA (0.7 ± 0.0% and 0.6 ± 0.3% total fatty acids
respectively), while in AquaGrow Advantage this fatty acid
was not detected (F2,6 ¼ 6.23, P ¼ 0.034). In AquaGrow
Advantage, the DHA percentage (47.4 ± 0.2% total fatty
acids) was approximately twofold higher than in the other
enrichments (F2,6 ¼ 446.7, P < 0.0001). In the Pavlova sp.
paste, the EPA percentage (1.4 ± 0.1% total fatty acids) was
4.6-fold higher than in AquaGrow Advantage, and 1.5-fold
higher than in AlgaMac 2000 (F2,6 ¼ 341.7, P < 0.0001). In
AlgaMac 2000, the x6DPA percentage (8.2 ± 0.1% total
fatty acids) was 2.7-fold higher than in the Pavlova sp. paste,
while in AquaGrow Advantage this fatty acid was not
detected (F2,6 ¼ 989.4, P < 0.0001).
In AquaGrow Advantage the sum of fatty acids form the
x3 family (Rx3) was 1.7-fold higher than in AlgaMac 2000
and 1.2-fold higher than in the Pavlova sp. paste (F2,6 ¼121.4, P < 0.0001). This enrichment also had a DHA/EPA
ratio (156.7 ± 2.0) 9.3-fold higher than the Pavlova sp.
paste, and 5.2-fold higher than AlgaMac 2000 (F2,6 ¼2458.5,P < 0.0001).
Total lipid, lipid class and fatty acid composition of
rotifers
Only rotifers from the AlgaMac 2000 treatment had higher
total lipid concentrations than unenriched rotifers (F4,9 ¼36.88, P < 0.0001) (Table 2). Rotifers enriched with Alga-
Mac 2000 had a TAG percentage (35.4 ± 6.4% total lipids)
similar to rotifers enriched with AquaGrow Advantage
(29.2 ± 0.1% total lipids) and to rotifers enriched with
the combination of Pavlova sp. paste + AlgaMac 2000
(26.6 ± 4.6% total lipids). However, the TAG percentage in
rotifers enriched with AlgaMac 2000 was 3.4-fold higher than
in rotifers enriched with the Pavlova sp. paste and 2.3-fold
higher than in unenriched rotifers (F4,10 ¼ 7.35, P ¼ 0.005).
Rotifers enriched with AquaGrow Advantage had the ST
percentage (7.3 ± 1.3% total lipids), higher than rotifers
enriched with AlgaMac 2000 (1.6 ± 0.0%) and rotifers
enriched with Pavlova sp. paste + AlgaMac 2000 (1.8 ±
0.5%) (F4,10 ¼ 5.36, P ¼ 0.014). The PL percentage
decreased significantly in the AlgaMac 2000 and Pavlova
sp. + AlgaMac 2000 treatments, when compared to unen-
riched rotifers (F4,10 ¼ 27.59, P < 0.0001). However when
the absolute values are considered, there were no significant
differences between unenriched rotifers and any of the
enriched rotifers, with PL concentrations ranging from
8.3 ± 0.4 mg g)1 dry weight (dw) in rotifers enriched with
Pavlova sp. paste + AlgaMac 2000 to 9.4 ± 0.7 mg g)1 dw
in rotifers enriched with Pavlova sp. paste.
In rotifers enriched with AlgaMac 2000, and rotifers
enriched with Pavlova sp. paste + AlgaMac 2000 the
A comparison among differently enriched rotifers and their effect
. . . . . . . . . . . . . . . . . . . . . . . . . . . . . . . . . . . . . . . . . . . . . . . . . . . . . . . . . . . . . . . . . . . . . . . . . . . . . . . . . . . . . . . . . . . . . .
� 2008 Blackwell Publishing Ltd Aquaculture Nutrition 14; 14–30
17

percentage of palmitic acid (16:0) was virtually the same
(23.8 ± 0.6% and 23.9 ± 1.1% total fatty acids respect-
ively: Table 3). In these two groups of rotifers, the percent-
ages of 16:0 were 3.5-fold higher than in unenriched rotifers,
2.5-fold higher than in rotifers enriched with Pavlova sp.
paste and 2.0-fold higher than in rotifers enriched with
AquaGrow Advantage (F4,10 ¼ 144.31, P < 0.0001).
Consequently, in rotifers enriched with AlgaMac 2000 and
rotifers enriched with Pavlova sp. paste + AlgaMac 2000 the
RSFA was approximately 2.4-fold higher than in unenriched
rotifers and 1.8-fold higher than in rotifers enriched with
AquaGrow Advantage and rotifers enriched with Pavlova sp.
paste (F4,10 ¼ 109.70, P < 0.0001). AlgaMac 2000 was the
only treatment that did not cause the percentage of AA in
Table 1 Total lipid, lipid class and fatty
acid composition of the enrichments
tested
Enrichments
AlgaMac
2000�AquaGrow�
Advantage
Pavlova sp.
paste
Total lipid (mg g)1 dw) 204.3 ± 3.4a 168.7 ± 8.1b 47.5 ± 3.0c
Lipid class (% total lipids)
Hydrocarbons 0.1 ± 0.0c 1.0 ± 0.1b 0.4 ± 0.0a
Steryl esters/wax esters 3.6 ± 0.1a 0.0 ± 0.0b 0.0 ± 0.0b
Ketones 6.4 ± 0.5a 3.7 ± 0.3b 0.5 ± 0.1c
Triacylglycerols 70.2 ± 0.8a 64.5 ± 2.0b 34.4 ± 0.1c
Free fatty acids 1.2 ± 0.2b 2.9 ± 0.1b 13.2 ± 1.7a
Alcohols 3.5 ± 0.4a 1.1 ± 0.1b 1.9 ± 0.1b
Sterols 0.6 ± 0.1b 4.0 ± 0.2a 0.8 ± 0.1b
Acetone mobile polar lipids 7.0 ± 0.8c 9.3 ± 0.3b 23.2 ± 0.5a
Phospholipids 5.4 ± 0.7c 13.5 ± 0.8b 25.5 ± 2.1a
Fatty acids (% total fatty acids)
14:0 17.5 ± 0.1a 17.3 ± 0.1a 9.9 ± 1.1b
16:0 36.2 ± 0.0a 17.3 ± 0.3b 10.5 ± 1.5c
18:0 0.9 ± 0.0a 0.6 ± 0.0b 0.3 ± 0.1c
21:0 0.0 ± 0.0b 0.0 ± 0.0b 2.0 ± 0.4a
RSFA1 56.0 ± 0.2a 37.5 ± 0.5b 25.5 ± 1.8c
16:1x7 3.9 ± 0.1c 1.7 ± 0.0b 5.6 ± 0.2a
18:1x9 0.0 ± 0.0c 8.7 ± 0.1b 13.6 ± 0.6a
18:1x7 2.1 ± 0.0a 0.0 ± 0.0c 1.3 ± 0.1b
RMUFA2 6.4 ± 0.1b 11.8 ± 0.4c 24.4 ± 0.9a
18:2x6 0.0 ± 0.0c 6.0 ± 0.1a 3.2 ± 0.1b
18:3x3 0.0 ± 0.0b 0.0 ± 0.0b 1.9 ± 0.0a
18:4x3 0.2 ± 0.5b 0.1 ± 0.0b 5.5 ± 0.1a
18:5x3 0.0 ± 0.0b 0.0 ± 0.0b 6.7 ± 0.1a
20:3x6 0.2 ± 0.0b 0.0 ± 0.0b 1.2 ± 0.2a
20:4x6 (AA) 0.7 ± 0.0a 0.0 ± 0.0b 0.6 ± 0.3a
20:4x3 0.5 ± 0.1a 0.0 ± 0.0b 0.3 ± 0.1a
20:5x3 (EPA) 0.9 ± 0.0c 0.3 ± 0.0b 1.4 ± 0.1a
22:5x6 (x6DPA) 8.2 ± 0.1a 0.0 ± 0.0c 3.0 ± 0.2b
22:5x3 0.2 ± 0.1a 0.6 ± 0.0a 0.5 ± 0.1a
22:6x3 (DHA) 26.2 ± 0.4b 47.4 ± 0.2a 23.0 ± 1.0c
RPUFA3 37.7 ± 0.2b 51.2 ± 0.8a 50.0 ± 2.5a
Rx3 28.4 ± 0.1c 48.7 ± 0.5a 39.7 ± 1.7b
Rx6 9.2 ± 0.2a 6.4 ± 0.2b 9.2 ± 1.0a
x3/x6 3.1 ± 0.0b 7.6 ± 0.2a 4.5 ± 0.3c
DHA/EPA 30.0 ± 1.6b 156.7 ± 2.0a 16.8 ± 0.6c
EPA/AA 1.3 ± 0.1a 0.0 ± 0.0b 3.0 ± 0.8a
AA, arachidonic acid; EPA, eicosapentaenoic acid; DHA, docosahexaenoic acid.
Values (mean ± SE of three replicates) in the same row not sharing a superscript are significantly
different (P < 0.05).1 Sum of saturated fatty acids, which also includes: i15:0, 15:0, ai16:0, i17:0, ai17:0, 20:0, 22:0 and
23:0 at £0.68% each.2 Sum of monounsaturated fatty acids, which also includes: 14:1, 15:1, 16:1x9, 16:1x5, 17:1,
20:1x11, 22:1x11, 22:1x9 and 24:1 at £1.98% each.3 Sum of polyunsaturated fatty acids, which also includes: 16:2x4, 16:3x4, 16:4x3, 16:4x1,
18:2x4, 18:3x6, 18:4x1, 20:2a, 20:2x6, 20:3x3, 21:5x3 and 22:4x6 at £1.16% each.
A. S. Garcia et al.
. . . . . . . . . . . . . . . . . . . . . . . . . . . . . . . . . . . . . . . . . . . . . . . . . . . . . . . . . . . . . . . . . . . . . . . . . . . . . . . . . . . . . . . . . . . . . .
� 2008 Blackwell Publishing Ltd Aquaculture Nutrition 14; 14–30
18

rotifers to decrease after enrichment. In rotifers enriched with
AlgaMac 2000, the percentage of EPA (1.2 ± 0.1% total
fatty acids) was fourfold higher than in unenriched rotifers,
threefold higher than in rotifers enriched with Pavlova sp.
paste + AlgaMac 2000, 1.5-fold higher than in rotifers en-
riched with AquaGrow Advantage and 1.3-fold higher than
in rotifers enriched with Pavlova sp. paste (F4,10 ¼ 33.80,
P < 0.0001). Additionally, the percentage of x6DPA in
rotifers enriched with AlgaMac 2000 (4.9 ± 0.4% total fatty
acids) was also significantly higher than in the other treat-
ments (F4,10 ¼ 51.65, P < 0.0001). In contrast, rotifers en-
riched with AquaGrow Advantage had a DHA percentage
(18.9 ± 0.8% total fatty acids) 95-fold higher than un-
enriched rotifers, 38-fold higher than rotifers enriched with
Pavlova sp. paste, 6.7-fold higher than rotifers enriched with
Pavlova sp. paste + AlgaMac and 1.3-fold higher than rot-
ifers enriched with AquaGrow Advantage (F4,10 ¼ 266.71,
P < 0.0001). Rotifers enriched with AquaGrow Advantage
had the highest DHA/EPA (25.0 ± 0.9), 42-fold higher than
unenriched rotifers and rotifers enriched with Pavlova sp.
paste, 2.8-fold higher than rotifers enriched with Pavlova sp.
paste + AlgaMac 2000 and 2.0-fold higher than rotifers
enriched with AlgaMac 2000 (F4,10 ¼ 342.32, P < 0.0001).
The EPA/AA ratio in rotifers enriched with AquaGrow
Advantage (3.3 ± 0.2) was also significantly higher than in
rotifers from the other treatments, 11-fold higher than in
unenriched rotifers, 2.7-fold higher than in rotifers enriched
with AlgaMac 2000 and approximately 2.0-fold higher than
in rotifers enriched with Pavlova sp. paste and enriched with
Pavlova sp. paste + AlgaMac 2000 (F4,10 ¼ 28.71,
P < 0.0001). Rotifers enriched with AlgaMac 2000 and
Pavlova sp. paste + AlgaMac 2000 had x6DPA/AA ratio
higher than the other treatments (F4,10 ¼ 13.72, P ¼ 0.0005).
Rotifers enriched with AlgaMac 2000 and rotifers enriched
with Pavlova sp. paste + AlgaMac 2000 had sum of bac-
terial fatty acids (sum of odd and/or branched fatty acids,
ROBFA) significantly lower than unenriched rotifers and
rotifers enriched with Pavlova sp. paste, on average 1.9-fold
lower than the former and 1.8-fold lower than the latter
(F4,10 ¼7.72, P ¼ 0.0042).
The rotifers enriched with AlgaMac 2000 and AquaGrow
Advantage supplied in the afternoon feeding did not differ
significantly from their respective morning groups in any of
the major lipid variables (P > 0.05 for all analysis).
Larval survival
The combination of Pavlova sp. paste and AlgaMac 2000
resulted in the best survival during the experimental period.
At 37 dph, the survival in this treatment was estimated to be
3 on a scale from 0 to 5, whereas the survival estimated for
the AlgaMac 2000 treatment was 2, and for the AquaGrow
Advantage it was 1 (Fig. 1).
Larval growth
During the three first weeks of larviculture, the larval
growth was not affected by the different treatments. After
243.2 dd (21 dph), differences in the growth curve produced
by the different treatments became noticeable, but these
differences were significant only at the end of the experi-
ment (Fig. 2a,b). At the end of the experiment, larvae
from the Pavlova sp. + AlgaMac 2000 treatment
(1.50 ± 0.11 mg dw) were significantly heavier than larvae
from the AquaGrow Advantage treatment (1.03 ± 0.04 dw)
(F1,1 ¼ 8.32, P ¼ 0.006). No significant differences were
found in larval dry weight between the AlgaMac 2000
treatment (1.21 ± 0.07 dw) and the Pavlova sp. + AlgaMac
Table 2 Total lipid (mg g)1 dry weight) and percentage lipid class composition of rotifers before and after experimental enrichments
Treatments
Unenriched AlgaMac 2000�AquaGrow�
Advantage Pavlova sp.
Pavlova sp. +
AlgaMac 2000�
Total lipid (mg g)1 dw) 17.4 ± 0.1b 50.6 ± 6.4a 19.7 ± 1.3b 21.3 ± 1.0b 25.5 ± 0.1b
Lipid class1 (% total lipids)
Hydrocarbons 0.2 ± 0.0b 0.3 ± 0.1b 1.3 ± 0.2a 1.0 ± 0.3ab 1.1 ± 0.4a
Steryl esters/wax esters 0.0 ± 0.0c 6.3 ± 0.2a 0.0 ± 0.0c 1.2 ± 0.1b 0.0 ± 0.0c
Ketones 17.3 ± 0.5a 4.0 ± 0.2b 2.1 ± 0.4c 11.0 ± 3.4b 0.0 ± 0.0d
Triacylglycerols 15.2 ± 2.5b 35.4 ± 6.4a 29.2 ± 0.1a 10.5 ± 1.8b 26.6 ± 4.6ab
Free fatty acids 4.5 ± 0.2b 3.9 ± 0.9b 4.7 ± 1.3b 7.8 ± 0.7ab 11.2 ± 2.1a
Sterols 5.6 ± 0.7ab 1.6 ± 0.0b 7.3 ± 1.3a 4.9 ± 1.5ab 1.8 ± 0.5b
Acetone mobile polar lipids 7.9 ± 1.7c 30.7 ± 1.5a 10.6 ± 3.3bc 19.2 ± 2.2bc 26.4 ± 6.2ab
Phospholipids 50.2 ± 3.9a 17.9 ± 0.9c 44.1 ± 3.0a 44.2 ± 2.0a 32.8 ± 1.1b
Values (mean ± SE of three replicates) in the same row not sharing a superscript are significantly different (P < 0.05).
A comparison among differently enriched rotifers and their effect
. . . . . . . . . . . . . . . . . . . . . . . . . . . . . . . . . . . . . . . . . . . . . . . . . . . . . . . . . . . . . . . . . . . . . . . . . . . . . . . . . . . . . . . . . . . . . .
� 2008 Blackwell Publishing Ltd Aquaculture Nutrition 14; 14–30
19

2000 and AquaGrow Advantage treatments. At 32 dph
(382.4 dd), larvae from the AquaGrow Advantage treat-
ment had 9.60 ± 0.22 mm of standard length, and were
significantly shorter than the larvae from the AlgaMac
2000 treatment (10.23 ± 0.18 mm) and the Pavlova sp. +
AlgaMac 2000 treatment (10.23 ± 0.15 mm) (F2,57 ¼ 3.66,
P ¼ 0.031).
Larvae from the Pavlova sp. + AlgaMac 2000 treatment
showed a dry weight SGR (7.10 ± 0.14) significantly
higher than larvae from the AquaGrow Advantage
treatment (6.29 ± 0.04) (F2,15 ¼ 7.79, P ¼ 0.004).
There were no significant differences between the dry
weight SGR of larvae from the AlgaMac 2000 treatment
(6.58 ± 0.20) and larvae from the other treatments
(Table 4). Larvae from the AquaGrow Advantage treat-
ment showed a standard length SGR (2.53 ± 0.07) signi-
ficantly lower than larvae from the AlgaMac 2000
treatment (2.73 ± 0.05) and larvae from the Pavlova
sp. + AlgaMac 2000 treatment (2.74 ± 0.04) (F2,57 ¼ 3.79,
P ¼ 0.02).
Table 3 Percentage fatty acid composi-
tion of rotifers before and after experi-
mental enrichments
Treatments
Unenriched AlgaMac 2000�AquaGrow�
Advantage Pavlova sp.
Pavlova sp. +
AlgaMac 2000�
Fatty acids (% total fatty acids)
14:0 1.7 ± 0.1c 10.5 ± 0.3a 4.5 ± 0.5b 3.0 ± 0.1c 11.7 ± 0.6a
16:0 6.8 ± 0.2c 23.8 ± 0.6a 11.8 ± 0.8b 9.4 ± 0.3c 23.9 ± 1.1a
17:0 0.6 ± 0.0ab 0.4 ± 0.0c 0.5 ± 0.0bc 0.8 ± 0.1a 0.5 ± 0.1abc
18:0 3.5 ± 0.2a 3.3 ± 0.2a 3.6 ± 0.4a 4.4 ± 0.4a 3.3 ± 0.3a
RSFA1 17.3 ± 0.8c 40.8 ± 0.7a 24.5 ± 1.1b 22.8 ± 0.4b 43.2 ± 1.9a
16:1x7 22.4 ± 0.0a 11.1 ± 0.2d 13.2 ± 1.1d 19.3 ± 0.3b 15.7 ± 0.7c
18:1x11 3.0 ± 0.1ab 1.8 ± 0.1b 2.9 ± 0.3ab 4.0 ± 0.3a 2.4 ± 0.4b
18:1x9 23.2 ± 0.3a 8.2 ± 0.0d 6.1 ± 0.5e 20.3 ± 0.7b 13.8 ± 0.7c
18:1x7 7.4 ± 0.3ab 6.3 ± 0.2b 3.1 ± 0.3b 9.1 ± 0.9a 6.5 ± 0.2b
20:1x9 3.8 ± 0.1ab 2.0 ± 0.1c 3.1 ± 0.3b 4.0 ± 0.3a 2.4 ± 0.2c
RMUFA2 70.0 ± 1.0a 33.7 ± 0.0d 48.4 ± 1.8b 66.0 ± 0.6a 46.6 ± 1.4c
18:2x6 6.4 ± 0.9a 1.4 ± 0.0c 2.2 ± 0.2bc 3.7 ± 0.4b 1.4 ± 0.2c
18:3x3 0.3 ± 0.0b 0.1 ± 0.0b 0.2 ± 0.0b 0.6 ± 0.1a 0.3 ± 0.1ab
20:3x6 0.7 ± 0.2a 0.2 ± 0.1bc 0.2 ± 0.0bc 0.6 ± 0.1ab 0.1 ± 0.1c
20:4x6 (AA) 0.8 ± 0.4a 1.0 ± 0.0a 0.2 ± 0.0b 0.5 ± 0.0b 0.3 ± 0.1b
20:4x3 0.0 ± 0.0c 0.3 ± 0.0a 0.0 ± 0.0c 0.2 ± 0.0b 0.2 ± 0.0b
20:5x3 (EPA) 0.3 ± 0.0c 1.2 ± 0.1a 0.8 ± 0.0b 0.9 ± 0.0b 0.4 ± 0.1c
22:5x6 (x6DPA) 0.1 ± 0.0c 4.9 ± 0.4a 0.0 ± 0.0c 0.2 ± 0.0c 2.0 ± 0.5b
22:5x3 0.0 ± 0.0b 0.4 ± 0.1a 0.3 ± 0.0a 0.0 ± 0.0b 0.0 ± 0.0b
22:6x3 (DHA) 0.2 ± 0.0d 14.7 ± 0.8b 18.9 ± 0.8a 0.5 ± 0.0cd 2.8 ± 0.4c
RPUFA3 13.6 ± 0.3b 25.3 ± 1.5a 26.9 ± 2.8a 10.9 ± 0.7b 9.7 ± 1.4b
ROBFA4 7.2 ± 0.6a 3.4 ± 0.8b 5.0 ± 0.3ab 6.9 ± 0.6a 4.0 ± 0.6b
Rx3 2.1 ± 0.1c 17.0 ± 0.9b 21.3 ± 1.6a 4.0 ± 0.3c 5.0 ± 0.5c
Rx6 9.0 ± 0.4a 7.6 ± 0.5a 3.0 ± 0.4c 5.3 ± 0.4b 3.0 ± 0.4c
x3/x6 0.2 ± 0.0c 2.2 ± 0.0b 7.4 ± 0.9a 0.8 ± 0.1c 1.7 ± 0.1b
DHA/EPA 0.6 ± 0.0d 12.4 ± 0.6b 25.0 ± 0.9a 0.6 ± 0.1d 8.9 ± 0.6c
EPA/AA 0.3 ± 0.0c 1.2 ± 0.1bc 3.3 ± 0.2a 1.6 ± 0.1b 1.8 ± 0.4b
DHA + x6DPA 0.2 ± 0.0b 19.5 ± 0.7a 19.0 ± 0.8a 0.7 ± 0.0b 4.8 ± 0.7a
DHA/x6DPA 2.0 ± 0.3a 2.9 ± 0.1a – 2.2 ± 0.4a 1.6 ± 0.6a
x6DPA/AA 0.06 ± 0.0b 5.1 ± 0.3a 0.0 ± 0.0b 0.4 ± 0.0b 9.5 ± 2.5a
AA, arachidonic acid; EPA, eicosapentaenoic acid; DHA, docosahexaenoic acid.
Values (mean ± SE of three replicates) in the same row not sharing a superscript are significantly
different (P < 0.05).1 Sum of saturated fatty acids, which also includes: i15:0, ai15:0, 15:0, i16:0, ai16:0, i17:0, ai17:0,
20:0, 22:0 and 23:0 at £1.38% each.2 Sum of monounsaturated fatty acids, which also includes: 14:1, 15:1, 16:1x9, 16:1x5, 17:1,
20:1x11, 22:1x11, 22:1x9 and 24:1 at £2.18% each.3 Sum of polyunsaturated fatty acids, which also includes: 16:2x4, 16:3x4, 16:4x3, 16:4x1,
18:2x4, 18:3x6, 18:4x3, 20:2a, 20:2b, 20:2x6, 20:3x3, 21:5x3 and 22:4x6 at £1.08% each.4 Sum of odd and/or branched fatty acids. Includes: i15:0, ai15:0, 15:0, 15:1, i16:0, ai16:0, i17:0,
ai17:0, 17:0 and 17:1.
A. S. Garcia et al.
. . . . . . . . . . . . . . . . . . . . . . . . . . . . . . . . . . . . . . . . . . . . . . . . . . . . . . . . . . . . . . . . . . . . . . . . . . . . . . . . . . . . . . . . . . . . . .
� 2008 Blackwell Publishing Ltd Aquaculture Nutrition 14; 14–30
20

Total lipid, lipid class and fatty acid composition of
larvae
In larvae from AquaGrow Advantage and AlgaMac 2000
treatments, the total lipid content increased during the first
2 weeks of larviculture, and reached a peak at 15 dph
(172.3 dd). After that, the total lipid content decreased
progressively during the remaining experimental period. In
contrast, larvae from the Pavlova sp. + AlgaMac 2000
treatment experienced a constant increase in their total lipid
content (Fig. 3a; Table 5). The same trend was observed in
the PL concentrations (Fig. 3b). At the end of the experi-
ment, larvae from all treatments significantly increased their
total lipid content when compared to the levels observed in
newly hatched larvae. However in larvae from the Pavlova
sp. + AlgaMac 2000 treatment (341.7 ± 6.4 mg g)1 dw)
the total lipid concentration was 2.5-fold higher than newly
hatched larvae, 1.6-fold higher than in larvae from the
AquaGrow Advantage treatment and 1.2-fold higher than
in larvae from the AlgaMac 2000 treatment (F3,9 ¼ 155.35,
P < 0.0001). Furthermore, these larvae also had PL con-
centrations (242.2 ± 6.6 mg g)1 dw) 3.4-fold higher than
newly hatched larvae, 1.7-fold higher than larvae from the
AquaGrow Advantage treatment and 1.4-fold higher than
larvae from the AlgaMac 2000 treatment (F3,9 ¼ 127.13,
P < 0.0001). After 37 days of larviculture, the percentage
of TAG decreased in larvae with all treatments (F3,9 ¼
15.29, P ¼ 0.0007). Larvae from the AlgaMac 2000 treat-
ment had higher percentages of ST than the larvae from the
other treatments and newly hatched larvae (F3,9 ¼ 6.34,
P ¼ 0.01).
In larvae from the AlgaMac 2000 treatment, the palmitic
acid percentage was comparable to values observed in newly
hatched larvae, and 1.6-fold higher than in larvae from the
Pavlova sp. + AlgaMac 2000 treatment, and 1.4-fold higher
than in larvae from the AquaGrow Advantage treatment
a
ab
b
aa
b
4
5
6
7
8
9
10
11
11 79.8 160.8 243.2 382.4
Degree-days
11 79.8 172.3 243.2 356.3 443.2Degree-days
Sta
ndar
d le
ngth
(m
m)
0
0.3
0.6
0.9
1.2
1.5
1.8(a)
(b)
Dry
wei
ght (
mg)
AlgaMac 2000®
AquaGrow® Advantage
Pavlova sp. + AlgaMac 2000®
AlgaMac 2000®
AquaGrow® Advantage
Pavlova sp. + AlgaMac 2000®
Figure 2 Dry weight (a) and standard length (b) of Atlantic cod
larvae fed differently enriched rotifers during 37 and 32 days (443.2
and 382.4 dd respectively) of larviculture respectively. Values
expressed as mean ± SE of six samples for dry weight (except at
11 dd where n ¼ 3) and mean ± SE of 20 samples for standard
length. Data points with different superscript are significantly
different at P < 0.05. dd, degree-days
0
1
2
3
4
5
11 79.8 172.3 243.2 356.3 443.2
Degree-days
Sur
viva
l
AlgaMac 2000®
AquaGrow® AdvantagePavlova sp. + AlgaMac 2000®
Figure 1 Survival of Atlantic cod larvae fed differently enriched
rotifers at 11, 79.8, 172.3, 243.2, 356.3 and 443.2 degree-days
(equivalent to 1, 7, 15, 21, 30 and 37 days posthatch respectively).
Survival was ranked on a nominal scale of 0–5, where 0 was con-
sidered as total mortality (or 0% survival), 1 as poor survival, 2 as
reasonable survival, 3 as good survival, 4 as very good survival and 5
as total survival (or 100% survival). The rank 3 was considered to be
between 30 % and 40% survival. Values are expressed as mean of 12
observations per treatment
A comparison among differently enriched rotifers and their effect
. . . . . . . . . . . . . . . . . . . . . . . . . . . . . . . . . . . . . . . . . . . . . . . . . . . . . . . . . . . . . . . . . . . . . . . . . . . . . . . . . . . . . . . . . . . . . .
� 2008 Blackwell Publishing Ltd Aquaculture Nutrition 14; 14–30
21

(F3,11 ¼ 180.39, P < 0.0001). This treatment resulted in lar-
vae with the highest RSFA (F3,11 ¼ 218.28, P < 0.0001:
Table 6). Larvae from the Pavlova sp. + AlgaMac 2000
treatment showed the highest percentage of 16:1x7 and the
highest sum of monounsaturated fatty acids (RMUFA,
F3,11 ¼ 52.56, P < 0.0001 for both analyses). Larvae from
the AlgaMac 2000 treatment had percentages of AA 4.2-fold
higher than newly hatched larvae, 1.9-fold higher than larvae
from the AquaGrow Advantage treatment and 1.2-fold
higher than larvae from the Pavlova sp. + AlgaMac 2000
treatment (F3,11 ¼ 126.56, P < 0.0001). In contrast, the
percentage of EPA in larvae from the AlgaMac 2000 treat-
ment was approximately sevenfold lower than in newly
hatched larvae, 1.5-fold lower than in larvae from the
AquaGrow Advantage treatment and 1.3-fold lower than in
larvae from the Pavlova sp. + AlgaMac 2000 treatment
(F3,11 ¼ 3733.82, P < 0.000 respectively). Consequently,
larvae from the AlgaMac 2000 treatment showed EPA/AA
ratios (0.6 ± 0.0) significantly lower than larvae from the
other treatments (F3,11 ¼ 462.08, P < 0.0001). The DHA
percentage observed in larvae from the AquaGrow
Advantage treatment (35.8 ± 0.3%) was approximately
1.5-fold higher than in larvae from the other two treatments
(F3,11 ¼ 114.07, P < 0.0001). In larvae from the Pavlova
sp. + AlgaMac 2000 treatment the percentage of x6DPA
(5.7 ± 0.2%) was significantly higher than in newly hatched
larvae and in larvae from the other treatments (F3,11 ¼137.63, P < 0.0001). The larval DHA/EPA ratio increased in
larvae from all treatments, but larvae from the Pavlova
sp. + AlgaMac 2000 treatment showed the lowest increment
(F3,11 ¼ 249, P < 0.0001). In larvae from all treatments, the
sum of DHA and x6DPA remained constant around 32%
from hatch up to the end of the experiment, with the
exception of larvae from the AquaGrow Advantage
treatment (Fig. 4), in which this value was higher than the
other treatments at 37 dph (443.2 dd; 36.5 ± 0.3%)
(F3,11 ¼ 42.53, P < 0.0001).
Although at 37 dph larvae from all treatments had signi-
ficantly higher ROBFA than newly hatched larvae (F3,11 ¼0.86, P ¼ 0.0019), there were no significant differences in the
ROBFA among larvae from the different treatments at
37 dph (F2,9 ¼ 0.54, P ¼ 0.59: Table 5). Furthermore, there
Table 4 Dry weight (mg), dry weight
specific growth rate (% day)1), standard
length (mm) and standard length specific
growth rate (SGR; % day)1) of Atlantic
cod larvae fed differently enriched
rotifers
Treatments
AlgaMac 2000�AquaGrow�
Advantage
Pavlova sp. +
AlgaMac 2000�
Dry weight (mg) at 37 dph (443.2 dd) 1.21 ± 0.07ab 1.03 ± 0.04b 1.50 ± 0.11a
Dry weight SGR (% day)1) 6.58 ± 0.20ab 6.29 ± 0.04b 7.10 ± 0.14a
Standard length (mm) at 32 dph (382.4 dd) 10.23 ± 0.18a 9.60 ± 0.22b 10.23 ± 0.15a
Standard length SGR (% day)1) 2.73 ± 0.05a 2.53 ± 0.07b 2.74 ± 0.04a
dph, days posthatch; dd, degree-days.
Values (mean ± SE) with different superscript are significantly different (P < 0.05).
a
Total lipid(a)
(b)
100
200
300
400
a
b
a
b
cb
a
a
Phospholipid
50
100
150
200
250
mg
g–1 d
ry w
eigh
tm
g g–1
dry
wei
ght
aa
b
a
b
b
a
b
c
11 172.3 356.3 443.2
Degree-days
11 172.3 356.3 443.2
Degree-days
AlgaMac 2000®
AquaGrow® AdvantagePavlova sp. + AlgaMac 2000®
AlgaMac 2000®
AquaGrow® AdvantagePavlova sp. + AlgaMac 2000®
Figure 3 Changes in total lipid (a) and phospholipid (b) concentra-
tions in Atlantic cod larvae fed on differently enriched rotifers.
Samples were collected at 11dd (1 dph), 172.3 dd (15 dph), at
356.3 dd (30 dph), and 443.2 dd (37 dph). Values are expressed as
mean ± SE of four samples, except at 11 dd (1 dph) where n ¼ 3.
Data points with different superscript are significantly different at
P < 0.05. dd, degree-days; dph, days posthatch.
A. S. Garcia et al.
. . . . . . . . . . . . . . . . . . . . . . . . . . . . . . . . . . . . . . . . . . . . . . . . . . . . . . . . . . . . . . . . . . . . . . . . . . . . . . . . . . . . . . . . . . . . . .
� 2008 Blackwell Publishing Ltd Aquaculture Nutrition 14; 14–30
22

were no statistical differences among the ROBFA of larvae
from the different treatments at 15 or 30 dph (data not
shown) (F2,9 ¼ 1.22, P ¼ 0.33 and F2,9 ¼ 0.49, P ¼ 0.62
respectively).
The larval dry weight correlated positively with larval
contents of DHA, AA and EPA (r2 ¼ 88.8%, P < 0.001;
r2 ¼ 77%, P < 0.001 and r2 ¼ 76%, P < 0.001 respectively)
over the experimental period. There was also a positive
correlation between larval dry weight and the larval content
of x6DPA (r2 ¼ 60%, P ¼ 0.001); however, this correlation
was not as strong as with DHA, AA and EPA (Fig. 5). Other
major variables were tested but did not correlate with larval
dry weight.
The larval concentrations of DHA, EPA, AA and x6DPA
did not reflect the relative composition of enriched rotifers
and their diets. Although rotifers enriched with Pavlova sp.
and Pavlova sp. + AlgaMac 2000 contained the lowest
concentrations of these fatty acids, larvae from the Pavlova
sp. + AlgaMac 2000 treatment showed the highest concen-
trations of DHA, EPA, AA and x6DPA (Figs 6 and 7).
Discussion
The lipid class composition of enriched rotifers showed a
trend similar to the composition of their diet. Although in
rotifers enriched with AlgaMac 2000, the PL proportion was
significantly lower than in the other treatments, in absolute
terms, different treatments delivered similar concentrations
of PL to the larvae. The fact that one of the treatments
resulted in rotifers with the PL percentage significantly lower
than others is somewhat surprising. The polar lipid class
composition of live organisms tends to be conservative
(Tackaert et al. 1991), and rotifers in particular, tend to
conserve a constant PL level independent of the lipid class
composition of the diets (Rainuzzo et al. 1994). However,
rotifers rapidly break down the PL fraction of their diet
(Dhert et al. 2001), and since other nutritional parameters of
the enriched rotifers were different (such as total lipid con-
tent, TAG percentage, and fatty acid composition), it is
possible that the metabolism of PL in the rotifers enriched
with AlgaMac 2000 was faster than in the other treatments.
In the present study, the Pavlova sp. + AlgaMac 2000
treatment resulted in the best larval performance overall.
Larvae from this treatment had not only better growth rates
but also superior survival during the 37 days of larviculture.
The growth rates observed in this study at 37 dph (443.2 dd)
are comparable to those obtained with cod larvae at 36 dph
by Park et al. (2006). These authors tested four commercial
preparations with three different DHA/EPA ratios—0, 33.6
and 95.7—for the enrichment of rotifers. The growth pro-
duced by rotifers enriched with DHA/EPA ratio of 33.6
(giving rotifers with a DHA/EPA ratio of 4.0, 92.1 mg g)1
total lipids, of which 50% was TAG and 34% was PL) was
significantly lower than the other treatments. On the other
hand, rotifers enriched with DHA/EPA ratio of 0.0 (giving
rotifers with a DHA/EPA of 9.2, 98.7 mg g)1 total lipids, of
which 40% was TAG and 39% was PL) resulted in superior
survival, and growth comparable to the growth produced by
rotifers enriched with DHA/EPA ratio of 95.7 (giving rotifers
with a DHA/EPA ratio of 9.7, 75.3 mg g)1 total lipids, of
which 32% was TAG and 61% was PL). In a different study
with cod larvae, O’Brien MacDonald et al. (2006) found that
larvae fed with rotifers with DHA/EPA ratio of 3.7 (giving
rotifers containing 78.3 ± 8.6 mg g)1 of total lipids, of
which �21% was TAG and 22% was PL) grew better, had
higher survival rates, and were more efficient at catching prey
than larvae fed with rotifers with a DHA/EPA ratio of 0.3
(giving rotifers with 44.4 ± 4.8 mg g)1 of total lipids, of
Table 5 Total lipid (mg g)1 dry weight)
and percentage lipid class composition
of Atlantic cod larvae at the start (newly
hatched larvae) and the end of the
experiment (37 dph; 443.2 dd)
Treatments
Newly hatched
larvae (1 dph) AlgaMac 2000�AquaGrow�
Advantage
Pavlova sp. +
AlgaMac 2000�
Total lipids1 (mg g)1 dw) 135.2 ± 3.8d 274.4 ± 9.9b 215.3 ± 3.5c 341.8 ± 6.4a
Lipid classes (% total lipids)
Hydrocarbons 0.6 ± 0.1a 0.3 ± 0.0b 0.3 ± 0.0b 0.2 ± 0.1b
Triacylglycerols 4.7 ± 0.7a 1.8 ± 0.4b 1.3 ± 0.2b 2.1 ± 0.3b
Free fatty acids 0.7 ± 0.1b 1.3 ± 0.2ab 1.7 ± 0.1a 1.3 ± 0.4ab
Sterols 24.6 ± 2.6b 33.1 ± 1.5a 27.6 ± 1.4b 24.3 ± 0.4b
Acetone mobile polar lipids 13.5 ± 0.6a 1.4 ± 0.2b 0.3 ± 0.0b 0.7 ± 0.1b
Phospholipids 52.5 ± 4.7b 61.7 ± 2.0ab 68.1 ± 1.3a 70.8 ± 0.6a
dph, days posthatch; dd, degree-days.
Values (mean ± SE of three replicates, except for AquaGrow� Advantage n ¼ 4) in the same row
not sharing a superscript are significantly different (P < 0.05).1 May also contain steryl esters, ketones and alcohols at £ 2.47% each.
A comparison among differently enriched rotifers and their effect
. . . . . . . . . . . . . . . . . . . . . . . . . . . . . . . . . . . . . . . . . . . . . . . . . . . . . . . . . . . . . . . . . . . . . . . . . . . . . . . . . . . . . . . . . . . . . .
� 2008 Blackwell Publishing Ltd Aquaculture Nutrition 14; 14–30
23
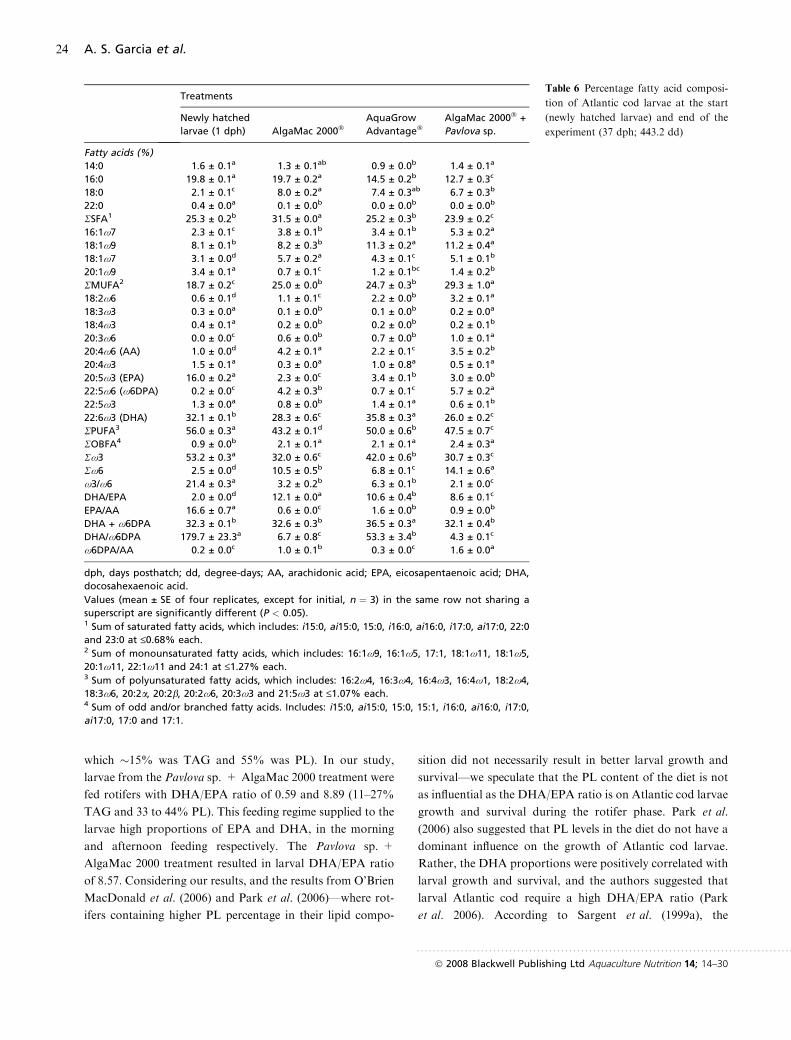
which �15% was TAG and 55% was PL). In our study,
larvae from the Pavlova sp. + AlgaMac 2000 treatment were
fed rotifers with DHA/EPA ratio of 0.59 and 8.89 (11–27%
TAG and 33 to 44% PL). This feeding regime supplied to the
larvae high proportions of EPA and DHA, in the morning
and afternoon feeding respectively. The Pavlova sp. +
AlgaMac 2000 treatment resulted in larval DHA/EPA ratio
of 8.57. Considering our results, and the results from O’Brien
MacDonald et al. (2006) and Park et al. (2006)—where rot-
ifers containing higher PL percentage in their lipid compo-
sition did not necessarily result in better larval growth and
survival—we speculate that the PL content of the diet is not
as influential as the DHA/EPA ratio is on Atlantic cod larvae
growth and survival during the rotifer phase. Park et al.
(2006) also suggested that PL levels in the diet do not have a
dominant influence on the growth of Atlantic cod larvae.
Rather, the DHA proportions were positively correlated with
larval growth and survival, and the authors suggested that
larval Atlantic cod require a high DHA/EPA ratio (Park
et al. 2006). According to Sargent et al. (1999a), the
Table 6 Percentage fatty acid composi-
tion of Atlantic cod larvae at the start
(newly hatched larvae) and end of the
experiment (37 dph; 443.2 dd)
Treatments
Newly hatched
larvae (1 dph) AlgaMac 2000�AquaGrow
Advantage�AlgaMac 2000� +
Pavlova sp.
Fatty acids (%)
14:0 1.6 ± 0.1a 1.3 ± 0.1ab 0.9 ± 0.0b 1.4 ± 0.1a
16:0 19.8 ± 0.1a 19.7 ± 0.2a 14.5 ± 0.2b 12.7 ± 0.3c
18:0 2.1 ± 0.1c 8.0 ± 0.2a 7.4 ± 0.3ab 6.7 ± 0.3b
22:0 0.4 ± 0.0a 0.1 ± 0.0b 0.0 ± 0.0b 0.0 ± 0.0b
RSFA1 25.3 ± 0.2b 31.5 ± 0.0a 25.2 ± 0.3b 23.9 ± 0.2c
16:1x7 2.3 ± 0.1c 3.8 ± 0.1b 3.4 ± 0.1b 5.3 ± 0.2a
18:1x9 8.1 ± 0.1b 8.2 ± 0.3b 11.3 ± 0.2a 11.2 ± 0.4a
18:1x7 3.1 ± 0.0d 5.7 ± 0.2a 4.3 ± 0.1c 5.1 ± 0.1b
20:1x9 3.4 ± 0.1a 0.7 ± 0.1c 1.2 ± 0.1bc 1.4 ± 0.2b
RMUFA2 18.7 ± 0.2c 25.0 ± 0.0b 24.7 ± 0.3b 29.3 ± 1.0a
18:2x6 0.6 ± 0.1d 1.1 ± 0.1c 2.2 ± 0.0b 3.2 ± 0.1a
18:3x3 0.3 ± 0.0a 0.1 ± 0.0b 0.1 ± 0.0b 0.2 ± 0.0a
18:4x3 0.4 ± 0.1a 0.2 ± 0.0b 0.2 ± 0.0b 0.2 ± 0.1b
20:3x6 0.0 ± 0.0c 0.6 ± 0.0b 0.7 ± 0.0b 1.0 ± 0.1a
20:4x6 (AA) 1.0 ± 0.0d 4.2 ± 0.1a 2.2 ± 0.1c 3.5 ± 0.2b
20:4x3 1.5 ± 0.1a 0.3 ± 0.0a 1.0 ± 0.8a 0.5 ± 0.1a
20:5x3 (EPA) 16.0 ± 0.2a 2.3 ± 0.0c 3.4 ± 0.1b 3.0 ± 0.0b
22:5x6 (x6DPA) 0.2 ± 0.0c 4.2 ± 0.3b 0.7 ± 0.1c 5.7 ± 0.2a
22:5x3 1.3 ± 0.0a 0.8 ± 0.0b 1.4 ± 0.1a 0.6 ± 0.1b
22:6x3 (DHA) 32.1 ± 0.1b 28.3 ± 0.6c 35.8 ± 0.3a 26.0 ± 0.2c
RPUFA3 56.0 ± 0.3a 43.2 ± 0.1d 50.0 ± 0.6b 47.5 ± 0.7c
ROBFA4 0.9 ± 0.0b 2.1 ± 0.1a 2.1 ± 0.1a 2.4 ± 0.3a
Rx3 53.2 ± 0.3a 32.0 ± 0.6c 42.0 ± 0.6b 30.7 ± 0.3c
Rx6 2.5 ± 0.0d 10.5 ± 0.5b 6.8 ± 0.1c 14.1 ± 0.6a
x3/x6 21.4 ± 0.3a 3.2 ± 0.2b 6.3 ± 0.1b 2.1 ± 0.0c
DHA/EPA 2.0 ± 0.0d 12.1 ± 0.0a 10.6 ± 0.4b 8.6 ± 0.1c
EPA/AA 16.6 ± 0.7a 0.6 ± 0.0c 1.6 ± 0.0b 0.9 ± 0.0b
DHA + x6DPA 32.3 ± 0.1b 32.6 ± 0.3b 36.5 ± 0.3a 32.1 ± 0.4b
DHA/x6DPA 179.7 ± 23.3a 6.7 ± 0.8c 53.3 ± 3.4b 4.3 ± 0.1c
x6DPA/AA 0.2 ± 0.0c 1.0 ± 0.1b 0.3 ± 0.0c 1.6 ± 0.0a
dph, days posthatch; dd, degree-days; AA, arachidonic acid; EPA, eicosapentaenoic acid; DHA,
docosahexaenoic acid.
Values (mean ± SE of four replicates, except for initial, n ¼ 3) in the same row not sharing a
superscript are significantly different (P < 0.05).1 Sum of saturated fatty acids, which includes: i15:0, ai15:0, 15:0, i16:0, ai16:0, i17:0, ai17:0, 22:0
and 23:0 at £0.68% each.2 Sum of monounsaturated fatty acids, which includes: 16:1x9, 16:1x5, 17:1, 18:1x11, 18:1x5,
20:1x11, 22:1x11 and 24:1 at £1.27% each.3 Sum of polyunsaturated fatty acids, which includes: 16:2x4, 16:3x4, 16:4x3, 16:4x1, 18:2x4,
18:3x6, 20:2a, 20:2b, 20:2x6, 20:3x3 and 21:5x3 at £1.07% each.4 Sum of odd and/or branched fatty acids. Includes: i15:0, ai15:0, 15:0, 15:1, i16:0, ai16:0, i17:0,
ai17:0, 17:0 and 17:1.
A. S. Garcia et al.
. . . . . . . . . . . . . . . . . . . . . . . . . . . . . . . . . . . . . . . . . . . . . . . . . . . . . . . . . . . . . . . . . . . . . . . . . . . . . . . . . . . . . . . . . . . . . .
� 2008 Blackwell Publishing Ltd Aquaculture Nutrition 14; 14–30
24

requirement of marine fish larvae for DHA is species and life
stage-specific. Although a DHA/EPA ratio of 2 is normally
found in many marine fish eggs and larvae (Tocher & Sargent
1984), DHA/EPA ratios different from 2 are often associated
with good larval growth and survival. For example, yellow-
tail flounder (Limanda ferruginea) larvae fed rotifers with a
DHA/EPA ratio of 8.2 grew faster and with better survival
rates than larvae fed rotifers with DHA/EPA ratio of 1.9
(Copeman et al. 2002). Although growth and survival rates
were not affected by different DHA/EPA ratios, the
percentage of turbot (Scophthalmus maximus) larvae with
normal pigmentation was higher in a group fed rotifers with
DHA/EPA ratio of 0.5 (83%) than in a group fed rotifers
with DHA/EPA ratio of 2 (�33%) (Estevez et al. 1999).
There were no differences in growth and survival rates of
haddock (Melanogrammus aeglefinus) larvae fed rotifers with
DHA/EPA ratio of 4.5 when compared to larvae fed rotifers
with DHA/EPA ratio of 1.6 (Castell et al. 2003).
The essential fatty acids from the x3 family, DHA and
EPA, are well known for the role they play in larval growth,
survival and resistance to stress (Sargent et al. 1999a; Izqui-
erdo et al. 2000) but other nutritional factors should be
considered when evaluating the quality of diets for marine
fish larvae. The importance of fatty acids from the x6 family,
especially AA, has received increased attention (Bell &
Sargent 1999; Izquierdo et al. 2000; Koven et al. 2003).
There is a competitive interaction between EPA and AA for
the synthesis of eicosanoids. Eicosanoids are a range of
highly bioactive compounds with twenty carbon atoms
formed in small amounts by every tissue in the body, and
involved in a great variety of physiological functions, inclu-
ding immune response and stress resistance (Sargent et al.
2002; Tocher 2003). The major precursor of eicosanoids in
fish is AA, with eicosanoids formed from EPA being less
biologically active than those formed from AA. Further-
more, EPA competitively inhibits the formation of eicosa-
noids from AA (Sargent et al. 1999b). Consequently, EPA
works as eicosanoid modulators in the body, with high tissue
ratios of EPA/AA resulting in decreased eicosanoid action.
The physiological function that EPA exerts in eicosanoid
action may help to explain why in the present study, the diet
with the highest DHA/EPA ratio (AquaGrow Advantage,
DHA/EPA of approximately 25) resulted in poor larval
growth and survival. Rotifers enriched with AquaGrow
Advantage had the lowest AA percentage and an EPA/AA
ratio significantly higher than the other treatments. It is
worthwhile to note that the same trend was observed in the
larval ratios, with larvae from the AquaGrow Advantage
treatment having the highest EPA/AA ratio (1.5). It is
possible that larvae from this treatment produced higher
proportions of EPA-derived eicosanoids, making them less
successful at overcoming stressful situations, and having
consequently, reduced survival and growth. These results are
in agreement with the Park et al. (2006) study, were the diet
with the lowest EPA/AA ratio resulted in the highest survival
rates. The EPA/AA ratio also explains the results exemplified
above (Estevez et al. 1999; Copeman et al. 2002; Castell et al.
2003) where DHA/EPA ratios higher and lower than 2
resulted in good larval performance.
The question of which DHA/EPA ratio is optimal for a
given species of fish cannot be answered without consid-
ering the EPA/AA ratio, since elevating the level of DHA
in the diet will simultaneously reduce the level of EPA,
therefore altering the EPA/AA ratio. Consequently, the
interactions in eicosanoid production between EPA and
AA are affected, which in turn affect larval growth, sur-
vival and stress resistance. Sargent et al. (1999a) suggested
that an optimum DHA/EPA/AA ratio for marine fish
would probably be around 10 : 5 : 1. However, these
authors cautiously pointed that this ratio may not apply
universally to all marine fish, since both the optimum
concentration and ratio of DHA, EPA and AA are species
specific. In the present study, a combination of two rotifers
enriched differently—rotifers enriched with Pavova sp.
paste rotifers and enriched with Pavlova sp. paste + Al-
gaMac 2000—resulted in the best larval performance. The
DHA/EPA/AA ratios in these preys were approximately
1 : 1.6 : 1 and 11 : 1.5 : 1 respectively. The daily food
requirement of Atlantic cod larvae is related to the larvae’s
30
32
34
36
38
*
11 243.2 356.3 443.2Degree-days
AlgaMac 2000®
AquaGrow® Advantage
Pavlova sp. + AlgaMac 2000®
Figure 4 Levels of 22:6x3 + 22:5x6 in Atlantic cod larvae fed dif-
ferently enriched rotifers at 11, 243.2, 356.3 and 443.2 degree-days
(dd) [equivalent to 1, 15, 30 and 37 days posthatch (dph) respect-
ively]. Values are expressed as mean + SE of four samples, except at
11 dd (1 dph) where n ¼ 3. *Denotes differences at P < 0.05
A comparison among differently enriched rotifers and their effect
. . . . . . . . . . . . . . . . . . . . . . . . . . . . . . . . . . . . . . . . . . . . . . . . . . . . . . . . . . . . . . . . . . . . . . . . . . . . . . . . . . . . . . . . . . . . . .
� 2008 Blackwell Publishing Ltd Aquaculture Nutrition 14; 14–30
25

specific growth rate. It has been estimated to range from a
few prey items per larva at the onset of the exogenous
feeding to up to >100 prey items per larva later in the
development (Olsen et al. 2004). Likewise, the proportions
of prey items ingested during different feeding periods
(morning and afternoon) also show variation during the
larviculture (Darrell Green and Jennifer Monk – ARDF
staff, personal communication). Because the feeding ratio
was not measured in the present study, it is not possible to
estimate the contribution of each type of rotifer as source
of essential fatty acids to the larvae. Nevertheless, it is
unlikely that the DHA/EPA/AA ratio observed in rotifers
enriched with Pavlova sp. paste is the best ratio to be
supplied to Atlantic cod larvae. In the study performed by
Park et al. (2006) rotifers containing DHA/EPA/AA ratio
of approximately 10 : 1 : 1 resulted in the best larval per-
formance (growth and survival). Considering this value,
and the ratio proposed by Sargent et al. (1999a), the DHA/
EPA/AA ratio observed in rotifers enriched with Pavlova
sp. paste + AlgaMac 2000 (11 : 1.5 : 1) is probably closer
to an optimum DHA/EPA/AA ratio for early develop-
mental stages of Atlantic cod larvae.
Odd and/or branched fatty acids are characteristic of
bacteria, and have been used as biomarkers in bacterial
taxonomy, as well to assess total bacterial biomass or the
biomass of groups of bacteria (Sargent et al. 1987). In the
present study, rotifer groups enriched with AlgaMac 2000
alone or in combination with algae paste had lower sum of
1086420
10 1286420806040200
0
0.5
1
1.5
2
1050 15 20
Larv
al d
ry w
eigh
t (m
g)
0
0.5
1
1.5
2
Larv
al d
ry w
eigh
t (m
g)
0
0.5
1
1.5
2
Larv
al d
ry w
eigh
t (m
g)
0
0.5
1
1.5
2(a) (b)
(c) (d)
Larv
al d
ry w
eigh
t (m
g)
AlgaMac 2000®
AquaGrow® Advantage
Pavlova sp. + AlgaMac 2000®
AlgaMac 2000®
AquaGrow® Advantage
Pavlova sp. + AlgaMac 2000®
AlgaMac 2000®
AquaGrow® Advantage
Pavlova sp. + AlgaMac 2000®
AlgaMac 2000®
AquaGrow® Advantage
Pavlova sp. + AlgaMac 2000®
Figure 5 The relationship between larval dry weight and (a) docosahexaenoic acid, (b) arachidonic acid, (c) eicosapentaenoic acid and
(d) x6DPA content of cod larvae. Values of fatty acids expressed as content in one larva (lg)
A. S. Garcia et al.
. . . . . . . . . . . . . . . . . . . . . . . . . . . . . . . . . . . . . . . . . . . . . . . . . . . . . . . . . . . . . . . . . . . . . . . . . . . . . . . . . . . . . . . . . . . . . .
� 2008 Blackwell Publishing Ltd Aquaculture Nutrition 14; 14–30
26
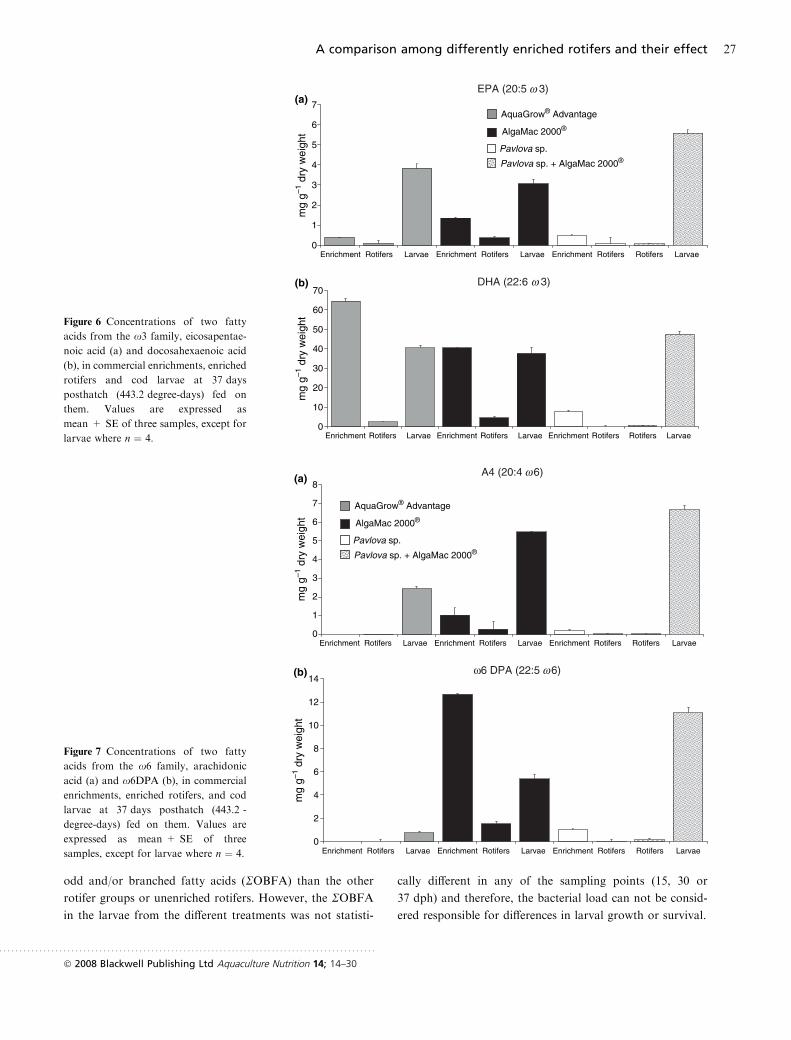
odd and/or branched fatty acids (ROBFA) than the other
rotifer groups or unenriched rotifers. However, the ROBFA
in the larvae from the different treatments was not statisti-
cally different in any of the sampling points (15, 30 or
37 dph) and therefore, the bacterial load can not be consid-
ered responsible for differences in larval growth or survival.
0
10
20
30
40
50
60
70
Enrichment Rotifers Larvae Enrichment Rotifers Larvae Enrichment Rotifers Rotifers Larvae
Enrichment Rotifers Larvae Enrichment Rotifers Larvae Enrichment Rotifers Rotifers Larvae
mg
g–1 d
ry w
eigh
tm
g g–1
dry
wei
ght
0
1
2
3
4
5
6
7(a)
(b)
AquaGrow® Advantage
AlgaMac 2000®
Pavlova sp.
Pavlova sp. + AlgaMac 2000®
Figure 6 Concentrations of two fatty
acids from the x3 family, eicosapentae-
noic acid (a) and docosahexaenoic acid
(b), in commercial enrichments, enriched
rotifers and cod larvae at 37 days
posthatch (443.2 degree-days) fed on
them. Values are expressed as
mean + SE of three samples, except for
larvae where n ¼ 4.
0
2
4
6
8
10
12
14
Enrichment Rotifers Larvae Enrichment Rotifers Larvae Enrichment Rotifers Rotifers Larvae
Enrichment Rotifers Larvae Enrichment Rotifers Larvae Enrichment Rotifers Rotifers Larvae
mg
g–1 d
ry w
eigh
tm
g g–1
dry
wei
ght
0
1
2
3
4
5
6
7
8(a)
(b)
AquaGrow® Advantage
AlgaMac 2000®
Pavlova sp.
Pavlova sp. + AlgaMac 2000®
Figure 7 Concentrations of two fatty
acids from the x6 family, arachidonic
acid (a) and x6DPA (b), in commercial
enrichments, enriched rotifers, and cod
larvae at 37 days posthatch (443.2 -
degree-days) fed on them. Values are
expressed as mean + SE of three
samples, except for larvae where n ¼ 4.
A comparison among differently enriched rotifers and their effect
. . . . . . . . . . . . . . . . . . . . . . . . . . . . . . . . . . . . . . . . . . . . . . . . . . . . . . . . . . . . . . . . . . . . . . . . . . . . . . . . . . . . . . . . . . . . . .
� 2008 Blackwell Publishing Ltd Aquaculture Nutrition 14; 14–30
27

To date, x6DPA (22:5x6) has not been considered an
essential fatty acid for marine fish larvae. This fatty acid can
act as a substitute for DHA in the developing brain of
mammals under DHA-deficient diets (Moriguchi et al. 2000).
According to Moriguchi et al. (2000) it is possible that
x6DPA supplementation would avoid an inadequate amount
of 22-carbon polyunsaturated fatty acids during a critical
stage in early nervous system development. In mammals, this
supplementation would prevent losses in behavioural per-
formance associated with x3 deficiency. Eldho et al. (2003)
investigated the effects of the replacement of DHA by
x6DPA in the physical properties of membranes. These au-
thors found that parameters traditionally used to compare
bilayers, such as main phase transition temperature, overall
bilayer geometry, bilayer thickness, and area per molecule,
were identical in the control group and in the bilayer in which
DHA was replaced by x6DPA. However, there was an
important difference between DHA- and x6DPA-containing
membranes: a difference in the packing of hydrocarbon
chains. The loss of a single double bond from DHA to
x6DPA resulted in a more even distribution of chain densi-
ties along the bilayer normal, with the less flexible tail section
of x6DPA favouring more extended chain formations
(Eldho et al. 2003). This characteristic of x6DPA-containing
membranes may serve to maintain membrane fluidity or
structural integrity during shifts in ambient temperature,
which would be important in species such as Atlantic cod.
According to Sundby (2000), during the period from the egg
stage to pelagic juvenile stage, Atlantic cod undergoes
the largest temperature changes through lifetime, with
larvae from the Northern stock off Labrador/Newfoundland
being found even at temperatures below 0 �C. Results with
cold-water bivalves support this hypothesis. Marked accu-
mulation of x6DPA was observed in sea scallop larvae
irrespective of diet and life stage. Accumulation of x6DPA
was reported in polar lipids of larval Placopecten maximus
(Delaunay et al. 1993), Placopecten magellenicus (Feindel
2000) and Argopecten purpuratus (Farias et al. 2003). More-
over, high mortalities and poor growth of P. magellanicus
larvae were related to low x6DPA in the diet (Pernet et al.
2005). Apparently, x6DPA plays a crucial role in the
development of bivalve larvae and it is possible that sea
scallops require this fatty acid either as a substitute for DHA
or as an essential fatty acid per se (Milke et al. 2004; Pernet
et al. 2005). In the present study, the two groups of larvae
with top performances showed a substantial accumulation of
x6DPA through the experimental period. At 37 dph, the
level of x6DPA in larvae from the AlgaMac 2000 treatment
was 22 times higher than in newly hatched larvae, while in
larvae from the Pavlova sp. + AlgaMac 2000 treatment the
increment was approximately 30-fold. In contrast, in larvae
from the AquaGrow Advantage treatment, the increment of
x6DPA was less than fourfold. In addition the sum of DHA
and x6DPA was maintained around 32% in larvae from all
treatments from hatch up to the end of the experiment, with
the only exception being the larvae from the AquaGrow
Advantage treatment. These results indicate that despite
replacement of DHA by x6DPA, a constant level of around
32% of 22-carbon fatty acids is needed during the first
4 weeks of development of Atlantic cod larvae. In a study
performed to determine the molecular and stable isotopic
composition of long-chain fatty acids in a short food chain
leading to Atlantic cod larvae, x6DPA showed the smallest
isotopic change among 17 fatty acids for which stable isotope
data were available. This indicates a lack of kinetic frac-
tionation that would occur during enzyme-catalyzed reaction
steps. In addition, this fatty acid showed a 30-fold enrich-
ment in Atlantic cod larvae between day 1 and day 11,
compared to less than threefold enrichment of AA and DHA
(Parrish et al. 2007).
Besides its possible structural role in membranes, x6DPA
may be precursor of bioactive docosanoids (22-carbon atom
compounds with functions similar to eicosanoids). Recently,
Hong et al. (2005) shown that rainbow trout (Oncorhynchus
mykiss) brain cells biosynthesize a range of bioactive
docasanoids—including neuroprotectin D1, resolvin D5,
resolvin D1 and resolvin D2—from endogenous sources of
DHA when challenged in vitro. These compounds are known
for their potent anti-inflammatory and immunoregulatory
actions (Hong et al. 2003). The enzymes involved in the
production of docosanoids from DHA, such as phospho-
lipase A2 (PLA2) and cyclooxygenase 2 (COX-2), could work
on x6DPA to form a parallel series of competitive products
as found with the C20 EPA and AA (Simopoulos 2002).
Elevated concentrations of x6DPA could compete for the
active sites of both PLA2 and COX-2, thus helping to retain
DHA (DeMar et al. 2004). In the present study, the larvae
with the poorest performance had the highest DHA/x6DPA
ratio. However if the poor performance of this group is to be
related to the DHA/x6DPA ratio, the relationship should be
established on the basis of docosanoid production and not
DHA retention, since larvae from this treatment had DHA
levels significantly higher than the larvae from other treat-
ments. The results exposed above suggest that x6DPA could
act as an essential fatty acid during early development of
Atlantic cod larvae. If so, it would not be surprising,
considering that up to the mid-1990s AA was not regarded
as an essential fatty acid in marine fish nutrition.
A. S. Garcia et al.
. . . . . . . . . . . . . . . . . . . . . . . . . . . . . . . . . . . . . . . . . . . . . . . . . . . . . . . . . . . . . . . . . . . . . . . . . . . . . . . . . . . . . . . . . . . . . .
� 2008 Blackwell Publishing Ltd Aquaculture Nutrition 14; 14–30
28

Sargent et al. (1999b) pointed out that the role of saturated
and MUFA as major energy-yielding nutrients in fish is often
neglected in nutritional studies. There is a strong indication
that 16:0, 18:1x9, 20:1x9 and 22:1x11 are heavily catabolized
to generate metabolic energy in fish because they are all
consumed in large amounts during the growth of farmed fish
species (Sargent et al. 2002). In our study, rotifers from the
treatment that resulted in the best larval performance had the
highest levels of 18:1x9, 20:1x9 and RMUFA (rotifers
enriched with Pavlova sp. paste), and of 16:0 and RSFA
(rotifers enriched with Pavlova sp. paste + AlgaMac 2000).
Although HUFA (including EPA and DHA) are catabolized
to generate energy in fish (Sargent et al. 2002; Tocher 2003),
diets containing high levels of saturated and MUFA give a
clear advantage to the larvae in terms of energy supply, per-
mitting more valuable essential fatty acids to be spared for
membrane composition and/or eicosanoid production.
Our results indicate that the combination of Pavlova sp.
paste and AlgaMac 2000 provided rotifers with an appro-
priate fatty acid profile for the initial feeding of Atlantic cod
larvae. However, more experiments involving stress resist-
ance and variation in x6DPA levels are needed to better
understand the effects of essential fatty acids and x6DPA in
the early development of Atlantic cod larvae.
Acknowledgements
We would like to thank Danny Boyce and the Aquaculture
Research Development Facilities (ARDF-OSC) staff for
their valuable help with the live-feed production and larval
rearing. We also thank Jeanette Wells for technical assistance
with lipid analysis, and Kelly O’Brien MacDonald for
standard length samples collection and measurements. This
research was supported by AquaNet.
References
Øie, G. & Olsen, Y. (1997) Protein and lipid content of rotifer
Brachionus plicatilis during variable growth and feeding condition.
Hydrobiologia, 358, 251–258.
Ando, Y. & Kobayashi, S. (2004) Positional distribution of doc-
osahexaenoic acid in triacyl-sn-glycerols of rotifers Brachionus
plicatilis enriched with fish oil fatty acid ethyl esters. Aquac.
Res., 35, 1391–1394.
Bell, J.G.&Sargent, J.R. (1999)Arachidonic acid in aquaculture feeds:
current status and future opportunities. Aquaculture, 218, 491–499.
Bell, J.G., McEvoy, L.A., Estevez, A., Shields, R.J. & Sargent, J.R.
(2003) Optimizing lipid nutrition in first-feeding flatfish larvae.
Aquaculture, 227, 211–220.
Brown, J.A., Minkoff, G. & Puvanendran, V. (2003) Larviculture of
Atlantic cod (Gadus morhua): progress, protocols and problems.
Aquaculture, 227, 357–372.
Budge, S.M. & Parrish, C.C. (2003) FA determination in cold water
marine samples. Lipids, 38, 781–791.
Castell, J., Blair, T., Neil, S., Kenneth, H., Mercer, S., Reid, J.,
Young-Lai, W., Gullison, B., Dhert, P. & Sorgeloos, P. (2003) The
effect of different HUFA enrichment emulsions on the nutritional
value of rotifers (Brachionus plicatilis) fed to larval haddock
(Melanogrammus aeglefinus). Aquac. Int., 11, 109–117.
Copeman, L.A., Parrish, C.C., Brown, J.A. & Harel, M. (2002) Ef-
fects of docosahexaenoic, eicosapentaenoic, and arachidonic acids
on the early growth, survival, lipid composition and pigmentation
of yellowtail flounder (Limanda ferruginea): a live food enrichment
experiment. Aquaculture, 210, 285–304.
Coutteau, P. & Sorgeloos, P. (1997) Manipulation of dietary lipids,
fatty acids and vitamins in zooplankton cultures. Freshw. Biol., 38,
501–512.
Delaunay, F., Marty, Y., Moal, J. & Samain, J.F. (1993) The effect
of monospecific algal diets on growth and fatty acid composition
of Pecten maximus (L.) larvae. J. Exp. Mar. Biol. Ecol., 173, 163–
179.
DeMar, J.C., Jr, Ma, K., Bell, J.M. & Rapoport, S.I. (2004)
Half-lives of docosahexaenoic acid in rat brain phospholipids
are prolonged by 15 weeks of nutritional deprivation of n-3
polyunsaturated fatty acids. J. Neurochem., 91, 1125–1137.
Dhert, P., Rombaut, G., Suantika, G. & Sorgeloos, P. (2001) Ad-
vancement of rotifer culture and manipulation techniques in
Europe. Aquaculture, 200, 129–146.
Eldho, N.V., Feller, S.E., Tristam-Nagle, S., Polozov, I.V. &
Gawrisch, K. (2003) Polyunsaturated docosahexaenoic vs
docosapentaenoic acid-differences in lipid matrix properties
from the loss of one double bond. J. Am. Chem. Soc., 125, 6409–
6421.
Estevez, A., McEvoy, L.A., Bell, J.G. & Sargent, J.R. (1999)
Growth, survival, lipid composition and pigmentation of turbot
(Scophthalmus maximus) larvae fed live-prey enriched in arachi-
donic and eicosapentaenoic acids. Aquaculture, 180, 321–343.
Farias, A., Bell, J.G., Uriarte, I. & Sargent, J.R. (2003) Poly-
unsaturated fatty acids and total lipid and phospholipids of Chi-
lean scallop Argopecten purpuratus (L.) larvae: effects of diet and
temperature. Aquaculture, 228, 289–305.
Feindel, S.C. (2000) Optimization of hatchery cultures of the sea
scallop, Placopecten magellanicus (Gmelin, 1791): dietary lipid
quality and fatty acid requirements. MSc thesis, Memorial
University of Newfoundland, St John’s, NF.
Fernandez-Reiriz, M.J., Labarta, U. & Ferreiro, M.J. (1993) Effects
of commercial enrichment diets on the nutritional value of the
rotifer (Brachionus plicatilis). Aquaculture, 112, 195–206.
Folch, J., Lees, M. & Sloane-Stanley, G.H. (1957) A simple method
for the isolation and purification of total lipids from animal
tissues. J. Biol. Chem., 22, 497–509.
Harel, M., Koven, W., Lein, I., Bar, Y., Behrens, P., Stubblefield, J.,
Zohar, Y. & Place, A.R. (2002) Advanced DHA, EPA and ArA
enrichment materials for marine aquaculture using single cell
heterotrophs. Aquaculture, 213, 347–362.
Hong, S., Gronert, K., Devchand, P.R., Moussignac, R.L. & Serhan,
C.N. (2003) Novel docosatrienes and 17S-resolvins generated from
docosahexaenoic acid in murine brain, human blood, and glial
cells. J. Biol. Chem., 17, 14677–14687.
Hong, S., Tjonahen, E., Morgan, E.L., Lu, Y., Serhan, C.N. &
Rowley, A.F. (2005) Rainbown trout (Oncorhynchus mykiss) brain
cells biosynthesize novel docosahexaenoic acid-derived resolvins
and protectins—Mediator lipidomic analysis. Prostaglandins Other
Lipid Mediat., 78, 107–116.
A comparison among differently enriched rotifers and their effect
. . . . . . . . . . . . . . . . . . . . . . . . . . . . . . . . . . . . . . . . . . . . . . . . . . . . . . . . . . . . . . . . . . . . . . . . . . . . . . . . . . . . . . . . . . . . . .
� 2008 Blackwell Publishing Ltd Aquaculture Nutrition 14; 14–30
29

Ishizaki, Y., Masuda, R., Uematsu, K., Shimizu, K., Arimoto, M. &
Takeuchi, T. (2001) The effect of dietary docosahexaenoic acid on
schooling behavior and brain development in larval yellowtail.
J. Fish Biol., 58, 1691–1713.
Izquierdo, M.S., Socorro, J., Arantzamendi, L. & Hernandez-Cruz,
C.M. (2000) Recent advances in lipid nutrition in fish larvae. Fish
Physiol. Biochem., 22, 97–107.
Kanazawa, A. (1997) Effects of docosahexaenoic acid and phos-
pholipids on stress tolerance of fish. Aquaculture, 155, 129–134.
Koven, W., van Anholt, R., Lutzky, S., Ben Atia, I., Nixon, O., Ron,
B. & Tandler, A. (2003) The effect of dietary arachidonic acid on
growth, survival and cortisol levels in different age gilthead seab-
ream larvae (Sparus aurata) exposed to handling or daily salinity
change. Aquaculture, 228, 307–320.
Lubzens, E., Minkoff, G., Barr, Y. & Zmora, O. (1997) Mariculture
in Israel—past achievements and future directions in raising roti-
fers as food for marine fish larvae. Hydrobiologia, 358, 13–20.
Milke, L.M., Bricelj, V.M. & Parrish, C.C. (2004) Growth of post-
larval sea scallops, Placopecten magellanicus, on microalgal diets,
with emphasis on the nutritional role of lipids and fatty acids.
Aquaculture, 23, 293–317.
Moriguchi, T., Greiner, R.S. & Salem, N. (2000) Behavioral deficits
associated with dietary induction of decreased brain docosahex-
aenoic acid concentration. J. Neurochem., 75, 2563–2573.
Morrison, W.R. & Smith, L.M. (1964) Preparation of fatty acid
methyl esters and dimethylacetals from lipids with boron fluoride
methanol. J. Lipid Res., 5, 600–608.
O’Brien MacDonald, K., Brown, J.A. & Parrish, C.C. (2006) In-
tegrating growth, behaviour, and digestive enzymes activity in
larval Atlantic cod (Gadus morhua): response to rotifer lipids.
ICES J. Mar. Sci., 63, 275–284.
Olsen, Y., van der Meeren, T. & Reitan, K.Y. (2004) First feeding
technology. In: Culture of Cold-water Marine Fish (Moksness, E.,
Kjørsvik, E. & Olsen, Y. eds), pp. 291–336. Backwell Publishing
Ltd, Oxford.
Palmtag, M.R., Faulk, C.K. & Holt, G.J. (2006) Highly unsaturated
fatty acid composition of rotifers (Brachionus plicatilis) and Arte-
mia fed various enrichments. J. World Aquac. Soc., 37, 126–131.
Park, H.G., Puvanendran, V., Kellett, A., Parrish, C.C. & Brown,
J.A. (2006) Effect of enriched rotifers on growth, survival, and
composition of larval Atlantic cod (Gadus morhua). ICES J. Mar.
Sci., 63, 285–295.
Parrish, C.C. (1987) Separation of aquatic lipid classes by Chroma-
rod thin-layer chromatography with measurement by Iatroscan
flame ionization detection. Can. J. Fish. Aquat. Sci., 44, 722–731.
Parrish, C.C. (1998) Determination of total lipids, lipid classes and
fatty acids in aquatic samples. In: Lipids in Freshwater Ecosystems
(Arts, M.T. & Wainman, B.C. eds), pp. 4–12. Springer-Verlang,
New York.
Parrish, C.C., Whiticar, M. & Puvanendran, V. (2007) Is x6 do-
cosapentaenoic acid an essential fatty acid during early ontogeny
in marine fauna? Limnol. Oceanogr. 52, 476–479.
Pernet, F., Bricelj, V.M. & Parrish, C.C. (2005) Effect of varying
dietary levels of x6 polyunsaturated fatty acids during the early
ontogeny of the sea scallop, Placopecten magellanicus. J. Exp.
Mar. Biol. Ecol., 327, 115–133.
Rainuzzo, J.R., Olsen, Y. & Rosenlund, G. (1989) The effect of
enrichment diets on the fatty acid composition of the rotifer
Brachionus plicatilis. Aquaculture, 79, 157–161.
Rainuzzo, J.R., Reitan, K.I., Jorgensen, L. & Olsen, Y. (1994)
Lipid composition in turbot larvae fed live feed cultured by
emulsions of different lipid classes. Comp. Biochem. Physiol., 107A,
699–710.
Rodrıguez, C., Perez, J.A., Izquierdo, M.S., Cejas, J.R., Bolanos, A.
& Lorenzo, A. (1996) Improvement of the nutritional value of
rotifers by varying the type and concentration of oil and the
enrichment period. Aquaculture, 147, 93–105.
Rodrıguez, C., Perez, J.A., Diaz, M., Izquierdo, M.S., Fernadez-
Palacios, H. & Lorenzo, A. (1997) Influence of EPA/DHA ratio in
rotifers on gilthead seabream (Sparus aurata) larval development.
Aquaculture, 150, 77–89.
Sargent, J.R., Parkes, R.J., Muller-Harvey, I., Henderson, R.J.
(1987) Lipid biomarkers in marine ecology. In: Microbes in the Sea
(Sleigh, M.A. ed.), pp. 119–138. Halsted Press, Chichester; Ellis
Horwood, New York.
Sargent, J., Bell, G., McEvoy, L., Tocher, D. & Estevez, A. (1999a)
Recent developments in the essential fatty acid nutrition of fish.
Aquaculture, 177, 191–199.
Sargent, J., McEvoy, L., Estevez, A., Bell, G., Bell, M., Henderson,
J. & Tocher, D. (1999b) Lipid nutrition of marine fish during early
development: status and future direction. Aquaculture, 179, 217–
229.
Sargent, J.R., Tocher, D.R. & Bell, J.G. (2002) The lipids. In: Fish
Nutrition, 3rd edn (Halver, J.E. ed.), pp. 181–257. Academic Press,
San Diego.
Simopoulos, A.P. (2002) Omega-3 fatty acids in inflammation and
autoimmune diseases. J. Am. Coll. Nutr., 21, 495–505.
Sorgeloos, P., Dhert, P. & Candreva, P. (2001) Use of the brine
shrimp, Artemia spp., in marine fish larviculture. Aquaculture, 200,
147–159.
Sundby, S. (2000) Recruitment of Atlantic cod stocks in relation to
temperature and advection of copepod populations. Sarsia, 85,
277–298.
Tackaert, W., Camara, M. R. & Sorgeloos, P. (1991) The effect of
dietary phosphatidylcholine in postlarval penaeid shrimp: I. Diet
preparation. In: Larvi� 91: Fish and Crustacean Larviculture
Symposium (Lavens, P., Sorgeloos, P., Jaspers, E., Olkvier, F.
eds.), August 27–30, Gent, Belgium, pp. 76–79. European Aqua-
culture Society, Gent, Belgium.
Tocher, D.R. (2003) Metabolism and function of lipids and fatty
acids in teleost fish. Rev. Fish. Sci., 11, 107–184.
Tocher, D.R. & Sargent, J.R. (1984) Analysis of lipids and fatty acids
in ripe roes of some northwest European marine fish. Lipids, 19,
492–499.
A. S. Garcia et al.
. . . . . . . . . . . . . . . . . . . . . . . . . . . . . . . . . . . . . . . . . . . . . . . . . . . . . . . . . . . . . . . . . . . . . . . . . . . . . . . . . . . . . . . . . . . . . .
� 2008 Blackwell Publishing Ltd Aquaculture Nutrition 14; 14–30
30