A comparative study on physico-chemical characteristics ...
13
www.pelagiaresearchlibrary.com t Available online a Pelagia Research Library European Journal of Experimental Biology, 2015, 5(5):85-97 ISSN: 2248 –9215 CODEN (USA): EJEBAU 85 Pelagia Research Library A comparative study on physico-chemical characteristics and Zooplankton diversities between natural and man-made Wetlands at Cooch Behar, West Bengal, India Supratim Pal 1* , Debashis Das 2 and Kaushik Chakraborty 1 1 Department of Zoology, University of Gour Banga, Mokdumpur, Malda, West Bengal 2 Department of Zoology, Tufanganj Mahavidyalaya, Tufanganj, West Bengal _____________________________________________________________________________________________ ABSTRACT Plankton diversity and physico-chemical parameters are important criterion for evaluating the suitability of aquatic health. A comparative study on zooplankton diversity in relation to physico-chemical parameters of two selected wetlands [one natural (NWL) and one man-made (MWL) respectively] was studied at Cooch Behar district of West Bengal. In gross nine physical and chemical parameters and fifteen types of zooplankton species were noted. Study reveals that the physico-chemical characteristics like conductivity (424μS/cm in NWL and 243μS/cm in MWL respectively), total hardness (204mg/lit in NWL and 108mg/lit in MWL respectively), total dissolved solids (211ppm in NWL and 121ppm in MWL respectively), dissolved oxygen (9.63mg/lit in NWL and 8.30mg/lit in MWL respectively) and iron concentration (1.18mg/lit in NWL and 0.79mg/lit in MWL respectively) are higher in natural wetland (Panishala Beel) but pH value (6.8 in NWL and 7.4 in MWL respectively), total suspended solids (5.64NTU in NWL and 24.5NTU in MWL respectively) and chloride concentration (63.9mg/lit in NWL and 70.0mg/lit in MWL respectively) are higher in the man-made wetland (Mali dighi). Study reveals the existence of both high species diversity and numerical abundance of zooplankton population in natural wetland in comparison to man-made wetland. But contrary to this, the density of zooplankton in man-made wetland is comparatively higher in comparison to natural wetland. Observation on the gross physico-chemical parameters on both the aquatic source indicates good water quality. However, lesser zooplankton diversity in man-made wetland is probably due to the short time of species succession following its excavation. Key words: Zooplankton, Water quality, Diversity, Correlation matrix. _____________________________________________________________________________________________ INTRODUCTION Water bodies are considered as the most productive ecosystems as they constitute huge floral as well as faunal diversities [1]. It also plays a very important role in socio-economic condition of the concerned region as it is used for fish culture at commercial level [2]. Wetlands being one of the most productive ecosystems are crucial for biodiversity conservation [3]. Richness of wetlands depends on its plankton community because they are placed on the base of the food pyramid [4]. Zooplanktons play an integral role and may serve as bio-indicator and it is a well-suited tool for understanding water pollution status [5, 6, 7, 8]. Zooplanktons are one of the most important biotic components influencing all the functional aspects of an aquatic ecosystem, such as food chains, food webs, energy flow and cycling of matter [9, 10, 11, 12].
Transcript of A comparative study on physico-chemical characteristics ...

www.pelagiaresearchlibrary.comt Available online a
Pelagia Research Library
European Journal of Experimental Biology, 2015, 5(5):85-97
ISSN: 2248 –9215
CODEN (USA): EJEBAU
85 Pelagia Research Library
A comparative study on physico-chemical characteristics and Zooplankton diversities between natural and man-made Wetlands
at Cooch Behar, West Bengal, India
Supratim Pal1*, Debashis Das2 and Kaushik Chakraborty1
1Department of Zoology, University of Gour Banga, Mokdumpur, Malda, West Bengal
2Department of Zoology, Tufanganj Mahavidyalaya, Tufanganj, West Bengal _____________________________________________________________________________________________
ABSTRACT Plankton diversity and physico-chemical parameters are important criterion for evaluating the suitability of aquatic health. A comparative study on zooplankton diversity in relation to physico-chemical parameters of two selected wetlands [one natural (NWL) and one man-made (MWL) respectively] was studied at Cooch Behar district of West Bengal. In gross nine physical and chemical parameters and fifteen types of zooplankton species were noted. Study reveals that the physico-chemical characteristics like conductivity (424µS/cm in NWL and 243µS/cm in MWL respectively), total hardness (204mg/lit in NWL and 108mg/lit in MWL respectively), total dissolved solids (211ppm in NWL and 121ppm in MWL respectively), dissolved oxygen (9.63mg/lit in NWL and 8.30mg/lit in MWL respectively) and iron concentration (1.18mg/lit in NWL and 0.79mg/lit in MWL respectively) are higher in natural wetland (Panishala Beel) but pH value (6.8 in NWL and 7.4 in MWL respectively), total suspended solids (5.64NTU in NWL and 24.5NTU in MWL respectively) and chloride concentration (63.9mg/lit in NWL and 70.0mg/lit in MWL respectively) are higher in the man-made wetland (Mali dighi). Study reveals the existence of both high species diversity and numerical abundance of zooplankton population in natural wetland in comparison to man-made wetland. But contrary to this, the density of zooplankton in man-made wetland is comparatively higher in comparison to natural wetland. Observation on the gross physico-chemical parameters on both the aquatic source indicates good water quality. However, lesser zooplankton diversity in man-made wetland is probably due to the short time of species succession following its excavation. Key words: Zooplankton, Water quality, Diversity, Correlation matrix. _____________________________________________________________________________________________
INTRODUCTION
Water bodies are considered as the most productive ecosystems as they constitute huge floral as well as faunal diversities [1]. It also plays a very important role in socio-economic condition of the concerned region as it is used for fish culture at commercial level [2]. Wetlands being one of the most productive ecosystems are crucial for biodiversity conservation [3]. Richness of wetlands depends on its plankton community because they are placed on the base of the food pyramid [4]. Zooplanktons play an integral role and may serve as bio-indicator and it is a well-suited tool for understanding water pollution status [5, 6, 7, 8]. Zooplanktons are one of the most important biotic components influencing all the functional aspects of an aquatic ecosystem, such as food chains, food webs, energy flow and cycling of matter [9, 10, 11, 12].

Supratim Pal et al Euro. J. Exp. Bio., 2015, 5(5):85-97 _____________________________________________________________________________
86 Pelagia Research Library
The distribution of zooplankton community depends on complex factors such as, change of climatic conditions, physical and chemical parameters and vegetation cover [13, 14, 15, 16]. The abundance of zooplanktons depends, in gross, on the phytoplankton, aquatic microphytes and macrophytes [17]. The distribution and diversity of zooplankton in aquatic ecosystem are mostly guided by the limnological properties of water [18, 19, 20, 21]. The fishes constitute the higher trophic level of the wetland ecosystem and consume predominantly the aquatic arthropods and zooplanktons [22]. The district Cooch Behar, West Bengal, endeavours a large number of water bodies including natural as well as man-made water bodies. The ecosystem of these two types of wetlands varies in nature, diversity and productivity as well. Keeping in view the importance of such wetlands the present work has been undertaken to assess the physico-chemical quality of water and zooplankton diversity of two wetlands of Cooch Behar District of West Bengal.
Fig. 1: Location of Study sites. 1a. Map of Cooch Behar. 1b.: Descriptive view of study area. 1c.: Satellite imagery of NWL (Panishala Beel). 1d.: Satellite imagery of MWL (Mali dighi)
MATERIALS AND METHODS
Geographic location (Fig.1): The district of Cooch Behar is geographically a part of the Himalayan Terai of West Bengal, India. It lies between the parallels of 25° 57´ 56″ and 26° 32´ 46″ North latitude and the longitude of the eastern most point which beings 89° 52´ 00″ East and the longitude of the western most point beings 88° 45´02″ East. The Panishala Beel (NWL) is a natural wetland and is an offshoot from river Torsa which in course of time had been disconnected from the river and persists as an impounding water body, presently known as ‘beel’. This site is named “Panishala Beel” (Fig.1c.) and is situated under the administrative jurisdiction of Panishala gram panchayet of the district. This study site (26o 27´ 89´´ N, 89o 52´ 53´´ E) is situated adjacent to the Dinhata subdivision of Cooch Behar district and is 12 kilometres away from Cooch Behar town. It is a natural wetland and thus embodies a

Supratim Pal et al Euro. J. Exp. Bio., 2015, 5(5):85-97 _____________________________________________________________________________
87 Pelagia Research Library
huge geographical and ecological importance. It receives run-off water from the adjacent land area and at present is mainly used for pisciculture. The Mali dighi (MWL) is a man-made wetland situated in the Cooch Behar town. This study site (26º31´21´´ N, 89º44´82´´ E) is situated beside the state highway-12A named Dinhata Road (Fig.1d.). It also receives run-off water from the adjacent land area and at present is mainly used for pisciculture. The Panishala Beel and Mali dighi are separated from each other by an aerial distance of about 11 km. For physical and chemical analysis of water: A. Sample collection: Surface water samples for physico-chemical analysis were collected from the selected locations by dipping well labelled sterilized plastic/glass containers of 250 ml to about 6-10 cm below the surface film. B. Mode of study: The physico-chemical characteristics of water like pH (pH units), conductivity (µS/cm), total hardness (mg/lit), total dissolved solid (ppm), turbidity (NTU), temperature (Celsius), dissolved oxygen (mg/lit), iron concentration (mg/lit) and chloride concentration (mg/lit) of NWL and MWL sample site was assessed following the standard method [23] and with the help of analytical instrument (Table 1). C. Application protocol: a) For pH estimation: pH was estimated with the help of Hanna portable pH meter (HI 98128) by dipping it into the water sample after calibration. b) For Conductivity estimation: Conductivity was estimated by using conductivity meter made by Eutech. c) For total hardness estimation: Total hardness of the water samples was estimated by following the conventional titration method [23]. d) For TDS estimation: TDS value of the collected water samples was estimated by using HM Digitals Aqua Pro digital water tester (Model AP-1). e) For turbidity estimation: Turbidity or Total Suspended Solids (TSS) of the water samples was estimated by using the Turbidity meter made by Eutech. f) For temperature estimation: The surface water temperature of the water bodies was measured by using the Hanna portable Temperature meter (HI 98128). g) For dissolved Oxygen (DO) estimation: For the estimation of Dissolved Oxygen (DO) of the collected water samples, the portable digital DO meter of Electronic India Pvt. Ltd. was used. h) For Iron concentration estimation: For the estimation of Iron concentration in the water samples, all the irons are reduced to iron (Fe++) ions firstly. Then in a thio-glycolate buffered medium these iron (Fe++) ions react with a tri-azine derivative to form a red-violet complex. Then the concentration of the red-violet complex was determined photometrically to estimate the iron concentration [23]. i) For Chloride concentration estimation: For the estimation of Chloride concentration in the water samples, at first, all the chloride ions were reacted with mercury-thio-cyanate to form slightly dissociated mercury-chloride. The thio-cyanate released in the process, in turn, reacts with iron (Fe+++) ions to form red iron-thio-cyanate. Then the concentration of the red iron-thio-cyanate was determined photometrically to determine the chloride concentration [23]. Table 1: Water parameters considered, methods followed, instruments used, units of observation and reference zone for each parameters
during the experimentation
Parameters Method followed/instrument used Unit of observation
Reference zone
pH Hanna portable HI 98128 water proof pH meter pH units 6.5 – 8.5 Conductivity Conductivity meter; made by Eutech. µS/cm ≤ 1000 Total hardness Conventional titration method. mg/lit --
Total Dissolved Solid (TDS) HM Digitals Aqua Pro digital water tester (Model AP-1). Parts per
million (ppm) ≤ 500
Turbidity Turbidity meter ; made by Eutech. Nephelometric
Turbidity Unit (NTU).
--
Temperature Hanna portable HI 98128 water proof Temperature meter Celsius (°C) -- Dissolved oxygen(DO) Portable digital DO meter, Electronic India Pvt. Ltd. mg/lit ≥ 6.0
Iron All irons were reacted to form a red-violet complex and this complex was determined photometrically.
mg/lit 0.3
Chloride Chloride ions were reacted to create a red coloured complex which was determined photometrically.
mg/lit ≤ 250
N.B.: (--): not indicated.
For zooplankton study: A. Sample collection: Zooplankton samples were collected from the study sites by filtering 50 litres of the subsurface source water through a fine nylon mesh attached to a conical zooplankton net. The content collected in

Supratim Pal et al Euro. J. Exp. Bio., 2015, 5(5):85-97 _____________________________________________________________________________
88 Pelagia Research Library
the plankton tube which was attached to the lower end of the net and the content was then transferred to separate polyethylene tubes. After sedimentation, a subsample of 30ml was taken. Thus the collected zooplankton organisms were preserved in 4% formalin solution and subsequently 4-5 drops of glycerine were added to the samples to ensure good preservation. B. Mode of study: a) Quantitative estimation: For quantitative study, the zooplankton count was done by Sedgwick rafter cell counter placed under the microscope. b) Photography of zooplanktons: Zooplanktons were observed with a binocular compound microscope (Olympus, Model No. CH20i) and subsequently, the photography were done with the help of a camera. c) Systematic identification: Systematic identification of collected zooplanktons was done after following the guideline as given by Edmondson [24] and the references of several workers like Adoni [25], Needham et al. [26], Pennak [27], Dhanapathi [28], Reddy [29], Michel et al. [30] and Victor et al. [31]. For statistical analysis: The pooled data that was obtained is analysed by INDOSTAT-ANOVA and by PAST, XLSTAT software analytical programme. A. Correlation: a) Linear correlation analysis: The purpose of a Linear correlation analysis is to determine whether there is a relationship between two sets of variables. We used it to find a positive correlation or a negative correlation or there is no correlation. b) Spearman’s D: The Spearman's D Rank Correlation Coefficient is used to discover the strength of a link between two sets of data. c) Spearman’s rs : Spearman's rank correlation coefficient is measured to show the statistical dependence between two variables. It assesses how well the relationship between two variables. d) Kendall’s tau: The Kendall rank correlation coefficient, commonly referred to as Kendall's tau (τ) coefficient, is a statistic used here to measure the association between two measured quantities. A tau test is a non-parametric hypothesis test for statistical dependence based on the tau coefficient. e) Variance-covariance: Variance-covariance analysis is done to measure the variability or spread in a set of data and the extent to which corresponding elements from two sets of ordered data move in same direction. B. Diagram: a) Bar: For our study, bar diagrams are used to provide a visual presentation with rectangular bars with lengths proportional to the values that they represent. b) Pie: The pie chart is a circular statistical graphic representation, which is divided into slices to illustrate numerical proportions.
RESULTS AND DISCUSSION
Assessment on the physico-chemical analysis and zooplankton diversity of two selected wetlands (NWL and MWL) was carried out at Cooch Behar district of West Bengal. The results are delineated below. Observation on the analysis of the physical and chemical characteristics: A. In consideration of the relative value (Table 2 and Fig.2): pH of water at NWL is slight acidic (6.80) while that of at MWL is slight alkaline (7.40). As pH levels of both the sites of observation are within the reference limits, it is safe to the aquatic life. The conductivity of water is 424 µS/cm at NWL and 243 µS/cm at MWL respectively. Hardness of water is basically caused by the elements like calcium, magnesium, sodium and occasionally by iron, aluminium and potassium. Hardness of water at NWL is 204 mg/lit while that of at MWL is 108 mg/lit. Result shows that TDS value is higher at NWL (211 ppm) than MWL (121 ppm). Both the results of pH and conductivity show positive correlation with TDS values. Turbidity in consideration of total suspended solids (TSS) is high at MWL (24.5 NTU) than NWL (5.64 NTU). Surface water temperature at NWL was 18.60C and at MWL was 20.30C. Dissolved oxygen (DO) is higher at NWL (9.63 mg/lit) than at MWL (8.30 mg/lit). Chloride ion is one of the more abundant anions found in waste water and is a good indicator of pollution sources. Chloride content is higher at MWL (70.00 mg/lit.) than at NWL (63.90 mg/lit.) and it shows positive correlation with pH values. Iron concentration has direct relation with zooplankton diversity. Present study reveals that both the wetlands have high iron concentration from reference values. Out of the two water sources iron concentration is high at NWL (1.18 mg/lit.) than at MWL (0.79 mg/lit.). Different physico-chemical parameters of NWL and MWL are also represented in web pattern (Fig.2).
Supratim Pal et al Euro. J. Exp. Bio., 2015, 5(5):85-97 _____________________________________________________________________________
89 Pelagia Research Library
Table 2: Comparative analytical results of physical and chemical characteristics of NWL and MWL
Characteristics Units Observations
OBS1 OBS2 OBS3 Average NWL MWL NWL MWL NWL MWL NWL MWL
pH pH units 7.0 7.4 6.5 7.3 6.9 7.5 6.80 7.4 Conductivity µS/cm 426 252 418 242 428 235 424 243 TH mg/lit. 203 112 205 104 206 108 204 108 TDS ppm 208 125 210 119 215 119 211 121 TSS NTU 5.08 26.5 6.00 23.0 5.84 24.0 5.64 24.5 Temp. Celsius 18.0 18.6 18.8 20.5 19.0 21.8 18.6 20.3 DO mg/lit. 9.10 8.50 9.06 8.0 9.73 8.40 9.63 8.30 Iron mg/lit. 1.13 0.83 1.20 0.76 1.21 0.78 1.18 0.79 Chloride mg/lit. 64.1 74.0 64.2 67.0 63.4 69.0 63.9 70.0
N.B.: T.H.-Total Hardness, TDS-Total Dissolved Solids, TSS-Total Suspended Solids, Temp.-Temperature, DO-Dissolved Oxygen, OBS-Observation number.
Fig.2: Representation of different physico-chemical factors in two types wetland (NWL and MWL) in web pattern in hue angel
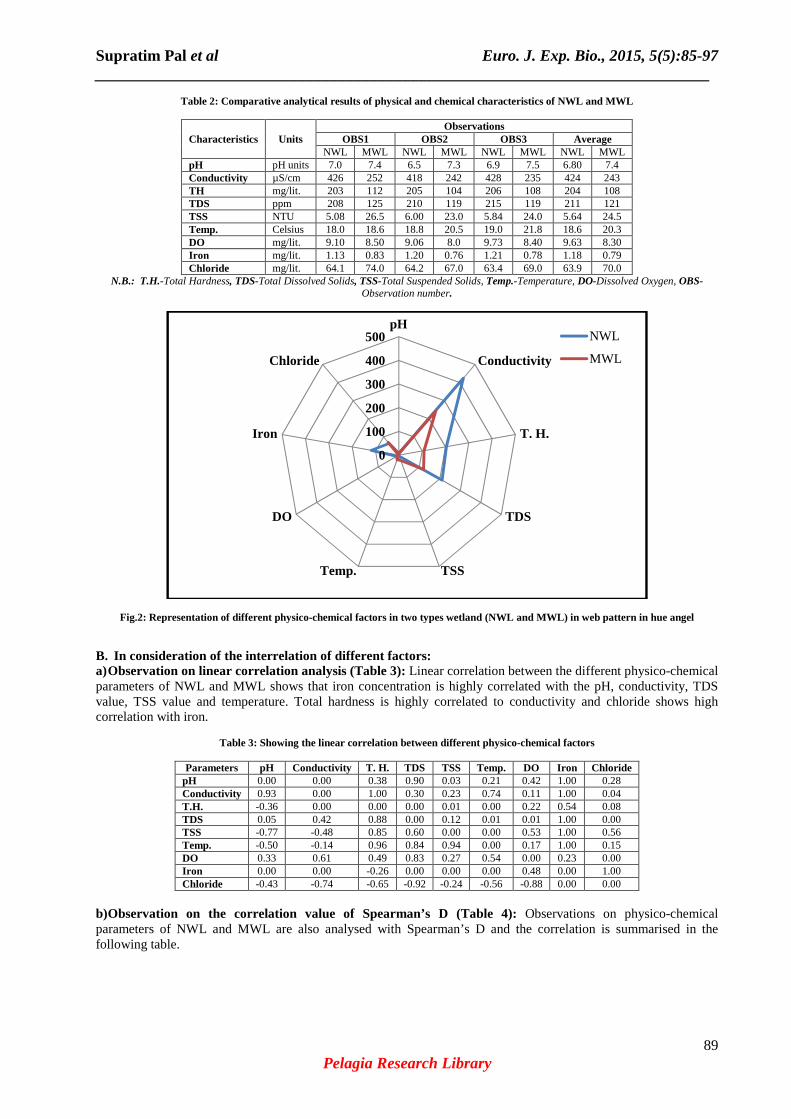
B. In consideration of the interrelation of different factors: a) Observation on linear correlation analysis (Table 3): Linear correlation between the different physico-chemical parameters of NWL and MWL shows that iron concentration is highly correlated with the pH, conductivity, TDS value, TSS value and temperature. Total hardness is highly correlated to conductivity and chloride shows high correlation with iron.
Table 3: Showing the linear correlation between different physico-chemical factors
Parameters pH Conductivity T. H. TDS TSS Temp. DO Iron Chloride
pH 0.00 0.00 0.38 0.90 0.03 0.21 0.42 1.00 0.28 Conductivity 0.93 0.00 1.00 0.30 0.23 0.74 0.11 1.00 0.04 T.H. -0.36 0.00 0.00 0.00 0.01 0.00 0.22 0.54 0.08 TDS 0.05 0.42 0.88 0.00 0.12 0.01 0.01 1.00 0.00 TSS -0.77 -0.48 0.85 0.60 0.00 0.00 0.53 1.00 0.56 Temp. -0.50 -0.14 0.96 0.84 0.94 0.00 0.17 1.00 0.15 DO 0.33 0.61 0.49 0.83 0.27 0.54 0.00 0.23 0.00 Iron 0.00 0.00 -0.26 0.00 0.00 0.00 0.48 0.00 1.00 Chloride -0.43 -0.74 -0.65 -0.92 -0.24 -0.56 -0.88 0.00 0.00
b) Observation on the correlation value of Spearman’s D (Table 4): Observations on physico-chemical parameters of NWL and MWL are also analysed with Spearman’s D and the correlation is summarised in the following table.
0
100
200
300
400
500pH
Conductivity
T. H.
TDS
TSSTemp.
DO
Iron
Chloride
NWL
MWL

Supratim Pal et al Euro. J. Exp. Bio., 2015, 5(5):85-97 _____________________________________________________________________________
90 Pelagia Research Library
Table 4: Showing the correlation value of Spearman’s D between NWL and MWL
Parameters pH Conductivity T.H. TDS TSS Temp. DO Iron Chloride pH 0.00 0.03 0.29 0.60 0.03 0.29 0.29 0.29 0.29 Conductivity 16.00 0.00 0.60 0.29 0.29 0.60 0.03 1.00 0.03 T.H. 112.00 64.00 0.00 0.03 0.03 0.01 0.29 0.29 0.29 TDS 96.00 48.00 16.00 0.00 0.29 0.03 0.03 0.03 0.03 TSS 144.00 112.00 16.00 48.00 0.00 0.03 0.60 0.60 0.60 Temp. 112.00 64.00 0.00 16.00 16.00 0.00 0.29 0.29 0.29 DO 48.00 16.00 48.00 16.00 96.00 48.00 0.00 0.11 0.01 Iron 112.00 80.00 48.00 16.00 64.00 48.00 32.00 0.00 0.11 Chloride 112.00 144.00 112.00 144.00 64.00 112.00 160.00 128.00 0.00
c) Observation on correlation value of Spearman’s rs (Table 5): Observations on physico-chemical parameters of NWL and MWL are also analysed with Spearman’s rs and the correlation is summarised in the following table. Results show that the values are partially elliptical.
Table 5: Showing the correlation value of Spearman’s rs between NWL and MWL
Parameters pH Conductivity T.H. TDS TSS Temp. DO Iron Chloride
pH 0.00 0.04 0.38 0.72 0.04 0.38 0.38 0.38 0.38 Conductivity 0.80 0.00 0.72 0.38 0.38 0.72 0.04 1.00 0.04 T.H. -0.40 0.20 0.00 0.04 0.04 0.00 0.38 0.38 0.38 TDS -0.20 0.40 0.80 0.00 0.38 0.04 0.04 0.04 0.04 TSS -0.80 -0.40 0.80 0.40 0.00 0.04 0.72 0.72 0.72 Temp. -0.40 0.20 1.00 0.80 0.80 0.00 0.38 0.38 0.38 DO 0.40 0.80 0.40 0.80 -0.20 0.40 0.00 0.17 0.00 Iron -0.40 0.00 0.40 0.80 0.20 0.40 0.60 0.00 0.17 Chloride -0.40 -0.80 -0.40 -0.80 0.20 -0.40 -1.00 -0.60 0.00
d) Observation on the correlation analysis with Kendal’s tau (Table 6): Observations on physico-chemical parameters of NWL and MWL are also analysed with Kendall’s tau and the correlation is summarised in the following table. Results show that conductivity is highly correlated with total hardness, temperature and iron concentration like pH with TDS whereas chloride concentration is negatively correlated with DO.
Table 6: The correlation analysis with Kendall’s tau between NWL and MWL
Parameters pH Conductivity T.H. TDS TSS Temp. DO Iron Chloride
pH 0.00 0.02 0.25 1.00 0.02 0.25 0.25 0.25 0.25 Conductivity 0.67 0.00 1.00 0.25 0.25 1.00 0.02 1.00 0.02 T.H. -0.33 0.00 0.00 0.02 0.02 0.00 0.25 0.25 0.25 TDS 0.00 0.33 0.67 0.00 0.25 0.02 0.02 0.02 0.02 TSS -0.67 -0.33 0.67 0.33 0.00 0.02 1.00 1.00 1.00 Temp. -0.33 0.00 1.00 0.67 0.67 0.00 0.25 0.25 0.25 DO 0.33 0.67 0.33 0.67 0.00 0.33 0.00 0.25 0.00 Iron -0.33 0.00 0.33 0.67 0.00 0.33 0.33 0.00 0.25 Chloride -0.33 -0.67 -0.33 -0.67 0.00 -0.33 -1.00 -0.33 0.00
e) Observation on the correlation analysis with variance-covariance (Table 7): Observations on physico-chemical parameters of NWL and MWL are also analysed with variance-covariance and the correlation is summarised in the following table.
Table 7: The correlation analysis with Variance-Covariance between NWL and MWL
Parameters pH Conductivity T.H. TDS TSS Temp. DO Iron Chloride pH 0.04 0.74 -0.09 0.03 -0.06 -0.04 0.02 0.00 -0.03 Conductivity 0.74 16.00 0.00 4.57 -0.71 -0.23 0.79 -0.03 -0.97 T.H. -0.09 0.00 1.43 2.86 0.38 0.46 0.19 -16.65 -0.26 TDS 0.03 4.57 2.86 7.43 0.61 0.91 0.73 0.07 -0.83 TSS -0.06 -0.71 0.38 0.61 0.14 0.14 0.03 0.01 -0.03 Temp. -0.04 -0.23 0.46 0.91 0.14 0.16 0.07 0.01 -0.07 DO 0.02 0.79 0.19 0.73 0.03 0.07 0.10 8.35 -0.09 Iron 0.00 -0.03 -16.65 0.07 0.01 0.01 8.35 2924.30 -0.01 Chloride -0.03 -0.97 -0.26 -0.83 -0.03 -0.07 -0.09 -0.01 0.11
f) Observation on Tukey Kramer multiple comparison test (Table 8): Observations on physico-chemical parameters of NWL and MWL are also analysed with Tukey Kramer multiple comparison test and the observation is

Supratim Pal et al Euro. J. Exp. Bio., 2015, 5(5):85-97 _____________________________________________________________________________
91 Pelagia Research Library
summarised in the following table. This is to mention that if the value of “q” is greater, then “p” value is less than 0.05.
Table 8: Comparison with Tukey Kramer multiple comparison test between NWL and MWL
Comparison Mean Difference q value p value pH vs Conductivity -417.28 65.192 ***p<0.001 pH vs TH -197.78 30.899 ***p<0.001 pH vs TDS value -204.28 31.915 ***p<0.001 pH vs TSS value 1.085 0.1695 ns p>0.05 pH vs Temprature -11.875 1.855 ns p>0.05 pH vs DO -2.655 0.414 ns p>0.05 pH vs Iron conc. -23.66 3.696 ns p>0.05 pH vs Chloride conc. -57.175 8.933 ***p<0.001 Conductivity vs TH 219.5 34.293 ***p<0.001 Conductivity vs TDS value 213 33.278 ***p<0.001 Conductivity vs TSS value 418.36 65.362 ***p<0.001 Conductivity vs Temprature 405.4 63.337 ***p<0.001 Conductivity vs DO 414.62 64.777 ***p<0.001 Conductivity vs Iron conc. 393.62 61.496 ***p<0.001 Conductivity vs Chloride conc. 360.1 56.26 ***p<0.001 T.H. vs TDS value -6.5 1.016 ns p>0.05 T.H. vs TSS value 198.86 31.069 ***p<0.001
N.B.: “***”= significant, “ns”= not significant. g) Observation on principal component analysis (PCA) (Fig.3): Observations on physico-chemical parameters of NWL and MWL are also analysed with PCA and the results of PCA analysis are summarised graphically in the following figures. By analysing the PCA it is observed that TSS and TDS are present in different groups and chloride is far from most of other components. It is also observed that conductivity and pH are the related component in our study.

Supratim Pal et al Euro. J. Exp. Bio., 2015, 5(5):85-97 _____________________________________________________________________________
92 Pelagia Research Library
Fig.3(a-g): Principal component analysis (PCA) between the physico-chemical parameters

Supratim Pal et al Euro. J. Exp. Bio., 2015, 5(5):85-97 _____________________________________________________________________________
93 Pelagia Research Library
Observation on the zooplankton: A. In relation to the major zooplankton species (Fig.4, 5 and 6): Fifteen types of Zooplanktons were primarily identified from the water sample of NWL. Out of those, two are crustacean larvae (Nauplius sp. and Zoea sp.), five are Cladocerans (Moina sp., Chydorus sp., Diphanosoma sp., Alona sp. and Daphnia sp.), four are Copepods (Cyclops sp., Heliodiaptomus sp., Tropocyclops sp. and Mesocyclops sp.), one is Ostracod (Cypris sp.) and the remaining three are Rotiferans (Brachionus sp., Keratella sp. and Lacane sp.). In the water sample of MWL, four types of zooplanktons were primarily identified. All of identified species of MWL are in adult form and all of the species belong to the order-Copepoda (Cyclops sp., Heliodiaptomus sp., Tropocyclops sp. and Mesocyclops sp.). So, the MWL sample shows copepod dominance. Different types of zooplanktons in two types of wetland (NWL and MWL) are also represented in web pattern (Fig.5).
B.
.
Fig.4: Representation of zooplankton out of the total abundance in two types of wetlands (NWL and MWL)
Fig.5: Representation of different types of zooplankton in two type of wetland (NWL and MWL) in web pattern in hue angel
0
10
20
30
40
50
60
70
MWL
NWL
010203040506070
Nauplius
Zoea
Moina
Chydorus
Diphanosoma
Alona
Daphnia
CyclopsHeliodiaptomus
Tropocyclops
Mesocyclops
Cypris
Brachionus
Keratella
Lacane
NWL
MWL

Supratim Pal et al Euro. J. Exp. Bio., 2015, 5(5):85-97 _____________________________________________________________________________
94 Pelagia Research Library
Fig. 6(a-f): Photographs of some collected zooplankton species
C. In relation to diversity: Fifteen types of zooplanktons were primarily identified from the water sample of NWL. Whereas, in the water sample of MWL, only four types of zooplanktons were primarily identified. NWL sample contains two crustacean larvae, five Cladocera species, four Copepod species, one Ostracod species and three Rotifer species. Whereas MWL sample contains only four Copepod species. So, NWL shows higher species diversity than MWL. D. In relation to zooplankton density: Zooplankton count shows that the approximate zooplankton density at NWL is 240000 zooplanktons per litre while that of MWL is 840000 zooplanktons per litre at the surface water. So, the MWL shows higher zooplankton density.
Table-8: List of zooplanktons with their relative abundance value
Phylum and Subphylum
Class with Order
Stages of the life cycle Identified Species
Presence or Absence
Relative abundance (%)
S1 S2 S1 S2
Arthropoda Crustacea
Branchiopoda Cladocera
L Nauplius sp. + - 1.64 .. L Zoea sp. + - 1.62 .. A Moina sp. + - 3.28 .. A Chydorus sp. + - 6.56 .. A Diphanosoma sp. + - 4.92 .. A Alona sp. + - 3.27 .. A Daphnia sp. + - 9.84 ..
Maxillopoda Copepoda
A Cyclops sp. + + 6.56 62.5 A Heliodiaptomus sp. + + 8.20 12.0 A Tropocyclops sp. + + 8.20 20.5 A Mesocyclops sp. + + 3.28 5.00
Ostracoda A Cypris sp. + - 3.28 ..
Rotifera A Brachionus sp. + - 29.51 .. A Keratella sp. + - 6.56 ..
A Lacane sp. + - 3.28 .. N.B.: L= Larva, A= Adult, “+”= Present, “-”= Absent, “..”= insignificant
Supratim Pal et al Euro. J. Exp. Bio., 2015, 5(5):85-97 _____________________________________________________________________________
95 Pelagia Research Library
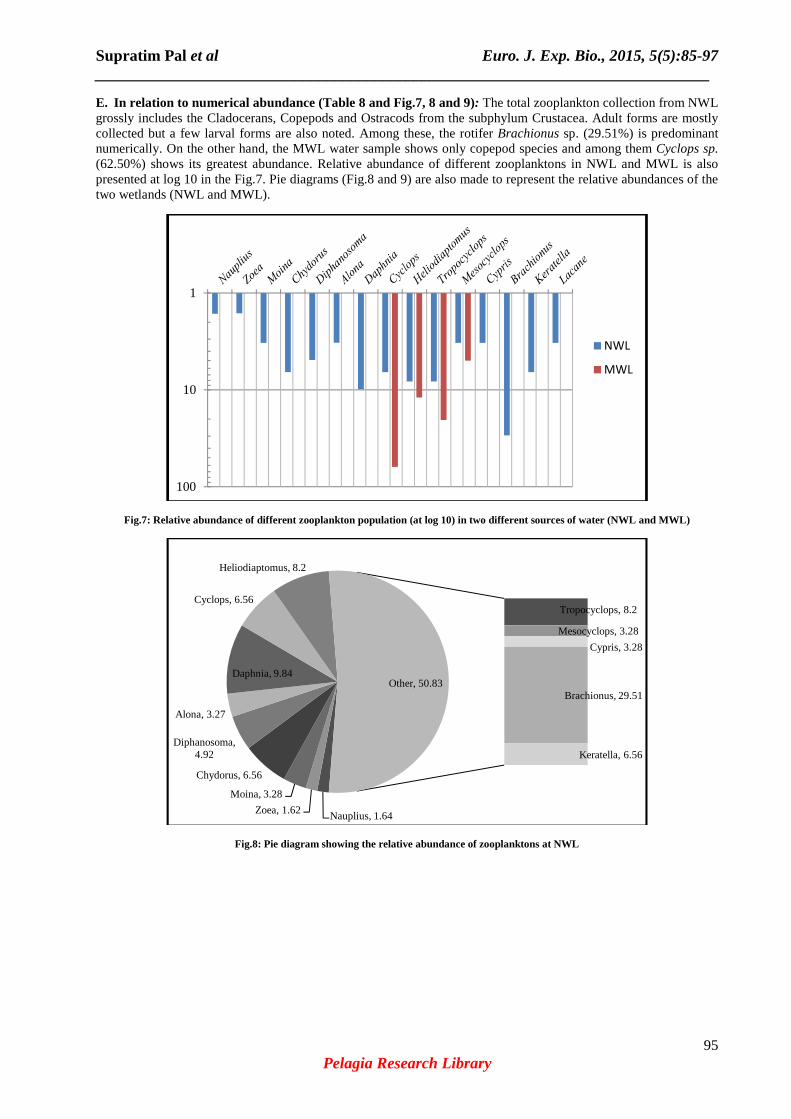
E. In relation to numerical abundance (Table 8 and Fig.7, 8 and 9): The total zooplankton collection from NWL grossly includes the Cladocerans, Copepods and Ostracods from the subphylum Crustacea. Adult forms are mostly collected but a few larval forms are also noted. Among these, the rotifer Brachionus sp. (29.51%) is predominant numerically. On the other hand, the MWL water sample shows only copepod species and among them Cyclops sp. (62.50%) shows its greatest abundance. Relative abundance of different zooplanktons in NWL and MWL is also presented at log 10 in the Fig.7. Pie diagrams (Fig.8 and 9) are also made to represent the relative abundances of the two wetlands (NWL and MWL).
Fig.7: Relative abundance of different zooplankton population (at log 10) in two different sources of water (NWL and MWL)
Fig.8: Pie diagram showing the relative abundance of zooplanktons at NWL
1
10
100
NWL
MWL
Nauplius, 1.64Zoea, 1.62
Moina, 3.28
Chydorus, 6.56
Diphanosoma, 4.92
Alona, 3.27
Daphnia, 9.84
Cyclops, 6.56
Heliodiaptomus, 8.2
Tropocyclops, 8.2
Mesocyclops, 3.28
Cypris, 3.28
Brachionus, 29.51
Keratella, 6.56
Other, 50.83

Supratim Pal et al Euro. J. Exp. Bio., 2015, 5(5):85-97 _____________________________________________________________________________
96 Pelagia Research Library
Fig.9: Pie diagram showing the relative abundance of zooplanktons at MWL Present study corroborated to the observations of Datta (2011)[4] who studied at the two wetlands of Jalpaiguri district of West Bengal and noted a number of zooplanktons which match to the present observation. Diversity of zooplankton population in relation to different physico-chemical parameters of water was also advocated by Ahmad et al. [32]. Barbosa et al. [33] has noted a high level of abundance of zooplankton population at Dom Helvecio Lake of Brazil due to different ecological zonation which is similar to the present work. Khan [34] also recorded high density of zooplankton in man-made village pond as well as in urban recreational lake. Impact of aquatic pH on the incidence of zooplankton population was also advocated by Lafrancois et al. [35]. Basically, pH influences the primary productivity which in turn dictates plankton abundance [20]. In present study pH levels of both the sites of observation are within the reference limits, thus it is safe to the aquatic life. Effect of conductivity on the zooplankton abundance was narrated by Bos et al. [36]. They demonstrate that water conductivity has impact on zooplankton population incidence. In present study, conductivity of the two sites is considerable for zooplankton population. Both TDS and TSS are related to water transparency. Ivanova et al. [37] advocates the impact of TDS and TSS value on the abundance of zooplankton. But in present study impact of TDS and TSS values at NWL and MWL are in considerable range for the zooplanktons. Effect of temperature as the primary limiting factor on the incidence and abundance of zooplankton population was also demonstrated by Farshad et al. [19]. As in the present observation, the variation of temperature at the two water bodies is marginal, variation of zooplankton population due to temperature is supposed to be less. Dissolved oxygen indicates water health and in the present study it is optimum to support aquatic life at both the water bodies. Effect of iron and chloride on the incidence of zooplankton population was also documented by Pitchford et al. [38] and Sharma et al. [39]. Increasing chloride content indicates the increasing pollution level [40, 41] as recorded in our study. Among the different physical and chemical parameters considered in present study, statistical analysis indicates that iron concentration has a strong correlation with conductivity. In the present study, iron and chloride concentration show a considerable range for zooplankton survivability.
CONCLUSION
On the basis of the results and discussion, this can be concluded that the natural wetland represents higher zooplankton diversity than man-made wetland in Cooch Behar. The man-made wetland shows comparatively more numerical dominance of copepod species. Presence of Cyclops sp. at high density in man-made water body indicates organic pollution. Physico-chemical parameters indicate prevalence of desirable quality of water in both the wetlands but the man-made wetland having lesser zooplankton diversity but higher zooplankton density stipulates the gradual deterioration of water bodies at Cooch Behar district of West Bengal.
REFERENCES
[1] J.M. Chase, Drought mediates the importance of stochastic community assembly, Proceedings of the National Academy of Sciences of the United States of America, 2007, 104, 17430–17434. [2] M. Williams, ‘Understanding Wetlands’ in Michael Williams (ed), Wetlands: A threatened Landscape, Basil Blakewell Ltd., Oxford, 1990, pp 1-3.
Nauplius, 0
Zoea, 0
Moina, 0
Chydorus, 0
Diphanosoma, 0
Alona, 0
Daphnia, 0
Cyclops, 62.5
Heliodiaptomus, 12
Tropocyclops, 20.5
Mesocyclops, 5
Cypris, 0
Brachionus, 0
Keratella, 0
Lacane, 0
Other, 5

Supratim Pal et al Euro. J. Exp. Bio., 2015, 5(5):85-97 _____________________________________________________________________________
97 Pelagia Research Library
[3] S. Panthi, M. Dhakal, S.S. Thagunna, B.B. Thapa, Open Journal of Ecology, 2014, 4, 245-252. [4] T. Datta, International Journal of Applied Biology and Pharmaceutical Technology. 2011, 2(3), 576-583. [5] M.S. Ahmad, Journal of Environment and Pollution. 1996, 3, 147-151. [6] J.J. Contreras, S.S.S. Sarma, M. Merino-Ibarra, S. Nandini, Journal of Environmental Biology, 2009, 30, 191-195. [7] V.B. Kushwaha, M. Agrahari, World Journal of Zoology, 2014, 9 (2), 86-92. [8] S.V. Rankhamb, K.S. Raut, International Journal of Innovations in Bio-Sciences, 2012, 2 (4), 211-216. [9] N. Murugan, P. Murugavel, M.S. Koderkar, Freshwater cladocera. Indian Association of Aquatic Biologists (IAAB), Hyderabad. 1998, pp 1-47. [10] N. Dadhick, M.M. Saxena, Journal of Environment and Pollution, 1999, 6, 251-254. [11] B. Sinha, M.R. Islam. Ecology Environment and Conservation. 2002, 8, 273-278. [12] K.S. Park, H.W. Shin, Journal of Environmental Biology, 2007, 28, 415-422. [13] O. Rocha, T. Matsumura-Tundisi, E.L.G. Espindola, K.F. Roche, A.C. Rietzler, Ecological theory applied to reservoir zooplankton. In: Theoretical reservoir ecology and its application (Eds.: Tundisi J. G. and M. Straskraba), International Institute of Ecology in São Carlos, Brazil, 1999, 457-476. [14] I.F. Neves, O. Recha, K.F. Roche, A.A. Pinto, Brazilian Journal of Biology, 2003, 63, 1-20. [15] S.N. Islam, Research Journal of Fisheries and Hydrobiology, 2007, 2(2), 21-25. [16] T. Rajagopal, A. Thangamani, G. Archunan, Journal of Environmental Biology, 2010, 31(5), 787-794. [17] A. James, J.W. Pitchford, J. Brindley, Ecological Modelling, 2003, 160, 77-90. [18] P. Kumar, F. Sonaullah, A. Wanganeo, J. Exp. Sci., 2010, 24(2), 219-226. [19] H. Farshad, G.V. Venkataramana, International Research Journal of Environment Sciences. 2012, 1(4), 37-42. [20] J.M. Harris, P. Vinobaba, Journal of Ecosystem and Ecography, 2012, 2(4). [21] M. Jeelani, H. Kaur, Journal of Academia and Industrial Research, 2014, 2(9), 534-537. [22] K. Bahura, J. Aqua. Biol., 2001, 16 (12), 45- 48. [23] APHA, Standard methods for examination of water and wastewater, 21st Edition, American Public Health Association, Washington DC, 2005. [24] W.T. Edmondson, Freshwater biology, 2nd Edition, John Wiley & Sons, New Experimental Biology, 1959, 1 (2), 68-76. [25] A.D. Adoni, Work book on limnology, Pratibha Publishers, Sagar. 1985. [26] J.G. Needham, R.P. Needham, Journal of Environmental Sociobiology, 1972, 2, 15-23. [27] R.W. Pennak, Freshwater invertebrates of United States, 2nd Edition, John Willey Sons Inc., New York, 1978. [28] M.V.S.S.S. Dhanapathi, Hydrobiologia, 2003, 48(1), 916. [29] Y.R. Reddy, Copepoda, Calanoida, Diaptomidae : Guide to the identification of the micro-invertebrates of the continental waters of the world, 5th volume, SPB Publishers, The Hague, Netherland, 1994. [30] R.G. Michael, B.K. Sharma; Fauna of India and adjacent countries, Indian Cladocera (Crustacea, Branchipoda and Cladocera), Zoological Survey of India, 1988. [31] R. Victor, C.H. Fernando, Records of the zoological survey of India. 1979, 74(2), 147-242. [32] U. Ahmad, S. Parveen, A.A. Khan, H.A. Kabir, H.R.A. Mola, A.H. Ganai, Frontiers in Life Sciences: Basic and Applied:Biology and Medicine. 2011, 3(2), 336-341. [33] P.M. Barbosa, R.S. Peixoto, A.S. Guimarães, Brazilian Journal Biology, 2008, 68(4). [34] R.A. Khan, Faunal diversity of Zooplankton in Freshwater Wetlands of South-eastern West Bengal, Occasional Paper No. 204, ZSI, Kolkata, India, 2003. [35] B.M. Lafrancois, R.K. Nydick, B.M. Johnson, J.S. Baron, Can. J. Fish. Aquat. Sci., 2004, 61, 1153–1165. [36] D.G. Bos, B.F. Cumming, C.E. Watters, J.P. Smol, International Journal of Salt Lake Research, 1996, 5, 1-15. [37] M.B. Ivanova, T.I. Kajantseva, Russian Journal of Ecology, 2006, 37(4), 264-270. [38] J.W. Pitchford, J. Brindley, Journal of Plankton Research, 1999, 21(3), 525-547. [39] B.K. Sharma, S. Sharma, Journal of Threatened Taxa, 2011, 3(5), 1745– 1755. [40] G.P. Bhatnagar, Limnology of lower lake, Bhopal with reference to sewage and eutrophication, Bhopal University Pub. MAB, UNESCO Project, 1984. [41] S.G. Patil, Hydro-biological Investigations in “Fauna of Nathsagar Wetland and Jaikwadi Bird Sanctuary”, Wetland Ecosystem Series 7, ZSI, Kolkata, India, 2005.