A Comparative Study on Criteria and Tasks in Korean ...s-space.snu.ac.kr/bitstream/10371/86483/1/2....
22
A Comparative Study on Criteria and Tasks in Korean English Speaking Assessment by Native and Non-native Raters Seokhan Kang and Hyunkee Ahn (Seoul National University) Kang, Seokhan and Ahn, Hyunkee. (2012). A comparative study on criteria and tasks in Korean English speaking assessment by native and non-native raters. Language Research 48.2, 241-262. Evaluating Korean English speaking proficiency could be a major prob- lem for Korean English educators mainly due to its subjectivity in assess- ment. More focus on eligible assessment has also raised a natural con- cern about valid and/or reliable evaluation on Korean English learners’ speaking performance by Korean raters. In this respect, it is meaningful to search for an objective way in evaluating non-native speaking per- formance by the non-native raters. With this particular aim, this paper is trying to analyze the current Korean raters’ rating patterns and sug- gest a better way of objective assessment. The results of the experi- ments show that most of experienced raters maintained acceptable level of internal consistency, regardless of their L1 background. The non-na- tive raters also show similar severity patterns across various tasks and criteria, along with native English raters. However, Korean raters ex- hibit some particular characteristics different from native English coun- terparts. The educational suggestion is based on the results of rating ex- periments, comparing native English raters with Korean raters, which would be specified in detail from the main section in this paper. Keywords: English speaking assessment, non-native speaking, non- native raters, fluency, tasks, criteria, consistency, strictness, FACET 1. Introduction Generally the evaluation methods on English speaking performance could be classified into two categories, depending on who evaluate the test: native English or non-native English raters. The assessment sys- tem by native English speakers has long been assumed in English pro- ficiency tests (Talyor, 2006; Kim Y-H, 2009). Naturally, large-scale and
Transcript of A Comparative Study on Criteria and Tasks in Korean ...s-space.snu.ac.kr/bitstream/10371/86483/1/2....

A Comparative Study on Criteria and Tasks in
Korean English Speaking Assessment by
Native and Non-native Raters
Seokhan Kang and Hyunkee Ahn
(Seoul National University)
Kang, Seokhan and Ahn, Hyunkee. (2012). A comparative study on criteria and tasks in Korean English speaking assessment by native and non-native raters. Language Research 48.2, 241-262.
Evaluating Korean English speaking proficiency could be a major prob-lem for Korean English educators mainly due to its subjectivity in assess-ment. More focus on eligible assessment has also raised a natural con-cern about valid and/or reliable evaluation on Korean English learners’ speaking performance by Korean raters. In this respect, it is meaningful to search for an objective way in evaluating non-native speaking per-formance by the non-native raters. With this particular aim, this paper is trying to analyze the current Korean raters’ rating patterns and sug-gest a better way of objective assessment. The results of the experi-ments show that most of experienced raters maintained acceptable level of internal consistency, regardless of their L1 background. The non-na-tive raters also show similar severity patterns across various tasks and criteria, along with native English raters. However, Korean raters ex-hibit some particular characteristics different from native English coun-terparts. The educational suggestion is based on the results of rating ex-periments, comparing native English raters with Korean raters, which would be specified in detail from the main section in this paper.
Keywords: English speaking assessment, non-native speaking, non- native raters, fluency, tasks, criteria, consistency, strictness, FACET
1. Introduction
Generally the evaluation methods on English speaking performance
could be classified into two categories, depending on who evaluate the
test: native English or non-native English raters. The assessment sys-
tem by native English speakers has long been assumed in English pro-
ficiency tests (Talyor, 2006; Kim Y-H, 2009). Naturally, large-scale and
242 Seokhan Kang and Hyunkee Ahn
high-stakes tests such as TOEFL or OPICs rendered their assessments
using native English speakers as a modeling benchmark (Lowenberg
2000, 2002).
However, some researchers raised some questions on whether native
English raters should be the only acceptable standard just because they
are native English speakers (Taylor 2006). Indeed, it is hard to set up
the indisputable definition of the native speakers of English. Further-
more, non-native English speakers outnumber native English speakers
internationally (Crystal 2003, Lowenberg 2000), and variation of English
has been extended in the world (Kachru 1985, 1992). The environ-
mental change calls for the non-native speakers’ participation in rating
non-native speakers’ English proficiency tests.
The inevitable requirement for non-native raters’ involvement in non-
native speakers’ proficiency raised some doubt on validity and reli-
ability for their ratings (e.g., Kim J-K 2006, Lee C-H 2010, Kang and
Rhee 2011). However, previous works have been focused on how the
Korean raters’ rating patterns are different from those of native English
raters superficially. Rather, this study used more in-depth analysis on
whether their rating results were influenced by mixed variables of tasks
and criteria. This study tried to suggest the better objective method in
assessing the English speaking performance by Korean raters. The
practical goal of the study is to analyze the Korean raters’ assessment
patterns comparing with native English raters on tasks and criteria. A
FACET program (Version 3.64; Lincare 2008) was applied to address
the following questions:
(1) Do Korean raters exhibit similar levels of internal consistency
when they assess Koreans’ oral English performance?
(2) Do Korean raters show similar strictness over different tasks and
criteria as native English raters?
2. Literature Review
Studies on how differently native and/or non-native raters approach
the tasks of evaluating L2 learners’ speaking performance are still rela-
tively few in numbers especially in Korea. In the international level,
however, comparatively a large number of such studies are found.

A Comparative Study on Criteria and Tasks in Korean English ~ 243
Their studies reported harsher ratings among non-native raters com-
pared to their native counterparts (e.g., Fayer and Krasinski 1987, Ross
1979, Santos 1989, Kang and Rhee 2012). For instance, Fayer and
Krasinski (1987) examined how the English-speaking performance of
non-native English students was perceived by native and non-native
English raters. The results showed that non-native raters tended to be
more severe in general and to express more annoyance when rating
linguistic forms and that pronunciation was the most distracting fac-
tors for both sets of raters.
On the contrary, some research reported little or no difference be-
tween native and non-native raters. Brown (1995) reported that the dif-
ference between native and non-native raters was not significant, even
though native speakers tended to be more severe than non-native
speakers in some tasks. The similar result can be found in the study of
Zhang and Elder (2011) who carried out an empirical study on ESL/
EFL teachers’ evaluation and interpretation of oral English proficiency.
The results yielded no significant difference in non-native raters’ holis-
tic judgments and a broad level of agreement between native and
non-native rating groups. It appears that the difference could be influ-
enced by the effects of raters’ L1, tasks, linguistic forms, or criteria. For
example, Galloway (1980) reported that non-native raters tended to fo-
cus on grammatical forms and reacted more negatively to non-verbal
behavior and slow speech, while native raters appeared to place more
on content and on supporting students’ attempts at self-expressions.
Some research in Korea, comparatively few in numbers, has been
studied on the non-native raters’ characteristics. Kim J-K (2006) point-
ed out some problems in grading system by Korean raters, in which
many students felt problems with fairness and validity. Furthermore, it
was also reported that test-takers’ main complaint to Korean raters is
on scoring standard or test efficacy. Lee C-H (2010) reported some an-
alytic difference in the areas of grammar and fluency between two raters’
groups. That is, native English raters graded more strictness on flu-
ency, even though Korean raters rendered more strictness on grammar.
Yoon W-H (2009) also raised some questions on valid assessment by
Korean raters. He reported that the striking difference between two
groups might be found in the intelligibility criterion, while other cri-
teria such as proficiency, rhythm, and intonation exhibited the similar
severity measurement. However, most of previous works that have in-
244 Seokhan Kang and Hyunkee Ahn
vestigated the rating patterns between native and non-native raters
have been conducted using only either limited tasks or criteria. This
study, examining the mixed effects of both tasks and criteria, tried to
suggest the better reliable methods in assessing the Korean speaking
proficiency of English by Korean raters.
3. Methodology
3.1. Participants
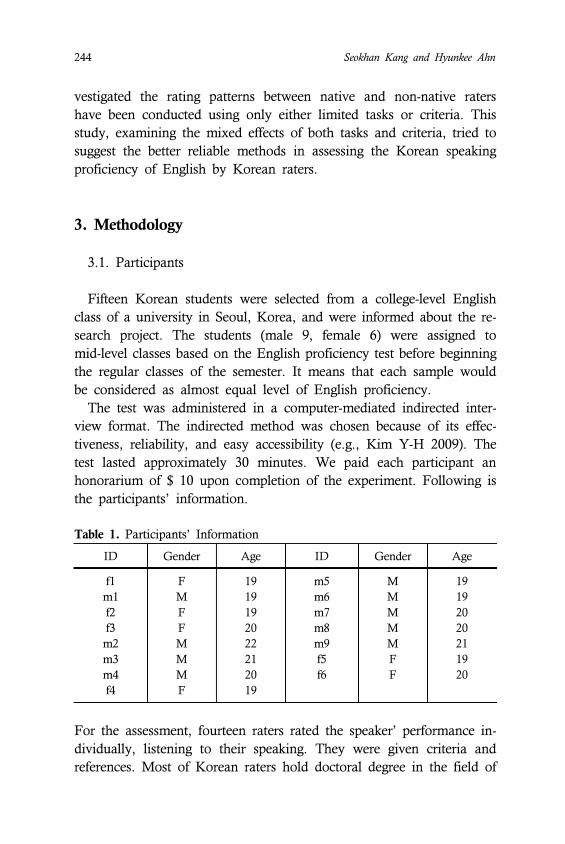
Fifteen Korean students were selected from a college-level English
class of a university in Seoul, Korea, and were informed about the re-
search project. The students (male 9, female 6) were assigned to
mid-level classes based on the English proficiency test before beginning
the regular classes of the semester. It means that each sample would
be considered as almost equal level of English proficiency.
The test was administered in a computer-mediated indirected inter-
view format. The indirected method was chosen because of its effec-
tiveness, reliability, and easy accessibility (e.g., Kim Y-H 2009). The
test lasted approximately 30 minutes. We paid each participant an
honorarium of $ 10 upon completion of the experiment. Following is
the participants’ information.
Table 1. Participants’ Information
ID Gender Age ID Gender Age
f1
m1
f2
f3
m2
m3
m4
f4
F
M
F
F
M
M
M
F
19
19
19
20
22
21
20
19
m5
m6
m7
m8
m9
f5
f6
M
M
M
M
M
F
F
19
19
20
20
21
19
20
For the assessment, fourteen raters rated the speaker’ performance in-
dividually, listening to their speaking. They were given criteria and
references. Most of Korean raters hold doctoral degree in the field of
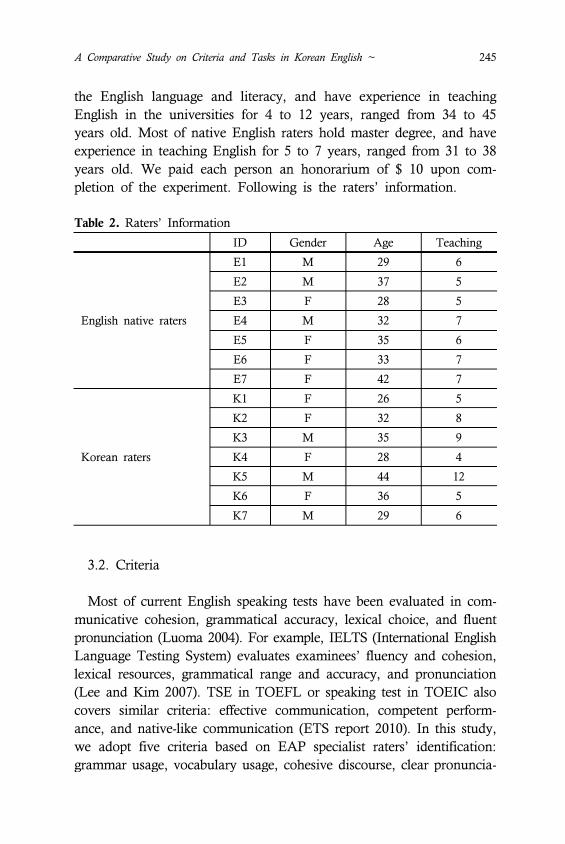
A Comparative Study on Criteria and Tasks in Korean English ~ 245
the English language and literacy, and have experience in teaching
English in the universities for 4 to 12 years, ranged from 34 to 45
years old. Most of native English raters hold master degree, and have
experience in teaching English for 5 to 7 years, ranged from 31 to 38
years old. We paid each person an honorarium of $ 10 upon com-
pletion of the experiment. Following is the raters’ information.
Table 2. Raters’ Information
ID Gender Age Teaching
English native raters
E1 M 29 6
E2 M 37 5
E3 F 28 5
E4 M 32 7
E5 F 35 6
E6 F 33 7
E7 F 42 7
Korean raters
K1 F 26 5
K2 F 32 8
K3 M 35 9
K4 F 28 4
K5 M 44 12
K6 F 36 5
K7 M 29 6
3.2. Criteria
Most of current English speaking tests have been evaluated in com-
municative cohesion, grammatical accuracy, lexical choice, and fluent
pronunciation (Luoma 2004). For example, IELTS (International English
Language Testing System) evaluates examinees’ fluency and cohesion,
lexical resources, grammatical range and accuracy, and pronunciation
(Lee and Kim 2007). TSE in TOEFL or speaking test in TOEIC also
covers similar criteria: effective communication, competent perform-
ance, and native-like communication (ETS report 2010). In this study,
we adopt five criteria based on EAP specialist raters’ identification:
grammar usage, vocabulary usage, cohesive discourse, clear pronuncia-
246 Seokhan Kang and Hyunkee Ahn
tion, and fluency because it is suggested as overall valid and reliable
measurement over the examinee’s proficiency ability (Brown, Iwashita,
& McNamara 2002).
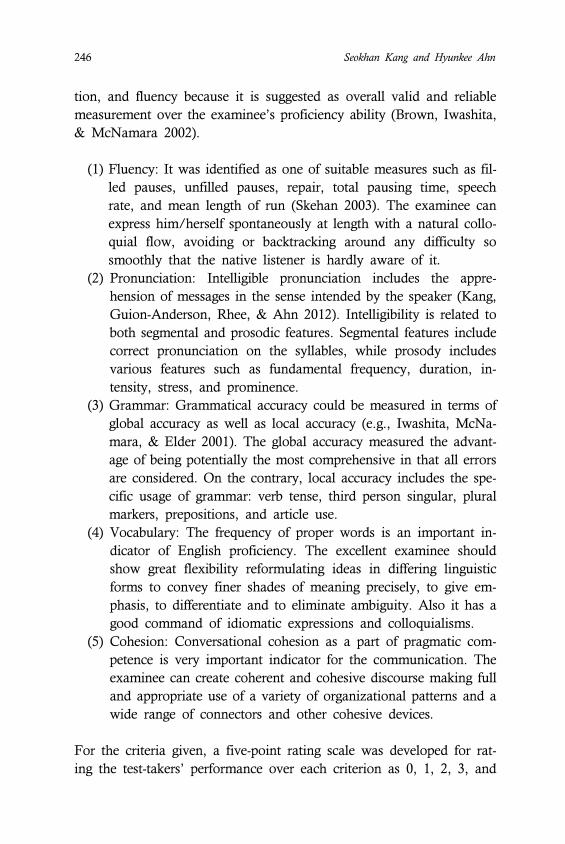
(1) Fluency: It was identified as one of suitable measures such as fil-
led pauses, unfilled pauses, repair, total pausing time, speech
rate, and mean length of run (Skehan 2003). The examinee can
express him/herself spontaneously at length with a natural collo-
quial flow, avoiding or backtracking around any difficulty so
smoothly that the native listener is hardly aware of it.
(2) Pronunciation: Intelligible pronunciation includes the appre-
hension of messages in the sense intended by the speaker (Kang,
Guion-Anderson, Rhee, & Ahn 2012). Intelligibility is related to
both segmental and prosodic features. Segmental features include
correct pronunciation on the syllables, while prosody includes
various features such as fundamental frequency, duration, in-
tensity, stress, and prominence.
(3) Grammar: Grammatical accuracy could be measured in terms of
global accuracy as well as local accuracy (e.g., Iwashita, McNa-
mara, & Elder 2001). The global accuracy measured the advant-
age of being potentially the most comprehensive in that all errors
are considered. On the contrary, local accuracy includes the spe-
cific usage of grammar: verb tense, third person singular, plural
markers, prepositions, and article use.
(4) Vocabulary: The frequency of proper words is an important in-
dicator of English proficiency. The excellent examinee should
show great flexibility reformulating ideas in differing linguistic
forms to convey finer shades of meaning precisely, to give em-
phasis, to differentiate and to eliminate ambiguity. Also it has a
good command of idiomatic expressions and colloquialisms.
(5) Cohesion: Conversational cohesion as a part of pragmatic com-
petence is very important indicator for the communication. The
examinee can create coherent and cohesive discourse making full
and appropriate use of a variety of organizational patterns and a
wide range of connectors and other cohesive devices.
For the criteria given, a five-point rating scale was developed for rat-
ing the test-takers’ performance over each criterion as 0, 1, 2, 3, and
A Comparative Study on Criteria and Tasks in Korean English ~ 247
4. Rating scale plays a crucial role to obtain the reliability and validity
for the assessment (Lane 2008, Lee, Kim, & Lee 2011). Usually 9 to
12 point Likert scale has been adopted in international speaking tests.
For example, ACTFL-OPI adopts 10 point scale, ISLPR takes 12
point scales, and MATE has 12 point scales. However, some tests
adopts 5 to 8 point rating scale because they should consider test-tak-
ers’ characteristics and purpose (eg., G-TELP: 5 points, ICAO: 6 points,
FCE: 6 points). Since this test used in the study was designed for the
research which focuses on analyzing the difference between two groups
over tasks and criteria, 5-point Lickert scale which covers compara-
tively larger range of sampling population was adopted.
3.3. Speaking Tasks
Speaking tasks refer to activities that involve speakers in using lan-
guage for the purpose of achieving a particular goal or objective in a
particular speaking situation (Backman and Palmer 1996). Task types
could be broadly identified into two: open-ended and structured task
(Luoma 2004). Open-ended speaking tasks guide the discussion, but al-
low space for different ways of fulfilling the task requirements. On the
contrary, structured speaking tasks specify quite precisely what the ex-
aminees should say.
This study focuses on open-ended method, but partially adopts
structured task. This method measures the effective use of language
knowledge and strategic competence (Bachman and Palmer 1996). The
purpose of the experiment was to compare two rating groups in assess-
ing the overall oral communicative language performance spoken by
Korean learners of English. In order to assess the diverse oral lan-
guage output of test-takers, the test used in the study consisted of five
different task types: open-ended response task, directed response task,
picture-cued story telling task, and opinion task.
(1) Open Ended Response Task
The main goal in the open-ended tasks is to get the examinees to do
something with languages as an indication of their skills. The open-
ended speaking tasks allow various methods so that they require com-
paratively longer presentation and wider scope of answer. The task in-
cludes description, comparison, explanation, definition, prediction, jus-

248 Seokhan Kang and Hyunkee Ahn
tification, and instruction. This can be a relatively long activity, such
as giving a presentation, or a short, functional based action like a
request. Following is the interview test used in the study:
In this part of the test, you will hear a simple question. You will have 30 sec-
onds to prepare. Then you will have 30 seconds to answer the question.
What do Koreans do in Chusok day (Korea traditional festival like Thanksgiv-
ing day)?
(2) Directed Response Task
This task is a part of semi-structured task that focuses on socially or
functionally complex language use. The test takers read or hear the so-
cial situation where they should imagine themselves to be, and they
are asked to say what they would say in the situation. The responses
require the use of formulaic language but also the ability to modify
expression. Following is the example used in the study:
In this part of the test, you will answer the question on your screen in as much
detail as you can. You will have 30 seconds to prepare your response. Then you
will have 45 seconds to answer the question.
Describe your favorite place.
You should say,
Where is located?
Why do you choose the place?
What did you do in the place? etc.
(3) Picture-cued Story Telling Task
The task is a part of open-ended task which explain the picture or
the drawings within the selected time. In this study, the examinee is
required to explain 8 comic pictures. Following is the example.
In this part of the test, you will make a story for the pictures on your screen in
as much detail as you can. You will have 45 seconds to prepare your response.
Then you will have 60 seconds to answer the pictures.

A Comparative Study on Criteria and Tasks in Korean English ~ 249
Picture 1. Picture-cued story cartoon.
(4) Opinion Task
The test taker presents his/her opinion for 2 or 3 minutes on the
given topics. He expresses his clear position on the topic and provides
the reasons or criteria. Following is the example used in the study.
In this part of the test, you will give your opinion about a specific topic. Be sure
to say as much as you can in the time allowed. You will have 45 seconds to
prepare. Then you will have 60 seconds to speak.
Are the single people qualified to adopt a child? Can they be good parents? Do
you support it or not? Why? Use reasons and specific examples to support your
answer.
3.4. Data Analysis
The data was analyzed using the FACETS (Version 3.64; Lincare
2008). FACETS used the scores, in which raters evaluate examinees’
proficiency on each of the five criteria (i.e., grammar usage, vocabu-
lary usage, cohesive discourse, clear pronunciation, fluency) to analyze
raters’ severity depending on raters consistency, task measurement dif-
ficulties, and test-takers severities. The rater facet was entered as a
dummy facet and anchored at zero. A Many-faceted Rasch Measure-
ment Model was used to analyze the data. The formula could be built
up like follows;
250 Seokhan Kang and Hyunkee Ahn
log(Pnijljpk/Pnijljp(k-1)) = English speaking proficiency
- proficiency of examinee n
- difficulty of criterion i
- difficulty of task measurement l
- severity of rater j
- rater’s severity by L1 p
- difficulty of receiving a rating of k rela-
tive to a rating of k-1
4. Results
4.1. Raters’ Severity and Internal Consistency
Table 3 showed that the raters varied widely in their measures of
severity. The raters are ordered in the table from most severe (E1 in
English raters and K1 in Korean raters) to most lenient (E3 in English
raters and K2 in Korean raters). In this study, English raters tend to
rate harshly (0.21 of mean logit), while Korean raters have a tendency
to grade leniently (-0.01 of mean logit). The results provide against the
studies of Fayer and Krasinski (1987) and Santos (1989), in which
non-native raters exhibit more strictness. Rather, it supports the results
of Lee C-H (2010) and Yoon W-H (2009) in that native English speak-
ers or trained raters exhibited more strict scores. Native raters’ harsh
ratings draw from native or experienced raters’ self-respect on the rat-
ing, in which he or she needs to “set the standard for the other raters
by noticing even small flaws in examinee performance that are other-
wise likely to be overlooked” (Eckes 2010:15). On the contrary, the
non-native or less-experienced raters may tend to raise the doubt to
their own ratings, especially when performances are at the border of
two adjacent fluency levels. Following is measurement results for the
rater facet:
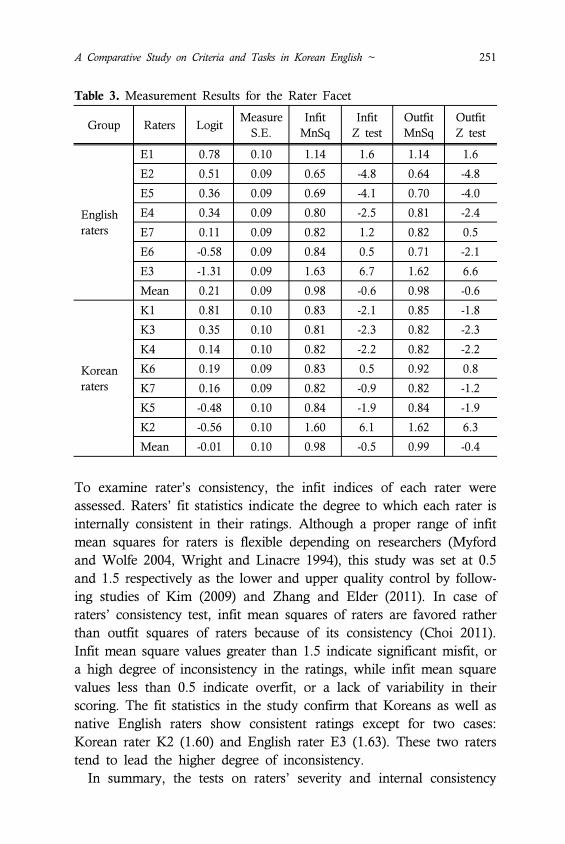
A Comparative Study on Criteria and Tasks in Korean English ~ 251
Table 3. Measurement Results for the Rater Facet
Group Raters LogitMeasure
S.E.
Infit
MnSq
Infit
Z test
Outfit
MnSq
Outfit
Z test
English
raters
E1 0.78 0.10 1.14 1.6 1.14 1.6
E2 0.51 0.09 0.65 -4.8 0.64 -4.8
E5 0.36 0.09 0.69 -4.1 0.70 -4.0
E4 0.34 0.09 0.80 -2.5 0.81 -2.4
E7 0.11 0.09 0.82 1.2 0.82 0.5
E6 -0.58 0.09 0.84 0.5 0.71 -2.1
E3 -1.31 0.09 1.63 6.7 1.62 6.6
Mean 0.21 0.09 0.98 -0.6 0.98 -0.6
Korean
raters
K1 0.81 0.10 0.83 -2.1 0.85 -1.8
K3 0.35 0.10 0.81 -2.3 0.82 -2.3
K4 0.14 0.10 0.82 -2.2 0.82 -2.2
K6 0.19 0.09 0.83 0.5 0.92 0.8
K7 0.16 0.09 0.82 -0.9 0.82 -1.2
K5 -0.48 0.10 0.84 -1.9 0.84 -1.9
K2 -0.56 0.10 1.60 6.1 1.62 6.3
Mean -0.01 0.10 0.98 -0.5 0.99 -0.4
To examine rater’s consistency, the infit indices of each rater were
assessed. Raters’ fit statistics indicate the degree to which each rater is
internally consistent in their ratings. Although a proper range of infit
mean squares for raters is flexible depending on researchers (Myford
and Wolfe 2004, Wright and Linacre 1994), this study was set at 0.5
and 1.5 respectively as the lower and upper quality control by follow-
ing studies of Kim (2009) and Zhang and Elder (2011). In case of
raters’ consistency test, infit mean squares of raters are favored rather
than outfit squares of raters because of its consistency (Choi 2011).
Infit mean square values greater than 1.5 indicate significant misfit, or
a high degree of inconsistency in the ratings, while infit mean square
values less than 0.5 indicate overfit, or a lack of variability in their
scoring. The fit statistics in the study confirm that Koreans as well as
native English raters show consistent ratings except for two cases:
Korean rater K2 (1.60) and English rater E3 (1.63). These two raters
tend to lead the higher degree of inconsistency.
In summary, the tests on raters’ severity and internal consistency

252 Seokhan Kang and Hyunkee Ahn
showed the particular Korean raters’ characteristics: lenient measure-
ment and internal consistency. It means that Korean raters similar as
native English raters were consistent in their ratings, although they ex-
hibited somewhat lenient ratings. Overall, it is safe to say that Korean
raters’ grading is reliable in assessing Korean English speaking per-
formance, and that they still need rating training to improve the se-
verity on the measurement.
4.2. Criterion Measurement
Figure 1. Criterion difficulty measures by Korean and English rating groups.
The analysis was carried out in order to identify whether two groups
of raters showed similar or different severity measures across different
criteria. Figure 1 shows what criterion is more difficult in ratings by
both Korean and English raters. By following this Figure, Korean
raters were slightly more diverse across criteria, with criterion difficulty
measures ranging from 0.84 logit to 0.74 logit, with a 1.58 logit spread.
On the contrary, native English raters were comparatively narrower
across criteria, with criterion difficulty measures ranging from -0.30
logit to 0.33 logit, with a 0.63 logit spread. It means that Korean rater
group exhibited particular patterns in criterion difficulty measures dif-
ferent from native English raters. The criteria of grammar accuracy
and discourse cohesion showed a wide range of severity. Korean raters
, " ""
, , ,
" , , " , • ___ Ko,,,,, ..
" , • _ ErJl;, 1\
"' ~' ,C ;,.' • , -0 .4 ,
, /;' , • -OE
" • , , , -11
A Comparative Study on Criteria and Tasks in Korean English ~ 253
exhibited the strict measurement on grammar accuracy (0.74 logit),
while English raters showed the comparatively lenient measurement as
0.05 logit. In the discourse cohesion, the opposite patterns between
two groups were found. English raters exhibited comparatively strict
measurement on discourse cohesion (-0.15 logit), while Korean raters
showed the comparatively lenient measurement as 0.84 logit. The re-
sult supports the studies of Galloway(1980) and Lee (2010) that two
groups exhibit the difference rating patterns in pragmatic evaluation
such as contents and story-telling. The test of cohesion covers the de-
gree to which the response is developed in a coherent manner. Good
use of linking words or organized answers is one of the familiar exam-
ples. In this pragmatic application, Korean raters tend to assign the le-
nient ratings to the test-takers. However, the criteria of pronunciation
intelligibility, vocabulary, and fluency show the similar severity be-
tween two groups.
Table 4. Measurement Results for the Criterion Facet
Criteria Group LogitMeasure
S.E.
Infit
MnSq
Infit
Z test
Outfit
MnSq
Outfit
Z test
VocabularyEnglish 0.33 0.09 1.01 0.00 1.02 0.2
Korean 0.15 0.10 0.75 -1.8 0.78 -1.8
PronunciationEnglish 0.07 0.09 1.21 1.9 1.18 1.8
Korean -0.07 0.10 0.77 -3.0 0.76 -3.0
GrammarEnglish 0.05 0.09 0.76 -3.1 0.75 -3.2
Korean 0.74 0.10 1.33 1.4 1.01 1.5
CohesionEnglish -0.15 0.09 0.98 -0.1 0.98 -0.2
Korean -0.84 0.10 1.06 2.7 1.06 2.8
FluencyEnglish -0.30 0.09 0.99 -0.1 0.98 -0.2
Korean 0.01 0.10 1.05 0.6 1.04 0.4
In the analysis, when the Z score values fall between -2 and +2, that
the group of raters is thought to be scoring a task with consistency
(Shin D-I 2006). Table 4 shows that both groups tended to grade con-
sistency in the criteria of vocabulary and fluency, while the other cri-
teria such as vocabulary, pronunciation, and grammar were graded in-
consistently in either or both groups.
More specifically, Korean raters exhibited inconsistent grading in

254 Seokhan Kang and Hyunkee Ahn
criteria of intelligible pronunciation (-3.0 logit) and discourse cohesion
(2.7 logit), while English raters showed inconsistency marking in those
of grammar accuracy (-3.1 logit). The results suggest that even L1
raters implied some problems of consistent grading to the criteria.
The difference may derive from raters’ knowledge; Korean raters
grade the criterion of grammar accuracy strictly because of their famil-
iar knowledge on grammar, while native English raters comparatively
ignore the importance of grammar in speaking assessment. It means
that the special rating training for raters is required, regardless of their
nativeness.
A bias analysis was carried out to explore the potential interaction
between rater groups and criteria. In the bias analysis, an estimate of
the extent to which a certain rating group was biased toward a partic-
ular criterion is standarized to a Z-score, in which the proper values
should fall between -2 and +2. Where the values of the Z score are
over +2, the group of the raters is thought to be rating more severely
than other criteria. As the bias slopes of Table 4 illustrate, neither of
the two rating groups was biased toward any particular criteria be-
cause Z scores for both groups falls between +2 and -2.
Figure 2. Bias analysis between raters’ group and criteria
The analysis suggests that both groups are not thought to commit a
significant bias rating. However, we can find some minor biased rat-
1· I 'OU P
, I "' +------=--'~~~------;&"--------i I _______________ ~~~----------~ 9 0 t-
__ l . p,on unc ;,,;on
___ l .fiu . ncy
......... 3·I "mm"
_ 4. 0;"ou" .
-+-5.vo"bul" y

A Comparative Study on Criteria and Tasks in Korean English ~ 255
ings for both groups. English native raters exhibited more severe pat-
terns on vocabulary, discourse cohesion, and pronunciation, but more
lenient patterns on fluency and grammar. On the contrary, Korean
raters showed more severe trend on vocabulary, discourse cohesion,
and pronunciation, but more generous ratings on fluency.
In summary, the Korean raters seem to have behaved similarly in
terms of severity over criteria, with some criteria showing quite oppo-
site rating patterns. Korean raters exhibited the strict grading on gram-
mar accuracy, while they kept the lenient measurement on the dis-
course cohesion. The result of bias analysis suggests that overall Korean
raters exhibited valid grading on the criteria, with some particular
characteristics.
4.3. Severity Test on Tasks
Figure 3. Task difficulty measures by Korean and English rating groups.
The analysis was carried out in order to identify whether the two
groups of raters exhibited similar leniency measures across different
tasks. Figure 3 shows the task difficulty derived from Koreans and
English rating groups. In this figure, the ratings of both groups showed
slightly similar diverse across tasks; native English raters’ difficulty
showed range from -0.27 logit to 0.52 logit, with a 0.79 logit spread.
Also, the ratings of Korean group exhibited similar difficulty across
tasks, ranging from -0.28 logit to 0.43 logit, with a 0.71 logit spread.
" " .\ " '. \ "' "
\ \ • _ Enll;,n
" • • , ___ Ko,,,,,,,
• , \. ,~
, op<n-<r>d «pI,oa'ion , op n loo
-0 .) • ..... ,-"' • -Q.J .. _------0 .4
256 Seokhan Kang and Hyunkee Ahn
Figure 3 shows that both groups exhibited generally similar patterns
in task difficulty measures. The task of open-ended questions was giv-
en the highest difficulty measure by both groups, while task of ex-
planation was given the lowest difficulty measure by both groups. The
task of opinion task, however, exhibited critically different patterns to
both groups; the ratings of Korean exhibited the severe measures with
a 0.27 logit, while native English raters graded more leniently as a
-0.37 logit.
Korean raters tend to grade more severely when it allows the test
takers to have room for various ways of fulfilling the task requirement.
Given the more detailed guideline, or the specific words or sentences
included for the task, Korean raters’ ratings follow the similar rating
patterns as native English raters’. For instance, in the explanation task
which providing the detail guideline, Korean raters exhibited the sim-
ilar difficulty as native English raters’ (0.98 logit vs. 0.83 logit).
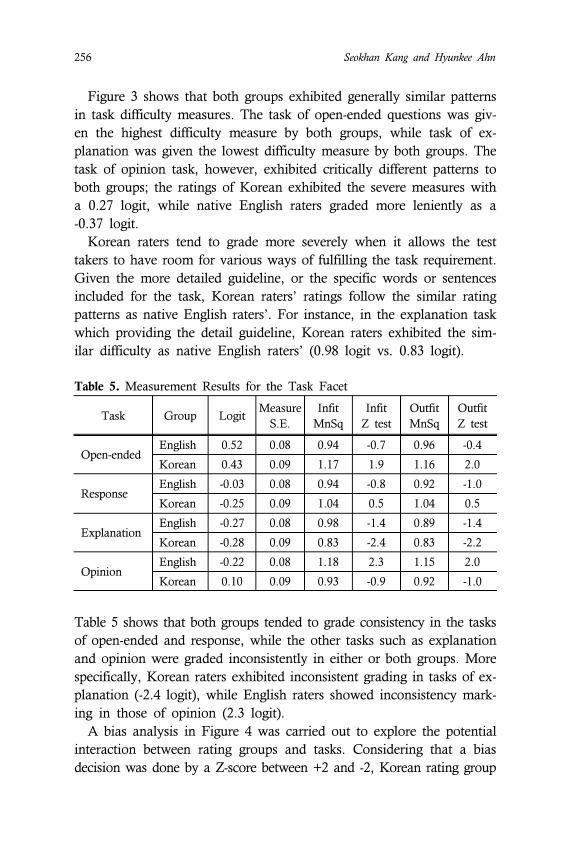
Table 5. Measurement Results for the Task Facet
Task Group LogitMeasure
S.E.
Infit
MnSq
Infit
Z test
Outfit
MnSq
Outfit
Z test
Open-endedEnglish 0.52 0.08 0.94 -0.7 0.96 -0.4
Korean 0.43 0.09 1.17 1.9 1.16 2.0
ResponseEnglish -0.03 0.08 0.94 -0.8 0.92 -1.0
Korean -0.25 0.09 1.04 0.5 1.04 0.5
ExplanationEnglish -0.27 0.08 0.98 -1.4 0.89 -1.4
Korean -0.28 0.09 0.83 -2.4 0.83 -2.2
OpinionEnglish -0.22 0.08 1.18 2.3 1.15 2.0
Korean 0.10 0.09 0.93 -0.9 0.92 -1.0
Table 5 shows that both groups tended to grade consistency in the tasks
of open-ended and response, while the other tasks such as explanation
and opinion were graded inconsistently in either or both groups. More
specifically, Korean raters exhibited inconsistent grading in tasks of ex-
planation (-2.4 logit), while English raters showed inconsistency mark-
ing in those of opinion (2.3 logit).
A bias analysis in Figure 4 was carried out to explore the potential
interaction between rating groups and tasks. Considering that a bias
decision was done by a Z-score between +2 and -2, Korean rating group

A Comparative Study on Criteria and Tasks in Korean English ~ 257
was not positively or negatively biased toward any particular tasks.
However, the task of opinion question exhibited meaningfully different
patterns to both groups; the ratings of Korean exhibited the severe
measures with a 0.27 logit, while native English raters graded more le-
niently as a -0.37 logit.
Figure 4. Bias analysis between raters’ group and tasks.
In summary, the Korean raters seem to have behaved similarly in
terms of severity over tasks, with the opinion task showing meaningful
different rating patterns. Korean raters exhibited the strict grading on
the task of opinion, while the native English raters showed the lenient
grading on it. The result of bias analysis, however, suggests the val-
idity of Korean raters’ grading over the tasks measured, in which Korean
group seems to keep the unbiased ratings.
4.4. Rating Scale Effectiveness
Speaking scales express how well the assessment evaluates test-tak-
ers’ speaking performance. This test examines the quality of five-point
rating scale that the raters used to evaluate speaking performance.
Overall, Korean raters’ rating scale is appropriately applied because
the outfit values are under 2.0 logit. One indicator of rating scale ef-
fectiveness refers to the mean-square outfit statistics computed for each
I 0 .0 5
1 * .l! -0 .0
~ ~ ~
,
,
,
,
,
l· I '''''P
,
/'
"- / ~ / -+- l _op.n -.ndod
,, / ...... 3_d iro " ro'
........ 4 _pi(tu ro d."'ip
r
/~ -+- 5.o pinion
/ ~ /
/ /
258 Seokhan Kang and Hyunkee Ahn
rating category. This indicator compares the average test-taker’s profi-
ciency measures and the expected his/her proficiency measures. The
greater the difference between the average and the expected measures,
the larger the mean-square outfit statistics will be. Generally, not ex-
ceeding 2.0 logit is appropriate (Eckes 2010).
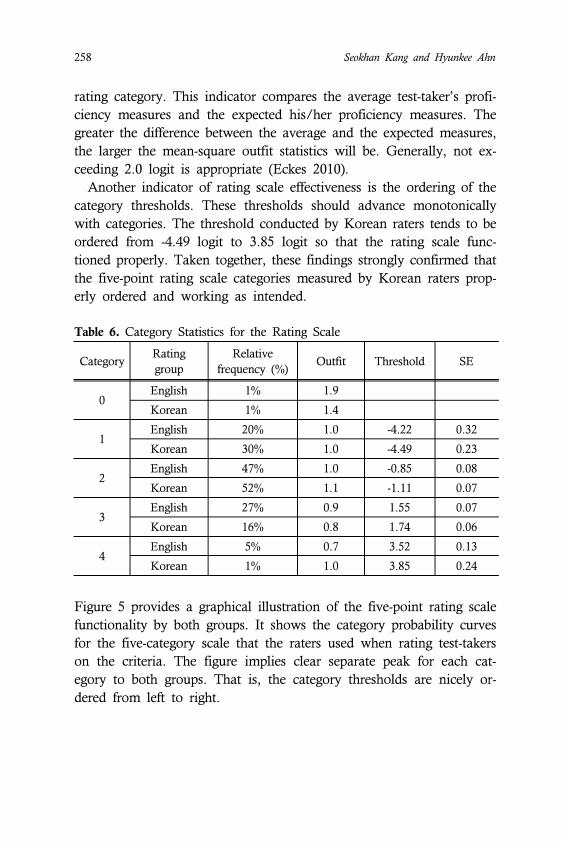
Another indicator of rating scale effectiveness is the ordering of the
category thresholds. These thresholds should advance monotonically
with categories. The threshold conducted by Korean raters tends to be
ordered from -4.49 logit to 3.85 logit so that the rating scale func-
tioned properly. Taken together, these findings strongly confirmed that
the five-point rating scale categories measured by Korean raters prop-
erly ordered and working as intended.
Table 6. Category Statistics for the Rating Scale
CategoryRating
group
Relative
frequency (%)Outfit Threshold SE
0English 1% 1.9
Korean 1% 1.4
1English 20% 1.0 -4.22 0.32
Korean 30% 1.0 -4.49 0.23
2English 47% 1.0 -0.85 0.08
Korean 52% 1.1 -1.11 0.07
3English 27% 0.9 1.55 0.07
Korean 16% 0.8 1.74 0.06
4English 5% 0.7 3.52 0.13
Korean 1% 1.0 3.85 0.24
Figure 5 provides a graphical illustration of the five-point rating scale
functionality by both groups. It shows the category probability curves
for the five-category scale that the raters used when rating test-takers
on the criteria. The figure implies clear separate peak for each cat-
egory to both groups. That is, the category thresholds are nicely or-
dered from left to right.

A Comparative Study on Criteria and Tasks in Korean English ~ 259
a. Examinee proficiency by English natives. b. Examinee proficiency by Korean natives
Figure 5. Category probability curves for the rating scale.
In summary, Korean raters’ rating scale is appropriately assigned over
the 5 point scales, and it is confirmed by both the rating scale meas-
urement and the ordering of the category thresholds. It means that the
ratings by Korean raters are reliably assigned in the scales.
5. Conclusion
This study has investigated the differences between a group of
Korean and English native raters in analytically judging performance
on Korean English speaking. It has revealed no significant differences
in the scores assigned by both groups. However, they exhibited some-
thing particular characteristics on consistency, severity degree on tasks,
criteria, and rating scale tests.
For the internal consistency test, raters of both groups maintained
acceptable levels of internal consistency. But in some areas they showed
inconsistent rating patterns. Korean raters tend to grade leniently over
tasks measured, although they were not positively or negatively biased
toward a particular task.
Two groups of raters showed somewhat difference in evaluation
criteria. Korean raters exhibited the strict measurement on grammar
accuracy, in which English raters showed the comparatively lenient
measurement. On the contrary, English raters exhibited comparatively
strict measurement on discourse cohesion, in which Korean raters
showed the comparatively lenient measurement. For the task severity
test, both groups exhibited generally similar patterns in task difficulty
measures, except for opinion task. Interestingly, the task of opinion
-6.'-
. " . .
QQ 11
" , " 1*3 ... 3
111 0*2 331 .. 22 333 I 22 000 333 1 I 22222 00003333 2222 I
8 ! ::::::::::: ::::::::::::::::::::::::::::~~~~~::::::::::: ::::::::::::!
-6.'-, , , , , '" " .
~ I 01 Q I 2222222 b I 2 3333 a I 22 33 33 .. b I *1 23 :1 1 10 3· " 1 1 32 , , " , " , \1 111 2 ....
111 · 2
" I 0*2 3·1 .... 2 33
, .. '
I 22200 333 11 222 331 I 22222 00000 3333 2222 I 81······ .... ******************** .. • ...... ·800 •••••••• ················1 ---------.----------.----------.----------.----------..
260 Seokhan Kang and Hyunkee Ahn
question exhibited critically different patterns to both groups; the rat-
ings of Korean exhibited the severe measures with a 0.27 logit, while
native English raters graded more leniently as a -0.37 logit.
The five-point Lickert scale is effectively used in this study. From
the result of mean-square outfit statistics not exceeding 2.0., this test is
thought to examine the quality of five-point rating scale comparatively
well which the raters used to evaluate speaking ability. Also the
threshold in this study tends to be ordered from -4.22 logit to 3.85
logit sequentially so that the rating scale functioned properly. Taken
together, these findings strongly confirmed that the five-point rating
scale categories properly ordered and working as intended.
By following the results, Korean raters require raters’ training course
in spite of their reliable ratings. In some rating areas, they still show
some lack of inconsistency and biased rating trend. Overall, this study
has improved our understanding on overall speaking proficiency by
Korean raters. The study analyzes the current measurement as well as
suggests the internal consistency, moderate severity on tasks and cri-
teria, and reliable scaling division on the scoring for Korean raters.
Future investigations on whether the results draw from L1 interference
are required.
References
Bachman, L.F. and Palmer, A.F. (1996). Language testing in practice. Oxford:
Oxford University Press.
Brown, A., Iwashita, N., and McNamara, T. (2002). Getting the balance
right: Criteria in integrated speaking tasks. Paper presented at the 24th
Language Testing Research Colloquium, Hong Kong, December 12-15.
Choi, S.-K. (2011). The reliability study on the writing assessment used by
Rasch models. Reading Stuies 25, 415-445.
Eckes, T. (2010). Many-facet rasch measurement. www.winsteps.com.
Fayer, J.M. and Krasinski, E. (1987). Native and nonnative judgements of in-
telligibility and irritation. Language Learning 37.3, 313-326.
Galloway, V.B. (1980). Perceptions of the communicative efforts of American
students of Spanish. Modern Language Journal 64, 428-433.
Iwashita N., McNamara T., and Elder, C. (2001). Can we predict task diffi-
culty in an oral proficiency test? Exploring the potential of an infor-
mation-processing approach to task design. Language Learning 51.3, 401-436.
Kachru, B.B. (1985). Standards, codification and sociolinguistic realism: The English
A Comparative Study on Criteria and Tasks in Korean English ~ 261
language in the outer circle. In Quirk, R. and Widdowson, H., eds.,
English in the world: Teaching and learning the language and literatures,
11-30, Cambridge: Cambridge University Press.
Kachuru, B.B. (1992). The other tongue: English across cultures. Urbana, IL:
University of Illinois Press.
Kang, S.-H. and Rhee S.-C. (2011). A study on the suprasegmental parame-
ters exerting an effect on the judgment of goodness or badness on Korean
spoken English. Malsori and Speech Science 3.2, 3-10.
Kang, S.-H., Guion-Anderson, Rhee, S.-C., and Ahn, H.-K. (2012). The effect
of language immersion on the acquisition of second language supraseg-
mentals. Applied Linguistics 28.1, 181-208.
Kim, J.-K. (2006). A validation study on the interview test in an university
English program. English Linguistics 6.1, 1-20.
Kim, Y.-H. (2009). An investigation into native and non-native teachers’
judgements of oral English performance: A mixed methods approach.
Language teaching 26.2, 187-217.
Lincare, J.M. (2008). A user’s guide to facets: Rasch-model computer programs.
www.winsteps.com.
Lee, C.-H. (2010). Improving inter-rater reliability in oral proficiency test at
college level. Modern Studies in English Language & Literature 54.1. 367-387.
Lowenberg, P.H. (2000). Assessing English proficiency in the global context: The
significance of non-native norms. In Kam, H. W., eds., Language in the
global context: Implications for the language classroom, 207-228. Singapore:
SEAMEO Regional Language Center.
Lowenberg, P.H. (2002). Assessing English proficiency in the expanding circle.
World Englishes 21, 431-435.
Luoma, S. (2004). Assessing speaking. Cambridge: Cambridge University Press.
McNamara, T.F. (1996). Measuring second language performance. London:
Longman.
Myford, C.M. and Wolfe, E.W. (2004). Detecting and measuring rater effects us-
ing many-facet Rash measurement. In Smith & Smith, eds., Introduction to
Rasch measurement. Maple Grove, MN: JAM Press.
North, B. and Schneider, G. (1998). Scaling descriptors for language proficien-
cy scales. Language Testing 15.2, 217-262.
Proficiency Standards Division (1999). OPI 2000 Tester certification workshop.
Monterey: Foreign Language Center.
Ross, J.R. (1979). Where’s English? In Fillmore, Kempler, and Wang, eds.,
Individual differences in language ability and language behavior. New
York: Academia Press.
Shin, D.-I. (2006). English assessment in Korea. Seoul: Hankook Munwhasa.
Skehan. (2003). Task-based instruction. Language Learning 36.1, 1-14.
Taylor, L.B. (2006). The changing landscape of English: Implications for lan-
262 Seokhan Kang and Hyunkee Ahn
guage assessment. ELT Journal 60, 51-60.
Weigle, S.C. (1998). Using FACETS to model rater training effects. Language
Testing 15, 263-287.
Wright, B.D. and Linacre, J.M. (1994). reasonable mean-square fit values.
Rasch measurement: Transactions of the Rasch measurement SIG, 8,
370.
Yoon, W.-H. (2009). The difference between native and non-native raters on
Korean English speaking. Study of Language Science 48, 201-217.
Zhang, Y. and Elder, C. (2011). Judgements of oral proficiency by non-native
and native English speaking teacher raters: Competing or complementary
constructs? Language Testing 28.1, 31-50.
Seokhan Kang
Institute of Foreign Language Education
Seoul National University
1 Gwanak-ro Gwanak-gu, Seoul 151-748, Korea
E-mail: [email protected]
https://sites.google.com/site/reall2research
Hyunkee Ahn
Department of English Education
Seoul National University
1 Gwanak-ro Gwanak-gu, Seoul 151-748, Korea
E-mail: [email protected]
Received : July 15, 2012
Revised version received: July 23, 2012
Accepted: August 3, 2012