Civil service in developed & developing countries a comparative study

A COMPARATIVE STUDY OF THE SERVICE
QUALITY OF CASUAL DINING RESTAURANTS IN
PHUKET: PERSPECTIVE OF THAI AND
INTERNATIONAL CUSTOMERS
By
ARISARA SEYANONT
Bachelor of Science in Accounting Bangkok University Bangkok, Thailand
1995
Master of Business Administration Jacksonville State University
Jacksonville, Alabama 1998
Submitted to the Faculty of the Graduate College of the
Oklahoma State University in partial fulfillment of
the requirements for the Degree of
DOCTOR OF PHILOSOPHY May, 2007

ii
A COMPARATIVE STUDY OF THE SERVICE
QUALITY OF CASUAL DINING RESTAURANTS IN
PHUKET: PERSPECTIVE OF THAI AND
INTERNATIONAL CUSTOMERS
Dissertation Approved:
Jerrold K. Leong, Ph.D., FMP Dissertation Advisor
Radesh Palakurthi, Ph.D.
Gregory E. Dunn, Ph.D.
Edward L. Harris, Ph. D.
A. Gordon Emslie, Ph.D. Dean of the Graduate College

iii
ACKNOWLEDGMENTS
First, I would like to thank my husband and my son, Apichart and Austin
Roongurang, who have supported me in completing this study successfully. Next, I
would like to thank my parents, Sanan and Patcharee Seyanont, who have given me their
endless support and encouragement to achieve my goals. Also, I thank both my sisters in
Thailand, who have provided their love and confidence in me.
This dissertation would have not been completed without the support of many
people who have been very kind to me. Their advise, guidance, and patience have
enriched my whole graduate experience. I would like to take this opportunity to thank
my dissertation chair and advisor, Dr. Jerrold K. Leong, who has been very supportive
and has provided exemplary guidance and supervision; thus, he insured that I completed
everything in a timely manner. I have admired his persistence and patience in dealing
with students.
I would like to thank Dr. Hailin Qu for his support and guidance through out my
program. My sincere appreciation is extended to the members of my advisory
committee: Dr. Radesh Palakurthi, Dr. Gregory E. Dunn, and Dr. Edward L. Harris,
whose supervision, comments, ideas, constructive criticism, and encouragement will
always be remembered. Everyone on the committee was very helpful and
accommodating throughout my doctoral pursuit at Oklahoma State University.

iv
TABLE OF CONTENTS
Chapter Page I. INTRODUCTION......................................................................................................1
Problem Statement ...................................................................................................5
Purpose of the Study ................................................................................................5 Objectives ................................................................................................................6 Definition of Terms..................................................................................................6 Research Questions..................................................................................................8 Significance of the Study.......................................................................................10 Assumptions...........................................................................................................11 Limitations .............................................................................................................11 Chapter Summary ..................................................................................................12
II. REVIEW OF LITERATURE..................................................................................13
Defining Service Quality .......................................................................................13 Dimensions of Service Quality ..............................................................................15 Perceived Service Quality......................................................................................19 Measuring Service Quality ....................................................................................21 SERVQUAL ..........................................................................................................24 Customer Satisfaction ............................................................................................34 Service Quality and Customer Satisfaction .....................................................36 Customer Loyalty...................................................................................................39 Customer Satisfaction and Customer Loyalty ..................................................41 Chapter Summary ..................................................................................................43
III. METHODOLOGY ................................................................................................44
Population ..............................................................................................................44 Sampling and Sample Size.....................................................................................45 Instruments.............................................................................................................46 Pilot Study Instrument .....................................................................................46 Reliability and Validity of Service Quality ......................................................47

v
Reliability and Validity of Customer Satisfaction ............................................49 Reliability and Validity of Customer Loyalty ..................................................50 Research Design.....................................................................................................51 Data Collection ......................................................................................................51 Data Analysis .........................................................................................................52 Descriptive Statistics.........................................................................................54 Factor Analysis .................................................................................................54 Correlation Analysis .........................................................................................55 Multiple Regression Analysis ...........................................................................55 Analysis of Variance (ANOVA).......................................................................57 Independent-Samples t Test ..............................................................................57 Chi-Square Tests of Independence ...................................................................58 Chapter Summary ..................................................................................................58
IV. RESULTS..............................................................................................................59
Pilot Study Results.................................................................................................59 Reliability of the Instrument of Pilot Study.....................................................66 Correlation Analysis ........................................................................................67 Multiple Regression Analysis ..........................................................................68 One-Way Analysis of Variance .......................................................................78 Description of the Subjects ....................................................................................87 Customers’ Demographics.....................................................................................88 Factor Analysis ......................................................................................................90 Reliability of the Instrument ..................................................................................95 Results of Hypotheses Testing...............................................................................96 Correlation Analysis ........................................................................................96 Multiple Regression Analysis ..........................................................................98 One-Way Analysis of Variance (ANOVA) ...................................................110 Independent-Samples t Test .................................................................................130 Service Quality Attributes..............................................................................130 Overall Service Quality..................................................................................130 Chi-Square Tests of Independence ......................................................................134 Chapter Summary ................................................................................................171
V. CONCLUSIONS..................................................................................................173
Discussion of Findings.........................................................................................173 Pilot Study Results.........................................................................................173 Correlation Analysis ......................................................................................174 Multiple Regression Analysis ........................................................................175 One-Way Analysis of Variance (ANOVA) ...................................................176 Full Model Study Results...............................................................................177 Correlation Analysis ......................................................................................179

vi
Multiple Regression Analysis ........................................................................179 One-Way Analysis of Variance (ANOVA) ...................................................180 Independent-Samples t Test ...........................................................................182 Chi-Square Tests of Independence ................................................................183 Conclusions..........................................................................................................186 Implications..........................................................................................................188 Managerial Implications ................................................................................188 Recommendations................................................................................................192 Limitations and Future Research .........................................................................193 REFERENCES ..........................................................................................................195 APPENDICES ...........................................................................................................203 Appendix A Institutional Review Board Approval .............................................204 Appendix B Cover Letter.....................................................................................206 Appendix C English Questionnaire .....................................................................208 Appendix D Thai Questionnaire ..........................................................................211

vii
LIST OF TABLES
Table Page
1. Hypotheses of Service Quality in Casual Dining Restaurants...............................9 2. Ten Dimensions of Service Quality.....................................................................16 3. Five Dimensions of Service Quality ....................................................................18 4. Summarized Literature Review of SERVQUAL.................................................31 5. Statistical Techniques Employed in this Study....................................................53 6. Demographic Characteristics of Respondents of Pilot Study..............................62 7. Descriptive of Service Quality Attributes............................................................64 8. Factor Analysis of Pilot Study .............................................................................65 9. Reliability of Each of the Measurements for Pilot Study ....................................66 10. Correlation between Service Quality Factors and Overall Customer Satisfaction .............................................................................67 11. Correlation between Overall Customer Satisfaction and Customer Loyalty.................................................................................................68 12. Regression Model of Hypothesis 4 ......................................................................70 13. Regression Model of Hypothesis 5 ......................................................................72 14. Regression Model of Hypothesis 6 ......................................................................74 15. Regression Model of Hypothesis 7 ......................................................................75 16. Regression Model of Hypothesis 8 ......................................................................77 17. ANOVA of Service Quality Factor 1 – Environment Service Provider by Dining Frequency............................................................................................79 18. ANOVA of Service Quality Factor 4 – Service Providers’ Initiative in Guest’s Service by Dining Frequency .............................................................81 19. ANOVA of Weighted Tangibles by Per Capita Expenditures for Each Meal.......................................................................................................82 20. ANOVA of Weighted Responsiveness by Dining Frequency and Per Capita Expenditures for Each Meal ........................................................83 21. ANOVA of Weighted Empathy by Per Capita Expenditures for Each Meal.......................................................................................................84 22. Comparative of ANOVA of Service Quality Factors and Overall Service Quality by Customers’ Demographic Profiles of Pilot Study..............................86 23. Demographic Characteristics of Respondents of Full Study. ..............................89 24. Descriptive of Service Quality Attributes of Full Study......................................93

viii
25. Factor Analysis of Full Study ..............................................................................94 26. Reliability of Each of the Measurements for Full Study .....................................95 27. Correlation between Service Quality Factors and Overall Customer Satisfaction .............................................................................97 28. Correlation between Overall Customer Satisfaction and Customer Loyalty.................................................................................................98 29. Regression Model of Hypothesis 4. ...................................................................100 30. Regression Model of Hypothesis 5 ....................................................................102 31. Regression Model of Hypothesis 6 ....................................................................105 32. Regression Model of Hypothesis 7 ....................................................................107 33. Regression Model of Hypothesis 8 ....................................................................109 34. ANOVA of Service Quality Factor 1 – Personnel and Customers’ Relationship by Per Capita Expenditures for Each Meal...................................111 35. ANOVA of Service Quality Factor 2 – Environment Service Provider by Per Capita Expenditures for Each Meal........................................................112 36. ANOVA of Service Quality Factor 3 – Service Providers Attitudes and Competencies by Gender and Per Capita Expenditures for Each Meal.............113 37. ANOVA of Service Quality Factor 4 – Service Providers’ Initiatives in Guest’s Service by Gender, Age, and Per Capita Expenditures for Each Meal.....................................................................................................114 38. ANOVA of Weighted Tangibles by Gender and Per Capita
Expenditures for Each Meal...............................................................................117 39. ANOVA of Weighted Reliability by Gender, Age, and Per Capita Expenditures for Each Meal.............................................................118 40. ANOVA of Weighted Responsiveness by Gender, Age, and Per Capita Expenditures for Each Meal.............................................................120 41. ANOVA of Weighted Assurance by Gender and Per Capita Expenditures for Each Meal.............................................................122 42. ANOVA of Weighted Empathy by Gender, Age, and Per Capita Expenditures for Each Meal.............................................................123 43. ANOVA of Weighted Reliability, Responsiveness, Assurance,
and Empathy by Type of Customers (Thai and International) ..........................125 44. ANOVA of Weighted Responsiveness, Assurance, and Empathy
by Type of Casual Dining Restaurants ..............................................................128 45. Comparative of ANOVA of Service Quality Factors and Overall Service Quality by Customers’ Demographic Profiles of Full Study.............................129 46. Independent-Samples t Test of Service Quality Attributes by Type of Customers (N = 500) .......................................................................132 47. Independent-Samples t Test of Overall Service Quality by Type of Customers (N =500) ........................................................................133 48. Chi-Square Test of Thai and International Customers between Service Quality Attributes and Customers Demographic Profiles .................................135 49. Crosstabulation of Thai Customers between Service Quality Attributes and Gender .........................................................................................................136 50. Crosstabulation of International Customers between Service Quality Attributes and Gender ........................................................................................139

ix
51. Crosstabulation of Thai Customers between Service Quality Attributes and Age ..............................................................................................................142 52. Crosstabulation of International Customers between Service Quality Attributes and Age .............................................................................................146 53. Crosstabulation of Thai Customers between Service Quality Attributes and Marital Status ..............................................................................................150 54. Crosstabulation of International Customers between Service Quality
Attributes and Marital Status .............................................................................152 55. Crosstabulation of Thai Customers between Service Quality Attributes and Dining Frequency per Month ......................................................................154 56. Crosstabulation of International Customers between Service Quality Attributes and Dining Frequency per Month .....................................................157 57. Crosstabulation of Thai Customers between Service Quality Attributes and Per Capita Expenditures for Each Meal ......................................................162 58. Crosstabulation of International Customers between Service Quality
Attributes and Per Capita Expenditures for Each Meal .....................................166

x
LIST OF FIGURES
Figure Page
1. Conceptual Model of Service Quality....................................................................10 2. Conceptual Model of Pilot Study...........................................................................61 3. Restaurant Distribution ..........................................................................................87 4. Conceptual Model of Full Study............................................................................92

1
CHAPTER I
INTRODUCTION
According to World Tourism Barometer (WTO), Thailand’s international tourism
rebounded in 2004 and reached to 760 million of international tourist arrivals, up thirteen
percent over 2003 (Hospitality Net, 2005). The Thai economy turned around a growth of
five percent in 2004 (Hospitality Net, 2005). Customer confidence has returned and
Thais have again started to spend money, which is having a positive effect on the food
service sector. More business people are dining out and entertaining their business
guests, making tourism continue to grow. The higher end of the food service market can
be expected to grow at a healthy rate in the years ahead, which will make imported foods
benefit from the growth in this market segment.
Phuket, Thailand’s largest island, is located approximately 862 kilometers south
of Bangkok. Phuket is a tourist destination and is full of the variety of tourism resources.
A study ranked Phuket attractions according to the top three of satisfactions of tourists:
first, beach/natural beauty/climate were given 63 percent, second, food was given 52
percent, and third, local hospitality 43 percent (Tourism Authority of Thailand, 2001).
Since food in Phuket is the second thing that satisfies the tourists, restaurants should
develop service standards and service quality to meet customer satisfaction.

2
According to the Phuket official census, Phuket Tourism Statistics 2005 showed
289,584 people living in Phuket (permanent residents) with 139, 506 males and 150,078
females. The guest arrivals at accommodation establishments in Phuket in 2005 were
totaled 1,971,181, including 824,330 Thai and 1,146,851 foreigners. Moreover, the
domestic tourism in Phuket in 2005 was 1,188,621 Thai visitors and 1,321,655 foreigner
visitors, 1,108,444 Thai tourists, and 1,266,900 Foreigner tourists. Phuket has seventy-
eight restaurants: twenty-one casual dining restaurants, twenty-five fine dining
restaurants at Hotels and Resorts, two fine dining restaurants at Yacht Clubs, two fine
dining restaurants, and two buffets dinner shows (Phuket Dining Guide, 2006; Restaurant
Preview, 2006). There are cuisine types, such as Austrian, French, Mediterranean,
German, Indian, International, Italian, Japanese, Scandinavian/European, Steakhouse, and
Thai. (Where to Eat in Phuket, 2006).
The restaurant industry is one of the most competitive industries in the world
today. The fastest-growing segment of the restaurant industry is casual dining, where
sales are increasing at double-digit rates. The restaurant industry has certainly not been
exempt from either increased competition or from rising consumer expectations of
quality. In the highly competitive food service industry, large chain operators have
tended to gain competitive advantages through cost leadership. The industry depends on
standardization and economies of arising scale, due to large market shares, whereas
smaller, independent restaurants attempt to gain advantage through differentiation.
As the service sector continues to expand, the issue of service quality has received
increasingly more attention. The casual dining customer has many choices when dining
out in restaurants. The customer is impatient and sophisticated. If the restaurant is not

3
providing satisfaction, service quality, and value, he/she will leave to another restaurant.
Over the last 20 years, a significant amount of literature has emerged which has increased
our understanding of the difficulties associated with delivering quality service, but fallen
short of providing service managers with the tools they need to put quality control into
action. In services, the intangible and heterogeneous characteristics associated with the
delivery process, and the inseparability of service production from service consumption
continue to provide a hurdle for those who seek to establish the well-defined standards
which are a prerequisite for quality control.
In highly competitive casual dining restaurants in Phuket, restaurateurs are
increasingly concerned with satisfying customers, who are not easily satisfied with the
restaurants’ service quality. One of the reasons for the lack of focus on customer
satisfaction may be because the concept of service quality has been difficult to define,
measure, and maintain. Customer satisfaction and service quality are prominent
marketing factors. The service does not stop at purchasing. Rather, its relationships with
customers go on to post-purchase behavior. It is recognized that customer satisfaction is
not sufficient to secure customer loyalty. Researchers found that satisfied customers
express a tendency to switch to competitors (Mittal and Lasser, 1998). Jones and Sasser
(1995) stressed a distinction between completely satisfied customers and satisfied
customers. Completely satisfied customers are significantly more likely to repurchase
company’s products than simply satisfied customers are. To increase customer
satisfaction and customer loyalty, casual dining restaurant owners must strive for better
service through service quality.

4
One of the biggest contemporary challenges of management in service industries
is providing and maintaining customer satisfaction. Service quality and customer
satisfaction have increasingly been identified as key factors in the battle for competitive
differentiation and customer loyalty. Service management literature stated that customer
satisfaction is the result of a customer’s perception of the value received in a transaction
or relationship---where value equals perceived service quality relative to price and
customer acquisition costs (Blanchard and Galloway, 1994).
Researchers agreed that service quality is an elusive an abstract construct that is
difficult to define and measure (Parasuraman, Zeithaml, and Berry, 1985). Parasuraman,
Zeithaml, and Berry (1985) suggested that service quality is evaluated by the gap
between expected service and perceived service. These researchers exploratory research
indicated that despite the different types of services offered, customers used similar
criteria when judging service quality. In 1988, these researchers developed the
instrument called “SERVQUAL” and tested this concept. Parasuraman, Berry, and
Zeithaml (1991b) refined and reassessed SERVQUAL’s psychometric properties and
indicated SERVQUAL could be used as a diagnostic methodology for undercovering a
company’s service quality shortfalls and identifying its strengths.
The SERVQUAL instrument is designed for use in a broad set of service
businesses and it encompasses statements for each of the five dimensions. The
SERVQUAL measure has been criticized and supported since its development. Most of
the SERVQUAL instrument’s problems were tied to using the different scores. The five
dimensional format of SERVQUAL allows a firm to assess its level of service quality
along each dimension, as well as overall. The instrument can also be used to categorize a

5
firm’s customers into several perceived quality segments (e.g. high, medium, low) based
on their individual SERVQUAL scores. The SERVQUAL can be used to compare and
contrast demographic characteristics to gain managerial insights.
Problem Statement
There is an urgent need to investigate the economic environment surrounding the
competitive business strategy of casual dining restaurants. The current trends indicate
that there is needed improvement in the study of service quality, customer satisfaction
and loyalty. However, there is no research about the relationship of service quality,
customer satisfaction, and customer loyalty related to restaurants in Phuket. The study
will provide information for casual dining restaurant businesses to be more competitive in
the current business practices circumstances.
Purpose of the Study
The purpose of this study was to examine the relationships between service
quality, customer satisfaction, and customer loyalty (word-of-mouth endorsements and
repurchase intention). The researcher adapted SERVQUAL model (Parasuraman,
Zeithaml, and Berry, 1988) to assess the customers’ perspective of service quality in
casual dining restaurants in Phuket. Additionally, this study was designed to determine
which attributes of service quality had significant differences in customers’ demographic
profiles (gender, age, dining frequency, and per capita expenditures for each meal).

6
Objectives
The following four objectives are addressed in this study:
1. To determine how the attributes of service quality (tangibles, reliability,
responsiveness, assurance, and empathy) have influenced and affected customer
satisfaction in the casual dining restaurants.
2. To determine the level of satisfaction customers receive at casual dining restaurants.
3. To determine the relationship between customer satisfaction and customer loyalty.
4. To determine the influences of customer satisfaction on word-of-mouth and
repurchase intention.
Definition of Terms
For the purpose of this study, the following terms are defined:
1. Casual Dining – A casual dining restaurant is a restaurant that serves moderately
priced food in a casual atmosphere. Except for buffet-style restaurants, casual dining
restaurants typically provide table service. Casual dining comprises a market
segment between fast food establishments and fine dining restaurants. Some casual
dining restaurants serve beer or wine with meals or include a bar where alcoholic
beverages are served, but they are generally distinct from drinking establishments
(Wikipedia, 2006).
2. Customer Loyalty – is defined as “ a deeply held commitment to rebuy or repatronize
a preferred product or service consistently in the future, there by causing repetitive
same brand set purchasing, despite situational influences’ and marketing efforts’
having the potential to cause switching behavior” (Skogland and Siguaw, 2004),

7
3. Customer Satisfaction –is defined as “ the level of a persons felt state resulting from
comparing a product’s perceived performance or outcome in violation to his/her own
expectations” (Kotler, 1996).
4. Overall Service Quality – is a measure of how well the service level matches
customer expectations. Overall service quality is described as “the consumer’s
judgment about an entity’s overall service quality and can be viewed as a form of
attitude resulting in comparison of expectations and perceptions of the service
performance.” Delivering a high level of overall service quality means conforming to
customer expectations on a consistent basis (Lewis and Booms, 1983).
5. Perceived Service Quality (PSQ) – is defined as “a global judgment or attitude
relating to the superiority of a service”. From their perspective, the perception of
service quality is a reflection of the degree and direction of discrepancy between
consumers’ perceptions and expectations (Parasuraman, Zeithaml, and Berry, 1985).
6. Service Quality – is defined as “the global evaluation or attitude of overall excellence
of services”. Thus, service quality is the difference between customers’ expectation
and perceptions of services delivered by service firms (Parasuraman, Zeithaml, and
Berry, 1988).

8
Research Questions
This study was conducted on the basis of the following research questions:
1. Is there a relationship between service quality factors and overall customer
satisfaction?
2. Is there a relationship between overall customer satisfaction and word-of-mouth
endorsements?
3. Is there a relationship between overall customer satisfaction and repurchase intention?
4. To what extent do service quality factors predict overall customer satisfaction?
5. To what extent do service quality factors predict word-of-mouth endorsements?
6. To what extent do service quality factors predict repurchase intention?
7. To what extent does overall customer satisfaction predict word-of-mouth
endorsements?
8. To what extent does overall customer satisfaction predict repurchase intention?
9. Do service quality factors significant difference in customers’ demographic profile
(gender, age, dining frequency, and per capita expenditures for each meal)?
10. Do overall service quality significant difference in customers’ demographic profile
(gender, age, dining frequency, and per capita expenditures for each meal)?
11. Do overall service quality significant difference between type of customers (Thai and
international)?
12. Do overall service quality significant difference in type of casual dining restaurants?

9
Table 1
Hypotheses of Service Quality in Casual Dining Restaurants
Hypotheses Antecedents of Service Quality Factors
H1: There is a positive relationship between service quality factors and overall
customer satisfaction.
H2: There is a positive relationship between overall customer satisfaction and
word-of-mouth endorsements.
H3: There is a positive relationship between overall customer satisfaction and
repurchase intention.
H4: Service quality factors have a positive impact on overall customer satisfaction.
H5: Service quality factors have a positive impact on word-of-mouth endorsements.
H6: Service quality factors have a positive impact on repurchase intention.
H7: Overall customer satisfaction has a positive impact on word-of-mouth
endorsements.
H8: Overall customer satisfaction has a positive impact on repurchase intention.
H9: There is a significant difference in service quality factors based on customers’
demographic profile (gender, age, dining frequency, and per capita expenditures
for each
H10: There is a significant difference in overall service quality based on customers’
demographic profile (gender, age, dining frequency, and per capita expenditures
for each meal).
H11: There is a significant difference in overall service quality between type of
customers (Thai and International).
H12: There is a significant difference in overall service quality with type of casual
dining restaurants.

10
Figure 1
Conceptual Model of Service Quality
Service Quality Dimensions Customer Loyalty
Significance of the Study
This research contributed both academically and practically. First, this study
provided evidence of the service quality factors that influenced customer satisfaction.
These factors were used to predict the likelihood of predicting increased repurchase
intentions and word-of-mouth endorsements. Second, this study enhanced the knowledge
and understanding of the relationships among service quality, customer satisfaction, and
customer loyalty.
Overall Customer Satisfaction
Tangibles
Reliability
Responsiveness
Assurance
H4
H6
Attitudinal
Behavioral
Word-of-Mouth
Repurchase Intention
Customers’ Demographic Profile
H1 H2
H3
H8
H7
Empathy
H5
Overall Service Quality
H
H9
H10 H11 H12

11
Practically, the findings from this study provided an in depth comparison between
domestic customers and international tourists who frequent casual dining restaurant in
Phuket. First, this study provided recommendations and best practices to implement that
may improve service quality, customer satisfaction, and customer loyalty for each type of
casual dining business. Second, customers provided feedback regarding the quality of
products and services, and this information was used to design strategic interventions to
improve the level of customer satisfaction and customer loyalty.
Assumptions
The study was based on the following assumptions:
1. The researcher chose validity measurement scales to measure the study variables.
2. Respondents expressed their perceptions of service quality in casual dining
restaurants with personal opinions.
3. The study generated useful information for the researcher and the restaurant industry
Limitations
The study was limited as follows:
1. The participants for this study were randomly selected from four casual dining
restaurants (Japanese, Thai, Italian, and Mediterranean) in Phuket. Hence, the results
and conclusions may not be universally applicable but may only be specific to the
casual dining restaurants.
2. This study involved only three dependent variables, overall customer satisfaction,
word-of-mouth endorsements, and repurchase intention.

12
3. The original questionnaire written in English was translated into Thai and the final
results will be reported in English.
4. Results were based on the data reported in the questionnaires completed by the
customers selected from four casual dining restaurants in Phuket.
Chapter Summary
Chapter 1 provided an outline of the research purpose, questions, hypotheses, and
conceptual model of this study. Chapter 2 provides an in-dept theoretical background
with respect to the constructs that appear in this study. It presents a review of the
literature on the concept of service quality, and the dimensions of service quality that
appear in hospitality and service industry.

13
CHAPTER II
REVIEW OF LITERATURE
In this chapter, the theoretical bases for this study are supported by a discussion of
previous studies and existing research relevant to the constructs of interest in the model
and their proposed relationships. The importance of service has obtained a substantial
amount of attention by many managers and academic scholars in a variety of fields.
Identifying the nature of the relationship between service quality and relevant constructs
appears to be advantageous as it assists in the development of better managerial
decisions. The review of literature is organized in seven sections: 1) defining service
quality, 2) dimensions of service quality, 3) perceived service quality, 4) measuring
service quality, 5) SERVQUAL, 6) customer satisfaction, and 7) customer loyalty.
Defining Service Quality
The study of service quality in the field of general marketing has evolved into
important parameters that need to be identified and understood in order to satisfy the
needs and wants of customers (Parasuraman, Zeithaml, and Berry, 1988). These
researchers defined service quality as the result of comparing the expectation of service
quality and the perception of feelings. That is, the service quality not only includes the

14
evaluation of the service performances, but also includes the process of service
(Parasuraman, Zeithaml, and Berry, 1985, 1988).
Since the success of a business has been linked to providing high levels of
service, a substantial amount of effort has been focused on identifying how consumers
perceive service quality in various setting. Gronroos (1982) defined service quality as
“the outcome of an evaluation process where the consumer compares his expectations
with the service he perceived he has received.” In other words, perceived service is
measured against expected service. Service quality has been seen as the result of
comparing a customer’s expectations prior to receiving the service with the customer’s
experiences with the service. Wyckoff (1984) defined the concept of service quality from
the company’s perspective. Service quality is the degree of excellence for meeting the
customer’s requirements, and control over the variability in achieving that excellence.
According to Sherden (1988), service quality is defined as a relationship between
a customer and the particular employee with whom the customer is dealing. Although
the actual level of service quality is developed in the employee-customer relationship,
management must ensure that customers’ experiences are in line with their expectations.
Lovelock (1991) defined the characteristics of service quality were as follows: a) that
which is delivered is a performance, b) the customer is involved in production, c) other
customers are often similarly involved in production (e.g., a theater), d) quality control
can only be performed during delivery, e) service cannot be inventoried, f) deliver is
“realtime”, and g) distribution channels are nonexistent or compressed.

15
As discussed earlier, there has been no consensus in defining service quality
among researchers engaged in the study of service quality. However, the definitions
discussed here may provide the basis for understanding the concept of service quality.
Dimension of Service Quality
Examining service quality and its relationship with relevant constructs not only
requires recognition of essential dimensions of service quality, but also identification of
dimensions that are most meaningful to the customers in measuring the overall
satisfaction. Therefore, having a better understanding of service quality is associated
with considering various dimensions of service quality. Service quality dimensions or
attributes are those attributes that contribute to the creation of consumer expectations and
perceptions of service quality (Jennifer, 1998).
Service Quality called “SERVQUAL” is an instrument for measuring the gap
between the services.” Therefore, consumers think should be provided and what they
think actually has been provided. Parasuraman, Zeithaml, and Berry (1985, 1988)
initially ten attributes, which they regard as essential to the quality of all services. These
ten dimensions were tangibles, reliability, responsiveness, communication, credibility,
security, competence, courtesy, understanding/knowing the customer, and access. These
ten dimensions and their descriptions served as the basic structure of the service quality
domain from which items were derived for the SERVQUAL scale (Table 2).

16
Table 2
Ten Dimensions of Service Quality
Dimensions Descriptions
Tangibles: include the physical evidence of the service: physical facilities, appearance of personnel, tools or
equipment used to provide the service, physical representation of the service, other customers in the
service facility.
Reliability: involves consistency of performance and dependability: accuracy in billing, keeping records
correctly, performing the service at the designated time.
Responsiveness: concerns the willingness or readiness of employees to provide service. It involves timeliness of
service: mailing a transaction slip immediately, calling the customer back quickly, and giving
prompt service.
Communication: means keeping customers informed in language they can understand and listening to them. It
involves explaining the service itself, explaining how much the service will cost, explaining the
trade-offs between service and cost, assuring the consumer that a problem will be handled.
Credibility: involves trustworthiness, believability, honesty. It involves having the customer’s best interests at
heart. Contributing to credibility are company name, company reputation, personal characteristics
of the contact personal.
Security: is the freedom from danger, risk, or doubt. It involves physical safety, financial security, and
confidentiality.
Competence: means possession of the required skills and knowledge to perform the service. It involves
knowledge and skill of the contact personnel, knowledge and skill of operational support personnel,
research capability of the organization.
Courtesy: involves politeness, respect, consideration, and friendliness of contact personnel. It includes
consideration for the consumer’s property, clean and neat appearance of public contact personnel.
Understanding/Knowing the Customers:
involves making the effort to understand the customer’s needs. It involves learning the customer’s
specific requirements, providing individualized attention, recognizing the regular customer.
Access: involves approachability and sense of contact. It means the service is easily accessible by
telephone, waiting time to receive service, convenient hours of operation, and convenient location
of service facility.
Note. Parasuraman, A., Zeithaml, V. A., & Berry, L. L. (1985). A Conceptual Model of Service Quality and Its Implication for Future Research. Journal of Marketing, 49(3), 25-46.

17
Parasuraman, Zeithaml, and Berry (1985) found that the criteria used by
consumers in assessing service quality fit ten potentially overlapping dimensions. The
study involved in-depth interviews with executives from large firms in four selected
segments---appliance repair and maintenance, long-distance telephone, retail banking,
and credit cards, plus focus group interviews with customers of these services. It varied
along key dimensions appropriate in the categorization of services.
Parasuraman, Zeithaml, and Berry (1988) suggested SERVQUAL’s five
dimensions framework of service quality (three original and two combined dimensions)
that encompasses tangibles, reliability, responsiveness, assurance, and empathy to
analyze service quality. The last two dimensions (assurance and empathy) contain items
representing seven original dimensions---communication, credibility, security,
competence, courtesy, understanding/knowing customers, and access ---that did not
remain distinct after the two stages of scale purification. The SERVQUAL instrument
consists of five dimensions and separates with two sets of twenty-two item statements for
the “expectation” and “perception” sections of the questionnaire (Table 3).

18
Table 3
Five Dimensions of Service Quality
Dimensions Items
Tangibles: Physical facilities, equipment, and appearance of personnel
1. Modern equipment.
2. Visually appealing facilities.
3. Employees who have a neat, professional appearance
4. Visually appealing materials associated with the service
Reliability: Ability to perform the promised service dependably and accurately
5. Providing services as promised.
6. Dependability in handling customers’ service problems.
7. Performing service right the first time.
8. Providing services at the promised time.
9. Maintaining error-free records.
Responsiveness: Willingness to help customers and provide prompt service
10. Keeping customers informed about when services will be performed.
11. Prompt service to customers.
12. Willingness to help customer
13. Readiness to respond to customers’ requests.
Assurance: Knowledge and courtesy of employees and their ability to inspire trust and confidence
14. Employees who instill confidence in customers.
15. Making customers feel safe in their transactions.
16. Employees who are consistently courteous.
17. Employees who have the knowledge to answer customer questions
Empathy: Caring, individualized attention the firm provides its customers
18. Giving customers individual attention.
19. Employees who deal with customers in a caring fashion.
20. Having the customer’s best interest at heart.
21. Employees who understand the needs of their customers.
22. Convenient business hours.
Note. Parasuraman, A., Zeithaml, V. A., & Berry, L. L. (1988). SERVQUAL: Multiple-Item Scale for Measuring Consumer Perceptions of Service Quality. Journal of Retailing, 64(1), 12-40.

19
The researchers also proposed that service is best measured as the perceived
“gap” between customers’ expectations and the actual service they receive.
There are two crucial key elements: expectation and perception. The satisfaction
literature stated that customers entertain expectations of performance on the service
dimensions, observe performance and perceptions of performance. These two key
concepts are compared through difference scores or “gaps.” In the conceptual work by
Zeithaml and her colleagues, the gap between predictive expectations and perceptions of
performance is defined as satisfaction. The gap of service quality can be done using a
style of questionnaire known as “SERVQUAL”, in which service customers are asked to
scale first the quality expected from the particular service and then the perceived quality
of the actual service performance. According to Parasuraman, Zeithaml, and Berry
(1993) stated that the actual service quality may be calculated by subtracting the
expectation score from the performance score.
Perceived Service Quality
According to Parasuraman, Berry, and Zeithaml (1985, 1988), perceived service
quality is the result of the consumer’s comparison of expected service with the service
received. Cronin and Taylor (1992) stated that in measuring perceived service quality,
the level of comparison is what a customer should expect: whereas in measures of
satisfaction, the appropriate comparison is what a consumer would expect. Teas (1993,
1994) stated that in the services marketing literature, perception are defined as
consumers’ beliefs concerning the service received or experienced service, and
expectations are defined as desires or wants of consumers. Thus, service quality is seen

20
as the result of comparing a customers’ expectation prior to receiving the service with the
customers’ experiences. If expectations are met or exceed, service quality is perceived to
be satisfactory (Liljander and Strandvik, 1993).
Stevens, Knutson, and Patton (1995) stated that perceived service quality is a
function of the interaction among three independent variables: normative expectations,
predictive expectations, and actual service quality. The lower the expectations the
consumers have about what should happen, the better their perceptions of the actual
service. In addition, the higher their expectations about what will happen, the better their
perceptions of the actual service. There are three ways to improve ways to improve
customers’ perceptions about service: improve the service, lower the expectations of what
should happen, and raise the expectations about what will happen.
Lewis and Klein (1988) stated that perceived service quality will affect consumer
satisfaction. The main difference between satisfaction and perceived service quality is
that the concept of satisfaction is connected with a specific transaction while service
quality is considered to be the consumers’ overall evaluation of the service, and
resembles the attitude concept. Teas (1993) explain that the confusion between
satisfaction and perceived service quality is due to the lack of consensus on the definition
and operationalizations of the two constructs.
Zeithaml (1987, 1988) treated perceived quality as a beneficial attribute and
distinguished it from price. She defined perceived quality as the consumer’s judgment of
a product’s overall excellence or superiority. Service quality assessments can range from
“bad” to “good”. It differs from objective quality (as define by, for example, Garvin,

21
1983 and Hjorth, 1984); it is a form of attitude, related but not equivalent to satisfaction,
and results from a comparison of expectations with perceptions of performance.
Heung, Wong, and Qu (2000) stated that in developing the SERVQUAL model,
Parasuraman, Zeithaml, and Berry defined perceived service quality as “a global
judgment, or attitude, relation to the superiority of the service.” However, the service
quality should be defined and measured from the customer’s perspective (Gavin, 1983;
Parasuraman, Zeithaml, and Berry, 1988; Brown and Swartz, 1989). The most widely
accepted definition of perceived service quality is that it represents the discrepancy
between customers’ expectations and their perceptions of the service performance (Lewis
and Booms, 1983; Gronroos, 1984; Parasuraman, Zeithaml, and Berry, 1988).
As discussed earlier, a perception of high service quality leads to a firms’ success
via customer satisfaction. In obtaining a high level of perceived service quality is a
positive strategy for attracting higher levels of customer repurchase behavior.
Basically, satisfaction is a major outcome of marketing activity and leads to customer
loyalty and positive word-of-mouth recommendations concerning the firm’s provision of
services.
Measuring Service Quality
Delivering superior service quality appears to be a prerequisite for success
(Parasuraman, Zeithaml, and Berry, 1988). Interest in the measurement of service quality
is understandably high due to the fact that delivering high levels of service quality has
been know to be a key to service providers’ efforts to position themselves more
effectively in the competitive market place (Cronin and Taylor, 1992). In an effort to

22
explain how customers perceive service quality, SERVQUAL instrument is as a valid
measure of service quality. SERVQUAL has been applied in numerous ways to measure
service quality within the hotel and restaurant industry. SERVQUAL uses to compare a
number of tools for measuring perceived service quality. Augustyn and Ho (1998)
concluded the SERVQUAL model was the most useful of those that they examined for
defining customer satisfaction.
Sasser, Olsen, and Wyckoff (1978) believed that service quality includes the
following seven constructions or attributes: 1) security, 2) consistency, 3) attitude, 4)
completeness, 5) condition, 6) availability, and 7) timing. Wyckoff (1984) stated that
measuring satisfaction of customers of service organizations is still one of the most
subjective and difficult parts of managing service quality. The measurement of customer
satisfaction can be achieved from the formal surveys that are carefully examined by
controlling the sample.
Parasuraman, Zeithaml, and Berry (1985) announced the concept of service
quality; it included the five gaps created by service delivery and communication process
between consumer and the service provider. Thus defining the perceived service quality
of the consumer as the difference between expected service and perceived service
received, called “service quality (Q) = perceived service (P) – expected service (E)”. In
1988, Parasuraman and his colleagues considered its benefits and simplication ten service
quality attributes into five attributes, establishing the SERVQUAL to be used in the
measuring of service quality. This measurement uses the perspective of the consumers to
evaluate the expectations of consumers, and the differences of the consumers’ perception

23
performance with other service providers. In the Parasuraman, Zeithaml, and Berry
model, the service quality measurement is divided into five dimensions. The
SERVQUAL measuring will measure expectations and perceptions of the customers with
twenty-two pairs of items designed to capture five dimensions: 1) tangibles, 2) reliability,
3) responsiveness, 4) assurance, and 5) empathy. Each item is assessed on a seven-point
Likert scale with 1 = strongly disagree and 7 = strongly agree.
The expectations component of SERVQUAL is a general measure and pertains to
customers’ normative standards, i.e., the service levels customers believe excellent
companies in a sector must deliver. The perceptions component pertains to customers’
perceptions of a given company’s service within the sector. Parasuraman, Zeithaml, and
Berry (1993) stated that if Customer A has a higher SERVQUAL expectation score for
the appearance of department stores than does Customer B, it does not necessarily follow
higher than would Customer B. The correlation between the SERVQUAL expectations
and perceptions may be merely an artifact of both measures appearing on the same
instrument (i.e., shared method variance). These researchers study showed that very
strong reliabilities for the two components of SERVQUAL were .94 for expectations and
.96 for perceptions.
As discussed earlier, service quality is to become a critical element of marketing
strategy, and then marketers must be able to measure their customers’ perceptions of
service quality. In fact, selecting and utilizing a quality assessment tool for measuring
service quality in specific service contexts can contribute to the enhancement of service
quality. In this part of the literature review, it is necessary to be concerned with the
important aspects and development process of outstanding service quality instruments.

24
SERVQUAL
SERVQUAL is a concise multiple-item scale with good reliability and validity
that companies can use to better understand the service expectations and perceptions of
their customers (Parasuraman, Zeithaml, and Berry, 1986).
Parasuraman, Zeithaml, and Berry (1985) developed a “comprehensive
measurement instrument named SERVQUAL which has been most widely adopted as an
instrument to measure the perceptions of service quality.” The service quality instrument
named SERVQUAL involves the calculation of the differences between expectations and
perceptions on five service quality dimensions in service and retailing organizations.
Items on the SERVQUAL instrument are assessed on a seven-point Likert scale from
“strongly disagree” to “strongly agree.”
First stage, the researchers used ten service-quality dimensions (tangibles,
reliability, responsiveness, understanding/knowing customers, access, communication,
credibility, security, competence, and courtesy), and generated ninety-seven items
(approximately ten items per dimension). The two-part questionnaire consisted of a
ninety-seven statement expectations part followed by a ninety-seven statement
perceptions part. The respondents were instructed to indicate the level of service by
using a seven-point Likert scale rated on 1 = strongly disagree to 7 = strongly agree. The
researchers used the OBLIMIN procedure in SPSS-X to delete the intercorrelations
among the dimensions and to facilitate easy interpretation. The deletion of certain items
and the final resulted in thirty-seven items representing seven distinct dimensions. The
five of the original ten dimensions—tangibles, reliability, responsiveness,
understanding/knowing customers, and access remained distinct. The remaining five

25
dimensions—communication, credibility, security, competence, and courtesy—collapsed
into two distinct dimensions (D4 and D5), each consisting of items from several of the
original five dimensions.
During the second stage, the researchers used seven dimensions and generated a
thirty-seven items scale to measure the service quality of the four firms. Data was
collected pertaining to the service quality of four service types: a bank, a credit-card
company, a firm offering appliance repair and maintenance services, and a long-distance
telephone company. The researchers surveyed 200 customers and a seven-point Likert
scale (1 = strongly disagree to 7 = strongly agree) was used to rate the service quality
attributes. The findings showed that a few items with relatively low item-to-total
correlations were deleted by using factor analysis. The final procedure resulted in a
refined scale SERVQUAL with twenty-two items spread among five dimensions:
tangibles, reliability, responsiveness, assurance, and empathy. The last two dimensions
(assurance and empathy) contained items representing seven original dimensions—
communication, credibility, security, competence, courtesy, understanding/knowing
customers, and access.
Mersha and Adlakha (1992) adapted SERVQUAL instrument of Parasuraman,
Zeithaml, and Berry (1988) for measuring customer perceptions of service quality in five
service types: physician services, retail banking, auto maintenance, colleges/universities,
and fast food restaurants. The questionnaire included twelve attributes each of good and
poor service quality, and a five-point Likert scale was used to indicate the attributes. The
findings showed that the top three attributes for good service were: 1) the knowledge of
the service, 2) thoroughness/accuracy, and 3) consistency/reliability. The most three

26
important attributes for poor service quality were: 1) lack of knowledge about the service,
2) employee indifference or “I don’t care” attitude, and 3) reluctance to correct errors.
The findings of this study showed that the good service quality was knowledge of
service and the poor service quality was lack of knowledge. For retail banking service,
auto-maintenance service, and colleges/universities, respondents considered willingness
to correct errors for good service quality and reluctant to correct error for poor service
quality. For fast food restaurants, the attribute of good service quality was timely/prompt
service and the attribute of poor service quality was not getting help in time/slowness.
Bojanic and Rosen (1994) applied the SERVQUAL instrument to a chain of
restaurants in Columbia, South Carolina. The researchers examined the gaps between
expectations and actual performance with six dimensions: tangibles, reliability,
responsiveness, assurance, knowing the customer, and access. Results showed that the
restaurants did well in knowing the customer, which had the smallest gap, and was
followed by reliability and assurance. The researchers recommended that restaurants
could improve reliability and assurance through total quality management programs and
other changes in operations areas, as well as by improving internal marketing and
training.
Tomes and Ng (1995) adapted a measurement scale for assessing in-patient
perceptions of service quality in an NHS or NHS trust hospital. The researchers adapted
SERVQUAL and ten dimensions (Parasuraman, Zeithamal, and Berry, 1985) to apply in
hospitals. A total of eight dimensions emerged, six relating to the intangibles
(empathy/understanding, relationship between patients and health care staff, dignity,
communications, reliability, and courtesy) of hospital care and two covering the tangible

27
aspects (food and the physical environment). The researchers surveyed 196 patients who
were admitted during the survey, and the respondents were asked to rate each of 49
statements on a seven-point Likert scale (ranging from 1 = strongly disagree to 7 =
strongly agree). The expectation questionnaire asked patients what they felt hospitals and
their staff should do and provide. The same questions formed the basis of the perception
questionnaire. The finding showed that the highest expectation was communication and
the second expectation was reliability dimension. The highest perception score was
relationship between patients and health care staff. However, the finding indicated that
the patients’ perception was higher than the patients’ expectation.
Lee and Hing (1995) adapted the SERVQUAL instrument in measuring and
comparing service quality within the two fine dining restaurants: French and Chinese
restaurants. The questionnaire contained two parts: expectations of service quality and
perceptions of service quality by using five dimensions of service quality: tangibles,
reliability, responsiveness, assurance, and empathy. The researchers surveyed fifty
participants: twenty-five of these participants to assess the service quality of the Chinese
restaurant, with the remaining twenty-five assigned the French restaurant. The
respondents rated twenty-two statements of service quality on a seven-point Likert scale
to indicate their extent of agreement to the given statements. The finding showed that the
highest respondents’ expectations were assurance and reliability, and the lowest
expectation was tangibles for both French and Chinese restaurants. The respondents’
perceptions of the service quality dimension of French restaurant were assurance,
reliability, and responsiveness being rated the highest respectively. The respondents’
perceptions of the service quality of Chinese restaurant were tangibles, reliability, and

28
Johnson and Mathews (1997) studied the expectation service quality in fast food
restaurants and focused on two different types of expectations: shoulds (a normative
expectation, influenced by experience) and wills (a predicative expectation, based on
experience). The researchers adapted SERVQUAL instrument to measure service quality
by using originally ten dimensions of Parasuraman, Zeithaml, and Berry (1985). The first
half of the instrument measured should expectations by asking respondents about the sort
of quality fast food restaurant (in general) should provide. The second half of the
instrument measured will expectations by asking respondents about the service quality
they will receive next time they visited one name restaurant (specifically). Zeithaml,
Parasuraman, and Berry (1990) stated that the “highest” expectation is always reliability
and it must be the most important. However, the results showed that security was the
highest service quality dimension of should expectation and access was the highest
service quality dimension of will expectation.
Landrum and Prybutok (2004) adapted SERVQUAL instrument (Parasuraman,
Zeithaml, and Berry, 1994) and evaluated to determine how effectively it measured
service quality within the information service industry. There were 385 respondents at
two US Army Corps of Engineers libraries, twenty-one items in the five dimensions of
SERVQUAL were used in questionnaires. Five questions pertained to the tangibles, five
for reliability, three for responsiveness, four for assurance, and four for empathy
dimensions. The respondents were asked to rate each item on a seven-point Likert scale,
ranging from low to high. The finding results indicated that the most important of
SERVQUAL dimensions were reliability and responsiveness. The least important
dimensions were tangibles and empathy.

29
Lee and Lin (2005) adapted the research model to examine the relationship among
e-service quality dimensions and overall service quality, customer satisfaction, and
purchase intentions. The researchers developed instrument dimensions of e-service
quality through modifying the SERVQUAL model to measure the customer perception of
online shopping affect overall service quality, customer satisfaction, and purchase
intentions. The dimensions of e-service quality included web site design, reliability,
responsiveness, trust, and personalization. The fifteen items of e-service quality
dimensions, overall service quality, customer satisfaction, and purchase intentions were
measured using a seven-point Likert scale (ranging from 1 = strongly disagree to 7 =
strongly agree). The 305 questionnaires were distributed to senior year undergraduate
students taking the course on e-commerce at St. John’s and St. Mary’s Institute of
Technology. The results showed that trust had the most strongly affected overall service
quality and customer satisfaction for online stores. Second, the reliability dimension was
a significant predictor of overall service quality, customer satisfaction, and purchase
intentions in online shopping. Third, the responsiveness dimension had mildly affected
overall service quality and customer satisfaction for online stores. Fourth, the web site
design had only a minor effect on overall service quality and customer satisfaction for
online stores. Fifth, the personalization was not a significant predictor of overall service
quality and customer satisfaction for online stores.
Lau, Akbar, and Fie (2005) assessed the expectations and perceptions of service
quality in Malaysia’s four and five stars hotels by applying a modified version of the
SERVQUAL model. The researchers also examined the relationship between overall
satisfaction levels and the five service quality dimensions: tangibles, reliability,

30
responsiveness, assurance, and empathy. The researchers surveyed 300 hotel customers,
used twenty-five hotel attributes instead of the original twenty-two items SERVQUAL
questionnaire (Parasuraman, Zeithaml, and Berry, 1988), and a seven-point Likert scale
was used in questionnaires. The SERVQUAL questionnaires were used to identify and
analyze the gaps between expectations and perceptions of hotel customers. The results
revealed that hotel customers’ perceptions were consistently not meeting their
expectations and tangibles dimension was the utmost importance for both four and five
stars hotels.
Yu, Chang, and Huang (2006) explored the relationship among service quality,
customer satisfaction and loyalty of leisure industry to provide operators with a reference
to improve their quality. The researchers adapted SERVQUAL scale of Parasuraman,
Zeithaml, and Berry, (1988) as the basis of service quality questionnaires in the leisure
industry. There were twenty-one questions in the questionnaires, and five dimensions of
SERVQUAL: tangibles, reliability, responsiveness, assurance, and empathy. The
researchers surveyed 200 visitors and 182 respondents’ valid and usable questionnaires.
The finding results showed that three dimensions of SERVQUAL: tangibles, reliability,
and assurance represented the contents of service quality of leisure industry and clearly
related to loyalty. There were significant correlation between all dimensions of service
quality of leisure industry and overall customer satisfaction. The results also showed that
there were significant correlation between overall customer satisfaction and loyalty.
31
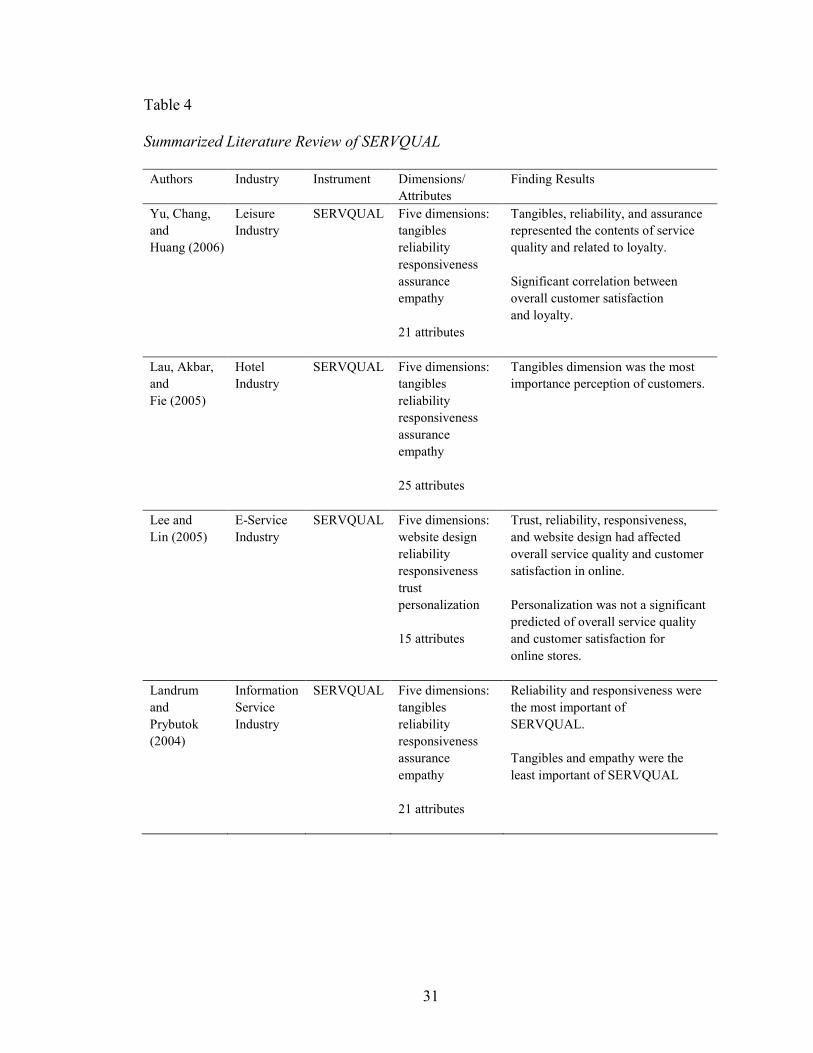
Table 4
Summarized Literature Review of SERVQUAL
Authors Industry Instrument Dimensions/ Finding Results Attributes
Yu, Chang, Leisure SERVQUAL Five dimensions: Tangibles, reliability, and assurance and Industry tangibles represented the contents of service Huang (2006) reliability quality and related to loyalty. responsiveness assurance Significant correlation between empathy overall customer satisfaction and loyalty. 21 attributes Lau, Akbar, Hotel SERVQUAL Five dimensions: Tangibles dimension was the most and Industry tangibles importance perception of customers. Fie (2005) reliability responsiveness assurance empathy
25 attributes Lee and E-Service SERVQUAL Five dimensions: Trust, reliability, responsiveness, Lin (2005) Industry website design and website design had affected reliability overall service quality and customer responsiveness satisfaction in online. trust personalization Personalization was not a significant predicted of overall service quality 15 attributes and customer satisfaction for online stores. Landrum Information SERVQUAL Five dimensions: Reliability and responsiveness were and Service tangibles the most important of Prybutok Industry reliability SERVQUAL. (2004) responsiveness assurance Tangibles and empathy were the empathy least important of SERVQUAL
21 attributes

32
Authors Industry Instrument Dimensions/ Finding Results Attributes
Johnson Fast Food SERVQUAL Ten dimensions: Security was the highest service and Restaurants tangibles quality dimension of should Mathews reliability expectation. (1997) responsiveness communication Access was the highest service credibility quality dimension of will
security expectation. competence courtesy understanding/ knowing the customer access Lee Fine Dining SERVQUAL Five dimensions: The respondents' perceptions and Restaurants tangibles of the service quality dimension Hing (1995) reliability of French restaurant were responsiveness assurance, reliability, and assurance responsiveness respectively. empathy The respondents' perceptions 22 attributes of service quality of Chinese restaurant were tangibles, reliability, and assurance dimension respectively. Tomes Hospital SERVQUAL Eight dimensions: The highest expectation was and Industry empathy communication and the second Ng (1995) understanding expectation was reliability relationship dimension. between patients and health care staff The highest perception score was dignity relationship between patients and communication health care staff. reliability courtesy The patients' perception was higher food than the patients' expectation.
physical environment
49 attributes

33
Authors Industry Instrument Dimensions/ Finding Results Attributes
Bojanic Chain SERVQUAL Six dimensions: The results showed that knowing and Restaurants tangibles the customer had the smallest gap, Rosen (1994) reliability
and followed by reliability and assurance.
responsiveness assurance
knowing the customer
access Mersha Five Service SERVQUAL Five dimensions: The finding results showed that and Types: tangibles the top three attributes for good Adlakha physician reliability service were: 1) the knowledge of (1992) services, responsiveness the service, 2) thoroughness/ retail banking, assurance accuracy, and 3) consistency/ auto empathy reliability. maintenance, colleges, 12 attributes The most three important attributes fast food for poor service quality were: restaurant 1) lack of knowledge about the service, 2) employee indifference, and 3) reluctance to correct errors. Parasuraman, Four Service SERVQUAL Ten dimensions: First stage: Zeithaml, Types: tangibles The deletion of certain items and and a bank, reliability the final resulted was 34 items Berry (1988) a credit card responsiveness representing seven dimensions. company, communication appliance credibility repair security maintenance competence services, courtesy long distance understand/knowing telephone the customer company access
97 attributes
Seven dimensions Second stage: The final procedure resulted in
37 attributes refined scale SERQUAL with 22 items spread among five
dimensions:
tangibles, reliability, responsiveness,
assurance, and empathy.

34
The previous section presented the relevant research and explained the concepts
of SERVQUAL instrument. SERVQUAL has been adapted to measure customers’
perceptions of service quality in a variety of setting. SERVQUAL literatures emphasize
the idea that customers make a comparison between the performance of the product or
service and some standard. The SERVQUAL literature has been maintained that the
distinction between perceive quality and satisfaction is that they use different standards of
comparison (Parasuraman, Zeithaml, and Berry, 1988).
Customer Satisfaction
It has been believed that higher levels of customer satisfaction may result in
higher levels of repurchase. According to Oliver (1997), repeat purchasing is essential to
a continued stream of profitability through achieving higher levels of customer
satisfaction. Satisfaction can be defined as “the consumer’s fulfillment response. It has
been a judgment that a product or service feature, or the product or service itself,
provides (or is providing) a pleasurable level of consumption-related fulfillment,
including levels of underfulfilment or overfulfilment” (Oliver, 1996, p. 14). The concept
of consumer satisfaction occupies a central position in marketing thought and practice.
Conceptually, satisfaction is an outcome of purchase and use results from the buyer’s
comparison of the rewards and costs of the purchase in relation to the anticipated
consequences. Operationally, satisfaction is similar to attitude in that it can be assessed
as the sum of the satisfactions with the various attributes of the product or service.

35
LaTour and Peat (1979) asserted that the primary distinction between satisfaction
and attitude derived from temporal positioning: attitude was positioned as a predecision
construct and satisfaction was a postdecision construct. Satisfaction has been defined as
“an overall evaluation of performance based on all prior experiences with a firm.” Since
the early 1970s, the volume of consumer satisfaction research has been impressive.
Numerous theoretical structures have been proposed to examine the antecedents of
satisfaction and develop meaningful measures of the construct. The vast majority of
these studies have used some variant of the disconfirmation paradigm, which holds that
satisfaction is related to the size and direction of the disconfirmation experience, where
disconfirmation is related to the person’s initial expectation. More specifically, an
individual’s expectations are: 1) confirmed when a product performs as expected, 2)
negatively disconfirmed when the product performs more poorly than expected, and 3)
positively disconfirmed when the product performs better than expected. Dissatisfaction
resulted when a subject’s expectations are negatively disconfirmed.
Marketing researchers have proposed that the benefits of increased customer
satisfaction come in two basic forms: the improved ability of the firm to attract new
customers and the ability of the firm to maintain repeat customers (Rust, Zahorik, and
Keiningham, 1995). Fornell (1992) suggested the following benefits associated with high
customer satisfaction:
1. Increased loyalty of current customers from competitive efforts.
2. Lower costs of future transactions: A firm with high customer retention does not
need to spend as much to acquire new customers each period.

36
3. Reduced failure costs: High customer satisfaction reduces resources devoted to
handling returns, reworking defective items, and processing complaints.
4. Lower costs of attracting new customers: Satisfied customers are more likely to
engage in positive word of mouth and are less likely to engage in damaging
negative word of mouth.
5. Reduce price elasticity: Satisfied customers are more willing to pay for the
benefits they receive; they are more likely to be tolerant of increases in price.
6. Enhanced reputation for the firm: This can aid in introducing new products by
providing instant awareness and lowering the buyer’s risk of trial.
Therefore, if managers or administrators working in service-based organizations are
able to identify how components of a product or service affect customer satisfaction of
their customers, they may be able to provide their customers with a better customer
experience to maximize customers ‘satisfaction.
Service Quality and Customer Satisfaction
The service literature has been contributed to the confusion over the relationship
between consumer satisfaction and service quality. The most important that service
providers need to know are how their objectives meet or exceed the customers’
satisfaction with their performance. The importance of this issue has been led to several
recent efforts to clarify the relationship between satisfaction and service quality. The
SERVQUAL measurement tool suggests that a consumer’s perception of service quality
involves the difference between his or her expectations about the performance of a
general class of service providers and his or her assessment of the actual performance of

37
a specific firm within that class. SERVQUAL confounds customer satisfaction and
customer attitude. In contrast, the SERVPERF version of the original SERVQUAL scale
only concerns performance.
Common dimensions of satisfaction with a service include service quality,
product quality, price, and location. The theory suggest that the “people factor” (i.e.,
service quality), in terms of tangibility, reliability, responsiveness, assurance, and
empathy, may be the most salient in determining overall satisfaction and repeated
purchasing in service industries.
Parasuraman, Zeithaml, and Berry (1988) conceptualized perceived service
quality as a long-run overall evaluation about a service, whereas satisfaction was a
transaction-specific evaluation. Based on these conceptualizations, they posited that
incidents of satisfaction over time result in perceptions of service quality. Other
researchers supported the argument that customer satisfaction leads to service quality.
For example, Bitner (1990) developed a model of service encounter evaluation and
empirically supported the effect of satisfaction on service quality. Bolton and Drew
(1991b) also proposed that satisfaction leads to service quality.
Cronin and Taylor (1992) reported that in their structural analysis for the causal
relations among satisfaction, overall service quality, and purchase intention, the
coefficients of path for service quality, satisfaction, and purchase intention appeared to be
all significant while the coefficients of path for satisfaction, service quality, purchase
intention were insignificant.

38
Spreng and MacKoy (1996) also studied the relationship between service quality
and satisfaction based on their modified Oliver’s (1993) satisfaction/service quality
model. Their modified model fitted the data well where service quality was hypothesized
to influence satisfaction. In their study, the path coefficient between two constructs
appeared to be significant (t = 9.4). Woodside, Frey, and Daly (1989) supported the
causal relation of service quality and satisfaction with data collected in area of health
care. Several researchers stated that overall service quality is determined only by the
customer’s perception of a service, rather than the difference between the customer’s
expectation and actual service performance.
Ruyter, Bloemer, and Pascal (1997) modified the SERVQUAL scale and
empirically tested the health care service of chiropractic care, attempting to determine the
relationship between service quality and customer satisfaction. The results suggested that
service quality should be treated as an antecedent of customer satisfaction. Moreover,
Cronin and Taylor’s (1992) investigation on banking industry, insecticidal companies,
cleaners, and fast food restaurants indicated that service quality was the determinant of
customer satisfaction. Service quality had great impacts on purchase intentions as well.
Lee, Lee, and Yoo (2000) believed that performance-based measures of service
quality explain more of the variation in the service quality than does the difference
between expectation and performance. Service mangers should therefore emphasize the
performance perceived by customers, rather than the difference between perceived
performance and customers’ prior expectation. The researchers investigated
performance-based measures through a survey of customers at an entertainment park, an
aerobic school, and an investment-consulting firm. The entertainment park was an

39
example of a facility and equipment-based firm and the aerobic school and investment-
consulting firm were people-based. The researchers concluded that providers of
equipment and facility-based services should check and renovate their facilities and
equipment continuously, in order to improve customers’ perceptions of service quality.
In contrast, responsiveness was a factor closely linked with the behavior of company
employees and was a more important factor in the people-based service. The researchers
claimed, “Perceived service quality leads to customer satisfaction that service quality is
an antecedent of customer satisfaction and that customer satisfaction has more influence
on the intention to buy a service than does service quality.”
As discussed earlier, both service quality and satisfaction literature emphasize the
idea that customers make a comparison between the performance of the product or
service and some standard. The service quality literature has maintained that the
distinction between perceived quality and satisfaction is that they use different standards
of comparison.
Customer Loyalty
The significance of service quality and customer satisfaction has been gained a
substantial amount of attention from both managers and academic researchers interested
in explaining key variables like word-of-mouth endorsements, repurchase intentions,
brand loyalty, and profitability. One of the focuses of the present study has been
associated with customer loyalty, which has been received attention from academic
scholars in the foodservice business. Loyalty has been defined as “ a deeply held
commitment to rebuy or repatronize a preferred product or service consistently in the

40
future, thereby causing repetitive same-brand-set purchasing, despite situational
influences’ and marketing efforts’ having the potential to cause switching behavior”
(Skogland and Siguaw, 2004). Customer loyalty consists of both an attitudinal
commitment to the relationship, such as price insensitivity, and other, more over loyalty
behavior, such as positive word-of-mouth and repeat patronage (Oliver, 1999). Customer
satisfaction is a prerequisite for loyalty, but is not sufficient condition on which own to
automatically lead to repeat purchases or brand loyalty (Bloemer and Kasper, 1995).
Customer loyalty has been defined as “the feeling of attachment to, or affection
for a company’s people, products or services” (Jones and Sasser, 1995). These
researchers emphasized a distinction between completely satisfied customers and
satisfied customers. The finding illustrated that fully satisfied customers were
significantly more likely to repurchase company’s products than simply satisfied
customers were.
The marketing literature suggests that customer loyalty can be defined in two
distinct ways (Jacoby and Kyner, 1973). These are described as the “behavioral
approach” and the “attitude approach.” The behavioral approach, customer loyalty has
been defined as “inclined to provide positive word-of-mouth, willing to tell others of your
experiences, and willing to be a reference for the product.” On the other hand, the
attitude approach, customer loyalty has been defined as “increase the number of products,
expand the range in brands of products, and expand the frequency of purchases
Oh and Parks (1997) also provided a review supporting a positive relationship
among satisfaction, repurchase intention, and word-of-mouth. Bojanic (1996) found a
strong positive association between customer value and satisfaction in four lodging

41
markets segmented by price. Fornell, Johnson, and Anderson (1996) also support a
positive influence of perceived value on customer satisfaction. Perceived value is
expected to explain both repurchase intention and word-of-mouth endorsements directly,
in addition, to its influence on word-of-mouth through customer satisfaction and
repurchase intention (Dodds and Monroe, 1985; Dodds, Monroe, and Grewal, 1991).
From the customer loyalty literature, the primary underlying assumption
regarding repurchase intentions of customers has been linked to the belief that customer
satisfaction and/or service quality perceptions positively affect behavioral intention of
customers. The more likely customers are satisfied with the service or product; they are
more likely to repurchase the service or product.
Customer Satisfaction and Customer Loyalty
Enhancing the level of service quality resulting in higher levels of customer
satisfaction has been identified as a key strategy for service providers. Increasingly,
attention has been paid to the concept of customer satisfaction as a corporate goal among
academics and business practitioners (Rust & Oliver, 1994). According to Mullin,
Hardy, and Sutton (200), satisfaction is a major outcome of marketing processes that
culminate in purchase, and satisfaction is also thought to contribute to post-purchasing
phenomena such as word-of-mouth communication, repurchase intention, and brand
loyalty.
Gronholdt, Martensen, and Kristensen (2000) administered a study on sixty
companies and found that customer satisfaction would have significant impacts on
customer loyalty. Bowen and Chen (2001) focused on the hotel industry to examine the

42
relationship between customer satisfaction and customer loyalty. The results showed a
slight increase in customer satisfaction would highly improve customer loyalty. Hence,
customer satisfaction was inferred to have great impacts on customer loyalty. Moreover,
Tam (2004) established an integrated framework of service quality, customer satisfaction,
and perceived value, suggesting that customer satisfaction and perceived value have
significant influences on customers’ future purchase behaviors. Anderson and Sullivan
(1993) believed that customer satisfaction positively influenced repurchase intentions.
Repurchase intentions is considered a possible outcome of customer loyalty.
Jones and Sasser (1995) stated that customer loyalty is “a feeling of attachment to
or affection for a company’s people, products, or services.” Customer loyalty is often
referred to as a purchase behavior, unlike customer satisfaction, which is an attitude
(Griffin, 1996). Repurchase behavior is a form of loyalty. Customer loyalty, a key
mediating variable in explaining customer retention (Pritchard and Howard, 1997), is
concerned with the likelihood of a customer returning, making business referrals,
providing strong word-of-mouth, as well as providing references and publicity (Bowen
and Showemaker, 1998). Although most research on loyalty has focused on frequently
purchased package goods (brand loyalty), the loyalty concept is also important for
industrial goods (vendor loyalty), services (service loyalty), and retail establishment
(store loyalty) (Dick and Basu, 1994).
Prior research has shown that one’s emotions have an influence on behavior, and
that one responds to an event in certain ways to maintain positive emotions (i.e.
happiness) and to avoid negative emotions (i.e. depression) (Strauss and Neuhaus, 1997).
Oliver, Rust, and Varki (1997) found that positive emotion led to higher levels of

43
customer satisfaction and increased repurchase intentions. On the other hand, Andreasen
(1999) found that initial negative emotion caused by a service failure results in customer
exit behavior. Dick and Basu (1994) posited that true loyalty only exists when repeat
patronage coexists with a high relative positive attitude. In addition to attitude, it has
been argued that loyalty may also be based on cognition (Lee and Zeiss, 1980; Oliver,
1980).
Chapter Summary
In this chapter, literature related to service quality, customer satisfaction, and
customer loyalty has been reviewed. As reported in many academic publications, the
nature of the relationships among service quality, customer satisfaction, and customer
loyalty may depend on the specific service context. Moreover, the causal relationship
among service quality, customer satisfaction, and customer loyalty has been identified
differently in each conceptual construct.
The next chapter will describe the research methods used in this study. It will be
included population, sampling and sample size, instruments and their reliability and
validity, research design, data collection, and data analysis.

44
CHAPTER III
METHODOLOGY
The present study was designed to explore the service quality of customer
satisfaction and customer loyalty for consumers of casual dining restaurants in Phuket,
Thailand. This chapter provided a discussion on the research methodology used to
conduct the study. It has been organized in the following manner: 1) Population, 2)
Sampling and Sample Size, 3) Instruments and Their Reliability and Validity, 4)
Research Design, 5) Data Collection, and 6) Data Analysis.
Population
The total number of casual dining restaurants in Phuket is twenty-one casual
dining restaurants (Phuket Dining Guide, 2006). A casual dining restaurant is a restaurant
that serves moderately priced food in a casual atmosphere. Casual dining restaurants
typically provide table service, serve beer or wine with meals, and provide them in a bar
if the restaurant has it. In Phuket, the average menu price at a casual dining restaurant
usually from 80 baht to 300 baht (US $ 1 = 40 Baht). Population samples were collected
from all customers who dined in four casual dining restaurants (Thai, Japanese, Italian,
and Mediterranean) based on cuisine type, atmosphere, and menu price.

45
Sampling and Sample Size
The sample population in the study was 537 customers who dined in four casual
dining restaurants (Japanese, Thai, Italian, and Mediterranean) between 5:00 p.m. to
11:00 p.m. during July 1 to 31, 2006. The researcher used the random sample of every
fifth Thai and every fifth international customer for 125 customers per restaurant. The
response rate for the self-administered questionnaire was 98% (500 of 537). Of the
questionnaires returned, 500 respondents were usable and each casual dining restaurant
was 125 respondents.
The sample size for the study was 500 for ensuring statistical power as suggested
by Hair, Anderson, Tatham, and Black, (1998). Regarding the sample size in the factor
analysis, the researcher generally would not factor analyze a sample of fewer than fifty
observations, and preferably the sample size should be 100 or larger. As a general rule,
the minimum sample size is to have at least five times as many observations as there are
variables to be analyzed, and the more acceptable size would have a ten-to-one ratio
(Hair, Anderson, Tatham, and Black, 1998).
According to Israel (1992), if the population is large, then Israel’s equation to
yield a representative sample for proportions needs to be used.
no = Z2σ²e2
where,
no = sample size
Z = standard error associated with chosen level of confidence (95%)
σ = standard error of overall mean of service quality attributes of pilot study
e = acceptable error ± 10% (p ≤ 0.10)

46
The resulting sample size is demonstrated below:
no = Z2σ² = (1.96)2(1.06)²
e2 (0.10)2
= (3.84) (1.12)0.01
= 4.30 = 430 customers
0.01
Instruments A self-administered questionnaire was used to examine the relationships between
service quality, overall customer satisfaction, and customer loyalty for casual dining
restaurants located in Phuket. The questionnaire had four sections: 1) Service Quality
Attributes, 2) Overall Service Quality, 3) Customer Satisfaction and Loyalty, and 4)
Demographic Profile. All of the statements were rated on seven-point Likert scale,
ranging from -3 = extremely less than expected, -2 = less than expected, -1 = somewhat
less than expected, 0 = neutral, 1 = somewhat greater than expected, 2 = greater than
expected, and 3 = extremely greater than expected.
Pilot Study Instrument
The questionnaire was pretested with a random sample of every fifth Thai and
every fifth international customer for thirty customers in casual dining restaurant in
Phuket to examine the reliability and validity of questionnaire. The total thirty
questionnaires were collected and usable. In order to establish internal consistency
among items within each dimension, the internal consistency reliability coefficient

47
(Cronbach’s alpha) was computed for each of the dimensions of the service quality scale
and customer loyalty scale after the data were collected.
The results of pilot study would help to refine the full instrument as follows:
1. To select a representative sample from each casual dining restaurant theme
2. To obtain feedback from the respondents as to any confusing statements
3. To clarify correct and revise the questionnaire statements based on the pilot study
respondents comments
4. To collect the data and analyze the data using means, standard deviation, and
frequency
5. To analyze data by using one-way ANOVA between the service quality variables and
demographic profile
6. To determine the standard error that may be used in the sample population
formulation: no = Z2σ²e2
7. To recalculate the actual sample size
Reliability and Validity of Service Quality
Within the hospitality industry, in particular, the restaurant business, the
SERVQUAL instrument was well adapted and many different researchers had evaluated
its applications. Parasuraman, Zeithaml, and Berry (1988) developed the SERVQUAL
instrument from ten dimensions to five dimensions of service quality in four service
firms: bank, credit card, repair and maintenance, and long-distance telephone. Four
questions pertained to the tangibles, five for reliability, four for responsiveness, four for
assurance, and five for empathy dimensions. The researchers performed rigorous

48
pretesting, validation, and reliability computations across four service firms. The
researchers reported reliability coefficients (Cronbach’s alpha) of five dimensions was
0.72, 0.83, 0.82, 0.81, 0.86 for tangibles, reliability, responsiveness, assurance, and
empathy, respectively. Moreover, the total scale reliability (overall Cronbach’s alpha)
was 0.92. According to Nunnally (1967), coefficients greater than or equal to 0.50 are
generally acceptable and are a good indication of construct reliability. An alpha value of
at least 0.70 should be considered acceptable as the minimum estimate of reliability for
basic research.
Dabholkar, Shepherd, and Thorpe (2000) employed a four-item overall service
quality scale. Customers were asked to indicate their feelings on the following seven-
point Likert scale in terms of service deliver, retail store XYZ: “Has an excellent overall
service”; “Has a service of very high quality”; “Provides a high standard of service’, and
“Delivers superior service in every way”. Cronbach’s alpha coefficient of reliability for
this component measure of overall service quality was 0.96.
Cronin and Taylor (1992) provided evidence of reliability and validity for the
SERVPERF instrument by assessing the reliability (Cronbach’s alpha) of the SERVPERF
instrument in comparison with that of the SERVQUAL instrument. Reliability values of
the SERVPERF instrument for each of four different types of service firms including
banks, pest control, dry cleaning, and fast food companies were reported ranging from
0.88 to 0.96. According to Nunnally and Berstein (1994), an internal consistency greater
than 0.70 is reasonably reliable. Karatepe and Avci (2002) who utilized the SERVPERF
instrument reported that the coefficient alpha for SERVPERF was 0.96.

49
Reliability and Validity of Customer Satisfaction
Oliver (1981) explained the construct of customer satisfaction as the “summary
psychological state resulting when the emotion surrounding disconfirmed expectation is
coupled with the consumer’s prior feelings about the consumption experiences”. This
definition presents customer satisfaction as an overall feeling or emotion derived from a
consumer’s evaluation of service quality
Reynolds and Beatty (1999) adopted the measure to capture emotional
satisfaction. The customers were asked to indicate their feelings with respect to shopping
at retail store XYZ on a seven-point Likert scale along measures of emotions such as:
“pleased/displeased”; “unhappy/happy”; “disgusted/contented”, and
“enjoyable/frustrating”. The composite reliability coefficient for the emotional
satisfaction measure was 0.86.
Chang (1998) developed the service quality in fitness services (SQFS) scale and
provided evidence of its reliability. In the process of developing the scales, internal
consistency was examined for the items of customer satisfaction. The estimated internal
consistency (Cronbach’s alpha) of the customer satisfaction with services scale ranged
from 0.59 to 0.74 with the significance level at 0.5 (Chang, 1998). According to
Nunnally (1967), the mean of the estimated internal consistency value was 0.67 and this
was deemed acceptable. To be more specific, Nunnally (1967) suggested that “in the
early stages of research on predictor tests or hypothesized measures of a construct, one
saves time and energy by working with instruments that have only modest reliability, for
which purpose reliabilities of 0.60 or 0.50 will suffice” (p. 226).

50
Crosby and Stephens (1987) developed and validated the measure of customer
satisfaction for a professional service, life insurance, and were used by Eroglu and
Machleit (1990). It was a four-item, seven-point semantic differential summated rating
scale with Cronbach’ s alpha of more than 0.96: “With respect to the quality of dental
care I have just received, I am: disgusted/contented, dissatisfied/satisfied,
displease/pleased, and I didn’t like it at all/I liked it very much.” Spreng, MacKenzie,
and Olshavky (1996) also measured satisfaction using a seven-point Likert scale: “With
respect to the quality of this dental practice, I feel: terrible, unhappy, mostly dissatisfied,
mixed mostly satisfied, pleased, delighted”.
Reliability and Validity of Customer Loyalty
The share of customer purchases ultimately measures customer loyalty. Other
alternative measurements for customer loyalty are future buying intentions and secondary
behaviors such as customer referrals, endorsements, and spreading the word (word-of-
mouth) (Jones & Sasser, 1995).
Chang (1998) examined the estimated internal consistency of the repurchase
intention scale as a way to purify the instrument. The internal consistency values of the
repurchase intention scale reported in the development process ranged from 0.57 to 0.74.
According to Nunnally (1967), this internal consistency value for the repurchase intention
scale would be acceptable. Thus Nunnally suggested that all of Cronbach’s alpha
coefficients for the scales were greater than 0.60, the scales were deemed acceptable.
Moreover, Choi (2001) provided evidence of internal consistency for the repurchase
intention scale with a reported Cronbach’s alpha of 0.95.

51
Parasuraman, Zeithaml, and Berry (1994) adopted a four-item customer loyalty
scale by using a seven-point Likert scale. Customers were asked to indicate their loyalty
towards retail store XYZ along the following: “I say positive things about retail store
XYZ to other people”, “I recommend retail store XYZ to someone who seeks my
advice”, “I encourage friends and relatives to shop at retail store XYZ”, and “I consider
retail store XYZ my first choice in the next few years”. The composite reliability alpha
of the scale was 0.92.
Research Design
The research method was used in this study was correlation research design. The
purpose was to discover the relationship between variables using correlational statistics
(r). The correlation coefficient provided a measure of degree and direction of
relationship. The square of a correlation coefficient yields the explained variance (r-
squared (R2)). This design was the most appropriate in order to determine properly the
relationship of service quality attributes, overall customer satisfaction, and customer
loyalty. The design of this study enabled the researcher to answer the research questions.
Data Collection
To initialize the data collection the researcher contacted the owner/manager of the
four casual dining restaurants (Japanese, Thai, Italian, and Mediterranean) to obtain
approval for conducting the research. The cover letter of the questionnaire explained the
purpose of the study to customers (Appendix B). The respondents completed the
questionnaire in four parts: 1) service quality attributes, 2) overall service quality,

52
3) customer satisfaction and loyalty, and 4) demographic profile (Appendix C and
Appendix D). The respondents were asked to indicate each statement on a seven-point
Likert scale. Data were collected during the period July 1 to 31, 2006.
Data Analysis
A formal coding sheet was designed and used to code all the questions in a
systematic way. In order to achieve the stated objectives and to test the hypotheses,
various kinds of statistical techniques were employed (Table 5). These techniques
included basic descriptive, factor analysis, correlation analysis, multiple regressions
analysis, and one-way analysis of variance (ANOVA). Data were entered into the
Statistical Package for Social Sciences Windows Version 13.0 (SPSS) program to
analyze the findings.

53
Table 5
Statistical Techniques Employed in This Study
Statistical Techniques Employed Research Purposes Hypotheses
Basic Descriptive (means, Examine the distribution standard deviations, and of responses frequency) Factor Analysis Delete the intercorrelations among the dimensions Correlation Analysis Determine the relationship Hypothesis 1
between service quality Hypothesis 2 factors, overall customer Hypothesis 3 satisfaction, and customer loyalty
Multiple Regression To extent service quality Hypothesis 4 Analysis factors predict overall Hypothesis 5 customer satisfaction and Hypothesis 6 customer loyalty Hypothesis 7 Hypothesis 8 One-Way Analysis of Variance Test significance of overall Hypothesis 9 (ANOVA) service quality factors based Hypothesis 10 on customers’ demographic Hypothesis11 profile (gender, age, dining Hypothesis 12 frequency, per capita expenditures for each meal) Independent-Samples t Test To compare the mean among Thai and international customers relative to the 30 service quality attributes Chi-Square Test To analyze the relationship between service quality attributes and customers’ demographic profiles among Thai and
international customers.

54
Descriptive Statistics
The data frequencies were analyzed to detect any discrepancy due to data entry
errors or missing value. Basic descriptive statistics of means, standard deviations, and
frequency examined the distribution of responses.
Factor Analysis
In this study, principal component analysis (factor analysis) was implemented to
discover the underlying dimensions of service quality attributes of customers’ perception.
The criteria for the number of factors to be extracted were based on eigenvalue,
percentage of variance, significance of factor loading, and assessment of the structure.
Factors with eigenvalue greater than 1 were considered significant. A variable was
considered to be of practical significance and included in a factor when its factor loading
was equal to or greater than 0.40 (Hair, Anderson, Tatham, and Black, 1998). There were
several assumptions used in factor analysis (Hair, Anderson, Tatham, and Black, 1998):
• The anti-image correlation matrix was used to assess the sampling adequacy of
each variable.
• Variables with a measure of sampling accuracy that failed below the acceptable
level of 0.50 should be excluded from the analysis.
• Barlett’s test of sphericity was large and significant, and the Kaiser-Meyer-Olkin
measure was greater than 0.60 then factorability was assumed.

55
Correlation Analysis
In this study, the correlation was used to determine the relationship between
service quality attributes, overall customer satisfaction, and customer loyalty
(word-of-mouth endorsements and repurchase intention). The correlation was used to
test hypothesis 1 through 3 in this study. According to Gay and Airasian (2003), the
correlation coefficient indicated the size and direction of a relationship. Pearson Product-
Moment Correlation, Pearson’s r was used to find relationships among variables.
Pearson’s r described the degree of linear correlation between two variables.
Multiple Regression Analysis
Multiple regression analysis was used to predict the relationship between service
quality attributes (tangibles, reliability, responsiveness, assurance, and empathy),
customer satisfaction, and customer loyalty. The result of regression used an equation
that represented the best prediction of a dependent variable from several independent
variables. In this study, the standard multiple regression was used to test hypothesis 4
through 8. The forms of prediction equations were:
Y′4(OCS) = a + b1X1 + b2X2 + b3X3 + b4X4 + ε
Y′5(WOM) = a + b1X1 + b2X2 + b3X3 + b4X4 + ε
Y′6(RI) = a + b1X1 + b2X2 + b3X3 + b4X4 + ε
Y′7(WOM) = a + b1X(CS) + ε
Y′8(RI) = a + b1X(CS) + ε

56
where,
Y′ = the predicted criterion score (overall customer satisfaction)
Y′ = the predicted criterion score (word-of-mouth)
Y′ = the predicted criterion score (repurchase intention)
X1 = service quality factor 1
X2 = service quality factor 2
X3 = service quality factor 3
X4 = service quality factor 4
a = a constant calculated from the scores of all participants
b = a coefficient that indicates the contribution of the predictor variable to
the criterion variable
ε = standard error
There were several assumptions used in multiple regression (Pedhazur, 1982):
• The independent variables were assumed to be “fixed”.
• The independent variables were assumed to be measured without error.
• The residuals were assumed to be independent and normally distributed with
equal variances.
• The criterion and predictor set were assumed to be linearly related.

57
One-Way Analysis of Variance (ANOVA)
One-way analysis of variance (ANOVA) was used to find the significant
difference between service quality attributes, overall customer satisfaction, and customer
loyalty (word of mouth and repurchase intention) according to demographic profile of
respondents in gender, age, dining frequency, and per capita expenditures for each meal).
In this study, one-way analysis of variance was used to test hypothesis 9 through 12.
There were two assumptions in Analysis of Variance (Keppel and
Wickens, 1997)
1. Normal distribution - populations from which the samples had been drawn should
be normal.
2. Homogeneity of Variance – the scores in each group should have homogeneous
variances.
Independent-Samples t Test
Independent-samples t test was used to compare the means among Thai and
international customers. In order to compare the responses of Thai and international
customers relative to the 30 service quality attributes. The results showed that the test for
homogenously of variance was achieved through. The use of Levene test for equality of
variance. Since the test is significant (p< .05), the researcher rejected the null hypothesis
and accepted the alternative hypothesis that the variances are unequal.

58
Chi-Square Test
Chi-square tests of independence applied to the analysis of the relationship
between service quality attributes and customers’ demographic profile (gender, age,
marital status, dining frequency, and per capita expenditures for each meal) among Thai
and international customers. If the Pearson Chi-Square was significance (p ≤ .05), then
concluded that there was a significant difference among Thai and international customers.
Chapter Summary
This chapter has described the study’s methodology, population, sampling and
sample size, instruments and their reliability and validity, research design, data
collection, and data analysis. The sample population in this study was 537 customers
who dined in four casual dining restaurants (Japanese, Thai, Italy, and Mediterranean).
The research used the random sample of every fifth Thai and every fifth international
customer for 125 customers per restaurant. Data analysis techniques used in evaluating
the hypotheses included; basic descriptive, factor analysis, correlation analysis, multiple
regression analysis, one-way analysis of variance, independent-samples t test, and chi-
square. The next chapter will be the results of the hypotheses.

59
CHAPTER IV
RESULTS
The purpose of this study was to identify the relationship between service quality,
overall customer satisfaction, and customer loyalty (word-of-mouth and repurchase
intention) in casual dining restaurants in Phuket. This chapter presents an analysis and
interpretation of the data and a discussion of the results. For this chapter is comprised of
five main sections: 1) Results of Pilot Study 2) Description of the Subjects, 3)
Customers’ Demographics, 4) Factor Analysis, 5) Reliability of the Instrument, and 6)
Results of Hypotheses Testing.
Pilot Study Results
A pilot study with 30 (100%) questionnaires was returned and usable from Thai
casual dining restaurant in Phuket. The respondents consisted of 20 Thai (67%) and 10
International (33%). As shown in Table 6, the respondents consisted of 20 female (67%)
and 10 male (33%). Among the 30 respondents of the marital status, 14 respondents
(47%) were single, 15 respondents were married (50%), and one respondent (3%) was
widowed status. The age groups with the most respondents were the age group of 20 to
29 years (40%) and age group of 30 to 39 years (40%). The smallest group of the
respondents in age was 40 to 49 years (20%). About 21 respondents (70%) were dining
in Thai casual dining restaurant before and nine respondents (30%) were the first time to

60
dine in. Fifteen respondents (50%) indicated that they had dined in this restaurant once a
month, nine respondents (30%) had dined in twice a month, five respondents (17%) had
dined in three times a month, and one respondent had dined in over 5 times a month
(3%). The majority of respondents spent capita expenditures for each meal were
801- 1200 Baht ($20.01 - $30), 15 respondents (50%) and followed by 400 – 800 Baht
($10 - $20), 12 respondents (40%). Respondents were also asked about the number of
people in their party when they were dining in Thai casual dining restaurant. The analysis
indicated that 17 respondents (58%) had two people in party, followed by five
respondents (17%) had three people in party, and four respondents (13%) had four people
in party.

61
Figure 2
Conceptual Model of Pilot Study
Service Quality Factors Customer Loyalty
Overall Customer Satisfaction
Environment Service Provider
Personnel and Customers’ Relationship
Service Providers’ Attitude and Competencies
Service Providers’ Initiative in Guest’ Service
H4
H6
Attitudinal
Behavioral
Word-of-Mouth
Repurchase Intention
Customers’ Demographic Profile
H1 H2
H3
H8
H7
H5
Overall Service Quality
H
H9
H10 H11 H12

62
Table 6
Demographic Characteristics of Respondents of Pilot Study
Frequency Percent (%)
Gender Male 10 33
Female 20 67 Total 30 100 Marital Status
Single 14 47 Married 15 50 Widowed 1 3 Total 30 100 Age
20-29 years 12 40 30-39 years 12 40
40-49 years 6 20 Total 30 100 Dine In Before
Yes 21 70 No 9 30 Total 30 100
Frequency
1 times 15 50 2 times 9 30 3 times 5 17 Over 5times 1 3 Total 30 100 Per Capita Expenditures for Each Meal (US $1 = 40 Baht)
Under 400 Baht 1 3 400 – 800 Baht 12 40
801 – 1200 Baht 15 50 1201 – 1600 Baht 2 7 Total 30 100 People in Party
1 1 32 17 58
3 5 17 4 4 13 5 1 3
6 1 37 1 3Total 30 100

63
This study adapted five dimensions of service quality (tangibles, reliability,
responsiveness, assurance, and empathy) of Parasuraman et. al., (1988) and generated
thirty items scale to measure the service quality of a casual dining restaurant (Table 7).
The present study used factor analysis, correlation analysis, multiple regression analysis,
and one-way analysis of variance (ANOVA), and obtained the following results: The
researchers used principal component analysis (factor analysis) to delete the
intercorrelations among the dimensions and the results were four factors (Figure 2).
The first factor was labeled as “Environment Service Provider,” contained items
representing four original dimensions – tangibles, reliability, responsiveness, and
empathy, with fifteen variables and explained 64.62% of the variance in the data, with an
eigenvalue of 19.39. The second factor was labeled as “Personnel and Customers’
Relationship,” contained items representing three original dimensions – reliability,
assurance, and empathy. It consisted of six variables and explained 10.08% of the
variance in the data, with an eigenvalue of 3.02. The third factor was labeled as “Service
Providers’ Attitude and Competencies,” contained items representing three original
dimensions – responsiveness, assurance, and empathy, with six variables and explained
8.08% of the variance in the data, with an eigenvalue of 2.42. Finally, the fourth factor
was labeled as “Service Providers’ Initiative in Guest’s Service,” contained items
representing empathy dimension, with three variables. The total variance explained was
4.37% and had an eigenvalue of 1.31 (Table 8).

64
Table 7
Descriptive of Service Quality Attributes
N Mean(a) Std. Deviation
Parking is adequate 30 .77 1.357 Dining is clean 30 1.10 1.269 Decor with restaurant image 30 1.40 1.567 Employees are well dressed 30 1.60 1.037 Menu reflects images 30 .83 1.392 Restroom is clean 30 .97 1.159 Service in the time promised 30 .93 1.311 Employees quickly correct 30 1.20 1.324 Service is consistent 30 1.40 1.221 Accurate guest check 30 1.40 1.303 Serve food exactly as you ordered 30 1.20 1.606 Food prices are charged same 30 1.03 1.474 As in the menu Service will be performed 30 1.07 1.388 During busy time has enough 30 1.13 1.432 employees Employees provide quick service 30 .87 1.479 Employees respond promptly 30 1.17 1.367 Willing to help 30 1.40 1.003 Give extra effort 30 .83 1.533 Employees answer questions 30 .73 1.388 accurately Feel comfortable 30 .93 1.230 Employees give information 30 1.53 1.042 Personnel has well trained 30 .83 1.341 Support their employees 30 1.00 1.390 Employees are polite 30 1.27 1.285 Personal attention 30 1.13 1.196 Know your needs 30 1.10 1.296 Operation hours are convenient 30 1.13 1.408 Best interest at heart 30 1.43 1.165 Considers your needs 30 .73 1.701 Valid N (listwise) 30 1.17 1.085 (a) Each item is assessed on seven-point Likert scale from -3 to 3, with, 0 = neutral.

65
Table 8
Factor Analysis of Pilot Study
Service Quality Factor 1 Factor 2 Factor 3 Factor 4 Communalities Attributes Environment Personnel Service Service Service and Providers’ Providers’ Provider Customers’ Attitude Initiative in Relationship and Guest’s Competencies Service Factor 1
Environment Service Provider Décor with restaurant image .912 .944
Know your needs .902 .930 During busy time has enough employees .894 .911 Menu reflects image .879 .900 Support their employees .876 .893 Service in the time promised .796 .949 Feel comfortable .760 .936 Personal attention .724 .906 Give extra effort .720 .940 Serve food exactly as you ordered .686 .947 Employees provide quick service .670 .959 Parking is adequate .645 .908 Personnel has well trained .630 .924 Service is consistent .625 .798 Customers feel special .593 .934 Factor 2 Personnel and Customers’ Relationship Accurate guest check .887 .900 Food prices are charged same as in menu .844 .916 Dining area is clean .842 .882 Operation hours are convenient .786 .909 Employees answer questions accurately .675 .930 Employees quickly correct .608 .895 Factor 3 Service Providers’ Attitude and Competencies Employees are polite .835 .926 Employees have your best interest at heart .826 .928 Service will be performed .678 .891 Employees respond promptly .666 .903 Restroom is clean .663 .877 Employees are well dressed .596 .781 Factor 4 Service Providers’ Initiative in Guest’s Service Employees give information .868 .902 Employees consider your needs .665 .931 Employees are willing to help .629 .897 Eigenvalue 19.387 3.023 2.423 1.311 Variance Explained (%) 64.622 10.075 8.078 4.371 Cumulative Variance (%) 64.622 74.697 82.775 87.147 Cronbach’s alpha .980 .949 .939 .878 Overall Cronbach’s alpha .971

66
Reliability of the Instrument of Pilot Study
Reliability of the scores for each of the four factors was estimated by calculating
Cronbach’s alpha coefficient using SPSS Version 13.0. The reliability coefficients for
each of the four factors of the service quality scale were as follows: (1) Environment
Service Provider (α = .98); (2) Personnel and Customers’ Relationship (α = .95); (3)
Service Providers’ Attitude and Competencies (α = .94); and (4) Service Providers’
Initiative in Guest’s Service (α = .88). The reliability coefficients consisted of six-item
scales measuring the customer loyalty had Cronbach’s alpha coefficient of .85. Since all
of Cronbach’s alpha coefficients for the scales were greater than .60, the scales were
deemed acceptable (Nunnally, 1967). The reliability coefficients for the scales utilized in
this study were reported in Table 9.
Table 9
Reliability of Each of the Measurements for Pilot Study
Measurement Factor Number Cronbach’s of Items Alpha
1) Environment and 15 .98 Service Provider
Service Quality 2) Personnel and 6 .95 Customers’ Relationship 3) Service Providers’ Attitude 6 .94 and Competencies 4) Service Providers’ 3 .88
Initiative in Guest’s Service
Customer Loyalty 6 .85

67
Correlation Analysis
In this study, the correlation was used to test hypothesis 1 through 3. The results
indicated that hypothesis 1, there was a positive relationship between service quality
factors and overall customer satisfaction (Table 10). The factor 1 – Environment Service
Provider had the highest correlation (r = .645) in overall customer satisfaction, followed
by factor 3 – Service Providers’ Attitude and Competencies (r = .510),
factor 2 – Personnel and Customers’ Relationship (r =.384), and factor 4 – Service
Providers’ Initiative in Guest’s Service (r =.182). Therefore, hypothesis 1, “there is a
positive relationship between service quality factors and overall customer satisfaction”
was supported.
Past research showed that the correlation of four factors of service quality
(assurance, tangibles, reliability, and empathy) had a positive relationship with overall
customer satisfaction. The assurance had the highest correlation (r = .591), followed by
tangibles (r = .530), reliability (r = .541), and empathy (r = .275) (Kim, 2005). Therefore,
hypothesis 1 was supported and agreed with previous research.
Table 10
Correlation between Service Quality Factors and Overall Customer Satisfaction
Factor 1 Factor 3 Factor 2 Factor 4 Environment Service Personnel Service
and Providers’ and Providers Service Attitude Customers’ Initiative in
Provider and Relationship Guest’s Service Competencies
Factor 1 1.000 Factor 3 .000 1.000 Factor 2 .000 .000 1.000 Factor 4 .000 .000 .000 1.000 Overall customer satisfaction .645 .510 .384 .182 * Correlation is significant at the 0.01 level (2-tailed).

68
As shown in Table 11, the result of hypothesis 2, there was a positive relationship
between overall customer satisfaction and word-of-mouth endorsements (r = .838).
Therefore, hypothesis 2, “there is a positive relationship between overall customer
satisfaction and word-of-mouth endorsements” was supported. Moreover, the result of
hypothesis 3 indicated that there was a positive relationship between overall customer
satisfaction and repurchase intention (r = .867). Therefore, hypothesis 3, “there is a
positive relationship between overall customer satisfaction and repurchase intention” was
supported.
Table 11
Correlation between Overall Customer Satisfaction and Customer Loyalty
(Word- of-Mouth Endorsements and Repurchase Intention)
Overall Word-of-Mouth Repurchase
Satisfaction Intention
Overall Satisfaction 1.000
Word-of-Mouth .838 1.000
Repurchase Intention .867 .774 1.000
* Correlation is significant at the 0.01 level (2-tailed).
Regression Analysis
As shown in Table 12, the regression model considered overall customer
satisfaction to be dependent variable and the four factors of service quality to be
independent variables. The standard (simultaneous) model, all independent variables

69
(four factors of service quality) entered and utilized for 30 respondents. The result of
hypothesis 4 indicated that service quality factors had positive impact on overall
customer satisfaction. The results of the regression model indicated that the regression
model was statistically significant (F (4, 25) = 48.460, p = .0001). The coefficient of
determination (R2) of .89 showed that 89% of the overall customer satisfaction was
explained by the four factors of service quality. The coefficients indicated that
factor 1 – Environment Service Provider (Beta = .645) had the most positive impact on
overall customer satisfaction, followed by factor 3 – Service Providers’ Attitude and
Competencies (Beta = .510), factor 2 – Personnel and Customers’ Relationship
(Beta = .384), and factor 4 – Service Providers’ Initiative inGuest’s Service
(Beta = .250). Therefore, hypothesis 4, “Service quality factors have a positive impact on
overall customer satisfaction” was supported.
Past research reported that four factors of service quality (tangibles, reliability,
assurance, and empathy) had a positive impact on overall customer satisfaction (Kim,
2005). The results of the regression model indicated that the regression model was
statistically significant (F (5, 428) = 121.06, p = .001), and 58% of the overall customer
satisfaction was explained by the five factors of service quality. The regression
coefficients indicated that the factors of assurance (Beta = .46, p = .0001) and tangibles
(Beta = .33, p = .0001) exerted the strongest influence on the overall customer
satisfaction, followed by the factors of empathy (Beta = .08, p = .020), and reliability
(Beta = .17, p = .001). The service quality of responsiveness was no statistically
significant difference in overall customer satisfaction (Beta = .06, p = .124).

70
Table 12
Regression Model of Hypothesis 4
H4: Service quality factors have a positive impact on overall customer satisfaction.
Equation: Y′(OCS) = a + B1X1 + B2X2 + B3X3 + B4X4 + ε
Y′(OCS) = .833 + .645X1 + .384X2 + .510X3 + .250X4 + .407
Y′ = the predicted criterion score (overall customer satisfaction)
X1 = factor 1- Environment Service Provider
X2 = factor 2 – Personnel and Customers’ Relationship
X3 = factor 3 – Service Providers’ Attitude and Competencies
X4 = factor 4 – Service Providers’ Initiative in Guest’s Service
a = a constant calculated from the scores of all participants
B= a coefficient that indicates the contribution of the predictor variable to
the criterion variable
Dependent variable: Overall customer satisfaction
Independent variables: Four Factors of Service Quality
Multiple R = .941
R2 = .886
Adjusted R2 = .864
Standard Error = .407
F = 48.460
p = .0001*

71
Unstandardized Standardized Coefficient Coefficient
Variable B Std.Error Beta p
Constant .833 .074 .0001*
F1: Environment Service Provider .720 .075 .645 .0001*
F2: Personnel and Customers’ Relationship .429 .075 .384 .0001*
F3: Service Providers’ Attitude and .570 .075 .510 .0001*
Competencies
F4: Service Providers’ Initiative in .279 .075 .250 .0010*
Guest’s Service
* P ≤ .05
Table 13 explained the results of regression analysis of service quality factors as
independent variable with word-of mouth endorsements (attitudinal loyalty) as the
dependent variable. The result of hypothesis 5 indicated that service quality factors had a
positive impact on word-of-mouth endorsements, the coefficient of determination (R2) of
.87 showed that 87% of the word-of-mouth endorsements were explained by the four
factors of service quality. The F-ratio was significant (F(4, 25) = 40.684, p =.0001). The
coefficient indicated that factor 2 – Personnel and Customers’ Relationship (Beta = .571)
had the most positive impact on word-of-mouth endorsements, followed by the factor 1 -
Environment Service Provider (Beta = .466), factor 4 - Service Providers’ Initiative in
Guest’s Service (Beta = .441), and factor 3 - Service Providers’ Attitude and
Competencies (Beta = .360. Therefore, hypothesis 5, “Service quality factors have a
positive impact on word-of-mouth endorsements” was supported.

72
Table 13
Regression Model of Hypothesis 5
H5: Service quality factors have a positive impact on word-of-mouth endorsements.
Equation: Y′(WOM) = a + B1X1 + B2X2 + B3X3 + B4X4 + ε
Y′(WOM) = 1.044 + .466X1 + .571X2 + .360X3 + .441X4 + .355
Dependent variable: Word-of-Mouth Endorsements
Independent variables: Four Factors of Service Quality
Multiple R = .931
R2 = .867
Adjusted R2 = .846
Standard Error = .355
F = 40.684
p = .0001*
Unstandardized Standardized Coefficient Coefficient
Variable B Std.Error Beta p
Constant 1.044 .065 .0001*
F1: Environment Service Provider .421 .066 .466 .0001*
F2: Personnel and Customers’ Relationship .516 .066 .571 .0001*
F3: Service Providers’ Attitude and .325 .066 .360 .0001*
Competencies
F4: Service Providers’ Initiative in .399 .066 .441 .0001*
Guest’s Service
* P ≤ .05

73
As shown in Table 14, the regression model considered repurchase intention
(behavioral loyalty) to be the dependent variable and the four factors of service quality to
be independent variables. The standard (simultaneous) model, all independent variables
(four factors of service quality) entered and utilized for 30 respondents. The result of
hypothesis 6 showed that service quality factors had a positive impact on repurchase
intention and the coefficient of determination (R2) was .74. Service quality factors
explained 74% of the variance in repurchase intention, which was statistically significant
as indicated by the F-value (F (4, 25) = 17.789, p = .0001). The coefficient indicated that
factor 1 – Environment Service Provider (Beta = .597), had the most positive impact on
repurchase intention, followed by the factor 3 - Service Providers’ Attitude and
Competencies (Beta = .475), factor 2 - Personnel and Customers’ Relationship
(Beta = .327), and factor 4 - Service Providers’ Initiative in Guest’s Service
(Beta = .226). Therefore, hypothesis 6, “Service quality factors have a positive impact on
repurchase intention” was supported.
Previous research showed that two factors of service quality had a positive impact
on repurchase intention (Kim, 2005). The regression model was statistically significant
(F (5, 428) = 37.27, p = .001), and 30% of repurchase intention (dependent variable) was
explained by the five factors of service quality (independent variables). The results of the
regression coefficients indicated that the factors of assurance (Beta = .38, p = .0001) and
tangibles (Beta = .34, p = .0001) exerted strong influence on repurchase intention,
followed by the factors of responsiveness (Beta = .098, p = .088), empathy (Beta = .068,
p = .167), and reliability (Beta = .046, p = .549). Only the factors of assurance and
tangibles indicated statistically significant unique relationship with repurchase intention.

74
Table 14
Regression Model of Hypothesis 6
H6: Service quality factors have a positive impact on repurchase intention.
Equation: Y′(RI) = a + B1X1 + B2X2 + B3X3 + B4X4 + ε
Y′(RI) = 1.067+ .597X1 + .327X2 + .475X3 + .226X4 +.626
Dependent variable: Repurchase Intention
Independent variables: Four Factors of Service Quality
Multiple R = .860
R2 = .740
Adjusted R2 = .698
Standard Error = .626
F = 17.789
p = .0001*
Unstandardized Standardized Coefficient Coefficient
Variable B Std.Error Beta p
Constant 1.067 .114 .0001*
F1: Environment Service Provider .680 .116 .597 .0001*
F2: Personnel and Customers’ Relationship .373 .116 .327 .0001*
F3: Service Providers’ Attitude and .542 .116 .475 .0001*
Competencies
F4: Service Providers’ Initiative in .257 .116 .226 .0360*
Guest’s Service * P ≤ .05

75
Table 15 explained the result of the regression analysis for overall customer
satisfaction as an independent variable with word-of-mouth endorsements (attitudinal
loyalty). The result of hypothesis 7 indicated that the overall customer satisfaction had a
positive impact on word-of-mouth endorsements. The coefficient of determination (R2)
of .70 showed that 70% of the variance in word-of-mouth endorsements was explained by
the overall customer satisfaction. The F-ratio was significant (F (1, 28) = 66.249,
p = .0001). Therefore, hypothesis 7, “Overall customer satisfaction has a positive impact
on word-of-mouth endorsements” was supported.
Previous research indicated that the overall customer satisfaction had a positive
impact on word-of-mouth endorsements (F (1, 678) = 1749.47, p = .0001), therefore, it was
supported hypothesis 7 (Ng, 2005). The coefficient of determination (R2) of .695 showed
that 69.5% of the variance in the word-of-mouth endorsements was explained by the
overall customer satisfaction, which represented that the respondents had a high
word-of-mouth endorsement with overall customer satisfaction.
Table 15
Regression Model of Hypothesis 7
H7: Overall customer satisfaction has a positive impact on word-of-mouth
endorsements.
Equation: Y′(WOM) = a + B1X1 + ε
Y′(WOM) = .479 + .838X1 + .501

76
Dependent variable: Word-of-Mouth Endorsements
Independent variable: Overall Customer Satisfaction
Multiple R = .838
R2 = .703
Adjusted R2 = .692
Standard Error = .501
F = 66.249
p = .0001*
Unstandardized Standardized Coefficient Coefficient
Variable B Std.Error Beta p
Constant .479 .115 .0001*
Overall customer satisfaction .679 .083 .838 .0001*
* P ≤ .05
As shown in Table 16, the result of hypothesis 8 showed that the overall customer
satisfaction had a positive impact on repurchase intention and the coefficient of
determination (R2) was .75. Overall customer satisfaction explained 75% of the variance
in repurchase intention, which was statistically significant as indicated by the F-value
(F (1, 28) = 84.961, p = .0001). Therefore, the R of independent variable (overall customer
satisfaction) on the dependent variables (word-of-mouth endorsements r = .84, and
repurchase intention (r = .87), which represented that the respondents had shown a
relationship between high word-of-mouth endorsements and repurchase intention with
overall customer satisfaction, which also indicated that the high level of satisfaction led

77
to the respondent’s customer loyalty. Therefore, hypothesis 8, “Overall customer
satisfaction has a positive impact on repurchase intention” was supported.
Previous research explained the results of regression analysis for overall customer
satisfaction as an independent variable with repurchase intention as a dependent variable
(Ng, 2005). About 72% of the repurchase intention was explained by the overall
customer satisfaction (R2 = .719). That was, significant interactions were found between
the overall customer satisfaction and repurchase intention for the respondents. The F
ratio was statistically significant at F-value of (F (1, 432) = 461.01, p = .0001). Therefore,
the previous research supported hypothesis 8.
Table 16
Regression Model of Hypothesis 8
H8: Overall customer satisfaction has a positive impact on repurchase intention.
Equation: Y′(RI) = a + B1X1 + ε
Y′(RI) = .329 + .867X1 + .577
Dependent variable: Repurchase Intention
Independent variable: Overall Customer Satisfaction
Multiple R = .867
R2 = .752
Adjusted R2 = .743
Standard Error = .577
F = 84.961
p = .0001*

78
Unstandardized Standardized Coefficient Coefficient
Variable B Std.Error Beta p
Constant .329 .132 .0190*
Overall customer satisfaction .885 .096 .867 .0001*
* P ≤ .05
One-Way Analysis of Variance
Hypothesis 9: There is a significant difference in service quality factors based on
customers’ demographic variables (gender, age, dining frequency, and per capita
expenditures for each meal). One-way ANOVA was used to determine whether there
were statistically significant differences in service quality factors based on customers’
demographics (gender, age, dining frequency, and per capita expenditures for each meal).
If the results of the ANOVA were significant, Tukey’s HSD test was carried out to assess
the significance of pairwise post hoc differences. All the statistical significance tests
were performed with the alpha level set at .05.
Factor 1 – Environment Service Provider
Customers’ demographics (gender, age, dining frequency, and per capita
expenditures for each meal) were treated as independent variables and service quality
factors as dependent variables. Table 17, the results of the ANOVA indicated that there
were significant differences in service quality factor 1 in terms of dining frequency
(F (3, 26) = 5.109, p = .007) and per capita expenditures for each meal (F (3, 26) =3.430,

79
p = .032). Tukey’s HSD test was not performed for service quality factor 1 because one
group had fewer than two cases. Moreover, there were no statistically significant
differences in service quality factor 1 in terms of gender and age, (p > .05).
Table 17
ANOVA of Service Quality Factor 1 – Environment Service Provider by
Dining Frequency
Sources Sum of df Mean F p Squares Square
Dining Frequency 10.756 3 3.585 5.109 .007*
Error 18.244 26 .702
Total 29.000 29
* P ≤ .05
ANOVA of Service Quality Factor 1 – Environment Service Provider by
Per Capita Expenditures for Each Meal
Sources Sum of df Mean F p Squares Square
Per Capita Expenditures 8.222 3 2.741 3.430 .032*
for Each Meal
Error 20.778 26 .799
Total 29.000 29
* P ≤ .05

80
Factor 2 – Personnel and Customers’ Relationship
The results of the ANOVA in factor 2 indicated that there were no statistically
significant differences in service quality factor 2 depending on the customers’
demographic variables (gender, age, dining frequency, and per capita expenditures for
each meal) (p > .05). In this regard, no pairwise comparison for the mean scores was
considered.
Factor 3 - Service Providers’ Attitude and Competencies
The results of factor 3 showed that there were no statistically significant
differences in service quality factor 3 depending on the customers’ demographic
variables (gender, age, dining frequency, and per capita expenditures for each meal
(p > .05).
Factor 4 - Service Providers’ Initiative in Guest’s Service
As shown in Table 18, the results of the ANOVA revealed that there was
statistically significant difference in service quality factor 4 based on dining frequency
(F (3, 26) = 3.101, p = .044). Since there was one group had fewer than two cases, pairwise
comparison using Tukey’s HSD was not used to test for means of service quality factor 4
in terms of dining frequency. Additionally, there were no statistically significant
differences in service quality factor 1 based on gender, age, and per capita expenditures
for each meal (p > .05).

81
Table 18
ANOVA of Service Quality Factor 4 – Service Providers’ Initiative in Guest’s Service by
Dining Frequency
Sources Sum of df Mean F p Squares Square
Dining Frequency 7.642 3 2.547 3.101 .044*
Error 21.358 26 .821
Total 29.000 29
* P ≤ .05
Hypothesis 10: There is a significant difference in overall service quality based on
customers’ demographic variables (gender, age, dining frequency, and per capita
expenditures for each meal). One-way ANOVA was used to determine whether there
was statistically significant difference in overall service quality (tangibles, reliability,
responsiveness, assurance, and empathy) depending on customers’ demographic variables
(gender, age, dining frequency, and per capita expenditures for each meal). If the results
of the ANOVA were significant, Tukey’s HSD test was carried out to assess the
significance of pairwise post hoc differences. Customers’ demographics (gender, age,
dining frequency, and per capita expenditures for each meal) were treated as independent
variables and overall service quality as dependent variables.
Weighted Tangibles
As reported in Table 19, there was a statistically significant difference in
weighted tangibles among different per capita expenditures for each meal (F (3, 26) =
3.728, p = .024). Tukey’s HSD test was not performed for weighted tangibles because

82
one group had fewer than two cases such as under 400 Baht (US $1= 40 Baht) had one
case. Moreover, there were no statistically significant differences in weighted tangibles
depending on gender, age, and dining frequency (p > .05).
Table 19
ANOVA of Weighted Tangibles by Per Capita Expenditures for Each Meal
Sources Sum of df Mean F p Squares Square
Per Capita Expenditures .540 3 .180 3.728 .024*
for Each Meal
Error 1.256 26 .048
Total 1.796 29
* P ≤ .05
Weighted Reliability
The results of the ANOVA indicated that there were no statistically significant
differences in weighted reliability depending on the customers’ demographic variables
(gender, age, dining frequency, and per capita expenditures for each meal (p > .05). In
this regard, no pairwise comparison for the mean scores was considered.
Weighted Responsiveness
As shown in Table 20, the results of ANOVA showed that there were statistically
significant differences in weighted responsiveness based on dining frequency
(F (3, 26) = 4.689, p = .010) and per capita expenditures for each meal (F (3, 26) = 3.365,

83
p = .034). Since there was one group had fewer than two cases, pairwise comparison
using Tukey’s HSD was not used to test for weighted responsiveness based on dining
frequency and per capita expenditures for each meal. Additionally, there were no
statistically significant differences in weighted responsiveness based on gender
and age (p > .05).
Table 20
ANOVA of Weighted Responsiveness by Dining Frequency
Sources Sum of df Mean F p Squares Square
Dining Frequency .442 3 .141 4.689 .010*
Error .781 26 .030
Total 1.203 29
* P ≤ .05
ANOVA of Weighted Responsiveness Per Capita Expenditures for Each Meal
Sources Sum of df Mean F p Squares Square
Per Capita Expenditures .336 3 .112 3.365 .034*
for Each Meal
Error .866 26 .033
Total 1.203 29
* P ≤ .05

84
Weighted Assurance
The results of the ANOVA indicated that there were no statistically significant
differences in weighted assurance depending on the customers’ demographic variables
(gender, age, dining frequency, and per capita expenditures for each meal) (p > .05). In
this regard, no pairwise comparison for the mean scores was considered.
Weighted Empathy
The results of the ANOVA in Table 21 showed that there was a statistically
difference in weighted empathy in terms of per capita expenditures for each meal (F (3, 26)
= 3.565, p = .028). Tukey’s HSD test was not performed for weighted empathy because
one group had fewer than two cases such as under 400 Baht (US $1= 40 Baht) had one
case. Moreover, there were no statistically significant differences in weighted empathy in
terms of gender, age, and dining frequency (p > .05).
Table 21
ANOVA of Weighted Empathy by Per Capita Expenditures for Each Meal
Sources SS df MS F p
Per Capita Expenditures .458 3 .153 3.565 .028*
for Each Meal
Error 1.114 26 .043
Total 1.573 29
* P ≤ .05

85
Hypothesis 11: There is a significant difference in overall service quality with
type of customers (Thai and International). One-way ANOVA was used to determine
whether there was statistically significant difference in overall service quality (tangibles,
reliability, responsiveness, assurance, and empathy) with type of customers (Thai and
International). If the results of the ANOVA were statistically significant, Tukey’s HSD
test was carried out to assess the significance of pairwise post hoc differences. Type of
customers (Thai and International) was treated as independent variable and overall
service quality as dependent variable. The results of the ANOVA showed that there were
no statistically significant differences in overall service quality between Thai and
international customers (p > .05). Therefore, hypothesis 11 was not supported.

86
Table 22
Comparative of ANOVA of Service Quality Factors and Overall Service Quality by
Customers’ Demographic Profiles of Pilot Study
Customers’ Demographic Profile
Gender Age Dining Per Frequency Capita Expenditures for Each Meal Service Quality Factors**:
F1: Environment and p = .596 p = .313 p = .007 p = .032*
Service Provider
F2: Personnel and Customers’ p = .168 p = .292 p = .791 p = .516
Relationship
F3: Service Providers’ Attitude p = .248 p = .160 p = .840 p = .956
and Competencies
F4: Service Providers’ Initiative p = .582 p = .670 p = .044* p = .658
in Guest’s Service
Overall Service Quality***:
Weighted Tangibles p = .873 p = .103 p = .119 p = .024*
Weighted Reliability p = .459 p = .159 p = .097 p = .122
Weighted Responsiveness p = .346 p = .135 p = .010* p = .034*
Weighted Assurance p = .346 p = .773 p = .559 p = .139
Weighted Empathy p = .889 p = .153 p = .059 p = .028* * p ≤ .05 ** Service quality factors refer to factor analysis *** Overall service quality refers to term of weighted = mean of service quality dimension multiplied by the weighted percentage of each item.

87
Description of the Subjects
A total of 537 questionnaires were distributed to customers dining in the four
casual dining restaurants: 1) Japanese, 2) Thai, 3) Italian, and 4) Mediterranean. The
questionnaires were distributed to every fifth Thai and every fifth international customer
for 125 customers per restaurant. Of the 537 questionnaires distributed, 37 (7%) were
returned incomplete and were not included in the data analysis. As shown in Figure 3,
500 (93%) questionnaires were usable. The respondents of Japanese casual dining
restaurant consisted of 61 Thai (49%) and 64 International (51%). The respondents of
Thai casual dining restaurant consisted of 84 Thai (67%) and 41 International (33%).
The respondents of Italian casual dining restaurant consisted of 68 Thai (54%) and 57
International (46%). The respondents of Mediterranean casual dining restaurant
consisted of 60 Thai (52%) and 65 International (48%).
Figure 3
Restaurant Distribution
010203040506070
Percentage
Japanese Thai ItalianMediterraneanType of Restaurants
Casual Dining Restaurants
Thai
International

88
Customers’ Demographics
As shown in Table 23, the respondents consisted of 279 female (56%) and 221
male (44%). Among the 500 respondents of the marital status, 236 respondents (47%)
were single, 248 respondents (50%) were married, 12 respondents (2%) were widowed,
and four respondents (1%) were divorced. The age distribution of the respondents was
categorized into five groups: 1) 20 – 29 years (35%), 2) 30 – 39 years (35%), 40 – 49
years (21%), 50 -59 years (8%), and over 60 years (1%). The majority of respondents
were the age group of 30 -39 years with 177 respondents and age group of
20 – 29 years with 176 respondents. The smallest group of the respondents in age was
over 60 years with one respondent. About 248 respondents (49%) were dining in
particular casual dining restaurants before and 252 (51%) were the first time to dine in.
Respondents were asked how frequency they had dined at the given restaurant in a
month. A 315 respondents (63%) had dined in this restaurant once a month, 108
respondents (22%) had dined in twice a month, 59 respondents (12%) had dined in three
times a month, 12 respondents (2%) had dined in four times a month, and six respondents
(1%) had dined in over 5 times a month. The majority of respondents spent capita
expenditures for each meal was 400 – 800 Baht ($10 - $20), 206 respondents (41%), and
followed by 801 – 1200 Baht ($20.01 - $30), 189 respondents (38%). Respondents were
also asked about the number of people in their party when they were dining in restaurant.
The analysis indicated that 208 respondents (42%) had two people in party, and followed
by 118 respondents (24%) had three people in party.
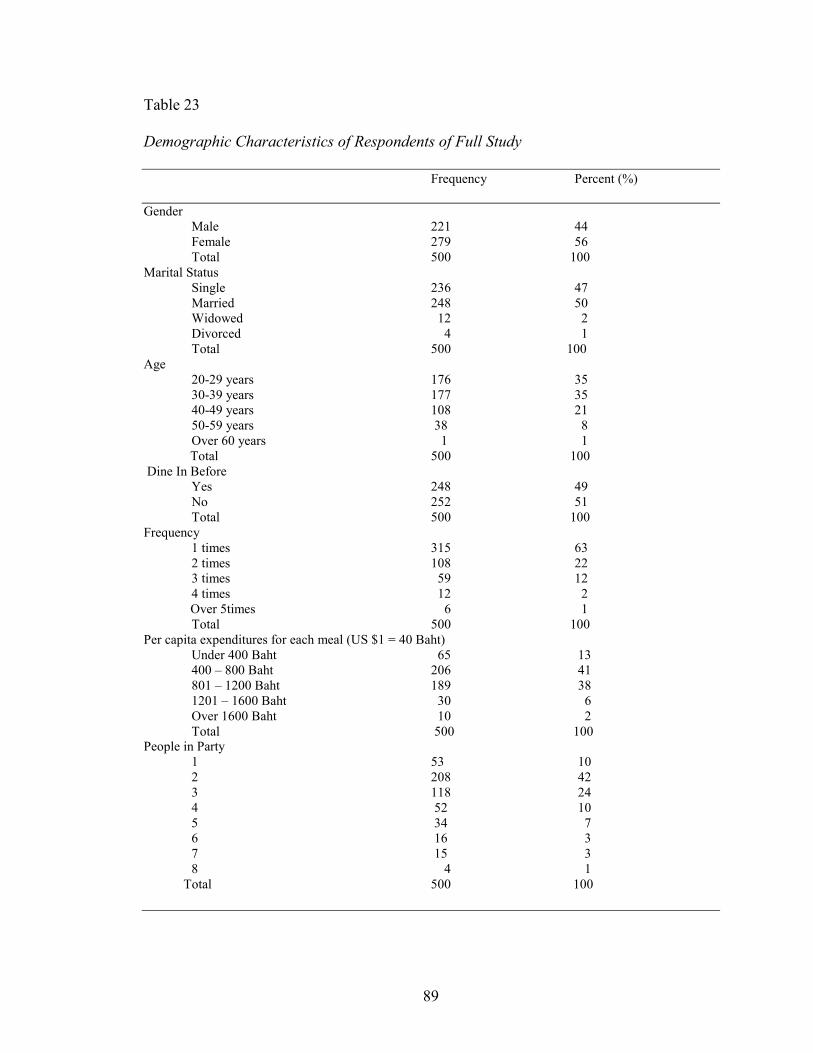
89
Table 23
Demographic Characteristics of Respondents of Full Study
Frequency Percent (%)
Gender Male 221 44
Female 279 56 Total 500 100 Marital Status
Single 236 47 Married 248 50 Widowed 12 2 Divorced 4 1 Total 500 100 Age
20-29 years 176 35 30-39 years 177 35
40-49 years 108 21 50-59 years 38 8 Over 60 years 1 1 Total 500 100 Dine In Before
Yes 248 49 No 252 51 Total 500 100
Frequency 1 times 315 63 2 times 108 22
3 times 59 12 4 times 12 2 Over 5times 6 1 Total 500 100 Per capita expenditures for each meal (US $1 = 40 Baht)
Under 400 Baht 65 13 400 – 800 Baht 206 41
801 – 1200 Baht 189 38 1201 – 1600 Baht 30 6 Over 1600 Baht 10 2 Total 500 100 People in Party
1 53 10 2 208 42 3 118 24 4 52 10 5 34 7 6 16 3 7 15 3 8 4 1 Total 500 100

90
Factor Analysis
A principal component analysis was conducted on the 30 variables to ensure that
the variables were not intercorrelated and that the variables were grouped properly
(Table 24). Bartlett’s test of sphericity was applied to test for intercorrelated. For data to
be appropriate for factor analysis, the results of the Bartlett’s test should be significant
and the Kaiser-Meyer-Olkin (KMO) measure was greater than 0.60 (Hair, Anderson,
Tatham, and Black, 1998). In this study, the value of Kaiser-Meyer-Olkin (KMO) was
.951, and verified that the use of factor analysis was appropriate in the study. Bartlett’s
test of sphericity value Chi Square (χ²) was 13075.19, with p = .0001, indicating that the
data was suitable for factor analysis.
The varimax rotation procedure was used to produce an orthogonal transformation
matrix yielding independent factors, which provided unique information. Only the
factors with eigenvalue equal to or greater than 1 were considered as significant.
Examination of the scree plot and interpretation of the resulting factors lead to four
factors with eignevalues of 1.008 was greater 1.00. Statements with loadings of 0.40 or
greater on a single factor were used in interpreting the factors.
After analyzing, the data with principal component analysis of factor analysis to
delete the intercorrelations among the dimensions and results were four factors
(Figure 4). The first factor was labeled as “Personnel and Customers’ Relationship,”
contained items representing two original dimensions – reliability and assurance, with
nine variables and explained 54.65% of the variance in the data, with an eigenvalue of
16.39. The second factor was labeled as “Environment Service Provider,” contained

91
items representing two original dimensions – tangibles and responsiveness. It consisted
of eight variables and explained 6.40% of the variance in the data, with an eigenvalue of
1.92. The third factor was labeled as “Service Providers’ Attitude and Competencies,”
contained items representing two original dimensions – assurance and empathy, with nine
variables and explained 4.45% of the variance in the data, with an eigenvalue of 1.34.
Finally, the fourth factor was labeled as “Service Providers’ Initiative in Guest’s
Service,” contained items representing responsiveness dimension, with four variables.
The total variance explained was 3.36% and had an eigenvalue of 1.01 (Table 25).

92
Figure 4
Conceptual Model of Full Study
Service Quality Factors Customer Loyalty
Overall Customer Satisfaction
Environment Service Provider
Personnel and Customers’ Relationship
Service Providers’ Attitude and Competencies
Service Providers’ Initiative in Guest’ Service
H4
H6
Attitudinal
Behavioral
Word-of-Mouth
Repurchase Intention
Customers’ Demographic Profile
H1 H2
H3
H8
H7
Overall Service Quality
H
H9
H10 H11 H12

93
Table 24
Descriptive of Service Quality Attributes of Full Study
N Mean(a) Std. Deviation
Parking is adequate 500 .70 1.431 Dining is clean 500 1.09 1.329 Decor with restaurant image 500 1.10 1.356 Employees are well dressed 500 1.09 1.398 Menu reflects images 500 .92 1.386 Restroom is clean 500 .96 1.249 Service in the time promised 500 .93 1.311 Employees quickly correct 500 1.10 1.228 Service is consistent 500 1.12 1.279 Accurate guest check 500 1.19 1.246 Serve food exactly as you ordered 500 1.12 1.297 Food prices are charged same 500 1.03 1.352 as in the menu Service will be performed 500 .87 1.292 During busy time has enough 500 .95 1.339 employees Employees provide quick service 500 .91 1.342 Employees respond promptly 500 1.04 1.331 Willing to help 500 1.05 1.256 Give extra effort 500 .95 1.301 Employees answer questions 500 1.05 1.253 accurately Feel comfortable 500 1.17 1.266 Employees give information 500 .91 1.361 Personnel has well trained 500 1.04 1.309 Support their employees 500 1.16 1.279 Employees are polite 500 .95 1.408 Personal attention 500 .99 1.317 Know your needs 500 .99 1.342 Operation hours are convenient 500 1.06 1.342 Best interest at heart 500 1.06 1.380 Considers your needs 500 1.11 1.410 Valid N (listwise) 500 (a) Each item is assessed on seven-point Likert scale from -3 to 3, with, 0 = neutral.

94
Table 25
Factor Analysis of Full Study
Service Quality Factor 1 Factor 2 Factor 3 Factor 4 Communalities Attributes Personnel Environment Service Service and Service Providers’ Providers’ Customers’ Provider Attitude Initiative in Relationship and Guest’s
Competencies Service Factor 1 Personnel and Customers’ Relationship Employees quick correct .768 .701 Service in the time promised .748 .719 Serve food exactly as you ordered .733 .685 Service is consistent .725 .695 Food prices are charged same as .701 .646 in the menu Accurate guest check .683 .644 Feel comfortable .621 .669 Employees answer questions accurately .611 .714 Employees give information .497 .468 Factor 2 Environment Service Provider Dining is clean .806 .756 Parking is adequate .782 .732 Décor with restaurant image .750 .721 Employees are well dressed .698 .657 Menu reflects images .690 .652 Restroom is clean .663 .663 Service will be performed .586 .723 During busy time has enough employees .537 .663 Factor 3 Service Providers’ Attitude and Competencies Considers your needs .745 .738 Operation hours are convenient .743 .752 Know your needs .726 .747 Personal attention .726 .774 Best interest at heart .717 .695 Customers feel special .694 .687 Support their employees .521 .635 Employees are polite .498 .524 Personnel has well trained .485 .698 Factor 4 Service Providers’ Initiative in Guest’s Service Willing to help .708 .765 Give extra effort .672 .662 Employees provide quick service .603 .760 Employees respond promptly .592 .709 Eigenvalue 16.393 1.919 1.335 1.008 Variance Explained (%) 54.645 6.397 4.449 3.361 Cumulative Variance (%) 54.645 61.042 65.491 68.851 Cronbach’s alpha .928 .929 .941 .889 Overall Cronbach’s alpha .971 Note: Kaiser-Meyer-Olkin (KMO) Measure of Sampling Adequacy (MSA): .951 Bartlett’s Test of Sphericity: χ² = 13075.19, p = .0001

95
Reliability of the Instrument
Reliability of the scores for each of the four factors was estimate by calculating
Cronbach’s alpha coefficient using SPSS version 13.0. The reliability coefficients for
each of the four factors of the service quality scale were as follows: (1) Personnel and
Customers’ Relationship (α = .93); (2) Environment Service Provider (α = .93); (3)
Service Providers’ Attitude and Competencies (α = .94); (4) Service Providers’ Initiative
in Guest’s Service (α = .89). The reliability coefficients consisted of six-item scales
measuring the customer loyalty had Cronbach’s alpha coefficient of .89. Since all of
Cronbach’s alpha coefficients for the scales were greater than .60, the scales were
deemed acceptable (Nunnally, 1967). The reliability coefficients for the scales utilized in
this study were reported in Table 26.
Table 26
Reliability of Each of the Measurements for Full Study
Measurement Factor Number Cronbach’s of Items Alpha
1) Personnel and 9 .93 Customers’ Relationship
Service Quality 2) Environment and 8 .93 Service Provider 3) Service Providers’ Attitude 9 .94 and Competencies 4) Service Providers’ 4 .89
Initiative in Guest’s Service
Customer Loyalty 6 .89

96
Results of Hypotheses Testing
Correlation Analysis
H1: There is a positive relationship between service quality factors and overall
customer satisfaction.
The result indicated in hypothesis 1 that there was a positive relationship between
service quality factors and overall customer satisfaction (Table 27). Factor 2 -
Environment Service Provider had the highest correlation (r = .437) in overall customer
satisfaction, followed by factor 1 – Personnel and Customers’ Relationship
(r = .351), factor 4 – Service Providers’ Initiative in Guest’s Service (r = .347), and factor
3 – Service Providers’ Attitude and Competencies (r = .282). Therefore, hypothesis 1
was supported.
Past research reported that the correlation of the four factors of service quality
(assurance, tangibles, reliability, and empathy dimensions) had a positive relationship
with overall customer satisfaction. The assurance dimension had the highest correlation
(r = .591), followed by tangibles (r = .530), reliability (r = .541), and empathy (r = .275)
(Kim, 2005). Therefore, hypothesis 1 was supported and favorably compared with the
results of previous research.

97
Table 27
Correlation between Service Quality Factors and Overall Customer Satisfaction
Factor 2 Factor 1 Factor 4 Factor 3 Environment Personnel Service Service
Service and Providers’ Providers’ Provider Customers’ Initiative in Attitude Relationship Guest’s and Service Competencies Factor 2 1.000 Factor 1 .000 1.000 Factor 4 .000 .000 1.000 Factor 3 .000 .000 .000 1.000 Overall customer satisfaction .437 .351 .347 .282 * Correlation is significant at the 0.01 level (2-tailed).
H2: There is a positive relationship between overall customer satisfaction and word-
of-mouth endorsements.
H3: There is a positive relationship between overall customer satisfaction and
repurchase intention.
As shown in Table 28, there was a positive relationship between overall customer
satisfaction and word-of-mouth endorsements (r = .788). Therefore, hypothesis 2 was
supported. Moreover, the result of hypothesis 3 indicated that there was a positive
relationship between overall customer satisfaction and repurchase intention (r = .703).
Therefore, hypothesis 3 was supported.

98
Table 28
Correlation between Overall Customer Satisfaction and Customer Loyalty
(Word- of-Mouth Endorsements and Repurchase Intention)
Overall Word-of-Mouth Repurchase
Satisfaction Intention
Overall Satisfaction 1.000
Word-of-Mouth .788 1.000
Repurchase Intention .703 .799 1.000
* Correlation is significant at the 0.01 level (2-tailed).
Multiple Regression Analysis
H4: Service quality factors have a positive impact on overall customer satisfaction.
As shown in Table 29, the regression model considered overall customer
satisfaction to be the dependent variable and the four factors of service quality to be
independent variables. The standard (simultaneous model), all independent variables
(four factors of service quality) entered and utilized for the 500 respondents. The result
of hypothesis 4 indicated that the service quality factors had a positive impact on overall
customer satisfaction. The results of the regression model indicated that the regression
model was statistically significant (F (4, 495) = 130.885, p = .0001). The coefficient of
determination (R²) of .51 showed that 51% of the overall customer satisfaction was
explained by the four factors of service quality. The value of variance of inflation (VIF)
indicated that there was no multicollinearity among the independent variables.

99
All of the four underlying factors; 1) Personnel and Customers’ Relationship,
2) Environment Service Provider, 3) Service Providers’ Attitude and Competencies, and
4) Service Providers’ Initiative in Guest’s Service all appeared to be significant
independent variables that influence the level of customer satisfaction in casual dining
restaurants in Phuket. The coefficients indicated that factor 2 – Environment Service
Provider (Beta = .437) had the most positive impact on overall customer satisfaction,
followed by factor 1 – Personnel and Customers’ Relationship (Beta = .351), factor 3 –
Service Providers’ Attitude and Competencies (Beta = .282), and factor 4 – Service
Providers’ Initiative in Guest’s Service (Beta = .234). Therefore, hypothesis 4, “Service
quality factors have a positive impact on overall customer satisfaction” was supported.
Past research studied indicated that the four factors of service quality (tangibles,
reliability, assurance, and empathy) had a positive impact on overall customer
satisfaction (Kim, 2005). The results of the regression model indicated that the
regression model was statistically significant (F (5, 428) = 121.06, p = .001), and 58% of the
overall customer satisfaction was explained by the five factors of service quality. The
regression coefficients indicated that the factors of assurance (Beta = .46, p = .0001) and
tangibles (Beta = .33, p = .0001) exerted the strongest influence on the overall customer
satisfaction, followed by the factors of empathy (Beta = .08, p = .020), and reliability
(Beta = .17, p = .001). The service quality of responsiveness was no statistically
significant difference in overall customer satisfaction (Beta = .06, p = .124). Therefore,
hypothesis 4 was supported by the findings of previous research studies.

100
Table 29
Regression Model of Hypothesis 4
H4: Service quality factors have a positive impact on overall customer satisfaction.
Equation: Y′(OCS) = a + B1X1 + B2X2 + B3X3 + B4X4 + ε
Y′(OCS) = .744 + .351X1 + .437X2 + .282X3 + .234X4 + .797
Y′ = the predicted criterion score (overall customer satisfaction)
X1 = factor 1 - Personnel and Customers’ Relationship
X2 = factor 2 – Environment Service Provider
X3 = factor 3 – Service Providers’ Attitude and Competencies
X4 = factor 4 – Service Providers’ Initiative in Guest’s Service
a = a constant calculated from the scores of all participants
B= a coefficient that indicates the contribution of the predictor variable to
the criterion variable
Dependent variable: Overall Customer Satisfaction
Independent variables: Four Factors of Service Quality
Multiple R = .717
R2 = .514
Adjusted R2 = .510
Standard Error = .797
F = 130.885
p = .0001*

101
Unstandardized Standardized Coefficient Coefficient
Variable B Std.Error Beta p
Constant .744 .036 .0001*
F1: Personnel and Customers’ Relationship .399 .036 .351 .0001*
F2: Environment Service Provider .498 .036 .437 .0001*
F3: Service Providers’ Attitude and .321 .036 .282 .0001*
Competencies
F4: Service Providers’ Initiative in .395 .036 .234 .0001*
Guest’s Service
* P ≤ .05
H5: Service quality factors have a positive impact on word-of-mouth endorsements.
Table 30 explained the results of regression analysis of service factors as
independent variable with word-of-mouth endorsements (attitudinal loyalty) as
the dependent variable. The result of hypothesis 5 indicated that service quality factors
had a positive impact on word-of-mouth endorsements, the coefficient of determination
(R²) of .61 showed that 61% of the word-of-mouth endorsements were explained by the
four factors of service quality. The F-ratio was significant (F(4, 495) = 190.612, p =.0001).
The value of variance of inflation (VIF) for each variable indicated that there was no
multicollinearity among the independent variables.
All of the four underlying factors; 1) Personnel and Customers’ Relationship,
2) Environment Service Provider, 3) Service Providers’ Attitude and Competencies, and
4) Service Providers’ Initiative in Guest’s Service all appeared to be significant

102
independent variables that influence word-of-mouth endorsements. The coefficient
indicated that factor 2 – Environment Service Provider (Beta = .444) had the most
positive impact on word-of-mouth endorsements, followed by factor 1 – Personnel and
Customers’ Relationship (Beta = .425), factor 4 – Service Providers’ Initiative in Guest’s
Service (Beta = .367), and factor 3 – Service Providers’ Attitude and Competencies
(Beta = .305). Therefore, hypothesis 5, “Service quality factors have a positive impact on
word-of-mouth endorsements” was supported.
Table 30
Regression Model of Hypothesis 5
H5: Service quality factors have a positive impact on word-of-mouth endorsements.
Equation: Y′(WOM) = a + B1X1 + B2X2 + B3X3 + B4X4 + ε
Y′(WOM) = .867 + .425X1 + .444X2 + .305X3 + .367X4 + .649
Dependent variable: Word-of-Mouth Endorsements
Independent variables: Four Factors of Service Quality
Multiple R = .779
R2 = .606
Adjusted R2 = .603
Standard Error = .649
F = 190.612
p = .0001*

103
Unstandardized Standardized Coefficient Coefficient
Variable B Std.Error Beta p
Constant .867 .029 .0001*
F1: Personnel and Customers’ Relationship .438 .029 .425 .0001*
F2: Environment Service Provider .458 .029 .444 .0001*
F3: Service Providers’ Attitude and .314 .029 .305 .0001*
Competencies
F4: Service Providers’ Initiative in .378 .029 .367 .0001*
Guest’s Service * P ≤ .05
H6: Service quality factors have a positive impact on repurchase intention.
As shown in Table 31, the regression model considered repurchase intention
(behavioral loyalty) to be the dependent variable and the four factors of service quality to
be independent variables. The standard (simultaneous) model, all independent variables
(four factors of service quality) entered and utilized for the 500 respondents. The result
of hypothesis 6 showed that service quality factors had a positive impact on repurchase
intention and the coefficient of determination (R²) was .65. Service quality factors
explained 65% of the variance in repurchase intention, which was statistically significant
as indicated by the F-value (F(4, 495) = 226.884, p =.0001). The value of variance of
inflation (VIF) for each variable indicated that there was no multicollinearity among the
independent variables.

104
All of the four underlying factors; 1) Personnel and Customers’ Relationship,
2) Environment Service Provider, 3) Service Providers’ Attitude and Competencies, and
4) Service Providers’ Initiative in Guest’s Service all appeared to be significant
independent variables that influence repurchase intention. The coefficient indicated that
factor 2 – Environment Service Provider (Beta = .499) had the most positive impact on
repurchase intention, followed by factor 1 – Personnel and Customers’ Relationship
(Beta = .456), factor 4 – Service Providers’ Initiative in Guest’s Service (Beta = .325),
and factor 3 – Service Providers’ Attitude and Competencies (Beta = .291). Therefore,
hypothesis 6, “Service quality factors have a positive impact on repurchase intention”
was supported.
Previous research showed that two factors of service quality had a positive impact
on repurchase intention (Kim, 2005). The regression model was statistically significant
(F (5, 428) = 37.27, p = .001), and 30% of repurchase intention (dependent variable) was
explained by the five factors of service quality (independent variables). The results of the
regression coefficients indicated that the factors of assurance (Beta = .38, p = .0001) and
tangibles (Beta = .34, p = .0001) exerted strong influence on repurchase intention,
followed by the factors of responsiveness (Beta = .098, p = .088), empathy (Beta = .068,
p = .167), and reliability (Beta = .046, p = .549). Only the factors of assurance and
tangibles indicated statistically significant unique relationship with repurchase intention.
Therefore, hypothesis 6 was supported through comparison of similar results from
previous research.

105
Table 31
Regression Model of Hypothesis 6
H6: Service quality factors have positive impact on repurchase intention.
Equation: Y′(RI) = a + B1X1 + B2X2 +B3X3 + B4X4 + ε
Y′(RI) = .961+ .456X1 + .499X2 + .291X3 + .325X4 +.613
Dependent variable: Repurchase Intention
Independent variables: Four Factors of Service Quality
Multiple R = .804
R2 = .647
Adjusted R2 = .644
Standard Error = .613
F = 226.884
p = .0001*
Unstandardized Standardized Coefficient Coefficient
Variable B Std.Error Beta p
Constant .961 .027
F1: Personnel and Customers’ Relationship .468 .027 .456 .0001*
F2: Environment Service Provider .512 .027 .499 .0001*
F3: Service Providers’ Attitude and .299 .027 .291 .0001*
Competencies
F4: Service Providers’ Initiative in .334 .027 .325 .0360*
Guest’s Service
* P ≤ .05

106
H7: Overall customer satisfaction has a positive impact on word-of-mouth
endorsements.
As shown in Table 32, explained the result of the regression analysis of overall
customer satisfaction as an independent variable with customer loyalty (word-of-mouth
endorsements). The result of hypothesis 7 indicated that customer satisfaction had a
positive impact on word-of-mouth endorsements. The coefficient of determination (R²)
of .62 showed that 62% of the variance in word-of-mouth endorsements was explained by
overall customer satisfaction. The F-ratio was significant (F (1, 498) = 815.280, p = .0001).
The value of variance of inflation (VIF) for each variable indicated that there was
no multicollinearity among the independent variables. Overall customer satisfaction
appeared to be a significant independent variable that influenced the customer’s word-of-
mouth endorsements in casual dining restaurants in Phuket. In other words, when we
consider the relationship between word-of-mouth and satisfaction, customer satisfaction
was a critical influence that determined a positive or negative word-of-mouth inclination.
Therefore, hypothesis 7, “Overall customer satisfaction has a positive impact on
word-of-mouth endorsements” was supported.
Previous research indicated that overall customer satisfaction had a positive
impact on word-of-mouth endorsements (F (1, 678) = 1749.47, p = .0001) (Ng, 2005).
Therefore, hypothesis 7 was supported by the findings of previous research. The
coefficient of determination (R2) of .695 showed that 69.5% of the variance in the word-
of-mouth endorsements was explained by overall customer satisfaction, which indicated
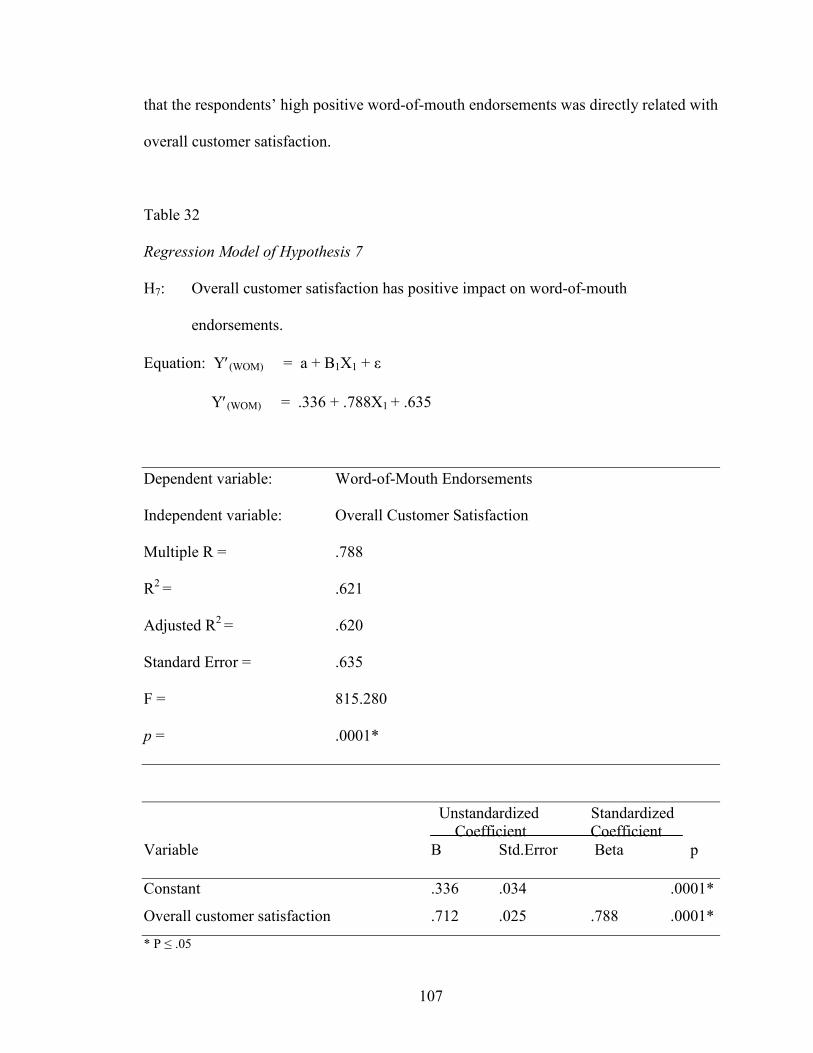
107
that the respondents’ high positive word-of-mouth endorsements was directly related with
overall customer satisfaction.
Table 32
Regression Model of Hypothesis 7
H7: Overall customer satisfaction has positive impact on word-of-mouth
endorsements.
Equation: Y′(WOM) = a + B1X1 + ε
Y′(WOM) = .336 + .788X1 + .635
Dependent variable: Word-of-Mouth Endorsements
Independent variable: Overall Customer Satisfaction
Multiple R = .788
R2 = .621
Adjusted R2 = .620
Standard Error = .635
F = 815.280
p = .0001*
Unstandardized Standardized Coefficient Coefficient
Variable B Std.Error Beta p
Constant .336 .034 .0001*
Overall customer satisfaction .712 .025 .788 .0001*
* P ≤ .05

108
H8: Overall customer satisfaction has a positive impact on repurchase intention.
As shown in Table 33, explained the result of the regression analysis of overall
customer satisfaction as an independent variable and the repurchase intention as the
dependent variable. The coefficient of determination (R²) of .49 showed that 49% of the
variance in the repurchase intention was explained by the overall customer satisfaction.
The R of independent variable (overall customer satisfaction) on the dependent variable
(repurchase intention) was .70, which represented that respondents had high repurchase
intention with the overall customer satisfaction. It also found that the high customer
satisfaction level would lead to respondent’s repurchase intention. The F-ratio was
significant (F (1, 498) = 486.424, p = .0001). The value of variance inflation factor (VIF)
showed that there was no multicollinearity among independent variables. Overall
customer satisfaction seemed to be a significant independent variable that influenced the
customer repurchase intention in casual dining restaurants in Phuket. Therefore,
hypothesis 8, “Overall customer satisfaction has a positive impact on repurchase
intention” was supported.
Previous research supports the results of regression analysis of overall customer
satisfaction as an independent variable with repurchase intention as dependent variable
(Ng, 2005). About 72 percent of the repurchase intention was explained by the overall
customer satisfaction (R2 = .719). That was, significant interactions were found between
the overall customer satisfaction and repurchase intention for the respondents. The F-
ratio was statistically significant at F-value of (F (1, 432) = 461.01, p = .0001). Therefore,
the previous research supported hypothesis 8.

109
Table 33
Regression Model of Hypothesis 8
H8: Overall customer satisfaction has positive impact on repurchase intention.
Equation: Y′(RI) = a + B1X1 + ε
Y′(RI) = .489 + .703X1 + .731
Dependent variable: Repurchase Intention
Independent variable: Overall Customer Satisfaction
Multiple R = .703
R2 = .494
Adjusted R2 = .493
Standard Error = .731
F = 486.424
p = .0001*
Unstandardized Standardized Coefficient Coefficient
Variable B Std.Error Beta p
Constant .489 .039 .0001*
Overall customer satisfaction .634 .029 .703 .0001*
* P ≤ .05

110
One-Way Analysis of Variance
H9: There is a significant difference in service quality factors based on customers’
demographic profile (gender, age, dining frequency, per capita expenditures for
each meal).
One-way ANOVA was used to determine whether there were statistically
significant differences in service quality factors based on customers’ demographic
variables (gender, age, dining frequency, and per capita expenditures for each meal).
Customers’ demographics (gender, age, dining frequency, and per capita expenditures for
each meal) were treated as independent variables and service quality factors as dependent
variables. If the results of the ANOVA were significant, Tukey’s HSD test was carried
out to assess the significance of pairwise post hoc differences. All the statistical
significance tests were performed with the alpha level set at .05.
Factor 1 – Personnel and Customers’ Relationship
As shown in Table 34, the results of the ANOVA indicated that there was a
significant difference in service quality factor 1 based on per capita expenditures for each
meal (F (4, 495) = 3.801, p = .005). Tukey’s HSD test was performed for service quality
factor 1 in order to assess which group of per capita expenditures for each meal showed
the significant differences. The result of the post hoc analysis showed that the
respondents’ per capita expenditures for each meal Over 1600 Baht (Over $400) had a
higher significance difference than expenditures Under 400 Baht (Under $100) and

111
400-800 Baht ($100-$200). Moreover, there were no statistically significant differences
in service quality factor 1 – Personnel and Customers’ Relationship based on gender, age,
and dining frequency (p > .05).
Table 34
ANOVA of Service Quality Factor 1 – Personnel and Customers’ Relationship by Per
Capita Expenditures for Each Meal
Sources Sum of df Mean F p Squares Square
Per Capita Expenditures 14.871 4 3.718 3.801 .005*
for Each Meal
Error 484.129 495 .978
Total 499.00 499
* P ≤ .05
Factor 2 – Environment Service Provider
As shown in Table 35, the results of the ANOVA indicated that there was a
significant difference in service quality factor 2 based on per capita expenditures for each
meal (F (4, 495) = 9.488, p = .0001). Tukey’s HSD test was performed for service quality
factor 2 in order to assess which group of per capita expenditures for each meal showed
the significant differences. The result of the post hoc analysis showed that the
respondents’ per capita expenditures for each meal had a significant difference among the
three groups. First, the respondents’ per capita expenditures for each meal between
801-1200 Baht ($20.01-$30) had a higher significance difference than expenditures
Under 400 Baht (Under $10) and 400-800 Baht ($10-$20). Second, the respondents’ per

112
capita expenditures for each meal between 1201-1600 Baht ($30.01-$40) had a higher
significance difference than expenditures Under 400 Baht (Under $10) and 400-800 Baht
($10-$20). Third, the respondents’ per capita expenditures of each meat at Over 1600
Baht (Over $40) had a higher significance difference than expenditures Under 400 Baht
(Under $10) and 400-800 Baht ($10-$20). Moreover, there were no statistically
significant differences in service quality factor 2 – Environment Service Provider based
on gender, age, and dining frequency (p > .05).
Table 35
ANOVA of Service Quality Factor 2 – Environment Service Provider by
Per Capita Expenditures for Each Meal
Sources Sum of df Mean F p Squares Square
Per Capita Expenditures 35.535 4 8.884 9.488 .0001*
for Each Meal
Error 463.465 495 .936
Total 499.00 499
* P ≤ .05
Factor 3 - Service Providers’ Attitude and Competencies
As shown in Table 36, the results of the ANOVA indicated that there were
significant differences in service quality factor 3 based on gender (F (1, 498) = 4.170,
p = .042) and per capita expenditures for each meal (F (4, 495) = 3.932, p = .004). Tukey’s
HSD test was not performed for gender because there were fewer than three groups. The
result of the post hoc analysis showed that the respondents’ per capita expenditures for

113
each meal between 801-1200 Baht ($20.01-$30) had a higher significance difference than
expenditures Under 400 Baht (Under $10). Moreover, there were no statistically
significant differences in service quality factor 3 – Service Providers’ Attitude and
Competencies based on age and dining frequency (p > .05).
Table 36
ANOVA of Service Quality Factor 3 – Service Providers’ Attitudes and Competencies by
Gender
Sources Sum of df Mean F p Squares Square
Gender 4.144 1 4.144 4.170 .042*
Error 494.856 498 .994
Total 499.000 499
* P ≤ .05
ANOVA of Service Quality Factor 3 – Service Providers’ Attitudes and Competencies by
Per Capita Expenditures for Each Meal
Sources Sum of df Mean F p Squares Square
Per Capita Expenditures 15.366 4 3.842 3.932 .004*
for Each Meal
Error 483.634 495 .977
Total 499.00 499
* P ≤ .05

114
Factor 4 - Service Providers’ Initiative in Guest’s Service
As shown in Table 37, the results of the ANOVA indicated that there were
significant differences in service quality factor 3 based on gender (F (1, 498) = 8.497,
p = .004), age (F (4, 495) = 3.803, p = .005), and per capita expenditures for each meal
(F (4, 495) = 2.782, p = .026). Tukey’s HSD test was not conducted for gender and age
because there were fewer than three groups or one group had fewer than two cases. The
result of the post hoc analysis showed that the respondents’ per capita expenditures of
each meal were no statistically different significances among per capita expenditures for
each meal. In addition, there was no statistically significant difference in service quality
factor 4 – Service Providers’ Initiative in Guest’s Service based on dining frequency
(p > .05).
Table 37
ANOVA of Service Quality Factor 4 – Service Providers’ Initiative in Guest’s Service by
Gender
Sources Sum of df Mean F p Squares Square
Gender 8.371 1 8.371 8.497 .004*
Error 490.629 498 .985
Total 499.000 499
* P ≤ .05

115
ANOVA of Service Quality Factor 4 – Service Providers’ Initiative in Guest’s Service by
Age
Sources Sum of df Mean F p Squares Square
Age 14.879 4 3.720 3.803 .005*
Error 484.121 495 .978
Total 499.000 499
* P ≤ .05
ANOVA of Service Quality Factor 4 – Service Providers’ Initiative in Guest’s Service by
Per Capita Expenditures for Each Meal
Sources Sum of df Mean F p Squares Square
Per Capita Expenditures 10.972 4 2.743 2.782 .026*
for Each Meal
Error 488.028 495 .986
Total 499.000 499
* P ≤ .05
H10: There is a significant difference in overall service quality based on customers’
demographic profile (gender, age, dining frequency, and per capita expenditures
for each meal).
One-way ANOVA was used to determine whether there was a statistically
significant difference in overall service quality (tangibles, reliability, responsiveness,
assurance, and empathy) depending on the customers’ demographic variables (gender,
age, dining frequency, and per capita expenditures for each meal). If the results of the

116
ANOVA were significant, Tukey’s HSD test was carried out to assess the significance of
pairwise post hoc differences. Customers’ demographics (gender, age, dining frequency,
and per capita expenditures for each meal) were treated as independent variables and
overall service quality as dependent variables.
Weighted Tangibles
As shown in Table 38, there were statistically significant differences in weighted
tangibles based on gender (F (1, 498) = 9.653, p = .002) and per capita expenditures for
each meal (F (4, 495) = 15.005, p = .0001). Tukey’s HSD test was not conducted for gender
because there were fewer than three groups. The result of the post hoc analysis showed
that the respondents’ per capita expenditures of each meal had significant difference
among the four groups. First, the respondents’ per capita expenditures for each meal
between 400-800 Baht ($10-$20) had a higher significance difference than expenditures
Under 400 Baht (Under $10). Second, the respondents’ per capita expenditures for each
meal between 801-1200 Baht ($20.01-$30) had a higher significance difference than
expenditures Under 400 Baht (Under $10) and 400-800 Baht ($10-$20). Third and
fourth, the respondents’ per capita expenditures for each meal between 1201-1600 Baht
($30.01-$40) and Over 1600 Baht (Over $40) had a higher significance difference than
expenditures Under 400 Baht (Under $10) and 400-800 Baht ($10-$20). In addition,
there were no statistically significant differences in weighted tangibles based on age and
dining frequency (p > .05).

117
Table 38
ANOVA of Weighted Tangibles by Gender
Sources Sum of df Mean F p Squares Square
Gender .664 1 .664 9.653 .002*
Error 34.256 498 .069
Total 34.920 499
* P ≤ .05
ANOVA of Weighted Tangibles by Per Capita Expenditures for Each Meal
Sources Sum of df Mean F p Squares Square
Per Capita Expenditures 3.776 4 .944 15.005 .0001*
for Each Meal
Error 31.143 495 .063
Total 34.920 499
* P ≤ .05
Weighted Reliability
As shown in Table 39, the results of the ANOVA showed that there were
statistically significant differences in weighted reliability based on gender (F (1, 498) =
9.163, p = .003), age (F (4, 495) = 4.335, p = .002) and per capita expenditures for each
meal (F (4, 495) = 9.259, p = .0001). Tukey’s HSD test was not conducted for gender and
age because there were fewer than three groups or one group had fewer than two cases.
The result of the post hoc analysis showed that the respondents’ per capita expenditures
of each meal between 801-1200 Baht ($20.01-$30) had a higher significance difference
than expenditures Under 400 Baht (Under $10) and 400-800 Baht ($10-$20). The

118
respondents’ per capita expenditures of each meal at Over 1600 Baht (Over $40) had a
higher significance difference than expenditures among Under 400 Baht (Under $10),
400-800 Baht ($10-$20), and 801-1200 Baht ($20.01-$30). In addition, there was no
statistically significant difference in weighted reliability based on dining frequency
(p > .05).
Table 39
ANOVA of Weighted Reliability by Gender
Sources Sum of df Mean F p Squares Square
Gender .502 1 .502 9.163 .003*
Error 27.271 498 .055
Total 27.773 499
* P ≤ .05
ANOVA of Weighted Reliability by Age
Sources Sum of df Mean F p Squares Square
Age .940 4 .235 4.335 .002*
Error 26.833 495 .054
Total 27.773 499
* P ≤ .05

119
ANOVA of Weighted Reliability by Per Capita Expenditures for Each Meal
Sources Sum of df Mean F p Squares Square
Per Capita Expenditures 1.933 4 .483 9.259 .0001*
for Each Meal
Error 25.839 495 .052
Total 27.773 499 * P ≤ .05
Weighted Responsiveness
As shown in Table 40, the results of the ANOVA showed that there were
statistically significant differences in weighted responsiveness based on gender
(F (1, 498) = 15.279, p = .0001), age (F (4, 495) = 4.086, p = .003), and per capita
expenditures for each meal (F (4, 495) = 14.480, p = .0001). Tukey’s HSD test was not
conducted for gender and age because there were fewer than three groups or one group
had fewer than two cases. The result of the post hoc analysis showed that the
respondents’ per capita expenditures for each meal had a significant difference among the
three groups. First, the respondents’ per capita expenditures for each meal between
801-1200 Baht ($20.01-$30) had a higher significance difference than expenditures
Under 400 Baht (Under $10). Second, the respondents’ per capita expenditures for each
meal between 1201-1600 Baht ($30.01-$40) had a higher significance difference than
expenditures Under 400 Baht (Under $10). Third, the respondents’ per capita
expenditures for each meal at Over 1600 Baht (Over $40) had a higher significance
difference than expenditures among Under 400 Baht (Under $10), 400-800 Baht ($10-
$20), and 801-1200 Baht ($20.01-$30). In addition, there was no statistically significant
difference in weighted responsiveness based on dining frequency (p > .05).

120
Table 40
ANOVA of Weighted Responsiveness by Gender
Sources Sum of df Mean F p Squares Square
Gender .726 1 .726 15.279 .0001*
Error 23.663 498 .048
Total 24.389 499
* P ≤ .05
ANOVA of Weighted Responsiveness by Age
Sources Sum of df Mean F p Squares Square
Age .779 4 .195 4.086 .003*
Error 23.609 495 .048
Total 24.389 499
* P ≤ .05
ANOVA of Weighted Responsiveness by Per Capita Expenditures for Each Meal
Sources Sum of df Mean F p Squares Square
Per Capita Expenditures 2.555 4 .639 14.480 .0001*
for Each Meal
Error 21.834 495 .044
Total 24.389 499 * P ≤ .05

121
Weighted Assurance
As shown in Table 41, the results of the ANOVA showed that there were
statistically significant differences in weighted assurance based on gender (F (1, 498) =
8.681, p = .003) and per capita expenditures for each meal (F (4, 495) = 14.493, p = .0001).
Tukey’s HSD test was not conducted for gender because there were fewer than three
groups. The result of the post hoc analysis showed that the respondents’ per capita
expenditures for each meal had a significant difference among the three groups. First, the
respondents’ per capita expenditures for each meal between 801-1200 Baht ($20.01-$30)
had a higher significance difference than expenditures Under 400 Baht (Under $10) and
400-800 Baht ($10-$20). Second, the respondents’ per capita expenditures for each meal
between 1201-1600 Baht ($30.01-$40) had a higher significance difference than
expenditures Under 400 Baht (Under $10). Third, the respondents’ per capita
expenditures for each meal at Over 1600 Baht (Over $40) had a higher significance
difference than expenditures among Under 400 Baht ($10), 400-800 Baht ($10-$20),
801-1200 Baht ($20.01-$30), and 201-1600 Baht ($30.01-$40). In addition, there were no
statistically significant differences in weighted assurance based on age and dining
frequency (p > .05).

122
Table 41
ANOVA of Weighted Assurance by Gender
Sources Sum of df Mean F p Squares Square
Gender .434 1 .434 8.681 .003*
Error 24.873 498 .050
Total 25.306 499
* P ≤ .05
ANOVA of Weighted Assurance by Per Capita Expenditures for Each Meal
Sources Sum of df Mean F p Squares Square
Per Capita Expenditures 2.653 4 .663 14.493 .0001*
for Each Meal
Error 22.653 495 .046
Total 25.306 499 * P ≤ .05
Weighted Empathy
As shown in Table 42, the results of the ANOVA showed that there were
statistically significant differences in weighted empathy based on gender
(F (1, 498) = 9.540, p = .002), age (F (4, 495) = 2.669, p = .032), and per capita expenditures
for each meal (F (4, 495) = 13.197, p = .0001). Tukey’s HSD test was not conducted for
gender and age because there were fewer than three groups or one group had fewer than
two cases. The result of the post hoc analysis showed that the respondents’ per capita
expenditures for each meal was a significantly different among the four groups. First,
the respondents’ per capita expenditures for each meal between 400-800 Baht ($10-$20)

123
showed a higher significance difference than expenditures Under 400 Baht (Under $10).
Second, the respondents’ per capita expenditures for each meal between 801-1200 Baht
($20.01-$30) showed a higher significance difference than expenditures Under 400 Baht
(Under $10) and 400-800 Baht ($10-$20). Third, the respondents’ per capita
expenditures for each meal between 1201-1600 Baht ($30.01-$40) showed a higher
significance difference than expenditures Under 400 Baht (Under $10). Lastly, the
respondents’ per capita expenditures for each meal at Over 1600 Baht (Over $40) showed
a higher significance difference than expenditures among Under 400 Baht ($10), 400-800
Baht ($10-$20), 801-1200 Baht ($20.01-$30), and 1201-1600 Baht ($30.01-$40) groups.
Moreover, there were no statistically significant differences in weighted empathy based
on dining frequency (p > .05).
Table 42
ANOVA of Weighted Empathy by Gender
Sources Sum of df Mean F p Squares Square
Gender .629 1 .629 9.540 .002*
Error 32.855 498 .066
Total 33.484 499
* P ≤ .05

124
ANOVA of Weighted Empathy by Age
Sources Sum of df Mean F p Squares Square
Age .707 4 .177 2.669 .032*
Error 32.777 495 .066
Total 33.484 499
* P ≤ .05
ANOVA of Weighted Empathy by Per Capita Expenditures for Each Meal
Sources Sum of df Mean F p Squares Square
Per Capita Expenditures 3.227 4 .807 13.197 .0001*
for Each Meal
Error 30.258 495 .061
Total 33.484 499 * P ≤ .05
H11: There is a significant difference in overall service quality between the type of
customers (Thai and International).
One-way ANOVA was used to determine whether there was a statistically
significant difference in overall service quality (tangibles, reliability, responsiveness,
assurance, and empathy) with the type of customers (Thai and International). If the
results of the ANOVA were statistically significant, Tukey’s HSD test was carried out to
assess the significance of pairwise post hoc differences. Type of customers (Thai and
International) was treated as independent variable and overall service quality as
dependent variable.

125
As shown in Table 43, the results of the ANOVA showed that there were
statistically significant differences in weighted reliability (F (1, 498) = 11.724, p = .001),
weighted responsiveness, (F (1, 498) = 14.552, p = .0001), weighted assurance (F (1, 498) =
10.609, p = .001), and weighted empathy (F (1, 498) = 8.865, p = .003) between Thai and
international customers. Since there were fewer than three groups, pairwise comparison
using Tukey’s HSD was not used to test for the means of weighted reliability, weighted
responsiveness, weighted assurance, and weighted empathy. Additionally, there was no
statistically significant difference in weighted tangibles between Thai and international
customers (p > .05). Therefore, hypothesis 11, “There is a significant difference in
overall service quality between the type of customers (Thai and International)” was
supported relative to weighted reliability, weighted responsiveness, weighted assurance,
and weighted empathy.
Table 43
ANOVA of Weighted Reliability between Thai and International Customers
Sources Sum of df Mean F p Squares Square
Customers .639 1 .639 11.724 .001*
Error 27.134 498 .054
Total 27.773 499
* P ≤ .05

126
ANOVA of Weighted Responsiveness between Thai and International Customers
Sources Sum of df Mean F p Squares Square
Customers .692 1 .692 14.552 .0001*
Error 23.696 498 .048
Total 24.389 499
* P ≤ .05
ANOVA of Weighted Assurance between Thai and International Customers
Sources Sum of df Mean F p Squares Square
Customers .528 1 .528 10.609 .001*
Error 24.778 498 .050
Total 25.306 499
* P ≤ .05
ANOVA of Weighted Empathy between Thai and International Customers
Sources Sum of df Mean F p Squares Square
Customers .586 1 .586 8.865 .003*
Error 32.899 498 .066
Total 33.484 499
* P ≤ .05

127
H12: There is a significant difference in overall service quality with type of casual
dining restaurants.
One-way ANOVA was used to determine whether there was a statistically
significant difference in overall service quality (tangibles, reliability, responsiveness,
assurance, and empathy) with type of casual dining restaurants. If the results of the
ANOVA were statistically significant, Tukey’s HSD test was carried out to assess the
significance of pairwise post hoc differences. Type of casual dining restaurants
(Japanese, Thai, Italian, and Mediterranean) was treated as independent variables and
overall service quality as dependent variables. All the statistical significance tests were
performed with the alpha level set at .05.
As shown in Table 44, the results of the ANOVA showed that there were
statistically significant differences in weighted responsiveness, (F (3, 496) = 2.892,
p = .035), weighted assurance (F (3, 496) = 4.275, p = .005), and weighted empathy
(F (3, 496) = 5.321, p = .001) with type of casual dining restaurants. Tukey’s HSD test was
performed for overall service quality in order to assess which types of causal dining
restaurants showed the significant differences. The result of the post hoc analysis showed
that Thai casual dining restaurant had a higher significance difference than Italian casual
dining restaurant in weighted responsiveness and weighted assurance. Thai casual dining
restaurant also had a higher significance difference than Japanese and Italian casual
dining restaurants in weighted empathy. Additionally, there were no statistically
significant differences in weighted tangibles and weighted reliability with type of causal

128
dining restaurants (p > .05). Therefore, hypothesis 12, “There is a significant difference
in overall service quality with type of casual dining restaurants” was supported.
Table 44
ANOVA of Weighted Responsiveness by Type of Casual Dining Restaurants
Sources Sum of df Mean F p Squares Square
Restaurants .419 3 .140 2.892 .035*
Error 23.969 496 .048
Total 24.389 499
* P ≤ .05
ANOVA of Weighted Assurance by Type of Casual Dining Restaurants
Sources Sum of df Mean F p Squares Square
Restaurants .638 3 .213 4.275 .005*
Error 24.668 496 .050
Total 25.306 499
* P ≤ .05
ANOVA of Weighted Empathy by Type of Casual Dining Restaurants
Sources Sum of df Mean F p Squares Square
Restaurants 1.042 3 .347 5.312 .001*
Error 32.442 496 .065
Total 33.484 499
* P ≤ .05

129
Table 45
Comparative of ANOVA of Service Quality Factors and Overall Service Quality by
Customers’ Demographic Profiles of Full Study
Customers’ Demographic Profile
Gender Age Dining Per Frequency Capita Expenditures for Each Meal Service Quality Factors**:
F1: Personnel and Customers’ p = .170 p = .196 p = .268 p = .005*
Relationship
F2: Environment and p = .131 p = .483 p = .188 p = .0001*
Service Provider
F3: Service Providers’ Attitude p = .042* p = .265 p = .220 p = .004*
and Competencies
F4: Service Providers’ Initiative p = .004* p = .005* p = .085 p = .026*
in Guest’s Service
Overall Service Quality***:
Weighted Tangibles p = .002* p = .102 p = .287 p = .0001*
Weighted Reliability p = .003* p = .002* p = .173 p = .0001*
Weighted Responsiveness p = .0001* p = .003* p = .053 p = .0001*
Weighted Assurance p = .003* p = .178 p = .153 p = .0001*
Weighted Empathy p = .002* p = .032* p = .104 p = .0001* * p ≤ .05 ** Service quality factors refer to factor analysis *** Overall service quality refers to term of weighted = mean of service quality dimension multiplied by the weighted percentage of each item.

130
Independent-Samples t Test
Independent-samples t test was used to compare the means among Thai and
international customers. In order to compare the responses of Thai and international
customers relative to the 30 service quality attributes. The results showed that the test for
homogenously of variance was achieved through. The use of Levene test for equality of
variance. Since the test is significant (p< .05), the researcher rejected the null hypothesis
and accepted the alternative hypothesis that the variances are unequal.
Service Quality Attributes
Table 46, the independent-samples t test analysis indicated that international
customers had a higher means than that of Thai customers. There was twenty-four
service quality attributes were significant relative to Thai and international customers in
casual dining restaurants in Phuket. These attributes were: menu reflects images, service
in the time promised, employees quickly correct, service is consistent, accurate guest
check, serve food exactly as you ordered, food prices are charged same as in menu,
service will be performed, during busy time has enough employee, employees provide
quick service, employees respond promptly, willing to help, give extra effort, employees
answer questions accurately, you feel comfortable, employees give information,
personnel has well trained, support their employees, employees are polite, personal
attention, know your needs, operation hours are convenient, best interest at heart, and
considers your needs.

131
Table 46 showed how Thai and international customers rated the importance of
service quality attributes in the casual dining restaurants in Phuket. With regard to the
twenty-four SERVQUAL attributes Thai and international customers stated that
“accurate guest check” was the most important attribute, followed closely by employees
are polite, considers your needs, and employees quickly correct. The findings showed
that the top five attributes of service quality for the Thai customers that reflected the
perspective of the mean value of service quality in casual dining restaurants were: (1)
accurate guest check (1.08), (2) employees are polite (1.02), (3) employees quickly
correct (0.97), (4) serve food exactly as you ordered (0.97), and (5) considers your needs
(0.97). The top five attributes of service quality for the international customers that
reflected the perspective of the mean value of service quality in casual dining restaurants
were: (1) accurate guest check (1.33), (2) employees are polite (1.33), (3) service is
consistent (1.32), (4) considers your needs (1.28), and (5) employees quickly correct
(1.26).

132
Table 46
Independent-Samples t Test of Service Quality Attributes by Type of Customers (N = 500)
Thai International
n = 273 n = 227 Equal Variances Not Assumed
Service Quality Mean(SD) Mean(SD) Mean t Sig. Attributes Difference (2 tailed) Menu reflects images .95(1.22) 1.23(1.38) -.277 -2.355 .019*
Service in the time promised .80(1.09) 1.15(1.39) -.351 -3.090 .002*
Employees quickly correct .97(1.10) 1.26(1.35) -.288 -2.583 .010*
Service is consistent .96(1.18) 1.32(1.37) -.361 -3.126 .002*
Accurate guest check 1.08(1.08) 1.33(1.41) -.249 -2.182 .030*
Serve food exactly as you ordered .97(1.15) 1.30(1.44) -.325 -2.755 .006*
Food prices are charged same as in menu .89(1.20) 1.19(1.50) -.300 -2.433 .015*
Service will be performed .75(1.14) 1.01(1.44) -.266 -2.253 .025*
During busy time has enough employee .81(1.21) 1.11(1.46) -.297 -2.439 .015*
Employees provide quick service .70(1.16) 1.15(1.50) -.446 -3.664 .000*
Employees respond promptly .87(1.17) 1.24(1.48) -.366 -3.021 .003*
Willing to help .90(1.14) 1.23(1.36) -.329 -2.889 .004*
Give extra effort .84(1.25) 1.19(1.47) -.343 -2.778 .006*
Employees answer questions accurately .81(1.20) 1.12(1.39) -.317 -2.690 .007*
You feel comfortable .92(1.15) 1.20(1.35) -.280 -2.460 .014*
Employees give information .99(1.18) 1.39(1.33) -.395 -3.474 .001*
Personnel has well trained .72(1.23) 1.14(1.45) -.419 -3.405 .001*
Support their employees .86(1.18) 1.26(1.43) -.403 -3.402 .001*
Employees are polite 1.02(1.17) 1.33(1.38) -.316 -2.733 .007*
Personal attention .77(1.32) 1.16(1.48) -3.94 -3.110 .002*
Know your needs .82(1.16) 1.19(1.46) -.365 -3.052 .002*
Operation hours are convenient .84(1.25) 1.18(1.43) -.342 -2.821 .005*
Best interest at heart .91(1.24) 1.24(1.43) -.334 -2.753 .005*
Considers your needs .97(1.28) 1.28(1.54) -.311 -2.430 .016* Table 2
*p ≤ 0.05

133
Overall Service Quality
Table 47, the independent-samples t test analysis indicated that there were
significant difference between Thai and international customers in overall service quality
with regard to weighted reliability, weighted responsiveness, weighted assurance, and
weighted empathy. International customers had a higher means than Thai customers did
in overall service quality. The findings showed that 273 Thai customers had the most
perspective of overall service quality in weighted tangibles (0.20), followed by weighted
reliability (0.19), weighted empathy (0.18), weighted assurance (0.17), and weighted
responsiveness (0.15). The international customers had the most insight of the overall
service quality in weighted reliability (0.26), weighted empathy (0.25), weighted
assurance (0.24), and weighted responsiveness (0.23).
Table 47
Independent-Samples t Test of Overall Service Quality by Type of Customers (N = 500)
Thai International
n = 273 n = 227 Equal Variances Not Assumed
Overall Service Mean(SD) Mean(SD) Mean t Sig.
Quality Difference (2 tailed) Weighted Tangibles .20(.24) .22(.30) -.02 -.639 .523
Weighted Reliability .19(.20) .26(.27) -.07 -3.331 .001*
Weighted Responsiveness .15(.18) .23(.26) -.08 -3.697 .000*
Weighted Assurance .17(.20) .24(.25) -.06 -3.197 .001*
Weighted Empathy .18(.23) .25(.28) -.07 -2.922 .004*
*p ≤ 0.05

134
Chi-Square Tests of Independence
Chi-square tests of independence applied to the analysis of the relationship
between service quality attributes and customers’ demographic profile (gender, age,
marital status, dining frequency, and per capita expenditures for each meal) among Thai
and international customers. If the Pearson Chi-Square was significance (p ≤ .05), then
concluded that there was a significant difference among Thai and international customers.
Table 48 showed the results of Chi-Square between service quality attributes and
customers’ demographic profiles among Thai and international customers. The value of
Chi-Square indicated that there were significant differences between service quality
attributes and customers’ demographic profiles (gender, age, marital status, dining
frequency, and per capital expenditures for each meal) among Thai and international
customers. The review of the crosstabulation showed that the relationships between
service quality attributes and customers’ demographic profiles were not the same when
type of customers (Thai and international) had been taken into consideration. For
example, gender, there were significantly different in Thai customers with regard to menu
reflects image, customers feel comfortable, and employees give information to
customers.

135
Table 48
Chi-Square Test of Thai and International Customers between Service Quality Attributes
and Customers Demographic Profiles
Customers Demographic Profiles Marital (a) Dining (a) Per Capita(a)
Gender(a) Age(a) Status Frequency Expenditures Service Quality Thai Inter Thai Inter Thai Inter Thai Inter Thai Inter Attributes Parking is adequate .649 .053 .045* .020* .023* .129 .010* .178 .012* .056 Dining is clean .959 .004* .098 .181 .187 .432 .706 .010* .006* .000* Décor with restaurant .282 .388 .071 .130 .422 .115 .453 .029* .058 .000* image Employees are well .087 .283 .241 .013* .544 .070 .619 .573 .690 .455 dressed Menu reflects image .014* .042* .105 .014* .067 .035* .025* .006* .379 .001* Restroom is clean .117 .035* .269 .075 .521 .078 .109 .795 .012* .095 Service in the time .217 .111 .025* .053 .625 .102 .528 .125 .077 .065 promised Employees quickly .319 .168 .241 .052 .207 .272 .512 .155 .386 .086 correct Service is consistent .476 .275 .060 .077 .771 .163 .607 .499 .201 .156 Accurate guest check .105 .182 .100 .532 .161 .076 .182 .001* .155 .058 Serve food exactly .514 .144 .086 .155 .089 .191 .363 .130 .607 .432 as you ordered Food prices are .094 .109 .061* .071* .052 .259 .652 .154 .012* .245 charged same as menu Service will be performed .318 .087 .795 .098 .207 .088 .064 .328 .752 .095 During busy time has .141 .074 .122 .222 .078 .096 .216 .401 .051 .351 enough employees Employees provide .796 .164 .018* .056 .194 .196 .717 .140 .499 .254 quick service Employees respond .274 .057 .350 .046* .119 .405 .308 .132 .130 .059 promptly Willing to help .124 .053 .245 .204 .562 .443 .533 .059 .652 .344 Give extra effort .053 .085 .116 .553 .619 .057 .814 .062 .109 .051 Employees answer .086 .383 .005* .164 .463 .092 .083 .054 .093 .140 questions accurately Feel comfortable .022* .285 .028* .202 .028* .082 .310 .001* .083 .057 Employees give infor. .019* .080 .105 .459 .092 .026* .913 .647 .176 .192 Personnel has well .798 .488 .053 .093 .488 .902 .068 .125 .440 .068 trained Support their employees .114 .235 .162 .586 .821 .078 .127 .078 .456 .103 Employees are polite .085 .331 .126 .583 .433 .189 .026* .205 .451 .187 Personal attention .184 .456 .234 .143 .339 .058 .078 .098 .647 .051 Know your needs .313 .102 .378 .145 .165 .125 .879 .903 .378 .125 Operation hours are .288 .444 .191 .122 .363 .054 .836 .052 .047* .000* convenience Best interest at heart .439 .053 .145 .167 .294 .552 .056 .234 .552 .294 Customers feel special .682 .054 .149 .114 .253 .126 .134 .089 .126 .165 Considers your needs .597 .723 .161 .205 .673 .097 .071 .126 .124 .256
(a) Pearson Chi-Square Assumption Significance (2-sided) * p ≤ 0.05

136
Gender
Thai Customers
From the value of the Chi-Square indicated that there were significant differences
between gender and service quality attributes among Thai customers with the three
service quality attributes. These attributes were: (1) menu reflects image, (2) customers
feel comfortable, and (3) employees give information to customers (Table 49).
Table 49
Crosstabulation of Thai Customers between Service Quality Attributes and Gender
Type of Gender Customers Male Female Total Results
Thai
Menu reflects images
Less than expected Count 8 11 19
There was a significant difference between
Expected Count 8.6 10.4 19.0 menu reflects image
% within menu reflects images 42.1 57.9 100.0
and gender of respondents
% within What is your gender? 6.5 7.3 7.0
among Thai customers. The majority of female
% of Total 2.9 4.0 7.0 (40.3%) though that Neutral Count 43 29 72 menu reflects image Expected Count 32.4 39.6 72.0 was greater than
% within menu reflects images 59.7 40.3 100.0
expected than male (26.4%).
% within What is your gender? 35.0 19.3 26.4
% of Total 15.8 10.6 26.4 Greater than expected Count 72 110 182
Expected Count 82 100 182
% within menu reflects images 39.6 60.4 100.0
% within What is your gender? 58.5 73.3 66.7
% of Total 26.4 40.3 66.7 Total Count 123 150 273
Expected Count 123.0 150.0 273.0
% within menu reflects images 45.1 54.9 100.0
% within What is your gender? 100.0 100.0 100.0
% of Total 45.1 54.9 100.0
χ² = 8.54, (df = 2), p = .014

137
Type of Gender Customers Male Female Total Results
Thai Feel comfortable
Less than expected Count 2 9 11 There was a significant
Expected Count 5.0 6.0 11.0 difference between
% within feel comfortable 18.2 81.8 100.0
customers feel comfortable and
% within What is your gender? 1.6 6.0 4.0
gender of respondent among Thai customers.
% of Total 0.7 3.3 4.0 The majority of female Neutral Count 49 40 89 (37.0%) thought Expected Count 40.1 48.9 89.0 that customers feel
% within feel comfortable 55.1 44.9 100.0
comfortable was greater than expected than male (26.4%).
% within What is your gender? 39.8 26.7 32.6
% of Total 17.9 14.7 32.6 Greater than expected Count 72 101 173
Expected Count 77.9 95.1 173.0
% within feel comfortable 41.6 58.4 100.0
% within What is your gender? 58.5 67.3 63.4
% of Total 26.4 37.0 63.4 Total Count 123 150 273
Expected Count 123 150 273
% within feel comfortable 45.05 54.95 100
% within What is your gender? 100 100 100
% of Total 45.05 54.95 100
χ² =7.63, (df = 2), p = .022

138
Type of Gender Customers Male Female Total Results
Thai Employees give information
Less than expected Count 3 12 15
There was a significant
Expected Count 6.8 8.2 15.0 difference between
% within employees give information 20.0 80.0 100.0
employees give information
% within What is your gender? 2.4 8.0 5.5
to customers and gender of
% of Total 1.1 4.4 5.5 respondent among Thai customers.
Neutral Count 47 38 85 The majority of female (36.6%)
Expected Count 38.3 46.7 85.0 thought that employees
% within employees give information 55.3 44.7 100.0
give information to customer
% within What is your gender? 38.2 25.3 31.1
was greater than expected
% of Total 17.2 13.9 31.1 than male (26.7%)
Greater than expected Count 73 100 173
Expected Count 77.9 95.1 173.0
% within employees give information 42.2 57.8 100.0
% within What is your gender? 59.3 66.7 63.4
% of Total 26.7 36.6 63.4 Total Count 123 150 273
Expected Count 123.0 150.0 273.0
% within employees give information 45.1 54.9 100.0
% within What is your gender? 100.0 100.0 100.0
% of Total 45.1 54.9 100.0
χ² =7.97, (df = 2), p = .019
International Customers
From the value of the Chi-Square indicated that there were significant differences
between gender and service quality attributes among international customers with the
three service quality attributes. These attributes were: (1) dining is clean, (2) menu
reflects image, and (3) restroom is clean (Table 50).

139
Table 50
Crosstabulation of International Customers between Service Quality Attributes and
Gender
Type of Gender Customers Male Female Total Results
International Dining is clean
Less than expected Count 18 6 24
There was a significant
Expected Count 10.4 13.6 24.0 difference between
% within dining is clean 75.0 25.0 100.0
parking is adequate and gender of
% within What is your gender? 18.4 4.7 10.6
respondents among international
% of Total 7.9 2.6 10.6 customers. The Neutral Count 19 27 46 majority of female Expected Count 19.9 26.1 46.0 (42.3%) thought
% within dining is clean 41.3 58.7 100.0
that parking is adequate was greater
% within What is your gender? 19.4 20.9 20.3
than expected than male (26.9%).
% of Total 8.4 11.9 20.3 Greater than expected Count 61 96 157
Expected Count 67.8 89.2 157.0
% within dining is clean 38.9 61.1 100.0
% within What is your gender? 62.2 74.4 69.2
% of Total 26.9 42.3 69.2 Total Count 98 129 227
Expected Count 98.0 129.0 227.0
% within dining is clean 43.2 56.8 100.0
% within What is your gender? 100.0 100.0 100.0
% of Total 43.2 56.8 100.0
χ² =11.17, (df = 2), p = .004

140
Type of Gender Customers Male Female Total Results
International Menu reflects images
Less than expected Count 13 6 19
There was a significant
Expected Count 8.2 10.8 19.0 difference between menu
% within menu reflects images 68.4 31.6 100.0
reflects image and gender of
% within What is your gender? 13.3 4.7 8.4
respondents among international
% of Total 5.7 2.6 8.4 customers. The Neutral Count 23 26 49 majority of female Expected Count 21.2 27.8 49.0 (42.7%) thought
% within menu reflects images 46.9 53.1 100.0
that menu reflects image was greater
% within What is your gender? 23.5 20.2 21.6
than expected than male (27.3%).
% of Total 10.1 11.5 21.6 Greater than expected Count 62 97 159
Expected Count 68.6 90.4 159.0
% within menu reflects images 39.0 61.0 100.0
% within What is your gender? 63.3 75.2 70.0
% of Total 27.3 42.7 70.0 Total Count 98 129 227
Expected Count 98.0 129.0 227.0
% within menu reflects images 43.2 56.8 100.0
% within What is your gender? 100.0 100.0 100.0
% of Total 43.2 56.8 100.0
χ² =6.35, (df = 2), p = .042

141
Type of Gender Customers Male Female Total Results
International Restroom is clean
Less than expected Count 16 9 25
There was a significant
Expected Count 10.8 14.2 25.0 difference between restroom
% within restroom is clean 64.0 36.0 100.0
is clean and gender of respondents
% within What is your gender? 16.3 7.0 11.0
among international customers. The
% of Total 7.0 4.0 11.0 majority of female Neutral Count 32 36 68 (37.0%) thought Expected Count 29.4 38.6 68.0 that restroom is
% within restroom is clean 47.1 52.9 100.0
clean was greater than expected than male (22.0%).
% within What is your gender? 32.7 27.9 30.0
% of Total 14.1 15.9 30.0 Greater than expected Count 50 84 134
Expected Count 57.9 76.1 134.0
% within restroom is clean 37.3 62.7 100.0
% within What is your gender? 51.0 65.1 59.0
% of Total 22.0 37.0 59.0 Total Count 98 129 227
Expected Count 98.0 129.0 227.0
% within restroom is clean 43.2 56.8 100.0
% within What is your gender? 100.0 100.0 100.0
% of Total 43.2 56.8 100.0
χ² =6.71, (df = 2), p = .035
Age
Thai Customers
From the value of the Chi-Square indicated that there were significant differences
between age and service quality attributes among Thai customers with the four service
quality attributes. These attributes were: (1) parking is adequate, (2) service in the time
promised, (3) employees provide quick service, and (4) employees answer questions
accurately (Table 51).

142
Table 51
Crosstabulation of Thai Customers between Service Quality Attributes and Age
Age Type of 20-29 Over Total Results Customers yrs. 30-39 yrs.
Thai Parking is adequate
Less than expected Count 8 31 39 There was a significant
Expected Count 15.0 24.0 39.0 difference between
% within parking is adequate 20.5 79.5 100.0
parking is adequate and age of respondents
% within What is your age? 7.6 18.5 14.3
among Thai customers. The
% of Total 2.9 11.4 14.3 majority of the age
Neutral Count 43 62 105 group over 30-39 years (27.5%) thought
Expected Count 40.4 64.6 105.0 that parking is adequate greater than
% within parking is adequate 41.0 59.0 100.0
expected than the age group of 20-29 years (19.8%).
% within What is your age? 41.0 36.9 38.5
% of Total 15.8 22.7 38.5 Greater than expected Count 54 75 129
Expected Count 49.6 79.4 129.0
% within parking is adequate 41.9 58.1 100.0
% within What is your age? 51.4 44.6 47.3
% of Total 19.8 27.5 47.3 Total Count 105 168 273
Expected Count 105.0 168.0 273.0
% within parking is adequate 38.5 61.5 100.0
% within What is your age? 100.0 100.0 100.0
% of Total 38.5 61.5 100.0
χ² =6.21, (df = 2), p = .045

143
Age Type of 20-29 Over Total Results Customers yrs. 30-39 yrs.
Thai Service in the time promised
Less than expected Count 2 18 20
There was a significant
Expected Count 7.7 12.3 20.0 difference between service in the time
% within service in the time promised 10.0 90.0 100.0
promised and age of respondents among
% within What is your age? 1.9 10.7 7.3
Thai customers. The majority of
% of Total 0.7 6.6 7.3 the age group of Neutral Count 36 53 89 over 30-39 years Expected Count 34.2 54.8 89.0 (35.5%) thought that
% within service in the time promised 40.4 59.6 100.0
service in the time promised was
% within What is your age? 34.3 31.5 32.6
greater than expected than the
% of Total 13.2 19.4 32.6 age group of 20-29 years (24.5%).
Greater than expected Count 67 97 164
Expected Count 63.1 100.9 164.0
% within service in the time promised 40.9 59.1 100.0
% within What is your age? 63.8 57.7 60.1
% of Total 24.5 35.5 60.1 Total Count 105 168 273
Expected Count 105.0 168.0 273.0
% within service in the time promised 38.5 61.5 100.0
% within What is your age? 100.0 100.0 100.0
% of Total 38.5 61.5 100.0
χ² =7.39, (df = 2), p = .025

144
Age Type of 20-29 Over Total Results Customers yrs. 30-39 yrs.
Thai Employees provide quick service
Less than expected Count 4.0 24.0 28.0
There was a significant
Expected Count 10.8 17.2 28.0
difference between employees
% within employees provide quick service 14.29 85.71 100
provide quick service and
% within What is your age? 3.8 14.3 10.3
age of respondents among Thai
% of Total 1.5 8.8 10.3 customers. The majority of the
Neutral Count 43.0 56.0 99.0 age group of over 30-39 years
Expected Count 38.1 60.9 99.0 (32.2%) thought
% within employees provide quick service 43.43 56.57 100
that employees provide quick
% within What is your age? 41.0 33.3 36.3
service was greater than
% of Total 15.8 20.5 36.3 the age group of
Greater than expected Count 58.0 88.0 146.0
20-29 years (21.2%).
Expected Count 56.2 89.8 146.0
% within employees provide quick service 39.73 60.27 100
% within What is your age? 55.2 52.4 53.5
% of Total 21.2 32.2 53.5 Total Count 105.0 168.0 273.0
Expected Count 105.0 168.0 273.0
% within employees provide quick service 38.5 61.5 100.0
% within What is your age? 100.0 100.0 100.0
% of Total 38.5 61.5 100.0
χ² =8.05, (df = 2), p = .018

145
Age Type of 20-29 Over Total Results Customers yrs. 30-39 yrs.
Thai Employees answer questions accurately
Less than expected Count 1 15 16
There was a significant
Expected Count 6.2 9.8 16.0 difference between
% within employees answer questions accurately 6.3 93.8 100.0
employees answer questions accurately
% within What is your age? 1.0 8.9 5.9
and age of respondents
% of Total 0.4 5.5 5.9 among Thai Neutral Count 49 55 104 customers. The Expected Count 40.0 64.0 104.0 majority of the
% within employees answer questions accurately 47.1 52.9 100.0
age group of over 30-39 years (35.9%) thought
% within What is your age? 46.7 32.7 38.1
that employees answer questions
% of Total 17.9 20.1 38.1 accurately was greater than
Greater than expected Count 55 98 153
the age group of 20-29 years (20.1%).
Expected Count 58.8 94.2 153.0
% within employees answer questions accurately 35.9 64.1 100.0
% within What is your age? 52.4 58.3 56.0
% of Total 20.1 35.9 56.0 Total Count 105 168 273
Expected Count 105.0 168.0 273.0
% within employees answer questions accurately 38.5 61.5 100.0
% within What is your age? 100.0 100.0 100.0
% of Total 38.5 61.5 100.0
International Customers
From the value of the Chi-Square indicated that there were significant differences
between age and service quality attributes among international customers with the four
service quality attributes. These attributes were: (1) parking is adequate, (2) employees
are well dressed, (3) menu reflects image, and (4) employees respond promptly
(Table 52).

146
Table 52
Crosstabulation of International Customers between Service Quality Attributes and Age
Age Type of 20-29 Over Total Results Customers yrs. 30-39 yrs.
International Parking is adequate
Less than expected Count 11 40 51 There was a significant
Expected Count 16.0 35.0 51.0 difference between
% within parking is adequate 21.6 78.4 100.0
parking is adequate and age of respondents
% within What is your age? 15.5 25.6 22.5
among international customers. The
% of Total 4.8 17.6 22.5 majority of the age Neutral Count 10 37 47 group of over 30-39 Expected Count 14.7 32.3 47.0 years (34.8%) thought
% within parking is adequate 21.3 78.7 100.0
that parking is adequate was greater than
% within What is your age? 14.1 23.7 20.7
expected than the age group of 20-29 years (22.0%).
% of Total 4.4 16.3 20.7 Greater than expected Count 50 79 129
Expected Count 40.3 88.7 129.0
% within parking is adequate 38.8 61.2 100.0
% within What is your age? 70.4 50.6 56.8
% of Total 22.0 34.8 56.8 Total Count 71 156 227
Expected Count 71.0 156.0 227.0
% within parking is adequate 31.3 68.7 100.0
% within What is your age? 100.0 100.0 100.0
% of Total 31.3 68.7 100.0
χ² =7.78, (df = 2), p = .020

147
Age Type of 20-29 Over Total Results Customers yrs. 30-39 yrs.
International Employees are well dressed
Less than expected Count 3 23 26
There was a significant
Expected Count 8.1 17.9 26.0 difference between employees are well
% within employees are well dressed 11.5 88.5 100.0
dressed and age of respondents
% within What is your age? 4.2 14.7 11.5
among international customers. The majority of the age
% of Total 1.3 10.1 11.5 group of over 30-39 Neutral Count 9 32 41 years (44.5%) Expected Count 12.8 28.2 41.0 thought that
% within employees are well dressed 22.0 78.0 100.0
employees are well dressed was greater
% within What is your age? 12.7 20.5 18.1
than expected than the age group of
% of Total 4.0 14.1 18.1 20-29 years (26.0%).
Greater than expected Count 59 101 160
Expected Count 50.0 110.0 160.0
% within employees are well dressed 36.9 63.1 100.0
% within What is your age? 83.1 64.7 70.5
% of Total 26.0 44.5 70.5 Total Count 71 156 227
Expected Count 71.0 156.0 227.0
% within employees are well dressed 31.3 68.7 100.0
% within What is your age? 100.0 100.0 100.0
% of Total 31.3 68.7 100.0
χ² =8.70, (df = 2), p = .013

148
Age Type of 20-29 Over Total Results Customers yrs. 30-39 yrs.
International Menu reflects images
Less than expected Count 4 15 19
There was a significant
Expected Count 5.9 13.1 19.0 difference between
% within menu reflects images 21.1 78.9 100.0
menu reflects image and age of
% within What is your age? 5.6 9.6 8.4
respondents among International
% of Total 1.8 6.6 8.4 customers. The Neutral Count 8 41 49 majority of the age Expected Count 15.3 33.7 49.0 group of over 30-39
% within menu reflects images 16.3 83.7 100.0
years (44.1%) thought that menu reflects
% within What is your age? 11.3 26.3 21.6
image was greater than expected than
% of Total 3.5 18.1 21.6 the age group of 20-29 years (26.0%).
Greater than expected Count 59 100 159
Expected Count 49.7 109.3 159.0
% within menu reflects images 37.1 62.9 100.0
% within What is your age? 83.1 64.1 70.0
% of Total 26.0 44.1 70.0 Total Count 71 156 227
Expected Count 71.0 156.0 227.0
% within menu reflects images 31.3 68.7 100.0
% within What is your age? 100.0 100.0 100.0
% of Total 31.3 68.7 100.0
χ² =8.53, (df = 2), p = .014

149
Age Type of 20-29 Over Total Results Customers yrs. 30-39 yrs.
International Employees respond promptly
Less than expected Count 4 20 24
There was a significant
Expected Count 7.5 16.5 24.0 difference between employees
% within employees respond promptly 16.7 83.3 100.0
respond promptly and age of
% within What is your age? 5.6 12.8 10.6
respondents among International
% of Total 1.8 8.8 10.6 customers. Neutral Count 10 36 46 The majority of Expected Count 14.4 31.6 46.0 the age group of
% within employees respond promptly 21.7 78.3 100.0
over 30-39 years (44.1%) thought
% within What is your age? 14.1 23.1 20.3
that employees respond promptly
% of Total 4.4 15.9 20.3 was greater than
Greater than expected Count 57 100 157
expected than the age group of 20-29 years (25.1%).
Expected Count 49.1 107.9 157.0
% within employees respond promptly 36.3 63.7 100.0
% within What is your age? 80.3 64.1 69.2
% of Total 25.1 44.1 69.2 Total Count 71 156 227
Expected Count 71.0 156.0 227.0
% within employees respond promptly 31.3 68.7 100.0
% within What is your age? 100.0 100.0 100.0
% of Total 31.3 68.7 100.0
χ² =6.18, (df = 2), p = .046
Marital Status
Thai Customers
From the value of the Chi-Square indicated that there were significant differences
between marital status and service quality attributes among Thai customers with the two
service quality attributes. These attributes were: (1) parking is adequate and
(2) customers feel comfortable (Table 53).

150
Table 53
Crosstabulation of Thai Customers between Service Quality Attributes and Marital Status
Type of Marital Status Customers Single Married Total Results
Thai Parking is adequate
Less than expected Count 10 26 36
There was a significant
Expected Count 17.7 18.3 36.0 difference between parking is adequate
% within parking is adequate 27.8 72.2 100.0
and marital status of respondents among
% within What is your marital status? 7.9 19.7 13.9
Thai customers. The majority of
% of Total 3.9 10.0 13.9 single (25.5%) Neutral Count 51 46 97 thought that parking Expected Count 47.6 49.4 97.0 is adequate was
% within parking is adequate 52.6 47.4 100.0
greater than expected than married (23.2%).
% within What is your marital status? 40.2 34.8 37.5
% of Total 19.7 17.8 37.5 Greater than expected Count 66 60 126
Expected Count 61.8 64.2 126.0
% within parking is adequate 52.4 47.6 100.0
% within What is your marital status? 52.0 45.5 48.6
% of Total 25.5 23.2 48.6 Total Count 127 132 259
Expected Count 127.0 132.0 259.0
% within parking is adequate 49.0 51.0 100.0
% within What is your marital status? 100.0 100.0 100.0
% of Total 49.0 51.0 100.0
χ² =7.56, (df = 2), p = .023

151
Type of Marital Status Customers Single Married Total Results
Thai Customers Less than expected Count 0 7 7
There was a significant
feels Expected Count 3.43 3.57 7.00 difference between comfortable % within feel comfortable 0.00 100.00 100.00 customers feels
% within What is your marital status? 0.00 5.30 2.70
comfortable and marital status of
% of Total 0.00 2.70 2.70 respondents among Neutral Count 42 45 87 Thai customers. The Expected Count 42.7 44.3 87.0 majority of single % within feel comfortable 48.3 51.7 100.0 (32.8%) thought that
% within What is your marital status? 33.1 34.1 33.6
customers feels comfortable was
% of Total 16.2 17.4 33.6 greater than expected than married (30.9%).
Greater than expected Count 85 80 165
Expected Count 80.9 84.1 165.0 % within feel comfortable 51.5 48.5 100.0
% within What is your marital status? 66.9 60.6 63.7
% of Total 32.8 30.9 63.7 Total Count 127 132 259
Expected Count 127.0 132.0 259.0 % within feel comfortable 49.0 51.0 100.0
% within What is your marital status? 100.0 100.0 100.0
% of Total 49.0 51.0 100.0
χ² =7.16, (df = 2), p = .028
International Customers
From the value of the Chi-Square indicated that there were significant differences
between marital status and service quality attributes among international customers with
the two service quality attributes. These attributes were: (1) menu reflects image and
(2) employees give information (Table 54).

152
Table 54
Crosstabulation of International Customers between Service Quality Attributes and
Marital Status
Type of Marital Status Customers Single Married Total Results
International
Menu reflects images
Less than expected Count 14 5 19
There was a signifcant
Expected Count 9.2 9.8 19.0 difference between menu reflects image
% within menu reflects images 73.7 26.3 100.0
and marital status of respondents among
% within What is your marital status? 12.8 4.3 8.4
international customers. The
% of Total 6.2 2.2 8.4 majority of married Neutral Count 19 30 49 (36.0%) thought that Expected Count 23.7 25.3 49.0 menu reflects image
% within menu reflects images 38.8 61.2 100.0
was greater than expected than single (33.8%).
% within What is your marital status? 17.4 25.9 21.8
% of Total 8.4 13.3 21.8 Greater than expected Count 76 81 157
Expected Count 76.1 80.9 157.0
% within menu reflects images 48.4 51.6 100.0
% within What is your marital status? 69.7 69.8 69.8
% of Total 33.8 36.0 69.8 Total Count 109 116 225
Expected Count 109.0 116.0 225.0
% within menu reflects images 48.4 51.6 100.0
% within What is your marital status? 100.0 100.0 100.0
% of Total 48.4 51.6 100.0
χ² =6.68, (df = 2), p = .035

153
Type of Marital Status Customers Single Married Total Results
International Employees give information
Less than expected Count 9 1 10
There was a significant
Expected Count 4.8 5.2 10.0 difference
% within employees give information 90.0 10.0 100.0
between employees give information to
% within What is your marital status? 8.3 0.9 4.4
customers and marital status of
% of Total 4.0 0.4 4.4 respondents among Neutral Count 22 27 49 International Expected Count 23.7 25.3 49.0 customers. The
% within employees give information 44.9 55.1 100.0
majority of married (39.1%) thought
% within What is your marital status? 20.2 23.3 21.8
that greater than expected than single (34.7%).
% of Total 9.8 12.0 21.8 Greater than expected Count 78 88 166
Expected Count 80.4 85.6 166.0
% within employees give information 47.0 53.0 100.0
% within What is your marital status? 71.6 75.9 73.8
% of Total 34.7 39.1 73.8 Total Count 109 116 225
Expected Count 109.0 116.0 225.0
% within employees give information 48.4 51.6 100.0
% within What is your marital status? 100.0 100.0 100.0
% of Total 48.4 51.6 100.0
χ² =7.30, (df = 2), p = .026
Dining Frequency per Month
Thai Customers
From the value of the Chi-Square indicated that there were significant differences
between dining frequency per month and service quality attributes among Thai customers
with the three service quality attributes. These attributes were: (1) parking is adequate,
(2) menu reflects image, and (3) employees are polite (Table 55).

154
Table 55
Crosstabulation of Thai Customers between Service Quality Attributes and Dining
Frequency per Month
Dining Frequency Per Month
Type of 1 time Over Customers 2 times Total Results
Thai
Parking is adequate
Less than expected Count 18 21 39
There was a significant
Expected Count 20.0 19.0 39.0 difference between parking
% within parking is adequate 46.2 53.8 100.0 is adequate and
% within How many times do you dine in this restaurant in a month? 12.9 15.8 14.3
dining frequency per month
% of Total 6.6 7.7 14.3 of respondents Neutral Count 66 39 105 among Thai Expected Count 53.8 51.2 105.0 customers. The % within parking is adequate 62.9 37.1 100.0 majority of
% within How many times do you dine in this restaurant in a month? 47.1 29.3 38.5
customers' dining frequency over 2
% of Total 24.2 14.3 38.5 times per month
Greater than expected Count 56 73 129
(26.7%)thought that greater than expected than
Expected Count 66.2 62.8 129.0 customers' dining % within parking is adequate 43.4 56.6 100.0 frequency 1 time
% within How many times do you dine in this restaurant in a month? 40.0 54.9 47.3
per month (20.5%).
% of Total 20.5 26.7 47.3 Total Count 140 133 273
Expected Count 140.0 133.0 273.0 % within parking is adequate 51.3 48.7 100.0
% within How many times do you dine in this restaurant in a month? 100.0 100.0 100.0
% of Total 51.3 48.7 100.0
χ² =9.24, (df = 2), p = .010

155
Dining Frequency Per Month
Type of 1 time Over Customers 2 times Total Results
Thai
Menu reflects images
Less than expected Count 13 6 19
There was a significant
Expected Count 9.7 9.3 19.0 difference % within menu reflects images 68.4 31.6 100.0 between menu
% within How many times do you dine in this restaurant in a month? 9.3 4.5 7.0
reflects image and dining frequency per
% of Total 4.8 2.2 7.0 month of Neutral Count 28 44 72 respondents Expected Count 36.9 35.1 72.0 among Thai % within menu reflects images 38.9 61.1 100.0 customers. The
% within How many times do you dine in this restaurant in a month? 20.0 33.1 26.4
majority of customers' dining
% of Total 10.3 16.1 26.4 frequency 1
Greater than expected Count 99 83 182
time per month (36.3%)thought that greater than expected
Expected Count 93.3 88.7 182.0 than customers’ % within menu reflects images 54.4 45.6 100.0 dining
% within How many times do you dine in this restaurant in a month? 70.7 62.4 66.7
frequency over 2 times per month (30.4%).
% of Total 36.3 30.4 66.7 Total Count 140 133 273
Expected Count 140.0 133.0 273.0 % within menu reflects images 51.3 48.7 100.0
% within How many times do you dine in this restaurant in a month? 100.0 100.0 100.0
% of Total 51.3 48.7 100.0
χ² =7.37, (df = 2), p = .025

156
Dining Frequency Per Month
Type of 1 time Over Customers 2 times Total Results
Thai Employees are polite
Less than expected Count 10 1 11
There was a significant
Expected Count 5.6 5.4 11.0 difference % within employees are polite 90.9 9.1 100.0 between
% within How many times do you dine in this restaurant in a month? 7.1 0.8 4.0
employees are polite and dining
% of Total 3.7 0.4 4.0 frequency per Neutral Count 40 43 83 month of Expected Count 42.6 40.4 83.0 respondents % within employees are polite 48.2 51.8 100.0 among Thai
% within How many times do you dine in this restaurant in a month? 28.6 32.3 30.4
customers. The majority of customers'
% of Total 14.7 15.8 30.4 dining
Greater than expected Count 90 89 179
frequency 1 time per month (33.0%) thought
Expected Count 91.8 87.2 179.0 that greater % within employees are polite 50.3 49.7 100.0 than expected
% within How many times do you dine in this restaurant in a month? 64.3 66.9 65.6
than customers’ dining frequency over
% of Total 33.0 32.6 65.6 2 times per month (32.6%).
Total Count 140 133 273 Expected Count 140.0 133.0 273.0 % within employees are polite 51.3 48.7 100.0
% within How many times do you dine in this restaurant in a month? 100.0 100.0 100.0
% of Total 51.3 48.7 100.0
χ² =7.30, (df = 2), p = .026
International Customers
From the value of the Chi-Square indicated that there were significant differences
between dining frequency per month and service quality attributes among international
customers with the five service quality attributes. These attributes were: (1) dining is
clean, (2) décor with restaurant image, (3) menu reflects image, (4) accurate guest check,
and (5) customers feel comfortable (Table 56).

157
Table 56
Crosstabulation of International Customers between Service Quality Attributes and
Dining Frequency per Month
Dining Frequency Per Month
Type of 1 time Over Customers 2 times Total Results
International
Dining is clean
Less than expected Count 13 11 24
There was a significant
Expected Count 18.5 5.5 24.0 difference % within dining is clean 54.2 45.8 100.0 between dining
% within How many times do you dine in this restaurant in a month? 7.4 21.2 10.6
is clean and dining frequency
% of Total 5.7 4.8 10.6 per month of Neutral Count 34 12 46 respondents Expected Count 35.5 10.5 46.0 among % within dining is clean 73.9 26.1 100.0 International
% within How many times do you dine in this restaurant in a month? 19.4 23.1 20.3
customers. The majority of
% of Total 15.0 5.3 20.3 customers’
Greater than expected Count 128 29 157
dining frequency 1 time per month
Expected Count 121.0 36.0 157.0 (56.4%) % within dining is clean 81.5 18.5 100.0 thought that
% within How many times do you dine in this restaurant in a month? 73.1 55.8 69.2
greater than expected than
% of Total 56.4 12.8 69.2 customers' Total Count 175 52 227 dining Expected Count 175.0 52.0 227.0 frequency over
% within dining is clean 77.1 22.9 100.0 2 times per month (12.8%).
% within How many times do you dine in this restaurant in a month? 100.0 100.0 100.0
% of Total 77.1 22.9 100.0
χ² =9.16, (df = 2), p = .010

158
Dining Frequency Per Month
Type of 1 time Over Customers 2 times Total Results
International
Decor with restaurant image
Less than expected Count 14 11 25
There was a significant difference between
Expected Count 19.3 5.7 25.0 décor with restaurant
% within decor with restaurant image 56.0 44.0 100.0
image and dining frequency per month
% within How many times do you dine in this restaurant in a month? 8.0 21.2 11.0
of respondents among international customers.
% of Total 6.2 4.8 11.0 The majority of Neutral Count 26 7 33 customers' Expected Count 25.4 7.6 33.0 dining frequency 1
% within decor with restaurant image 78.8 21.2 100.0
time per month (59.5%) thought
% within How many times do you dine in this restaurant in a month? 14.9 13.5 14.5
that greater than expected than customers' dining
% of Total 11.5 3.1 14.5 frequency over 2
Greater than expected Count 135 34 169
times per month (15.0%).
Expected Count 130.3 38.7 169.0
% within decor with restaurant image 79.9 20.1 100.0
% within How many times do you dine in this restaurant in a month? 77.1 65.4 74.4
% of Total 59.5 15.0 74.4 Total Count 175 52 227
Expected Count 175.0 52.0 227.0
% within decor with restaurant image 77.1 22.9 100.0
% within How many times do you dine in this restaurant in a month? 100.0 100.0 100.0
% of Total 77.1 22.9 100.0
χ² =7.10, (df = 2), p = .029

159
Dining Frequency Per Month
Type of 1 time Over Customers 2 times Total Results
International Menu reflects images
Less than expected Count 9 10 19
There was a significant
Expected Count 14.6 4.4 19.0 difference between
% within menu reflects images 47.4 52.6 100.0
menu reflects image and dining frequency
% within How many times do you dine in this restaurant in a month? 5.1 19.2 8.4
per month of respondents among international customers. The
% of Total 4.0 4.4 8.4 majority of Neutral Count 39 10 49 customers’ dining Expected Count 37.8 11.2 49.0 frequency 1 time
% within menu reflects images 79.6 20.4 100.0
per month (55.9%) though that greater
% within How many times do you dine in this restaurant in a month? 22.3 19.2 21.6
than expected than customers’ dining frequency over 2 times per month
% of Total 17.2 4.4 21.6 (14.1%).
Greater than expected Count 127 32 159
Expected Count 122.6 36.4 159.0
% within menu reflects images 79.9 20.1 100.0
% within How many times do you dine in this restaurant in a month? 72.6 61.5 70.0
% of Total 55.9 14.1 70.0 Total Count 175 52 227
Expected Count 175.0 52.0 227.0
% within menu reflects images 77.1 22.9 100.0
% within How many times do you dine in this restaurant in a month? 100.0 100.0 100.0
% of Total 77.1 22.9 100.0
χ² =10.38, (df = 2), p = .006

160
Dining Frequency Per Month
Type of 1 time Over Customers 2 times Total Results
International
Accurate guest check
Less than expected Count 8 8 16
There was a significant difference
Expected Count 12.3 3.7 16.0 between % within accurate guest check 50.0 50.0 100.0 accurate
% within How many times do you dine in this restaurant in a month? 4.6 15.4 7.0
guest check and dining frequency
% of Total 3.5 3.5 7.0 per month of Neutral Count 34 17 51 respondents Expected Count 39.3 11.7 51.0 among % within accurate guest check 66.7 33.3 100.0 International
% within How many times do you dine in this restaurant in a month? 19.4 32.7 22.5
customers. The majority of customers’
% of Total 15.0 7.5 22.5 dining
Greater than expected Count 133 27 160
frequency 1 time per
Expected Count 123.3 36.7 160.0 month % within accurate guest check 83.1 16.9 100.0 (58.6%)
% within How many times do you dine in this restaurant in a month? 76.0 51.9 70.5
thought that greater than expected than
% of Total 58.6 11.9 70.5 customers’ Total Count 175 52 227 dining Expected Count 175.0 52.0 227.0 frequency % within accurate guest check 77.1 22.9 100.0 over 2 times
% within How many times do you dine in this restaurant in a month? 100.0 100.0 100.0
per month (11.9%).
% of Total 77.1 22.9 100.0
χ² =13.09 (df = 2), p = .001

161
Dining Frequency Per Month
Type of 1 time Over Customers 2 times Total Results
International Customers feel
Less than expected Count 10 11 21
There was a significant
comfortable Expected Count 16.2 4.8 21.0 difference % within feel comfortable 47.6 52.4 100.0 between
% within How many times do you dine in this restaurant in a month? 5.7 21.2 9.3
customers feel comfortable and dining
% of Total 4.4 4.8 9.3 frequency Neutral Count 36 16 52 per month of Expected Count 40.1 11.9 52.0 respondents % within feel comfortable 69.2 30.8 100.0 among
% within How many times do you dine in this restaurant in a month? 20.6 30.8 22.9
international customers. The majority
% of Total 15.9 7.0 22.9 of customers’
Greater than expected Count 129 25 154
dining frequency 1 time per
Expected Count 118.7 35.3 154.0 Month % within feel comfortable 83.8 16.2 100.0 (56.8%)
% within How many times do you dine in this restaurant in a month? 73.7 48.1 67.8
thought that greater than expected than
% of Total 56.8 11.0 67.8 customers’ Total Count 175 52 227 dining Expected Count 175.0 52.0 227.0 frequency % within feel comfortable 77.1 22.9 100.0 over 2 times
% within How many times do you dine in this restaurant in a month? 100.0 100.0 100.0
per month (11.0%).
% of Total 77.1 22.9 100.0
χ² =16.03 (df = 2), p = .000
Per Capital Expenditure for Each Meal (US $1 = 40 Baht)
Thai Customers
From the value of the Chi-Square indicated that there were significant differences
between per capital expenditures for each meal and service quality attributes among Thai
customers with the four service quality attributes. These attributes were: (1) parking is
adequate, (2) dining is clean, (3) food prices are charged same as in the menu,
(4) operation hours are convenience (Table 57).

162
Table 57
Crosstabulation of Thai Customers between Service Quality Attributes and Per Capita
Expenditures for Each Meal
Per Capita Expenditures for Each Meal
Under Over Type of 400 400-800 800 Customers Baht Baht Baht Total Results
Thai
Parking is adequate
Less than expected Count 10 20 9 39
There was a significant
Expected Count 5.9 19.4 13.7 39.0 difference
% within parking is adequate 25.6 51.3 23.1 100.0
between customers’
% within How much do you usually spend per dinner? 24.4 14.7 9.4 14.3
per capita expenditures for each
% of Total 3.7 7.3 3.3 14.3 and Neutral Count 21 51 33 105 parking is Expected Count 15.8 52.3 36.9 105.0 adequate of
% within parking is adequate 20.0 48.6 31.4 100.0
respondents among Thai
% within How much do you usually spend per dinner? 51.2 37.5 34.4 38.5
customers. The majority of
% of Total 7.7 18.7 12.1 38.5 customers’
Greater than expected Count 10 65 54 129
expenditures for each meal
Expected Count 19.4 64.3 45.4 129.0 400-800
% within parking is adequate 7.8 50.4 41.9 100.0
Baht (23.8%)
% within How much do you usually spend per dinner? 24.4 47.8 56.3 47.3
though that greater than expected
% of Total 3.7 23.8 19.8 47.3 than Total Count 41 136 96 273 customers’ Expected Count 41.0 136.0 96.0 273.0 per capita
% within parking is adequate 15.0 49.8 35.2 100.0
expenditures for each meal under
% within How much do you usually spend per dinner? 100.0 100.0 100.0 100.0
400 Baht (3.7%) and over 800
% of Total 15.0 49.8 35.2 100.0 Baht (19.8%). χ² =12.94 (df =4), p = .012

163
Per Capita Expenditures for Each Meal
Under Over Type of 400 400-800 800 Customers Baht Baht Baht Total Results
Thai
Dining is clean
Less than expected Count 3 11 5 19
There was a significant
Expected Count 2.9 9.5 6.7 19.0 difference between dining
% within dining is clean 15.8 57.9 26.3 100.0
is clean and customers' per
% within How much do you usually spend per dinner? 7.3 8.1 5.2 7.0
capita expenditures for
% of Total 1.1 4.0 1.8 7.0 each meal of respondents
Neutral Count 18 27 16 61 among Thai customers.
Expected Count 9.2 30.4 21.5 61.0 The majority of customers'
% within dining is clean 29.5 44.3 26.2 100.0
per capita expenditures
% within How much do you usually spend per dinner? 43.9 19.9 16.7 22.3
for each meal 400-800 Baht (35.9%)
% of Total 6.6 9.9 5.9 22.3 thought that
Greater than expected Count 20 98 75 193
greater than expected than customers'
Expected Count 29.0 96.1 67.9 193.0 per capita expenditures
% within dining is clean 10.4 50.8 38.9 100.0
for each meal under 400 Baht
% within How much do you usually spend per dinner? 48.8 72.1 78.1 70.7
(7.3%) and over 800 Baht (27.5%).
% of Total 7.3 35.9 27.5 70.7 Total Count 41 136 96 273
Expected Count 41.0 136.0 96.0 273.0
% within dining is clean 15.0 49.8 35.2 100.0
% within How much do you usually spend per dinner? 100.0 100.0 100.0 100.0
% of Total 15.0 49.8 35.2 100.0
χ² =14.54 (df = 4), p = .006

164
Per Capita Expenditures for Each Meal
Under Over Type of 400 400-800 800 Customers Baht Baht Baht Total Results
Thai Food prices
Less than expected Count 0 6 10 16
There was a significant difference
are charged Expected Count 2.4 8.0 5.6 16.0
between food prices are
same as in the menu
% within food prices are charged same as in the menu 0.0 37.5 62.5 100.0
charged same as in the menu and
% within How much do you usually spend per dinner? 0.0 4.4 10.4 5.9
customers' per capita expenditures
% of Total 0.0 2.2 3.7 5.9 for each meal Neutral Count 20 44 23 87 of respondents
Expected Count 13.1 43.3 30.6 87.0 among Thai customers.
% within food prices are charged same as in the menu 23.0 50.6 26.4 100.0
The majority of customers' per capita
% within How much do you usually spend per dinner? 48.8 32.4 24.0 31.9
expenditures for each meal 400-800 Baht
% of Total 7.3 16.1 8.4 31.9 (31.5%)
Greater than expected Count 21 86 63 170
thought that greater than expected than
Expected Count 25.5 84.7 59.8 170.0 customers'
% within food prices are charged same as in the menu 12.4 50.6 37.1 100.0
per capita expenditures for each meal
% within How much do you usually spend per dinner? 51.2 63.2 65.6 62.3
under 400 Baht(7.7%) and over
% of Total 7.7 31.5 23.1 62.3 800 Baht 3.1%).
Total Count 41 136 96 273 Expected Count 41.0 136.0 96.0 273.0
% within food prices are charged same as in the menu 15.0 49.8 35.2 100.0
% within How much do you usually spend per dinner? 100.0 100.0 100.0 100.0
% of Total 15.0 49.8 35.2 100.0
χ² =12.86 (df = 4), p = .012

165
Per Capita Expenditures for Each Meal
Under Over Type of 400 400-800 800 Customers Baht Baht Baht Total Results
Thai Operation hours
Less than expected Count 4 7 9 20
There was a significant
are convenient Expected Count 3.0 10.0 7.0 20.0
difference between
% within operation hours are convenient 20.0 35.0 45.0 100.0
operation hours are
% within How much do you usually spend per dinner? 9.8 5.1 9.4 7.3
convenient and customers'
% of Total 1.5 2.6 3.3 7.3 per capita expenditures
Neutral Count 20 47 24 91 for each meal of respondents
Expected Count 13.7 45.3 32.0 91.0 among Thai customers.
% within operation hours are convenient 22.0 51.6 26.4 100.0
The majority of customers'
% within How much do you usually spend per dinner? 48.8 34.6 25.0 33.3
per capita expenditures
% of Total 7.3 17.2 8.8 33.3 for each meal 400-800 Baht
Greater than expected Count 17 82 63 162
(30.0%) thought that greater
Expected Count 24.3 80.7 57.0 162.0
than expected than customers'
% within operation hours are convenient 10.5 50.6 38.9 100.0
per capita expenditures
% within How much do you usually spend per dinner? 41.5 60.3 65.6 59.3
for each meal under 400 Baht
% of Total 6.2 30.0 23.1 59.3 (6.2%) and over 800 Baht
Total Count 41 136 96 273 (23.1%). Expected Count 41.0 136.0 96.0 273.0
% within operation hours are convenient 15.0 49.8 35.2 100.0
% within How much do you usually spend per dinner? 100.0 100.0 100.0 100.0
% of Total 15.0 49.8 35.2 100.0
χ² =9.63 (df = 4), p = .047

166
International Customers
From the value of the Chi-Square indicated that there were significant differences
between per capital expenditures for each meal and service quality attributes among
international customers with the four service quality attributes. These attributes were: (1)
dining is clean, (2) décor with restaurant image, (3) menu reflects image, and (4)
operation hours are convenient (Table 58).
Table 58
Crosstabulation of International Customers between Service Quality Attributes and Per
Capita Expenditures for Each Meal
Per Capita Expenditures for Each Meal
Under Over Type of 400 400-800 800 Customers Baht Baht Baht Total Results
International Dining is clean
Less than expected Count 8 8 8 24
There was a significant difference
Expected Count 2.5 7.4 14.1 24.0 between dining is clean and
% within dining is clean 33.3 33.3 33.3 100.0
customers' per capita
% within How much do you usually spend per dinner? 33.3 11.4 6.0 10.6
expenditures for each meal of respondents
% of Total 3.5 3.5 3.5 10.6 among Neutral Count 6 23 17 46 International Expected Count 4.9 14.2 27.0 46.0 customers. The
% within dining is clean 13.0 50.0 37.0 100.0
majority of customers' per
% within How much do you usually spend per dinner? 25.0 32.9 12.8 20.3
capita expenditures for each meal over
% of Total 2.6 10.1 7.5 20.3 800 Baht (47.6%)

167
Per Capita Expenditures for Each Meal
Under Over Type of 400 400-800 800 Customers Baht Baht Baht Total Results
Greater than expected Count 10 39 108 157
thought that greater than expected than
Expected Count 16.6 48.4 92.0 157.0 customers' per % within dining is clean 6.4 24.8 68.8 100.0 capita
% within How much do you usually spend per dinner? 41.7 55.7 81.2 69.2
expenditures for each meal under 400 Baht
% of Total 4.4 17.2 47.6 69.2 (4.4%) and Total Count 24 70 133 227 400-800 Expected Count 24.0 70.0 133.0 227.0 Baht (17.2%). % within dining is clean 10.6 30.8 58.6 100.0
% within How much do you usually spend per dinner? 100.0 100.0 100.0 100.0
% of Total 10.6 30.8 58.6 100.0
χ² =31.08 (df = 4), p = .000

168
Per Capita Expenditures for Each Meal
Under Over Type of 400 400-800 800 Customers Baht Baht Baht Total Results
International Decor with
Less than expected Count 6 11 8 25
There was a significant difference
restaurant Expected Count 2.6 7.7 14.6 25.0 between
image
% within decor with restaurant image 24.0 44.0 32.0 100.0
décor with restaurant image and customers'
% within How much do you usually spend per dinner? 25.0 15.7 6.0 11.0
per capita expenditures for each meal of respondents
% of Total 2.6 4.8 3.5 11.0 among Neutral Count 8 11 14 33 International Expected Count 3.5 10.2 19.3 33.0 customers. The
% within decor with restaurant image 24.2 33.3 42.4 100.0
majority of customers' per capita
% within How much do you usually spend per dinner? 33.3 15.7 10.5 14.5
expenditures for each meal over 800 Baht (48.9%)
% of Total 3.5 4.8 6.2 14.5 thought that
Greater than expected Count 10 48 111 169
greater than expected than customers'
Expected Count 17.9 52.1 99.0 169.0 per capita
% within decor with restaurant image 5.9 28.4 65.7 100.0
expenditures for each meal under 400 Baht
% within How much do you usually spend per dinner? 41.7 68.6 83.5 74.4
(4.4%)and 400-800 Baht (21.1%).
% of Total 4.4 21.1 48.9 74.4 Total Count 24 70 133 227
Expected Count 24.0 70.0 133.0 227.0
% within decor with restaurant image 10.6 30.8 58.6 100.0
% within How much do you usually spend per dinner? 100.0 100.0 100.0 100.0
% of Total 10.6 30.8 58.6 100.0
χ² =21.96 (df = 4), p = .000

169
Per Capita Expenditures for Each Meal
Under Over Type of 400 400-800 800 Customers Baht Baht Baht Total Results
International
Menu reflects images
Less than expected Count 4 9 6 19
There was a significant difference
Expected Count 2.0 5.9 11.1 19.0 between
% within menu reflects images 21.1 47.4 31.6 100.0
menu reflects image
% within How much do you usually spend per dinner? 16.7 12.9 4.5 8.4
and customers' per capita expenditures
% of Total 1.8 4.0 2.6 8.4 for each meal of respondents
Neutral Count 10 18 21 49 among Expected Count 5.2 15.1 28.7 49.0 International
% within menu reflects images 20.4 36.7 42.9 100.0
customers. The majority of
% within How much do you usually spend per dinner? 41.7 25.7 15.8 21.6
customers’ per capita expenditures for
% of Total 4.4 7.9 9.3 21.6 each meal over
Greater than expected Count 10 43 106 159
800 Baht (46.7%) thought that greater than
Expected Count 16.8 49.0 93.2 159.0 expected than
% within menu reflects images 6.3 27.0 66.7 100.0
customers' per capita
% within How much do you usually spend per dinner? 41.7 61.4 79.7 70.0
expenditures for each meal under 400 Baht (4.4%)
% of Total 4.4 18.9 46.7 70.0 and 400-800 Total Count 24 70 133 227 Baht (18.9%). Expected Count 24.0 70.0 133.0 227.0
% within menu reflects images 10.6 30.8 58.6 100.0
% within How much do you usually spend per dinner? 100.0 100.0 100.0 100.0
% of Total 10.6 30.8 58.6 100.0
χ² =18.40 (df = 4), p = .001

170
Per Capita Expenditures for Each Meal
Under Over Type of 400 400-800 800 Customers Baht Baht Baht Total Results
International
Operation hours are convenient
Less than expected Count 4 6 9 19
There was a significant difference
Expected Count 2.0 5.9 11.1 19.0 between
% within operation hours are convenient 21.1 31.6 47.4 100.0
operation hours are convenient
% within How much do you usually spend per dinner? 16.7 8.6 6.8 8.4
and customers' per capita expenditures
% of Total 1.8 2.6 4.0 8.4 for each meal of respondents
Neutral Count 6 27 17 50
among international customers.
Expected Count 5.3 15.4 29.3 50.0 The majority of customers'
% within operation hours are convenient 12.0 54.0 34.0 100.0
per capita expenditures
% within How much do you usually spend per dinner? 25.0 38.6 12.8 22.0
for each meal over 800 Baht (47.1%) thought
% of Total 2.6 11.9 7.5 22.0 that greater
Greater than expected Count 14 37 107 158
than expected than customers' per capita
Expected Count 16.7 48.7 92.6 158.0 expenditures
% within operation hours are convenient 8.9 23.4 67.7 100.0
for each meal under 400 Baht
% within How much do you usually spend per dinner? 58.3 52.9 80.5 69.6
(6.2%) and 400-800 Baht (16.3%).
% of Total 6.2 16.3 47.1 69.6 Total Count 24 70 133 227
Expected Count 24.0 70.0 133.0 227.0
% within operation hours are convenient 10.6 30.8 58.6 100.0
% within How much do you usually spend per dinner? 100.0 100.0 100.0 100.0
% of Total 10.6 30.8 58.6 100.0
χ² =21.85 (df = 4), p = .000

171
Chapter Summary
The sample size was sufficient to measure all of the research hypotheses. The
reliability coefficients for each of the four factors of the service quality scale were as
follows: (1) Personnel and Customers’ Relationship (α = 0.93); (2) Environment Service
Provider (α = 0.93); (3) Service Providers’ Attitude and Competencies (α = 0.94); (4)
Service Providers’ Initiative in Guest’s Service (α = 0.89). The reliability coefficients
consisted of six-item scales measuring the customer loyalty had Cronbach’s alpha
coefficient of 0.89. Since all of Cronbach’s alpha coefficients for the scales were greater
than 0.60, the scales were deemed acceptable (Nunnally, 1967).
The following summaries the results of hypotheses testing were: Hypothesis 1:
There is a positive relationship between service quality factors and overall customer
satisfaction was accepted. Hypothesis 2: There is a positive relationship between overall
customer satisfaction and word-of-mouth endorsements was accepted. Hypothesis 3:
There is a positive relationship between overall customer satisfaction and repurchase
intention was accepted. Hypothesis 4: Service quality factors have a positive impact on
overall customer satisfaction was accepted. Hypothesis 5: Service quality factors have a
positive impact on word-of-mouth endorsements was accepted. Hypothesis 6: Service
quality factors have a positive impact on repurchase intention was accepted. Hypothesis
7: Overall customer satisfaction has a positive impact on word-of-mouth endorsement
was accepted. Hypothesis 8: Overall customer satisfaction has a positive impact on
repurchase intention was accepted. Hypothesis 9: There is a significant difference in
service quality factors based on customers’ demographic profile (gender, age, dining
frequency, and per capita expenditures for each meal) was accepted. Hypothesis 10:

172
There is a significant difference in overall service quality based on customers’
demographic profile (gender, age, dining frequency, and per capita expenditures for each
meal) was accepted. Hypothesis 11: There is a significant difference in overall service
quality between Thai and international customers was accepted. Hypothesis 12: There is
a significant difference in overall service quality with type of casual dining restaurants
was accepted. In comparing the perspective of service quality attributes and customers’
demographic profiles (gender, age, marital status, dining frequency, and per capita
expenditures for each meal) among Thai and international customers, there were
significant differences in service quality attributes among Thai and international
customers.
The following chapter will present discussion of findings, conclusions,
implications, recommendations, and limitations and future research.

173
CHAPTER V
CONCULSIONS
The purpose of this study was to determine which attributes of service quality
(SERVQUAL) influenced customer’s satisfaction of casual dining restaurants in Phuket.
The researcher examined the relationships between overall customer satisfaction and
customer loyalty (word-of-mouth endorsements and repurchase intention). The study
focused on Thai and international customers of casual dining restaurants in Phuket, and
considered the influence of demographics by focusing on gender, age, dining frequency,
and per capita expenditures for each meal. This chapter consists of five sections:
1) Discussion of Findings, 2) Conclusions, 3) Implications, 4) Recommendations, and
5) Limitations and Future Research.
Discussion of Findings
Pilot Study Results
A pilot study with 30 respondents was carried out to identify unanticipated
problems or issues. The pilot study provided valuable information about instrument
administration, scoring routine, and analysis technique. As the results of descriptive
statistics, gender distribution was 20 female (67%) and 10 male (33%). The majority of
respondents of age group were the age group of 20 to 29 years (40%) and the age group
of 30 to 39 years (40%). About 21 respondents (70%) were dining in Thai casual dining

174
restaurant before and nine respondents (30%) were the first time to dine in this restaurant.
Fifteen respondents (50%) indicated that they had dined in this restaurant once a month
and nine respondents (30%) had dined in twice a month. The 50 percent of respondents
spent capita expenditures of each meal were 801-1200 Baht ($20.01-$30).
The result of principal component analysis (factor analysis) with varimax rotation,
the 30 attributes service quality of casual dining restaurant was grouped into four factors.
The first factor was labeled as “Environment Service Provider,” contained items
representing four original dimensions – tangibles, reliability, responsiveness, and
empathy, with fifteen variables. The second factor was labeled as “Personnel and
Customers’ Relationship,” contained items representing three original dimensions –
reliability, assurance, and empathy, with six variables. The third factor was labeled as
“Service Providers’ Attitude and Competencies,” contained items representing three
original dimensions – responsiveness, assurance, and empathy, with six variables.
Finally, the fourth factor was labeled as “Service Providers’ Initiative in Guest’s
Service,” contained items representing empathy dimension, with three variables.
Correlation Analysis
To test hypothesis 1 through 3, a correlation analysis was performed to identify
the relationship among service quality factors, overall customer satisfaction, and
customer loyalty (word-of-mouth endorsements and repurchase intention). The results of
the correlation analysis indicated that hypothesis 1, there was a positive relationship
between service quality factors and overall customer satisfaction. The results of

175
hypothesis 2 and hypothesis 3 showed that there were positive relationship between
overall customer satisfaction and customer loyalty (word-of-mouth endorsements and
repurchase intention). Therefore, hypothesis 1, hypothesis 2, and hypothesis 3 were
supported.
Multiple Regression Analysis
To test hypothesis 4 through 8, a multiple regression analysis was performed to
identify the positive impact between service quality factors, overall service quality,
overall customer satisfaction, and customer loyalty (word-of-mouth endorsements and
repurchase intention). Additionally, a regression coefficient from multiple regression
analysis was used to identify the influential level that service quality factors had
measures of overall customer satisfaction and customer loyalty (word-of-mouth
endorsements and repurchase intention).
The result of hypothesis 4 indicated that service quality factors had a positive
impact on overall customer satisfaction. The coefficients indicated that factor 1 –
Environment Service Provider had the most positive impact on overall customer
satisfaction, followed by factor 3 – Service Providers’ Attitude and Competencies,
factor 2- Personnel and Customers’ Relationship, and factor 4 – Service Providers’
Initiative in Guest’s Service. Therefore, hypothesis 4 was supported.
The result of hypothesis 5 indicated that service quality factors had a positive
impact on word-of-mouth endorsements. The coefficient indicated that factor 2 –
Personnel and Customers’ Relationship had the most positive impact on word-of-mouth
endorsements, followed by factor 1 – Environment Service Provider, factor 4 – Service

176
Providers’ Initiative in Guest’s Service, and factor 3 – Service Providers’ Attitude and
Competencies. Therefore, hypothesis 5 was supported.
The result of hypothesis 6 indicated that service quality factors had a positive
impact on repurchase intention. The coefficient indicated that factor 1 – Environment
Service Provider had the most positive impact on repurchase intention, followed by factor
3 - Service Providers’ Attitude and Competencies, factor 2 - Personnel and Customers’
Relationship, and factor 4 - Service Providers’ Initiative in Guest’s Service. Therefore,
hypothesis 6 was supported.
The result of hypothesis 7 and hypothesis 8 indicated that overall customer
satisfaction had a positive impact on customer loyalty (word-of-mouth endorsements and
repurchase intention). Therefore, hypothesis 7 and hypothesis 8 were supported.
One-Way Analysis of Variance (ANOVA)
To test hypothesis 9 through 11, one-way analysis of variance (ANOVA) and post
hoc testing using Tukey’s HSD were used to examine the differences between the mean
scores of service quality factors and overall service quality based on demographic
variables (gender, age, dining frequency, per capita expenditures for each meal).
The result of hypothesis 9 indicated that there was a significant difference in
service quality factor 1 and factor 4 based on demographic variables. Service quality
factor 1 – Environment Service Providers was a significant difference based on dining
frequency and per capita expenditures for each meal. Service quality factor 4 – Service
Providers’ Initiative in Guest’ Service was a significant difference based on dining
frequency. Tukey’s HSD test was not performed for service quality factor 1 and factor 4

177
because one group had fewer than two cases. Therefore, hypothesis 9 was supported
relative to factor 1 - Environment Service Providers and factor 4 - Service Providers’
Initiative in Guest’ Service.
The result of hypothesis 10 indicated that there was a significant difference in
overall service quality based on demographic variables. The findings showed that
weighted tangibles were significant difference based on per capita expenditures for each
meal. Weighted responsiveness was a significant difference based on dining frequency.
Weighted empathy was a significant difference based on per capita expenditures for each
meal. Tukey’s HSD test was not performed for weighted tangibles and weighted
responsiveness because one group had fewer than two cases. Therefore, hypothesis 10
was supported relative to weighted tangibles, weighted responsiveness, and weighted
empathy.
The result of hypothecs 11 indicated that there was no significant difference in
overall service quality between Thai and international customers. Therefore, hypothesis
11 was not supported.
Full Model Study Results
A total of 537 questionnaires were distributed to customers dining in the four
casual dining restaurants: 1) Japanese, 2) Thai, 3) Italian, and 4) Mediterranean. The
questionnaires were distributed to every fifth Thai and every fifth international customer
for 125 customers per restaurant. Of the 537 questionnaires distributed, 37 (7%) were
returned incomplete and 500 (93%) were usable and included in the data analysis.

178
As the results of descriptive statistics, gender distribution was 279 female (44%)
and 221 male (56%). The majority of respondents of age group were the age group of 30
to 39 years with 177 respondents (35%) and age group of 20 to 29 years with 176
respondents (35%). About 315 respondents (63%) had dined in this restaurant once a
month, 108 respondents (22%) had dined in twice a month, 59 respondents (12%) had
dined in three times a month, 12 respondents (2%) had dined in four times a month, and 6
respondents (1%) had dined in over 5 times a month. The majority of respondents’ per
capita expenditures for each meal was 400 – 800 Baht ($10 - $20), 206 respondents
(41%), and followed by 801 – 1200 Baht ($20.01 - $30), 189 respondents (38%).
Respondents were also asked about people in their party when they were dining in
restaurant. The analysis indicated that 208 respondents (42%) had two people in party,
and followed by 118 respondents (24%) had three people in party.
The result of principal component analysis (factor analysis) with varimax rotation,
the 30 attributes service quality of casual dining restaurants was grouped into four
factors. The first factor was labeled as “Personnel and Customers’ Relationship,”
contained items representing two original dimensions – reliability and assurance, with
nine variables. The second factor was labeled as “Environment Service Provider,”
contained items representing two original dimensions – tangibles and responsiveness,
with eight variables. The third factor was labeled as “Service Providers’ Attitude and
Competencies,” contained items representing two original dimensions – assurance and
empathy, with nine variables. Finally, the fourth factor was labeled as “Service
Providers’ Initiative in Guest’s Service,” contained items representing responsiveness
dimension.

179
Correlation Analysis
To test hypothesis 1 through 3, a correlation analysis was performed to identify
the relationship among service quality factors, overall customer satisfaction, and
customer loyalty (word-of-mouth endorsements and repurchase intention). The results of
correlation indicated that hypothesis 1, there was a positive relationship between service
quality factors and overall customer satisfaction. The results of hypothesis 2 and
hypothesis 3 showed that there were a positive relationship between overall customer
satisfaction and customer loyalty (word-of-mouth endorsements and repurchase
intention). Therefore, hypotheses 1 through 3 were supported.
Multiple Regression Analysis
To test hypothesis 4 through 8, a linear multiple regression analysis was
performed to identify the positive impact among service quality factors, overall service
quality, overall customer satisfaction, and customer loyalty (word-of-mouth
endorsements and repurchase intention). Additionally, a regression coefficient from the
multiple regression analysis was used to identify the influential level that service quality
factors had on measures of overall customer satisfaction and customer loyalty (word-of-
mouth endorsements and repurchase intention).
The result of hypothesis 4 indicated that service quality factors had a positive
impact on overall customer satisfaction. The coefficients indicated that factor 2 –
Environment Service Provider had the most positive impact on overall customer
satisfaction, followed by factor 1 – Personnel and Customers’ Relationship, factor 3 –

180
Service Providers’ Attitude and Competencies, and factor 4 – Service Providers’
Initiative in Guest’s Service. Therefore, hypothesis 4 was supported.
The result of hypothesis 5 indicated that service quality factors had a positive
impact on word-of-mouth endorsements. The coefficient indicated that factor 2 –
Environment Service Provider had the most positive impact on word-of-mouth
endorsements, followed by factor 1 – Personnel and Customers’ Relationship, factor 4 –
Service Providers’ Initiative in Guest’s Service, and factor 3 – Service Providers’
Attitude and Competencies. Therefore, hypothesis 5 was supported.
The result of hypothesis 6 indicated that service quality factors had a positive
impact on repurchase intention. The coefficient indicated that factor 2 – Environment
Service Provider had the most positive impact on word-of-mouth endorsements, followed
by factor 1 – Personnel and Customers’ Relationship, factor 4 – Service Providers’
Initiative in Guest’s Service, and factor 3 – Service Providers’ Attitude and
Competencies. Therefore, hypothesis 6 was supported.
The result of hypothesis 7 and hypothesis 8 indicated that overall customer
satisfaction had a positive impact on customer loyalty (word-of-mouth endorsements and
repurchase intention). Therefore, hypothesis 7 and hypothesis 8 were supported.
One-Way Analysis of Variance (ANOVA)
To test hypothesis 9 through 12, one-way analysis of variance (ANOVA) and post
hoc testing using Tukey’s HSD were used to examine the differences in the mean scores
of service quality factors and overall service quality based on demographic variables
(gender, age, dining frequency, per capita expenditures for each meal).

181
The result of hypothesis 9 indicated that there was a significant difference in
service quality factors based on demographic variables. The findings showed that four
service quality factors were significant differences based on demographic variables.
Service quality factor 1 – Personnel and Customers’ Relationship and factor 2 –
Environment Service Provider were significant difference based on per capita
expenditures for each meal. Service quality factor 3 – Service Providers’ Attitude and
Competencies was a significant difference based on gender and per capita expenditures
for each meal. Service quality factor 4 – Service Providers’ Initiative in Guest’s Service
was a significant difference based on gender, age, and per capita expenditures for each
meal. Therefore, hypothesis 9 was supported.
The result of hypothesis 10 indicated that there was a significant difference in
overall service quality based on demographic variables. The findings showed that
weighted tangibles and weighted assurance were significant differences based on gender
and per capita expenditures for each meal. Weighted reliability, weighted
responsiveness, and weighted empathy were significant differences based on gender, age,
and per capita expenditures for each meal. Therefore, hypothesis 10 was supported.
The result of hypothesis 11 indicated that there was a significant difference in
overall service quality between the type of customers (Thai and International). The
findings showed that weighted reliability, weighted responsiveness, weighted assurance,
and weighted empathy were significant differences between Thai and international
customers. Therefore, hypothesis 11 was supported.

182
The result of hypothesis 12 indicated that there was a significant difference in
overall service quality with type of casual dining restaurants (Japanese, Thai, Italian, and
Mediterranean). The findings showed that weighted responsiveness, weighted assurance,
and weighted empathy were significant differences among Japanese, Thai, Italian, and
Mediterranean. Therefore, hypothesis 12 was supported.
Independent-Samples t Test
Service Quality Attributes
The independent-samples t test analysis indicated that international customers had
a higher means than that of Thai customers. There was twenty-four service quality
attributes were significant relative to Thai and international customers in casual dining
restaurants in Phuket. With regard to the twenty-four SERVQUAL attributes Thai and
international customers stated that “accurate guest check” was the most important
attribute, followed closely by employees are polite, considers your needs, and employees
quickly correct.
Overall Service Quality
The independent-samples t test analysis indicated that there were significant
difference between Thai and international customers in overall service quality with
regard to weighted reliability, weighted responsiveness, weighted assurance, and
weighted empathy. International customers had a higher means than Thai customers did
in overall service quality. The findings showed that 273 Thai customers had the most
perspective of overall service quality in weighted tangibles (0.20), followed by weighted

183
reliability (0.19), weighted empathy (0.18), weighted assurance (0.17), and weighted
responsiveness (0.15). The international customers had the most insight of the overall
service quality in weighted reliability (0.26), weighted empathy (0.25), weighted
assurance (0.24), and weighted responsiveness (0.23).
Chi-Square Tests of Independence
The value of Chi-Square indicated that there were significant differences between
service quality attributes and customers’ demographic profiles (gender, age, marital
status, dining frequency, and per capital expenditures for each meal) among Thai and
international customers. The review of the crosstabulation showed that the relationships
between service quality attributes and customers’ demographic profiles were not the
same when type of customers (Thai and International) had been taken into consideration.
Gender
The results of the Chi-Square indicated that there were significant differences
between gender and service quality attributes among Thai and international customers
with the three service quality attributes. Among Thai customers, these attributes were: (1)
menu reflects image, (2) customers feel comfortable, and (3) employees give information
to customers. Among international customers, these attributes were: (1) dining is clean,
(2) menu reflects image, and (3) restroom is clean.

184
Age
The results of the Chi-Square indicated that there were significant differences
between age and service quality attributes among Thai and international customers with
the four service quality attributes. Among Thai customers, these attributes were: (1)
parking is adequate, (2) service in the time promised, (3) employees provide quick
service, and (4) employees answer questions accurately. Among international customers,
these attributes were: (1) parking is adequate, (2) employees are well dressed, (3) menu
reflects image, and (4) employees respond promptly.
Marital Status
The results of the Chi-Square indicated that there were significant differences
between marital status and service quality attributes among Thai and international
customers with the two service quality attributes. Among Thai customers, these
attributes were: (1) parking is adequate and (2) customers feel comfortable. Among
international customers, these attributes were: (1) menu reflects image and (2) employees
give information.
Dining Frequency per Month
The results of the Chi-Square indicated that there were significant differences
between dining frequency per month and service quality attributes among Thai and
international customers. There were three attributes: (1) parking is adequate, (2) menu
reflects image, and (3) employees are polite among Thai customers. There were five
attributes: (1) dining is clean, (2) décor with restaurant image, (3) menu reflects image,

185
(4) accurate guest check, and (5) customers feel comfortable among international
customers.
Per Capital Expenditure for Each Meal (US $1 = 40 Baht)
The results of the Chi-Square indicated that there were significant differences
between per capital expenditures for each meal and service quality attributes among Thai
customers with the four service quality attributes. Among Thai customers, these
attributes were: (1) parking is adequate, (2) dining is clean, (3) food prices are charged
same as in the menu, (4) operation hours are convenience. Among international
customers, these attributes were: (1) dining is clean, (2) décor with restaurant image, (3)
menu reflects image, and (4) operation hours are convenient.

186
Conclusions
In this study, the five dimensions (tangibles, reliability, responsiveness, assurance,
and empathy) of service quality developed by Parasuraman, Zeithaml, and Berry (1988)
and adapted for use in this study were great significance in measuring service quality in
casual dining restaurants. By administering the modified SERVQUAL questionnaire to
customers, a restaurant operator can receive the respondents’ opinion of how they view
the restaurant’s quality, identify where problems are, and get the point to resolve them. If
restaurateurs, owners, and staff are educated relative to the dimensions, which make up
service quality, they may be able to have a better focus when identifying their individual
shortcomings and improve service in their restaurants.
The results of this research indicated that service quality factors scales and
customer loyalty scales measures were reliable Cronbach’s alpha ≥ 0.60 had a high
reliability. As a result of principal component analysis (factor analysis) using the
varimax rotation identified four underlying service quality dimensions in casual dining
restaurants. These four service quality factors were 1) Personnel and Customers’
Relationship, 2) Environment Service Provider, 3) Service Providers’ Attitude and
Competencies, and 4) Service Providers’ Initiative in Guest’s Service.
The findings of this study indicated that the service quality factors had a positive
impact on overall customer satisfaction. In turn, customer satisfaction is likely to
increase customer loyalty (word-of-mouth endorsements and repurchase intention) in
casual dining restaurants environment. These findings are in agreement with previous
findings that customer satisfaction is influential in predicting repeat purchase behavior
(Anderson and Sullivan, 1993; Gronholdt et. al., 2000; Jones and Sasser, 1995; Pritchard

187
and Howard, 1997). Oliver, Rust, and Varki (1997) found that positive emotion led to
higher levels of customer satisfaction and increased repurchase intention (behavioral
loyalty). On the other hand, Andreasen (1999) found that initial negative emotion caused
by a service failure results in customer exit behavior. The results also showed that Thai
casual dining restaurant had a higher significance difference than Japanese and Italian
casual dining restaurants in overall service quality.
The effects of service quality on customer loyalty indicate that casual dining
restaurants should measure customer’s behavioral intentions to gain valuable insight on
why and how to invest in service quality improvement, for example, training of service
providers to provide optimal service to these Thai and international customers.
Behavioral intentions can be viewed as both positive and negative consequences of
service quality such as saying positive things about the restaurant, recommending the
restaurant to others, remaining loyal, and spending more in services
In comparing the perspective of service quality attributes and customers’
demographic profiles (gender, age, marital status, dining frequency, and per capita
expenditures for each meal) among Thai and international customers, there were
significant differences in service quality attributes among Thai and international
customers. These findings are in agreement with previous findings that
there were statistically significant differences in expectation and perception of service
quality of the fast food industry between Thai and American customers due to age,
education, and income (Chaipoopirutana, 1998). Gagliano and Hatcote (1994) found
that the different among demographic characteristics of retail apparel specialty stores
were found significant differences due to race, marital status, and income.

188
Implications
This study provides empirical evidence that there is a strong relationship exist
between service quality factors, overall customer satisfaction, and customer loyalty
(word-of-mouth endorsements and repurchase intention). The findings of this study have
a significant relevance and great importance to both academicians and practitioners.
Academically, this study has provided evidence of the service quality factors that
positively influence customer satisfaction. These factors are used to predict the
likelihood of predicting word-of-mouth endorsements (attitudinal loyalty) and repurchase
intentions (behavioral loyalty). Practically, this study has provided recommendations to
implement that may improve service quality, customer satisfaction, and customer loyalty
for each type of casual dining business.
Managerial Implications
These results have several managerial implications. First, they support the
findings of previous research, which indicates that perception of service quality affects
customer satisfaction (Lee et. al., 2000; Lewis and Klein, 1988; Spreng and MacKoy,
1996; Stevens et. al, 1995). Second, some other researchers supported that perceived
service quality is an antecedent of customer satisfaction.
This study provides operational information to managers in Phuket and offers
insight concerning the perception of service quality between Thai and international
customers. It identifies the dimensions of service quality and the difference in reaction to
them. Results showed that the top five attributes of service quality were: 1) accurate
guest check, 2) customer feel comfortable, 3) restaurants support their employees, 4)

189
served food exactly as you ordered, and 5) service is consistent. And the least important
attributes of service quality was parking is adequate. Therefore, managers should
emphasize the tangibles dimension of service quality, in order to improve customers’
perceptions of the level of service quality, for example, public transportation, adequate
parking, and clean dining area.
Understanding demographic variables may help casual dining restaurants
managers in Phuket better understand the perceptions of the attributes of service quality.
Specifically, perceptions of service quality between Thai and international customers
seem to be an influencing factor when considering to the respondent’s gender, age, and
per capita expenditures for each meal. The findings suggested that these demographic
variables had significant influence in service quality attributes.
In a highly competitive restaurant industry, it has become increasingly important
to understand the customer’s wants and needs in order to provide the customer with the
best possible product and experience. The results indicated that the Thai casual dining
restaurant had a higher significance difference than Japanese, Italian, and Mediterranean
casual dining restaurants with regard to responsiveness, assurance, and empathy
dimensions of service quality. Therefore, the restaurateurs or managers of these three
casual dining restaurants should improve their attributes of service quality, in order to
maintain optimal customer satisfaction.
Understanding the service quality process is critical to a manager’s business
success and this study has made a valuable contribution to service quality literature. As
demonstrated in previous research, service quality influenced customer satisfaction and
customer loyalty (word-of-mouth endorsements and repurchase intention) (Alexandris et

190
al., 2002; Athanassopoulos et al., 2001; Baker & Crompton, 2000; Bloemer et al., 1999;
Shaw-Ching Liu et al., 2001; Zeithalm et al., 1996). This study showed that service
quality factors had a positive impact on customer satisfaction. There was a significantly
positive relationship between service quality factors and customer loyalty (word-of-
mouth endorsements and repurchase intention). The findings also showed that customer
satisfaction had a positive impact on customer loyalty. The previous studies agreed that
slight increase in customer satisfaction would highly improve customer loyalty (Bowen
and Chen, 2001; Gronholdt et. al., 2000).
Marketing researchers have proposed that the benefits of increased customer
satisfaction are: 1) the improved ability of the firm to attract new customers, and 2) the
ability of the firm to maintain repeat customers (Rust, Zahorik, and Keiningham, 1995).
The benefits of this study will help the casual dining restaurants managers in Phuket as
follows:
1. Lower costs of attracting new customers: Satisfied customers are more likely to
engage in positive word-of-mouth.
2. Increased loyalty of current customers: Satisfied customers are more likely to repeat
purchase.
3. Enhanced reputation for the casual dining restaurants businesses: This can aid in
introducing new products by providing instant awareness to customers.
4. Reduced failure service from competitive efforts.
5. Lower costs of future transactions to acquire new customers each period.

191
From a managerial standpoint, if resources are limited, a service based firm can
positively influence the overall service quality by enhancing its overall service
performance. This can be achieved through training managers in both technical and
interpersonal aspects including feedback on performance, defining roles, generating
standards, applicable recruitment, and remuneration policies (Bolten & McManus, 1999).
In this study, to increase the overall service quality that influence customer
satisfaction and customer loyalty, the most influential factors is reliability dimension, and
the attributes such as “accurate guest check”, “service is consistent”, “and “serve food
exactly as customer order”. Moreover, the dimensions of responsiveness, assurance, and
empathy were significantly correlated with the overall service quality. The dimension of
responsiveness refers to willingness to help customers and provide prompt service, and
the attributes such as “employees respond to customer request promptly” and “employees
provide quick service”. The dimension of assurance refers to the knowledge and courtesy
of employees and their ability to inspire trust and confidence in the delivery of service,
and the attributes such as “employees had well trained” and “employees are polite”. To
achieve higher levels of assurance, the managers of casual dining restaurants should
motivate all service providers such as cashiers, servers, and staff members with
establishing a pleasant work environment and increasing reward system. The dimension
of empathy refers to caring, individualized attention the firm provides its customers, and
the attributes such “operating hours are convenient to customer” and “the restaurant
considers customer needs”. To achieve this, the managers should constantly monitor the
service environment to make continual improvements in the aptitudes and attitudes of
their staff members. In addition, the managers of casual dining restaurants should

192
attempt to enhance to the tangibles dimension of service quality, which involves “dining
area is clean” and “the menu reflects the restaurant’s image”.
Recommendations
These findings suggest some important implications for casual dining managers.
The casual dining managers should recognize the customer’s characteristics such as
gender, age, and per capita expenditures for each meal that have an impact on casual
dining restaurants. The casual dining managers should pay more attention to the age
group of 20 to 29 years and age group of 30 to 39 years. The managers should also pay
more attention to customers who spend capita expenditures for each meal at 400-800
Baht ($10 - $20). The findings showed that these demographic groups have a positive
impact on customer satisfaction and customer loyalty. Therefore, the casual dining
managers should seek to improve service quality by developing a comprehensive
employee-training program in order to maintain high customer satisfaction.
There are many foreign companies in Thailand in foodservice industries;
however, for various reasons, little research has been done on service quality in Thailand.
Specifically, no studies have been done on perspective of service quality in casual dining
businesses. One reason for this lack of research in Thailand might be that most research
conducted in this area has focused on manufacturing firms (Agarwal and Sridhar, 1992).
A second reason is that published studies of service firms have not directly address the
service quality issue in countries outside the U.S.A. (Bower, 1986; Gaedeke, 1973).
Therefore, both domestic companies and foreign companies are planning to do business

193
in Thailand; they should understand what the customers want and need in service quality
and learn more about the expectation and perception of service quality of the Thai people.
In the Thai culture, word-of-mouth communication, family, and recommendations
of well-known people are very important. Thai people like to talk and there is a transfer
of information about the quality of firms from one customer to another customer about
his or her experiences and feelings. Thai customers receive much information from other
customers and make their evaluation based in a large part on the experiences of others.
As results of this study, service quality factors had positive impact on word-of-mouth
endorsements and repurchase intention. In accomplishing, service firms must understand
that front-line employees are ultimately the key to successful provision of service. Their
attention to service quality will result in a higher level of perceived service quality. This
will create loyal customers who will use the firm repeatedly.
Limitations and Future Research
The present study has some limitations, and the recognition of these should help
refine future research efforts. First, the study is limited in one location studied and is not
representative of all casual dining restaurants in Thailand. Second, the researcher did not
examine the service quality of fast food restaurants and fine dining restaurants. Third, the
survey questionnaires were distributed to respondents during the summer time. Fourth,
the population statistics of Phuket statistics were not available at the time of colleting
data. For future research, more related attributes can be added to the SERVQUAL
dimensions to make the questionnaire more precise and more applicable to the casual
dining restaurants. Future research may examine service quality in differences type of

194
restaurants such as fast food restaurants and fine dining restaurants in Thailand.
Improved service may enable restaurants to attract new customers to the casual dining
businesses as well as to retain its current customers. Future studies should consider using
more DINESERV or service recovery attributes to measure customer satisfaction and
customer loyalty.

195
REFERENCES
Agarwal, S., & Sridhar, R. (1992). Choice of Foreign Market Entry Mode: Impact of Ownership, Location and Internalization Factors. Journal of International Business Studies, 23(1), 1-27.
Aigbedo, H., & Prameswaran, R. (2004). Importance-Performance Analysis for
Improving Quality of Campus Food Service. The International Journal of Quality & Reliability Management, 21(8), 876-896.
Alexandris, K., Dimitriadis, N., & Markata, D. (2002). Can Perception of Service Quality
Predict Behavioral Intentions? Managing Service Quality, Bedford, 12(4), 224.
Anderson, E. W., & Sullivan, M. W. (1993). The Antecedents and Consequences of Customer Satisfaction for Firms. Marketing Science, 12(2), 125-143.
Annonymous. (2006, March - April). Where to Eat in Phuket.
Annonymous. (2006, February - March ). Restaurant in Phuket. Restaurant Preview, 5.
Athanassopoulos, A., Gounaris, S., & Stathakopoulos, V. (2001). Behavioral Responses to Customer Satisfaction: An Empirical Study. European Journal of Marketing, 35(5/6), 687-707.
Augustyn, M., & Ho, S. (1998). Service Quality and Tourism. Journal of Travel
Research, 37(1), 71-75. Baker, D., & Crompton, J. (2000). Quality, Satisfaction, and Behavioral Intentions.
Annual of Tourism Research, 27, 785-804. Bitppipe Dictionary. (2006). Retrieved February 16, 2006, from
http://www.bitpipe.com/tlist/Customer-Loyalty.html Bitner, M. J. (1990). Evaluating Service Encounters: the Effects of Physical Surroundings
and Employee Responses. Journal of Marketing, 54(2), 69-82.

196
Blanchard, R. F., & Galloway, R. L. (1994). Quality in Retail Banking. International of Service Industry Management, 5(4), 5-23.
Blomer, J., Deruyter, K., & Wetzels, M. (1999). Linking Perceived Service Quality and
Service Loyalty: A Multi-Dimensional Perspective. Journal of Marketing, 33,1082-1106.
Bojanic, D. C., & Rosen, L. D. (1994). Measuring Service Quality in Restaurants: An
Application of the SERVQUAL Instrument. Hospitality Research Journal, 18(1), 3-14.
Bolton, R. N., & Drew, J. H. (1991b). A Multistage Model of Customers' Assessments of
Service Quality and Value. Journal of Consumer Research, 17, 375-384. Bowen, J. T., & Chen, S. L. (2001). The Relationship Between Customer Loyalty and
Customer satisfaction. International Journal of Contembporary Hospitality Management, 13(4/5), 213-217.
Bower, M. (1968). Personal Service Firms Venture Abroad. Columbia Journal of World
Business, 3, 49-58. Brown, S., & Wartz, T. (1989). A Gap Analysis of Professional Service Quality. Journal
of Marketing, 53, 92-98. Chaipoopirutana, S. (1998). A Comparative Study of Service Quality in the Fast Food
Industry: U.S.A. versus Thailand. Unpublished doctoral dissertation, Nova Southeastern University.
Chang, K. (1998). A Systems View of Quality on Fitness Services: Development of a
Model and Scales. Unpublished Doctoral Dissertation, Ohio State University, Columbus, OH.
Choi, J. P. (2001). The Influence of Service Quality on Customer Satisfaction and
Repurchase Intentions at Fitness Club in South Korea. Unpublished Doctoral Dissertation, University of New Mexcio, Albuquerque, NM.
Cochran, W. G. (1963). Sampling Techniques (2 ed.). New York: John Wiley and Sons
Inc. Cronin, J. J., & Taylor, S. A. (1992). Measuring Service Quality: A Reexamination and
Extentsion Journal of Marketing, 56, 55-68. Cunningham, R. M. (1961). Customer loyalty to Store and Brand. Harvard Business
Review, 39(6), 127-137.

197
Fick, G. R., & Ritchie, J. R. B. (1991). Measuring Service Quality in The Travel and Tourism Industry. Journal of Travel Research, Fall(2-9).
Fornell, C. (1992). A National Customer Satisfaction Barometer: The Swedish
Experience. Journal of Marketing, 56(1), 6-21. Fournier, S., & Yao, J. L. (1997). Reviving Brand Loyalty: A Conceptualization Within
The Framework of Consumer-Brand Relationships. International Journal of Research in Marketing, 14(5), 451-472.
Gaedeke, R. M., (1973). Selected U.S. Multinational Service Firms in Perspective.
Journal of International Business Studies, 4, 61-67. Garvin, D. A. (1983). Quality On The Line. Harvard Business Review, 61, 65-73. Gagliano, K. B., & Hathcote, J. (1994). Customer Expectations and Perceptions of
Service Quality in Retail Apparel Specialty Stores. Journal of Services Marketing. 8(1), 60-69.
Gronholdt, L., Martensen, A., & Kristensen, K. (2000). The Relationship Between Customer Satisfaction and Loyalty: Cross-Industry Differences. Total Quality Management, 11, 509-514.
Gronroos, C. (1982). A Service Quality Model and Its Marketing Implication. European
Journal of Marketing, 18, 35-42. Gronroos, C. (1983). Strategic Management and Marketing in the Service Sector.
Marketing Science Institue.
Gronroos, C. (1984). A Service Quality Model and Its Marketing Implications. European Journal of Marketing, 12(8), 588-600.
Hair, J. F., Anderson, R. E., Tatham, R. L., & Black, W. C. (1998). Multivariate Data
Analysis (5 ed.). Upper Saddle River, NJ: Prentice Hall. Hermon, P., & Niteck, D. A. (2001). Service Quality: A Concept Not Fully Explored.
Library Trends, 49(4), 687-708. Hermon, P., & Niteck, D. A. (2001). Service Quality: A Concept Not Fully Explored.
Library Trends, 49(4), 687-708. Heung, V. C., Wong, M. Y., & Qu, H. (2000). Airport-Restaurant Service Quality in
Hong Kong. Cornell Hotel and Restaurant Administration Quarterly, 41(3), 86-96.

198
Heung, V. C., Wong, M. Y., & Qu, H. (2000). Airport-Restaurant Service Quality in Hong Kong. Cornell Hotel and Restaurant Administration Quarterly, 41(3), 86-96.
Hjorth, A. (1984). The Concept of Quality and The Efficiency of Markets for Consumer
Products. Journal of Consumer Research, 11, 708-718. Hospitality Net. (2001). Bangkok and Phuket Market Overview. Retrieved March 20,
2006, from C:\Documents and Settings\Owner\Desktop\Hospitality Net - Industry News - Bankok And Phuket Market Overview.htm
Israel, G. D. (1992). Sampling the Evidence of Extension Program Impact. Program Evaluation and Organizational Development, IFAS, University of Florida.
PEOD-5. October. Jacoby, J., & Kyner, D. B. (1973). Brand Loyalty VS Repeat Purchasing Behavior.
Journal of Marketing Research, 10(2), 1-9. Johns, N. (1992). Quality Management in the Hospitality Industry: Part 1. Definition and
Specification. Service Industries Journal, 16(3), 321. Johnson, C., & Mathews, B. P. (1997). The Influence of Experience on Service
Expectation. International Journal of Service Industry, 8(4), 290. Jones, T. O., & Sasser, W. E. (1995). Why Satisfied Customers Defect? Harvard
Business Review, 73(6), 88-99. Kaholkar, P. A., Shepherd, D. C., & Thorpe, D. I. (2000). A Comprehensive Framework
for Service Quality: An Investigation of Critical Conceptual and Measurement Issues through a Longitudinal Study. Journal of Retailing, 76(2), 139-173.
Karatepe, O. M., & Avci, T. (2002). Measuring Service Quality in the Hotel Industry:
Evidences from Northern Cyprus. An International Journal of Tourism and Hospitality Research, 13, 19-32.
Keppel, G., & Wickens, T. D. (1997). Design and Analysis (4 ed.). Upper Saddle River,
NJ: Prentice Hall. Kim, H. D. (2005). The Relationships Between Service quality, Customer Satisfaction,
and Repurchase Intention in Korean Private Golf Courses. Dissertation Abstracts International, (UMI No. 3177086).
Knutson, B., Stevens, P., & Patton, M. (1995). DINSERV: Measuring Service Quality in
Quick Service, Casual/heme, and Fine Dining Restaurants. Journal Hospitality & Leisure Marketing, 3(2), 35-45.

199
Landrum, H., & Prybutok, V. R. (2004). A Service Quality and Success Model for The Information Service Industry. European Journal of Operational Research, 156,628-642.
LaTour, S. A., & Peat, N. C. (1979). Conceptual and Methodlogical Issues in Consumer Satisfaction Research. Advances in Consumer Research, 432-437.
Lau, P. M., Akbar, A. K., & Fie, D. Y. G. (2005). Service Quality:Study of The Luxury
Hotel in Malaysia. Journal of American Academy of Business, 7(2), 46-55. Lee, G. G., & Lin, H. F. (2005). Customer Perceptions of E-Service Quality in Online
Shopping. International Journal of Retail & Distribution Management, 33(2/3), 161-176.
Lee, H., Lee, Y., & Yoo, D. (2000). The Determinants of Perceived Service Quality and
Its Relationship with Satisfaction. Journal of Services Marketing, 14(3), 217-231. Lee, Y. L., & Hing, N. (1995). Measuring Quality in Restaurant Operations: An
Application of the SERVQUAL Instrument. International Journal of Hospitality Management, 14(3/4), 293-310.
Lewis, R. C., & Booms, B. H. (Eds.). (1983). The Marketing Aspects of Service Quality.
Chicago: American Marketing. Lewis, R. C., & Klein, D. M. (Eds.). (1988). The Measurements of Gaps in Service
Quality. Illinois: American Marketing Association. Liljander, V., & Stradvik, T. (1993). Estimating Zones of Tolerance in Perceived Service
Quality and Perceived Service Value. International Journal of Service Industry Management, 4(2), 6-28.
Lovelock, C. H. (1991). Service Marketing (2 ed.). Englewood Cliffs: Prentice-Hall. Mersha, T., & Adlakha, V. (1992). Attributes of Service Quality: The Consumers'
Perspective. International Journal of Service Industry Management, 3(3), 34-45. Mittal, B., & Lassar, W. M. (1998). Why Do Customers Swith? The Dynamics of
Satisfaction Versus Loyalty. Journal of Services Marketing, 12(3), 177. Ng, Y. N. (2005). A Study of Customer Satisfaction, Return Intention, and Word-of-
Mouth Endorsement in University Dining. Unpublished doctoral dissertation, Oklahoma State University, Oklahoma.
Nunnally, J. C. (1967). Psychometric Theory. New York: McGraw-Hill. Nunnally, J. C., & Bernstein, I. (1994). Psychometric Theory (3 ed.). New York:
McGraw-Hill.

200
Oliver, R. L. (1981). Measurement and Evaluation of Satisfaction Process in Retail Setting. Journal of Retailing, 57(3), 25-48.
Oliver, R. L. (Ed.). (1993). A Conceptual Model of Service Quality and Service
Satisfaction: Compatible Goals, Different Concepts (Vol. 2). Greewich: JAI Press.
Oliver, R. L. (1996). Satisfaction: A Behavioral Perspective on The Consumer. New
York: McGraw-Hill. Oliver, R. L. (1999). When Consumer Loyalty? Journal of Marketing, 63, 33-44. Parasuram, A., Zeithaml, V. A., & Berry, L. L. (1988). SERVQUAL: Multiple-Item
Scale for Measuring Consumer Perceptions of Service Quality. Journal of Retailing, 64(1), 12-40.
Parasuraman, A., Zeithaml, V. A., & Berry, L. L. (1985). A Conceptual Model of Service
Quality and Its Implication for Future Research. Journal of Marketing, 49(3), 25-46.
Parasuraman, A., Zeithaml, V. A., & Berry, L. L. (1985). A conceptual model of service
quality and its implications for future research. Journal of Marketing, 49(4), 41-50.
Parasuraman, A., Zeithaml, V. A., & Berry, L. L. (1985). Problems and Strategies in
Service Marketing. Journal of Marketing, 49(3), 25-46. Parasuraman, A., Zeithaml, V. A., & Berry, L. L. (1986). SERVQUAL: A Multiple-Item
Scale for Measuring Customer Perceptions of Service Quality (Working Paper No. 86-108): Marketing Science Institue.
Parasuraman, A., Zeithaml, V. A., & Berry, L. L. (1988). SERVAUAL: A Multiple-Item
Scale for Measuring Consumer Perceptions of Service Quality. Journal of Retailing, 67(4), 421-450.
Parasuraman, A., Zeithaml, V. A., & Berry, L. L. (1993). More on Improving Service
Quality. Journal of Retailing, 69(1), 140-147. Parasuraman, A., Zeithaml, V. A., & Berry, L. L. (1994). Moving Forward in Service
Quality Research: Measuring Different Customer Expectation Levels, Comparing Alternative Scales, and Examinaing the Performance Behavioral Intentions Link (Working Paper No. 94-114): Marketing Science Institue.
Phuket Dining Guide. (2006). Retrieved February 10, 2006, from
http://www.phuket.com/dining/index.htm

201
Phuket Tourism Statistics (2005). Retrieved February 16, 2006, from http://www.phukettourism.org/contact_us/statistic.htm
Reynolds, K. E., & Beatty, S. E. (1999). Customer Benefits and Company Consequences
of Customer-Salesperson Relationships in Retailing. Journal of Retailing, 75(1), 11-32.
Rust, T., Zahorik, A. J., & Keiningham, T. L. (1995). Return on Qualty (ROQ): Making
Service Quality Financialy Accountable. Journal of Marketing, 59(2), 58-70. Ruyter, K. D., Bloemer, J., & Pascal, P. (1997). Merging Service Quality and Service
Satisfaction: An Empirical Test of An Integrative Model. Journal of Economic Psychology, 18(4), 187-406.
Sasser, W. E., Olsen, R. P., & Wyckoff, D. D. (1978). Management of Service
Operations: Text and Cases. Boston: Allyn and Bacon. Shaw-Ching Liu, B., Furrer, O., & Sudharshan, D. (2001). The relationship between
Culture and Behavioral Intentions toward Services. Journal of Service Research, 4(2), 118-130.
Sherden, W. A. (1988). Gaining the Service Quality Advantage. Journal of Business
Strategy, 9(2), 45-48. Skogland, I., & Siguaw, J. (2004). Are Your Satisfied Customers Loyalty? Cornell Hotel
and Restaurant Administration Quarterly, 45(3), 221-232. Spreng, R. A., Mackenzie, S. B., & Olshavsky, R. W. (1996). A Reexamination of the
Determinants of Consumer Satisfaction. Journal of Marketing, 60, 15-32. Spreng, R. A., & MacKoy, R. D. (1996). An Empirical Examination of A Model of
Perceived Service Quality and Satisfaction. Journal of Retailing, 72(2), 201-214. Spreng, R. A., & MacKoy, R. D. (1996). An Empirical Examination of a Model of
Perceived Service Quality and Satisfaction. Journal of Retailing, 72(2), 201-214. Stevens, P., Knutson, B., & Patton, M. (1995). DINESERV: A Tool for Measuring
Service Quality in Restaurants. Cornell Hotel and Restaurant Administration Quarterly, 36(2), 55-60.
Tam, J. L. M. (2004). Customer Satisfaction, Service Quality and Perceived Value: An
Integrative Model. Journal of Marketing Management, 20(7/8), 897. Teas, R. K. (1993). Expectations, Performance Evaluation, and Consumers' Perceptions
of Quality. Journal of Marketing, 57(4), 18-34.
202
Teas, R. K. (1994). Expectations as a Comparison Standard in Measuring Service Quality: An Assessment of a Reassessment. Journal of Marketing, 58, 132-139.
Tomes, A. E., Ng, S., & Chee, P. (1995). Service Quality in Hospital Care: the
Development of an In-Patient Questionnaire. International Journal of Health Care Quality Assurance, 8(3), 25-32.
Tourism Authority of Thailand. (2001). Retrieved February 10, 2006, from
C:\Documents and Settings\Owner\Desktop\The Tourism Authority of Thailand (TAT) - Tourism Information Phuket Thailand.htm
Wikipedia. (2006). Retrieved February 14, 2006, from
http://en.wikipedia.org/wiki/Casual_dining Wikipedia. (2006). Retrieved February 16, 2006, from
http://en.wikipedia.org/wiki/Customer_Satisfaction Woodside, A. G., Frey, L. L., & Daly, R. T. (1989). Linking Service Quality, Customer
Satisfaction, and Behavioral Intention. Journal of Health Care Marketing, 9(December), 5-17.
Wyckoff, D. D. (1984). New Tools for Achieving Service Quality. Cornell Hotel and
Restaurant Administration Quarterly, 25(3), 78-91. Yu, C. H., Chang, H. C., & Huang, G. L. (2006). A Study of Service Quality, Customer
Satisfaction and Loyalty in Taiwanese Leisure Industry. The Journal of American Academy of Business, 9(1), 126-132.
Zeithaml, V. (1987). Defining and Relating Price, Perceived Quality, and Perceived
Value (No. 87-101). Cambride: Marketing Science Institue. Zeithaml, V. (1988). Consumer Perceptions of Price, Quality, and Value: A means-End
Model and Synthesis of Evidence. Journal of Marketing, 52(July ), 2-22. Zeithaml, V. A., Berry, L. L., & Parasuraman, A. (1988). Communication and Control
Process in The Delivery of Service Quality. Journal of Marketing, 52, 35-48. Zeithaml, V. A., Parasuraman, A., & Berry, L. L. (1990). Delivering Quality Service:
Balancing Customer Perceptions and Expectations. New York: Free Press. Zeithaml, V. A., Berry, L. L., & Parasuraman, A. (1996). The Behavioral Consequences
of Service Quality. Journal of Marketing, 60(April), 31-46.

203
APPENDICES

204
APPENDIX A – INSTITUTIONAL REVIEW BOARD (IRB) APPROVAL

205

206
APPENDIX B – COVER LETTER

207

208
APPENDIX C – ENGLISH QUESTIONNAIRE

209
Restaurant Type________________
Questionnaire No.________________ Questionnaire
Part I: Service Quality Directions: The following set of statement relates to your perspective of service quality in this restaurant. For each statement, please show the extent to which you believe the restaurant has the feature described by the statement. Please circle a number based on a scale from -3 to 3, with -3 being “less than expected” and 3 being “greater than expected”.
Less Than Greater than Expected Expected
Tangibles 1. The parking is adequate for you. -3 -2 -1 0 1 2 3 2. The dining area is clean. -3 -2 -1 0 1 2 3 3. This restaurant has a décor with restaurant image. -3 -2 -1 0 1 2 3 4. Employees are well dressed. -3 -2 -1 0 1 2 3 5. The menu reflects the restaurant’s image. -3 -2 -1 0 1 2 3 6. Restroom is thoroughly clean. -3 -2 -1 0 1 2 3
Reliability
7. You are served in the time promised. -3 -2 -1 0 1 2 3 8. Employees quickly correct anything that is wrong. -3 -2 -1 0 1 2 3 9. Service is consistent. -3 -2 -1 0 1 2 3 10. This restaurant provides an accurate guest check. -3 -2 -1 0 1 2 3 11. Employees serve food exactly as you ordered. -3 -2 -1 0 1 2 3 12. The food prices that you are charged on the guest check are the same as -3 -2 - 1 0 1 2 3
those in the menu.
Responsiveness 13. This restaurant tells you exactly when the services will be performed. -3 -2 -1 0 1 2 3 14. This restaurant during busy times has enough employees to help each other -3 -2 -1 0 1 2 3
maintain speed. 15. Employees provide quick service. -3 -2 -1 0 1 2 3 16. Employees respond to your request promptly. -3 -2 -1 0 1 2 3 17. Employees are always willing to help you. -3 -2 -1 0 1 2 3 18. Employees give extra effort to handle your special requests. -3 -2 -1 0 1 2 3
Assurance 19. Employees are able to answer your questions accurately. -3 -2 -1 0 1 2 3 20. Employees make you feel comfortable when dealings with them. -3 -2 -1 0 1 2 3 21. This restaurant has employees who are able to give you information -3 -2 -1 0 1 2 3 about menu items, their ingredients, and methods of preparation. 22. This restaurant has personnel who had well trained. -3 -2 -1 0 1 2 3 23. This restaurant seems to support their employees so that they can do their jobs well. -3 -2 -1 0 1 2 3 24. Employees are polite. -3 -2 -1 0 1 2 3
Empathy 25. Employees give you personal attention. -3 -2 -1 0 1 2 3 26. Employees know what your needs are. -3 -2 -1 0 1 2 3 27. This restaurant has operating hours convenient to you. -3 -2 -1 0 1 2 3 28. Employees have your best interests at heart. -3 -2 -1 0 1 2 3 29. Employees make you feel special. -3 -2 -1 0 1 2 3 30. This restaurant considers your needs. -3 -2 -1 0 1 2 3
(next page)

210
Part II: Overall Service Quality Directions: Please indicate the percentage of each dimension of service quality in this restaurant. The total percentage of service quality dimensions is 100. Service Quality Dimensions Percentage (%) Tangibles (physical facilities, appearance of employees, and tools or equipment used to provide the service) ----------------
Reliability (ability to perform the promised service dependably and accurately) ------------
Responsiveness (willingness to help customers and provide prompt service) -------------
Assurance (knowledge and courtesy of employees and their ability to inspire trust and confidence) -------------
Empathy (caring, individualized attention the firm provides its customers) -------------
Total 100 %
Part III: Customer Satisfaction and Loyalty Directions: Please circle a number based upon a scale from -3 to 3, with -3 being “less than expected” and 3 being “greater than expected”. Less Than Greater than Expected Expected 31. Overall, I am satisfied with this restaurant. -3 -2 -1 0 1 2 3
Customer Loyalty Attitudinal Measures32. I am likely to make positive comments about this restaurant to my friends, -3 -2 -1 0 1 2 3
relatives, and coworkers. 33. I would go out of my way to help my friends, relatives, and coworkers to do -3 -2 -1 0 1 2 3
business with this restaurant. 34. I would recommend this restaurant to my friends, relatives, and coworkers. -3 -2 -1 0 1 2 3 Behavioral Measures35. Even if I am offered lower prices at another restaurant, I will not switch from -3 -2 -1 0 1 2 3
this restaurant. 36. I would complain to this restaurant if I experience problems. -3 -2 -1 0 1 2 3 37. I would return to this restaurant in the future. -3 -2 -1 0 1 2 3
Part IV: Demographic Profile
Directions: Please answer each of the following questions to provide information about yourself. This demographic information will be used for research purposes only.
1. What is your gender? Male Female
2. What is your marital status? Single Married Widowed Divorced
3. What is your age?
20 – 29 years 30 – 39 years 40 – 49 years 50 – 59 years Over 60 years
4. Have you dined at this restaurant before? Yes No
5. How many times do you dine in this restaurant in a month?
1 time 2 times 3times 4 times Over 4 times 6. How much do you usually spend per dinner? (US $ 1 = 40 baht)
Under 400 baht 400 – 800 baht 801 – 1,200 baht 1,201 – 1,600 baht Over 1,600 baht
7. How many people do you have in your party? (Including you) _________ people
Thank you for participation in this questionnaire

211
APPENDIX D – THAI QUESTIONNAIRE

212

213

VITA
Arisara Seyanont
Candidate for the Degree of
Doctor of Philosophy Dissertation: A COMPARATIVE STUDY OF THE SERVICE QUALITY OF CASUAL DINING RESTAURANTS IN PHUKET: PERSPECTIVE OF THAI AND INTERNATIONAL CUSTOMERS Major Field: Hospitality Administration Biographical:
Personal Data: Born in Bangkok, Thailand, On April 5, 1973, the daughter of Sanan and Patcharee Seyanont
Education: Received Bachelor of Science degree in Accounting (International
Program), Bangkok University, Bangkok, Thailand, December 1995; received Master of Business Administration degree, Jacksonville State University, Jacksonville, Alabama. Completed requirements for Doctor of Philosophy degree, Oklahoma State University, May 2007
Experience: 2004 to present – Student Assistant at Career Resource Center,
Oklahoma State University: Design marketing materials for campus-wide awareness campaigns, help students with career exploration and study skills enhancement, train staff and clients on effective use of information systems resources; Jul y 2006 – Research Assistant at School of Hotel and Restaurant Administration, Oklahoma State University: Assist the professor in development of research, assist the professor in publicity material in the research; August 2004 – Dining Service Graduate Assistant at Residential Life – Scott-Parker-Wentz Dining, Oklahoma State University: Daily operational management, catering and special events, maintenance of health and safety standards, and service management; 2000-2004 –CEO and Owner at Patcharee Thai Restaurant, Inc., Carterville, Georgia: Managed all operation functions, improved quality and efficiencies resulting in food and labor cost reduction, created new menu items and instituting new plating system, and scheduled and payroll forecasting for the business.

Name: Arisara Seyanont Date of Degree: May, 2007 Institution: Oklahoma State University Location: Stillwater, Oklahoma Title of Study: A COMPARATIVE STUDY OF THE SERVICE QUALITY OF CASUAL DINING RESTAURANTS IN PHUKET: PERSPECTIVE OF THAI AND INTERNATIONAL CUSTOMERS Pages in Study: 213 Candidate for the Degree of Doctor of Philosophy
Major Field: Hospitality Administration Scope and Method of Study: The purpose of the study was to determine which attributes
of service quality (SERVQUAL) influenced customer’s satisfaction of casual dining restaurants in Phuket. The researcher examined the relationships between customer satisfaction and customer loyalty (word-of-mouth endorsements and repurchase intention). Additionally, this study was also designed to measure levels of service quality based on a) gender, b) age, c) dining frequency, and d) per capita expenditures for each meal.
Findings and Conclusions: The results of this research indicated that service quality
factors scales and customer loyalty scales measures were reliable Cronbach’s alpha ≥ 0.60 had a high reliability. As a result of principal component analysis (factor analysis) using the varimax rotation identified four underlying service quality factors in casual dining restaurants. These four service quality factors were 1) Personnel and Customers’ Relationship, 2) Environment Service Provider, 3) Service Providers’ Attitude and Competencies, and 4) Service Providers’ Initiative in Guest’s Service. The findings of this study indicated that the service quality factors had a positive impact on overall customer satisfaction. In turn, customer satisfaction is likely to increase customer loyalty (word-of-mouth endorsements and repurchase intention) in casual dining restaurants environment. The results showed that Thai casual dining restaurant had a higher significance difference than Japanese, Italian, and Mediterranean casual dining restaurants in overall service quality.
ADVISOR’S APPROVAL: Jerrold K. Leong, Ph. D., FMP