A Comparative Study of the Bioremediation Potentials of ...
11
_____________________________________________________________________________________________________ *Corresponding author: E-mail: [email protected]; British Microbiology Research Journal 15(2): 1-11, 2016, Article no.BMRJ.26027 ISSN: 2231-0886, NLM ID: 101608140 SCIENCEDOMAIN international www.sciencedomain.org A Comparative Study of the Bioremediation Potentials of Inorganic Nutrient Sources T. Sampson 1* , C. J. Ogugbue 1 and G. C. Okpokwasili 1 1 Department of Microbiology, University of Port Harcourt, P.M.B. 5323, Port Harcourt, Nigeria. Authors’ contributions This work was carried out in collaboration between all authors. The work was designed and carried out by author TS under the close supervision and technical support of authors GCO and CJO. The manuscript was prepared by author TS while authors GCO and CJO aided in intellectual contributions as well as restructuring. All the authors approve this publication. Article Information DOI: 10.9734/BMRJ/2016/26027 Editor(s): (1) Raúl Rodríguez-Herrera, Autonomous University of Coahuila, México. Reviewers: (1) Brijesh Kumar Yadav, Punjab Agricultural University, Punjab, India. (2) Mahmood M. Barbooti, University of Technology, Iraq. (3) Masahiko Katoh, Meiji University, Japan. Complete Peer review History: http://sciencedomain.org/review-history/14866 Received 30 th March 2016 Accepted 24 th May 2016 Published 1 st June 2016 ABSTRACT Aim: To evaluate the efficacy of inorganic nutrient sources in crude oil degradation. Place and Duration of Study: The study was carried out at Environmental Microbiology Department, University of Port Harcourt, Nigeria, between January and June 2015. Methodology: Hydrocarbon polluted soil was collected and recreated in three (3) containers marked A – C, representing NPK, Urea fertilizer and control, respectively. The setups were amended with NPK and urea fertilizer and observed for a 35 - day period. Hydrocarbon degradation in a 0.25% crude oil contaminated water was as well studied by inoculating a mineral salt – water (solution) with suspensions of a 24-h old pure cultures of bacterial isolates identified as Pseudomonas sp., Bacillus sp. and Micrococcus sp. Total petroleum hydrocarbons (TPH) and total hydrocarbon content (THC) was analyzed using gas chromatographic analysis and mass spectrometer – GC/MS. Results: The percentage residual petroleum hydrocarbons in soil were closely related to each other when compared to the control setup, C. NPK was however, found to be more effective in the aquatic environment than urea. The kinetics studies in water showed the treatment options were effective in the descending order of percentage residual hydrocarbons; direct NPK, Aw - (20.3%) > Original Research Article
Transcript of A Comparative Study of the Bioremediation Potentials of ...

_____________________________________________________________________________________________________ *Corresponding author: E-mail: [email protected];
British Microbiology Research Journal 15(2): 1-11, 2016, Article no.BMRJ.26027
ISSN: 2231-0886, NLM ID: 101608140
SCIENCEDOMAIN international www.sciencedomain.org
A Comparative Study of the Bioremediation Potentials of Inorganic Nutrient Sources
T. Sampson1*, C. J. Ogugbue1 and G. C. Okpokwasili1
1Department of Microbiology, University of Port Harcourt, P.M.B. 5323, Port Harcourt, Nigeria.
Authors’ contributions
This work was carried out in collaboration between all authors. The work was designed and carried out by author TS under the close supervision and technical support of authors GCO and CJO. The
manuscript was prepared by author TS while authors GCO and CJO aided in intellectual contributions as well as restructuring. All the authors approve this publication.
Article Information
DOI: 10.9734/BMRJ/2016/26027
Editor(s): (1) Raúl Rodríguez-Herrera, Autonomous University of Coahuila, México.
Reviewers: (1) Brijesh Kumar Yadav, Punjab Agricultural University, Punjab, India.
(2) Mahmood M. Barbooti, University of Technology, Iraq. (3) Masahiko Katoh, Meiji University, Japan.
Complete Peer review History: http://sciencedomain.org/review-history/14866
Received 30 th March 2016 Accepted 24 th May 2016 Published 1 st June 2016
ABSTRACT
Aim: To evaluate the efficacy of inorganic nutrient sources in crude oil degradation. Place and Duration of Study: The study was carried out at Environmental Microbiology Department, University of Port Harcourt, Nigeria, between January and June 2015. Methodology: Hydrocarbon polluted soil was collected and recreated in three (3) containers marked A – C, representing NPK, Urea fertilizer and control, respectively. The setups were amended with NPK and urea fertilizer and observed for a 35 - day period. Hydrocarbon degradation in a 0.25% crude oil contaminated water was as well studied by inoculating a mineral salt – water (solution) with suspensions of a 24-h old pure cultures of bacterial isolates identified as Pseudomonas sp., Bacillus sp. and Micrococcus sp. Total petroleum hydrocarbons (TPH) and total hydrocarbon content (THC) was analyzed using gas chromatographic analysis and mass spectrometer – GC/MS. Results: The percentage residual petroleum hydrocarbons in soil were closely related to each other when compared to the control setup, C. NPK was however, found to be more effective in the aquatic environment than urea. The kinetics studies in water showed the treatment options were effective in the descending order of percentage residual hydrocarbons; direct NPK, Aw - (20.3%) >
Original Research Article

Sampson et al.; BMRJ, 15(2): 1-11, 2016; Article no.BMRJ.26027
2
direct urea, Bw - (23%) compared to the control, Cw - (45.2%). And a one-way analysis of variance, the Laverne’s test for homogeneity of variances and Tukey post hoc test showed there was a significant difference in the mean values of the various treatment options (p>0.05, f (2, 36) = 92.70, PV = 0.00). Conclusion: In the overall, the efficacy of a fertilizer depends on the environment it found itself. However, urea fertilizer was observed to be slow-release in nature, hence if fertilizers must be applied directly, urea fertilizer is recommended.
Keywords: Bioremediation; fertilizers; biostimulation; hydrocarbon; soil; water. 1. INTRODUCTION Oil pollution accounts for most of the environmental impacts of oil exploration and exploitation practices in Nigeria. These are meanly through leakages; transportation processes and sabotage (breaking of oil pipes) [1]. The activities of these oil industries in their areas of operation usually result in high degree of pollution which drastically affects the land and sea (terrestrial and aquatic environment) [2]. Oil pollution causes great damage to the ecosystem as it leads to loss of important biotic and abiotic components of the environment [3] and as well affects microbial diversity. The high rate of petroleum-related activities in the Niger Delta region causes frequent oil spills with attendant ecological problems associated with their coastal waters [4]. Most of the pollution cases in Nigeria are due to exploitation and exploration practices as well as the vandalization of oil pipelines [1]. Some petroleum industries in Nigeria deliberately discharge waste oil in the soil or waster. Obire and Amusan [5] have put forward the deliberate discharge of oil field waste water or effluent as a source of environmental contamination. Several factors have made bioremediation to be a more preferred technology. These include the conversion of harmful compounds into nontoxic form, in situ and ex situ applicability, less labour skill requirement and it as well results in the breakdown of large range of pollutants in the environment [6]. Novel techniques are now developed to suit the need to remediate these contaminated sites [7]. Since petroleum hydrocarbon is biodegradable in nature, the technique of bioremediation has become a very useful alternative compared to chemical and physical methods of cleanup [7]. In most cases, most of the fertilizers applied are sparingly available following leaching and dissolution. The loss of the applied fertilizers is dependent on the solubility of the fertilizers and
the method used in the application: spraying, broadcasting, embedding, etc. This leaching or washout usually results in eutrophication and pollution of underground, surface and sub-surface water [8]. Bioremediation, under natural attenuation is rather a slow process. This is however, a major setback. The addition of inorganic nutrient sources will bring about a rapid rate of degradation. There are different types and sources of fertilizer. Some fertilizers such as commercial NPK fertilizer as well as urea fertilizer are excellent sources of inorganic nutrient. They are generally manufactured by the agrochemical industries. The use of fertilizers as sources of nutrient to biostimulate microbial population explores the principle that fertilizers are mainly composed of nitrogen, phosphorus, potassium and other micro and macro elements/nutrient required by microorganisms to carry out the metabolic activities. The activities of these microbial groups help in degrading hydrocarbon, which are utilized as a carbon source by microorganisms [9]. Several reports have shown that inorganic fertilizers are more effective in stimulating bacterial metabolism of petroleum hydrocarbons [8]. This work therefore, evaluates the impact of inorganic nutrient sources (NPK and urea fertilizers) on bioremediation rate. 2. MATERIALS AND METHODS 2.1 Soil Sample Source and Collection A 0-10 cm depth, crude oil-hydrocarbon impacted soil sample was collected from Etelebuo-Ogboloma, flow station in Yenagoa L.G.A. of Bayela State, Nigeria. 2.2 Fertilizer Type and Source The fertilizer type and source was a commercial NPK fertilizer (15:15:15) and Urea (46%N) by Spring Field Agro LTD.

Sampson et al.; BMRJ, 15(2): 1-11, 2016; Article no.BMRJ.26027
3
2.3 Soil Bioremediation Studies The Crude oil impacted soil sample was amended as follows and kept under a controlled laboratory condition for a 35-day period of study. Five hundred gram (500 g) of hydrocarbon contaminated soil was recreated in three containers and labeled as follow:
Sample A = 500 g Soil + 5 g direct NPK Sample B = 500 g Soil + 5 g Direct urea
fertilizer Sample C = 500 g unamended soil: control
2.4 Crude Oil Degradation in Water A 0.25% concentration of crude oil was achieved by introducing 0.5 ml crude oil into a 500 ml capacity Erlenmeyer flask containing 200 ml mineral salt solution and 2 g of each fertilizer type was used as nutrient source. Bacterial consortium/biomass was prepared by inoculating serially diluted hydrocarbon polluted soil on a mineral salt agar plate through a vapour phase transfer technique. Suspensions of a 24-h old pure cultures of bacterial isolates identified as Pseudomonas sp., Bacillus sp. and Micrococcus sp. was used to inoculate the set-ups and labeled as Aw (NPK fertilizer); Bw (urea fertilizer); Cw (no fertilizer, only bacterial biomass) and Dw (no fertilizer, no bacterial biomass) as controls. This was achieved by adjusting the turbidity of each suspension using McFarland’s standard. The set-up was however inoculated with 0.5 ml of each bacterial suspension (Pseudomonas sp., Bacillus sp. and Micrococcus sp) in a 500 ml capacity Erlenmeyer flask containing 200 ml mineral salt solution and 0.5 ml contaminant (crude oil). 2.5 Enumeration of THBC and HUB The population of heterotrophic bacteria was enumerated using the spread plate technique, at seven (7) days interval. A 10-fold serial dilution of the soil sample was carried out by weighing 1 g of the soil sample into a sterile test tube containing 9ml of sterile physiological saline. From here a ten-fold serial dilution was performed to a dilution of 10-5. From each dilution, 0.1 ml was inoculated on nutrient agar plates (Petri dishes). However, a triplicate plating of each dilution was employed. Sterile glass rods (spreader) were used to spread the inoculums over the media and were incubated in an incubator at 25ºC for 24 hours.
The population of the hydrocarbon utilizing bacteria was determined by culturing the diluted soil samples on mineral salts agar. A Whatman’s filter paper was saturated with crude oil and placed on the lid of each glass Petri dish using sterile forceps. The crude oil served as the sole source of hydrocarbon (that is carbon and energy source for the hydrocarbon utilizers). The inoculated mineral salts agar plates were inverted and placed over the lid containing the saturated filter paper, and incubated at room temperature for seven (7) days. 2.6 Monitoring Bioremediation 2.6.1 Aeration The experimental soil samples were tilled twice a week to allow the distribution of oxygen in and around the soil sample. 2.6.2 Moisture content The moisture content was maintained at 20% by weighing and adding water when necessary. 2.6.3 Determination of physicochemical
parameters and residual hydrocarbon Parameters such as pH, total nitrogen, and phosphate were determined using the methods from [10] while the total petroleum hydrocarbons (TPH) and total hydrocarbon content (THC) was determined using the methods of ASTDM 3921 and USEPA 8270B [11]. However GC/MS was used for total petroleum hydrocarbon (TPH) and total hydrocarbon content (THC) determination. 2.6.4 Monitoring nutrient utilization The changes in the amount of available nutrient (nitrogen) were monitored/analyzed during the study period, using the distillation method. Soil samples for analysis were digested using concentrated sulphuric acid. The digest was cooled to room temperature and was diluted to 100 ml with distilled water. One milliliter of each sample (soil digest or water) was weighed into distillation flask. This was followed by the addition of 20 ml distilled water and 0.4 g magnesium oxide. The distillation flask was attached to a retort stand on a distillation hot plate. This was connected to a receiver flask via a Liebig condenser. To this receiver, was added 10 ml 2% boric acid with few drops of double indicator. The flask was heated to distil out the ammonia as distillate in the receiver. The boric

Sampson et al.; BMRJ, 15(2): 1-11, 2016; Article no.BMRJ.26027
4
acid indicator changed to greenish from purple and was titrated with 0.1N HCl to purple as back titration.
% NH4+ =
����� ���� ��� ��� ����� �� ������
������ �� ������ x 10
2.7 Statistical Analysis One-way Analysis of variance (ANOVA) was used to check for significant difference in the values of the various treatment options and a 2-tailed Pearson’s Moment Correlation coefficient ρ was used to determine degrees of relationship between the various parameters. 3. RESULTS AND DISCUSSION 3.1 Changes in pH Values The changes in soil pH following soil amendment with fertilizer were revealed in this study. It was discovered that the initial pH of the polluted soil was 6.52±0.2. After soil amendment the pH values increased slightly towards neutrality and alkalinity and ranged from 6.91±0.0 to 8.96±0.3. This is in conformity with the pH range observed by Okpokwasili and Oton [12]. It was observed that the pH values of Experimental Set-up A, increased progressively throughout the study period. However, set-up B as well as the control experimental set-up C fluctuated during the period of study. From Table 1 it was observed that NPK has lower pH values than urea as A < B. This may imply that urea fertilizer is less acidic than the inorganic NPK fertilizer. However, statistical analysis using the one way analysis of variance showed there was no significant
difference in the mean values of the various treatment options, A – B, compared to the control C (p>0.05, f = 2.184, pv = 0.08). This observation might be attributable to the fact that fertilizer application has varying effect on soil pH [13]. The changes in soil pH are also a function of other intrinsic factors relating to microbial activities (metabolites). 3.2 Variations in Nutrient Concentration Tables 2 - 3 show the changes in nutrient concentration during the study period. The investigation revealed that urea fertilizer had lower nitrogen content compared to NPK. Table 2 revealed that NPK fertilizer witnessed a decrease up to day 35 (0.209±0.008%). Also, Experimental set-up B (urea fertilizer) had an initial nitrogen content of 0.306±0.003% and progressively reduced during the study period, to 0.221±0.004% at day 35. These values were subjected to statistical analysis and a one-way ANOVA showed that there was a significant difference in the mean total nitrogen of setups A and B compared to the Control, C (p<0.05, f = 20.228, pv = 0.00). Similar trend was observed in Table 3, for crude-oil degradation in water. At the beginning of the investigations (zero hour), the set-ups had an initial nutrient concentration of 71.50±0.05 mg/L and 46.80±0.05 nitrate nitrogen for NPK (Aw) and urea (Bw), respectively. The results were taken at seven days interval for a period of thirty five (35) days. The variations in nutrient concentration were 60.00±0.35, 37.21±0.25 and 0.99±0.0105 mg/L nitrate nitrogen for samples Aw, Bw and Cw, respectively on day 35.
Table 1. Variations in pH
Sample Day 0 Day 7 Day 14 Day 21 Day 28 Day 35 A 7.80±0.20 8.00±0.20 8.52±0.10 8.63±0.30 8.76±0.2 0 8.80±0.10 B 8.10±0.20 8.82±0.30 8.95±0.10 8.99±0.20 8.93±0.20 8.96±0.30 C 6.52±0.20 6.60±0.10 6.63±0.40 6.67±0.00 6.71±0.10 6.72±0.20
Code: A – NPK; B- Urea; C – Control
Table 2. Changes in soil nitrogen content
Sample Day 0 Day 7 Day 14 Day 21 Day 28 Day 35 A 0.320±0.003 0.311±0.003 0.291±0.008 0.252±0.005 0.247±0.002 0.231±0.002 B 0.306±0.003 0.300±0.005 0.287±0.007 0.248±0.003 0.230±0.007 0.221±0.004 C 0.270±0.003 0.265±0.004 0.260±0.009 0.210±0.009 0.209±0.003 0.201±0.002
Code: A = NPK fertilizer; B = Urea fertilizer; C = Control

Sampson et al.; BMRJ, 15(2): 1-11, 2016; Article no.BMRJ.26027
5
Table 3. Variations in nitrogen concentration (water)
Sample Day 0 Day 7 Day 14 Day 21 Day 28 Day 35 Aw 71.50±0.05 70.61±0.32 68.80±0.45 63.00±0.25 60.7±0.20 60.00±0.35 Bw 46.80±0.05 44.44±0.25 40.50±0.18 38.80±0.20 34.80±0.28 37.21±0.25 Cw 1.95±0.05 1.91±0.02 01.82±0.07 1.50±0.03 1.47±0. 16 0.99±0.01
Code: Aw = NPK fertilizer; Bw = Urea fertilizer; Cw = Control Statistical analysis using the one way analysis of variance showed there was no significant difference in the mean values of the various treatment options, A – B, compared to the control C (p>0.05, f(2,36) = 0.597, PV = 0.703). However, while there was a positive correlation between the nutrient source (nitrate nitrogen) and bacterial biomass (r = 0.530), there was a negative correlation between the nutrient source (nitrate nitrogen) and total hydrocarbon content (r = -0.441), using the 2-tailed Pearson’s correlation model.
This observed trend has revealed the need for frequent application of fertilizer due to rapid loss, following microbial utilization and washout by rain and other meteorological factors. This is a potential disadvantage associated with direct fertilizer application as it will eventually lead to eutrophication, underground water pollution (due to leaching) and higher cost implication due to frequency of application.
3.3 Changes in Bacterial Population in Soil
The effect of nutrient concentration on the population dynamics of hydrocarbon utilizing bacterial population was investigated. The initial cell count of hydrocarbon utilizing bacteria and total heterotrophic bacteria in the contaminated soil was 1.20 ± 0.02 x10⁵ cfu/g and 1.10 ± 0.01 x 10⁶
cfu/g, respectively. The unamended soil had the least bacterial count for both the total heterotrophic and hydrocarbon utilizing bacteria. Statistical analysis showed a strong negative and significant relationship between nutrient concentration and bacterial counts (total heterotrophic bacteria and hydrocarbon utilizing bacteria). The result obtained from the total heterotrophic bacterial count showed the various
treatment options where effective (with respect to the control set-up) in the order of A (1.30±0.03 x 1027 cfu/g) > B (1.10±0.02 x 1026 cfu/g). Same trend was observed for hydrocarbon utilizing bacterial count where the control set-up had growth counts that ranged from 6.01±0.02 x 10⁷ cfu/g) to 2.80±0.04 x 10¹³ cfu/g between days 7 and 35. The result revealed that experimental set-up A (direct NPK fertilizer) supported the highest growth rate of hydrocarbon utilizing bacteria in the range of 2.90±0.03 x 10¹² cfu/g (day 7) to 2.80 ± 0.08 x 1026 cfu/g (day 35). Sample B with direct urea fertilizer was next with 3.00±0.03 x 10¹¹ cfu/g (day 7) to 2.90±0.06 x 1025 cfu/g (day 35).
This has established that the amount or available nutrient has a significant effect on the growth rate of hydrocarbon utilizing bacterial population. This however, implies that as cell count increases the concentration of nutrients reduces. This work has shown that the addition of nutrients supported proliferation of bacteria following the metabolism of the crude oil contaminants. 3.4 Changes in Bacterial Biomass in
Water The initial cell count at the start of the experiment (zero-hour) was 4.90±0.03 x 10⁴ cfu/ml. After a 35–day period of investigation, the bacterial count for the various set-ups was as follows: Sample Cw (NPK) had 2.51±0.09 x 10⁹ cfu/ml on day 7 and its highest count of 2.40±0.02 x 10¹⁹
cfu/ml was on day 35. Sample Bw (urea) had 2.14±0.05 x 10⁷ cfu/ml on day 7 and its highest count of 1.38±0.05 x 10¹⁸ cfu/ml on day 35. The control setup Cw had 2.51±0.02 x 10⁶ cfu/ml on day 7 and its highest count of 1.32±0.10 x 10¹¹ cfu/ml on day 35 (Table 4).
Table 4. Bacterial biomass (cfu/ml)
Sample Day 0 Day 7 Day 14 Day 21 Day 28 Day 35 Aw 4.90x10⁴ 2.51x10⁹ 1.50x10¹³ 1.90x10¹⁵ 1.90x10¹⁷ 2.40x10¹⁹ Bw 4.90x10⁴ 2.14x10⁷ 1.70x10¹⁰ 1.00x10¹³ 1.20x10¹⁶ 1.38x10¹⁸ Cw 4.90x10⁴ 2.51x10⁶ 2.23x10⁸ 2.30x10⁹ 2.30x10¹⁰ 1.32x10¹¹
Code: Aw = NPK fertilizer; Bw = Urea fertilizer; Cw (control 1) = No fertilizer, only bacterial biomass

Sampson et al.; BMRJ, 15(2): 1-11, 2016; Article no.BMRJ.26027
6
Fig. 1. Changes in hydrocarbon utilizing bacterial count
Fig. 2. Changes in total heterotrophic bacterial count The result revealed that the direct NPK fertilizer stimulated more bacterial growth than urea fertilizer. The control set-up (Cw) however witnessed a rather slow growth rate compared to the treated options. Statistical analysis using the one way analysis of variance showed there was a significant difference in the mean values of the various treatment options, A and B, compared to the control, Cw (p>0.05, f (2,36) = 34.378, PV = 0.00). However, while there was a positive correlation between bacterial biomass and the nutrient source (nitrate nitrogen) (r = 0.530), there was a strong negative correlation between bacterial biomass and total hydrocarbon content (r = -0.957), using the two-tailed Pearson’s correlation model. This observed difference is attributable to the varying effect of the nutrient amendments in the set-ups. The crude oil contamination served as
sole source of carbon and energy for proliferation of bacteria. The inorganic fertilizers however, provided nitrogen to bring about a balanced C:N ratio, supporting the growth and metabolic activities of the bacterial population. Researchers have established that microorganisms require different levels of nutrients, in addition to hydrocarbon which serves as carbon and energy source. Researchers have also identified the availability of nutrients as a major factor affecting the rate of hydrocarbon removal in the polluted environment. For instance, the degradation of 1L of gasoline requires 44 g of N and 22 g of P supplied as aqueous solution [14]. Deficiency or plethora of nitrogen or phosphorus will reduce the efficiency of biodegradation. Some proposed ratios include 100:15:3 [15], 120:10:1 [16], 250:10:3 or 100:10:2 [17] and 100:10:1 [18].
0
5
10
15
20
25
30
0 7 14 21 28 35
Lo
g.1
0 o
f H
UB
C
TIME (Days)
A - NPK
B - UREA
C - CONTROL
0
5
10
15
20
25
30
0 7 14 21 28 35
Lo
g.1
0 o
f T
HB
C
TIME (Days)
A - NPK
B - UREA
C - CONTROL

Sampson et al.; BMRJ, 15(2): 1-11, 2016; Article no.BMRJ.26027
7
Besides, it has been recognized that a low concentration of N (approximately 300 mg/kg soil) is more realistic due to toxicity considerations [19]. 3.5 Hydrocarbon Biodegradation in Soil The percentage residual petroleum hydrocarbon was closely related to each other when compared to the control setup, C. The percentage residual hydrocarbon, R (%) was calculated using the formula, R (%) = (
*
+ ) x 100.
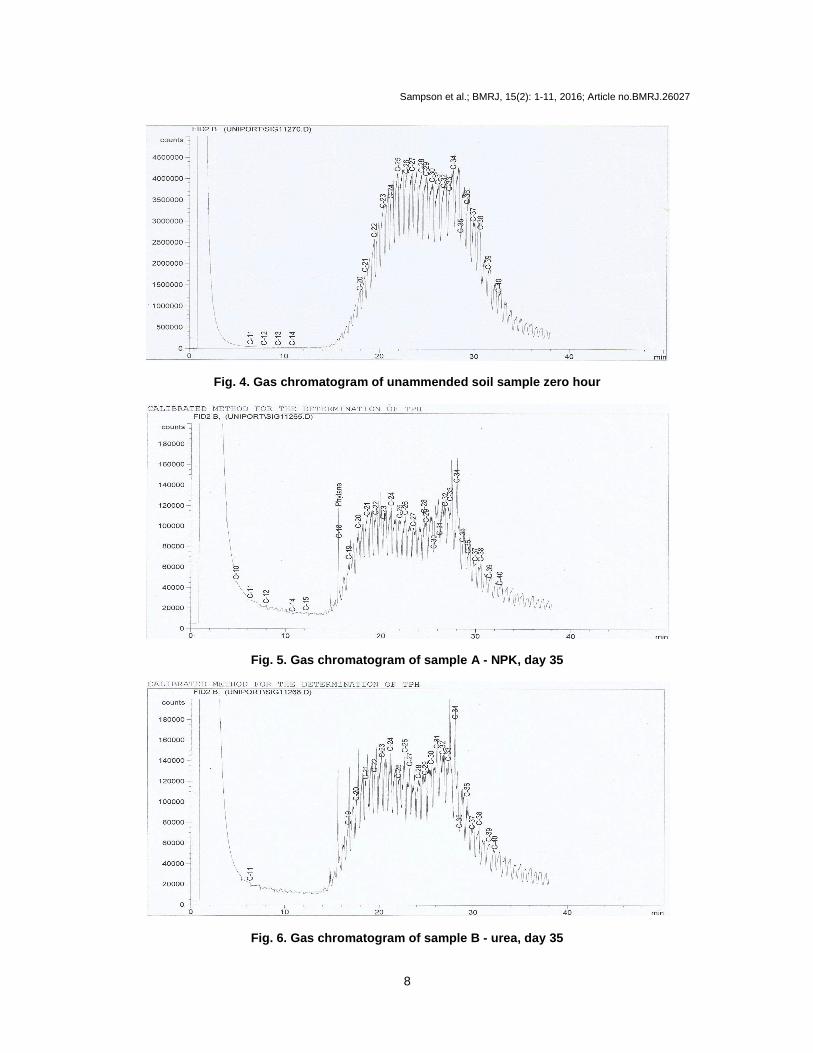
Where, I is the initial total petroleum hydrocarbon of the polluted soil and R is the residual total petroleum hydrocarbon at a given time. Gas chromatographic studies showed the peak heights and base widths of the constituent petroleum hydrocarbon. The peak heights reduced as base widths increased. The constituents ranged from C10 to C40, including pristane and phytane. The total petroleum hydrocarbons of the unamended soil were seen to be 2825.19±0.15 mg/kg. A 59.9%, 69.2% and 34.9% loss of hydrocarbon was observed for treatment options A, B and C, respectively on day 35 of the investigation. This shows that the direct urea application (B) had the highest hydrocarbon removal rate. The direct NPK fertilizer was next. From the result it can be extrapolated that direct urea application recorded 1093.38 ±0.29 mg/kg
while the direct NPK had 1117.86±0.76 mg/kg TPH on day 35. This observation can be linked to the fact that the rate of bioremediation is dependent on the amount of available nutrient. This is in agreement
with the findings of Okpokwasili and Oton [12]. They observed that nutrient amendment was effective as 0.2% NPK was more active than 0.075% NPK compared to the set up without fertilizer application and thus they attributed this observation to nutrient availability as well as other physicochemical factors that affected the rate of hydrocarbon loss in the environment. Also, Chikere et al. [20] in a community profiling of active oleophilic bacteria reported a significant reduction of total petroleum hydrocarbon (TPH) with an increase in biomass, following a 64-day treatment using NPK and urea as nutrient sources in a bioreactor. It can be deduced from Fig. 3 that the urea and NPK showed similar effect in soil. Some researchers have however, reported some differences in the bioremediation potentials of fertilizers. Chikere et al. [21] observed that NPK fertilizer option was more effective than urea fertilizer (after a 57-day period of investigation). Also, Chikere et al. [22] carried out a study on the phylogenetic diversity of dominant bacterial communities during bioremediation of crude oil-polluted soil and came up with the conclusion that NPK fertilizer seems to be the best nutrient for the biostimulation of indigenous bacterial community in crude oil-polluted soil. In a bioreactor based community profiling, Chikere et al. [20] also showed that NPK fertilizer was able to cause a 97.2% reduction in crude oil hydrocarbon compared to urea that caused about 82.1% reduction. This differences can be attributable to the fact that bioremediation of hydrocarbon is a function of other environmental factors.
Fig. 3. Percentage residual hydrocarbon
0
20
40
60
80
100
120
0 7 14 21 28 35
% R
ES
IDU
AL
TP
H
TIME ( Days)
A - NPK
B - UREA
C - CONTROL
Sampson et al.; BMRJ, 15(2): 1-11, 2016; Article no.BMRJ.26027
8
Fig. 4. Gas chromatogram of unammended soil sample zero hour
Fig. 5. Gas chromatogram of sample A - NPK, day 35
Fig. 6. Gas chromatogram of sample B - urea, day 35

Sampson et al.; BMRJ, 15(2): 1-11, 2016; Article no.BMRJ.26027
9
Fig. 7. Gas chromatogram of sample C, day 35 3.6 Hydrocarbon Biodegradation in Water At the end of the investigation, the bacterial consortium was able to appreciably degrade the crude oil as measured by the oil and grease method, to determine the total hydrocarbons content (shown in Table 5). The table shows the treatment options were effective in the descending order; NPK (20.3%) > urea (23%), compared to the two controls Cw (45.2%) and Dw (62.7%), (Table 5). A one way analysis of variance showed there was a significant difference in the mean values of the various treatment options (p>0.05, f (2, 36) = 92.70, PV = 0.00). The influence of inorganic nutrient and bacterial growth on crude oil degradation was investigated. Nutrients (NPK and urea fertilizers) and bacterial suspensions were added to experimental set-ups Aw and Bw, while setup Cw was seeded with bacterial suspension (without nutrient) and set-up Dw was without bacteria and nutrient. The result indicated that set-ups Cw and Dw had the least hydrocarbon removal rates which imply that crude oil degradation is greatly
influenced by bacterial growth and nutrient availability. However, the control experiment Dw had the least rate of hydrocarbon removal. It has been well documented that the fate of crude oil pollutants is dependent on physical, chemical and biological factors. Where the rate of hydrocarbon removal was influenced by nutrient concentration in treatments A and B, a 34.9% and 37.3% loss of hydrocarbon (day 35) was noticed in the control set-up (without fertilizer) in soil and water, respectively. This is probably due to natural attenuation taking place in the unfertilized soil. Chikere et al. [23] observed a hydrocarbon loss in the heat-killed control signifying that abiotic factors could as well contribute to hydrocarbon attenuation in the environment. Therefore, the potential of a fertilizer is dependent on the nutrient formulation and the environment it finds itself. This is owed to the observations where urea and NPK fertilizer showed similar effect in the cleanup of hydrocarbon polluted soil whereas NPK had a faster hydrocarbon removal rate in water than urea. These observed differences are attributable
Table 5. Percentage residual hydrocarbon in water
Sample Day 0 Day7 Day 14 Day 21 Day 28 Day 35 Aw 100 73.3 42.2 31.1 26.7 20.3 Bw 100 79.1 42.2 36.0 30.0 23.0 Cw 100 88.9 68.0 59.6 49.8 45.2 Dw 100 93.3 77.8 72.0 68.4 62.7
Code: Aw = NPK fertilizer; Bw = Urea fertilizer; Cw (control 1) = No fertilizer, only bacterial biomass; Dw (control 2) = No fertilizer, no bacterial biomass

Sampson et al.; BMRJ, 15(2): 1-11, 2016; Article no.BMRJ.26027
10
to the difference in the composition of the two inorganic fertilizers: NPK (15:15:15) and urea (49% nitrogen), used in this study. NPK is a compound fertilizer composed of nitrogen, phosphorus (P2O5) and potassium (K2O) while urea on the other hand has nitrogen as the main constituent. In view of increasing ecological concerns, these results are therefore, important for future research, targeted at optimizing the bioremediation potentials of inorganic fertilizers. 4. CONCLUSION It was observed from this study that inorganic fertilizers have varying effect, depending on the environment it found itself. NPK fertilizer was however, found to be more effective in the aquatic environment due to difference in solubility in water. Urea fertilizer on the other hand was observed to be slow-release in nature and so if fertilizers must be applied directly, urea fertilizer is recommended. This research has however shown the performance of inorganic fertilizers in the bioremediation of different impacted media. This presents an easy frame work and important data set for future research and publications involving the use of inorganic fertilizers in formulating and optimizing the potentials of slow-release fertilizers in the bioremediation of petroleum hydrocarbon impacted media (soil and water). COMPETING INTERESTS Authors have declared that no competing interests exist. REFERENCES 1. Salau AO. Securing environmental
protection in the Nigeria Oil Industry. Modern Practice Journal of Finance and Law. 1999;3:31-39.
2. Abu GO, Chikere BO. Cell surface properties of hydrocarbon utilizing bacterial isolates from Port Harcourt marine environment. Nigerian Journal of Microbiology. 2006;20:809-816.
3. Nwachukwu SCU, Ugoji EO. Impacts of crude petroleum spills on microbial communities of tropical soils. International Journal of Ecology and Environmental Science. 1995;21:169-176.
4. Antai SP. Microbial bioprocesses as agents of welfare for Man and the environment. 30th Inaugural Lecture.
University of Calabar, Calabar, Nigeria. 2005;7-48.
5. Obire O, Amusan FO. The environmental impact of oil feed formation on a fresh water stream in Nigeria. Journal of Applied Science and Environmental Management. 2003;7:61-66.
6. Yakub MB. Biological approach to oil spills remediation in the soil. African Journal of Biotechnology. 2007;6(24):2735-2739.
7. Okoh A. Biodegradation alternative in the cleanup of petroleum hydrocarbon pollutants. Biotechnology and Molecular Biology Review. 2006;1(2):38-50.
8. Omar AS. Polyethylene-coated urea. Improved storage and handling properties. Industrial and Engineering Chemistry. 1989;1:630–632.
9. Ijah UJJ, Safiyanu H, Abioye OP. Comparative study of biodegradation of crude oil in soil amended with chicken droppings and NPK fertilizer. Science World Journal. 2008;3(2):63–67.
10. APHA. Standard Methods for the Examination of Water and Waste Water. 20th ed. APHA-AWWA-WPCF. Washington; DC; 1998.
11. TPI. Technological Partners International analytical manual for total petroleum hydrocarbons and polycyclic aromatic hydrocarbons analyses, Port Harcourt, Nigeria; 2007 Available: www.tpilimited.com
12. Okpokwasili GC, Oton NS. Comparative applications of bioreactor and shake- flask systems in the laboratory treatment of oily sludge. International Journal of Environment and Waste Management 2006;1:49–60.
13. Jones CA, Jacobsen J and Lorbeer S. Metal concentrations in three Montana soils following 20 years of fertilization and cropping. Community of Soil Science and Plant Analysts. 2002;33:1401-1414.
14. Lee MD, Thomas JM, Borden RC, Bedient PB, Ward CH and Wilson JT. Biorestoration of aquifers contaminated with organic compounds. Critical Reviews in Environmental Control. 1988;18:30-89.
15. Zitrides T. Biodecontamination of spill site. Pollution Engineering. 1983;15:25–29.
16. Alexander M. Introduction to Soil Microbiology. 2nd ed. John Wiley and Sons, Inc. New York. 1977;467.
17. Staps SJM. International evaluation of in situ biorestoration of contaminated soil and groundwater. EPA/540/2-90/012; 1990.

Sampson et al.; BMRJ, 15(2): 1-11, 2016; Article no.BMRJ.26027
11
18. Miller RN. A field scale investigation of enhanced petroleum hydrocarbon biodegradation in the vadose zone combing soil venting as an oxygen source with moisture and nutrient additions. Ph.D. Dissertation, Utah State University, Logan, Utah. 1990;45-51.
19. Wibowo R. Bioremediation and fracturing of soil. M.Sc. Thesis, New York Institute of Technology, NY. 1996;32–49.
20. Chikere CB, Okoye AU and Okpokwasili GC. Microbial community profiling of active oleophilic bacterial involved in bioreactor–based crude oil polluted sediment treatment. Journal of Applied and Environmental Microbiology. 2016;4(1): 1–20.
21. Chikere CB. Okpokwasili GC, Ichiakor O. Characterization of hydrocarbon utilizing bacteria in tropical marine sediments. African Journal of Biotechnology. 2009b; 8(1):2541-2544.
22. Chikere CB, Surridge KJ Cloete TE and Okpokwasili GC. Phylogenetic diversity of dominant bacterial communities during bioremediation of crude oil-polluted soil. Ambi-Agua, Taubaté. 2011;6(2):61-76.
23. Chikere CB, Surridge KJ, Cloete TE and Okpokwasili GC. Dynamics of indigenous bacterial communities associated with crude oil degradation in soil microcosms during nutrient-enhanced bioremediation. Waste Management Research. 2012; 30(3):225–236.
_________________________________________________________________________________ © 2016 Sampson et al.; This is an Open Access article distributed under the terms of the Creative Commons Attribution License (http://creativecommons.org/licenses/by/4.0), which permits unrestricted use, distribution, and reproduction in any medium, provided the original work is properly cited.
Peer-review history: The peer review history for this paper can be accessed here:
http://sciencedomain.org/review-history/14866