A Comparative Study of a ¼-scale Gulfstream G550 … · American Institute of Aeronautics and...
15
American Institute of Aeronautics and Astronautics 1 A Comparative Study of a ¼-scale Gulfstream G550 Aircraft Nose Gear Model Nikolas S. Zawodny, 1 Fei Liu, 2 Tarik Yardibi, 3 Louis Cattafesta 4 Florida Center for Advanced Aero-Propulsion Interdisciplinary Microsystems Group University of Florida, Gainesville, FL 32611 Mehdi R. Khorrami, 5 Dan H. Neuhart 6 NASA Langley Research Center Hampton, VA 23681 Thomas Van de Ven 7 Gulfstream Aerospace Corporation Savannah, GA 31407 A series of fluid dynamic and aeroacoustic wind tunnel experiments are performed at the University of Florida Aeroacoustic Flow Facility and the NASA-Langley Basic Aerodynamic Research Tunnel Facility on a high-fidelity ¼-scale model of Gulfstream G550 aircraft nose gear. The primary objectives of this study are to obtain a comprehensive aeroacoustic dataset for a nose landing gear and to provide a clearer understanding of landing gear contributions to overall airframe noise of commercial aircraft during landing configurations. Data measurement and analysis consist of mean and fluctuating model surface pressure, noise source localization maps using a large- aperture microphone directional array, and the determination of far field noise level spectra using a linear array of free field microphones. A total of 24 test runs are performed, consisting of four model assembly configurations, each of which is subjected to three test section speeds, in two different test section orientations. The different model assembly configurations vary in complexity from a fully-dressed to a partially-dressed geometry. The two model orientations provide flyover and sideline views from the perspective of a phased acoustic array for noise source localization via beamforming. Results show that the torque arm section of the model exhibits the highest rms pressures for all model configurations, which is also evidenced in the sideline view noise source maps for the partially-dressed model geometries. Analysis of acoustic spectra data from the linear array microphones shows a slight decrease in sound pressure levels at mid to high frequencies for the partially-dressed cavity open model configuration. In addition, far field sound pressure level spectra scale approximately with the 6 th power of velocity and do not exhibit traditional Strouhal number scaling behavior. I. Introduction N recent years, landing gear have been identified as major components of airframe noise during approach and landing for commercial aircraft. They are the least studied and understood contributors of airframe noise, mostly due to complex flow patterns associated with intricate gear component geometries. Nose landing gear is of primary interest due to the fact that it has been shown to be a prominent noise source 1 and is more amenable than the main landing gear to scaled wind tunnel testing. Previous studies have emphasized the importance of 1 Graduate Research Assistant, MAE Department, P.O. Box 116250, Student Member AIAA 2 Post-Doctoral Associate, MAE Department, P.O. Box 116250, Member AIAA 3 Graduate Research Assistant, ECE Department, P.O. Box 116200, Student Member AIAA 4 Professor, MAE Department, P.O. Box 116250, Associate Fellow AIAA, [email protected] 5 Research Engineer, Computational AeroSciences Branch, MS 128, Associate Fellow AIAA 6 Research Engineer, Flow Physics and Control Branch, MS 170 7 Senior Acoustics Engineer, Acoustics & Vibration Group, Member AIAA I https://ntrs.nasa.gov/search.jsp?R=20090020451 2018-09-06T20:50:39+00:00Z
Transcript of A Comparative Study of a ¼-scale Gulfstream G550 … · American Institute of Aeronautics and...

American Institute of Aeronautics and Astronautics
1
A Comparative Study of a ¼-scale Gulfstream G550
Aircraft Nose Gear Model
Nikolas S. Zawodny,
1 Fei Liu,
2 Tarik Yardibi,
3 Louis Cattafesta
4
Florida Center for Advanced Aero-Propulsion
Interdisciplinary Microsystems Group
University of Florida, Gainesville, FL 32611
Mehdi R. Khorrami,5 Dan H. Neuhart
6
NASA Langley Research Center
Hampton, VA 23681
Thomas Van de Ven7
Gulfstream Aerospace Corporation
Savannah, GA 31407
A series of fluid dynamic and aeroacoustic wind tunnel experiments are performed at
the University of Florida Aeroacoustic Flow Facility and the NASA-Langley Basic
Aerodynamic Research Tunnel Facility on a high-fidelity ¼-scale model of Gulfstream
G550 aircraft nose gear. The primary objectives of this study are to obtain a
comprehensive aeroacoustic dataset for a nose landing gear and to provide a clearer
understanding of landing gear contributions to overall airframe noise of commercial
aircraft during landing configurations. Data measurement and analysis consist of mean
and fluctuating model surface pressure, noise source localization maps using a large-
aperture microphone directional array, and the determination of far field noise level
spectra using a linear array of free field microphones. A total of 24 test runs are
performed, consisting of four model assembly configurations, each of which is subjected
to three test section speeds, in two different test section orientations. The different model
assembly configurations vary in complexity from a fully-dressed to a partially-dressed
geometry. The two model orientations provide flyover and sideline views from the
perspective of a phased acoustic array for noise source localization via beamforming.
Results show that the torque arm section of the model exhibits the highest rms pressures
for all model configurations, which is also evidenced in the sideline view noise source
maps for the partially-dressed model geometries. Analysis of acoustic spectra data from
the linear array microphones shows a slight decrease in sound pressure levels at mid to
high frequencies for the partially-dressed cavity open model configuration. In addition,
far field sound pressure level spectra scale approximately with the 6th
power of velocity
and do not exhibit traditional Strouhal number scaling behavior.
I. Introduction
N recent years, landing gear have been identified as major components of airframe noise during approach and
landing for commercial aircraft. They are the least studied and understood contributors of airframe noise,
mostly due to complex flow patterns associated with intricate gear component geometries. Nose landing gear is
of primary interest due to the fact that it has been shown to be a prominent noise source1 and is more amenable
than the main landing gear to scaled wind tunnel testing. Previous studies have emphasized the importance of
1 Graduate Research Assistant, MAE Department, P.O. Box 116250, Student Member AIAA
2 Post-Doctoral Associate, MAE Department, P.O. Box 116250, Member AIAA
3 Graduate Research Assistant, ECE Department, P.O. Box 116200, Student Member AIAA
4 Professor, MAE Department, P.O. Box 116250, Associate Fellow AIAA, [email protected]
5 Research Engineer, Computational AeroSciences Branch, MS 128, Associate Fellow AIAA
6 Research Engineer, Flow Physics and Control Branch, MS 170
7 Senior Acoustics Engineer, Acoustics & Vibration Group, Member AIAA
I
https://ntrs.nasa.gov/search.jsp?R=20090020451 2018-09-06T20:50:39+00:00Z
American Institute of Aeronautics and Astronautics
2
fine structural details present in the actual gear assembly, as these have been found to contribute to higher
frequency noise.2,3
This implies that reduced-scale testing of such components must be done with high-fidelity
models to ensure that accurate analysis of noise source contributions can be made over as broad a frequency
range as possible.
One subject of great interest in the examination of landing gear noise has been the scaling of far field noise
levels with flow speed. Past studies have shown that noise generation due to low Mach number flows over solid
bodies typically scales with the 6th
power of velocity.1,3,4
This scaling has been shown to hold for landing gear at
low- and mid-frequency ranges where the sources can be considered to be acoustically compact, exhibiting the
radiation behavior of a dipole source.3 At high frequencies, however, the compactness of the sources diminishes
as acoustic wavelength becomes comparable with the dimensions of the gear components. As the various gear
components begin to act as reflective sources, the radiation efficiencies of the sources degrade from dipole- to
“quadrupole-like” scaling with the 7th
power of velocity.3 An investigation of these trends is one of the topics
addressed in this paper.
In addition to the scaling of the far field noise levels, localization of gear noise sources has become important
in an attempt to implement acoustic treatments to mitigate them. Noise source localization is achieved through
the process of beamforming via a planar acoustic array of multiple microphones, in which the focal point of the
array is electronically steered through space to identify the spatial regions with dominant sound radiation. While
numerous beamforming algorithms have been developed and implemented for aeroacoustic applications, most
operate with the assumption that the sound sources under investigation can be modeled as a distribution of
incoherent monopoles. Deviations from these assumptions limit the accuracy of the array estimates.5 The most
common and simplest algorithm is the Delay-and-Sum (DAS) beamformer which, as the name implies, consists
of the summation of delayed and weighted versions of each microphone signal. Through this process, source
signals in spatial regions of interest are strengthened while signals from other regions are deemphasized. The
major drawback to this standard method is poor resolution at lower frequencies and high sidelobe levels.
Improvements to DAS include the Standard and Robust Capon beamformers (SCB and RCB respectively),
which yield higher resolution and lower sidelobe levels via near-optimal suppression.6 Other more complex, but
resource intensive algorithms such as the Deconvolution Approach for the Mapping of Acoustic Sources
(DAMAS),7 Sparsity-Constrained DAMAS (SC-DAMAS) and Covariance Matrix Fitting (CMF),
8 and CLEAN
based on spatial coherence (CLEAN-SC)9 have improved on the deficiencies of DAS. As a preliminary step,
DAS and RCB algorithms are employed in this study.
The platform of the experiments is a high-fidelity ¼-scale model of a Gulfstream G550 aircraft nose landing
gear. This study spans two sets of experiments in the open-jet University of Florida Aeroacoustic Flow Facility
(UFAFF). For the first entry, mean and fluctuating surface pressure data are acquired and compared with the
comprehensive aerodynamic measurements acquired in NASA Langley’s Basic Aerodynamic Research Tunnel
(BART).10
This comparison serves to highlight any inherent differences that may exist between aerodynamic
measurements obtained in an open-jet facility to those obtained in a conventional closed-wall tunnel. The second
entry focuses on aeroacoustic measurements of “benchmark” model configurations, ranging from a fully-dressed
model to a partially-dressed model, in order to determine the contribution of specific gear components to the far
field sound. These experiments are part of an ongoing collaborative effort between NASA Langley Research
Center, Gulfstream Aerospace Corporation, and the University of Florida to conduct detailed aeroacoustic
measurements of a nose landing gear in order to gain a clearer understanding of the contributions of aircraft
landing gear to overall airframe noise during aircraft approach and landing.
II. Experimental Approach
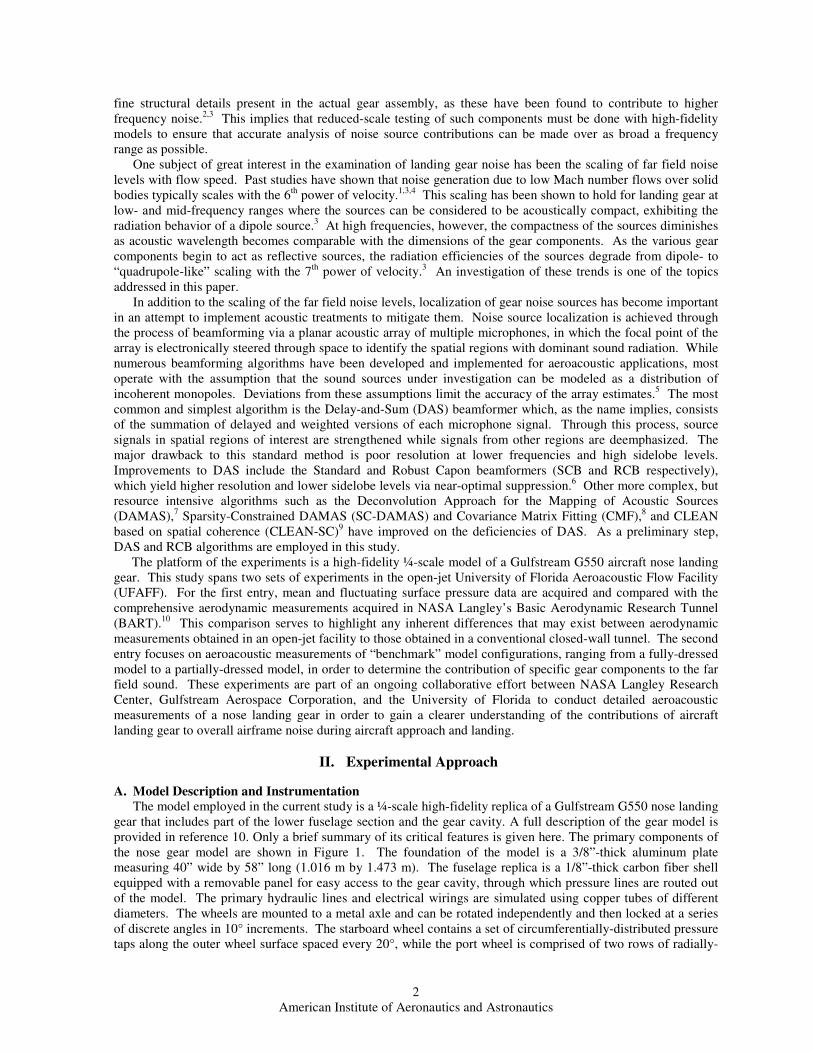
A. Model Description and Instrumentation
The model employed in the current study is a ¼-scale high-fidelity replica of a Gulfstream G550 nose landing
gear that includes part of the lower fuselage section and the gear cavity. A full description of the gear model is
provided in reference 10. Only a brief summary of its critical features is given here. The primary components of
the nose gear model are shown in Figure 1. The foundation of the model is a 3/8”-thick aluminum plate
measuring 40” wide by 58” long (1.016 m by 1.473 m). The fuselage replica is a 1/8”-thick carbon fiber shell
equipped with a removable panel for easy access to the gear cavity, through which pressure lines are routed out
of the model. The primary hydraulic lines and electrical wirings are simulated using copper tubes of different
diameters. The wheels are mounted to a metal axle and can be rotated independently and then locked at a series
of discrete angles in 10° increments. The starboard wheel contains a set of circumferentially-distributed pressure
taps along the outer wheel surface spaced every 20°, while the port wheel is comprised of two rows of radially-

Amer
distributed pressure taps. The more intricate components of the gear assembly, such as the steering mechanism
and light cluster, are made of a polycarbonate material and secured about the main shaft of the model via small
threaded screws. In Figure 1, the nose gear model is oriented in a ceiling arrangement where the gear plate is
suspended from the upper rails of the UFAFF test section.
Figure 1. Primary components of fullymodel installation. (Exposed
There are 126 pressure taps for steady pressure measurements and 16 flush
transducers located strategically on the primary components of the gear. The unsteady pressure transducers on
the nose gear are Model LQ-12-062
pressure lines are routed through the cavity of the mod
used as a reference pressure for all pressure transducers. The Kulite locations are summarized in
Kulites are powered through a parallel
pressure range of ± 1.0 psi differential (PSID).
Table 1
Kulite
Channel
1 Cavity floor
2 Cavity back wall
3 Door (lower starboard side)
4 Door (lower port side)
5 Drag brace (lower)
6 Light system
7 Starboard wheel hub
8 Drag brace (upper)
9 Steering mechanism (front side)
10 Door (upper, near cavity)
11 Steering mechanism (back side)
12 Main strut
13 Starboard wheel (exterior)
14 Wheel axle
15 Upper torque arm
16 Mobile transducer (cavity back wall)
Wheels
Steering
Mechanism
Hydraulic
Lines
Shock Strut
(Piston)Torque
Arm
erican Institute of Aeronautics and Astronautics
3
distributed pressure taps. The more intricate components of the gear assembly, such as the steering mechanism
and light cluster, are made of a polycarbonate material and secured about the main shaft of the model via small
, the nose gear model is oriented in a ceiling arrangement where the gear plate is
suspended from the upper rails of the UFAFF test section.
. Primary components of fully-dressed nose gear model in the UFAFF shown during
Exposed reflective surfaces are acoustically treated during testing
There are 126 pressure taps for steady pressure measurements and 16 flush-mounted unsteady pressure
strategically on the primary components of the gear. The unsteady pressure transducers on
062-2D Kulites. The steady pressure lines and Kulite electrical and reference
pressure lines are routed through the cavity of the model out of the test section. The ambient tunnel pressure is
used as a reference pressure for all pressure transducers. The Kulite locations are summarized in
Kulites are powered through a parallel-circuit “patch panel” using a 10 V dc power supply, yielding a rated
pressure range of ± 1.0 psi differential (PSID).
1. Kulite channel locations on nose gear model.
Location on Model
Cavity floor
Cavity back wall
Door (lower starboard side)
Door (lower port side)
Drag brace (lower)
Light system
Starboard wheel hub
Drag brace (upper)
Steering mechanism (front side)
Door (upper, near cavity)
Steering mechanism (back side)
Main strut
Starboard wheel (exterior)
Wheel axle
Upper torque arm
Mobile transducer (cavity back wall)
Fuselage Door
Flow Direction
Steering
Mechanism
Shock Strut
(Piston)
distributed pressure taps. The more intricate components of the gear assembly, such as the steering mechanism
and light cluster, are made of a polycarbonate material and secured about the main shaft of the model via small
, the nose gear model is oriented in a ceiling arrangement where the gear plate is
nose gear model in the UFAFF shown during
surfaces are acoustically treated during testing.)
mounted unsteady pressure
strategically on the primary components of the gear. The unsteady pressure transducers on
2D Kulites. The steady pressure lines and Kulite electrical and reference
el out of the test section. The ambient tunnel pressure is
used as a reference pressure for all pressure transducers. The Kulite locations are summarized in Table 1. The
circuit “patch panel” using a 10 V dc power supply, yielding a rated
Lights
Flow Direction

Amer
B. Facilities
The UFAFF is a low-noise, open
acoustic wind tunnel with a cross
29” high by 44” wide by 72” long (0.737 m by
1.118 m by 1.83 m) installed in an ISO 3745
certified 100 Hz anechoic chamber. The inner
walls, floor, and ceiling of the aeroacoustic
chamber are populated with 36” (0.914 m)
acoustic wedges. The floor of the test section
is also populated with acoustic wedges
measuring 11.75” (0.298 m) tall. The
test section is bounded by an aluminum
test stand, within which aerodynamic models
and acoustic foam sidewalls may be installed.
The maximum empty test section velocity is
approximately 75 m/s. The maximum
tunnel velocity with the nose gear model
installed is 66 m/s, corresponding to
number of M = 0.189. A schematic of the
wind tunnel is shown in Figure 2.
Unlike the UFAFF, the BART Facility located
conventional open-return wind tunnel with a rigid
flow fields and to validate computational fluid d
by 40” (0.711 m by 1.016 m) with a length of 120” (3.048 m). The maximum flow velocity in the empty test
section is approximately 67 m/s. The similar test section cross
minimize installation issues that can
collaborative experiments.
C. Instrumentation and Data Acquisition
C.1 Atmospheric and Flow PropertiesPrior to each set of experiments, the atmospheric
the UFAFF are determined. With the nose gear model installed,
the wind tunnel is run at the desired flow speeds
pressure, temperature, and relative humidity
atmospheric data is acquired by
conditions at a nearby building. Tunnel speed
a deployable pitot static probe installed
the centerline of the wheels, and 12 inches (0.305 m)
of the inlet trailing edge (see Figure
atmospheric data previously mentioned
of a local isentropic speed of sound, and thus the Mach number.
C.2 Phased and Linear ArraysUniversity of Florida’s large aperture microphone directional array
consisting of 90 Panasonic WM-61A electret microphones flush
aluminum plate located 48" (1.22 m) belo
two nested, logarithmic-spaced spiral patterns
range of interest (discussed later).12
array with 63 elements. The two nested
of the LAMDA. For this study, data
improved resolution at lower frequencies. For the outer array, there are nine total spiral arms, each of which
contains 7 microphone elements with an outer array microphone diameter of 44” (
erican Institute of Aeronautics and Astronautics
4
noise, open-jet
wind tunnel with a cross-section of
(0.737 m by
an ISO 3745-
. The inner
walls, floor, and ceiling of the aeroacoustic
chamber are populated with 36” (0.914 m)-tall
The floor of the test section
is also populated with acoustic wedges
The open-jet
ounded by an aluminum-frame
test stand, within which aerodynamic models
and acoustic foam sidewalls may be installed.
The maximum empty test section velocity is
maximum safe
tunnel velocity with the nose gear model
corresponding to a Mach
A schematic of the
Unlike the UFAFF, the BART Facility located at NASA-Langley is not an aeroacoustic facility but rather a
tunnel with a rigid-wall test section used to investigate characteristics of complex
computational fluid dynamics (CFD) methods.11
Its test section dimensions are 28”
by 40” (0.711 m by 1.016 m) with a length of 120” (3.048 m). The maximum flow velocity in the empty test
The similar test section cross-sectional dimensions of the two f
can occur with a trans-facility model, making them good candidates for
Data Acquisition
C.1 Atmospheric and Flow Properties s, the atmospheric properties of
determined. With the nose gear model installed,
run at the desired flow speeds, and ambient
relative humidity are measured. This
by monitoring local weather
building. Tunnel speed is measured using
c probe installed 6 inches (0.152 m) below
12 inches (0.305 m) downstream
Figure 3). This data, coupled with
data previously mentioned, allows the computation
of a local isentropic speed of sound, and thus the Mach number.
Phased and Linear Arrays aperture microphone directional array (LAMDA) is a phased acoustic array
61A electret microphones flush-mounted in a ¼”-thick, 72” (1.829 m) diameter
located 48" (1.22 m) below the centerline of the test section. The microphones are
spiral patterns, which provide good sidelobe characteristics within the frequency 12
The nested patterns consist of an inner array with 45 elements
nested arrays share 18 microphones. Figure 4 shows the microphone
of the LAMDA. For this study, data is collected using the outer LAMDA so as to allow beamforming with
lower frequencies. For the outer array, there are nine total spiral arms, each of which
contains 7 microphone elements with an outer array microphone diameter of 44” (1.118 m).
Figure 2. Schematic of the UFAFF.
Figure 3. Installation o
probe for flow speed measurements.
Flow
72”
Langley is not an aeroacoustic facility but rather a
characteristics of complex
Its test section dimensions are 28”
by 40” (0.711 m by 1.016 m) with a length of 120” (3.048 m). The maximum flow velocity in the empty test
of the two flow facilities
them good candidates for
LAMDA) is a phased acoustic array
thick, 72” (1.829 m) diameter
The microphones are oriented in
characteristics within the frequency
45 elements and an outer
shows the microphone locations
collected using the outer LAMDA so as to allow beamforming with
lower frequencies. For the outer array, there are nine total spiral arms, each of which
UFAFF.
. Installation of pitot static
flow speed measurements.
72”

Amer
Beamforming is performed
while the nose gear model is
mounted within the UFAFF
test section in both flyover and
sideline orientations (Figure 6).
Due to the size of the array
plate, along with associated
microphone circuitry and
wiring, it is infeasible to rotate
the array for both flyover and
sideline views. Therefore, the
landing gear model itself is
rotated in the test section.
While the flyover perspective
from the LAMDA is
considered more relevant to
airframe noise quantification, a sideline view of the landing gear for beamforming provides a better unobstructed
view of the different potential noise sources. Only sideline beamforming plots
Figure 4. Microphone distribution of the
LAMDA.
(a)
Figure 5. (a) 3-dB Beamwidth of outer LAMDA as a function of frequency, (b) PSF of outer LAMDA at
a frequency of F = 2 kHz.
Figure
orientation, (b) sideline orientation.
erican Institute of Aeronautics and Astronautics
5
Calibration of the electret microphones
individual basis. Each microphone is flush
side with a 1/8”-diameter Brüel & Kjaer Type 4138 pressure
field microphone at the end of a plane wave tube and
periodic random noise. Microphone sensitivities
computed up to the tube cut-on frequency of
study, calibration of the LAMDA is performed using
array calibration technique described in reference
To quantify the performance of the outer LAMDA at lower
frequencies, the spatial selectivity of the array
computing the 3-dB beamwidth as a function of frequency
(Figure 5a). Note that the reference height of the “source” used
in the computation is typical of that of a model mounted in the
UFAFF test section. The point spread function (PSF) of the
array and several array beamwidths denoted by contour lines at
a frequency of 2 kHz are shown in Figure
qualitative representation of the array’s performance.
se quantification, a sideline view of the landing gear for beamforming provides a better unobstructed
view of the different potential noise sources. Only sideline beamforming plots are shown in this paper.
Microphone distribution of the
(b)
Beamwidth of outer LAMDA as a function of frequency, (b) PSF of outer LAMDA at
(a)
Figure 6. Test section configuration for beamforming in (a) flyover
orientation, (b) sideline orientation.
LAMDA
LAMDA Flow
D = 72”
Nose Gear
Model
is performed on an
flush-mounted side-by-
Brüel & Kjaer Type 4138 pressure-
a plane wave tube and excited by
noise. Microphone sensitivities are then
frequency of 6.72 kHz. For this
performed using a group
array calibration technique described in reference 13.
To quantify the performance of the outer LAMDA at lower
the spatial selectivity of the array is determined by
dB beamwidth as a function of frequency
Note that the reference height of the “source” used
in the computation is typical of that of a model mounted in the
function (PSF) of the
eamwidths denoted by contour lines at
Figure 5(b) to provide a
ation of the array’s performance.
se quantification, a sideline view of the landing gear for beamforming provides a better unobstructed
shown in this paper.
Beamwidth of outer LAMDA as a function of frequency, (b) PSF of outer LAMDA at
(b)
. Test section configuration for beamforming in (a) flyover
Flow
LAMDA

Amer
layer develops along the length of the test section. Sound that propagates from a model in the test section
refracted as it passes through this shear layer before it reaches the
corrections (SLCs) are performed as outlined by Amiet
illustrating the SLC terminology as applied to the linear array is provided in
represent the measured source-to-
represent the effective source-to-microphone distances and corrected radiation angles
the quantities h and Z denote the source
the far field microphones, respectively.
of the nose gear model is denoted as the nominal “source” location
source location via beamforming.
D. Testing Conditions
For the first phase of this study, steady and unsteady model surface pressure data
phase, data is acquired at two flow speeds corresponding to those run at the BART facility.
consists of repeated unsteady pressure data r
array. For this phase, a third flow speed of
more closely correspond with actual landing speeds encountered by the Gulfstream G550
the test matrices of the two tunnel entry phases.
Table 2. Test matrix for
Figure 7. Schematic of linear array configuration for
measuring flyover far field noise levels of the nose
gear model with SLC Terminology.
Orientation DAQ
Flyover Mean Cp
Kulites
Flyover Outer LAMDA
Linear Array
Kulites
Sideline Outer LAMDA
Kulites
erican Institute of Aeronautics and Astronautics
6
A linear array of omni-directional
microphones is used to acquire the
level spectra along the length of the UFAFF test
section. It consists of 11 of the same electret
microphones used to populate the LAMDA. Each
microphone is flush-mounted at the top of an
aluminum tube measuring 6” (0.152 m),
microphones are covered with a windscreen. The
microphone tubes stem from an acoustically
treated rail running along the bottom of the te
section with a spacing of 7” (0.178 m)
7). The total range of geometric radiation angles
spanned by the linear array is approximately
θm ≤ 122° as referenced from the
of the model in the downstream direction.
linear array is situated along the length of t
section and positioned directly underneath the
centerline of the gear model, with the plane of the
microphones located approximately 28” (0.711 m)
below the bottom inlet plane, or 42" (1.07 m)
below the test section centerline (see
Since the UFAFF is an open
layer develops along the length of the test section. Sound that propagates from a model in the test section
as it passes through this shear layer before it reaches the far field. Therefore, standard
performed as outlined by Amiet14
for both the linear array and LAMDA. A schematic
illustrating the SLC terminology as applied to the linear array is provided in Figure 7. The quantities
-microphone distances and radiation angles respectively, while
microphone distances and corrected radiation angles, respectively
denote the source-to-shear layer distance and the distance from the source to the plane of
respectively. Note that in this figure, a region corresponding to the upper torque arm
of the nose gear model is denoted as the nominal “source” location, since this location is found to be the primary
For the first phase of this study, steady and unsteady model surface pressure data are
acquired at two flow speeds corresponding to those run at the BART facility.
of repeated unsteady pressure data runs, with acoustic measurements using the LAMDA and the linear
phase, a third flow speed of M = 0.189 is added to extract the appropriate scaling laws and
more closely correspond with actual landing speeds encountered by the Gulfstream G550 aircraft.
o tunnel entry phases.
. Test matrix for first and second phases of nose gear model UFAFF entry.
. Schematic of linear array configuration for
noise levels of the nose
gear model with SLC Terminology.
Assembly Config. Flow Speed
Fully-dressed, cavity open
Hydraulic lines OFF, cavity open
Hydraulic lines, lights OFF, cavity open
Hydraulic lines, lights, steering OFF, cavity closed
Fully-dressed, cavity open
Hydraulic lines OFF, cavity open
Hydraulic lines, lights OFF, cavity open
Hydraulic lines, lights, steering OFF, cavity closed
Hydraulic lines, lights, steering OFF, cavity closed
Hydraulic lines, lights, steering OFF, cavity open
Fully-dressed, cavity open
directional free field
to acquire the far field noise
level spectra along the length of the UFAFF test
section. It consists of 11 of the same electret
used to populate the LAMDA. Each
mounted at the top of an
tube measuring 6” (0.152 m), and the
covered with a windscreen. The
microphone tubes stem from an acoustically
treated rail running along the bottom of the test
7” (0.178 m) (see Figure
The total range of geometric radiation angles
approximately 47° ≤
122° as referenced from the upper torque arm
of the model in the downstream direction. The
linear array is situated along the length of the test
section and positioned directly underneath the
centerline of the gear model, with the plane of the
microphones located approximately 28” (0.711 m)
below the bottom inlet plane, or 42" (1.07 m)
below the test section centerline (see Figure 7).
Since the UFAFF is an open-jet facility, a shear
layer develops along the length of the test section. Sound that propagates from a model in the test section is
standard shear layer
for both the linear array and LAMDA. A schematic
. The quantities Rm and θm
microphone distances and radiation angles respectively, while Re and θc
respectively. In addition,
shear layer distance and the distance from the source to the plane of
, a region corresponding to the upper torque arm
found to be the primary
are acquired. For this
acquired at two flow speeds corresponding to those run at the BART facility. The second phase
using the LAMDA and the linear
to extract the appropriate scaling laws and to
aircraft. Table 2 shows
of nose gear model UFAFF entry.
Flow Speed (Mach #)
0.145, 0.166
0.145, 0.166
0.145, 0.166
0.145, 0.166
0.145, 0.166, 0.189
0.145, 0.166
0.145, 0.166
0.145, 0.166, 0.189
0.145, 0.166, 0.189
0.145, 0.166, 0.189
0.145, 0.166, 0.189

American Institute of Aeronautics and Astronautics
7
III. Data Acquisition Parameters
For unsteady data acquisition in the UFAFF, a National Instruments PXI-1045 chassis equipped with 17 NI
PXI-4462 DAQ cards is used, yielding a total of 68 available channels. The sampling parameters for both Kulite
and microphone data acquisition using the PXI are summarized in Table 3. Note that εr denotes the normalized
autospectral random uncertainty. A useful feature of the PXI module is its ability to provide dc current
excitation to the electret microphones. This feature is utilized for the microphone circuits used in the LAMDA
and linear array, serving as a 4 mA dc current source for all microphone channels. The circuitry for the electret
microphones consist of the microphone leads connected in parallel with a BNC connector and a 3.74-kΩ
resistance to convert the 4 mA dc current into a voltage excitation. The circuitry resulted in an average electret
microphone sensitivity of 30 mV/Pa.
Table 3. Sampling parameters used for transducer data acquisition.
IV. Results The following results
compare aerodynamic and
acoustic data between the
principal benchmark
landing gear assembly
configurations: fully-
dressed cavity open
(FDCO) and partially-
dressed cavity closed
(PDCC) model (Figure 8).
In addition, a third model
configuration is considered
for the second phase of
experiments, consisting of
the model in a partially-
dressed cavity open (PDCO) configuration. This configuration combined with the cavity-closed case is
important since it can potentially demonstrate the effect the cavity has on the overall acoustic signature of the
nose gear model. Recall that the steering mechanism, hydraulic and electrical lines, and light system are the
components removed for the partially-dressed model configurations (Figure 1, Table 2).
A. Verification of Aerodynamic Trends A series of aerodynamic experiments performed on the
nose gear model during the first entry into the UFAFF are
used to compare the results with those from BART. Two
regions of particular interest on the nose gear model in
regard to mean pressure coefficient (Cp) data are the door
and the wheels. Figure 9 shows the nose gear door as well
as a schematic of the door pressure tap distribution.
Figures 10 and 11 compare the Cp distributions on the gear
door and starboard wheel obtained in the UFAFF and
BART test runs, respectively. The testing conditions for
this comparison are the PDCC case and a test section speed
of M = 0.166 (U∞ = 57.4 m/s). As Figures 10 and 11 show,
despite a nearly constant offset in the Cp values, the trends
of the data between the two tunnels are very similar.
Transducer Sampling
Rate (Hz)
Samples/block Window
Function
Overlap
(%)
Nblocks Naverages
(effective)
εr
(%)
Acqusition
Time (sec.)
Kulite 51,200 16384 Hanning 0 100 100 10 32
WM-61A 65,536 2048 Hanning 75 320 664 3.9 10
(a)
(b)
(c)
Figure 8. Model configurations: (a) fully-dressed cavity open (FDCO), (b)
partially-dressed cavity closed (PDCC), and (c) partially-dressed cavity open
(PDCO).
(a) (b)
Figure 9. (a) Image of nose gear door, (b)
visualization of door pressure tap distribution.
Flow

Amer
(a)
Figure 10. Comparison of gear door (PDCC, M = 0.166)
The Kulite power spectral densities (PSDs) and root
square (rms) Cp values are also compared between the two
facilities. Figure 13 shows two comparison plots of Kulite
values, one for each benchmark model configuration at a tunnel
flow speed of M = 0.166. Note that Kulites 2, 6, and 12
not functional or not present on the model.
Figure 13(a), there are some deviations f
between BART and UFAFF. This is believed to be mainly due to
different routing paths of the Kulite reference pressure lines along
the model. This is especially apparent for Kulite #15, which is
located on the torque link mechanis
other Kulite Cp,rms deviations between the two facilities are
reduced for the PDCC case, the difference
increases from ∆Cp,rms = 0.03 to 0.08
noting is how in going from the FDCO
the Cp for this Kulite slightly decreases as
versus an increase as recorded at the UFAFF.
difference in Cp,rms occurs for Kulite
with ∆Cp,rms = 0.03. This difference vanishes in the
(a) Figure 11. (a) Profile view of starboard wheel (angular coordinate system), (b) Angular
distribution comparison between UFAFF and BART test runs.
180 deg.
θ
erican Institute of Aeronautics and Astronautics
8
(b)
. Comparison of gear door Cp distribution between (a) BART, (b) UFAFF
ulite power spectral densities (PSDs) and root-mean-
also compared between the two
shows two comparison plots of Kulite Cp,rms
values, one for each benchmark model configuration at a tunnel
= 0.166. Note that Kulites 2, 6, and 12 are either
not functional or not present on the model. As can be seen in
(a), there are some deviations for a few Kulite channels
between BART and UFAFF. This is believed to be mainly due to
different routing paths of the Kulite reference pressure lines along
the model. This is especially apparent for Kulite #15, which is
located on the torque link mechanism (see Figure 12). While the
deviations between the two facilities are
the difference for Kulite #15 actually
= 0.03 to 0.08. Another feature worth
in going from the FDCO to the PDCC geometry,
for this Kulite slightly decreases as recorded at BART
increase as recorded at the UFAFF. The next largest
occurs for Kulite #5 in the FDCO test case,
This difference vanishes in the PDCC case.
(b)
(a) Profile view of starboard wheel (angular coordinate system), (b) Angular
distribution comparison between UFAFF and BART test runs. (PDCC, M = 0.166)
Figure 12. Location
arm Kulite relative to
strut).
Kulite #15
Flow
0 deg.
θ
BART, (b) UFAFF.
(a) Profile view of starboard wheel (angular coordinate system), (b) Angular Cp
Location of upper torque
to gear piston (shock
American Institute of Aeronautics and Astronautics
9
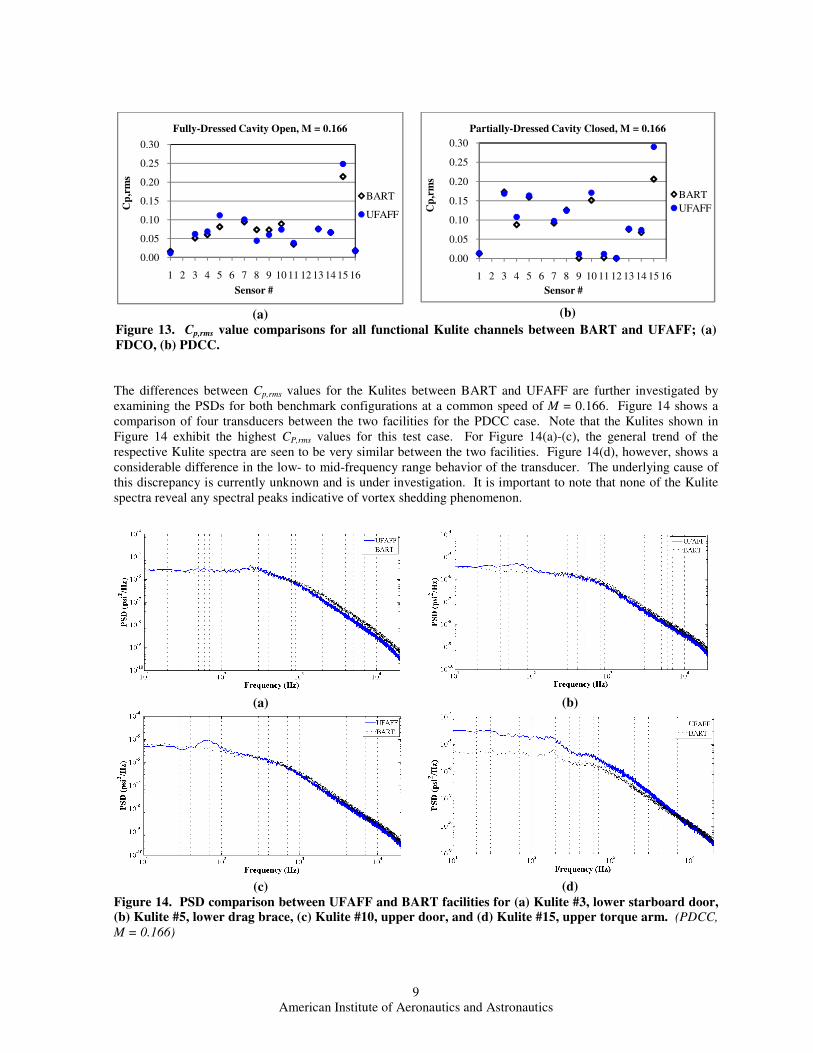
The differences between Cp,rms values for the Kulites between BART and UFAFF are further investigated by
examining the PSDs for both benchmark configurations at a common speed of M = 0.166. Figure 14 shows a
comparison of four transducers between the two facilities for the PDCC case. Note that the Kulites shown in
Figure 14 exhibit the highest CP,rms values for this test case. For Figure 14(a)-(c), the general trend of the
respective Kulite spectra are seen to be very similar between the two facilities. Figure 14(d), however, shows a
considerable difference in the low- to mid-frequency range behavior of the transducer. The underlying cause of
this discrepancy is currently unknown and is under investigation. It is important to note that none of the Kulite
spectra reveal any spectral peaks indicative of vortex shedding phenomenon.
(a)
(b)
Figure 13. Cp,rms value comparisons for all functional Kulite channels between BART and UFAFF; (a)
FDCO, (b) PDCC.
(a)
(b)
(c)
(d)
Figure 14. PSD comparison between UFAFF and BART facilities for (a) Kulite #3, lower starboard door, (b) Kulite #5, lower drag brace, (c) Kulite #10, upper door, and (d) Kulite #15, upper torque arm. (PDCC,
M = 0.166)
0.00
0.05
0.10
0.15
0.20
0.25
0.30
1 2 3 4 5 6 7 8 9 10 11 12 13 14 15 16
Cp
,rm
s
Sensor #
Fully-Dressed Cavity Open, M = 0.166
BART
UFAFF
0.00
0.05
0.10
0.15
0.20
0.25
0.30
1 2 3 4 5 6 7 8 9 10 11 12 13 14 15 16
Cp
,rm
s
Sensor #
Partially-Dressed Cavity Closed, M = 0.166
BART
UFAFF

American Institute of Aeronautics and Astronautics
10
B. Aeroacoustic Analysis
For the aeroacoustic testing, far field spectra are examined to isolate interesting spectral features of the nose
gear model for the different model configurations. Beamforming is then performed at these frequencies to locate
regions on the model that are most responsible for noise generation.
B.1 Noise Source Localization As shown in Figure 7, linear array microphone #7
is located almost directly below the upper torque arm
Kulite. It is therefore the focus of the following
analysis due to its “flyover” location. Both narrow-
band and 1/3rd
octave band weighted spectra
computed from the raw microphone data for the three
model configurations are shown in Figure 15.
Spectra below F = 300 Hz are not presented since the
distance from the source to the microphone is less
than one acoustic wavelength. From Figure 15, the
PDCC case exhibits higher sound pressure levels
(SPLs) at lower frequencies (300 Hz < F < 1 kHz)
and slightly lower SPLs at certain higher frequencies
(6 kHz < F < 10 kHz) when compared to the FDCO
case. Even more noteworthy is the PDCO case,
which is seen to exhibit power levels lower than the
other configurations at all frequencies above 1 kHz.
Due to the fact that closing the cavity suppresses the
interactions between the cavity and the gear flow
fields, the contributions of the removable gear
components to the acoustic signature of the model is
better assessed through direct comparison of the
FDCO and PDCO configurations. Furthermore, since
the gear components removed consist of geometries
with multiple length scales, the measured SPL should
decrease across a broad range of frequencies.
Focusing attention on Figure 15(b), the 1/3rd
octave
spectra shows common tonal peaks at F = 1.25 and
2.5 kHz between the three configurations. From this
behavior, it is initially assumed that the physical
sources of these respective spectral peaks are
common to the configurations. Sideline beamforming is then conducted at these tonal frequencies to a height
corresponding to the central midplane of the model. Due to the higher resolution and reduced sidelobe levels
associated with the Capon beamformers – specifically, the RCB – it is the primary algorithm used in this initial
analysis. For example, Figure 16 shows a comparison of noise source localization plots between the DAS, SCB,
and RCB algorithms at a frequency of F = 1.25 kHz for the FDCO configuration at a flow speed of M = 0.166.
As the figure shows, the RCB algorithm outputs a much cleaner noise source localization plot, indicative of its
higher resolution and robust nature. Note that all beamforming plots will be displayed in 1/3rd
octave bands.
(a)
(b)
Figure 15. (a) Narrow-band and (b) 1/3rd
octave
band spectra comparisons between model configurations at M = 0.166. (Linear array
microphone #7)
5 dB
2 dB

American Institute of Aeronautics and Astronautics
11
Beamforming comparisons are then conducted between the three configurations for 1/3rd
octave band
frequencies of F = 1.25, 2.5, 4, 5, and 8 kHz. The three highest frequencies of 4, 5, and 8 kHz are chosen to
gauge the higher-frequency performance of the RCB algorithm and determine the primary differences between
the model configurations in terms of dominant noise sources. Figure 17 shows a series of relative scale
beamforming maps at the previously mentioned frequencies for the three model configurations at a flow speed of
M = 0.166. The beamforming maps are normalized relative to the respective peaks in each case.
From Figure 17(a)-(c), the general trend seems to be that the region of dominant noise generation corresponds
to the wheels/axle at a frequency of F = 1.25 kHz. One interesting feature to note is how the source appears to
become more localized in going from one configuration to the next. The trend is even seen to continue in
comparing the cases of partially-dressed with closed versus open cavity configurations. The more localized
source distribution for the PDCO case implies that the closed cavity can act as a reflective surface, effectively
“smearing” the source distribution. It is also possible that the closed cavity may produce local flow accelerations
and thus stronger acoustic sources. This effect is more evident in the FDCO case, possibly due to the presence of
the additional gear components, such as the lights and steering mechanism. From Figure 1 it can be seen that
these are fairly large in scale and can be noise source contributors within this frequency range. At a frequency of
F = 2.5 kHz, the dominant source shifts away from the wheels and migrates upward, as can be seen in Figure 17
(d)-(f). For the FDCO case, the source distribution is smeared along the main strut region starting at the upper
torque arm. This smearing effect appears to become mitigated with the removal of the complex components, as
seen by cases (e) and (f). For these configurations, the torque link appears to be the dominant noise source
contributor with some secondary contributions from the linkages near the cavity. The differences between the
maps for the partially-dressed model geometry cases are less evident for the case of F = 2.5 kHz when compared
to those for F = 1.25 kHz. The only noticeable difference is a slight upstream shift of the apparent dominant
source from the rear to the flow side of the torque link in going from the PDCC to the PDCO case.
Frequencies of F = 4 and 5 kHz show similar results with respect to one another. For the FDCO case (g) and
(j), the dominant source shifts to the front region of the main strut of the model corresponding to the light cluster
and a simulated electrical line. In contrast, for the partially-dressed cases, the primary source remains the torque
link region, with a slight upward shift toward the rear side of the main strut region at F = 5 kHz. At F = 8 kHz
the dominant noise sources are the light cluster for the FDCO case and the torque link for the partially-dressed
cases. It is interesting to note how the beamforming maps identify the sources as more distributed with
increasing frequency. This is consistent with the idea that noise sources become non-compact with increasing
frequency, thereby becoming more directive. On the other hand, the progressive improvement in array resolution
with increasing frequency tends to reveal individual noise sources while obscuring source directivity due to the
large aperture of the array. These issues are difficult to sort out. In general, however, the torque link appears to
be a common “hot spot” between the two partially-dressed model configurations. This is believed to be due to its
interaction with the wake from the shock strut (piston). This trend was also identified by Dobrzynski et al.15
via
CFD results for a preliminary re-design of the A340 Airbus nose landing gear.
(a)
(b)
(c)
Figure 16. Sideline beamforming plots for FDCO case at a frequency of F = 1.25 kHz using (a) DAS, (b) SCB,
and (c) RCB algorithms. (Computed and plotted in 1/3rd
octave bands)

American Institute of Aeronautics and Astronautics
12
FDCO PDCC PDCO
(a)
(b)
(c)
(d)
(e)
(f)
(g)
(h)
(i)
(j)
(k)
(l)
(m)
(n)
(o)
Figure 17. RCB noise source localization maps at frequencies (a)-(c) F = 1.25 kHz, (d)-(f) F = 2.5 kHz (g)-(i)
F = 4 kHz, (j)-(l) F = 5 kHz, (m)-(o) F = 8 kHz.

American Institute of Aeronautics and Astronautics
13
B.2 Scaling of Far Field Spectra
Once the primary noise sources on the model are identified, the scaling of far field spectra as recorded by the
linear array microphones is investigated. The autospectra of microphone 7 is discussed here due to its
approximate flyover location relative to the model. A frequency range of interest of 1 kHz ≤ F ≤ 16 kHz is
assumed based on geometrical scaling of those analyzed in reference 1. After applying the appropriate shear
layer amplitude corrections for each microphone, a scaling corresponding to a 6th
power of velocity –
specifically, Mach number – is applied using the maximum tested flow speed of M = 0.189 as a reference. The
scaled autospectra in dB scale are computed as
= − .
, (1)
where SPLC represents the sound pressure level after application of shear layer amplitude corrections. As can be
seen in Figure 18, application of scaling using a M6 power law collapses the data reasonably well for linear array
microphone #7 for all three model configurations with a slight deviation for the PDCO case in a frequency range
of 5 kHz ≤ F ≤ 10 kHz. The exact cause of this deviation is currently unknown. Very similar results are
observed for the other microphones within the range of geometric radiation angles. Note that plots in the left
column of Figure 18 represent the autospectra prior to scaling and those in the right column are those after
scaling is performed. It is interesting to note that the spectra for all three configurations shift only in terms of
amplitude with respect to flow speed and not frequency. This implies that the expected tonal behavior of the
gear model is not dominant, since this would correspond to a frequency shift according to Strouhal scaling /.
The trends shown in this spectral analysis are consistent with full-scale flyover experiments of the Gulfstream
G550 aircraft reported in reference 1.
V. Conclusions & Future Work
The primary objectives of this study are to obtain a comprehensive aeroacoustic dataset for a nose landing
gear and to provide a clearer understanding of landing gear contributions to overall airframe noise of commercial
aircraft during landing configurations. Comparison of model aerodynamic data between the UFAFF and BART
facilities appear to yield consistent and repeatable results with the exception of the measured pressure field on
the upper torque arm of the model which displayed higher PSD and Cp,rms levels at the UFAFF facility.
Independent of the facility tested, the torque arm is seen to exhibit higher pressure levels than any other
measured locations for all gear configurations.
Analysis of acoustic data taken in the UFAFF shows a slight decrease in SPLs at higher frequencies in going
from a fully-dressed to a partially-dressed cavity open model configuration as well as a noticeable difference in
the sideline noise source localization maps. In contrast, flyover beamforming maps were found to be non-
informative in identifying dominant noise sources. For the fully-dressed model, the dominant noise sources
appear to be the wheels (F = 1.25 kHz), upper torque arm (F = 2.5 kHz), and light cluster (4 kHz ≤ F ≤ 8 kHz),
Removal of the hydraulic lines, light cluster, and steering mechanism from the gear main strut yielded a shift in
noise source “hot spots” from the lights to the upper torque arm and rear section of the main strut over a
frequency range of 4 kHz ≤ F ≤ 8 kHz. Overall, the torque arm region is an important noise contributor for all
configurations. In addition, flyover far field microphone spectra scale with the 6th
power of velocity and do not
exhibit Strouhal scaling behavior.
As a continuation of this effort, advanced beamforming algorithms such as SC-DAMAS and CMF will be
implemented in an attempt to achieve noise source localizations with higher resolution. Coherence-based
methods16
will also be utilized to aid in the removal of uncorrelated noise from far field spectra. Finally, laser
Doppler velocimetry (LDV) will be used to measure and analyze the turbulent local flow velocity fields around
and in between the complex gear components in order to document the state of the local flow fields. LDV is
better suited than Particle Image Velocimetry (PIV) to gain access to regions that are difficult to illuminate with
a laser light sheet.

American Institute of Aeronautics and Astronautics
14
(a) (b)
(c) (d)
(e) (f)
Figure 18. Dependence of far field autospectra on Mach number plotted in 1/3rd
octave bands: (a)-(b)
FDCO, (c)-(d) PDCC, (e)-(f) PDCO. Left column: raw autospectra. Right column: scaled spectra using M
6 power law. (Linear array microphone #7)
Acknowledgments
The first four authors would like to acknowledge Gulfstream Aerospace Corporation and the Florida Center
for Advanced Aero-Propulsion (FCAAP) for their financial support. These authors would also like to
acknowledge the NASA Langley Research Center for providing the landing gear model used in this study. N. S.
Zawodny thanks Donald Day of NASA Langley for lending his technical expertise in configuring the landing
1.E+03 1.E+04
SP
L (
dB
ref
. 2
0 µ
Pa
)
Frequency (Hz)
M = 0.145M = 0.166M = 0.189
1.E+03 1.E+04
SP
L (
dB
ref
. 2
0 µ
Pa
)
Frequency (Hz)
M = 0.145M = 0.166M = 0.189
1.E+03 1.E+04
SP
L (
dB
ref
. 2
0 µ
Pa
)
Frequency (Hz)
M = 0.145M = 0.166M = 0.189
1.E+03 1.E+04
SP
L (
dB
ref
. 2
0 µ
Pa
)
Frequency (Hz)
M = 0.145M = 0.166M = 0.189
1.E+03 1.E+04
SP
L (
dB
ref
. 2
0 µ
Pa
)
Frequency (Hz)
M = 0.145
M = 0.166
M = 0.189
1.E+03 1.E+04
SP
L (
dB
ref
. 2
0 µ
Pa
)
Frequency (Hz)
M = 0.145
M = 0.166
M = 0.189
2 dB 2 dB
2 dB 2 dB
2 dB 2 dB

American Institute of Aeronautics and Astronautics
15
gear model for testing within the UFAFF, Christopher Bahr of the University of Florida for his assistance on data
acquisition and processing, and Adam Edstrand, Alberto Gordon, Tom Kennedy, and Christopher Pergola of the
University of Florida for their assistance on model installation and wind tunnel testing.
References
1 Khorrami, M. R., Lockard, D. P., Humphreys, W. M., Jr., Choudhari, M. M., and Van de Ven, T., “Preliminary Analysis
of Acoustic Measurements from the NASA-Gulfstream Airframe Noise Flight Test,” AIAA Paper 2008-2814, 14th
AIAA/CEAS Aeroacoustics Conference, Vancouver, Canada, May 5-7, 2008. 2 Guo, Y., “A Statistical Model for Landing Gear Noise Prediction,” AIAA Paper 2003-3227, 9th AIAA/CEAS
Aeroacoustics Conference, Hilton Head, SC, May 12-14, 2003. 3 Guo, Y., Yamamoto, K. J., and Stoker, R. W., “Experimental Study on Aircraft Landing Gear Noise,” Journal of
Aircraft, Vol. 43, No. 2, pp. 306-317, 2006. 4 Hutcheson, F. V., and Brooks, T. F., “Noise Reduction from Single and Multiple Rod Configurations,” AIAA Paper
2006-2629, 12th AIAA/CEAS Aeroacoustics Conference, Cambridge, MA, May 8-10, 2006. 5 Arnold, D., “A MEMS-Based Directional Acoustic Array for Aeroacoustic Measurements,” M.S. Thesis, Department of
Electrical and Computer Engineering, University of Florida, Gainesville, FL, 2001. 6 Capon, J., “High Resolution Frequency-Wavenumber Spectrum Analysis,” Proceedings of the IEEE, 57:1408-1418,
August 1969. 7 Brooks, T. F., and Humphreys, W. M., “A Deconvolution Approach for the Mapping of Acoustic Sources (DAMAS)
Determined from Phased Microphone Arrays,” Journal of Sound and Vibration, Vol. 294, pp. 856-879, 2006. 8 Yardibi, T., Li, J., Stoica, P., and Cattafesta, L. N., III, “Sparsity Constrained Deconvolution Approaches for Acoustic
Source Mapping,” Journal of the Acoustical Society of America, Vol. 123, No. 5, pp. 2631-2642, 2008. 9 Sijtsma, P., “CLEAN Based on Spatial Source Coherence,” AIAA Paper 2007-3436, 13th AIAA/CEAS Aeroacoustics
Conference, Rome, Italy, May 21-23, 2007. 10 Neuhart, D.H., Khorrami, M.R., and Choudhari, M.M., “Aerodynamics of a Gulfstream G550 Nose Landing Gear
Model,” AIAA Paper 2009-3152, Miami, May 11-13, 2009. 11 Sellers, W. L., III, and Kjelgaard, S. O., “The Basic Aerodynamics Research Tunnel – A Facility Dedicated to Code
Validation,” AIAA Paper 1988-1997, Hampton, VA, 1988. 12 Underbrink, J. R., M.S. Thesis, “Practical Considerations in Array Design for Passive Broad-Band Source Mapping
Applications,” The Pennsylvania State University, State College, PA, 1995. 13 Dougherty, R. P., “Beamforming in Acoustic Testing,” Aeroacoustic Measurements, Edited by T. J. Mueller, Springer,
pp. 63-97, 2002. 14 Amiet, R. K., “Refraction of Sound by a Shear Layer,” Journal of Sound and Vibration, Vol. 58, No. 3, pp. 467-482,
1978. 15 Dobrzynski, W. M., Schoning, B., Chow, L. C., Wood, C., Smith, M., and Seror, C., “Design and Testing of Low Noise
Landing Gears,” AIAA Paper 2005-3008, 11th AIAA/CEAS Aeroacoustics Conference, Monterey, CA, May 23-25, 2005. 16 Bahr, C., Yardibi, T., Liu, F., and Cattafesta, L., “An Analysis of Different Measurement Techniques for Airfoil Trailing
Edge Noise,” AIAA Paper 2008-2957, 14th AIAA/CEAS Aeroacoustics Conference, Vancouver, Canada, May 5-7, 2008.