A Comparative Evaluation of Performance-Based · PDF fileA COMPARATIVE EVALUATION OF...
15
13 th World Conference on Earthquake Engineering Vancouver, B.C., Canada August 1-6, 2004 Paper No. 453 A COMPARATIVE EVALUATION OF PERFORMANCE-BASED SEISMIC ASSESSMENT PROCEDURES M. Selim GÜNAY 1 , Haluk SUCUOĞLU 2 SUMMARY A building stock consisting of 130 medium-rise reinforced concrete buildings were damaged moderately during the recent earthquakes in Turkey. These buildings were rehabilitated by using simple, cost- effective methods where the newly added shear walls comprised the primary lateral load resisting system. In the presented study, different seismic performance evaluation procedures are tested first on the samples of damaged buildings for predicting their observed performances. Then the expected performances of the rehabilitated buildings are evaluated by employing these procedures. It has been found that the nonlinear static procedure is equally successful as the nonlinear dynamic procedure in predicting the observed performances of damaged buildings. The demand-to-capacity ratios obtained from linear spectral procedure are also good indicators of member performances predicted by the nonlinear static procedure. The predicted performance of the rehabilitated buildings evaluated under design excitations revealed that the simple rehabilitation methodology applied systematically should provide life safety under a 475-year seismic hazard. Hence, implementation of the cost effective rehabilitation method presented herein can be suggested as a realistic solution for the vulnerable medium rise concrete buildings in seismic regions. INTRODUCTION Seismic rehabilitation of vulnerable buildings prior to a probable damaging earthquake is an effective risk mitigation measure. However societal motivation for seismic rehabilitation usually arises after an earthquake, and involves buildings that are affected by the earthquake. Large-scale rehabilitation works conducted after the 1994 Northridge, 1995 Kobe and 1999 Kocaeli earthquakes are recent examples of a similar social psychology. In such cases, a large building stock has to be evaluated and rehabilitated within a limited duration, at reasonable cost. The available time does not usually permit the application of sophisticated, time consuming methods and techniques to all buildings. The 1995 Dinar and 1998 Adana-Ceyhan earthquakes, with respective magnitudes of 6.0 and 6.2, caused substantial damage in the towns of Dinar and Ceyhan in Turkey. A total of 130 moderately damaged buildings were rehabilitated within the scope of a government-funded project (Wasti [1], Sucuoğlu [2]) under the technical guidance of the Earthquake Engineering Research Center of the Middle East Technical University, Ankara. Since the FEMA program on seismic rehabilitation was under development 1 Graduate student, Dept. of Civil Eng., METU, Ankara 06531, Turkey. Email: [email protected] 2 Professor, Dept. of Civil Eng., METU, Ankara 06531, Turkey. Email: [email protected]
Transcript of A Comparative Evaluation of Performance-Based · PDF fileA COMPARATIVE EVALUATION OF...

13th World Conference on Earthquake Engineering Vancouver, B.C., Canada
August 1-6, 2004 Paper No. 453
A COMPARATIVE EVALUATION OF PERFORMANCE-BASED SEISMIC ASSESSMENT PROCEDURES
M. Selim GÜNAY1, Haluk SUCUOĞLU2
SUMMARY A building stock consisting of 130 medium-rise reinforced concrete buildings were damaged moderately during the recent earthquakes in Turkey. These buildings were rehabilitated by using simple, cost-effective methods where the newly added shear walls comprised the primary lateral load resisting system. In the presented study, different seismic performance evaluation procedures are tested first on the samples of damaged buildings for predicting their observed performances. Then the expected performances of the rehabilitated buildings are evaluated by employing these procedures. It has been found that the nonlinear static procedure is equally successful as the nonlinear dynamic procedure in predicting the observed performances of damaged buildings. The demand-to-capacity ratios obtained from linear spectral procedure are also good indicators of member performances predicted by the nonlinear static procedure. The predicted performance of the rehabilitated buildings evaluated under design excitations revealed that the simple rehabilitation methodology applied systematically should provide life safety under a 475-year seismic hazard. Hence, implementation of the cost effective rehabilitation method presented herein can be suggested as a realistic solution for the vulnerable medium rise concrete buildings in seismic regions.
INTRODUCTION Seismic rehabilitation of vulnerable buildings prior to a probable damaging earthquake is an effective risk mitigation measure. However societal motivation for seismic rehabilitation usually arises after an earthquake, and involves buildings that are affected by the earthquake. Large-scale rehabilitation works conducted after the 1994 Northridge, 1995 Kobe and 1999 Kocaeli earthquakes are recent examples of a similar social psychology. In such cases, a large building stock has to be evaluated and rehabilitated within a limited duration, at reasonable cost. The available time does not usually permit the application of sophisticated, time consuming methods and techniques to all buildings. The 1995 Dinar and 1998 Adana-Ceyhan earthquakes, with respective magnitudes of 6.0 and 6.2, caused substantial damage in the towns of Dinar and Ceyhan in Turkey. A total of 130 moderately damaged buildings were rehabilitated within the scope of a government-funded project (Wasti [1], Sucuoğlu [2]) under the technical guidance of the Earthquake Engineering Research Center of the Middle East Technical University, Ankara. Since the FEMA program on seismic rehabilitation was under development
1 Graduate student, Dept. of Civil Eng., METU, Ankara 06531, Turkey. Email: [email protected] 2 Professor, Dept. of Civil Eng., METU, Ankara 06531, Turkey. Email: [email protected]

in this era with new publications promoting performance-based methodologies (ATC 1992 [3], ATC 1997 [4], BSSC 1992 [5]), the rehabilitation projects carried out in Dinar and Ceyhan were based on the performance objective of providing life safety under a 475-year seismic hazard (10% probability of exceeding in 50 years). Considering the constraints in time and budget, simple and cost-effective seismic assessment and rehabilitation procedures have been developed and applied to the entire building stock. Linear spectral analysis with force-based component acceptability was employed as the basic seismic assessment procedure, and newly added shear walls comprised the primary elements in seismic rehabilitation. The field applications of both Dinar and Ceyhan rehabilitation projects have been completed. There are two objectives of the presented study. The first objective is to conduct a comparative evaluation of different seismic performance assessment procedures in predicting the observed performances of damaged buildings. Two damaged buildings, one from Dinar and the other from Ceyhan are selected as samples for the comparative evaluation of linear spectral, nonlinear static, capacity spectrum and nonlinear dynamic procedures. The second objective is to test the expected performances of the rehabilitated buildings in order to provide an analytical verification of the implemented simple systematic rehabilitation methodology. Confirmation of the performance objectives through reliable analytical procedures shall perhaps encourage the application of cost effective assessment and rehabilitation methods for mitigating seismic risk in urban regions exposed to significant seismic hazard.
BUILDING DAMAGES AND REHABILITATION METHODOLOGY The buildings in Dinar and Ceyhan were subjected to ground motions with the mean elastic and inelastic acceleration response spectra of horizontal components shown in Figure 1. For reference, elastic design spectra specified in both the Turkish Seismic Design Code [6] and ATC-40 [7] for the associated seismic zones in Dinar (EPA=0.40g) and Ceyhan (EPA=0.30g) are also given. Both cities are located on flat soil sites (profile type SD) where soil conditions are fairly uniform over the two cities (Wasti [1], Sucuoğlu [2]). Hence, strong motions recorded in the two cities during the respective earthquakes represent seismic intensity distributions in both cities reasonably well. The reduced design spectra in the Turkish Code are shown in both figures for ordinary moment resisting concrete frames as a comparison to the respective inelastic response spectra. The graphs in Figure 1 reveal that the code level seismic hazard with a return period of 475 years reasonably envelops the experienced ground shaking. The common factors leading to building damages in Dinar and Ceyhan were basically related to their inadequate structural systems, which do not conform to fundamental seismic resistant design rules. The beams were generally stronger than the columns in all stories. There was no closely spaced confinement reinforcement at the beam and column ends. The measured concrete strengths were usually lower than 15 MPa, and workmanship was not satisfactory. Plain reinforcing bars with 220 MPa yield strength were used in all buildings. The transverse beam and column reinforcement was not providing adequate confinement, and anchorage lengths of the longitudinal reinforcement were insufficient. Despite these negative facts, foundations were generally adequate with no visible cracks, distortions or settlements. Considering the inherent weaknesses of the existing structural systems, their damaged state, and the constraints on completion of the rehabilitation works in a limited time, it was decided to apply a uniform, simple and robust systematic rehabilitation strategy for all buildings. The selected conventional rehabilitation strategy was simply based on adding new concrete shear walls to constitute a primary system for seismic resistance while keeping the existing frame as a secondary system mainly responsible for carrying the gravity forces. Life safety performance under a 475-year seismic hazard was the rehabilitation objective. The basic stages in the implementation of the adopted systematic rehabilitation methodology can be found elsewhere (Sucuoğlu [8]).

Figure 1. Acceleration response spectra of the Dinar and Ceyhan earthquake ground motions and
the related code spectra
PERFORMANCE EVALUATION PROCEDURES In the systematic rehabilitation of 130 buildings, linear dynamic analysis (modal spectral) using design spectrum was employed as the standard procedure. For two selected buildings, nonlinear static analysis, capacity spectrum method (ATC-40 [7], Freeman [9]) and nonlinear dynamic analysis procedures were used for verifying the results of linear dynamic procedure. The moments of inertia of columns beams and shearwalls were reduced by 40, 60 and 50 percent respectively proposed by FEMA-356 [10] to account for cracking in sections during dynamic response. Three-dimensional models were employed in the linear dynamic procedure, where modal spectral analysis was carried out. The acceptance of component performances was based on the criteria for linear procedures (FEMA-356 [10]). In nonlinear static and dynamic procedures, two-dimensional models were prepared by using the Drain-2DX program (Prakash [11]). A displacement-controlled pushover analysis (Allahabadi [12]) was carried out in the nonlinear static procedure, and both the target displacement method and the capacity spectrum method were employed for calculating the global performance levels. Deformation-controlled actions were considered for acceptability of the component performances. Finally, nonlinear time history analyses were conducted for the damaged buildings under the Dinar and Ceyhan ground motions for comparing the maximum dynamic response displacements with the target displacements from nonlinear static procedure. All spectrum based performance evaluation procedures were applied to both the existing and rehabilitated states of the buildings for observing their seismic performances before and after rehabilitation. Ground excitations were expressed by the recorded ground motions and their spectra for the damaged states, and by the design spectra for the rehabilitated states of the buildings (Fig.1).
SAMPLE BUILDINGS Two sample buildings, one from Dinar and one from Ceyhan were selected to conduct case studies for performance evaluation. Both buildings represent general characteristics of the rehabilitated buildings after the 1995 Dinar and 1998 Adana-Ceyhan earthquakes.
0.0
0.2
0.4
0.6
0.8
1.0
1.2
0.0 0.2 0.4 0.6 0.8 1.0 1.2 1.4 1.6 1.8 2.0
Period (sec)
Spe
ctra
l Acc
ele
ratio
n (g
)Mean elastic, mainshockMean inelastic, mainshock Mean inelastic, mainshock Mean elastic, aftershockTurkish Code, elastic (EPA = 0.4g)Turkish Code, design (R=4)ATC-40, elastic
(µ=2)(µ=3)
a) Dinar0.0
0.2
0.4
0.6
0.8
1.0
1.2
0.0 0.2 0.4 0.6 0.8 1.0 1.2 1.4 1.6 1.8 2.0
Period (sec)
Spe
ctra
l Acc
ele
ratio
n (g
)
Mean elastic
Mean inelastic
Mean inelastic
Turkish Code, elastic (EPA = 0.3g)
Turkish Code, design (R=4)
ATC-40, elastic
(µ =2)
(µ=3)
b) Ceyhan

Four-Story Building in Dinar The four-story building was moderately damaged after the Dinar earthquake. It was rehabilitated by adding new shear walls extending along the full building height indicated by darker shading in Figure 2a, on the ground story plan. Before seismic rehabilitation, the structural system of the building was a reinforced concrete frame with concrete slabs and individual footings connected by foundation tie beams in both directions. A typical floor area was 310 m2; the story heights were 3.80 m at the ground level and 3.50 m at the three layers above. The most common column size was 25 cm by 60 cm and all beam sizes were 25 cm by 70 cm. There were cantilevering floors of 1 meter above the ground level on the front and the backsides of the building (Figure 2a). The ground story had a smaller number of brick partition walls than the upper stories, which created a weakness. During the 1 October 1995 Dinar earthquake, all of the 23 columns in the ground story were damaged with two where the damage was severe due to shear failures at both ends (columns 3B and 6C in Fig. 2a), three with moderate (1A, 2A and 5D) and 18 with light damage. Out of 37 beams at the first floor, two were severely (B12 and B45), three were moderately (B23, C12 and C45) and one was lightly damaged in combined shear and flexure modes. All of the nine brick partition walls were severely damaged at the ground story. Although the damage was concentrated at the ground level, masonry partition wall damages continued in the upper stories accompanied with lighter damages in the concrete members. Less damage in beams indicated stronger beams than columns at the connections. The concrete core specimens taken from the building revealed a mean concrete strength of 12 MPa. The spacing of transverse reinforcement in columns and beams was 20-25 cm. In the seismic rehabilitation of the building, two U-shaped shear walls were added to the existing system and the corner columns were improved as shown in Figure 2a. The column 6C was severely damaged. Since it was to remain in one of the new shear walls, its concrete was completely removed and it was recast with the new wall. The other severely damaged column 3B was jacketed with a concrete cover in the ground story. The shear wall ratio in the rehabilitated building (shear wall area divided by the total floor area) was 0.0021 in the x-direction and 0.0032 in the y-direction. Eight-Story Building in Ceyhan The eight-story building experienced moderate damage during the June 25, 1998 Adana-Ceyhan earthquake. Damage was mostly observed in beams in the first five levels, and in the columns and the U shaped shearwall around the elevator shaft in the first level. The shearwalls with darker shading indicated on Figure 2b were added for seismic rehabilitation. The structural system of the existing building was regular, and almost symmetrical in the long direction. Its foundation consisted of two-way continuous footings at a depth of 1 m from the ground. The beam sizes were 20 by 60-cm, the concrete slab thickness was 14 cm, and the column sizes varied between 25 by 50 and 25 by 70 cm. A typical floor area was 227 m2 at the upper stories and 195 m2 at the ground story, whereas the story height was 3.0 m for all stories. During the Adana-Ceyhan earthquake, four of the 24 columns at the first story were lightly damaged (1D, 3G, 3I and 5B in Fig. 2b), and the other 20 were undamaged. Two of the three existing concrete wall segments were lightly damaged and one was moderately damaged. Most of the 55 beams and 36 infill walls at the ground level were light to moderately damaged. Similar beam and infill-wall damage patterns were repeated from the first to fifth stories above the ground level. In the majority of connections, the strong column-weak beam condition was satisfied. The longitudinal reinforcement ratio in columns was between 1 and 2 percent, and the beams were lightly reinforced. The spacing of transverse reinforcement was 20 cm in all frame members. Although the beam damage distribution over the five stories indicated a tendency toward a favorable beam mechanism, the infill wall

damages was an indication of the lack of lateral stiffness and strength. The characteristic concrete strength was estimated as 14 MPa from the core samples taken from walls and beams. Four infilled concrete shear walls were added to the building in both directions during seismic rehabilitation. The wall ratio was increased to 0.0020 and 0.0027 in the X and Y directions respectively.
Figure 2. Rehabilitation scheme applied to the ground story plan of a) the four story building in
Dinar, b) the eight story building in Ceyhan
COMPARATIVE ASSESSMENT OF PERFORMANCE EVALUATION PROCEDURES FOR DAMAGED BUILDINGS
The seismic performances of the four and eight story buildings in their existing states are calculated by several evaluation procedures under the Dinar and Ceyhan ground excitations respectively. In the linear and nonlinear spectral procedures, ground excitations are defined by the mean elastic spectra of the two ground motion components as shown in Fig. 1. The results are evaluated in view of the observed performances of the buildings during both earthquakes. Linear Spectral Procedure Three-dimensional linear models are prepared for both sample buildings where the cracked concrete sections are considered and equivalent diagonal struts represent brick partition walls. Mean elastic spectra of the recorded ground motion components are applied separately in both orthogonal directions. The fundamental vibration periods of the four-story building are calculated as 0.72 and 0.56 seconds, and the eight-story building as 0.86 and 0.79 seconds in the X and Y directions, respectively. Acceptance criteria for linear procedures are employed for controlling component acceptability. Earthquake actions are reduced by a factor of 2 for the vertical elements where forces are delivered by yielding beams (FEMA-356 [10]). In-situ material strengths are used in capacity evaluation. In calculating the flexural capacities of columns, axial forces due to earthquake actions are not obtained from the results of linear spectral analysis, but calculated from the shear forces that can be transmitted by the connecting beams in accordance with their flexural capacities. Column axial forces calculated accordingly from the shear forces transmitted by beams are considerably less than the axial forces obtained from spectral analysis. Otherwise, using axial forces obtained from spectral analysis leads to severe underestimation of flexural capacities.
a) b)
I H G F E D C B A
1
2
3
4
5
1 2 3 4 5 6
A
B
C
D

A comparison of flexural demand-capacity ratios (DCR) for the first story columns and beams of both sample buildings are given in Tables I and II. Only one-half of the members of the eight-story building are presented in Table II due to symmetry. The first row in Tables I.a and II.a is the columns axis, the second row is the DCR in X-direction, and the third row is the DCR in Y-direction. In Tables I and II, beam and column DCR’s are for the member ends where they are maximum. DCR values in Table I indicate that all of the first story column capacities and the capacities of beams connected into the stronger direction of columns were exceeded in the four-story building during the Dinar earthquake, which conforms to the post-earthquake observations. Similarly, DCR values in Table II reveal that columns sustained less damage compared to shearwalls and beams in the first story of the eight-story building as observed after the Adana-Ceyhan earthquake. Accordingly, it may be concluded that the linear spectral procedure captures the general damage distribution in both buildings. However, DCR values do not provide detailed information on the damage states of individual members. In view of the observed member damages and the associated DCR values, it appears that the force-based DCR’s are conservative predictors of the actual damages, particularly the beam damages observed after the earthquake. A member based survey on the correlation of DCR and damage level in two buildings leads to the correspondence presented in Table III. The differences among damage levels are such that light damage does not require repair, moderate damage is repairable and severe damage is not repairable. Table I.a. Demand-Capacity Ratios in the First Story Columns of the Four-Story Existing Building
under Dinar Spectrum 1A 2A 3A 4A 5A 6A 1B 2B 3B 4B 5B 6B 1C 2C 3C 4C 5C 6C 1D 2D 3D 4D 5D
3.79 2.17 1.76 1.56 1.64 1.62 1.66 1.82 2.03 2.01 2.00 1.13 1.56 1.75 2.05 2.15 2.00 2.15 1.90 1.90 1.90 2.41 3.00 0.63 2.81 2.30 1.91 2.38 1.08 1.02 1.09 1.09 1.00 0.94 0.91 1.11 1.27 1.21 1.08 0.96 1.82 1.49 2.67 2.17 1.89 1.11
Table I.b. Demand-Capacity Ratios in the First Story Beams of the Four-Story Existing Building
under Dinar Spectrum
A12 A23 A34 A45 A56 B12 B23 B34 B45 B56 1AB 2AB 3AB 4AB 5AB 6AB 1BC 2BC 3BC 4BC 5BC 6BC
3.67 0.59 1.47 1.67 1.64 6.24 6.00 4.50 7.06 4.79 1.84 1.81 1.88 1.70 1.59 3.10 2.54 0.83 0.43 0.42 1.09 3.78
Table II.a. Demand-Capacity Ratios in the First Story Columns and Walls of the Eight-Story
Existing Building under Ceyhan Spectrum Columns Walls
1A 1B 1C 1D 2A 2C 2D 3A 3D 3C 5A 5B 5C 5E 4DF D34 0.96 1.21 1.09 1.32 0.85 0.98 1.11 0.96 0.72 0.90 0.87 0.98 1.00 1.07 2.05 - 0.59 0.85 1.04 0.93 0.55 0.53 0.93 0.49 0.71 0.83 0.57 0.59 1.08 1.28 - 2.00
Table II.b. Demand-Capacity Ratios in the First Story Beams of the Eight-Story Existing Building
under Ceyhan Spectrum
1AB 1BC 1CD 1DF 2AC 2CD 3AB 3BC 3CD 5AB 5BC 5CE A12 A23 A35 B35 C12 C23 C35 D12 D23
2.65 0.85 0.74 1.75 2.65 3.11 1.62 0.61 2.16 2.37 2.18 0.74 0.71 0.34 0.58 1.34 1.40 1.27 1.59 2.15 3.38
Table III. Correspondence of DRC Values and Damage Levels in Members
Member Type No Visible Damage Light Damage Moderate
Damage Severe Damage
Columns, shear walls <1.2 1.2-2.0 2.0-3.0 >3.0
Beams <1.5 1.5-2.5 2.5-4.0 >4.0
Nonlinear Static Procedure Two-dimensional models which include frames A and B in the four-story building and frames A to D in the eight-story building are prepared. Since the computer program Drain 2DX only considers flexural hinge formation, member and connection shear forces are traced manually in response calculations to make sure that their shear capacities are not exceeded. Strain hardening stiffness is taken as zero. A pair of equivalent diagonal inelastic truss elements with elasto-plastic properties in compression and no resistance in tension is used to model infill walls. The infill walls in Dinar and Ceyhan were made from hollow, non-load bearing bricks of 13-cm thickness, laid with cement-mortar lime. Specimens of similar brick were transported to the laboratory, and prism specimens prepared with similar mortar were tested under compression to obtain a mean gross compressive strength of 1 MPa and a modulus of elasticity of 700 MPa with slight variations. The elastic stiffness in compression is based on the strut width a defined in FEMA 273/356, and the measured modulus of elasticity. The force capacity of the strut is calculated from the shear strength of the wall panel at the onset of diagonal cracking (Sucuoğlu and McNiven [13]). A shear strength value of 0.06 MPa is obtained for typical infill masonry panels, which is employed in the analytical model of the building. A lateral force distribution proportional to the respective first mode shapes is applied to both models. The four-story building is analyzed for two different cases: without and with the infill walls. Thus, the contribution of the brick infills on the building response can be assessed separately. The results of the pushover analysis are presented in Figures 3 and 4 for the four and eight story buildings, respectively. The lower curves represent the existing buildings. It can be observed from Figure 3 that brick infills increased the lateral strength and initial stiffness of the four story bare frame by 20% and 70% respectively. Coefficient Method The effective vibration periods of the 2D models of the four and eight story buildings are calculated as 0.69 and 0.90 seconds respectively, with the corresponding spectral displacements of 5.25 and 8.5 cm. When these values and the first modal participating factors at the roof level are employed to calculate the target roof displacement, which is normalized with respect to the associated building height, target values of 0.0052 and 0.0049 are obtained for the two buildings. These values are marked on respective capacity curves in Figures 3 and 4.
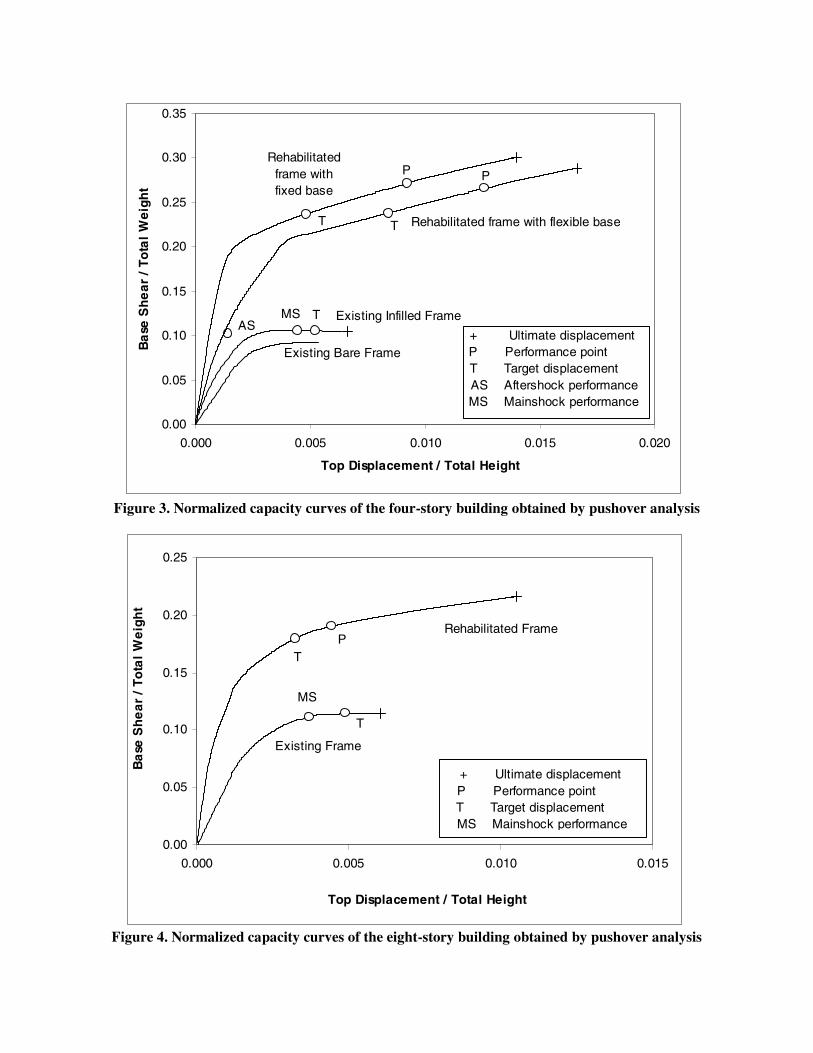
Figure 3. Normalized capacity curves of the four-story building obtained by pushover analysis
Figure 4. Normalized capacity curves of the eight-story building obtained by pushover analysis
0.00
0.05
0.10
0.15
0.20
0.25
0.30
0.35
0.000 0.005 0.010 0.015 0.020
Top Displacement / Total Height
Ba
se S
he
ar
/ T
ota
l W
eig
ht
Rehabilitated frame with flexible base
Rehabilitated frame with fixed base
Existing Infilled Frame
Existing Bare Frame
ASMS T
T
P
T
P
+ Ultimate displacement P Performance point
T Target displacement AS Aftershock performance MS Mainshock performance
0.00
0.05
0.10
0.15
0.20
0.25
0.000 0.005 0.010 0.015
Top Displacement / Total Height
Ba
se S
he
ar
/ T
ota
l W
eig
ht
Rehabilitated Frame
Existing Frame
PT
T
MS
+ Ultimate displacement P Performance point
T Target displacement MS Mainshock performance

Capacity Spectrum Method Seismic demand and capacity of both existing buildings are expressed in the ADRS format by using the procedure outlined in ATC-40 [7]. Structural behavior types are selected as type C, corresponding to poor existing buildings. The first mode participation factor PF1 and modal mass coefficient α1 are 1.29 and 0.85 for the four story building, which possessed an energy dissipation capacity equivalent to 16.4% viscous damping at the ultimate stage. The reduced demand spectrum does not intersect its capacity spectrum, indicating that the building can not perform under the Dinar ground motion. Corresponding values of the eight story existing building are 1.42 for PF1, 0.69 for α1 and 12.5 % equivalent viscous damping. A performance point is not obtained also for the eight-story building under the Ceyhan ground motion. Nonlinear Dynamic Procedure Nonlinear time history analyses are conducted for the four and eight story buildings under the NS components of Dinar and Ceyhan ground motions respectively. The maximum values of roof displacement to building height ratios are obtained as 0.0044 for the four-story building under Dinar, and 0.0040 for the eight-story building under Ceyhan ground motions. It can be inferred from Figures 3 and 4 that these displacements are lower than the ultimate displacement capacities of both existing buildings. The maximum response ratios obtained from the nonlinear dynamic analyses are shown on the capacity curves of respective buildings in Figures 3 and 4 with the legend MS. Discussion of Results From Nonlinear Procedures The normalized maximum displacement demands obtained from nonlinear procedures are compared in Table IV with the ultimate capacities obtained from pushover analysis. Although both buildings survived the earthquakes with moderate damage, the capacity spectrum method overestimates the observed response and indicates collapse. It is apparent that the equivalent damping ratios proposed by the capacity spectrum method are insufficient for reducing the elastic demand to actual inelastic demand. The target displacements obtained from the coefficient method and the maximum displacements obtained from the time history analysis are in reasonable agreement. The plastic hinge mechanisms at the respective target displacements of the four and eight story buildings are presented in Figure 5. The distribution of plastic regions generally conforms well to the observed damage distributions in these buildings.
Table IV. Comparison of Normalized Maximum Roof Displacement Demands from Different Nonlinear Procedures
Sample Building
Time History
Target Displacement Capacity Spectrum Ultimate
Displacement 4-Story 0.0044 0.0052 No performance 0.0066 8-Story 0.0040 0.0049 No performance 0.0060
SEISMIC PERFORMANCES OF THE REHABILITATED BUILDINGS
The performances of the rehabilitated sample buildings are calculated by the evaluation procedures discussed in the previous section. Linear elastic design spectra shown in Figure 1.a and 1.b describe seismic input for the four and eight story buildings, respectively. The performance evaluation results are presented comparatively in the following paragraphs.
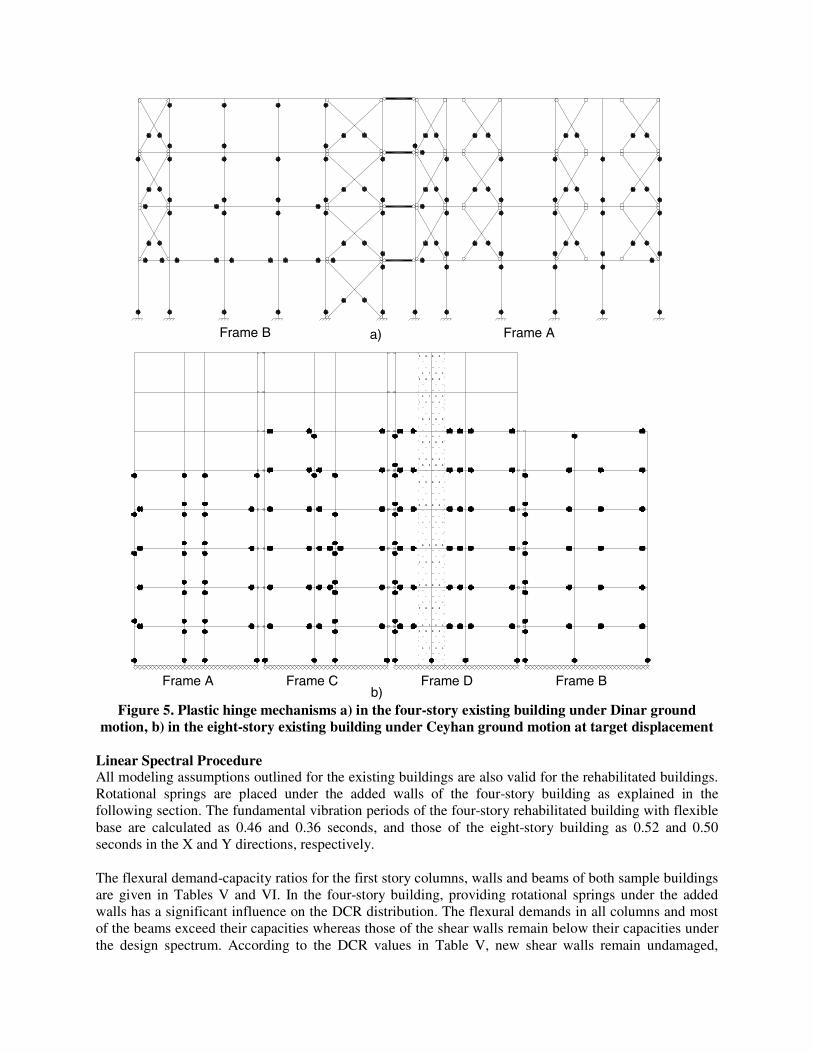
Figure 5. Plastic hinge mechanisms a) in the four-story existing building under Dinar ground motion, b) in the eight-story existing building under Ceyhan ground motion at target displacement
Linear Spectral Procedure All modeling assumptions outlined for the existing buildings are also valid for the rehabilitated buildings. Rotational springs are placed under the added walls of the four-story building as explained in the following section. The fundamental vibration periods of the four-story rehabilitated building with flexible base are calculated as 0.46 and 0.36 seconds, and those of the eight-story building as 0.52 and 0.50 seconds in the X and Y directions, respectively. The flexural demand-capacity ratios for the first story columns, walls and beams of both sample buildings are given in Tables V and VI. In the four-story building, providing rotational springs under the added walls has a significant influence on the DCR distribution. The flexural demands in all columns and most of the beams exceed their capacities whereas those of the shear walls remain below their capacities under the design spectrum. According to the DCR values in Table V, new shear walls remain undamaged,
Frame B Frame A
Frame A Frame C Frame D Frame B
a)
b)
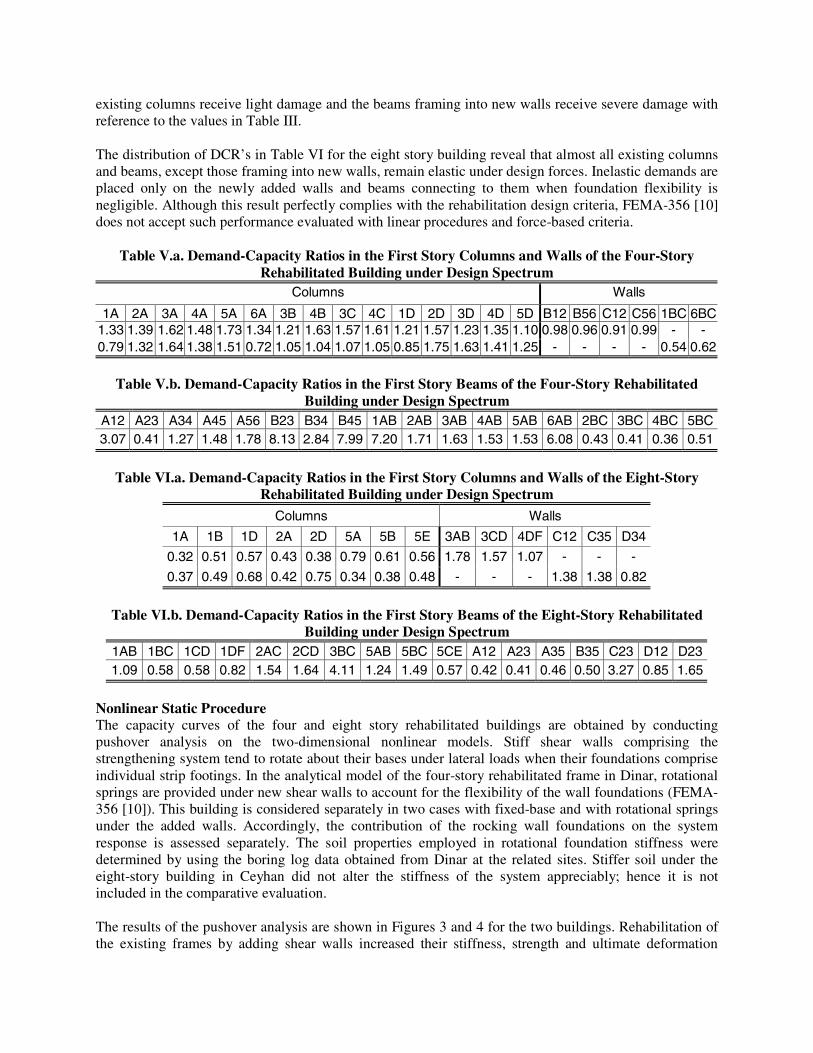
existing columns receive light damage and the beams framing into new walls receive severe damage with reference to the values in Table III. The distribution of DCR’s in Table VI for the eight story building reveal that almost all existing columns and beams, except those framing into new walls, remain elastic under design forces. Inelastic demands are placed only on the newly added walls and beams connecting to them when foundation flexibility is negligible. Although this result perfectly complies with the rehabilitation design criteria, FEMA-356 [10] does not accept such performance evaluated with linear procedures and force-based criteria.
Table V.a. Demand-Capacity Ratios in the First Story Columns and Walls of the Four-Story Rehabilitated Building under Design Spectrum
Columns Walls
1A 2A 3A 4A 5A 6A 3B 4B 3C 4C 1D 2D 3D 4D 5D B12 B56 C12 C56 1BC 6BC 1.33 1.39 1.62 1.48 1.73 1.34 1.21 1.63 1.57 1.61 1.21 1.57 1.23 1.35 1.10 0.98 0.96 0.91 0.99 - - 0.79 1.32 1.64 1.38 1.51 0.72 1.05 1.04 1.07 1.05 0.85 1.75 1.63 1.41 1.25 - - - - 0.54 0.62
Table V.b. Demand-Capacity Ratios in the First Story Beams of the Four-Story Rehabilitated
Building under Design Spectrum A12 A23 A34 A45 A56 B23 B34 B45 1AB 2AB 3AB 4AB 5AB 6AB 2BC 3BC 4BC 5BC 3.07 0.41 1.27 1.48 1.78 8.13 2.84 7.99 7.20 1.71 1.63 1.53 1.53 6.08 0.43 0.41 0.36 0.51
Table VI.a. Demand-Capacity Ratios in the First Story Columns and Walls of the Eight-Story
Rehabilitated Building under Design Spectrum
Columns Walls
1A 1B 1D 2A 2D 5A 5B 5E 3AB 3CD 4DF C12 C35 D34
0.32 0.51 0.57 0.43 0.38 0.79 0.61 0.56 1.78 1.57 1.07 - - -
0.37 0.49 0.68 0.42 0.75 0.34 0.38 0.48 - - - 1.38 1.38 0.82
Table VI.b. Demand-Capacity Ratios in the First Story Beams of the Eight-Story Rehabilitated
Building under Design Spectrum 1AB 1BC 1CD 1DF 2AC 2CD 3BC 5AB 5BC 5CE A12 A23 A35 B35 C23 D12 D23 1.09 0.58 0.58 0.82 1.54 1.64 4.11 1.24 1.49 0.57 0.42 0.41 0.46 0.50 3.27 0.85 1.65
Nonlinear Static Procedure The capacity curves of the four and eight story rehabilitated buildings are obtained by conducting pushover analysis on the two-dimensional nonlinear models. Stiff shear walls comprising the strengthening system tend to rotate about their bases under lateral loads when their foundations comprise individual strip footings. In the analytical model of the four-story rehabilitated frame in Dinar, rotational springs are provided under new shear walls to account for the flexibility of the wall foundations (FEMA-356 [10]). This building is considered separately in two cases with fixed-base and with rotational springs under the added walls. Accordingly, the contribution of the rocking wall foundations on the system response is assessed separately. The soil properties employed in rotational foundation stiffness were determined by using the boring log data obtained from Dinar at the related sites. Stiffer soil under the eight-story building in Ceyhan did not alter the stiffness of the system appreciably; hence it is not included in the comparative evaluation. The results of the pushover analysis are shown in Figures 3 and 4 for the two buildings. Rehabilitation of the existing frames by adding shear walls increased their stiffness, strength and ultimate deformation

significantly. Allowing for foundation rocking under the four-story building reduced initial stiffness, hence increased displacements. However it did not reduce the ultimate strength. Coefficient Method Effective vibration periods of 0.52 and 0.57 seconds, and code level spectral displacements of 8.2 cm and 6.0 cm are calculated for the 2D models of the four and eight story rehabilitated buildings in Dinar and Ceyhan, respectively. The corresponding normalized target displacements are 0.0084 and 0.0032. It must be noted that higher design spectrum and foundation flexibility under the four-story building in Dinar are responsible for the difference in the normalized target displacements. These two values are marked on respective curves in Figures 3 and 4. The target displacement ratio of 0.0048 for the four-story building with fixed base is also shown in Figure 3. Capacity Spectrum Method Capacity spectrum method is applied to four and eight story rehabilitated buildings with a procedure similar to that applied to the existing buildings. Structural behavior type is selected as B, representing buildings whose primary elements are combinations of existing and new elements. Employing equivalent damping ratios of 26% for both of the rehabilitated buildings, normalized roof displacements of 0.0106 and 0.0044 are calculated at the performance points of the four and eight story buildings respectively. These points are marked on the capacity curves in Figures 3 and 4. Performance Evaluation of Rehabilitated Buildings Using Nonlinear Static Procedures The normalized roof displacements obtained from nonlinear static procedures, and the ultimate displacements of the rehabilitated buildings are presented in Table VII. Similar to the results obtained for existing buildings, capacity spectrum method produces significantly larger performance displacements compared to the target displacements of the coefficient method. This difference can be attributed to the inadequacy of equivalent damping concept in reducing the elastic spectra to inelastic spectra. Since target displacements were in good agreement with the results of time history analysis for the existing buildings, it is decided to employ target displacements for the performance evaluation of rehabilitated building components. Target displacement values of the four story building with flexible base and the eight story building exceed their associated global yield displacements, but stay well below the ultimate displacement values indicated in Figures 3 and 4. Therefore both rehabilitated buildings may be considered to satisfy life safety performance level in global displacement terms. Displacement-based acceptance criteria of FEMA-356 [10] are applied to all components of the two rehabilitated buildings and presented separately below. Table VII. Comparison of Normalized Maximum Roof Displacement Demands of the Rehabilitated
Buildings from Nonlinear Static Procedures Sample Building Target Displacement Capacity Spectrum Ultimate Displacement
4-Story, fixed base 0.0048 0.0092 0.0140
4-Story, flexible base 0.0084 0.0126 0.0170
8-Story 0.0032 0.0044 0.0105
The plastic hinge distribution at the target displacement of the four-story building is shown in Figure 6, and the corresponding plastic rotations of the first story members are given in Table VIII. All members in Figure 6 are numbered from left to right in Table VIII, and only the maximum of plastic rotations from both ends are given.
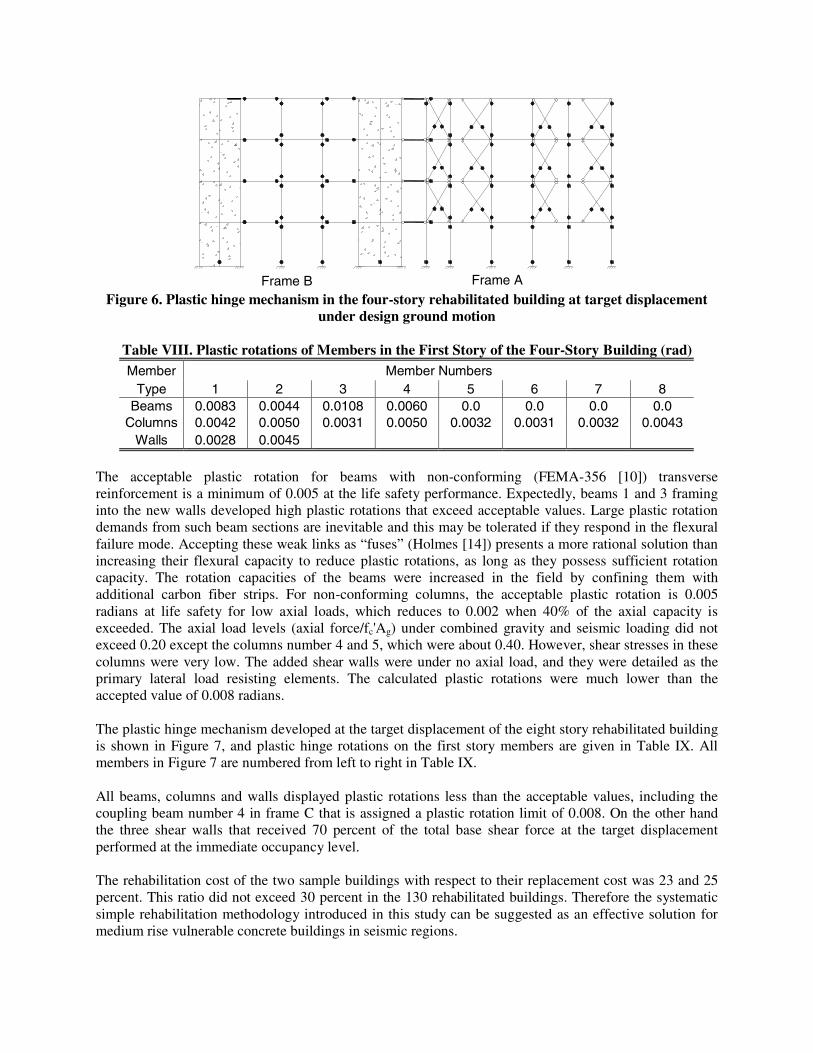
Figure 6. Plastic hinge mechanism in the four-story rehabilitated building at target displacement under design ground motion
Table VIII. Plastic rotations of Members in the First Story of the Four-Story Building (rad) Member Member Numbers
Type 1 2 3 4 5 6 7 8 Beams 0.0083 0.0044 0.0108 0.0060 0.0 0.0 0.0 0.0
Columns 0.0042 0.0050 0.0031 0.0050 0.0032 0.0031 0.0032 0.0043 Walls 0.0028 0.0045
The acceptable plastic rotation for beams with non-conforming (FEMA-356 [10]) transverse reinforcement is a minimum of 0.005 at the life safety performance. Expectedly, beams 1 and 3 framing into the new walls developed high plastic rotations that exceed acceptable values. Large plastic rotation demands from such beam sections are inevitable and this may be tolerated if they respond in the flexural failure mode. Accepting these weak links as “fuses” (Holmes [14]) presents a more rational solution than increasing their flexural capacity to reduce plastic rotations, as long as they possess sufficient rotation capacity. The rotation capacities of the beams were increased in the field by confining them with additional carbon fiber strips. For non-conforming columns, the acceptable plastic rotation is 0.005 radians at life safety for low axial loads, which reduces to 0.002 when 40% of the axial capacity is exceeded. The axial load levels (axial force/fc'Ag) under combined gravity and seismic loading did not exceed 0.20 except the columns number 4 and 5, which were about 0.40. However, shear stresses in these columns were very low. The added shear walls were under no axial load, and they were detailed as the primary lateral load resisting elements. The calculated plastic rotations were much lower than the accepted value of 0.008 radians. The plastic hinge mechanism developed at the target displacement of the eight story rehabilitated building is shown in Figure 7, and plastic hinge rotations on the first story members are given in Table IX. All members in Figure 7 are numbered from left to right in Table IX. All beams, columns and walls displayed plastic rotations less than the acceptable values, including the coupling beam number 4 in frame C that is assigned a plastic rotation limit of 0.008. On the other hand the three shear walls that received 70 percent of the total base shear force at the target displacement performed at the immediate occupancy level. The rehabilitation cost of the two sample buildings with respect to their replacement cost was 23 and 25 percent. This ratio did not exceed 30 percent in the 130 rehabilitated buildings. Therefore the systematic simple rehabilitation methodology introduced in this study can be suggested as an effective solution for medium rise vulnerable concrete buildings in seismic regions.
Frame B Frame A
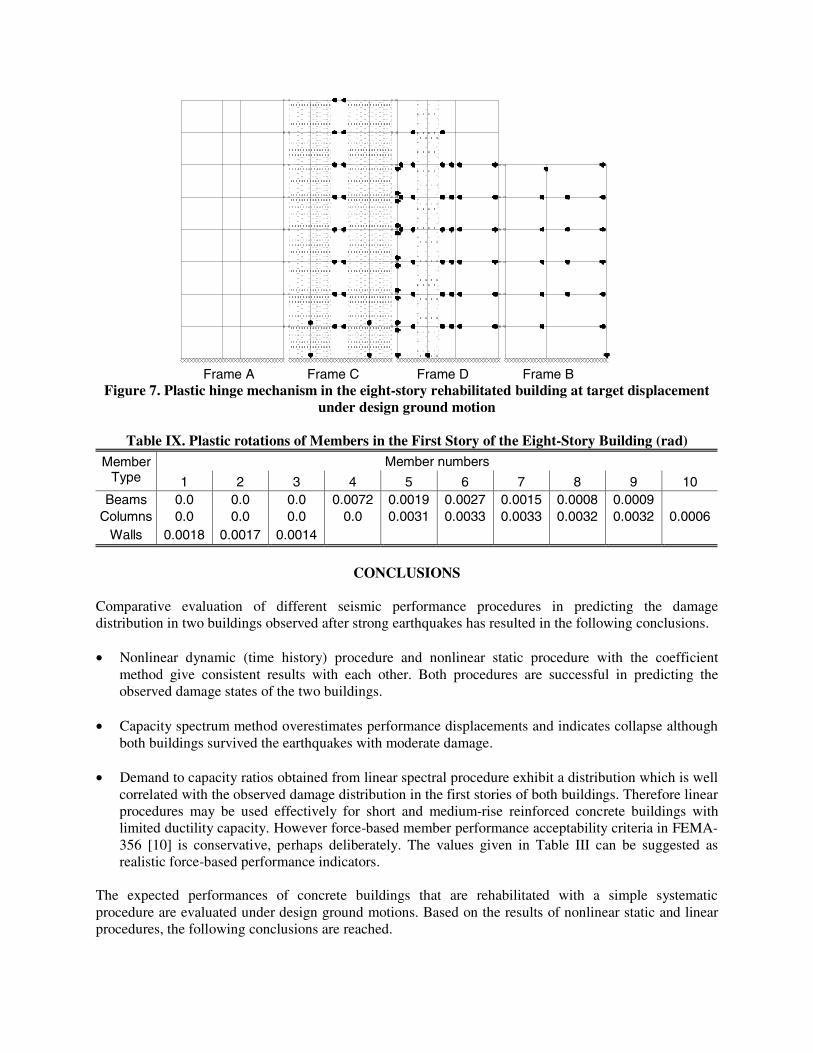
Figure 7. Plastic hinge mechanism in the eight-story rehabilitated building at target displacement under design ground motion
Table IX. Plastic rotations of Members in the First Story of the Eight-Story Building (rad)
Member numbers Member Type 1 2 3 4 5 6 7 8 9 10
Beams 0.0 0.0 0.0 0.0072 0.0019 0.0027 0.0015 0.0008 0.0009 Columns 0.0 0.0 0.0 0.0 0.0031 0.0033 0.0033 0.0032 0.0032 0.0006
Walls 0.0018 0.0017 0.0014
CONCLUSIONS
Comparative evaluation of different seismic performance procedures in predicting the damage distribution in two buildings observed after strong earthquakes has resulted in the following conclusions. • Nonlinear dynamic (time history) procedure and nonlinear static procedure with the coefficient
method give consistent results with each other. Both procedures are successful in predicting the observed damage states of the two buildings.
• Capacity spectrum method overestimates performance displacements and indicates collapse although
both buildings survived the earthquakes with moderate damage. • Demand to capacity ratios obtained from linear spectral procedure exhibit a distribution which is well
correlated with the observed damage distribution in the first stories of both buildings. Therefore linear procedures may be used effectively for short and medium-rise reinforced concrete buildings with limited ductility capacity. However force-based member performance acceptability criteria in FEMA-356 [10] is conservative, perhaps deliberately. The values given in Table III can be suggested as realistic force-based performance indicators.
The expected performances of concrete buildings that are rehabilitated with a simple systematic procedure are evaluated under design ground motions. Based on the results of nonlinear static and linear procedures, the following conclusions are reached.
Frame A Frame C Frame D Frame B
• Life safety performance can be easily achieved by added shear walls receiving approximately 70 percent of the total base shear force. A wall area to total floor area ratio of 0.002 in both directions is sufficient for achieving this performance.
• Foundation flexibility under the added walls must be incorporated in the analytical models
realistically. Its influence on the performance level is significant. • Newly added shear walls naturally place high rotation demands on the ends of existing beams framing
into the added walls, and high axial tension/compression demands on the adjacent columns. The suggested improvement is not to increase their flexural and axial capacities directly, but to apply local confinement at critical sections for increasing the shear and rotation capacities of beams and axial deformation capacity of columns. Fibre reinforced polymers offer practical solutions for such local member improvement.
REFERENCES
1. Wasti T, Sucuoğlu H, Utku M. “Seismic rehabilitation of moderately damaged R/C buildings after
the 1 October 1995 Dinar earthquake.” Journal of Earthquake Engineering 2001; 5(2): 131-151. 2. Sucuoğlu H, Gür T, Gülkan P. “The Adana-Ceyhan earthquake of 27 June 1998: seismic retrofit of
120 R/C buildings.” 12th Word Conf. on Earthquake Eng. 2000, CD-ROM, Auckland, New Zealand.
3. Applied Technology Council (ATC). “Development of guidelines for seismic rehabilitation of buildings.” Report No. FEMA-273, Washington, DC, USA, 1992.
4. Applied Technology Council (ATC). “NEHRP guidelines for the seismic rehabilitation of buildings.” Report No. FEMA-273, Washington, DC, USA, 1997.
5. Building Seismic Safety Council (BSSC). “NEHRP handbook of techniques for the seismic rehabilitation of existing buildings.” Report No. FEMA-172, Washington, DC, USA, 1992.
6. Ministry of Public Works and Settlement. “Specifications for Buildings Constructed in Disaster Areas.” Ankara, Turkey, (1975, revised in 1997).
7. Applied Technology Council (ATC). “Seismic evaluation and retrofit of concrete buildings.” Report No. ATC-40, Redwood City, California, USA, 1996.
8. Sucuoğlu H, Gür T, Günay M.S. “Performance-Based Seismic Rehabilitation of Damaged R/C Buildings”, Accepted for publication in ‘Journal of Structural Engineering, ASCE’.
9. Freeman SA. “Prediction of response of concrete buildings to severe earthquake motion.” Publication SP-55, American Concrete Institute, Detroit, USA, 1978; 589-605.
10. American Society of Civil Engineers (ASCE). “Prestandard and Commentary for the Seismic Rehabilitation of Buildings.” Report No. FEMA-356, Washington DC, USA, 2000.
11. Prakash V, Powell GH, Campbell S. “Drain-2DX base program description and user guide.” SEMM Report No. 93/17, University of California, Berkeley, California, USA, 1993.
12. Allahabadi R. “Drain-2DX, seismic response and damage assessment for 2D structures.” Ph.D. Dissertation, University of California, Berkeley, California, USA, 1981.
13. Sucuoğlu H., McNiven HD. “Seismic shear capacity of reinforced masonry piers.” Journal of Struct. Eng. ASCE 1991; 117: 2166-2186.
14. Holmes, W.T. “Risk Assessment and Retrofit of Existing Buildings.” Proceedings, 12’th World Conf. Earthquake Eng., Paper no. 2826, Auckland, New Zealand, 2000.
15. Gülkan P, Sucuoğlu H, Erberik MA, Akkar S. “Dinar aftershock tests retrofitted buildings.” EERI Newsletter 1998; 32(9): 6-8.