A Comparative Analysis of the Singapore Math Curriculum ...
296
Seton Hall University eRepository @ Seton Hall Seton Hall University Dissertations and eses (ETDs) Seton Hall University Dissertations and eses Spring 2-25-2014 A Comparative Analysis of the Singapore Math Curriculum and the Everyday Mathematics Curriculum on Fiſth Grade Achievement in a Large Northeastern Urban Public School District Tina L. Powell Seton Hall University, [email protected] Follow this and additional works at: hps://scholarship.shu.edu/dissertations Part of the Curriculum and Instruction Commons , Educational Assessment, Evaluation, and Research Commons , and the Science and Mathematics Education Commons Recommended Citation Powell, Tina L., "A Comparative Analysis of the Singapore Math Curriculum and the Everyday Mathematics Curriculum on Fiſth Grade Achievement in a Large Northeastern Urban Public School District" (2014). Seton Hall University Dissertations and eses (ETDs). 1981. hps://scholarship.shu.edu/dissertations/1981
Transcript of A Comparative Analysis of the Singapore Math Curriculum ...

Seton Hall UniversityeRepository @ Seton HallSeton Hall University Dissertations and Theses(ETDs) Seton Hall University Dissertations and Theses
Spring 2-25-2014
A Comparative Analysis of the Singapore MathCurriculum and the Everyday MathematicsCurriculum on Fifth Grade Achievement in a LargeNortheastern Urban Public School DistrictTina L. PowellSeton Hall University, [email protected]
Follow this and additional works at: https://scholarship.shu.edu/dissertations
Part of the Curriculum and Instruction Commons, Educational Assessment, Evaluation, andResearch Commons, and the Science and Mathematics Education Commons
Recommended CitationPowell, Tina L., "A Comparative Analysis of the Singapore Math Curriculum and the Everyday Mathematics Curriculum on FifthGrade Achievement in a Large Northeastern Urban Public School District" (2014). Seton Hall University Dissertations and Theses(ETDs). 1981.https://scholarship.shu.edu/dissertations/1981

A COMPARATIVE ANALYSIS OF THE SINGAPORE MATH CURRICULUM AND THE
EVERYDAY MATHEMATICS CURRICULUM ON FIFTH GRADE ACHIEVEMENT IN A
LARGE NORTHEASTERN URBAN PUBLIC SCHOOL DISTRICT
Tina L. Powell
Dissertation Committee
Gerard Babo, Ed.D., Mentor Christopher Tienken, Ed.D.
Erin Krupa, Ph.D. Heather Jackson, Ed.D.
Submitted in partial fulfillment of the requirements for the degree of
Doctor of Educational Leadership
Seton Hall University 2014

Copyright © 2014
by
Tina L. Powell


ii
ABSTRACT
This study examined the differences between the achievement effects of one
proposed Common Core State Standards-aligned mathematics program, Math in Focus:
Singapore Math, and one NCTM-aligned mathematics program, Everyday Mathematics,
on Grade 5 mathematics performance. An explanatory non-experimental research design
was employed using post hoc pre- and post-treatment data from 2010 NJ ASK3 and 2012
NJ ASK5 administrations, respectively. The study examined the achievement outcomes
of 205 Grade 5 general education students across several independent variables
(race/ethnicity, gender, SES, attendance). Statistical analyses revealed fairly consistent
results regarding differences in student performance on the 2012 NJ ASK5 in schools
implementing Singapore Math and in schools implementing Everyday Mathematics.
Generally, across all analyses, there were no substantial differences in performance based
upon treatment status. Similarly, there were no patterns of differential treatment effects
across the dimensions of race/ethnicity, gender, and SES. Overall, treatment was found to
be the weakest predictor of student performance, whereas student background
characteristics (race/ethnicity and SES), and attendance accounted for the greatest
proportion of variation in the performance of certain subgroups.

iii
ACKNOWLEDGMENTS
I am thankful for the extraordinary support embodied within my network of
family, friends, cohort-mates, and colleagues. This has been an extraordinary
undertaking, and I must take this opportunity to acknowledge those individuals who
willingly became my travel mates at varying points in this journey:
Dr. Gerard Babo, you were the ultimate “coach” during this entire process,
representing a healthy balance of encouragement, reassurance, prodding, critique, and
approbation. I admire your attention to detail, your vast knowledge of statistical
methods, your professionalism and responsiveness. It was, undeniably, those qualities
that got me through this process.
Dr. Christopher Tienken, you inspired an entire cohort of present and future
“influencers” of policy to “think critically,”--to never be swayed by rhetoric and trends
but instead to ask the tough and often unfashionable questions. It was to this standard
that I engaged in this study. I am pleased that this study, as did our coursework, ends not
with a period of conclusiveness, but with a question mark of future prospect. There is so
much more to come from all whom you have inspired.
Dr. Krupa and Dr. Jackson, throughout this entire process, you helped me solidify
my thinking to produce a comprehensive, cohesive, and scholarly research study. You
offered suggestions and perspectives that encouraged me to explore bodies of work that

iv
helped not only in writing my dissertation but also in other arenas of my professional life.
Thank you.
Anthony Brown, Dr. Carlos Lee, and Naseed Gifted, you define friendship. You
wanted completion for me as much as I did, often sacrificing your own schedules to
ensure that I had the support I needed.
And finally, I must acknowledge my Cohort XIV family. We will always be
connected by the cohesive bonds of shared effort, support, and the scholarly kinship
conceptualized in Dr. Caufield’s model for this program. The analogy of the giant
redwoods of Sequoia National Park comes to mind. The redwoods’ interlocking root
system supports and sustains the trees under the surface, providing strength, longevity,
and height. Our paths will cross again either in our casual interactions, through career
endeavors, or when we’re reading journals that feature the work of our cohort-mates.
Either way, I’ll see you soon!
Thank you to all.

v
DEDICATION
Sixty thousand two hundred and one words . . . and I dedicate every single one to
James and Jerry Powell, my parents.

vi
TABLE OF CONTENTS
ABSTRACT ........................................................................................................................ ii
ACKNOWLEDGMENTS ................................................................................................. iii
DEDICATION .................................................................................................................... v
TABLE OF CONTENTS ................................................................................................... vi
LIST OF TABLES .............................................................................................................. x
LIST OF FIGURES .......................................................................................................... xv
CHAPTER I: INTRODUCTION
Background of the Study ........................................................................................... 1
Theoretical Framework .............................................................................................. 4
Statement of the Problem ........................................................................................... 5
Purpose of the Study .................................................................................................. 9
Curriculum Descriptions .......................................................................................... 10
Singapore Math .................................................................................... 11
Everyday Mathematics ......................................................................... 13
Research Questions .................................................................................................. 15
Significance of the Study ......................................................................................... 16
Research Design/Methods ....................................................................................... 19
Researcher Bias ........................................................................................................ 20
Limitations ............................................................................................................... 22
Delimitations ............................................................................................................ 25
Definition of Terms.................................................................................................. 26
CHAPTER II: REVIEW OF THE LITERATURE
Introduction .............................................................................................................. 32
Evolution of the NCTM Standards .......................................................................... 34
Evolution of the Common Core State Standards ..................................................... 37
Mathematics in the Earlier Grades ........................................................................... 42
Studies of Curriculum Effect in Mathematics ......................................................... 45
Seminal Large-Scale Studies of Mathematics Curricula ...................... 45
Seminal Meta-Analytic Studies of Mathematics Curricula .................. 48
A Comparison between Singapore Math and Everyday Mathematics .................... 51
Singapore Math .................................................................................... 52

vii
Everyday Mathematics ......................................................................... 54
Curriculum Effectiveness Studies: Singapore Math ................................................ 56
Curriculum Effectiveness Studies: Everyday Mathematics ..................................... 59
Factors Influencing Mathematics Achievement ...................................................... 62
Gender .................................................................................................. 62
Socioeconomic Status ........................................................................... 63
Race/Ethnicity ...................................................................................... 65
Attendance ............................................................................................ 66
Synthesis .................................................................................................................. 67
CHAPTER III: METHODOLOGY
Introduction .............................................................................................................. 74
Setting for the Study ................................................................................................ 75
Demographic Composition ................................................................... 76
Prior Mathematics Performance ........................................................... 76
Within-School Factors .......................................................................... 76
Treatment ................................................................................................................. 77
Everyday Mathematics.................................................................................... 77
Singapore Math ............................................................................................... 78
Participants ............................................................................................................... 79
Singapore Math Experimental Treatment Sample ............................... 79
Everyday Math Alternative Treatment Sample .................................... 80
Research Questions .................................................................................................. 82
Research Design....................................................................................................... 87
Instrumentation/Data Collection ..................................................................... 88
Instrument Reliability and Validity ................................................................ 91
Data Analysis .................................................................................................. 93
Effect Size ....................................................................................................... 95
Summary .................................................................................................................. 96
CHAPTER IV: DATA ANALYSIS
Introduction .............................................................................................................. 98
Preliminary Analyses ...................................................................................... 99
Summary of Preliminary Analyses ............................................................... 100
Statistical Power and Effect Size .................................................................. 101
Testing the Assumptions ............................................................................... 102

viii
Descriptive Statistics .............................................................................................. 104
Primary Analyses ................................................................................................... 109
Subsidiary Question 1 ................................................................................... 114
Subsidiary Question 2 ................................................................................... 120
Subsidiary Question 3 ................................................................................... 123
Subsidiary Question 4 ................................................................................... 136
Subsidiary Question 5 ................................................................................... 155
Subsidiary Question 6 ................................................................................... 158
Subsidiary Question 7 ................................................................................... 161
Review of the Findings .......................................................................................... 166
Subsidiary Question 1 ................................................................................... 167
Subsidiary Question 2 ................................................................................... 168
Subsidiary Question 3 ................................................................................... 169
Subsidiary Question 4 ................................................................................... 174
Subsidiary Question 5 ................................................................................... 178
Subsidiary Question 6 ................................................................................... 179
Subsidiary Question 7 ................................................................................... 180
CHAPTER V: FINDINGS, CONCLUSIONS, AND RECOMMENDATIONS
Introduction ............................................................................................................ 182
Summary of Findings ............................................................................................. 184
Subsidiary Question 1 ................................................................................... 184
Subsidiary Question 2 ................................................................................... 185
Subsidiary Question 3 ................................................................................... 186
Subsidiary Question 4 ................................................................................... 188
Subsidiary Question 5 ................................................................................... 191
Subsidiary Question 6 ................................................................................... 191
Subsidiary Question 7 ................................................................................... 193
Discussion and Conclusions .................................................................................. 194
Curriculum Findings ..................................................................................... 194
Performance-Level Findings ......................................................................... 199
Demographic Findings .................................................................................. 203
Recommendations for Policy and Practice ............................................................ 207
National Level Recommendations ................................................................ 208
State/District Level Recommendations......................................................... 208

ix
School Level Recommendations................................................................... 209
Recommendations for Future Study ...................................................................... 210
Summary ................................................................................................................ 215
Final Thoughts ....................................................................................................... 216
REFERENCES ............................................................................................................... 219
APPENDIX A ................................................................................................................. 246
APPENDIX B ................................................................................................................. 247
APPENDIX C ................................................................................................................. 272
APPENDIX D ................................................................................................................. 276
APPENDIX E ................................................................................................................. 278
x
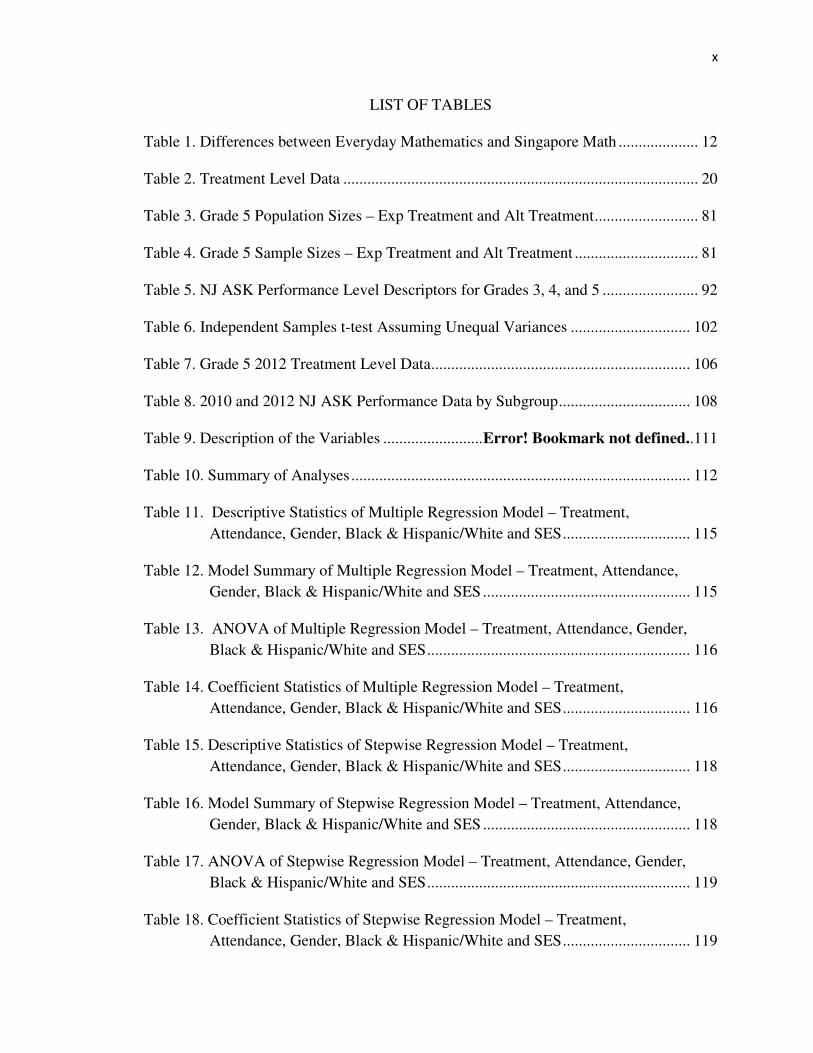
LIST OF TABLES
Table 1. Differences between Everyday Mathematics and Singapore Math .................... 12
Table 2. Treatment Level Data ......................................................................................... 20
Table 3. Grade 5 Population Sizes – Exp Treatment and Alt Treatment .......................... 81
Table 4. Grade 5 Sample Sizes – Exp Treatment and Alt Treatment ............................... 81
Table 5. NJ ASK Performance Level Descriptors for Grades 3, 4, and 5 ........................ 92
Table 6. Independent Samples t-test Assuming Unequal Variances .............................. 102
Table 7. Grade 5 2012 Treatment Level Data ................................................................. 106
Table 8. 2010 and 2012 NJ ASK Performance Data by Subgroup ................................. 108
Table 9. Description of the Variables ......................... Error! Bookmark not defined..111
Table 10. Summary of Analyses ..................................................................................... 112
Table 11. Descriptive Statistics of Multiple Regression Model – Treatment,
Attendance, Gender, Black & Hispanic/White and SES ................................ 115
Table 12. Model Summary of Multiple Regression Model – Treatment, Attendance,
Gender, Black & Hispanic/White and SES .................................................... 115
Table 13. ANOVA of Multiple Regression Model – Treatment, Attendance, Gender,
Black & Hispanic/White and SES .................................................................. 116
Table 14. Coefficient Statistics of Multiple Regression Model – Treatment,
Attendance, Gender, Black & Hispanic/White and SES ................................ 116
Table 15. Descriptive Statistics of Stepwise Regression Model – Treatment,
Attendance, Gender, Black & Hispanic/White and SES ................................ 118
Table 16. Model Summary of Stepwise Regression Model – Treatment, Attendance,
Gender, Black & Hispanic/White and SES .................................................... 118
Table 17. ANOVA of Stepwise Regression Model – Treatment, Attendance, Gender,
Black & Hispanic/White and SES .................................................................. 119
Table 18. Coefficient Statistics of Stepwise Regression Model – Treatment,
Attendance, Gender, Black & Hispanic/White and SES ................................ 119

xi
Table 19. Descriptive Statistics of ANCOVA – Overall Performance; Controlling
Attendance ...................................................................................................... 121
Table 20. Levene's Test of Equality of ANCOVA – Overall Performance;
Controlling Attendance .................................................................................. 121
Table 21. Tests of Between-Subjects Effects of ANCOVA – Overall Performance;
Controlling Attendance .................................................................................. 122
Table 22. Estimated Marginal Means of ANCOVA – Overall Performance;
Controlling Attendance .................................................................................. 122
Table 23. Descriptive Statistics of Independent Samples t-test, Performance Level
Comparisons ................................................................................................... 124
Table 24. Independent Samples t-test, Performance Level Comparisons for Everyday
Math Alternative Treatment ........................................................................... 124
Table 25. Descriptive Statistics of Independent Samples t-test, Performance Level
Comparisons, Singapore Math ....................................................................... 126
Table 26. Independent Samples t-test, Performance Level Comparisons, Singapore
Math ................................................................................................................ 126
Table 27. Descriptive Statistics of Factorial ANOVA – Treatment and 2012
Performance Level ......................................................................................... 128
Table 28. Levene's Test of Equality of Error Variances of Factorial ANOVA –
Treatment and 2012 Performance Level ........................................................ 128
Table 29. Tests of Between-Subjects Effects of Factorial ANOVA – Treatment and
2012 Performance Level ................................................................................ 129
Table 30. Estimated Marginal Means of Factorial ANOVA – Treatment and 2012
Performance Level ......................................................................................... 129
Table 31. Descriptive Statistics of ANOVA, Proficient ................................................. 132
Table 32. Levene's Test of Equality of Error Variances of ANOVA, Proficient ........... 132
Table 33. Tests of Between-Subjects Effects of ANOVA, Proficient ............................ 133
Table 34. Descriptive Statistics of ANOVA, Not Proficient .......................................... 134

xii
Table 35. Levene's Test of Equality of ANOVA, Not Proficient ................................... 135
Table 36. Tests of Between-Subjects Effects of ANOVA, Not Proficient ..................... 135
Table 37. Descriptive Statistics of Factorial ANOVA – Treatment and Black &
Hispanic/White ............................................................................................... 137
Table 38. Levene's Test of Equality of Factorial ANOVA – Treatment and Black &
Hispanic/White ............................................................................................... 138
Table 39. Tests of Between-Subjects Effects of Factorial ANOVA – Treatment and
Black & Hispanic/White ................................................................................ 138
Table 40. Estimated Marginal Means of Factorial ANOVA – Treatment and Black &
Hispanic/White ............................................................................................... 139
Table 41. Descriptive Statistics of ANOVA (Black&Hispanic) .................................... 141
Table 42. Levene's Test of Equality of ANOVA (Black&Hispanic) ............................. 141
Table 43. Tests of Between-Subjects Effects of ANOVA (Black/Hispanic) ................. 142
Table 44. Descriptive Statistics of ANOVA (White) ..................................................... 143
Table 45. Levene's Test of Equality of ANOVA (White) .............................................. 144
Table 46. Tests of Between-Subjects Effects of ANOVA (White) ................................ 144
Table 47. Descriptive Statistics of Factorial ANOVA – Treatment and
Black/Hispanic ............................................................................................... 146
Table 48. Levene's Test of Equality of Factorial ANOVA – Treatment and
Black/Hispanic Scores .................................................................................... 147
Table 49. Tests of Between-Subjects Effects of Factorial ANOVA – Treatment,
Black/Hispanic ............................................................................................... 147
Table 50. Estimated Marginal Means of Factorial ANOVA – Treatment,
Black/Hispanic ............................................................................................... 148
Table 51. Descriptive Statistics of ANOVA – Black/Hispanic (Everyday Math) .......... 150
Table 52. Levene's Test of Equality of ANOVA – Black/Hispanic (Everyday Math) ... 150

xiii
Table 53. Tests of Between-Subjects Effects of ANOVA – Black/Hispanic (Everyday
Math) .............................................................................................................. 151
Table 54. Descriptive Statistics of ANOVA – Black/Hispanic (Singapore Math) ......... 152
Table 55. Levene's Test of Equality of ANOVA – Black/Hispanic (Singapore Math) .. 153
Table 56. Tests of Between-Subjects Effects of ANOVA – Black/Hispanic (Singapore
Math) .............................................................................................................. 153
Table 57. Group Statistics of Independent Samples t-test – Black/Hispanic (Singapore
Math) .............................................................................................................. 154
Table 58. Independent Samples T-test – Black/Hispanic (Singapore Math) .................. 154
Table 59. Descriptive Statistics of Simultaneous Regression Analysis (Black) –
Treatment, Attendance, Gender, and SES ...................................................... 156
Table 60. Model Summary of Simultaneous Regression Analysis (Black) – Treatment,
Attendance, Gender, and SES ........................................................................ 156
Table 61. ANOVA of Simultaneous Regression Analysis (Black) – Treatment,
Attendance, Gender, and SES ........................................................................ 157
Table 62. Coefficient Statistics of Simultaneous Regression Analysis (Black) –
Treatment, Attendance, Gender, and SES ...................................................... 157
Table 63. Residual Statistics of Simultaneous Regression Analysis (Black) – Treatment,
Attendance, Gender, and SES ........................................................................ 158
Table 64. Descriptive Statistics of Simultaneous Regression Analysis (Hispanic) –
Treatment, Attendance, Gender, and SES ...................................................... 159
Table 65. Model Summary of Simultaneous Regression Analysis (Hispanic) –
Treatment, Attendance, Gender, and SES ...................................................... 160
Table 66. ANOVA of Simultaneous Regression Analysis (Hispanic) – Treatment,
Attendance, Gender, and SES ........................................................................ 160
Table 67. Coefficient Statistics of Simultaneous Regression Analysis (Hispanic) –
Treatment, Attendance, Gender, and SES ...................................................... 161
Table 68. Descriptive Statistics of Factorial ANCOVA (Hispanic) – Treatment,
Attendance, and SES ...................................................................................... 163

xiv
Table 69. Levene's Test of Equality of ANOVA (Hispanic) – Treatment, Attendance,
and SES .......................................................................................................... 163
Table 70. Test of Between-Subject Effects of ANOVA (Hispanic) – Treatment,
Attendance, and SES ...................................................................................... 164
Table 71. Estimated Marginal Means (1) of ANOVA (Hispanic) – Treatment,
Attendance, and SES ...................................................................................... 164
Table 72. Estimated Marginal Means (2) of ANOVA (Hispanic) – Treatment,
Attendance, and SES ...................................................................................... 165
Table 73. Treatment Level Comparisons of Mean Scale Scores on the 2012
NJ ASK5 ......................................................................................................... 166
Table 74. Slope and Intercept of Theta to Scale Score Transformation ......................... 203

xv
LIST OF FIGURES
Figure 1. Degree of Congruence between State Standards and the CCCSM ............ Error!
Bookmark not defined.38
Figure 2. NJ ASK Content Clusters/Standards and Their Associated Strands .......... Error!
Bookmark not defined.90
Figure 3. Research Design Schematic .............................................................................. 96
Figure 4. Estimated Marginal Means of MathScaleScore2012 at each Performance
Level ............................................................................................................... 130
Figure 5. Estimated Marginal Means of MathScaleScore2012- Black &
Hispanic/White ............................................................................................... 139
Figure 6. Estimated Marginal Means of MathScaleScore2012- Black & Hispanic ....... 148
Figure 7. Estimated Marginal Means of MathScaleScore2012- Hispanic, SES,
Attendance ...................................................................................................... 165
LIST OF EQUATIONS
Equation 1. Linear Transformation Formula (NJDOE, 2011, 2013) .............................. 202

1
CHAPTER I
INTRODUCTION
Background of the Study
Science, technology, engineering, and mathematics fields (STEM fields) have
been a strong focus of recent education reform efforts. The National Academies, in its
congressionally prompted study of America’s global competitiveness, Rising above the
Gathering Storm (National Research Council [NRC], 2007), attributes as much as 85% of
measured U.S. income per capita growth to technological change (NRC, 2007). In 2007,
the Department of Labor issued its landmark report, The STEM Workforce Challenge, as
a call to inspire long-term, concerted efforts towards increasing the “supply and quality of
‘knowledge workers’ whose specialized skills enable them to work productively within
the STEM industries and occupations” (p. 5). Under the U.S. Department of Education’s
American Recovery and Reinvestment Act (ARRA) of 2009, $4.35 billion was allocated
to “education innovation and reform” (USDOE, p. 2) in competitive Race to the Top
grant funding. The grant encourages and rewards states for effecting “high-quality
plan[s] to address the need to offer rigorous course[s] of study in mathematics, the
sciences, technology, and engineering [in cooperation with] STEM-capable community
partners . . . ” (p. 4). The grant aspires to increase the proportions of students taking
courses in STEM fields and at their advanced levels.
Beyond ensuring that U.S. students are adequately prepared for college and the
workplace, current educational reform policies and efforts in the United States encourage
states to address the academic challenges of historically underrepresented groups:

2
disadvantaged, minority, and high-poverty populations of students (National Science
Board [NSB], 2010a; NRC, 2011; USDOE, 2009).
National data support a well-founded focus on the educational opportunities of
disadvantaged groups. According to the NSB’s (2012) reporting of NAEP data available
from 1990 through 2009, higher proportions of White and Asian/Pacific Islander students
scored at or above the basic and proficient levels compared with Black, Hispanic, and
American Indian/Alaskan Native students and students from lower income families at
each assessed grade level in mathematics. Overall, Black students represented the lowest
performing subgroup, having the fewest number of students scoring at or above the basic
level and at or above the proficient level. Special analyses conducted by the National
Center for Education Statistics (NCES) in 2009 and 2011 showed that Black and
Hispanic students trailed their White peers by an average of more than 20 test-score
points on the NAEP in mathematics at Grades 4 and 8, representing a difference of
roughly two grade levels (NCES, 2009, 2011).
These findings are consistent with high school graduation attainment data
comparing student population groups: Black/White, Hispanic/White, and high-
poverty/low-poverty. Recent changes to federal regulations require states to hold districts
accountable for the high school graduation rates of students in various subgroups
(race/ethnicity, language, poverty, and disability). According to the Editorial Projects in
Education Research Center’s annual Diplomas Count (2011) report, while each major
racial and ethnic group had more students graduate as of the class of 2008, massive gaps
continue to persist between the different subgroups. “[Whereas] 82.7% of Asian students
and 78.4% of White students in the class of 2008 graduated on time, the same was the

3
case for only 57.6% of Hispanic, 57% of Black and 53.9% of American Indian students”
(Achievement Gap, 2011, para. 6). In addition, while high school mathematics
achievement data reflect an upward trend (NCES, 2009), the 2010 ACT report of all 11th
grade students who took the ACT as part of their statewide assessment program found the
percentage of students meeting or exceeding the College Readiness Benchmark in
Mathematics to be between 33% and 42% for each category of the standard (Number &
Quantity, Algebra, Geometry, Functions, Statistics and Probability); the range for African
American and Hispanic students was between 8% and 22% and 16% and 32%,
respectively. According to the NCES (2009) data, white and Asian American students
are at least twice as likely to take mathematics classes considered academically rigorous
than Black and Hispanic students. Of the total number of high school seniors planning to
attend college, only 6% of Black and 8% of Hispanic students had participated in
rigorous courses (e.g., precalculus) in 2009 (NCES, 2009).
As racial/ethnic disparities in performance continue to gain national attention as a
major impediment to U.S. competitiveness, U.S. policy goals are becoming increasingly
directed toward broad-based educational reform efforts around standards and
assessments. One such effort resulted in the development of a common set of standards
for mathematics and English.
In 2009, a group of 48 states, led by the National Governors Association's (NGA)
Center for Best Practices and the Council of Chief State School Officers (CCSSO),
developed the Common Core State Standards Initiative (CCSSO/NGA, 2009). Beginning
with the formative years of elementary instruction, the Common Core State Standards

4
(CCSS) outline a body of knowledge, skills, and fluencies students must master at each
grade level to graduate from high school “college and career ready” in the 21st century.
The standards seek to (1) clarify what students are expected to learn in each
grade, (2) permit cross-state comparisons, and (3) improve student achievement by
increasing the rigor of coursework required to meet the standards (Fine, 2010).
According to a recent survey, the majority of the states and districts adopting the
Common Core State Standards plan to adopt new curriculum materials, assessments,
instructional practices, teacher induction and professional development programs, and
teacher evaluation systems based on the standards (Kober & Rentner, 2011).
Theoretical Framework
Given the central role that curriculum materials play in teaching and learning, it
stands to reason that differences across curricula can lead to differences in student
achievement. This study looks at two mathematics programs that differ pedagogically
with regards to content, organization, and the treatment of topics.
Developing an authentic understanding of mathematics–thinking conceptually,
not just procedurally; using logical reasoning and common sense to find mathematical
solutions; using experimental thinking; taking risks and accepting failure as part of the
learning process (Conley, 2003); and applying formulas and algorithms of computation–
is the ultimate objective of mathematics instruction as students are expected to move
sensibly between everyday problems and mathematical formulations.
The development of number concepts has long been seen as the core of many
mathematics programs for young children. “Number concepts are the foundation that
children must have in order to achieve high standards in mathematics as a whole”

5
(Richardson, 2012 p. xii). In its utility for describing quantities and relationships, for
representing numerical ideas, and for collecting information about the world in which we
live, a foundation in number sense ultimately impacts every other succeeding area of
mathematics instruction. This deep understanding of number concepts and relationships
does not develop quickly. Raising achievement in mathematics in ways that allow
children to build on what they know underscores the importance of children’s
understanding of number. This thinking has been codified in the Common Core State
Standards for Mathematics (CCSSM) (Common Core State Standards Writing Team,
2011).
Because this study intends to reveal how the implementation of two elementary
mathematics programs aligned to different sets of standards and having pedagogically
different approaches relates to students' acquisition of mathematics skills and
understandings, it is important to know not only the factors that make a difference in the
early grades, above and beyond intelligence and other abilities, but also the characteristic
differences between elementary mathematics programs that potentially impact cognitive
growth and development in early mathematics.
Statement of the Problem
The recent movement toward using scientifically or empirically-based research in
education since the No Child Left Behind (NCLB) Act of 2001 (U.S. Department of
Education, 2002) has yielded a growing emphasis for providing evidence of what works
in schools and school districts (Dynarski, Clarke, Cobb, Finn, Rumberger, & Smink,
2008; Slavin, 2008). However, while the curriculum market is diverse, “in the case of
elementary mathematics, for example, the What Works Clearinghouse (WWC) has

6
identified over 70 different curriculum options” (Bhatt & Koedel, 2012, p. 392), there are
few rigorous, empirical evaluations of curricular effectiveness.
Currently, of the abundance of available elementary mathematics programs, only
a small number dominate elementary math instruction, many of which were developed to
align to The National Council of Teachers of Mathematics (NCTM) standards (1989,
2000). According to a 2008 survey, these curricula continue to dominate market share,
representing 91% of curricula used by K-2 educators (Resnick, Saliso, & Oda, 2010).
Still, little rigorous evidence exists to support one approach over another, thereby
providing educators little useful information about choosing one mathematics curriculum
over another.
Within the state of New Jersey and at the time of this study, the vast majority of
elementary and secondary teachers of mathematics were aligning their instructional
practices to the New Jersey Core Curriculum Content Standards (NJCCCS) for
mathematics (NJDOE, 1996, 2004, 2008) and have been doing so since the New Jersey
State Board of Education’s initial adoption of the standards in 1996. The NJCCCS for
mathematics were philosophically aligned with the NCTM’s Curriculum and Evaluation
Standards for School Mathematics (NCTM, 1989) but went beyond the NCTM standards
in a number of ways, adjusting for conditions specific to New Jersey (e.g., specifying
what should be done by the end of certain grade levels, repeating strands across grade
levels, and adding strands at each grade level to progress competencies along Bloom’s
taxonomy) (NJDOE, 2008). After the NCTM’s publication of Principles and Standards
for School Mathematics (NCTM, 2000), which replaced preceding publications, New
Jersey realigned its standards; however, it retained the content of its prior release, thereby

7
presenting no major departure from what was tested on the statewide assessments while
revising, primarily, the presentation of the standards (NJDOE, 2008). The NJCCCS’
adoption authorized New Jersey’s district boards of education to establish standards-
based curricula and instructional methodologies, thereby providing students with the
constitutionally-mandated system of “thorough and efficient” public school instruction
(N.J. Const. (1844) art. IV, § 7, ¶ 6 (as amended in 1875)).
In 2004, as district boards of education were mandated to ensure that curriculum,
instruction, and professional development were aligned to the New Jersey standards and
statewide assessments, a district, referred to in this study as the Large Northeastern Urban
Public School District, embarked on a district-wide overhaul of its K-5 mathematics
curriculum and implemented the Everyday Mathematics program (currently published by
the Wright Group/McGraw-Hill) in its more than 60 elementary schools, using district
budgets and grant dollars funded by the National Science Foundation’s (NSF) Systemic
Initiative Program. At that time, only 10% of all schools nationwide were using one of
three commercially published programs developed under NSF funding: Everyday
Mathematics, Math Trailblazers, or Investigations in Number, Data, and Space (Sconiers,
Isaacs, Higgins, McBride, & Kelso, 2003). By 2008, Everyday Mathematics was the
most widely used of the NSF-supported reform curricula (Slavin &Lake, 2008). In 2010,
the developers of the Everyday Mathematics curriculum reported that the curriculum was
used in more than 175,000 classrooms by approximately three million students.
Unfortunately, evidence of its effectiveness is limited (What Works Clearinghouse
[WWC], 2010). Of the 72 studies reviewed by the WWC investigating the effects of
Everyday Mathematics on student performance, 71 failed to meet either the WWC’s

8
evidence standards or eligibility screens. Only one study met the evidence standards, but
with reservations, finding a positive effect of the Everyday Math curriculum.
This begs the question, “How can there be limited conclusive data available for a
program that dominates market share?” Bhatt et al. (2012), in their study of the
curricular effectiveness of the three most popular curricula in Indiana, found the program
with the highest market share to be the least effective of the three programs studied, also
finding that the program did not lose market share during the state’s most recent adoption
cycle. The researchers attributed this to the decision makers’ lack of knowledge around
effective curricula, a practice that Chingos and Whitehurst (2012) describe as “choosing
blindly” (Chingos et al., 2012, title page).
The lack of information on curricular effectiveness has become more problematic
with the enactment of the Common Core State Standards. According to a recent survey,
the majority of the states and districts adopting the Common Core State Standards plan to
adopt new curriculum materials, assessments, instructional approaches, teacher induction
and professional development programs, and teacher evaluation systems based on the
standards (Kober & Rentner, 2011). Generally, curricular materials mediate the degree
to which content standards influence classroom instruction. Education decision makers
will need reliable evidence of curriculum effectiveness to make informed and
“economically sensible” decisions around new adoptions. This and similar studies
provide what Bhatt et al. refer to as “proof of concept” (Bhatt et al., 2013), demonstrating
the value of smaller, well-designed studies lending to larger inquiries of curricular
effectiveness and suggesting broader statewide systems for collecting longitudinal data
on the instructional materials currently in use (Chingos et al., 2012).

9
Purpose of the Study
The primary purpose of this study was to determine how two different curricula
aligned to two different sets of standards (NCTM and CCSSM) impacted fifth grade
performance on the New Jersey Assessment of Skills and Knowledge. This study
contributes to the larger body of research on curricular effectiveness and provides
education decision makers with valid, informative, and credible data to guide their
selection, development, and refinement of instructional programs.
Although many factors affect mathematics learning, one factor over which
schools have more immediate control is the mathematics program chosen to be
implemented by teachers (Slavin, Lake, & Groff, 2009). This sentiment is reaffirmed in
the opening line of NCTM’s research brief, Selecting the Right Curriculum, “One of the
most critical decisions educational leaders make is the selection of a mathematics
curriculum” (p. 1) and again in the NRC’s 2004 review of curriculum evaluation data
which notes that “knowing how effective a particular curriculum is, and for whom and
under what conditions it is effective, represents a valuable and irreplaceable source of
information for decision makers . . .” (p. 1). While many of the debates have centered on
“traditional” pedagogical approaches that emphasize “teacher-led instruction where
students receive step-by-step guidance for problem solving and are drilled in
implementation” (Bhatt et al., 2012, p. 393) versus “reform-based” curricula that
emphasize “student inquiry, real-world applications of problems, and the use of visual
aids for understanding” (p. 393), this study contributes to research that views curricular
effectiveness as an integrated judgment based upon of a series of independent evaluations
from multiple contexts (Bhatt et al., 2012; NRC, 2004; Slavin et al., 2009) and expands

10
its scope beyond “traditional-based” versus “reform-based” curricula comparisons. The
release of publications such as the NCTM Curriculum Focal Points (2006), the National
Mathematics Advisory Panel’s report (2008), and the Common Core State Standards
(2010), which communicate the mutually reinforcing balance between conceptual
understanding, computational and procedural fluency, and problem solving skills, will
cause the lines to blur when defining new and revised curricula seeking to strike that
balance.
Curriculum Descriptions
This study used student performance data from the 2011-2012 school year to
evaluate the curriculum effectiveness of two philosophically-dissimilar elementary school
mathematics curricula, Math in Focus: Singapore Math (published by Houghton Mifflin
Harcourt, 2010) and Everyday Mathematics, 3rd edition (currently published by the
Wright Group/McGraw-Hill, 2007) on Grade 5 mathematics performance in the Large
Northeastern Urban Public School District. One hundred Grade 5 general education
students in the four district public schools denoted as Singapore Math Experimental
Treatment sites and 105 Grade 5 general education students in the four district public
schools denoted as Everyday Math Alternative Treatment sites comprise the qualifying
samples (see Research Design/Methods).
The two curricula share similarities with regard to their emphasis on problem
solving and the use of visual aids for learning, two characteristics often associated with
“reform-based” instruction. Beyond the dimension of pedagogy, there are many other
differences between the curricula related to the organization and structure of the
programs, the treatment of topics, and the coverage of higher order topics.

11
Singapore Math
The Houghton Mifflin Harcourt-published Math in Focus: Singapore Math
program is referenced as Singapore Math within this study. The program is the United
States’ culturally sensitive translation of the Singapore version, My Pals Are Here!
Maths, 2nd Edition (Marshall Cavendish, 2008). The U.S. enhancements include the
addition of customary measurement, a teacher’s edition, a kindergarten component,
enhanced technology components, differentiated resources for reteaching and enrichment,
and transition components to address student deficiencies. The descriptive information
for the Singapore Math program was obtained from publicly available information on the
program publisher’s website and the What Works Clearinghouse’s (WWC) intervention
report. Some of the more critical analyses regarding the structural characteristics of
Singapore Math and Everyday Mathematics as cited in recent research and policy reports
are captured in Table 1. The Singapore Math program is organized in a mastery
framework where emphasis is distributed amongst the development of conceptual
understanding, procedural fluencies, and problem solving skills (Houghton Mifflin
Harcourt, 2011). The Singapore Math curriculum covers a relatively small number of
topics in depth and emphasizes essential math skills recommended in the NCTM
Curriculum Focal Points (NCTM, 2006), the National Mathematics Advisory Panel
(2008), and the Common Core State Standards (2010), though generally introducing
topics at earlier grade levels than set by Common Core State Standards1.
1 The 2010 Singapore Math program was aligned to the March 9, 2010, public draft of the CCSS for Mathematics© Copyright 2009 National Governors Association and Council of Chief State School Officers. Schools involved in the Singapore Math pilot aligned lessons, instruction, and formative assessment to the final version of the Common Core State Standards for Mathematics released June 2, 2010. Teachers were provided additional curriculum articulation documents (e.g., curriculum guides) to support alignment to the new standards.

12
Table 1. Differences between Everyday Mathematics and Singapore Math
Differences between Everyday Mathematics and Singapore Math
(Braams, 2003; Ginsberg et al., 2005; Hoven & Garelick, 2007; Isaacs, Carroll, & Bell,
2001; Klein, 2000; Wang & Birdwell, 2001)
Everyday Mathematics Singapore Math
Emphasizes reasoning, representation,
connections and problem solving, using
problem-based learning methods and real-
world situations
Introduces concepts broadly and integrates
them into real-life situations
Embeds philosophies aligned to discovery-
and constructivist-based approaches,
encouraging students’ own construction of
knowledge
Deemphasizes the utilization of standard
algorithms in advocacy of non-traditional
methods and the “invented procedures”
approach to algorithm development
Integrates the use of calculators in the early
grades to perform basic functions
Arranges topics in a helix, whereby practice is
distributed rather than massed; topics, to a
significant degree, repeat content across
grades
Emphasizes the development of conceptual
understanding through solving structured,
multistep mathematical problems
Tightly connects concrete and pictorial
examples within its presentation of
mathematical ideas to help students
understand and apply mathematical
abstractions
Embeds a balance of conceptual,
computational, and strategic problem-
solving skills
Establishes a strong foundation in numbers
in Grades 1-6; incorporating use of the
standard algorithms (e.g., multi-digit
addition, subtraction, multiplication and
division) at specific grade levels
Embeds heuristic strategies for solving
problems (e.g., use of a diagram or model).
Specifies and bounds mathematical topics
and outcomes in a sequence across grades
with a spiral approach that limits topic
repetition, building outward on prior
content. Emphasizes within-grade
proficiency and mastery of mathematical
priorities

13
The textbooks are designed to build a “deep understanding of mathematical
concepts with concrete illustrations that demonstrate how abstract mathematical concepts
are used to solve problems from different perspectives” (Ginsburg et al., 2005, p. xii).
The Singapore Math textbooks have a consistent emphasis on problem solving and model
drawing. Related topics are presented in self-contained units (massed approach),
encouraging the mastery of prior content.
At present, there are no published peer-reviewed studies analyzing the impact of
the Singapore Math approach on student achievement in an urban setting. The U.S.
Department of Education Institute of Education Sciences, through its research arm, the
WWC (2009), looked at 12 Singapore Math effectiveness studies released between 1983
and 2008, all of which were analyzed under the Middle School Math review protocol.
The WWC concluded that none of the subject studies met its evidence standards. Since
the studies were impossible to evaluate realistically, the WWC could not definitively
qualify the methodology as effective or ineffective.
Everyday Mathematics
According to the University of Chicago’s Comprehensive Summary of the
Scientific Research & Evidence of Effectiveness for the Everyday Mathematics program
(UCSMP, 2007), the Everyday Mathematics program is founded on three core principles:
(a) Students acquire knowledge and skills, and develop an understanding
of mathematics from their own experiences. Mathematics is more
meaningful when it is rooted in real-life contexts and situations, and when
children are given the opportunity to become actively involved in learning.
Teachers and other adults play a very important role in providing children

14
with rich and meaningful mathematical experiences. (b) Children begin
school with more mathematical knowledge and intuition than previously
believed. A K-6 curriculum should build on this intuitive and concrete
foundation, gradually helping children gain an understanding of the
abstract and symbolic and (c) Teachers, and their ability to provide
excellent instruction, are the key factors in the success of any program.
Previous efforts to reform mathematics instruction failed because they did
not adequately consider the working lives of teachers (UCSMP, 2007,
p. 5).
Of the 72 studies reviewed by the WWC (2010) investigating the effects of
Everyday Mathematics on student performance, 71 failed to meet either the WWC’s
evidence standards or eligibility screens. Only one study met the evidence standards but
“with reservations,” finding a positive effect of the Everyday Math curriculum.
Slavin and Lake (2007) reviewed four studies of Everyday Mathematics that met
their standards of review within their best-evidence synthesis of elementary programs in
mathematics. Of the four, only one small study used a prospective matched design
(Woodward & Baxter, 1997) and reported no significant differences between Everyday
Mathematics and control students (ES= -0.25).
The Riordan and Noyce (2001) post-hoc study of all Massachusetts schools that
had used Everyday Mathematics for two or more years, in comparison to matched
schools, reported modest results (ES= 0.15) for schools using the program for 2-3 years,
but reported a more significant effect size (ES= 0.35) among 19 schools that had used the
program for four or more years.

15
Research Questions
Curricula play a vital role in educational practice, providing “a crucial link
between standards and accountability measures” (NRC, 2004, p. 2).
This research sought to answer the question, “What is the impact of implementing
a proposed CCSSM-aligned mathematics program, Singapore Math, on the mathematics
achievement of Grade 5 general education students as measured by the 2012 Grade 5 NJ
ASK (NJ ASK5), in comparison to the mathematics achievement of Grade 5 general
education students using a NCTM-aligned elementary mathematics program, Everyday
Mathematics, in the Large Northeastern Urban Public School District?” Using composite
data of student performance in major categories–namely (a) overall achievement (b)
gender, and (c) subgroup (as defined by the NJDOE, 2010) economically disadvantaged,
White, African-American, Asian/Pacific Islander, American Indian/Native American,
Hispanic, and other–yields the following subsidiary research questions:
Subsidiary Question 1
How much variance in the 2012 NJ ASK5 mean scale score can be explained by
the predictor variables treatment, attendance, gender, race/ethnicity, and SES?
Subsidiary Question 2
Is there a statistically significant difference in the 2012 NJ ASK5 performance
level of students in the Everyday Math Alternative Treatment and the Singapore Math
Experimental Treatment when controlling for attendance?
Subsidiary Question 3
To what extent do differences in performance exist when data are analyzed
according to 2012 NJ ASK5 performance levels (Partially Proficient, Proficient, and

16
Advanced Proficient) and treatment status; and is there significant interaction between
the performance levels and treatment?
Subsidiary Question 4
Is there a statistically significant difference in the 2012 NJ ASK5 performance of
students in the Everyday Math Alternative Treatment and the Singapore Math
Experimental Treatment based on race/ethnicity (Black, Hispanic, White, subset of Black
and Hispanic); and is there significant interaction between treatment status and
race/ethnicity (Black, Hispanic, White, subset of Black and Hispanic)?
Subsidiary Question 5
How much variance in the 2012 NJ ASK5 mean scale score of Black students can
be explained by the predictor variables treatment, attendance, gender, and SES?
Subsidiary Question 6
How much variance in the 2012 NJ ASK5 mean scale score of Hispanic students
can be explained by the predictor variables treatment, attendance, gender, and SES?
Subsidiary Question 7
Is there a statistically significant difference in the 2012 NJ ASK5 performance of
Hispanic students based on SES classification and treatment status when controlling for
attendance; and is there significant interaction between treatment status and SES
classification for Hispanic students when controlling for attendance?
Significance of the Study
The Large Northeastern Urban Public School District (LSD), the focus for this
study, has been at the center of reform and improvement efforts in New Jersey for the
better part of 12 years. The results of these efforts are significant in that the district has

17
made substantial progress over the last few years, but it also has a long way to go before
it attains the level of excellence comparable to State benchmarks and beyond.
The district is a comprehensive system that serves the entire city, with 75 public
schools, 7,000 employees, and just under 40,000 students making it the largest school
system in New Jersey. As of the 2010 United States Census, there were 94,542
households, 277,140 people, and 61,641 families residing in the city with a racial makeup
of 52.35% African American, and 33.83% Hispanic or Latino (US Census Bureau, 2010).
At present, the district, one of the poorest in the United States, is classified by the
New Jersey Department of Education (NJDOE) as being in District Factor Group (DFG)
"A," the lowest, socioeconomically, of the eight groupings (NJDOE, 2004).
The city’s public schools continue to be among the lowest performing statewide,
even subsequent to its state government taking over management of the city's schools in
1995, this done under the presumption that improvement would follow. As of 2003, only
64% of its residents 25 years and over had graduated from high school and only 11% had
a bachelor's degree or higher. Among its residents 16 to 19 years old, 10% were dropouts
who had either never enrolled in school or had not graduated from high school (U.S.
Census Bureau, 2010). The data become even more sobering given that 98% of the
district’s college enrollees need remediation before they can go on to regular credit-
bearing math coursework at the local community college.
Existing research shows that the correlations between socioeconomic status and
cognitive ability as measured by educational performance are often quite significant
(Brooks-Gunn, Duncan, Klebanov, & Sealand, 1993; Brooks-Gunn, Guo, & Furstenberg,
1993; Gottfried, Gottfried, Bathurst, Guerin, & Parramore, 2003; Smith, Brooks-Gunn, &

18
Klebanov, 1997). “Significant gaps in achievement between student population groups–
the Black/White, Hispanic/White, and high-poverty/low-poverty gaps––are often close to
1 standard deviation in size” (Bloom, Black, & Lipsey, 2008, p. 172). This compels
district leaders to look critically at ways of ensuring that underserved low-income and
minority students are equitably represented and are successful within the K-16 continuum
and in seminal courses of study.
Slavin and Lake (2007) found that one such way of reducing mathematics
achievement gaps and improving overall achievement is by providing “low-performing
schools training and materials known to be markedly more effective than typical
programs. No Child Left Behind, for example, emphasizes the use of research-proven
programs to help schools meet their annual goals” (p. 3). Yet for such a strategy to be
effective, “knowing how effective a particular curriculum is, and for whom and under
what conditions it is effective, represents a valuable and irreplaceable source of
information for decision makers . . .” (NRC, 2004, p. 1). As this study intends to
interpret, compare, and summarize the achievement effects of two philosophically-
dissimilar enacted mathematics programs, it will contribute to current studies that attempt
to identify the essential organization, structure, and treatment of topics in mathematics
that serve as the necessary foundation for success as students progress toward more
complex topics in mathematics. In a system where educational decision making is
undertaken primarily at the state and local levels, state and local decision makers will
need valid, informative, and credible data on curricular effectiveness. The results from
this study could inform the district’s central administration of the potential impact of
mathematics programs on student performance and teacher practice, particularly in urban

19
environments where reducing achievement gaps and improving mathematics achievement
are often district-wide priorities.
Research Design/Methods
This investigation employed an explanatory non-experimental research design
using post hoc pre- and post-test data from 2010 NJ ASK3 and 2012 NJ ASK5
administrations, respectively. The study compared the mean mathematics scale scores for
sample populations on the 2012 NJ ASK5 and used 2010 NJ ASK3 scores to analyze pre-
treatment performance. Attention is given to various subgroups of general education
students within the study. The analyses are performed at the treatment level throughout.
The participants in this study were a group of Grade 5 students during the 2011-2012
school year from select schools within the Large Northeastern Urban Public School
District. As third grade students in 2009-2010, and presumably years prior, both groups
(Singapore Math Experimental Treatment and Everyday Math Alternative Treatment)
received math instruction using the NCTM-aligned program, Everyday Mathematics.
The Everyday Mathematics program was first used in all of the schools within the district
in the fall of 2004. Table 2 provides treatment level data (attendance, SES,
race/ethnicity, and performance). The measure of achievement is the New Jersey
Assessment of Skills and Knowledge (NJ ASK). The NJ ASK is a standards-based,
criterion-referenced test administered in mathematics and language arts, and is
administered in Grades 3-8. The mathematics portion of the NJ ASK assesses student
skills in four content clusters: (1) Number and Numerical Operations; (2) Geometry and
Measurement; (3) Patterns and Algebra; (4) Data Analysis, Probability, and Discrete
Mathematics; and one cluster assessing the Mathematical Processes. During the 2010-

20
2011 and 2011-2012 school years, the experimental treatment sites implemented the
Singapore Math program in all K-5 classrooms. During the same span of years, the
alternative treatment sites continued using the Everyday Mathematics program in all of
its K-5 classrooms.
Table 2. Treatment Level Data
Treatment Level Data
Everyday Math Singapore Math
N (Students) 105 100
Attendance Rate 95.92 94.58
Percent free/reduced lunch 86.7 85.0
Percent Male 41.9 39.0
Percent Female 58.1 61.0
Percent Black 47.6 51.0
Percent Hispanic 38.1 37.0
Percent White 13.3 11.0
Percent Other 1.0 1.0
Percent Proficient-NJ ASK3 74.3 66.0
Percent Proficient-NJ ASK5 85.7 71.0
Researcher Bias
At the time of the study, I was employed in the same district in which the study
took place as the district’s K-12 Director of Mathematics. My responsibilities included
the review, implementation, monitoring, and evaluation of all existing mathematics
curricula used within the district, thereby placing me in direct contact with all school
administrators and teachers in both the experimental and alternative treatment schools.
Beyond the district-wide, needs-driven professional development offered to the entire

21
district throughout each school year, I coordinated ongoing on-site and off-site
professional development to the experimental treatment sites for teachers, administrators,
and school-based professional development teams to support the 2010-2011 and 2011-
2012 implementation of the Singapore Math program. Professional development in year
one of the Singapore Math pilot provided teachers with in-depth, hands-on experiences
with the program.
Grade level workshops introduced participants to the philosophy, components,
mathematics content, and pedagogy of the Singapore Math curriculum. Participants
worked with the fundamentals of the program, learning the essential math concepts at
their grade level. Special emphasis was placed on the structure of each lesson, alignment
to the Common Core State Standards for mathematics, and anticipating the obstacles that
might occur when teaching the Singapore Math pedagogy.
Professional development in year two of the pilot built on the first year’s trainings
and emphasized job-embedded practices presented in three professional development
formats: coaching, demonstration lessons, and lesson studies. Emerging research shows
that professional development training has the highest impact on classroom practice when
it is supported with demonstration lessons and classroom coaching (Ai & Rivera, 2003;
Neufeld & Roper, 2003; Poglinco et al., 2003). Whereas this study did not control for
variables relating to teacher quality, teacher knowledge of mathematics, or their varying
levels of professional development, the professional development providers and the
district’s existing classroom monitoring and accountability systems sought to support
implementation of curricula in all district schools in ways consistent with typical district
practices.

22
Limitations
In this study, groups were not assigned through the mechanism of randomization.
Samples were selected from already existing populations. The study used eight intact,
matched comparison groups considered similar as the experimental treatment and
alternative treatment groups. The Everyday Mathematics alternative treatment sites had
been using iterations of the program as their core curriculum since district-wide adoption
in school year 2004-2005. The four experimental treatment sites using the Singapore
Math program as their core program had been doing so since school year 2010-2011.
This study did not control for the additional variables relating to teacher affect,
teacher quality, teachers’ knowledge of mathematics, or the varying levels of professional
development related to mathematics instructional topics. There are no formal
observations data of classroom instruction related specifically to the level of
implementation for either treatment group; and while the district did not mandate a
minimum or maximum level of implementation, the professional development providers
and the district’s existing classroom monitoring and accountability systems sought to
support implementation in ways consistent with typical district practices.
While reading level may contribute to variances observed (Sconiers et al., 2002),
this study did not control for reading level.
This study did not control for additional variables relating to the impact of student
intelligence beyond prior mathematics achievement. According to Embretson (1995),
general intelligence, described as the ability to think logically and systematically, is the
best individual predictor of achievement across academic domains, including

23
mathematics (Deary, Strand, Smith, & Fernandes, 2007; Jensen, 1998; Stevenson, Parker,
Wilkinson, Hegion, & Fish, 1976; Taub, Floyd, Keith, & McGrew, 2008; Walberg,
1984). In a five-year prospective study of more than 70,000 students, Geary (2011)
found that general intelligence, assessed at age 11 years, explained nearly 60% of the
variation on national mathematics tests when assessed at age 16 years. Despite the high
heritability of intelligence and the correlation between intelligence and mathematics
achievement (Kovas, Harlaar, Petrill, & Plomin, 2005), “findings such as these do not
indicate educational interventions will not affect academic outcomes” (Geary, p. 1540).
There is a two-year difference between the pre-test assessment and the post-test
assessment. While normal maturation could account for gains over the two-year period,
summative evaluations used in examining curricular effectiveness for curricula that are
“discontinuous with traditional practice, [require that care] be taken to ensure that
adequate commitment and capacity exists for successful implementation as change”
(NRC, 2004, p. 61). It can take “up to three years for a dramatic curricular change to be
reliably implemented in schools” (p. 61).
While it is a common practice to measure students' performance over a period of
time or to analyze the trend of a subject in a particular grade over different years (Leung,
2003), the NJDOE does not claim that the NJ ASK assessments are vertically equated;
cautioning schools and districts to use the NJ ASK results “along with other indicators of
student progress, to identify those students who may need instructional support in any of
the content areas” (NJDOE, p. 3). Therefore, cross-grade comparisons cannot be made
(NJDOE, 2011, 2013).

24
Although each of the participating schools is required by the district to provide
math instruction a minimum of five days per week and for a minimum of 50 minutes each
day (District File code: 6156 instructional planning/scheduling), this study did not
address actual “seat time” extending beyond the 50-minute mandate.
At the time of this study, the NJ ASK tests were aligned to New Jersey State’s
Core Curriculum Content Standards2 (NJCCCS). Since the NJCCCS for mathematics
were philosophically aligned with the NCTM standards (1989, 2000), as is the Everyday
Mathematics program, the Everyday Math Alternative Treatment group have a presumed
degree of advantage over the Singapore Math Experimental Treatment group.
A final limitation of the study reflects the relatively small sample size, which
potentially impacts statistical power, type II error, and statistical significance (Cohen,
1988). High levels of student mobility and restricting the analysis to in-district Grade 5
general education students who were administered both the 2010 NJ ASK3 and the 2012
NJ ASK5 at their respective sites reduced the qualifying sample sizes by 14.7% - 28.7%.
Restricting the sample leaves a total sample size of 205 students. For this reason it may
not be possible to make generalizations about the findings to the broader community
based on this study alone.
2 The 2012-2013 NJ ASK (Grades 3-5) measured the CCSS within the current NJ ASK blueprint. The
2013-2014 NJ ASK (Grades 3-8) will measure the CCSS within the NJ ASK blueprint.

25
Delimitations
The scope of this study is the comparison of two elementary mathematics
instructional programs, Singapore Math and Everyday Mathematics, and the analysis of
the differences among NJ ASK mean scale scores for Grade 5 general education3 students
in regular education classroom settings. The study delimited the population to general
education students who, at the time of the administration of the NJ ASK3 and NJ ASK5,
were not identified as (a) having less than one year in the school district (b) special
education4 classified (b) Limited English Proficient5 classified (d) taking the Spanish
version of the NJ ASK3 for mathematics, (e) having less than one year in the school, (f)
out-of-district placement, and (g) out-of-residency placement. The study further
delimited the sample population to students who were administered both the 2010 NJ
ASK3 and the 2012 NJ ASK5 at their respective sites.
The analyses of individual clusters were not included in the design due to the
reported 2012 NJ ASK5 reliability coefficient alphas with ranges from .41 - .78 per
cluster (NJDOE, 2013).
3 General education students received no special testing accommodations during NJ ASK administration
(NJDOE, 2011, 2013).
4 Students with Disabilities not exempted from taking the NJ ASK can be tested with accommodations (in
setting and/or scheduling) and/or modifications (in testing materials and/or testing procedures) as specified
by their Individualized Education Programs (IEP) or 504 plans (NJDOE, 2011, 2013).
5 Limited English Proficient students who do not take the Spanish form of the NJ ASK can be tested with
accommodations (e.g. 150% additional administration time, translation of directions in student’s native
tongue, and/or use of a bilingual dictionary) (NJDOE, 2011, 2013).

26
Definition of Terms
Alignment – Curriculum Alignment is an agreement of what is written, taught, and tested
and reflects a mapping of the curricular objectives addressed in the materials to the
national, state, or local standards or curricular frameworks. See definitions for CCSS-
aligned NJCCCS-aligned that follow. Based on a review of literature (La Marca,
Redfield, & Winter, 2000), several dimensions of alignment have been identified. The
two overarching dimensions are content match and depth match. Content match refers to
topical correspondence, while depth alignment refers to the match between the cognitive
complexity of the knowledge/skill prescribed by the standards (Webb 1997, 1999).
College and Career Readiness – The level of preparation a student needs in order to
enroll and succeed—without remediation—in a credit-bearing course at a postsecondary
institution that offers a baccalaureate degree or transfer to a baccalaureate program, or
into a high-quality certificate program that enables students to enter a career pathway
with potential future advancement (Conley, 2007).
Common Core State Standards – The Common Core State Standards (CCSS) outline a
body of knowledge, skills, and fluencies students must master at each grade level to
graduate from high school “college and career ready” in the 21st century.
Common Core State Standards-Aligned (CCSS-aligned) – The K–8 Publishers’
Criteria for the Common Core State Standards for Mathematics outlines a set of 10
criteria centered on focus, coherence, and rigor as the main themes that serve to inform
purchases and adoption of, and modifications to, new and existing published resources.
The criteria can be used to “test claims of alignment” (Daro, McCallum, & Zimba, 2012,
p. 6).

27
Curriculum – Curriculum, in this study, is used to refer to a set of materials for use at
each grade level. It generally includes accompanying ancillary materials (e.g., teacher’s
guides, resources for differentiation, homework, assessments, materials for parents, and
so forth). The materials include recommendations for pacing of lessons and the
sequencing of topics. Within this study, the term is used interchangeably, where fitting,
with “program.’”
District Factor Grouping (DFG) – A system for ranking New Jersey school districts by
their socioeconomic status (SES). Introduced by the NJDOE in 1975 based on 1970
Census data, identified groupings are periodically updated, taking into account new
Census data. The most recent revision took place in 2004, using the 2000 Census. From
lowest socioeconomic status to highest, the categories are A, B, CD, DE, FG, GH, I, and
J (New Jersey Department of Education, 2004).
Enacted Curriculum – The actual curricular content in which students engage in the
classroom. The enacted curriculum highlights the content that students have the
opportunity to learn.
Ethnicity – A student's racial designation as reported to the State of New Jersey based on
information gathered upon student registration in a school district. New Jersey School
Report Cards include the designations White, Black, Asian/Pacific Islander, American
Indian/Alaska Native, Hispanic, and Other.
Everyday Mathematics Program – Originally developed in 1985, Everyday
Mathematics is a Kindergarten through Grade 6 mathematics curriculum developed by
the University of Chicago School Mathematics Project. It was based on principles typical
of NSF-supported reform curricula; and its design, generally, is reflective of

28
constructivist theories of learning (Steffe & Cobb, 1988; Steffe & Gale, 1995). The
Everyday Mathematics program reflects alternative perspectives to teaching, asserting
that students are capable of inventing and applying their own efficient procedures (Kamii
& Domenick, 1998), and encourages the delay of introducing formal algorithms, fearing
delays in the development of number sense and problem solving skills.
General Education – Students not included as LEP or special education in the reporting
of NJ ASK assessment data.
Large Northeastern Urban Public School District Regions – As a part of the 2009
reorganization, oversight for the district's geographical areas was divided according to
regions – North, South, East/Central and West. Theoretically, the reorganization allowed
more support to students by bringing resources closer to the schools through the four
regional offices. Each regional office is led by a Regional Superintendent. High Schools
were merged with the elementary feeder schools to encourage a K-12 articulation.
Limited English Proficient (LEP) – In New Jersey, Limited English Proficient students
are those whose performance on an approved test of listening, speaking, reading, and
writing of English identifies them as needing additional, specialized English instruction
from an appropriately certificated teacher.
National Assessment of Educational Progress (NAEP) – Also known as “The Nation’s
Report Card,” the NAEP has charted U.S. student performance for the past three decades
(Campbell, Hombo, & Mazzeo, 2000) and is the only nationally representative,
continuing assessment of what students know and can do in a variety of academic
subjects, including reading, writing, civics, science, and mathematics in Grades 4, 8, and
12 (National Science Board, 2004). The NAEP’s mathematics framework contains five

29
broad content strands (number sense; properties and operations; measurement; geometry
and special sense; data analysis, statistics, and probability; and algebra and functions).
The assessment also tests mathematics abilities (conceptual understanding, procedural
knowledge, and problem solving, and mathematics power (reasoning, connections and
communication).
New Jersey Assessment of Skills and Knowledge (NJ ASK) – The NJ ASK tests are a
series of state assessments aligned to the New Jersey Core Curriculum Content Standards
and are administered to New Jersey public school students in Grades 3-8 to determine the
level of student achievement in language arts, mathematics, and science. The NJ ASK
tests were implemented in 2003 in response to the requirements of NCLB legislation.
The assessment is a standardized test given to all New Jersey public school students in
grades 3-8 during March, April, and/or May and is administered by the New Jersey
Department of Education.
New Jersey Core Curriculum Content Standards (NJCCCS) – The New Jersey Core
Curriculum Content Standards6 (NJDOE, 1996, 2004, 2008) were originally adopted in
1996 in an effort to define what students should know and be able to do at the end of their
K-12 public school education. The Standards seek to articulate the important knowledge
and skills all students should master (New Jersey Department of Education, 2008a).
New Jersey Core Curriculum Content Standards–Aligned (NJCCCS-aligned) –
Those textbooks, curricula, philosophies, and instructional methodologies mapped to
curricular objectives addressed in the New Jersey Core Curriculum Content Standards
(NJDOE, 1996, 2004, 2008) and its accompanying curricular frameworks.
6 The 2012-2013 NJ ASK (grades 3-5) measured the CCSS within the current NJ ASK blueprint. The 2013-
2014 NJ ASK (grades 3-8) will measure the CCSS within the NJ ASK blueprint.

30
No Child Left Behind (NCLB) – Public Law 107-1 10 passed by the U.S. Congress and
signed into law on January 8, 2002. The No Child Left Behind Act of 2001 (U.S.
Department of Education, 2002) was originally put forth by President George W. Bush
on January 21, 2001. The law reauthorized the Elementary and Secondary Education Act
of 1965.
Race to the Top – The American Reinvestment and Recovery Act provides $4.35 billion
for the Race to the Top Fund, a competitive grant program designed to reward states that
create conditions for education innovation and reform, achieve significant improvement
in student outcomes, and implement ambitious plans in core areas of education reform
(standards, instruction, assessment, data, teacher/principal recruitment, retention,
evaluation, and school turnaround).
Singapore Math Program – The Houghton Mifflin Harcourt-published Math in Focus:
Singapore Math program is referenced as Singapore Math within this study. The
Singapore Math program is a kindergarten through eighth grade mathematics
instructional curriculum developed by Marshall Cavendish/Singapore Ministry of
Education. The program is organized in a mastery framework in which emphasis is
distributed among the development of conceptual understanding, procedural fluencies,
and problem-solving skills (Houghton Mifflin Harcourt Specialized Curriculum Common
Core Overview, 2011).
Socioeconomic Status (SES) – A student’s socioeconomic status is defined as
economically disadvantaged or non-economically disadvantaged under New Jersey
Department of Education guidelines. Economically disadvantaged is the status attributed
to a student qualifying for free or reduced-price lunch and is based upon family income

31
level, parents' educational attainment, and parents' occupation as defined by the U.S.
government under the National School Lunch Program (NLSP).
Students with Disabilities – A broadly defined group of students with physical and/or
mental impairments such as blindness or learning disabilities that might make it more
difficult for them to do well on assessments without accommodations or adaptations.
Students with disabilities are protected under the Individuals with Disabilities Education
Act (IDEA), a federal law that ensures public schools serve the educational needs of
students with disabilities. IDEA requires that schools provide special education services
to eligible students as outlined in a student’s Individualized Education Program (IEP).

32
CHAPTER II
REVIEW OF THE LITERATURE
Introduction
A broad literature search was conducted in an attempt to locate literature that (1)
provides the historical background for my research, (2) positions this work within its
related and current context, (3) informs relevant theories and concepts underpinning my
research, (4) illustrates how this research challenges, expands, or addresses gaps within
the current bodies of related work, and (5) underlines the significance of the bodies of
work relating to the problem presented (Ridley, 2008). This included obtaining reviews
of mathematics programs, searches of educational databases (JSTOR, ERIC, EBSCO,
Dissertation Abstracts), and examinations of peer-reviewed journals, edited volumes,
government reports, web-based repositories, and mathematics education publishers’
websites.
Chapter II begins with an examination of the two historically significant sets of
mathematics standards that influenced the development and refinement of the curricula
evaluated in this study–the National Council of Teachers of Mathematics (NCTM)
standards and the Common Core State Standards for mathematics (CCSSM). The NCTM
standards (1989, 2000), the predecessor of the two, presented opportunities for systemic
improvement in mathematics education in the United States and influenced new
curriculum projects and changes to existing state standards. The CCSSM, emerging
roughly 20 years later, built on the work of the NCTM standards (2006) to define a
kindergarten through high school progression and promote college and career readiness.
As research supports that success in mathematics, particularly at the higher levels, yields

33
college and career options, and increases prospects for future income (Bozick, Ingels, &
Owings, 2008; Carnevale & Desrochers, 2003; Cuoco, Goldenberg, & Mark, 1997;
Gamoran & Hannegan, 2000; Rose & Betts, 2001), Chapter II includes research on
algebraic readiness (a specific aim of the CCSSM) as a pre-determinant of college and
career readiness and the additional high priority content in the elementary and secondary
grades that converges to a study of “a full body of algebraic material” (NMAP, 2008, p.
xvii). Cognitive development is then discussed as it relates to the specific mathematical
competencies that have been found to have a sustained impact on mathematical
understandings. The development of effective strategies for improving the educational
trajectory of early math learners is contingent on identifying areas of early quantitative
knowledge that influence later mathematics achievement (Duncan et al., 2007; Geary,
2011; Jordan, Kaplan, Ramineni, & Locuniak, 2009; Locuniak & Jordan, 2008). Because
this study intends to reveal how the implementation of elementary school mathematics
curricula is related to mathematics skill acquisition, it is important to know not only the
factors that make a difference in the early grades above and beyond intelligence and other
abilities, but also the defining characteristics of programs introduced in the elementary
grades that consistently result in sustained cognitive growth in mathematics. A portion of
the Review of Literature is devoted to curriculum effectiveness studies, particularly those
that are current and seminal in the field of curriculum effectiveness, and then outlines
current findings relating specifically to the mathematics programs explored in this study
and their documented impact on student achievement. Chapter II concludes with a
discussion of the variables that have, historically, linked significantly to mathematics
performance (gender, SES, race/ethnicity, and attendance).

34
Evolution of the NCTM Standards
The release of the controversial documents Agenda for Action in 1980 and A
Nation at Risk in 1983 focused media attention on educational policy, particularly the
status of mathematics education in American schools (Dindyal, 2009) and contributed to
the perceptions that the United States is failing its students. A Nation at Risk (1983)
presented concerns about the state of U.S. public education and challenged the U.S.’s
status of preeminence in commerce, industry, science, and technological innovation. The
report declared that minimum-competency exams had "become the maximum thus
lowering educational standards for all" (p. 63) and recommended that "high school
graduation requirements be strengthened" (p. 70). Consequently, high school exit exams
gained popularity among employers and policymakers as a means of ensuring that
students who received high school diplomas had mastered basic skills in reading, writing,
and mathematics (Amrein & Berliner, 2002; Dorn, 2003; Thurlow & Esler, 2000).
Educating Americans for the 21st Century (1983) called for local districts to "revise their
elementary school schedules to provide consistent and sustained attention to
mathematics, science, and technology” (The National Science Board Commission on
Precollege Education in Mathematics, Science, and Technology, 1983, p. x). In 1991, the
Secretary's Commission on Achieving Necessary Skills (SCANS, 1991) echoed these
concerns; asking schools to "determine new standards, curricula, teaching methods, and
materials" (p. 16) for teaching the core subjects (history, geography, science, English, and
mathematics).

35
In 1994, following President George H. W. Bush’s 1989 Educate Summit
Conference, The Goals 2000: Educate America Act (P.L. 103-227) was signed by
Congress, marking a shift from state to federal control of educational standards. The
legislation required increased outcome-based measures of accountability for public
education. As noted by Horn (2005), the result was a set of “voluntary” national
standards for all core content areas, “expanded graduation requirements and, more
recently, a stringent system of institutional checks and consequences, outlined by the
2001 NCLB legislation” (p. 5).
Concurrently emerging during this time was a renewed interest in cognitive
theories and social aspects of learning, thereby paving the way for more qualitative,
student-centered, inquiry-based approaches in mathematics education. Constructivism,
as presented by Confrey and Kazak (2006), “served as a means of prying mathematics
education from its sole identification with the formal structure of mathematics as the sole
guide to curricular scope and sequence. It created a means to examine that mathematics
from a new perspective, the eyes, mind and hands of the child” (p. 306).
Constructivism evolved and became, in practice, a way of addressing “students’
weak conceptual understanding with over-developed procedures and students
demonstrated difficulties with recall and transfer to new tasks” (NRC, p. 306).
Constructivism focused teaching, more so, on the active involvement and
participation of children and the strengths and resources they brought to the tasks. In
practice, it rejected prior theories that placed emphasis on set language, properties,
proofs, and abstractions that characterized the “New Math” era of the 1960s and further
deemphasized arithmetic computation, rote memorization of algorithms and basic

36
arithmetic facts–competencies that characterized the “Back to Basics” movements of the
late 1970s and early 1980s. Favored by The National Council of Teachers of
Mathematics (NCTM), constructivist thinking established the context for the emergence
of the Curriculum and Evaluation Standards for School Mathematics (1989) (which will
be referred to as the NCTM Standards).
The 1989 NCTM Standards codified what had been outlined in the Council’s
earlier policy release, An Agenda for Action (1980). The standards, “viewed as a
promising new approach for translating and infusing research results into classroom
practice” (NRC, 2004, p. 12), (a) shifted teaching toward new child-centered, minimal
guidance approaches, (b) placed problem solving at the forefront of mathematics
instruction, (c) eschewed any practices that could potentially hinder access to problem
solving (e.g., paper-pencil calculations for numbers with more than 2 digits, mastery of
basic skills, emphasis on standard algorithms), and (d) supported practices that would
make problem solving more accessible (e.g., use of calculators and manipulatives).
Advocates of the NCTM Standards were the catalysts for successive NCTM documents
that set guidelines for mathematics teaching and assessment: The Professional Teaching
Standards for Teaching Mathematics published in 1991 and the Assessment Standards for
School Mathematics published in 1995. The NCTM’s triadic reaction slowly reformed
the manner in which mathematics was taught in the United States (Ward, 2009). By 1997
the vast majority of state departments of education had adopted mathematics standards
closely aligned with the NCTM standards.
The reauthorization of the NCTM standards in 2000 placed increased emphasis on
critical thinking and problem solving and stimulated the development of reform-based

37
curriculum programs. These reform programs were designed to increase students'
conceptual understandings within the five content standards–numbers and operations,
algebra, geometry, measurement, and data analysis and probability–and through five
process standards–problem solving, reasoning and proof, communication, connections,
and representation (NCTM, 2000).
As standards reform efforts gained in popularity, a number of National Science
Foundation (NSF)-funded curriculum projects, aligned to the new standards, emerged.
Between 1988 and 1999, three NSF-supported elementary mathematics curriculum
projects were developed to promote widespread implementation of mathematics curricula
reflective of the NCTM Standards: Investigations in Number, Data and Space (Technical
Education Research Centers, 1998), Math Trailblazers: A Mathematical Journey Using
Science and Language Arts (Institute for Mathematics and Science Education, 1999), and
University of Chicago’s Everyday Mathematics (Bell et al., 1988-1996).
Between 1990 and 2007, the NSF devoted approximately $93 million to the development
and revisions of thirteen mathematics curricula in an effort to accomplish their initial
goal: “to stimulate the development of exemplary educational models and materials . . .”
(NSF, 1989, p. 1).
Evolution of the Common Core State Standards
In 2009, under President Obama’s administration, Secretary of Education Arne
Duncan tied eligibility for the four billion dollar Race to the Top program of competitive
federal grants to participation in the Common Core effort. The federal government
invested additional financial support to the Common Core Initiative by setting aside $350

38
Figure 1. Degree of Congruence between State Standards and the CCCSM
million for the Common Core State Standards’ accountability measure, assessments tied
to national standards (U.S. Department of Education, 2009). The aim of this bipartisan
movement was to upgrade and unify elementary and secondary school standards to
ensure college and career readiness, offering the benefits of shared expectations and
improved focus and efficiency that would extend to other sectors of education; e.g.,
teacher development, the development of curricular materials, pre-service teacher
education, and the delivery of quality electronic and computer-adaptive assessments
(Hwang, McMaken, Porter, & Yang, 2011).
According to Hwang et al. (2011), the Common Core State Standards “represent
an unprecedented shift away from the disparate content guidelines found across
individual states in the areas of English language arts and mathematics” (p. 103) and
present a less than modest shift away from current practice (see Figure 1).
Managed by the National Governors Association Center for Best Practices (NGA)
and the Council of Chief State School Officers (CCSSO) and prompted by the United

39
States Department of Education and support from the Bill and Melinda Gates Foundation,
by June 1, 2011, the Common Core State Standards Initiative [CCSSI], had been adopted
by 44 states, the District of Columbia, and the U.S. Virgin Islands (CCSSI, 2010). The
initiative represented the first significant attempt in the nation’s history to systematically
align common K-12 mathematics standards across the states, building upon previous
efforts to create a national vision for mathematics education, including that of the
National Council of Teachers of Mathematics’ standards documents (NCTM, 1989, 2000,
2006).
The case for national standards can be made by the need to level academic
expectations for all students. Predictably, the Common Core State Standards for
Mathematics (CCSSM) will become more entrenched in state education policy and will
inevitably stimulate significant and immediate revisions in state mathematics
assessments, curriculum materials (Porter, McMaken, Hwang, & Yang, 2011), and
eventually teacher practice.
According to Corcoran, Mosher, and Rogat (2011), the “standards-based reform
movement of the last few decades attempted to shift the norms of teaching away from
just delivering the content and towards taking more responsibility for helping all students
at least to achieve adequate levels of performance in core subjects. Initial state-wide
content standards, as they have been tied to grade levels, can be seen as a first
approximation of an order in which students should learn the required content and skills”
(p. 16).
However, current state standards tend to be more prescriptive than they are
descriptive. They define the order in which, and the time or grade by which, students

40
should learn specific content and skills. Typically, state standards have not been deeply
rooted in empirical studies exploring the ways in which children’s thinking and
understanding of mathematics actually develop in interaction with instruction. “Rather
they usually have been compromises derived from the disciplinary logic of mathematics
itself, experience with the ways mathematics has usually been taught, as reflected in
textbooks and teachers’ practical wisdom, and lobbying and special pleading on behalf of
influential individuals and groups arguing for inclusion of particular topics or particular
ideas about ‘reform’ or ‘the basics’” (p. 16).
Corcoran et al. (2011) emphasize that “absent a strong grounding in research on
student learning, state standards tend, at best, to be lists of mathematics topics and some
indication of when they should be taught grade by grade without explicit attention being
paid to how those topics relate to each other” (p. 17). They advocate, instead, for a more
focused approach by which students have the opportunities over time to “develop a
coherent understanding of core mathematical concepts” (p. 17). Because of the
cumulative nature of mathematics, “a weak curriculum can limit and constrain instruction
beyond the K-12 years” (NRC, 2004, p. 13).
Schmidt et al. (1997) found that countries with more focused curriculum designs
outperformed the United States on the 1995 Third International Mathematics and Science
Study. Subsequent studies (Schmidt et al., 2001, 2005) drew similar conclusions, noting
that higher achieving countries, later termed A+ countries (Schmidt, Wang, & McKnight,
2005), focused deliberately on fewer topics and the more rigorous cognitive domains
(Darling-Hammond & McCloskey, 2008). Porter, Politkoff, and Smithson (2009) found

41
that state standards, in general, tend to favor the coverage of “laundry lists of small
topics” (p. 240).
Schmidt et al. (2005) identified three defining common characteristics
exemplified throughout the national standards of the A+ countries (e.g., England,
Finland, Hong Kong, Japan, and Singapore): focus, rigor, and coherence. Their recent
study (2012) revealed a high degree of alignment between the CCSSM and the standards
of the highest-achieving nations on the 1995 TIMSS (Schmidt et al., 2012, p. 294).
In the course of developing the CCSS, the CCSS writing team consulted
numerous international models, including those from Ireland, Finland, New Zealand,
Australia (by state), Canada (by province), Singapore, the United Kingdom, and others
(CCSSI, 2010). Ginsburg, Leinwand, and Decker (2009) note the benefit of allowing
high-performing countries to influence benchmarks, writing “the composite standards [of
Hong Kong, Korea and Singapore] have a number of features that can inform an
international benchmarking process for the development of K–6 mathematics standards in
the United States. First, the composite standards concentrate the early learning of
mathematics on the number, measurement, and geometry strands with less emphasis on
data analysis and little exposure to algebra” (NGA, CCSSO, 2009, p. 2).
The CCSSM were built on progressions that bridge core mathematical topics
across a number of grade levels whereby grade placements for specific topics were made
“on the basis of state and international comparisons” (CCSSI, 2010b, p. 5). These
progressions were informed both by research on children's cognitive development and by
the logical structure of mathematics and echo the definition of coherence defined by
Schmidt et al. (2005), “Standards that are articulated over time as a sequence of topics

42
and performances that are logical and reflect, where appropriate, the sequential and
hierarchical nature of the disciplinary content from which the subject matter derives” (p.
528). Further, an inherent aspect of the design of the CCSSM is that they “map back” to
the K-12 grades from the college and career-ready secondary standards.
The Common Core State Standards codify a set of benchmarks, deemed
“international benchmarks” (CCSSI, 2010b, p. x) designed to serve as the anchor for
every state’s system of high school completion assessments and graduation requirements.
Research supports that a strong grounding in high school mathematics,
particularly through algebra or higher, correlates with increased career options and
prospects for future income (Bozick, Ingels, & Owings, 2008; Carnevale & Desrochers,
2003; Cuoco, Goldenberg, & Mark, 1997; Gamoran & Hannegan, 2000; National
Mathematics Advisory Panel, 2008; Rose & Betts, 2001).
Mathematics in the Earlier Grades
In his 1997 publication entitled How the Mind Works, Steven Pinker writes,
"Mathematics is ruthlessly cumulative, all the way back to counting to ten" (p. 341).
The evidence concerning college and career readiness shows clearly that the
knowledge, skills, and practices important for readiness include a great deal of
prerequisite mathematics. As much of the highest priority content for college and career
readiness comes from Grades 6–8 (Partnership for Assessment for Readiness of College
and Careers [PARCC], 2011, Appendix A), the mathematics that children learn from
preschool through the middle grades provides the basic foundation for algebra and more
advanced mathematics coursework.
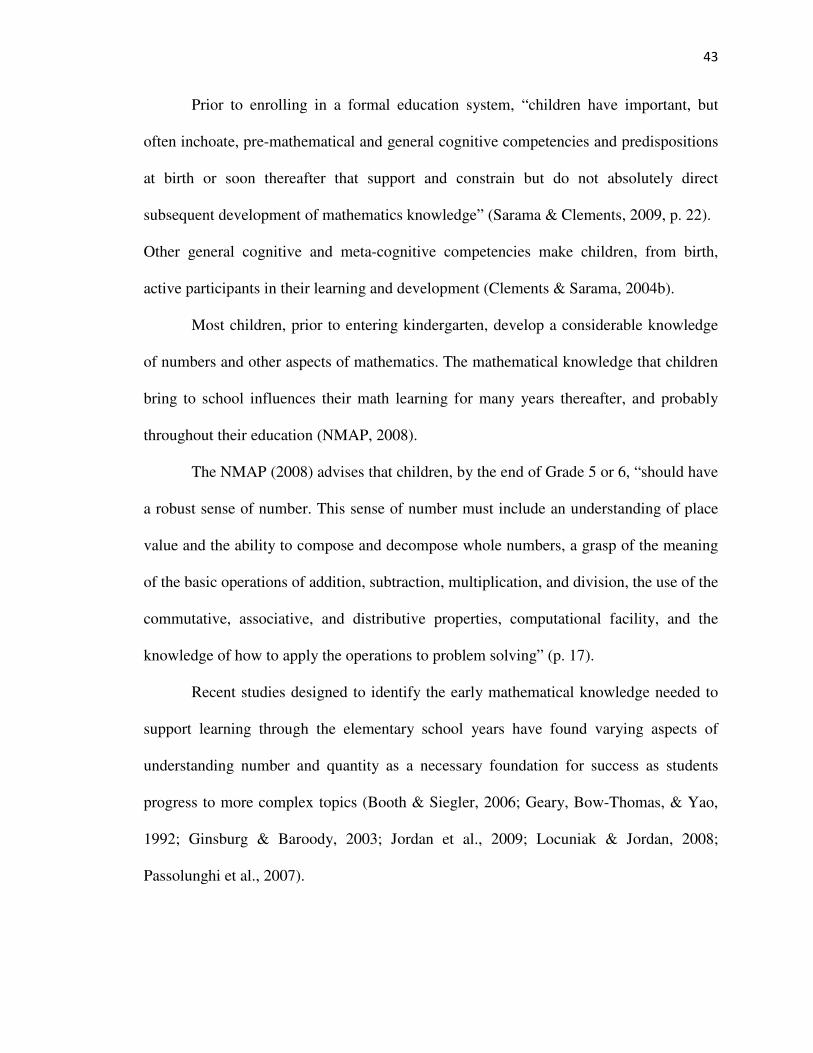
43
Prior to enrolling in a formal education system, “children have important, but
often inchoate, pre-mathematical and general cognitive competencies and predispositions
at birth or soon thereafter that support and constrain but do not absolutely direct
subsequent development of mathematics knowledge” (Sarama & Clements, 2009, p. 22).
Other general cognitive and meta-cognitive competencies make children, from birth,
active participants in their learning and development (Clements & Sarama, 2004b).
Most children, prior to entering kindergarten, develop a considerable knowledge
of numbers and other aspects of mathematics. The mathematical knowledge that children
bring to school influences their math learning for many years thereafter, and probably
throughout their education (NMAP, 2008).
The NMAP (2008) advises that children, by the end of Grade 5 or 6, “should have
a robust sense of number. This sense of number must include an understanding of place
value and the ability to compose and decompose whole numbers, a grasp of the meaning
of the basic operations of addition, subtraction, multiplication, and division, the use of the
commutative, associative, and distributive properties, computational facility, and the
knowledge of how to apply the operations to problem solving” (p. 17).
Recent studies designed to identify the early mathematical knowledge needed to
support learning through the elementary school years have found varying aspects of
understanding number and quantity as a necessary foundation for success as students
progress to more complex topics (Booth & Siegler, 2006; Geary, Bow-Thomas, & Yao,
1992; Ginsburg & Baroody, 2003; Jordan et al., 2009; Locuniak & Jordan, 2008;
Passolunghi et al., 2007).

44
An understanding of number and quantity, as specific competencies, has been
found to have a sustained impact on subsequent mathematical understanding beyond the
early grades. The development of effective strategies for improving the educational
trajectory is contingent on identifying areas of early quantitative knowledge that
influence later mathematics achievement. Relevant longitudinal studies have tracked the
relationship between early mathematics achievement and later achievement (Duncan et
al., 2007); early quantitative knowledge and later achievement (Jordan, Kaplan,
Ramineni, & Locuniak, 2009; Locuniak & Jordan, 2008); and early cognitive abilities,
such as working memory, and later achievement or later performance on specific
quantitative tasks (Bull, Espy, & Wiebe, 2008; Krajewski & Schneider, 2009).
National achievement data (NCES, 2009) show that elementary school students in
the United States, particularly those from low socioeconomic backgrounds, have weak
math skills. In fact, data show that, even before they enter elementary school, children
from disadvantaged backgrounds are behind their more advantaged peers in basic
competencies such as number-line ordering and magnitude comparison (Rathbun &West,
2004). Furthermore, after a year of kindergarten, disadvantaged students still have less
extensive knowledge of mathematics than their more affluent peers (Denton & West,
2002).
It is important to know not only the factors that make a difference in the early
grades, above and beyond intelligence and other abilities, but also the defining
characteristics of mathematics programs introduced in the elementary grades that
consistently result in sustained cognitive growth in early mathematics. Aforementioned
results from other recent longitudinal projects (e.g., Jordan et al., 2009) indicate that the

45
critical early quantitative competencies that children must possess to learn mathematics
include an understanding of the relationship between number words, Arabic numerals,
and the underlying quantities they represent, as well as skill at fluently manipulating
these representations, knowledge of the mathematical number line, and basic skills in
arithmetic (i.e., skilled use of counting procedures, decomposition, and fact retrieval in
problem solving). The early elementary grades, therefore, become the most important
level for the evaluation because early quantitative knowledge is closely associated with
later achievement (Rathbun & West, 2004).
Studies of Curriculum Effect in Mathematics
Seminal Large-Scale Studies of Mathematics Curricula
The Second International Mathematics Study ([SIMS], 1987) was a large-scale,
comprehensive, international survey conducted during 1981 and 1982 authorized by the
International Association for the Evaluation of Educational Achievement to explore
variables such as intended curriculum, opportunities to learn, and instructional practices
and their possible influence on student outcomes. The study involved approximately
7,000 8th grade students (Population A: students aged 13 in most of the surveyed
countries; students aged 12 in Hong Kong and Japan) and approximately 5,000 12th
grade students (Population B: students enrolled in their final year of college-preparatory
math courses) in roughly 20 nations around the world. The results of the study were
documented in the publication The Underachieving Curriculum: Assessing U.S. Math
from an International Perspective (McKnight et al., 1987). The SIMS assessed students
on an international consensus of topics in mathematics (arithmetic, algebra, geometry,
statistics, and measurement). U.S. students in Population A scored slightly above the
46
international average in arithmetic but well below in problem solving (McKnight et al.,
1987). U.S. students in Population B scored well below the international average. Japan
and Hong Kong represented the highest performing nations in both groups. Beyond
achievement differences, the survey revealed large differences in the math content of
typical U.S. textbooks, finding that U.S. textbooks, in comparison to the higher
performing nations, included a great deal of repetition and review, less rigorous topics,
and more arithmetic-driven topics. The authors recommended that the United States
engage in curriculum renewal that addresses both the “form and substance” (p. 15) of its
elementary mathematics curriculum materials by eliminating excess repetition,
refocusing the organizing of topics, and intensifying and broadening content to better
prepare students for high school mathematics.
The Third International Mathematics and Science Study ([TIMSS], 1995), a more
ambitious international effort assessing over 400,000 students worldwide at Grades 4, 8,
and 12, provided the educational community with additional methodologies for
comparison, including videotaped studies, over 200 classroom observations, and over
1,100 reviews of texts and curricula across 41 nations. On the 1995 TIMSS assessment,
U.S. students scored above the international average in mathematics in grade 4 and below
the international average in mathematics in Grades 8 and 12.
Similar to the SIMS, the TIMSS found the U.S. mathematics curriculum to be less
focused and less advanced with a heavier focus on topics in arithmetic. The survey
(renamed Trends in International Mathematics and Science Study in 2003) has been
administered every four years since 1995 through 2011 (12th grade testing was concluded
after 1995) and continues to serve as a mechanism for “identifying unforeseen

47
weaknesses in national programs and for discovering exemplary programs that can be
investigated in an effort to improve domestic teaching” (Siegal, 2006, p. 11).
In one of the largest experimental studies around early elementary curriculum
effectiveness, Agodini et al. (2009) examined four commercially-available elementary
mathematics curricula (1) Investigations in Number, Data, and Space (Investigations), an
NSF-funded reform program; (2) Math Expressions, which blended teacher- and student-
centered approaches; (3) Saxon Math (Saxon), a teacher-directed program using a more
traditional approach; and (4) Scott Foresman-Addison Wesley Mathematics (SFAW),
which also used a more traditional, teacher-directed approach, to determine “whether
some early elementary school math curricula are more effective than others at improving
student math achievement, thereby providing educators with information that may be
useful for making AYP” (p. xvii). The study analyzed results based on first grade
curriculum implementation during the 2006-2007 school year in the 39 cohort-one
schools and first and second grade curriculum implementation in 71 additional schools
that joined the study during the 2007-2008 school year. The study, using paired-
comparisons, found statistically significant differences in performance, as measured by
the Early Childhood Longitudinal Study-Kindergarten (ECLS-K), at the first-grade level
in favor of students using the Math Expressions program. Math Expressions students
scored 0.11 standard deviations higher than both Investigations and SFAW students. At
the second-grade level, statistically significant differences in performance favored
students using Math Expressions and Saxon. Math Expressions and Saxon students
scored 0.12 and 0.17 standard deviations higher than SFAW students, respectively. No
other curriculum-pair differentials were statistically significant (Agodini et al., 2009).

48
Bhatt et al., (2012), in their study examining which early elementary school math
curricula are more effective than others at improving student math achievement in
disadvantaged schools, used data from one of the few states where information on
curriculum adoptions is available, Indiana, to empirically evaluate differences in
performance across three elementary-mathematics curricula, two of which were Saxon
and SFAW. These three curricula accounted for 86% of all curriculum adoptions in
Indiana at the time of the study: Saxon Math (Saxon), Silver-Burdett Ginn (SBG)
Mathematics, and Scott Foresman–Addison Wesley (SFAW). Large differences were
found in effectiveness between the curricula, most notably between the two that held the
largest market shares in Indiana, Saxon and SFAW. The researchers found that the
average math achievement of students taught using Saxon was 0.09 standard deviations
lower than that of students using SFAW. These results conflict with those found in the
Agodini et al., study (2009). Key insights from their analysis were (1) that there can be
large differences in effectiveness between curricula that share the same pedagogical
approach, suggesting that while much attention is devoted to the debate over traditional-
versus reform-based mathematics instruction, findings suggest that other differences in
curriculum design are substantively important and (2) that decision makers have virtually
no information about which curricula are most effective.
Seminal Meta-analytic Studies of Mathematics Curricula
Since being introduced by Gene V. Glass in 1976, and spurred by the recent
movement toward the policy-making process using scientifically or evidence-based
research in education since the No Child Left Behind (NCLB) Act of 2001 (U.S.
Department of Education, 2002), the number of meta-analyses conducted in education

49
has proliferated. Meta-analytic techniques have been emphasized for providing evidence
of what works with regard to programs, products, practices, and policies (IES, 2013) in
education in schools and school districts (Dynarski et al., 2008; Slavin, 2008).
In 2002, the NRC convened a blue-ribbon panel to review studies on the
effectiveness of mathematics curriculum materials, covering all grade levels K-12. Of the
147 studies initially meeting the panel’s minimum standards of quality and ranging in
type (content analysis, case studies, comparative analysis, and synthesis studies), 63
quasi-experimental comparative studies were considered. The 63 studies reflected 13
NSF-funded programs (35 of which analyzed the Everyday Mathematics program), and 6
commercially generated mathematics programs. The authors of the NRC (2004) found
that 59% of the NSF-supported programs had significantly positive effects, 6% had
significantly negative effects, and 35% found no differences. Most of these studies
involved elementary and secondary programs of the University of Chicago School
Mathematics Project. Of the commercial, non-NSF-supported programs, the
corresponding percentages were 29%, 13%, and 59%, thereby suggesting that NSF-
funded programs had better outcomes. However, because none of the studies embedded a
content analysis conducted by mathematics educators and mathematicians, the NRC
chose not to describe the outcomes it found in the 63 evaluations that met its minimum
standards and did not report the outcomes of any particular program. The committee
reported that, as a whole, across the 19 programs studied, the findings were inconclusive,
prohibiting the panel from determining “conclusively, whether the programs, overall,
were effective or ineffective” (p. 4). The committee precluded a second phase of
evaluations of any program based upon data contained in their existing database (NRC,

50
2004), entreating curriculum evaluators to apply a more rigorous standard of evaluation,
writing, “The committee recommends that a curricular program be designated as
scientifically established as effective only when it includes a collection of scientifically
valid evaluation studies addressing its effectiveness that establish that an implemented
curricular program produces valid improvements in learning for students, and when it can
convincingly demonstrate that these improvements are due to the curricular intervention”
(p. 5).
In 2007, funded by the Institute of Education Sciences, U.S. Department of
Education, researchers Slavin and Lake (2007) from Johns Hopkins University published
their study examining research on three prevailing types of math programs that are
available to elementary educators today: mathematics curricula, computer-assisted
instruction, and instructional process programs. Their intention was to place all types of
programs on a common scale and “to look broadly for factors that might underlie
effective practices across programs and program types, and to inform an overarching
theory of effective instruction in elementary mathematics” (Slavin & Lake, 2007, p. 4).
The review applied a technique called “best-evidence synthesis” (Slavin, 1986, 2007),
which sought to identify unbiased, meaningful quantitative information from
experimental studies. Best-evidence synthesis closely resembles meta-analysis (Cooper
& Lindsay, 1998; Lipsey & Wilson, 2001), but requires “more extensive discussion of
key studies instead of primarily pooling results across many studies” (Slavin & Lake,
2007, p. 6). The studies involved elementary (K-5) children and sixth graders if they
were in the studied elementary schools. Of the 87 studies meeting the criteria, the
researchers placed the 13 evaluated math curricula into three categories: (1) programs

51
developed under funding from the National Science Foundation that emphasize a
constructivist philosophy, with a strong emphasis on problem solving, manipulatives, and
concept development, and a relative de-emphasis on algorithms, (2) back-to-the-basics
curriculum that emphasizes building students’ confidence and skill in computations and
word problems, and (3) traditional commercial textbook programs (Slavin & Lake, 2007).
Their most conclusive findings were that more well-structured randomized trials
extending beyond one year are greatly needed, and major limitations in the methods and
quality of existing research further reduce the amount of available evidence supporting
one curriculum over another (Slavin & Lake, 2007).
A Comparison between Singapore Math and Everyday Mathematics
As this study intends to reveal how the implementation of the elementary school
mathematics curriculum, Singapore Math, is related to student achievement as assessed
by the Grade 5 New Jersey Assessment of Skills and Knowledge (NJ ASK) as compared
to Everyday Mathematics, a New Jersey Core Curriculum Contents Standards
(NJCCCS)-aligned program in a district classified one of the poorest in the United States,
it is important to present the more compelling and discernible differences between the
two programs. The descriptive information for the Singapore Math program was
obtained from publicly available information obtained from the program publisher’s
website and the What Works Clearinghouse’s (WWC) intervention report. Some of the
more critical analyses regarding the structural characteristics of Singapore Math and
Everyday Mathematics as cited in recent research and policy reports are captured in
Table 1 (see Table 1, p. 22).

52
Singapore Math
The Houghton Mifflin Harcourt-published Math in Focus: Singapore Math
program is referenced as Singapore Math within this study and is aligned to the
Singaporean standards for mathematics (Singapore Ministry of Education, 2006) as well
as the March 9, 2010, public draft of the CCSS for Mathematics, copyright 2009 National
Governors Association and Council of Chief State School Officers. The standards were
designed to develop proficiency in a relatively small number of important mathematics
topics, as validated by a recent analysis conducted by Ginsburg et al. (2005). The appeal
of emphasizing fewer important mathematics topics in greater depth has also been
recognized by some U.S. educators (NMAP, 2008). According to Achieve (2011), the
Singapore Math syllabus is well aligned to CCSSM, and its learning expectations for
students are comparable to the CCSSM in terms of rigor, coherence, and focus (Achieve,
2011). As are the CCSSM, the Singapore Math program is organized in a mastery
framework where emphasis is distributed among the development of conceptual
understanding, procedural fluencies, and problem solving skills (Houghton Mifflin
Harcourt Specialized Curriculum Common Core Overview, 2011). Unlike the
organization and structure of the Everyday Mathematics program, the Singapore Math
curriculum covers a relatively small number of topics in depth. Students are expected to
master prior content. “Each semester-level Singapore Math textbook builds upon
preceding levels, and assumes that what was taught need not be taught again. The
textbooks are designed to build a deep understanding of mathematical concepts with
concrete illustrations that demonstrate how abstract mathematical concepts are used to
solve problems from different perspectives” (Ginsburg et al., 2005, p. xii). The

53
Singapore Math textbooks have a consistent emphasis on problem solving and model
drawing, with a focus on in-depth understanding of the essential math skills
recommended in the NCTM’s Curriculum Focal Points (NCTM, 2006), the National
Mathematics Advisory Panel report (2009), and the Common Core State Standards
(2010). “Singapore Math students begin solving simple multi-step word problems in
third grade, using a technique called the ‘bar model’ method. Later grades apply this
same method to more and more difficult problems, so that by sixth grade they are solving
very difficult problems” (Hoven & Garelick, 2007, p. 28).
Reform curricula typically embed ideologies that either directly or indirectly
influence instructional practice. For example, Everyday Mathematics, originally
developed in 1985, was based on the principles common to the NSF-supported reform
models, and its curriculum design is reflective of constructivist theories of learning
(Steffe & Cobb, 1988; Steffe & Gale, 1995). The Singapore Ministry of Education used
a graphic to represent its vision for mathematics teaching–a pentagon, with problem
solving in the center and five interdependent elements surrounding it: concepts, skills,
processes, attitudes, and metacognition. The pentagon represents a “balanced set of
mathematics priorities centered on problem solving” (Ginsburg et al., 2005, p. xi),
whereby computation skills and conceptual understandings are mutually emphasized.
To engage all learners, “Singapore Math uses minimal text and simple, direct
visuals. As a result, all students, regardless of language skills, focus on the math lesson.
To allow all students to reach high levels of conceptual understanding and use of skills, a
consistent approach of concrete to pictorial to abstract pedagogy is repeatedly employed”
(Great Source, 2009, p. 2).

54
This use of scaffolding is found throughout the program. Students are given
increasingly more intricate problems for which they draw on prior knowledge as well as
recently acquired concepts and skills as they combine problem solving strategies with
critical thinking skills.
Everyday Mathematics
Initially funded in 1983 by a six-year grant from the AMOCO Foundation,
Everyday Mathematics began as a kindergarten program. Continued development
through Grade 3 (from 1989 to 1992) was possible due to funding from the GTE
Corporation and the Everyday Learning Corporation. Afterwards, funding from the NSF
led to the completion of the program through Grade 6 (Carroll, Isaacs, & Bell, 2001).
According to the University of Chicago’s Comprehensive Summary of the
Scientific Research & Evidence of Effectiveness for the Everyday Mathematics program
(UCSMP, 2007), the Everyday Mathematics program is founded on three core principles
(p. 5):
(1) Students acquire knowledge and skills, and develop an understanding
of mathematics from their own experiences. Mathematics is more
meaningful when it is rooted in real-life contexts and situations, and when
children are given the opportunity to become actively involved in learning.
Teachers and other adults play a very important role in providing children
with rich and meaningful mathematical experiences; (2) children begin
school with more mathematical knowledge and intuition than previously
believed. A K-6 curriculum should build on this intuitive and concrete
foundation, gradually helping children gain an understanding of the

55
abstract and symbolic; and (3) teachers, and their ability to provide
excellent instruction, are the key factors in the success of any program.
Previous efforts to reform mathematics instruction failed because they did
not adequately consider the working lives of teachers.
Structurally, Everyday Mathematics’ design was developed to encourage students
to frequently work collaboratively while exploring mathematical concepts. Manipulatives
such as counters, pattern blocks, or the hundreds grids were encouraged to help scaffold
students' thinking during problem solving exercises and discussions (Kamii & Joseph,
1989).
Organizationally, the developers of the program used a spiral approach through
which ideas are continuously reviewed, practiced in varied contexts, and build in
complexity. The organization of the program was due largely to the breadth of the
mathematics topics covered. More recent research (Ginsberg, Leinwand, Anstrom, &
Pollock, 2005) asserts that it is the very nature of the program’s spiraled organizational
framework that causes the curriculum to do a relatively poor job of systematically
developing mathematical concepts.
Ginsberg et al. (2005) found that on average, Everyday Mathematics instructional
materials present about one lesson on a narrowly focused topic every two days. CCSS
reformers support the idea of paring down the number of major topics and subtopics
taught, thereby allowing teachers to focus on essential content and the development of the
conceptual frameworks necessary for transferring knowledge to new contexts.

56
Curriculum Effectiveness Studies: Singapore Math
At present, there are no conclusive data indicating the impact of Singapore Math
on student achievement in low-performing, high-poverty school districts. The U.S.
Department of Education Institute of Education Sciences through its research arm, the
What Works Clearinghouse (WWC) identified 12 studies of Singapore Math that were
published between 1983 and 2008. Six studies had ineligible designs and six studies
were out of the scope of the review protocol for reasons other than study design. The
WWC concluded that none of the subject studies met its evidence standards, thereby
disqualifying their methodologies as effective or ineffective.
Since 2008, three larger-scale studies on the effectiveness of Singapore Math have
been released. However, the studies, based upon the WWC’s criteria for eligibility (U.S.
Department of Education's Institute of Education Sciences, n.d.), may lack essential
components needed to satisfy WWC requirements for a well-designed randomized
controlled trial, quasi-experimental, regression discontinuity, or single subject research
design. Further, it is difficult to differentiate market research from scientifically valid
evaluation studies.
A quasi-experimental, pretest/posttest study was conducted by the Educational
Research Institute of America (2010a) in the 2009-2010 school year, sampling second
and fourth graders enrolled in Old Bridge Township School District; one of the largest
suburban school districts in the State of New Jersey with a student population of just over
10,000. The district is classified by the New Jersey Department of Education as being in
District Factor Group "FG", the fourth highest of eight groupings of socioeconomic
status.

57
The district used the Singapore Math program, Math in Focus, as part of a district
pilot and showed significant increases in math achievement over one academic year, as
measured by the Stanford Achievement Test, Ninth Edition (SAT 9). In the year before
the pilot began, all 678 students in all 12 elementary schools in the district used the same
alternative program. In a subsequent study which extended the 2009-2010 pilot, 2010
state test mathematics scores were used to determine if similar gains were reflected
within results from the Grade 4 NJ ASK.
One hundred twenty-five fourth graders in Old Bridge Township School District
were engaged in the Singapore Math pilot during the 2009-2010 academic year;
comprising the experimental group. The remaining 553 students in the district enrolled in
Grade 4 during the same period used an alternative instructional mathematics program
and comprised the control group for this study. Mathematics scores from the NJ ASK
administered in the spring of 2009 and the spring of 2010 were analyzed to determine if
the students who used Singapore Math made significant gains over the course of the pilot
year. The score gains attained by the experimental group were also compared to those
attained by the control group students.
Analyses of spring 2009 NJ ASK mathematics scores, which represent
achievement prior to the Singapore Math pilot, show that there were no significant
differences in performance between those students who the following year used
Singapore Math (the experimental group for this study) and those students who did not
(the control group). The analysis of the spring 2010 NJ ASK mathematics scores showed
that the average score of the experimental group, those students using Singapore Math,
was significantly higher than that of the control group students who did not use the

58
program. Both chi-square analyses and analyses of variance were used to evaluate gains.
Analyses of performance-level achievement showed that when the experimental group
was divided into subgroups of students who scored at the Advanced Proficient Level, the
Proficient Level, and the Partially Proficient Level on the NJ ASK math test, all three
subgroups made statistically significant gains, whereby the Partially Proficient Level
students increased the most.
In a 2008 curriculum effectiveness study, researchers from the School of
Education and Department of Mathematics and Computer Science at North Georgia
College and State University (NGCSU) conducted a large-scale study evaluating the
implementation of Singapore Math in all 21 elementary schools in Hall County during
the 2008-2009 and 2009-2010 school years, using descriptive statistics to communicate
their findings. While findings generally showed overall increases in the percentage of
students within the control group (using Singapore Math) meeting and exceeding state
and local benchmarks, no statistical analyses were done to show statistical significance,
correlation, or effect size. Further, the authors did not specify which publication/edition
of Singapore Math was used in the study.
In 2009, Goldman, Retakh, Rubin, and Munnigh conducted a longitudinal,
statistical study which analyzed the impact of Singapore Math (Primary Mathematics,
3rd edition, and later, U.S. edition) on student performance in North Middlesex Regional
School District (NMRSD), a Massachusetts school district serving the suburban towns of
Pepperell, Townsend, and Ashby, Massachusetts, and enrolling approximately 5,000 pre-
K-12 students within one high school, two middle schools, and four elementary schools
(Goldman et al., 2009). Beginning in the 2000-2001 school year, NMRSD implemented

59
Singapore Math in six classrooms. By 2007-08, the district reached 100% Singapore
Math participation in all of its K-8 classrooms. Results from the Massachusetts
Comprehensive Assessment System (MCAS), which evaluates student, school, and
district mathematics performance, revealed that the NMRSD student scores were higher
than those of Massachusetts students (using a different math program) in all but three of
the 24 grade-years. These results are significant by analysis of variance (ANOVA)
(F=56.069, P<0.001, df =1, 32). NMRSD results for Grades 5, 6, 7, 8, and 10 were
significantly better than the Massachusetts results. While NMRSD’s third-grade results
are also better than the Massachusetts results, this difference is not statistically
significant. Overall, results showed that (a) participation in Singapore Math classes had a
positive impact on student MCAS test scores, (b) the duration of student participation in
Singapore Math classes had a greater positive impact on test score gains than Singapore
Math participation at any particular grade level and, (c) beginning Singapore Math in
early grades improved the curriculum’s effectiveness (Goldman et al., 2009).
Curriculum Effectiveness Studies: Everyday Mathematics
The amount of research evidence about Everyday Mathematics makes it one of
the most scrutinized elementary mathematics programs (NRC, 2004).
Waite (2000), in his quasi-experimental study of the impact of Everyday
Mathematics on student academic performance, analyzed assessment results of 732
third-, fourth-, and fifth-grade students in six schools using Everyday Mathematics and a
comparison group of 2,704 third-, fourth-, and fifth-grade students in 12 similar schools,
matched on baseline math achievement scores, student demographics, and geographical
location. The schools in the experimental group were in their first year of implementing

60
the first version of Everyday Mathematics. The comparison group used a traditional
mathematics curriculum. This quasi-experimental study found Everyday Mathematics to
have significant positive effects on overall math achievement as measured by the math
portion of the Texas Assessment of Academic Skills. However, the WWC, after
recalculating levels of significance reported by the study’s author for purposes of
clustering and multiple comparisons, found no statistically significant differences
between the two treatment groups on specific outcome measures (overall performance on
the Texas Assessment of Academic Skills, concepts, operations, and problem solving)
and considered the extent of evidence (the indicator of how much evidence supported the
findings) for Everyday Mathematics for elementary students to be small for math
achievement.
Carroll (2001) compared the performance of 12,880 third-grade Everyday
Mathematics students and 11,213 fifth-grade Everyday Mathematics students on the 1999
Illinois Standards Achievement Test (ISAT) to 47,742 third grade non-Everyday
Mathematics students and 50,023 fifth-grade non- Everyday Mathematics students. The
study found that Everyday Mathematics students significantly outperformed comparison
students, even after controlling for all other significant variables. The study also found
that "the differences favoring the Everyday Mathematics curriculum were largest in
schools with a higher percentage of low-income students" (p. 5).
The Riordan and Noyce (2001) post-hoc study of all Massachusetts schools that
had used Everyday Mathematics for two or more years, in comparison to matched
schools, reported modest results (ES= 0.15) for schools using the program for two to
three years but reported a more significant effect size (ES= 0.35) among 19 schools that

61
had used the program for four or more years, suggesting a positive longitudinal effect on
achievement.
Sconiers, Isaacs, Higgins, McBride, and Kelso (2003), in a tri-state study funded
by the NSF, compared the performance of 39,701 students who had studied with
Everyday Mathematics for at least two years to 38,481 students carefully matched by
reading level, socioeconomic status, and other variables. The study compared the scores
on all the topics tested at all the grade levels tested (Grades 3-5) in each of the three states
(Massachusetts, Illinois, and Washington) finding that the average scores of the Everyday
Mathematics students were significantly higher than the average scores of students in
their matched comparison schools with small-moderate effect sizes ranging from 0.07 to
0.12. Of 34 comparisons across five state-grade combinations, 29 favored the Everyday
Mathematics students, five showed no statistically significant difference, and none
favored the comparison students. The results held across all income and racial subgroups,
except for Hispanic students, where Everyday Mathematics students had higher (but not
statistically significantly higher) average scores.
While the research evidence on Everyday Mathematics is generally positive,
challenges relating to uneven quality and flawed methodological design make
determining the effectiveness of Everyday Mathematics to a high degree of certainty
difficult.
Of the 72 studies reviewed by the What Works Clearinghouse (WWC), a program
of the federal Institute of Education Sciences investigating the effects of Everyday
Mathematics on student performance, 71 failed to meet either the WWC’s evidence
standards or eligibility screens. Only the Waite study (2001) met the evidence standards

62
but with reservations, finding a positive but small effect of the Everyday Math
curriculum. The WWC reported these findings after recalculating levels of significance
reported by the study’s author for purposes of clustering and multiple comparisons,
finding no statistically significant differences between the two treatment groups on
specific outcome measures (overall performance on the Texas Assessment of Academic
Skills, concepts, operations, and problem solving).
Slavin and Lake (2007) reviewed four studies of Everyday Mathematics within
their best-evidence synthesis of elementary programs in mathematics that met their
standards of review. Of the four, only one small study among 38 low-performing children
used a prospective matched design (Woodward & Baxter, 1997), reporting no significant
differences between Everyday Mathematics and control students (ES= -0.25). The three
remaining studies (SRA/McGraw, 2003; Riordan and Noyce, 2001; Waite, 2000) all used
post-hoc matched designs and varied in reported outcomes. Generally, based on the
researchers’ findings, across all of the studies, there was “no pattern of differential effects
by measure,” a surprising finding given the focus on concepts and problem solving.
There were also no differences by ethnicity, except that in the SRA/McGraw (2003) and
Waite (2000) studies, where “effects for Hispanic students were near zero” (p. 14).
Factors Influencing Mathematics Achievement
Gender
Historically, research has drawn significant correlations between gender and
mathematics performance, often finding that the mathematics achievement of girls, across
different contexts and underlying factors, is lower than that of boys (Leder, 1992;
Rothman & McMillan, 2003). In a meta-analysis of 100 studies published between 1963

63
and 1988, examining gender differences in mathematics performance, Hyde, Fennema,
and Lamon (1990) found insignificant gender differences in the lower elementary grades
(d = -0.05). However, significant differences existed at the high school level, around
complex problem solving and in favor of boys (d = 0.29). This finding was possibly
explained by the underrepresentation of girls in higher levels of mathematics and science
classes at the time of their analysis. Since the 1990 study, Hyde, Else-Quest, and Linn
(2010) conducted a larger-scale meta-analysis using statewide data, examining 242
studies published between 1990 and 2007 of gender differences in mathematics
performance. The researchers also analyzed larger national data sets based on probability
sampling (National Education Longitudinal Study, 1988; National Center of Educational
Statistics, n.d.). Combined, the data revealed, conclusively, that girls performed similarly
to boys in mathematics across all grades analyzed (2–11) with uniform effect sizes <0.10
across all grades (Hyde et al., 2010).
Socioeconomic Status
In research of academic achievement, a number of recent studies show quite
significant correlations between socioeconomic status (SES) and general cognitive ability
as measured by educational performance (Brooks-Gunn et al., 1993; Coleman, Ernest,
Campbell, Hobson, McPartland, Mood, Weinfeld, & York, 1966; Gamoran, 1987;
Gottfried et al. 2003; Jencks et al., 1972, 1979; Lee, Bryk, & Smith, 1993; Smith et al.,
1997). While SES may be a proxy for a composite of family processes (income, ability,
culture, parenting styles, parents’ education level, and parents’ involvement in child’s
education), SES remains a strong predictor of student mathematics achievement.
Research has also shown that SES plays an important role on children’s early and later

64
mathematics achievement (Crosnoe & Cooper, 2010; Jordan, Kaplan, Locuniak, &
Ramineni, 2007). The Rothman and McMillan (2003) report noted that “the effects of
socioeconomic status on student achievement [in numeracy] were significant at two
levels. There were small but significant effects of SES within schools, and larger
significant effects of SES between schools” (p. 30). The authors assert that SES, by far,
“is the greatest influence on between-school differences” (p. 30). Smith, Brooks-Gunn,
and Klebanov (1997) found that “family income has selective but, in some instances,
quite substantial effects on child and adolescent well-being” (p. 55). The findings
suggest that family income is more strongly related to children’s ability and achievement
(in reading and math) than to other outcomes (emotions), whereas children who live in
extreme poverty over several years perform significantly worse. Halle, Kurtz-Costes, and
Mahoney (1997) in a sampling of low-income minority families found that achievement
in math and reading was related to the level of expectations parents set for their
children’s academic achievement. More specifically, parents with higher education
attainment levels held more positive beliefs and success expectations for their children
(Halle et al., 1997). Jordan, Kaplan, Locuniak, and Ramineni (2007). In their study of the
predictors of first grade mathematics achievement, found that “compared to their middle-
income peers, children from low-income households entered school with a generally low
level of number sense” (p. 37). This finding was substantiated by the caregivers of low-
income children who reported “fewer home experiences with numbers as well as with
literacy” (p. 37). The researchers also found that the income-gap widened over the
course of the school year although the students were exposed to the same curriculum.

65
Race/Ethnicity
SES is often closely related to racial/ethnic background (Atweh et al., 2004). The
concern over achievement gaps–for example, those between racial/ethnic groups–has
been addressed within recent (No Child Left Behind [NCLB], 2002) legislation which
reauthorized Title I, the largest federal funding program designed to distribute funding to
schools and school districts with high percentages of students from low-income families.
The NCLB (2002) states the purpose of Title I: To ensure that all children
have a fair, equal, and significant opportunity to obtain a high-quality
education and reach, at a minimum, proficiency on challenging state
academic achievement standards and state academic assessments. This
purpose can be accomplished by . . . closing the achievement gap between
high- and low-performing children, especially the achievement gaps
between minority and nonminority students, and between disadvantaged
children and their more advantaged peers . . . (1001 NCLB 3).
Research has consistently shown that Black and Latino students are more likely to
have lower standardized test scores than White students. Research has offered several
explanations for why these minority groups have lower scores, including parental
involvement (Delgado-Gaitan, 1991, 1992); institutionalized inequities (Fordham &
Ogbu, 1986); stereotype (Steele & Aronson, 1998); individual-level factors such as
personal aspirations (Bohon, Johnson, & Gorman, 2006; socioeconomic factors (Brooks-
Gunn, Duncan, & Aber, 1997); mood differences (Davies & Kandel, 1981), etc.
Though racial/ethnic gaps have narrowed (Campbell, Hombo, & Mazzeo, 2000;
Cook & Evans, 2000; Grissmer et al., 1994; Hedges & Nowell, 1999; Jencks & Phillips,

66
1998; Koretz, 1986, 1992), the average achievement gap between different racial/ethnic
groups remains large and varies across tests, grades, and subject areas. “Significant gaps
in achievement between student population groups: the Black/White, Hispanic/White,
and high-poverty/low-poverty gaps are often close to one standard deviation in size”
(Bloom et al., 2008, p. 172).
According to the NSB’s (2012) reporting of NAEP data available from 1990
through 2009, higher proportions of White and Asian/Pacific Islander students scored at
or above the basic and proficient levels compared with Black, Hispanic, and American
Indian/Alaskan Native students and students from lower income families at each assessed
grade level in mathematics. Overall, Black students represented the lowest performing
subgroup, having the fewest number of students scoring at or above the basic level and at
or above the proficient level. Special analyses conducted by the NCES in 2009 and 2011
showed that Black and Hispanic students trailed their White peers by an average of more
than 20 test-score points on the NAEP in mathematics at Grades 4 and 8, representing a
difference of roughly two grade levels (NCES, 2009, 2011).
Attendance
There is general consensus that chronic school absenteeism negatively impacts
student performance. The amount of time actually spent in the classroom is in direct
correlation to a student’s access to education (Dekalb, 1999). Research generally supports
a positive relationship between attendance and performance, specifically in mathematics
(Balfanz & Byrnes, 2012). A study conducted by Roby (2004) that examined annual
building attendance averages and student achievement in Grades 4, 6, 9, and 12 as
measured by the Ohio Proficiency Tests found a moderate to strong positive relationship

67
between attendance and student achievement. Gottfried (2009) used multilevel,
longitudinal data sets of all second- through fourth-grade students in the Philadelphia
School District from 1994-2000 to study the impact of attendance on achievement,
discerning attendance by type (excused and unexcused). The researcher found that,
regardless of type, absence is negatively associated with academic performance.
Additionally, the researcher noted that students with higher proportions of unexcused
absences are placed at academic risk, particularly in math achievement and as early as
elementary school.
Synthesis
As this study analyzes the achievement effects of two elementary school
mathematics curricula whose development was influenced by two different sets of
standards, Chapter II began with an examination of the NCTM standards (1989, 2000)
and the Common Core State Standards for Mathematics (2010). If curriculum has the
potential to alter classroom practice, then, as Ball and Cohen (2003) acknowledge, it can
“translate research findings and authoritative recommendations into classroom reality” (p.
1). The theoretical framework of the Everyday Mathematics program communicates the
vision of the early NCTM standards--focusing teaching on child-centered approaches and
embedding philosophies aligned to constructivist-based approaches that encourage
students’ own construction of knowledge. The program distributes practice across a
broader range of topics and emphasizes reasoning, representation, and connections, using
problem-based learning methods.
The theoretical framework of the Singapore Math program aligns to the major
principles of the CCSSM, presenting a framework that supports the three major shifts

68
embodied within the standards: focus, coherence, and rigor. The program emphasizes the
development of conceptual understanding through structured, multistep mathematical
problem solving; establishes a strong foundation in number and quantity in grades K-5,
incorporating use of standard algorithms at specific grade levels; and bounds
mathematical topics and outcomes within a mastery approach whereby topic repetition is
limited.
Both programs in Grades K-5 address specific foundational understandings and
skills characteristic of early mathematics (place value concepts; the commutative,
associative, and distributive properties; composing and decomposing whole numbers; the
basic operations of addition, subtraction, multiplication, and division; and the knowledge
of how to apply the operations to problem solving). The Everyday Math program
develops foundational skills and understandings in a spiral curriculum, distributing
learning over time. The program frequently revisits topics, concepts, and skills and in a
variety of contexts, interspersing various review lessons throughout its chapters (e.g.,
angle measure, time, probability, volume). In contrast, the Singapore Math program
develops foundational mathematical concepts through a more concentrated approach
attained through daily reinforcement and scaffolding concepts. In Grades K-5, the
program’s focus is on number concepts and topics in geometry. Numerous studies
support the understanding of number and quantity as a necessary foundation for success
as students advance to more complex topics. Structural and organizational distinctions
between the Everyday Mathematics and Singapore Math curricula, though not a central
focus of this study, transition this study into a new reform dialogue. While many of the
earlier school mathematics curriculum debates can be characterized as “traditional”

69
versus “reform-based,” this study, though subtly stated, introduces a comparison of two
distinct reform philosophies (CCSS versus NCTM). The broad discussion of the SIMS
and TIMSS helped in positioning this work within its current context. In a call to
“restructure and revitalize” (p. 134) mathematics curricula in U.S. schools, authors of The
Underachieving Curriculum: Assessing U.S. School Mathematics Performance from an
International Perspective (McKnight et al., 1987) cited the mathematics curriculum as
the primary culprit of producing a “nation of underachievers” (p. 22), writing:
Something appears to be wrong with the way the content and goals are
distributed in school mathematics in U.S. schools. Content is spread
throughout the curriculum in a way that leads to very few topics being
intensely pursued. Goals and expectations for learning are diffuse and
unfocused. Content and goals linger from year to year so that curricula are
driven and shaped by still unmastered mathematics content begun years
before.
Recommendations stemming from the Second International Mathematics Study
and the Third International Mathematics and Science Study suggested that the United
States engage in curriculum reorganization and renewal that result in curricula that better
resemble what is found in higher performing nations such as Japan, Hong Kong, and
later, Singapore (an island country whose fourth and eighth grade students have been top
or near-top performers in the world in each of the major studies carried out by the
International Association for the Evaluation of Educational Achievement (IEA) from
1995 to 2003 (Dindyal, 2006)). Schmidt et al. (1997) found that countries with more
focused curriculum designs outperformed the United States on the 1995 Third

70
International Mathematics and Science Study. Subsequent studies (Schmidt et al., 2001,
2005) drew similar conclusions, noting that higher achieving countries focused
deliberately on fewer topics and the more rigorous cognitive domains (Darling-Hammond
et al., 2008). Challenges such as these establish the footing for this research.
Overall research on curriculum effect has offered little if any conclusive direction
for decision makers. Recent large-scale comparative studies (Agodini et al., 2009; Bhatt
et al., 2012) underscore additional complexities in the field of curriculum effectiveness:
(1) large differences in effectiveness can exist between curricula that share the same
pedagogical approach, (2) while much attention has been devoted to the debate over
traditional versus reform-based mathematics, other differences in curriculum design are
substantively important, and (3) the same curricula can produce contrasting results in new
conditions or environments.
While there have been numerous studies on the outcomes of particular approaches
to mathematics education, such as use of educational technology (Becker, 1991;
Chambers, 2003; Kulik, 2003; Murphy, Penuel, Means, Rorbak, Whaley, & Allen, 2002),
calculators (Ellington, 2003), and math approaches for at-risk children (Baker, Gersten,
& Lee, 2002; Kroesbergen & Van Luit, 2003; Slavin et al., 2007), there are few
comprehensive reviews of research on mathematics programs available to educators.
Adding to existing complexities in the field of curriculum effectiveness are the major
limitations in the methods and quality of existing research which further reduces the
amount of available evidence supporting one curriculum over another (IES/USDOE, n.d.;
NRC, 2004; Slavin & Lake, 2007).

71
Meta-analyses conducted around curriculum effectiveness in mathematics, though
largely yielding inconclusive findings, have produced unexpected benefits that potentially
advance the field of curriculum study. Meta-analyses, such as that conducted by the NRC
(2004), have resulted in the establishment of more rigorous frameworks for curriculum
evaluation that promote the idea that curriculum effectiveness should be established via a
“collection of scientifically valid evaluation studies” (p. 5). Therefore the Review of the
Literature section synthesizes the more recent studies related to the two programs
analyzed in this study. In light of the available literature addressing the effectiveness of
the Everyday Mathematics and Singapore Math programs, this study is unique. The
curriculum field is thin in terms of available research on the impact of the Singapore
Math program used in this analysis, Math in Focus: Singapore Math (published by
Houghton Mifflin Harcourt, 2010). Of the 12 studies of Singapore Math published
between 1983 and 2008 and reviewed by the What Works Clearinghouse, none of the
subject studies met its evidence standards, thereby disqualifying their methodologies.
Since 2008, three larger-scale studies on the effectiveness of Singapore Math have been
released. However, each of the studies lacks essential components, further qualifying the
methodology used in this study.
The Old Bridge study (2010a) closely resembles market research and failed to
either establish adequate initial comparability of the control and treatment groups or
make statistical adjustments to establish adequate comparability. The Old Bridge study
did not identify the two alternative curricula by name. Although a number of statistical
analyses were employed (Chi Square, ANOVA, regression), effect sizes were not
reported.

72
The NGCSU study (2008) used descriptive analyses versus statistical analyses to
measure impact. Therefore, metrics indicating statistical significance, correlation, or
effect size were not reported. Also, the authors did not specify which publication/edition
of Singapore Math was used in their study.
While the Goldman et al. study (2009) presented a more scientifically sound
analysis of data, the experimental treatment differed from the one presented in this study.
Primary Mathematics, 3rd edition (and later, U.S. edition) was the Singapore Math
publication used in the Goldman study.
While the Everyday Mathematics program is reportedly one of the most
scrutinized elementary mathematics programs (NRC, 2004) whereby the findings are
generally positive, consensus is that its effectiveness cannot be determined to any high
degree of certainty due to the uneven quality and flawed methodological designs of much
of the available research (NRC, 2004; USDOE, 2010; Slavin et al., 2007). This study
sought research that underscores the significance of the problem presented within the
study and strives to establish a sound methodology to provide valid, informative, and
credible data on curricular effectiveness that contributes to the larger body of research on
program impact.
In order to strengthen the conduct of this comparative analysis, this analysis
studied variables historically linked to differences in mathematics performance: gender,
socioeconomic status (SES), race/ethnicity, and attendance). As captured in this review,
SES, race/ethnicity, and attendance were projected to have a greater impact on student
performance, possibly predicting significant differences in achievement between student
population groups (the Black/White, Hispanic/White, and high-SES/low-SES gaps) and

73
within subgroups having greater variation in attendance. Gender comparisons, on the
other hand, were expected to reveal minor differences (Hyde et al., 2010).
This study’s complete research design, results, and findings are discussed in the
chapters that follow.

74
CHAPTER III
METHODOLOGY
Introduction
Many mathematics curricula adopted by states, districts, and schools continue to
be purchased and used without outcome-based, empirically derived evidence of
effectiveness. As states and school districts transition from their former NCTM-aligned
standards and programs into Common Core States Standards–aligned systems
(curriculum, assessment, and professional development), significant investments in
resources are inevitable in order to enact the expectations of the standards documents.
The potential for a new round of large-scale investments in resources and the impact on
student achievement warrants improved evidence-based selections of programs and
instructional materials.
The intent of this study was to use research-based methodology to provide valid,
informative, and credible data on curricular effectiveness, specifically data on the
effectiveness of the two elementary school mathematics curricula presented within this
study. Within the larger body of research on program impact, this study may provide
indications for future study.
This study examines the differences between the achievement effects of one
proposed Common Core State Standards-aligned mathematics program, Math in Focus:
Singapore Math (published by Houghton Mifflin Harcourt, 2010), and one NCTM-
aligned mathematics program, Everyday Mathematics (currently published by the Wright
Group/McGraw-Hill, 2007), on mathematics achievement as measured by the
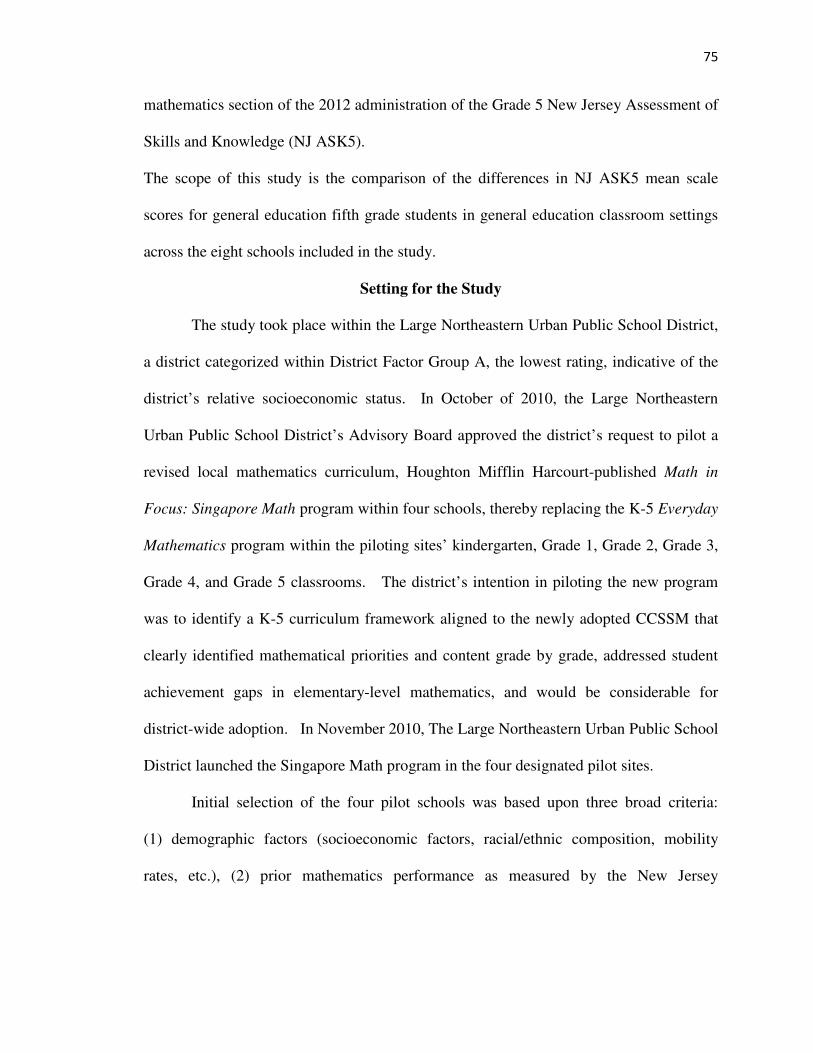
75
mathematics section of the 2012 administration of the Grade 5 New Jersey Assessment of
Skills and Knowledge (NJ ASK5).
The scope of this study is the comparison of the differences in NJ ASK5 mean scale
scores for general education fifth grade students in general education classroom settings
across the eight schools included in the study.
Setting for the Study
The study took place within the Large Northeastern Urban Public School District,
a district categorized within District Factor Group A, the lowest rating, indicative of the
district’s relative socioeconomic status. In October of 2010, the Large Northeastern
Urban Public School District’s Advisory Board approved the district’s request to pilot a
revised local mathematics curriculum, Houghton Mifflin Harcourt-published Math in
Focus: Singapore Math program within four schools, thereby replacing the K-5 Everyday
Mathematics program within the piloting sites’ kindergarten, Grade 1, Grade 2, Grade 3,
Grade 4, and Grade 5 classrooms. The district’s intention in piloting the new program
was to identify a K-5 curriculum framework aligned to the newly adopted CCSSM that
clearly identified mathematical priorities and content grade by grade, addressed student
achievement gaps in elementary-level mathematics, and would be considerable for
district-wide adoption. In November 2010, The Large Northeastern Urban Public School
District launched the Singapore Math program in the four designated pilot sites.
Initial selection of the four pilot schools was based upon three broad criteria:
(1) demographic factors (socioeconomic factors, racial/ethnic composition, mobility
rates, etc.), (2) prior mathematics performance as measured by the New Jersey

76
Assessment of Skills and Knowledge in Grades 3, 4 and 5, and (3) within-school factors,
such as leadership, shown to correlate to quality of implementation.
Demographic Composition
Each of the four pilot schools is situated in a different Large Northeastern Urban
Public School District region (North, South, East-Central, and West). Demographic data
used in the initial selection of the pilot sites included faculty, student, and school data.
Each pilot school is generally comparable to the demographic composition of the region
in which it is situated.
Prior Mathematics Performance
With the exception of one school, the pilot schools performed below 2010 NJ
ASK district and/or State averages (Grades 3, 4, and 5).
Within-School Factors
In a quantitative analysis of the factors influencing the quality of implementation
of school-wide programs, Cooper (1998) revealed six within-school factors: (1) creation
of a supportive culture for institutional change, (2) overcoming program resistance, (3) a
commitment to implementing program structures, (4) having a strong school-site
facilitator, (5) the concern level of teachers regarding an increased workload, and (6) the
availability of program materials. At the inception of the Singapore Math implementation
in the four sites, school leadership was receptive to the new adoption. Underscoring
Factors 1, 4, and 6, piloting principals actively encouraged their teaching staff to
participate in initial Singapore Math exposure sessions. Each pilot site was staffed with
an onsite mathematics coach who received additional training on the program’s
theoretical framework and components. All program materials (teacher editions, student

77
materials, web-based technologies, manipulative kits) were supplied by the district to
each school prior to training and implementation.
Shortly after the launch of the Singapore Math pilot, district leadership selected
and paired four additional schools (with similar past performance trends, demographic
compositions, and within-school factors) to each piloting site. The additional sites
continued to use Everyday Mathematics as their core program in Grades K-5 and acted as
“control” sites for the purpose of district-level analysis and reporting. This study retained
the four sites as alternative treatment sites. Comparability of the paired sites is discussed
in Chapter IV.
Treatment
The two curricula discussed within this study share similarities with regard to
their emphasis on problem solving and the use of visual aids for learning, characteristics
often associated with “reform-based” instruction. Beyond the dimension of pedagogy,
there are other differences between the curricula related to the organization, structure, and
treatment of topics.
Everyday Mathematics
Everyday Mathematics, 3rd Edition (McGraw-Hill Education, 2007) is a
kindergarten through sixth grade mathematics instructional curriculum developed by the
University of Chicago School Mathematics Project (UCSMP), is reflective of the NCTM
Standards, and emphasizes the priorities expressed in the Standards documents: a de-
emphasis on performing paper and pencil calculations, greater emphasis on “operation
sense” and the “collection and organization of data” (NCTM, 1980, as cited by Klein,
2007, p. 22). The program emphasizes nontraditional methods and the “invented

78
procedures” approach to algorithm development. It arranges topics in a helix, whereby
practice is distributed rather than massed. Topics, to a significant degree, repeat content
across grades. The program’s design was developed to encourage students to frequently
work collaboratively. Manipulatives encourage scaffolded thinking during problem
solving exercises and discussions (Kamii et al., 1989). Everyday Mathematics, 2nd
Edition (SRA/McGraw-Hill, 2002) was implemented within the district and used as the
core instructional mathematics program in Grades K-5 from 2004 to 2007. Everyday
Mathematics, 3rd Edition (McGraw-Hill Education, 2007) replaced the earlier edition in
school year 2007-2008 and has been used continuously in all K-5 classrooms within the
district since. The treatment is referenced as the Everyday Math Alternative Treatment
throughout this study.
Singapore Math
The Houghton Mifflin Harcourt-published Math in Focus: Singapore Math
program is the United States’ culturally sensitive translation of the Singapore version, My
Pals Are Here! Maths, 2nd Edition (Marshall Cavendish Singapore, 2008). U.S.
enhancements include the addition of customary measurement, a teacher’s edition, a
kindergarten component, enhanced technology components, differentiated resources for
reteaching and enrichment, and transition components to address student deficiencies.
The Singapore Math program is organized in a mastery framework, where emphasis is
distributed amongst the development of conceptual understanding, procedural fluencies,
and problem solving skills (Houghton Mifflin Harcourt, 2011). The Singapore Math
curriculum covers a relatively small number of topics in depth and emphasizes essential
math skills recommended in the NCTM Curriculum Focal Points (NCTM, 2006), the

79
National Mathematics Advisory Panel (2008), and the proposed Common Core State
Standards (2010).
The Singapore Math textbooks have a consistent emphasis on problem solving
and model drawing. Related topics are presented in self-contained units (massed
approach), encouraging the mastery of prior content. The treatment is referenced as the
Singapore Math Experimental Treatment throughout this study.
Participants
Singapore Math Experimental Treatment Sample
The experimental treatment sites implemented the Singapore Math program as
their core instructional mathematics program in all K-5 classrooms for two successive
years beginning in school year 2010-2011. One thousand six hundred and eighty-two
(1,682) students in kindergarten through Grade 5 from the four experimental treatment
sites were involved in the Singapore Math pilot during the 2011-2012 school year (862
male, 820 female; 11.47% White, 44.89% Black, 43.22% Hispanic, and 0.42% other).
Three hundred six (306) Grade 5 students from the four experimental treatment sites
comprised the experimental treatment population (see Table 3).
After delimiting the qualifying experimental treatment sample to general
education students enrolled within their respective treatment site during schools years
2010-11 and 2011-12 with mathematics score data from both the 2010 NJ ASK3 and the
2012 NJ ASK5, the qualifying Singapore Math Experimental Treatment sample reflected
100 Grade 5 students instructed in the Math in Focus: Singapore Math program in
Grades 3-5 from school years 2010-2011 to 2011-2012 (see Table 4).
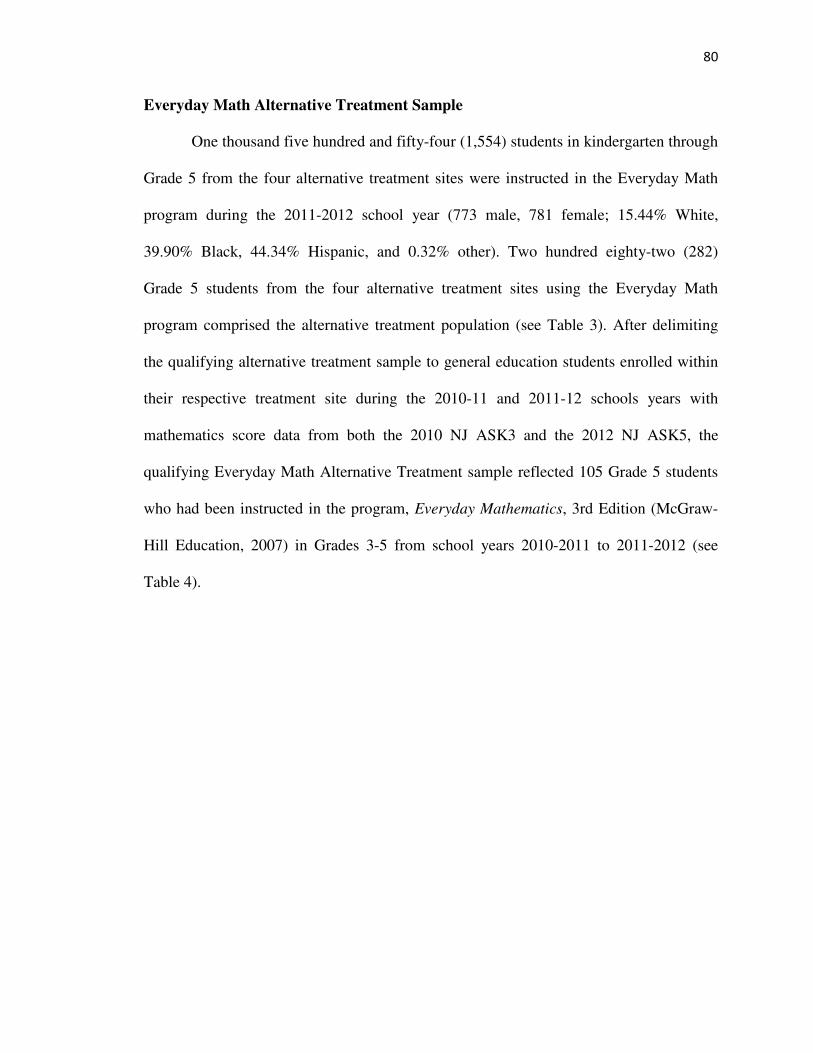
80
Everyday Math Alternative Treatment Sample
One thousand five hundred and fifty-four (1,554) students in kindergarten through
Grade 5 from the four alternative treatment sites were instructed in the Everyday Math
program during the 2011-2012 school year (773 male, 781 female; 15.44% White,
39.90% Black, 44.34% Hispanic, and 0.32% other). Two hundred eighty-two (282)
Grade 5 students from the four alternative treatment sites using the Everyday Math
program comprised the alternative treatment population (see Table 3). After delimiting
the qualifying alternative treatment sample to general education students enrolled within
their respective treatment site during the 2010-11 and 2011-12 schools years with
mathematics score data from both the 2010 NJ ASK3 and the 2012 NJ ASK5, the
qualifying Everyday Math Alternative Treatment sample reflected 105 Grade 5 students
who had been instructed in the program, Everyday Mathematics, 3rd Edition (McGraw-
Hill Education, 2007) in Grades 3-5 from school years 2010-2011 to 2011-2012 (see
Table 4).

81
Table 3. Grade 5 Population Sizes- Exp Treatment and Alt Treatment
Grade 5 Population Sizes- Experimental Treatment and Alternative Treatment
Table 4. Grade 5 Sample Sizes- Exp Treatment and Alt Treatment
Grade 5 Sample Sizes- Experimental Treatment and Alternative Treatment

82
Research Questions
This research sought to determine if the implementation of a K-5 CCSSM-aligned
mathematics program, Singapore Math, is related to differences in performance on the
New Jersey Assessment of Skills and Knowledge (NJ ASK) for Grade 5 general
education students in comparison to students using a NCTM-aligned elementary
mathematics program, Everyday Mathematics, and asks the question “What is the impact
of implementing a proposed CCSSM-aligned mathematics program, Singapore Math, on
mathematics achievement of Grade 5 general education students as measured by the 2012
Grade 5 NJ ASK (NJ ASK5) in comparison to the mathematics achievement of Grade 5
general education students using a NCTM-aligned elementary mathematics program,
Everyday Mathematics, in the Large Northeastern Urban Public School District?”
Measuring student performance data according to (a) overall performance
(Advanced Proficiency, Proficiency, Partial Proficiency); (b) gender; and (c) subgroup, as
defined by the NJDOE, 2010 (economically disadvantaged, White, African-American,
Hispanic, and other, including Asian/Pacific Islander, American Indian/Native American
within this study) yields the following subsidiary research questions:
Subsidiary Question 1
How much variance in the 2012 NJ ASK5 mean scale score can be explained by
the predictor variables treatment, attendance, gender, race/ethnicity, and SES?
Subsidiary Question 2
Is there a statistically significant difference in the 2012 NJ ASK5 performance of
students in the Everyday Math Alternative Treatment and the Singapore Math
Experimental Treatment when controlling for attendance?

83
Subsidiary Question 3
To what extent do differences in performance exist when data are analyzed
according to 2012 NJ ASK5 performance levels (Partially Proficient, Proficient, and
Advanced Proficient) and treatment status; and is there significant interaction between
the performance levels and treatment?
Subsidiary Question 4
Is there a statistically significant difference in the 2012 NJ ASK5 performance
level of students in the Everyday Math Alternative Treatment and the Singapore Math
Experimental Treatment based on race/ethnicity (Black, Hispanic, White, subset of Black
and Hispanic); and is there significant interaction between treatment status and
race/ethnicity (Black, Hispanic, White, subset of Black and Hispanic)?
Subsidiary Question 5
How much variance in the 2012 NJ ASK5 mean scale score of Black students can
be explained by the predictor variables treatment, attendance, gender, and SES?
Subsidiary Question 6
How much variance in the 2012 NJ ASK5 mean scale score of Hispanic students
can be explained by the predictor variables treatment, attendance, gender, and SES?
Subsidiary Question 7
Is there a statistically significant difference in the 2012 NJ ASK5 performance
level of Hispanic students based on SES classification and treatment status when
controlling for attendance, and is there significant interaction between treatment status
and SES classification for Hispanic students when controlling for attendance?

84
This study yielded the following null hypotheses:
Null Hypothesis 1
H0: β0 = 0; the predictor variables treatment, attendance, gender,
Black&Hispanic/White and SES account for no variation in student performance on the
2012 NJ ASK5.
Null Hypothesis 2
There is no significant difference in the overall performance of the Everyday
Math Alternative Treatment and the Singapore Math Experimental Treatment as
measured by the 2012 NJ ASK5 when controlling for attendance.
Null Hypothesis 3a
There is no significant difference between the Everyday Math Alternative
Treatment’s 2010 NJ ASK3 mean scale score at each performance level (Partially
Proficient, Proficient, and Advanced Proficient) and the Everyday Math Alternative
Treatment’s 2012 NJ ASK5 mean scale score at each performance level (Partially
Proficient, Proficient, and Advanced Proficient).
Null Hypothesis 3b
There is no significant difference between the Singapore Math Experimental
Treatment’s 2010 NJ ASK3 mean scale score at each performance level (Partially
Proficient, Proficient, and Advanced Proficient) and the Singapore Math Experimental
Treatment’s 2012 NJ ASK5 mean scale score at each performance level (Partially
Proficient, Proficient, and Advanced Proficient).

85
Null Hypothesis 3c
There is no significant interaction between the independent variables treatment
and performancelevel2012 (the categorical variable representing the 2012 NJ ASK5
proficiency levels: Advanced Proficient, Proficient, and Partially Proficient).
Null Hypothesis 3d
There is no significant difference between the mean scale scores of those students
scoring Proficient on the 2012 NJ ASK5 (scoring 200 and above) in the Everyday Math
Alternative Treatment and the mean scale score of those students scoring Proficient on
the 2012 NJ ASK5 (scoring 200 and above) in the Singapore Math Experimental
Treatment as measured by the 2012 NJ ASK5.
Null Hypothesis 3e
There is no significant difference between the mean scale scores of those students
scoring Partially Proficient on the 2012 NJ ASK5 (scoring below 200) in the Everyday
Math Alternative Treatment and the mean scale score of those students scoring Partially
Proficient on the 2012 NJ ASK5 (scoring below 200) in the Singapore Math
Experimental Treatment as measured by the 2012 NJ ASK5.
Null Hypothesis 4a
There is no significant interaction between treatment status and
Black&Hispanic/White performance as measured by the 2012 NJ ASK5.
Null Hypothesis 4b
There is no significant difference between the overall performance of the subset
of Black and Hispanic students in the Everyday Math Alternative Treatment and the

86
subset of Black and Hispanic students in the Singapore Math Experimental Treatment as
measured by the 2012 NJ ASK5.
Null Hypothesis 4c
There is no significant difference between the overall performance of White
students in the Everyday Math Alternative Treatment and White students in the
Singapore Math Experimental Treatment as measured by the 2012 NJ ASK5.
Null Hypothesis 4d
There is no significant interaction between treatment status and Black/Hispanic
performance as measured by the 2012 NJ ASK5.
Null Hypothesis 4e
There is no significant difference in the overall 2012 NJ ASK5 performance level
of Black and Hispanic students in the Everyday Math Alternative Treatment.
Null Hypothesis 4f
There is no significant difference in the overall 2012 NJ ASK5 performance level
of Black and Hispanic students in the Singapore Math Experimental Treatment.
Null Hypothesis 5
H0: β0 = 0; the predictor variables treatment, attendance, gender, and SES account
for no variation in the performance of Black students on the 2012 NJ ASK5.
Null Hypothesis 6
H0: β0 = 0; the predictor variables treatment, attendance, gender, and SES account
for no variation in the performance of Hispanic students on the 2012 NJ ASK5.

87
Null Hypothesis 7a
There is no significant difference in the 2012 NJ ASK5 performance level of
Hispanic students based on SES classification and treatment status when controlling for
attendance.
Null Hypothesis 7b
There is no significant interaction between treatment status and SES when
controlling for attendance.
Students with disabilities and Limited English Proficient students were not
included in the primary analyses within this study. Additional populations excluded from
the experimental treatment and alternative treatment samples included students having
less than one year in the school/district, out-of-district placements, and out-of-residency
placements as indicated within the 2010 NJ ASK3 and 2012 NJ ASK5 data reports.
Research Design
This study employed an explanatory non-experimental research design using post
hoc pre- and post-test data from the 2010 NJ ASK3 and 2012 NJ ASK5 administrations,
respectively. The study used eight intact, matched comparison groups considered similar
as the experimental treatment and alternative treatment groups. While non-random
designs can impact the potential benefits that an ideal randomization procedure would
achieve; namely the maximization of statistical power, particularly in cases of subgroup
analyses (Lachin, 1988), observations made by Glazerman, Levy, & Myers (2002) and
Torgerson (2006) suggest that high-quality studies with well-matched treatment and
control groups produce outcomes similar to those of randomized experiments. The NRC
(2002) emphasizes that while randomized controlled trials are widely considered the

88
“gold standard” in the sciences for measuring the impact of a particular treatment, they
are often impractical in many areas of social policy, such as education, whereas quasi-
experimental approaches that include comparison groups closely matched on key
characteristics (prior achievement, demographics, etc.) can be rigorous within their own
context (NRC, 2002, 2005). Identification and selection of comparison groups is further
discussed in this chapter.
Instrumentation/Data Collection
This investigation compared the 2012 NJ ASK5 mathematics scale score means
for sampled grade 5 general education students within the Singapore Math Experimental
Treatment (n=100) to the 2012 NJ ASK5 mathematics scale score means for sampled
Grade 5 general education students within the Everyday Math Alternative Treatment
(n=105).
The NJ ASK tests are a series of state assessments administered to New Jersey
public school students to determine levels of student achievement in language arts,
mathematics, and science. The assessments, grounded in the state’s content standards (the
NJCCCS), are standardized tests administered to all New Jersey public school students in
Grades 3-8 during March, April, and/or May, and are an extension of federal and state
accountability requirements. The results of the elementary-level assessments are
intended to measure and promote student acquisition of the state’s curriculum standards
and provide information about student performance.
The empirical reliability and validity of the assessments are reported within the
NJDOE’s New Jersey Assessment of Skills and Knowledge Technical Reports (NJDOE,
2011, 2013) and is further explained in the next subsection.

89
The mathematics assessments include questions in four content clusters (1)
Number and Numerical Operations; (2) Geometry and Measurement; (3) Patterns and
Algebra; (4) Data Analysis, Probability, Discrete Mathematics, and one cluster assessing
the Mathematical Processes. Figure 2 describes the strands associated with each cluster
assessed on the NJ ASK. The Mathematics portion of the NJ ASK tests measures
students’ ability to solve problems by applying mathematical concepts. The Mathematics
component measures knowledge and skills in four content clusters corresponding to
standards. Questions on the NJ ASK are distributed among three item types: multiple
choice, short-constructed, and extended-constructed response items (NJDOE, 2011,
2013). This design is unique given that the format of tasks on many large-scale
standardized tests is predominantly multiple-choice, as accuracy of test scores is most
likely to be achieved by this format (Darling & McCloskey, 2008).
Abida, Azeem, and Gondal (2011), in their study of multiple choice (MC) and
short constructed response (SCR) types, found item format to have significant effects in
assessing students’ proficiency in mathematics. Their research design included the
administration of a 60-item, NAEP-adapted proficiency test to 2,680 students within 134
schools, concluding that, while multiple choice (MC) items are able to assess more
content, short constructed (SCR) items “require more thinking than MC items” (Abida et
al., p. 145); and more specifically, inclusion of both MS and SCR item formats may
improve test reliability (Abida et al., 2011). On the third and fourth grade test, about
40% of the items can be classified as number and numerical operations, and the
remaining points are fairly evenly split between geometry and measurement, patterns and
algebra, and data analysis, probability, and discrete mathematics. On the fifth grade test,

90
about 36% of the items can be classified as number and numerical operations; about 32%
of the items can be classified as geometry and measurement; and the remaining points are
equally distributed between algebra, patterns and data analysis, probability, and discrete
mathematics. Performance level descriptors are Partially Proficient, Proficient, and
Advanced Proficient. See Table 5 for descriptors (NJDOE, 2009).
4.1. Number and Numerical Operations
A. Number Sense B. Numerical Operations C. Estimation 4.2. Geometry and Measurement
A. Geometric Properties B. Transforming Shapes C. Coordinate Geometry D. Units of Measurement E. Measuring Geometric Objects 4.3. Patterns and Algebra
A. Patterns B. Functions and Relationships C. Modeling D. Procedures
4.4. Data Analysis, Probability, and Discrete Mathematics
A. Data Analysis (Statistics) B. Probability C. Discrete Mathematics--Systematic Listing and Counting D. Discrete Mathematics--Vertex-Edge Graphs and Algorithms
Figure 2. NJ ASK Content Clusters/Standards and their Associated Strands
For this study, publically available 2009-2010 and 2011-2012 enrollment, school
performance, statewide assessment, and the historical NJ Report Card data retrieved from
the New Jersey Department of Education’s website was used. School year 2009-2010
enrollment numbers were based on the October 15, 2009, district enrollment count. The
NJDOE suppressed data having cell sizes of less than 11 students, proficiency levels that
were greater than 90% Partially Proficient, and other combinations of small cell sizes that

91
might not protect privacy. Asterisks were used on report card data files to indicate that
the data were suppressed in order to protect privacy. Student level data were also used
for this study. I requested and received approval to collect and use data for the purposes
of this study from the Large Northeastern Urban Public School District’s internal
Institutional Review Board (IRB) and Seton Hall University’s IRB. See Appendix A for
documentation of IRB approval. Throughout this study, data are reported in aggregate at
either the “treatment” level or “school” level.
Instrument Reliability and Validity
As reported by the NJDOE (2011), the NJ ASK assessments were designed under
the tenets of Classical Test Theory (CTT). Measurement Incorporated (MI), the
contractor for NJ ASK Grades 3-8, uses Cronbach’s coefficient alpha for estimating the
consistency of individual performance on a single test administration. Based upon
published technical reports, the reliability coefficient alphas for the Mathematics portion
of the 2011 Grade 5 NJ ASK range from .56 - .86 per cluster; combining all item types
(multiple choice, short constructed, and extended constructed response items) with an
overall coefficient alpha of .90 and a Standard Error of Measure (SEM) of 3.23.

92
Table 5. NJ ASK Performance Level Descriptors for Grades 3, 4, and 5
NJ ASK Performance Level Descriptors for Grades 3, 4, and 5
(Source: New Jersey Department of Education, 2009)
MI uses the Kappa index (φ) to estimate how reliably the NJ ASK classifies
students into the performance categories (Partially Proficient, Proficient, and Advanced
Proficient). The Kappa index indicates “the probability of a consistent classification by
chance” (NJDOE, 2011, p. 123). The NJDOE reports the stratified alpha coefficient as
.93, the Standard Error of Measure as 2.92, and the Kappa percentage as 80% for the
Mathematics portion of the 2011 Grade 5 NJ ASK (NJDOE, 2011).
MI calculates a final measure of reliability, rater reliability, based upon the
percentages of extended constructed response items scored, on a 0-3 point scoring rubric
Grade 3 Grade 4 Grade 5
Partially Proficient
100-199
Students performing at the
Partially Proficient level have
limited recall, recognition
and application of basic facts
and informational concepts.
Students performing at the
Partially Proficient level have
limited recall, recognition
and application of basic
mathematical concepts,
skills, and vocabulary to solve
problems involving real
world situations.
Students performing at the
partially proficient level have
limited recognition and
understanding of and
inconsistently apply basic
mathematical concepts, skills,
and vocabulary to theoretical
and real world situations.
Proficient
200 - 249
Students performing at the
proficient level demonstrate
recall, recognition and
application of facts and
informational concepts.
Students performing at the
proficient level demonstrate
recall, recognition and
application of mathematical
concepts, skills, and
vocabulary to solve problems
involving real world
situations.
Students performing at the
proficient level recognize and
understand basic
mathematical concepts, skills,
and vocabulary and apply
them to theoretical and real
world situations.
Advanced
Proficient
250 - 300
Students performing at the
Advanced Proficient level
demonstrate the qualities
outlined for Proficient
performance. In addition,
these students determine
strategies and procedures to
solve routine and non-
routine problems.
Students performing at the
Advanced Proficient level
clearly and consistently
demonstrate the qualities
outlined for Proficient
performance.
Students performing at the
advanced proficient level
consistently demonstrate the
qualities outlined for
proficient performance. In
addition, advanced proficient
students analyze methods for
appropriateness, synthesize
processes, and evaluate
mathematical relationships.

93
for math, with exact agreement, adjacent agreement, and resolution needed by grade level
and content area. The NJDOE (2011) reports the exact agreement rate for the
Mathematics portion of the 2011 Grade 5 NJ ASK as 89.2 for all extended constructed
response items.
The state reports Pearson correlations coefficients to address construct validity.
Validity details are outlined in the 2011 NJ ASK 3-8 Technical Report (NJDOE, 2012).
Data Analysis
The NRC’s Panel on Evaluating Curricular Effectiveness (NRC, 2004),
recognizing the complexity of doing research on curricular effectiveness and the need to
strengthen the conduct of comparative studies in order to mitigate possible confounding
variables, recommended that in all comparative analyses, “explicit attention be given to
the following criteria” (p. 7):
• Identify comparative curricula by name
• Employ random assignment, or otherwise establish adequate comparability
• Select the appropriate unit of analysis
• Document extent of implementation fidelity (see Chapter 1, Researcher Bias)
• Select outcome measures that can be disaggregated by content strand7
• Conduct appropriate statistical tests and report effect size
• Disaggregate data by gender, race/ethnicity, socioeconomic status (SES), and
performance levels, and express constraints as to the generalizablity of the
study (p. 7).
7 Analyses of individual clusters were not included in the design due to the reported reliability coefficient
alphas of the 2011 Grade 5 NJ ASK with ranges from .56 - .86 per cluster (see Delimitations).

94
Since this study retained the four alternative treatment sites initially selected by
the district to pair with each of the experimental treatment sites, the conduct of this
comparative analysis needed to be strengthened (NRC, 2004). At both the school and
treatment levels, a series of preliminary analyses were employed to establish adequate
comparability of the paired groups and to analyze the interaction and effect of key
variables. Several demographic factors that research has connected to student
achievement were included in the preliminary analyses and were used to assess
comparability between the experimental treatment and alternative treatment groups;
percentage of low-income students (Pearl, 2002; Steinberg, Brown, & Dornbusch, 1996),
percentage of minority students (African-American and Hispanic), student population
(Bouchey & Harter, 2005; Demie, 2001; Tate & D’Ambrosio, 1997), etc. At the paired
school level and at the treatment level, simple Chi Square (Goodness-of-Fit), r X k Chi
Square, t-tests, and ANOVA were employed in the study to determine whether there were
significant differences between the main distributions: race/ethnicity, gender, SES, etc.
(see Appendix B: Null Hypotheses 1-7). Additionally, at the treatment level, a Two-
Sample t-test (Assuming Unequal Variances) was conducted to compare the 2010 NJ
ASK3 performance level between the Everyday Math Alternative Treatment sample and
the Singapore Math Experimental Treatment sample to ensure that “treatment status” did
not give initial advantage to either group. Results of the preliminary analyses are
discussed in Chapter IV.
The primary analyses, linear regression, multiple regression, hierarchical regression,
one-way ANOVA, ANCOVA, factorial ANOVA and factorial ANCOVA were employed
to determine the effect of the independent variables (treatment, gender, SES,

95
race/ethnicity, and attendance) on the dependent variable, performance on the
mathematics portion of the Grade 5 Assessment of Skills and Knowledge (2012 NJ
ASK5) (see Figure 3).
One research question, seven subsidiary questions and their accompanying null
hypotheses were analyzed using Microsoft Excel’s Data Analysis Tools and the IBM’s
statistical analysis software, SPSS version 21.0. Differences were reported only if the
comparisons were statistically significant, using F-ratio statistic to determine statistical
significance where p ≤ 0.05.
Effect Size8
In the analyses of correlation and regression, the Pearson R2 correlation was used
to calculate effect sizes of statistically significant outcomes where rough guidelines for
determining size is 0.1, small; 0.3, medium; 0.5, large (Cohen, 1988, 1992). For
Analyses of Variance, effect sizes are reported as partial eta squared (ηp2) where rough
guidelines for determining size is 0.01, small; 0.06, medium; 0.138, large (Bruin, 2006).
For all t-tests, Cohen's d was used to calculate effect sizes of statistically significant
outcomes whereby 0.2 equates to a small effect, 0.5 equates to a medium effect, and
effects larger than 0.8 equate to large effects (Cohen, 1988).
8 Although rough guidelines for interpreting effect sizes have been included in this study, effect size can
also be interpreted as a comparison between the reported effect size and those reported in prior studies of a
similar nature (Thompson, 2002a; Vaccha-Haase & Thompson, 2004).

96
Figure 3. Research Design Schematic
Summary
This study employed an explanatory non-experimental research design using post
hoc pre- and post-test data from 2010 NJ ASK3 and 2012 NJ ASK5 administrations. The
qualifying experimental treatment and alternative treatment participants were Grade 5
general education students who were administered both the 2010 NJ ASK3 and the 2012
NJ ASK5 at their respective school sites.
A series of preliminary analyses, simple Chi Square (Goodness-of-Fit), r X k Chi
Square, t-tests, and ANOVA, were employed in the study to determine comparability of
the groups. The primary analyses, linear regression, multiple regression, hierarchical
regression, one-way ANOVA and ANCOVA, factorial ANOVA, and factorial ANCOVA
were employed to determine the effect of the independent variables (treatment, gender,

97
SES, race/ethnicity, and attendance) on the dependent variable, performance on the
mathematics portion of the Grade 5 Assessment of Skills and Knowledge.
As non-randomized designs possess an overall risk of spurious relationships, this
design actively sought to isolate the effect of extraneous variables. Confounding
variables were either actively excluded or controlled and are reflected in the types of
analyses conducted.
The main findings are reported in Chapter IV. In addition, Chapter IV, when
applicable, includes the verification of parametric assumptions (normality, linear
correlation, homogeneity of regression slopes, homogeneity of variance), dependent
variable scores, significance, F-ratio scores, means, and effect sizes.

98
CHAPTER IV
DATA ANALYSIS
Introduction
Chapter IV presents the results and findings of this study to address the problems
posed in Chapter 1. Multiple data analyses were conducted and the results are reported
and summarized to answer the primary research questions and test the hypotheses. When
appropriate, the magnitude, statistical significance, and validation of results are
presented. One ultimate goal drove the collection of the data and the subsequent data
analysis for this study. The goal was to use research-based methodology to provide valid,
informative, and credible data on curricular effectiveness, specifically data on the
effectiveness of the two elementary school mathematics curricula presented in this study,
Singapore Math (published by Houghton Mifflin Harcourt, 2010) and Everyday
Mathematics, 3rd edition (currently published by the Wright Group/McGraw-Hill, 2007).
The study used the results from the state-mandated NJ ASK mathematics assessment to
examine the student achievement outcomes of Grade 5 students across several
demographic characteristics (e.g., race/ethnicity, gender, SES). An explanatory non-
experimental research design was employed, using post hoc pre- and post-test data from
2010 NJ ASK3 and 2012 NJ ASK5 administrations, respectively. Grade 3 NJ ASK 2010
performance data were used as the measure of pre-treatment achievement. Grade 5 NJ
ASK 2012 performance data were used as the outcome measure and were examined at
the treatment level. The qualifying experimental treatment sample (N=100) and
alternative treatment sample (N=105) were Grade 5 general education students from eight

99
schools within a large urban public school district who were administered both the 2010
NJ ASK3 and the 2012 NJ ASK5 at their respective school sites.
A series of preliminary analyses, simple Chi Square (Goodness-of-Fit), r X k Chi
Square, t-tests, and ANOVA, were employed in the study to determine comparability of
the groups. The primary analyses, linear regression, multiple regression, hierarchical
regression, one-way ANOVA and ANCOVA, factorial ANOVA, and factorial
ANCOVA, were employed to determine the effect of the independent variables
(treatment, gender, SES, race/ethnicity, and attendance) on the dependent variable,
performance on the mathematics portion of the Grade 5 Assessment of Skills and
Knowledge. One research question, seven subsidiary questions, and their accompanying
null hypotheses were analyzed and discussed in this chapter. Microsoft Excel’s Data
Analysis Tools and IBM’s statistical analysis software, SPSS version 21.0, were utilized
for data analysis. Differences were reported only if the comparisons were statistically
significant, using the F-ratio statistic to determine statistical significance where p ≤ 0.05.
The potential implications for theory, knowledge, practice, policy, and future research are
discussed in Chapter V.
Preliminary Analyses
Because this study retained the four alternative treatment sites initially paired by
the district to each of the experimental treatment sites, the conduct of this comparative
analysis needed to be strengthened (NRC, 2004). The initial intention of the researcher
was to make gross comparisons between the paired schools. At both the school and
treatment levels, a series of preliminary analyses were employed to establish adequate
comparability of the paired groups and to analyze the interaction and effect of key

100
variables. At the paired school level and at the treatment level, chi squares were used to
determine whether there were significant differences between the main distributions
(treatment, attendance, race/ethnicity, gender, and SES) (see Appendix B). At the
treatment level, an Independent Samples t-test (Assuming Unequal Variances) was
conducted to compare the 2010 NJ ASK3 performance level between the Everyday Math
Alternative Treatment sample and the Singapore Math Experimental Treatment sample to
ensure that “treatment status” did not give initial advantage to either group. Results of
the preliminary analyses are discussed in the next section.
Summary of Preliminary Analyses
Preliminary chi square analyses performed at the paired school level revealed
statistically significant differences in race/ethnicity, gender, and SES level. However, at
the treatment level, once delimiting the treatment sample to (1) general education
students (2) who were enrolled within their respective treatment site during schools years
2010-11 and 2011-12 (3) with reported mathematics score data from both the 2010 NJ
ASK3 and the 2012 NJ ASK5 administrations, no significant differences were found
between the qualifying alternative and experimental treatment samples when comparing
distributions of race/ethnicity, gender, socioeconomic status (SES), and performance
levels (past performance as measured by the 2010 NJ ASK3 data) (see Appendix B).
While it was entirely legitimate to isolate the variance in the post-treatment scores
that was not associated with past performance in order to focus the treatment
comparisons exclusively on post-treatment effects, preliminary analysis showed
homogeneity of the treatment groups with regard to past performance. The Independent
Samples t-test (Assuming Unequal Variances) revealed no significant difference in the

101
pre-test mean scale score of the Everyday Math Alternative Treatment (M=221.95,
SD=39.99) and pre-test mean scale score of the Singapore Math Experimental Treatment
(M=219.44, SD=45.90); t(196)=0.417, p = 0.667, suggesting that there is no significant
difference in past performance between the two treatment groups and thereby justifying
the exclusion of the covariate in this study. The results are shown in Table 6.
As such, all primary analyses, linear regression, multiple regression, hierarchical
regression, one-way ANOVA and ANCOVA, were used in this study to explore Grade 5
performance on the 2012 NJ ASK at the treatment level. Analyses were conducted to
examine differences between the main variables that research tells us have influence on
student performance (SES, treatment, attendance, gender, and race/ethnicity)(see Table
10). The qualifying Everyday Math Alternative Treatment (N=105) and the Singapore
Math Experimental Treatment (N=100) were a representation of Grade 5 general
education students residing in one of the four the district regions who remained within
their respective schools sites for their third, fourth, and fifth grade years.
Statistical Power and Effect Size9
In the analyses of correlation and regression, the Pearson R2 correlation was used
to calculate effect sizes of statistically significant outcomes where the rough guideline for
determining size is 0.1, small; 0.3, medium; 0.5, large (Cohen, 1988, 1992). For analyses
or variance, effect sizes are reported as partial eta squared (η p 2) where the rough
guideline for determining size is 0.01, small; 0.06, medium; 0.138, large (Bruin, 2006).
9 Although rough guidelines for interpreting effect sizes have been included in this study, effect size can
also be interpreted as a comparison between the reported effect size and those reported in prior studies of a
similar nature (Thompson, 2002a; Vaccha-Haase & Thompson, 2004).

102
Table 6. Independent Samples t-test Assuming Unequal Variances
Independent Samples t-test Assuming Unequal Variances (2010 NJ ASK3 Data)
Alternative
Treatment
Experimental
Treatment
Mean 221.952381 219.44
Variance 1599.10348 2107.036768
Observations 105 100
Hypothesized Mean Difference 0
Standard Deviation 39.98879193 45.90247017
df 196
t Stat 0.416996712
P(T<=t) one-tail 0.338568584
t Critical one-tail 1.652665059
P(T<=t) two-tail 0.677137167
t Critical two-tail 1.972141222
For all t-tests, Cohen's d was used to calculate effect sizes of statistically
significant outcomes, whereby 0.2 equates to a small effect, 0.5 equates to a medium
effect, and effects larger than 0.8 equate to large effects (Cohen, 1988).
Testing the Assumptions
Criterion for dependent variable and the covariates. In this analysis, the
dependent variables, 2010 NJ ASK3 performance level and 2012 NJ ASK5 performance
level, were measured on a continuous scale (from 100 to 300). Attendance, also used as a
covariate variable, was also on a continuous scale (from 0 to 370). Attendance was
documented for all participants for school years 2010-2011 and 2011-2012 (the two
successive years reflected within this study), and the total possible number of days (370)
reported.
Criterion for categorical variables. The independent variables treatment,
gender, SES, and Black&Hispanic/White each consisted of two or more categorical,
independent groups. Examples of independent variables that meet this criterion include

103
gender (2 groups: male and female), race/ethnicity (2 groups: Black&Hispanic and
White), SES (2 groups: low SES and high SES), treatment (2 groups: Everyday Math
Alternative Treatment and Singapore Math Experimental Treatment), and so forth.
Independence of observations. There was no relationship between the
observations in each group or between the groups themselves. There were different
participants in each treatment group with no participant being in more than one group.
Independence. The Durbin-Watson statistic was applied as a measure of
autocorrelation between the residuals. In this analysis, Durbin-Watson statistics
approximately equal to 2 indicate no serial correlation between the residuals (Durbin and
Watson, 1950, 1951). Results of each test for independence are explained within the
primary analyses of regression and variance.
Normality. Tests for normality were applied to make inferences as to whether the
data sets for the continuous variables, 2010 NJ ASK3 and 2012 NJ ASK5, follow a
normal distribution, using either the Shapiro-Wilk statistic or the Kolmogorov-Smirnov
statistic when appropriate (see Appendix C). The 2010 NJ ASK3 scale scores of the
Everyday Math participants ranged from 128 to 300 (M = 221.95, SD = 39.99) and were
normally distributed with skewness of 0.091 (SE = 0.236) and kurtosis of 0.209 (SE =
0.467). The 2012 NJ ASK5 scale scores of the Everyday Math participants ranged from
140 to 300 (M = 225.45, SD = 33.429) and were normally distributed with skewness of
0.125 (SE = 0.236) and kurtosis of 0.111 (SE = 0.467). The 2010 NJ ASK3 scale scores
of the Singapore Math participants ranged from 128 to 300 (M = 219.44, SD = 45.902)
and were normally distributed with skewness of 0.144 (SE = 0.241) and kurtosis of

104
-0.796 (SE = 0.478). The 2012 NJ ASK5 scale scores of the Singapore Math participants
ranged from 146 to 300 (M = 220.88, SD = 37.752) and were normally distributed with
skewness of 0.117 (SE = 0.241) and kurtosis of -0.745 (SE = 0.478).
Homogeneity of variance. Levene's Test of Equality was applied in all analyses
of variance and covariance to assess the homogeneity of variance, an inferential statistic
used to assess the equality of variances for a variable calculated for two or more groups.
The null hypothesis for this statistic assumes that the population variances are equal,
indicating that there is a difference between the variances in the population. Results of
each test are presented within each analysis. In cases where the assumption was not met
(p < 0.05), additional analyses were conducted to verify findings.
Descriptive Statistics
Table 7 displays treatment level data. One hundred and five (N=105) Grade 5
students represented the qualifying Everyday Math Alternative Treatment sample. One
hundred (N=100) Grade 5 students represented the qualifying Singapore Math
Experimental Treatment sample. The attendance rate was 95.92% for the Everyday Math
Alternative Treatment and 94.58% for the Singapore Math Experimental Treatment.
86.7% of the Everyday Math Alternative Treatment participants and 85.0% of the
Singapore Math Experimental Treatment participants were low SES (receiving free or
reduced lunch). 41.9% of the Everyday Math Alternative Treatment participants and
39.0% of the Singapore Math Experimental Treatment participants were male. 58.1% of
the Everyday Math Alternative Treatment participants and 61.0% of the Singapore Math
Experimental Treatment participants were female. 47.6%% of the Everyday Math
Alternative Treatment participants and 51.0% of the Singapore Math Experimental

105
Treatment participants were Black. 38.1% of the Everyday Math Alternative Treatment
participants and 37.0% of the Singapore Math Experimental Treatment participants were
Hispanic. 13.3% of the Everyday Math Alternative Treatment participants and 11.0% of
the Singapore Math Experimental Treatment participants were White. 1.0% of the
Everyday Math Alternative Treatment participants and 1.0% of the Singapore Math
Experimental Treatment participants were Other. 74.3% of the Everyday Math
Alternative Treatment participants and 66.0% of the Singapore Math Experimental
Treatment participants were Proficient on the 2010 NJ ASK3. 85.7% of the Everyday
Math Alternative Treatment participants and 71.0% of the Singapore Math Experimental
Treatment participants were Proficient on the 2012 NJ ASK5.
Table 8 displays the Grade 3 2010 NJ ASK and Grade 5 2012 NJ ASK
performance data disaggregated by treatment, SES status, race/ethnicity, and gender.

106
Table 7. Grade 5 2012 Treatment Level Data
Grade 5 2012Treatment Level Data
The 2012 NJ ASK5 mean scale score for the Everyday Math Alternative
Treatment group (N=105) was 225.45 (SD = 33.43). The 2012 NJ ASK5 mean scale
score for the Singapore Math Experimental Treatment group (N=100) was 220.88 (SD =
37.75). The 2012 NJ ASK5 mean scale score for the Everyday Math Alternative
Treatment subgroup low SES (N=91) was 224.73 (SD = 33.82). The 2012 NJ ASK5
mean scale score for the Singapore Math Experimental Treatment subgroup low SES
(N=85) was 220.99 (SD =37. 95). The 2012 NJ ASK5 scale score mean for the Everyday
Math Alternative Treatment subgroup higher SES (N=14) was 230.14 (SD = 31.54). The
2012 NJ ASK5 mean scale score for the Singapore Math Experimental Treatment
subgroup higher SES (N=15) was 220.27 (SD =37.93). The 2012 NJ ASK5 mean scale
score for the Everyday Math Alternative Treatment subgroup Black (N=50) was 211.60
10 Attendance Rate is reported as a percentage of the total possible days (370) for the two successive years reflected in this study.

107
(SD = 29.28). The 2012 NJ ASK5 mean scale score for the Singapore Math Experimental
Treatment subgroup Black (N=51) was 205.94 (SD=29.69). The 2012 NJ ASK5
mean scale score for the Everyday Math Alternative Treatment subgroup Hispanic
(N=40) was 233.50 (SD = 33.45). The 2012 NJ ASK5 mean scale score for the Singapore
Math Experimental Treatment subgroup Hispanic (N=37) was 225.92 (SD =37.29). The
2012 NJ ASK5 mean scale score for the Everyday Math Alternative Treatment subgroup,
White (N=14) was 251.93 (SD = 25.72). The 2012 NJ ASK5 mean scale score for the
Singapore Math Experimental Treatment subgroup White (N=11) was 267.18 (SD
=25.86). The 2012 NJ ASK5 mean scale score for the Everyday Math Alternative
Treatment subgroup Other (N=1) was 225 (SD = N/A). The 2012 NJ ASK5 mean scale
score for the Singapore Math Experimental Treatment subgroup Other (N=1) was 287
(SD =N/A). The 2012 NJ ASK5 mean scale score for the Everyday Math Alternative
Treatment subgroup females (N=61) was 224.20 (SD = 31.33). The 2012 NJ ASK5 mean
scale score for the Singapore Math Experimental Treatment subgroup females (N=61)
was 215.28 (SD =37.51). The 2012 NJ ASK5 mean scale score for the Everyday Math
Alternative Treatment subgroup males (N=44) was 227.18; (SD = 36.44). The 2012 NJ
ASK5 mean scale score for the Singapore Math Experimental Treatment subgroup males
(N=39) was 229.64 (SD =36.904).

108
Table 8. 2010 and 2012 NJ ASK Performance Data by Subgroup
2010 and 2012 NJ ASK Performance Data by Subgroup
Everyday Math
Alternative Treatment
Singapore Math
Experimental Treatment
2010 NJ ASK3 2012 NJ ASK5 2010 NJ ASK3 2012 NJ ASK5
Total Students N=105 N=105 N=100 N=100
Mean 221.95 225.45 219.44 220.88
Standard Deviation 39.989 33.43 45.902 37.75
Low SES N = 91 N = 91 N = 85 N = 85
Mean 219.09 224.73 218.04 220.99
Standard Deviation 39.334 33.818 47.025 37.945
Higher SES N = 14 N = 14 N = 15 N = 15
Mean 240.57 230.14 227.40 220.27
Standard Deviation 40.631 31.542 39.390 37.929
Black N = 50 N = 50 N = 51 N = 51
Mean 212.18 211.60 201.88 205.94
Standard Deviation 33.747 29.275 33.451 29.690
Hispanic N = 40 N = 40 N = 37 N = 37
Mean 225.58 233.50 225.16 225.92
Standard Deviation 45.112 33.446 49.485 37.287
White N = 14 N = 14 N = 11 N = 11
Mean 246.79 251.93 274.27 267.18
Standard Deviation 36.358 25.722 28.278 25.864
Other N = 1 N = 1 N = 1 N = 1
Mean 218 225 300 287
Standard Deviation . . . .
Females N = 61 N = 61 N = 61 N = 61
Mean 220.72 224.20 212.67 215.28
Standard Deviation 38.445 31.332 44.804 37.513
Males N = 44 N = 44 N = 39 N = 39
Mean 223.66 227.18 230.03 229.64
Standard Deviation 39.989 36.437 46.166 36.904

109
Primary Analyses
Linear regression, multiple regression, hierarchical regression, one-way ANOVA,
ANCOVA, factorial ANOVA and factorial ANCOVA were used in this study to explore
Grade 5 performance on the 2012 NJ ASK at the treatment level. Independent and
dependent variables are described in Table 9.
Research Questions
What is the impact of implementing a proposed CCSSM-aligned mathematics
program, Singapore Math, on mathematics achievement of grade 5 general education
students as measured by the 2012 Grade 5 NJ ASK (NJ ASK5), in comparison to the
mathematics achievement of Grade 5 general education students using a NCTM-aligned
elementary mathematics program, Everyday Mathematics, in the Large Northeastern
Urban Public School District?
Subsidiary Question 1
How much variance in the 2012 NJ ASK5 mean scale score can be explained by
the predictor variables treatment, attendance, gender, race/ethnicity, and SES?
Subsidiary Question 2
Is there a statistically significant difference in the 2012 NJ ASK5 performance
level of students in the Everyday Math Alternative Treatment and the Singapore Math
Experimental Treatment when controlling for attendance?
Subsidiary Question 3
To what extent do differences in performance exist when data are analyzed
according to 2012 NJ ASK5 performance levels (Partially Proficient, Proficient, and

110
Advanced Proficient) and treatment status; and is there significant interaction between
the performance levels and treatment?
Subsidiary Question 4
Is there a statistically significant difference in the 2012 NJ ASK5 performance
level of students in the Everyday Math Alternative Treatment and the Singapore Math
Experimental Treatment based on race/ethnicity (Black, Hispanic, White, subset of Black
and Hispanic); and is there significant interaction between treatment status and
race/ethnicity (Black, Hispanic, White, subset of Black and Hispanic)?
Subsidiary Question 5
How much variance in the 2012 NJ ASK5 mean scale score of Black students can
be explained by the predictor variables treatment, attendance, gender, and SES?
Subsidiary Question 6
How much variance in the 2012 NJ ASK5 mean scale score of Hispanic students
can be explained by the predictor variables treatment, attendance, gender, and SES?
Subsidiary Question 7
Is there a statistically significant difference in the 2012 NJ ASK5 performance
level of Hispanic students based on SES classification and treatment status when
controlling for attendance; and is there significant interaction between treatment status
and SES classification for Hispanic students when controlling for attendance?

111
Table 9. Description of the Variables
Description of the Variables
Field Description
Dependent Variable
MathScaleScore2012 - Continuous variable representing the 2012 NJ ASK5 scale scores
Independent Variables
MathScaleScore2010 Continuous variable representing the 2010 NJ ASK3 scale scores
PerformanceLevel2010 Categorical variable representing the 2010 NJ ASK3 proficiency levels; (1-Advanced, 2 – Proficient, 3 – Partial)
PerformanceLevel2012 Categorical variable representing the 2012 NJ ASK5 proficiency levels; (1-Advanced, 2 – Proficient, 3 – Partial)
Treatment Dichotomous variable of treatment status; Everyday Math Alternative or Singapore Math Experimental
Pass_Fail2012 Dichotomous variable representing 2012 NJ ASK5 performance status; Pass – scoring 200 and above or Fail – scoring below 200
Black&Hispanic/White Dichotomous variable representing race/ethnicity status; Black/Hispanic or White/Other* *Other (N=1), in both treatment groups and is combined with White in each analysis
Black/Hispanic Dichotomous variable representing race/ethnicity status; Black or Hispanic
SES Dichotomous variable representing socioeconomic status; low SES – qualifying for free/reduced lunch; higher SES – not qualifying for free/reduced lunch
Gender Dichotomous variable representing gender; male or female
Attendance_2yr Continuous variable representing the total number of days in attendance for school years 2010-11 and 2011-12
2010 Partially Proficient Continuous variable representing the 2010 NJ ASK3 scale scores of students scoring less than 200 on the 2010 NJ ASK3
2012_ Same2010PP Categorical variable representing the 2012 NJ ASK5 scale scores of students scoring less than 200 on the 2010 NJ ASK3
2010 Proficient Continuous variable representing the 2010 NJ ASK3 scale scores of students scoring 200 to 249 on the 2010 NJ ASK3
2012_ Same2010P Categorical variable representing the 2012 NJ ASK5 scale scores of students scoring 200 to 249 on the 2010 NJ ASK3
2010 Advanced Proficient Continuous variable representing the 2010 NJ ASK3 scale scores of students scoring 250 and above on the 2010 NJ ASK3
2012_ Same2010AP Categorical variable representing the 2010 NJ ASK3 scale scores of students scoring 250 and above on the 2010 NJ ASK3

112
Table 10.
Summary of Analyses

113

114
Subsidiary Question 1
How much variance in the 2012 NJ ASK5 mean scale score can be explained by
the predictor variables treatment, attendance, gender, race/ethnicity, and SES?
Null Hypothesis 1
H0: β0 = 0; the predictor variables treatment, attendance, gender, Black&Hispanic/White
and SES account for no variation in student performance on the 2012 NJ ASK5.
Multiple and hierarchical regressions were used as exploratory analyses to
determine how strongly a set of predictor variables, when taken together, will predict
performance.
A simultaneous regression analysis was conducted to determine the degree to
which the predictor variables treatment, attendance, gender, Black&Hispanic/White and
SES account for variation in student performance on the 2012 NJ ASK5 and to determine
which of the variables, if any, are significant predictors of performance on the 2012 NJ
ASK5. Basic descriptive statistics, correlations, model summaries, ANOVA, and
regression coefficients are shown in Tables 11 through 14. Collinearity statistics,
revealed VIFs less than 2 indicating that there was not a high correlation among the
predictor variables (Allison, 1999). The Durbin-Watson statistic was applied as a
measure of correlation between the residuals. In this analysis, the value of the Durbin-
Watson statistic is 1.743, approximately equal to 2, indicating no serial correlation
between the residuals (Durbin & Watson, 1950, 1951).
The current model showed a significant proportion of variance in the 2012 NJ
ASK5 performance (16.5%) was attributed to the combination of predictor variables
treatment, attendance, gender, Black&Hispanic/White, and SES with an R = 0.431, R2adj

115
= 0.165, F(5, 199) = 9.06, p < 0.05. Coefficient statistics revealed that the predictor
variables attendance and Black&Hispanic/White were the only variables within the
model explaining a statistically significant proportion of variance in performance
• Attendance, β =0.196 (explaining 3.8% of variance), t(205) = 3.006, p<0.05
• Black&Hispanic/White, β =0.354 (explaining 12.5% of variance), t(205) =
5.496, p<0.05
The variables treatment, gender, and SES were not significant predictors of performance
in this model. Though treatment was not a significant indicator of performance, it was
retained as a fixed or grouping variable in all subsequent analyses.
Table 11. Descriptive Statistics of Multiple Regression Model- treatment, attendance, gender, black&Hispanic/white and SES Descriptive Statistics of Multiple Regression Mode l - Treatment, Attendance, Gender,
Black&Hispanic/White and SES
Descriptive Statistics
Mean Std. Deviation N
MathScaleScore2012 223.22 35.589 205
Attendance_2yr 352.4829 15.32646 205
SES .86 .349 205
Gender .60 .492 205
Black&Hispanic/White .1268 .33360 205
Treatment .49 .501 205
Table 12. Model Summary of Multiple Regression Model- treatment, attendance, gender, black&Hispanic/white and SES Model Summary of Multiple Regression Mode l- Treatment, Attendance, Gender,
Black&Hispanic/White and SES
Model Summary
Model
R R Square Adjusted R Square
Std. Error of the
Estimate Durbin-Watson
1 .431a .185 .165 32.522 1.743
a. Predictors: (Constant), Treatment, Black&Hispanic/White, Gender, SES, Attendance_2yr
b. Dependent Variable: MathScaleScore2012
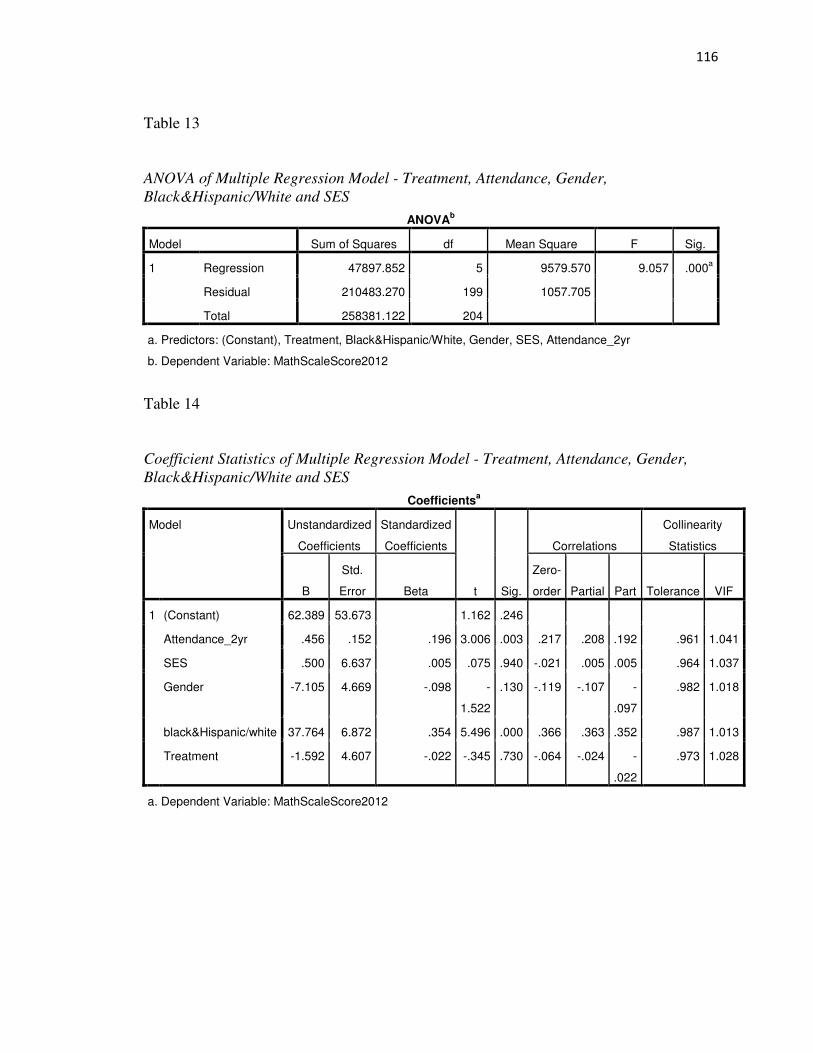
116
Table 13. ANOVA of Multiple Regression Model- treatment, attendance, gender, black&Hispanic/white and SES ANOVA of Multiple Regression Model - Treatment, Attendance, Gender,
Black&Hispanic/White and SES
ANOVAb
Model Sum of Squares df Mean Square F Sig.
1 Regression 47897.852 5 9579.570 9.057 .000a
Residual 210483.270 199 1057.705
Total 258381.122 204
a. Predictors: (Constant), Treatment, Black&Hispanic/White, Gender, SES, Attendance_2yr
b. Dependent Variable: MathScaleScore2012
Table 14. Coefficient Statistics of Multiple Regression Model- treatment, attendance, gender, black&Hispanic/white and SES Coefficient Statistics of Multiple Regression Model - Treatment, Attendance, Gender,
Black&Hispanic/White and SES
Coefficientsa
Model Unstandardized
Coefficients
Standardized
Coefficients
t Sig.
Correlations
Collinearity
Statistics
B
Std.
Error Beta
Zero-
order Partial Part Tolerance VIF
1 (Constant) 62.389 53.673 1.162 .246
Attendance_2yr .456 .152 .196 3.006 .003 .217 .208 .192 .961 1.041
SES .500 6.637 .005 .075 .940 -.021 .005 .005 .964 1.037
Gender -7.105 4.669 -.098 -
1.522
.130 -.119 -.107 -
.097
.982 1.018
black&Hispanic/white 37.764 6.872 .354 5.496 .000 .366 .363 .352 .987 1.013
Treatment -1.592 4.607 -.022 -.345 .730 -.064 -.024 -
.022
.973 1.028
a. Dependent Variable: MathScaleScore2012

117
A stepwise regression analysis was conducted to determine the independent
variable(s) best correlated with the dependent variable, 2012 NJ ASK5 performance.
Basic descriptive statistics, correlations, model summaries, ANOVA, and regression
coefficients are shown in Tables 15 through 18. Collinearity statistics revealed VIFs less
than 2 in all cases, indicating that there was not a high correlation among the predictor
variables (Allison, 1999). The Durbin-Watson statistic was applied as a measure of
correlation between the residuals. In this analysis, the value of the Durbin-Watson
statistic is 1.703, approximately equal to 2, indicating no serial correlation between the
residuals (Durbin & Watson, 1950, 1951). The analysis presented two statistically
significant models. Model 1 showed a significant proportion of variance in 2012 NJ
ASK5 performance attributed to the predictor Black&Hispanic/White, R = 0.366, R2adj =
.130, F(1, 203) = 31.47, p < 0.05 and β =0.366, t (205) = 5.610, p<0.05. Model 2 showed
a significant proportion of variance in 2012 NJ ASK5 performance attributed to the
predictor variables Black&Hispanic/White and attendance, R = 0.419, R2adj = .167, F(2,
202) = 21.460, p < 0.05, and each predictor variable within the model is also significant
at the level p<0.05
• Black&Hispanic/White, β =0.358 (explaining 12.8% of variance), t (205) =
5.598, p<0.05
• Attendance, β =0.203 (explaining 4.1% of variance), t (205) = 3.170, p<0.05
In Model 2, the R2 change= 0.041 was significant with p<0.05. Overall results show that
the variables Black&Hispanic/White and attendance account for a significant proportion
of variation in student performance. The variables treatment, gender, and SES were not
significant predictors of performance in this model.

118
Table 15. Descriptive Statistics of Stepwise Regression Model- treatment, attendance, gender, black&Hispanic/white and SES Descriptive Statistics of Stepwise Regression Model - Treatment, Attendance, Gender,
Black&Hispanic/White and SES
Descriptive Statistics
Mean Std. Deviation N
MathScaleScore2012 223.22 35.589 205
Attendance_2yr 352.4829 15.32646 205
SES .86 .349 205
Gender .60 .492 205
black&Hispanic/white .1268 .33360 205
Treatment .49 .501 205
Table 16. Model Summary of Stepwise Regression Model- treatment, attendance, gender, black&Hispanic/white and SES
Model Summary of Stepwise Regression Model - Treatment, Attendance, Gender,
Black&Hispanic/White and SES
Model Summaryc
Model
R
R
Square
Adjusted
R Square
Std. Error
of the
Estimate
Change Statistics
Durbin-
Watson
R Square
Change
F
Change df1 df2
Sig. F
Change
1 .366a .134 .130 33.196 .134 31.469 1 203 .000
2 .419b .175 .167 32.480 .041 10.048 1 202 .002 1.703
a. Predictors: (Constant), Black&Hispanic/White b. Predictors: (Constant), Black&Hispanic/White, Attendance_2yr c. Dependent Variable: MathScaleScore2012

119
Table 17. ANOVA of Stepwise Regression Model- treatment, attendance, gender, black&Hispanic/white and ANOVA of Stepwise Regression Mode l- Treatment, Attendance, Gender,
Black&Hispanic/White and SES
ANOVAc
Model Sum of Squares df Mean Square F Sig.
1 Regression 34678.578 1 34678.578 31.469 .000a
Residual 223702.544 203 1101.983
Total 258381.122 204
2 Regression 45279.294 2 22639.647 21.460 .000b
Residual 213101.828 202 1054.960
Total 258381.122 204
a. Predictors: (Constant), Black&Hispanic/White
b. Predictors: (Constant), Black&Hispanic/White, Attendance_2yr
c. Dependent Variable: MathScaleScore2012
Table 18. Coefficient Statistics of Stepwise Regression Model - treatment, attendance, gender, black&Hispanic/white and SES Coefficient Statistics of Stepwise Regression Model - Treatment, Attendance, Gender,
Black&Hispanic/White and SES
Coefficientsa
Model Unstandardized
Coefficients
Standardized
Coefficients
t Sig.
Correlations
Collinearity
Statistics
B
Std.
Error Beta
Zero-
order Partial Part Tolerance VIF
1 (Constant) 218.263 2.481 87.967 .000
Black&Hispanic/
White
39.084 6.967 .366 5.610 .000 .366 .366 .366 1.000 1.000
2 (Constant) 52.448 52.365 1.002 .318
black&Hispanic/
White
38.193 6.823 .358 5.598 .000 .366 .366 .358 .998 1.002
Attendance_2yr .471 .149 .203 3.170 .002 .217 .218 .203 .998 1.002
a. Dependent Variable: MathScaleScore2012

120
Subsidiary Question 2
Is there a statistically significant difference in the 2012 NJ ASK5 performance of
students in the Everyday Math Alternative Treatment and the Singapore Math
Experimental Treatment when controlling for attendance?
Null Hypothesis 2
There is no significant difference in the overall performance of the Everyday
Math Alternative Treatment and the Singapore Math Experimental Treatment as
measured by the 2012 NJ ASK5 when controlling for attendance.
An ANCOVA was conducted to determine whether there were statistically
significant differences in the overall performance of the Everyday Math Alternative
Treatment and the Singapore Math Experimental Treatment as measured by the 2012 NJ
ASK5 when controlling for attendance. The results are shown in Tables 19 through 22.
The resulting p-value (p>0.05), allowed the null hypothesis of equal variances to be
accepted, and it is concluded that there are no differences in the variances of the sample
populations. Results are reported in Table 20. All other assumptions for ANCOVA were
met for this analysis (see Appendix C).
The mean scale score of the Everyday Math Alternative Treatment (N = 105) was
225.45 (SD = 33.43); the mean scale score of the Singapore Math Experimental
Treatment (N = 100) was 220.88 (SD = 37.75). Results showed that the covariate
attendance, was statistically significant with a p-value < 0.05; F(1, 76) = 9.343, ηρ2 =
0.044, p = 0.003. The effect of treatment was not statistically significant. Estimated
marginal means are reported in Table 22.

121
Table 19. Descriptive Statistics of ANCOVA - Overall Performance; Controlling Attendance
Descriptive Statistics of ANCOVA - Overall Performance, Controlling Attendance
Descriptive Statistics
Dependent Variable: MathScaleScore2012
Treatment Mean Std. Deviation N
Alternative Treatment (Everyday Math) 225.45 33.429 105
Experimental Treatment (Singapore Math) 220.88 37.752 100
Total 223.22 35.589 205
Table 20. Levene's Test of Equality of ANCOVA - Overall Performance; Controlling Attendance Levene's Test of Equality of ANCOVA - Overall Performanc, Controlling Attendance
Levene's Test of Equality of Error Variancesa
Dependent Variable: MathScaleScore2012
F df1 df2 Sig.
2.070 1 203 .152
Tests the null hypothesis that the error variance of the dependent variable is equal across groups.
a. Design: Intercept + Attendance_2yr + Treatment

122
Table 21. Tests of Between-Subjects Effects of ANCOVA- Overall Performance; Controlling Attendance
Tests of Between-Subjects Effects of ANCOVA- Overall Performance, Controlling
Attendance
Tests of Between-Subjects Effects
Dependent Variable: MathScaleScore2012
Source Type III Sum
of Squares
df Mean
Square
F Sig. Partial Eta
Squared
Noncent.
Parameter
Observed
Powerb
Corrected
Model
12443.437a 2 6221.719 5.110 .007 .048 10.220 .818
Intercept 906.359 1 906.359 .744 .389 .004 .744 .138
Attendance_2yr 11374.837 1 11374.837 9.343 .003 .044 9.343 .860
Treatment 224.410 1 224.410 .184 .668 .001 .184 .071
Error 245937.685 202 1217.513
Total 10472906.000 205
Corrected Total 258381.122 204
a. R Squared = .048 (Adjusted R Squared = .039)
b. Computed using alpha = .05
Table 22. Estimated Marginal Means of ANCOVA - Overall Performance; Controlling tedance Estimated Marginal Means of ANCOVA - Overall Performanc, Controlling Attendance
Dependent Variable: MathScaleScore2012
Treatment Mean Std. Error 95% Confidence Interval
Lower Bound Upper Bound
Alternative Treatment
(Everyday Math)
224.254a 3.428 217.496 231.013
Experimental Treatment
(Singapore Math)
222.133a 3.513 215.206 229.060
a. Covariates appearing in the model are evaluated at the following values: Attendance_2yr = 352.4829.
Subsidiary Question 3

123
To what extent do differences in performance exist when data are analyzed
according to 2012 NJ ASK5 performance levels (Partially Proficient, Proficient,
and Advanced Proficient) and treatment status; and is there significant interaction
between the performance levels and treatment?
Null Hypothesis 3a
There is no significant difference between the Everyday Math Alternative
Treatment’s 2010 NJ ASK3 mean scale score at each performance level (Partially
Proficient, Proficient, and Advanced Proficient) and the Everyday Math Alternative
Treatment’s 2012 NJ ASK5 mean scale score at each performance level (Partially
Proficient, Proficient, and Advanced Proficient).
An Independent samples t-test was conducted comparing the Everyday Math
Alternative Treatment’s 2010 NJ ASK3 performance at each performance level (Partially
Proficient, Proficient, and Advanced Proficient) prior to treatment and the performance of
the same cohort (scoring Partially Proficient, Proficient, or Advanced Proficient on the
2010 NJ ASK3) after treatment. There was a statistically significant difference between
the mean scale score of students scoring Partially Proficient (N=27) on the 2010 NJ
ASK3 (M=172.15, SD=19.13) and the 2012 NJ ASK5 mean scale score of the same
cohort of students (M=192.56, SD=25.861); t(27)= -4.018, p = 0.000, d =0.897. There
was a statistically significant difference between the mean scale score of students scoring
Advanced Proficient (N=26) on the 2010 NJ ASK3 (M=275.19, SD=19.57) and the 2012
NJ ASK5 mean scale score of same cohort of students (M=262.69, SD=25.884); t(26)=
4.377, p = 0.002, d = 0.545. There was no statistically significant difference between the
mean scale score of students scoring Proficient (N=52) on the 2010 NJ ASK3

124
(M=221.19, SD=11.312) and the 2012 NJ ASK5 mean scale score of the same cohort of
students (M=223.90, SD=18.085); t(52)= .495, p = 0.319. The results are shown in Table
23 and 24.
Table 23. Descriptive Statistics of Independent Samples t-test, Performance Level Comparisons
Descriptive Statistics of Independent Samples t-test, Performance Level Comparisons for
Everyday Math Alternative Treatment
N Range Minimum Maximum Mean Std. Deviation
2010 Partially Proficient 27 68 128 196 172.15 19.127
2012_ Same2010PP 27 102 140 242 192.56 25.861
2010 Proficient 52 45 200 245 221.19 11.312
2012_Same2010P 52 99 188 287 223.90 18.085
2010 Advanced Proficient 26 50 250 300 275.19 19.565
2012 _Same2010AP 26 96 204 300 262.69 25.884
Table 24. Independent Samples t-test, Performance Level Comparisons for Everyday Math Alternative Treatment
Independent Samples, Performance Level Comparisons for Everyday Math Alternative
Treatment
Independent Samples Test
Paired Differences t df Sig. (2-tailed) Mean Std.
Deviation
Std. Error Mean
95% Confidence Interval of the
Difference
Lower Upper
Pair 1
2010 Partially Proficient 2012_ Same2010PP
-20.407 26.394 5.079 -30.848 -9.966 -4.018 26 .000
Pair 2
2010 Proficient 2012_Same2010P
-2.712 19.436 2.695 -8.122 2.699 -1.006 51 .319
Pair 3
2010 Advanced Proficient 2012 2012 _Same2010AP
12.500 18.749 3.677 4.927 20.073 3.399 25 .002

125
Null Hypothesis 3b
There is no significant difference between the Singapore Math Experimental
Treatment’s 2010 NJ ASK3 mean scale score at each performance level (Partially
Proficient, Proficient, and Advanced Proficient) and the Singapore Math Experimental
Treatment’s 2012 NJ ASK5 mean scale score at each performance level (Partially
Proficient, Proficient, and Advanced Proficient).
An Independent samples t-test was conducted to compare Singapore Math
Experimental Treatment’s 2010 NJ ASK3 performance at each performance level
(Partially Proficient, Proficient, and Advanced Proficient) prior to treatment and the
performance of the same cohort of students (scoring Partially Proficient, Proficient, or
Advanced Proficient on the 2010 NJ ASK3) after treatment. There was a statistically
significant difference between the mean scale score of students scoring Partially
Proficient (N=34) on the 2010 NJ ASK3 (M=169.91, SD=18.99) and the 2012 NJ ASK5
mean scale score of the same cohort of students (M=189.85, SD=23.96); t(34)= -5.753, p
= 0.000, d = 0.922. There was also a statistically significant difference between the mean
scale score of students scoring Advanced Proficient (N=28) on the 2010 NJ ASK3
(M=277.68, SD=19.50) and the 2012 NJ ASK5 mean scale score of the same cohort of
students (M=261.21, SD=22.94); t(28)= 4.377, p = 0.000, d = 0.774. There was no
statistically significant difference between the mean scale score of students scoring
Proficient (N=38) on the 2010 NJ ASK3 (M=220.84, SD=14.689) and the 2012 NJ ASK5
mean scale score of the same cohort of students (M=218.92, SD=28.237); t(38)= 0.495, p
= 0.624. The results are shown in Tables 25 and 26.

126
Table 25. Descriptive Statistics of Independent Samples t-test, Performance Level Comparisons, Singapore Math Descriptive Statistics of Independent Samples t-test, Performance Level Comparisons,
Singapore Math Descriptive Statistics
N Range Minimum Maximum Mean Std.
Deviation
2010 Partially Proficient 34 68 128 196 169.91 18.990
2012_ Same2010PP 34 96 146 242 189.85 23.964
2010 Proficient 38 45 200 245 220.84 14.689
2012_Same2010P 38 114 160 274 218.92 28.237
2010 Advanced Proficient 28 50 250 300 277.68 19.499
2012 _Same2010AP 28 87 213 300 261.21 22.943
Table 26. Independent Samples t-test, Performance Level Comparisons, Singapore Math
Independent Samples t-test, Performance Level Comparisons, Singapore Math
Independent Samples Test
Paired Differences t df Sig. (2-tailed) Mean Std.
Deviation
Std. Error Mean
95% Confidence Interval of the
Difference
Lower Upper
Pair
1
2010PP_Singapore &
2012_Same2010PP
-19.941 20.211 3.466 -26.993 -12.889 -
5.753
33 .000
Pair
2
2010P_Singapore &
2012P_Same2010P
1.921 23.943 3.884 -5.949 9.791 .495 37 .624
Pair
3
2010AP_Singapore &
2012AP_Same2010AP
16.464 19.903 3.761 8.747 24.182 4.377 27 .000

127
Null Hypothesis 3c
There is no significant interaction between the independent variables treatment
and performancelevel2012 (the categorical variable representing the 2012 NJ ASK5
proficiency levels: Advanced Proficient, Proficient, and Partially Proficient).
To address the null hypothesis, a Factorial ANOVA was conducted incorporating
the independent variables treatment and performancelevel2012 (the categorical variable
representing the 2012 NJ ASK5 proficiency levels: Advanced Proficient, Proficient, and
Partially Proficient). The results are shown in Tables 27 through 30. Levene's Test of
Equality was applied to assess the homogeneity of variance. The resulting p-value
(p>0.05) allowed the null hypothesis of equal variances to be accepted and it is concluded
that there are no differences in the variances of the sample populations. Results are
reported in Table 28. All other assumptions for ANOVA were met for this analysis (see
Appendix C).
The mean scale score of Everyday Math students scoring Advanced Proficient
(N=23) was 273.17 (SD = 16.30), scoring Proficient (N= 67) was 220.52 (SD = 13.92),
and scoring Partially Proficient (N= 15) was 174.27 (SD = 17.49). The mean scale score
of Singapore Math students scoring Advanced Proficient (N=26) was 269.50 (SD =
15.58), scoring Proficient (N= 45) was (221.36, SD = 15.47), and scoring Partially
Proficient (N=29) was 176.55 (SD = 14.68). The interaction of treatment and
performancelevel2012 was not statistically significant, suggesting that there was no
significant difference in the overall performance of the Everyday Math Alternative
Treatment and the Singapore Math Experimental Treatment based on performance level.

128
The variable performancelevel2012 was the only statistically significant variable in this
analysis with p values < 0.05.
Table 27. Descriptive Statistics of Factorial ANOVA, Treatment and 2012 Performance Level
Descriptive Statistics of Factorial ANOVA, Treatment and 2012 Performance Level
Descriptive Statistics
Dependent Variable: MathScaleScore2012
Treatment PerformanceLevel2012 Mean Std. Deviation N
Alternative Treatment
(Everyday Math)
Advanced Proficient 273.17 16.300 23
Proficient 220.52 13.919 67
Partially Proficient 174.27 17.487 15
Total 225.45 33.429 105
Experimental Treatment
(Singapore Math)
Advanced Proficient 269.50 15.578 26
Proficient 221.36 15.473 45
Partially Proficient 176.55 14.681 29
Total 220.88 37.752 100
Table 28. Levene's Test of Equality of Error Variances of Factorial ANOVA, Treatment and 2012 Performance Level
Levene's Test of Equality of Factorial ANOVA, Treatment and 2012 Performance Level
Levene's Test of Equality of Error Variancesa
Dependent Variable: MathScaleScore2012
F df1 df2 Sig.
.812 5 199 .543
Tests the null hypothesis that the error variance of the dependent variable is equal across groups.
a. Design: Intercept + Treatment + PerformanceLevel2012 + Treatment * PerformanceLevel2012

129
Table 29. Tests of Between-Subjects Effects of Factorial ANOVA, Treatment and 2012 Performance Level Tests of Between-Subjects Effects of Factorial ANOVA, Treatment and 2012 Performance
Level
Tests of Between-Subjects Effects
Dependent Variable: MathScaleScore2012
Source Type III Sum
of Squares
df Mean
Square
F Sig. Partial
Eta
Squared
Noncent.
Parameter
Observed
Powerb
Corrected Model 212832.184a 5 42566.437 185.970 .000 .824 929.848 1.000
Intercept 8096800.971 1 8096800.971 35374.335 .000 .994 35374.335 1.000
Treatment 1.402 1 1.402 .006 .938 .000 .006 .051
PerformanceLevel2012 203747.230 2 101873.615 445.078 .000 .817 890.157 1.000
Treatment *
PerformanceLevel2012
235.034 2 117.517 .513 .599 .005 1.027 .134
Error 45548.938 199 228.889
Total 10472906.000 205
Corrected Total 258381.122 204
a. R Squared = .824 (Adjusted R Squared = .819)
b. Computed using alpha = .05
Table 30. Estimated Marginal Means of Factorial ANOVA, Treatment and 2012 Performance Level Estimated Marginal Means of Factorial ANOVA, Treatment and Performance Level
1. Treatment * PerformanceLevel2012
Dependent Variable: MathScaleScore2012
Treatment PerformanceLevel2012 Mean Std.
Error
95% Confidence Interval
Lower
Bound
Upper Bound
Alternative Treatment
(Everyday Math)
Advanced Proficient 273.174 3.155 266.953 279.395
Proficient 220.522 1.848 216.878 224.167
Partially Proficient 174.267 3.906 166.564 181.970
Experimental Treatment
(Singapore Math)
Advanced Proficient 269.500 2.967 263.649 275.351
Proficient 221.356 2.255 216.908 225.803
Partially Proficient 176.552 2.809 171.012 182.092

130
Figure 4. Estimated Marginal Means of MathScaleScore2012 at each Performance Level

131
Null Hypothesis 3d
There is no significant difference between the mean scale scores of those students
scoring Proficient on the 2012 NJ ASK5 (scoring 200 and above) in the Everyday Math
Alternative Treatment and the mean scale score of those students scoring Proficient on
the 2012 NJ ASK5 (scoring 200 and above) in the Singapore Math Experimental
Treatment as measured by the 2012 NJ ASK5.
To address the null hypothesis, an ANOVA was conducted comparing the scale
scores of those students in each treatment scoring 200 and above on the 2012 NJ ASK5.
The results are shown in Tables 31 through 33. Levene's Test of Equality was applied to
assess the homogeneity of variance. The resulting p-value (p>0.05), allowed the null
hypothesis of equal variances to be accepted, and it is concluded that there are no
differences in the variances of the sample populations. Results are reported in Table 32.
All other assumptions for ANOVA were met (see Appendix C).
The total number of Everyday Math Treatment students meeting the criteria for
proficiency by scoring Proficient or Advanced Proficient on the Grade 5 NJ ASK was 90
(M= 233.98, SD = 27. 252). The total number of Singapore Math Treatment students
meeting the criteria for proficiency by scoring Proficient or Advanced Proficient on the
Grade 5 NJ ASK was 71 (M=238.99, SD = 27.979). Results showed that the effect of
treatment was not statistically significant at the p<0.05 level.

132
Table 31. Descriptive Statistics of ANOVA, Proficient
Descriptive Statistics of ANOVA (Proficient)
Descriptive Statisticsa
Dependent Variable: MathScaleScore2012
Treatment Mean Std. Deviation N
Alternative Treatment (Everyday Math) 233.98 27.252 90
Experimental Treatment (Singapore Math) 238.99 27.979 71
Total 236.19 27.601 161
a. Pass_Fail = Proficient
Table 32. Levene's Test of Equality of Error Variances of ANOVA, Proficient
Levene's Test of Equality of Error Variances of ANOVA (Proficient)
Levene's Test of Equality of Error Variancesa,b
Dependent Variable: MathScaleScore2012
F df1 df2 Sig.
.385 1 159 .536
Tests the null hypothesis that the error variance of the dependent variable is equal across groups.
a. Pass_Fail = Proficient
b. Design: Intercept + Treatment

133
Table 33. Tests of Between-Subjects Effects of ANOVA, Proficient
Tests of Between-Subjects Effects of ANOVA (Proficient)
Tests of Between-Subjects Effectsa
Dependent Variable: MathScaleScore2012
Source Type III Sum
of Squares
df Mean
Square
F Sig. Partial
Eta
Squared
Noncent.
Parameter
Observed
Powerc
Corrected
Model
995.468b 1 995.468 1.309 .254 .008 1.309 .206
Intercept 8878315.816 1 8878315.816 11676.686 .000 .987 11676.686 1.000
Treatment 995.468 1 995.468 1.309 .254 .008 1.309 .206
Error 120894.941 159 760.346
Total 9103112.000 161
Corrected
Total
121890.410 160
a. Pass_Fail = Proficient
b. R Squared = .008 (Adjusted R Squared = .002)
c. Computed using alpha = .05
Null Hypothesis 3e
There is no significant difference between the mean scale scores of those students
scoring Partially Proficient on the 2012 NJ ASK5 (scoring below 200) in the Everyday
Math Alternative Treatment and the mean scale score of those students scoring Partially
Proficient on the 2012 NJ ASK5 (scoring below 200) in the Singapore Math
Experimental Treatment as measured by the 2012 NJ ASK5.
To address the null hypothesis, an ANOVA was conducted comparing the scale
scores of those students in each treatment scoring below 200 on the 2012 NJ ASK5. The
results are shown in Tables 34 through 36. Levene's Test of Equality was applied to
assess the homogeneity of variance. The resulting p-value (p>0.05), allowed the null
hypothesis of equal variances to be accepted, and it is concluded that there are no

134
differences in the variances of the sample populations. Results are reported in Table 35.
The assumption for linear correlation was not met in this analysis. All other assumptions
for ANOVA were met (see Appendix C).
The total number of Everyday Math Treatment students not meeting the criteria
for proficiency (scoring less than 200) on the Grade 5 NJ ASK was 15 (M= 174.27, SD =
17.487)11. The total number of Singapore Math students not meeting the criteria for
proficiency (scoring less than 200) on the Grade 5 NJ ASK was 29 (M=176.55, SD =
14.681)12. Results showed that the effect of treatment was not statistically significant at
the p<0.05 level.
Table 34. Descriptive Statistics of ANOVA, Not Proficient
Descriptive Statistics of ANOVA (Partially Proficient)
Descriptive Statisticsa
Dependent Variable: MathScaleScore2012
Treatment Mean Std. Deviation N
Alternative Treatment (Everyday Math) 174.27 17.487 15
Experimental Treatment (Singapore Math) 176.55 14.681 29
Total 175.77 15.528 44
a. Pass_Fail = Not Proficient
_______________________________ 11 Small sample size (N = 15) could potentially reduce the statistical power of this analysis. 12 Small sample size (N = 29) could potentially reduce the statistical power of this analysis.

135
Table 35. Levene's Test of Equality of ANOVA, Not Proficient
Levene's Test of Equality of ANOVA (Partially Proficient)
Levene's Test of Equality of Error Variancesa,b
Dependent Variable: MathScaleScore2012
F df1 df2 Sig.
.938 1 42 .338
Tests the null hypothesis that the error variance of the dependent variable is equal across groups.
a. Pass_Fail = Not Proficient
b. Design: Intercept + Treatment
Table 36. Tests of Between-Subjects Effects of ANOVA, Not Proficient
Tests of Between-Subjects Effects of ANOVA (Partially Proficient)
Tests of Between-Subjects Effectsa
Dependent Variable: MathScaleScore2012
Source Type III Sum
of Squares
df Mean
Square
F Sig. Partial Eta
Squared
Noncent.
Parameter
Observed
Powerc
Corrected
Model
51.622b 1 51.622 .210 .649 .005 .210 .073
Intercept 1216749.803 1 1216749.803 4953.758 .000 .992 4953.758 1.000
Treatment 51.622 1 51.622 .210 .649 .005 .210 .073
Error 10316.106 42 245.622
Total 1369794.000 44
Corrected
Total
10367.727 43
a. Pass_Fail = Not Proficient
b. R Squared = .005 (Adjusted R Squared = -.019)
c. Computed using alpha = .05

136
Subsidiary Question 4
Is there a statistically significant difference in the 2012 NJ ASK5 performance of
students in the Everyday Math Alternative Treatment and the Singapore Math
Experimental Treatment based on race/ethnicity (Black, Hispanic, White, subset
of Black and Hispanic); and is there significant interaction between treatment
status and race/ethnicity (Black, Hispanic, White, subset of Black and Hispanic)?
Null Hypothesis 4a
There is no significant interaction between treatment status and
Black&Hispanic/White performance as measured by the 2012 NJ ASK5.
To address this null hypothesis, a Factorial ANOVA was conducted incorporating
the independent variables treatment and Black&Hispanic/White (the dichotomous
variable representing the race/ethnicity status, Black and Hispanic or White). The results
are shown in Tables 37 through 40. Levene's test of Equality was applied to assess the
homogeneity of variance. The resulting p-value (p>0.05), allowed the null hypothesis of
equal variances to be accepted, and it is concluded that there are no differences between
the variances in the sample populations. Results are reported in Table 38. All other
assumptions for ANOVA were met (see Appendix C).
Black and Hispanic students in the Everyday Math Alternative Treatment (N= 90)
had a mean scale score of 221.33 (SD = 32.890). White students in the Everyday Math
Alternative Treatment (N= 15)10 had a mean scale score of 250.13 (SD = 25.743). Black
and Hispanic students in the Singapore Math Experimental Treatment (N=88) had a mean
scale score of 214.34 (SD = 34.355). White students in the Singapore Math Experimental
10 Small sample size (N = 15) could potentially reduce the statistical power of this analysis.

137
Treatment (N=12)14 had a mean scale score of 268.83 (SD = 25.316). The interaction of
treatment and Race (Black&Hispanic/White) was not statistically significant suggesting
that there was no significant interaction between Race (Black&Hispanic/White) and
treatment with student performance on the 2012 NJ ASK5. The independent variable
Black&Hispanic/White was statistically significant, p-value < 0.05, F(1, 204) = 37.554;
and ηp2 = 0.157, indicating that the performance of Black and Hispanic students was
significantly different and, in this case, significantly worse than White students.
Estimated marginal means are reported in Table 40.
Table 37. Descriptive Statistics of Factorial ANOVA, Treatment and Bck&Hispanic/White Descriptive Statistics of Factorial ANOVA, Treatment and Black&Hispanic/White
Descriptive Statistics
Dependent Variable: MathScaleScore2012
Treatment Race_coded Mean Std. Deviation N
Alternative Treatment (Everyday
Math)
Black&Hispanic 221.33 32.890 90
White 250.13 25.743 15
Total 225.45 33.429 105
Experimental Treatment
(Singapore Math)
Black&Hispanic 214.34 34.355 88
White 268.83 25.316 12
Total 220.88 37.752 100
Total
Black&Hispanic 217.88 33.710 178
White 258.44 26.789 27
Total 223.22 35.589 205
_________________________
14 Small sample size (N = 12) could potentially reduce the statistical power of this analysis.

138
Table 38. Levene's Test of Equality of Factorial ANOVA, Treatment lack&Hispanic/Whit Levene's Test of Equality of Factorial ANOVA, Treatment and Black&Hispanic/White
Levene's Test of Equality of Error Variancesa
Dependent Variable: MathScaleScore2012
F df1 df2 Sig.
1.328 3 201 .266
Tests the null hypothesis that the error variance of the dependent variable is equal across groups.
a. Design: Intercept + Treatment + Race_coded + Treatment * Race_coded
Table 39. Tests of Between-Subjects Effects of Factorial ANOVA, Treatment and Black&Hispanic/White Tests of Between-Subjects Effects of Factorial ANOVA, Treatment and
Black&Hispanic/White
Tests of Between-Subjects Effects
Dependent Variable: MathScaleScore2012
Source Type III Sum
of Squares
df Mean Square F Sig. Partial Eta
Squared
Corrected Model 43089.949a 3 14363.316 13.410 .000 .167
Intercept 5283899.693 1 5283899.693 4933.151 .000 .961
Treatment 794.710 1 794.710 .742 .390 .004
Race_coded 40224.021 1 40224.021 37.554 .000 .157
Treatment *
Race_coded
3827.231 1 3827.231 3.573 .060 .017
Error 215291.173 201 1071.100
Total 10472906.000 205
Corrected Total 258381.122 204
a. R Squared = .167 (Adjusted R Squared = .154)

139
Table 40. Estimated Marginal Means of Factorial ANOVA, Treatment and Black&Hispanic/White
Estimated Marginal Means of Factorial ANOVA, Treatment and Black&Hispanic/White
Treatment * Race_coded
Dependent Variable: MathScaleScore2012
Treatment Race_coded Mean Std. Error 95% Confidence Interval
Lower Bound Upper Bound
Alternative Treatment
(Everyday Math)
Black&Hispanic 221.333 3.450 214.531 228.136
White 250.133 8.450 233.471 266.796
Experimental Treatment
(Singapore Math)
Black&Hispanic 214.341 3.489 207.462 221.220
White 268.833 9.448 250.204 287.463
Figure 5. Estimated Marginal Means of MathScaleScore2012 - Black&Hispanic/White

140
Null Hypothesis 4b
There is no significant difference between the overall performance of the subset
of Black and Hispanic students in the Everyday Math Alternative Treatment and the
subset of Black and Hispanic students in the Singapore Math Experimental Treatment as
measured by the 2012 NJ ASK5.
An ANOVA was conducted comparing the 2012 NJ ASK5 mean scale score of
the subset of Black and Hispanic students in the Everyday Math treatment to the 2012 NJ
ASK5 mean scale score of the subset of Black and Hispanic students in the Singapore
Math treatment. The results are shown in Tables 41 through 43. Levene's test of
Equality was applied to assess the homogeneity of variance. The resulting p-value
(p>0.05) allowed the null hypothesis of equal variances to be accepted, and it is
concluded that there are no differences between the variances in the sample populations
(see Table 42). All other assumptions for ANOVA were met (see Appendix C).
Black and Hispanic students in the Everyday Math Alternative Treatment (N= 90)
had a mean scale score of 221.33 (SD = 32.89). Black and Hispanic students in the
Singapore Math Experimental Treatment (N=88) had a mean scale score of 214.34 (SD =
34.36). The independent variable treatment was not statistically significant with p-values
> 0.05, indicating that there was no significant difference in the performance of the subset
of Black and Hispanic students in the Everyday Math treatment and the subset of Black
and Hispanic students in the Singapore Math Treatment.

141
Table 41. Descriptive Statistics of ANOVA (Black&Hispanic)
Descriptive Statistics of ANOVA (Black&Hispanic)
Descriptive Statisticsa
Dependent Variable: MathScaleScore2012
Treatment Mean Std. Deviation N
Alternative Treatment (Everyday Math) 221.33 32.890 90
Experimental Treatment (Singapore Math) 214.34 34.355 88
Total 217.88 33.710 178
a. Black&Hispanic_White = nonwhite
Table 42. Levene's Test of Equality of ANOVA (Black&Hispanic)
Levene's Test of Equality of ANOVA (Black&Hispanic)
Levene's Test of Equality of Error Variancesa,b
Dependent Variable: MathScaleScore2012
F df1 df2 Sig.
1.487 1 176 .224
Tests the null hypothesis that the error variance of the dependent variable is equal across groups.
a. BlackHispanic_White = blk&his
b. Design: Intercept + Treatment

142
Table 43. Tests of Between-Subjects Effects of ANOVA, Black/Hispanic
Tests of Between-Subjects Effects of ANOVA (Black/Hispanic)
Tests of Between-Subjects Effectsa
Dependent Variable: MathScaleScore2012
Source Type III Sum
of Squares
df Mean
Square
F Sig. Partial Eta
Squared
Noncent.
Parameter
Observed
Powerc
Corrected
Model
2175.508b 1 2175.508 1.924 .167 .011 1.924 .281
Intercept 8445569.665 1 8445569.665 7470.809 .000 .977 7470.809 1.000
Treatment 2175.508 1 2175.508 1.924 .167 .011 1.924 .281
Error 198963.773 176 1130.476
Total 8650822.000 178
Corrected
Total
201139.281 177
a. BlackHispanic_White = blk&his
b. R Squared = .011 (Adjusted R Squared = .005)
c. Computed using alpha = .05
Null Hypothesis 4c
There is no significant difference between the overall performance of White
students in the Everyday Math Alternative Treatment and White students in the
Singapore Math Experimental Treatment as measured by the 2012 NJ ASK5.
An ANOVA was conducted comparing the 2012 NJ ASK5 mean scale score of
the subset of White students in the Everyday Math treatment to the 2012 NJ ASK5 mean
scale score of the subset of White students in the Singapore Math Treatment. The results
are shown in Tables 44 through 46. Levene's test of Equality was applied to assess the
homogeneity of variance. The resulting p-value (p>0.05) allowed the null hypothesis of
equal variances to be accepted, and it is concluded that there are no differences between

143
the variances in the sample populations. Results are reported in Table 45. All other
assumptions for ANOVA were met (see Appendix C).
White students in the Everyday Math Alternative Treatment (N= 15)15 had a mean
scale score of 250.13 (SD = 25.74). White students in the Singapore Math Experimental
Treatment (N=12)16 had a mean scale score of 268.83 (SD = 25.32). The independent
variable treatment was not statistically significant with p-values > 0.05, indicating that
there was no significant difference in the performance of White students in the Everyday
Math treatment and White students in the Singapore Math Treatment.
Table 44. Descriptive Statistics of ANOVA (White)
Descriptive Statistics of ANOVA (White)
Descriptive Statisticsa
Dependent Variable: MathScaleScore2012
Treatment Mean Std. Deviation N
Alternative Treatment (Everyday Math) 250.13 25.743 15
Experimental Treatment (Singapore Math) 268.83 25.316 12
Total 258.44 26.789 27
a. Black&Hispanic_White = White
__________________________ 15 Small sample size (N = 15) could potentially reduce the statistical power of this analysis. 16 Small sample size (N = 12) could potentially reduce the statistical power of this analysis.

144
Table 45. Levene's Test of Equality of ANOVA (White)
Levene's Test of Equality of ANOVA (White)
Levene's Test of Equality of Error Variancesa,b
Dependent Variable: MathScaleScore2012
F df1 df2 Sig.
.006 1 25 .940
Tests the null hypothesis that the error variance of the dependent variable is equal across groups.
a. Black/Hispanic_White = White
b. Design: Intercept + Treatment
Table 46. Tests of Between-Subjects Effects of ANOVA (White)
Tests of Between-Subjects Effects of ANOVA (White)
Tests of Between-Subjects Effectsa
Dependent Variable: MathScaleScore2012
Source Type III Sum
of Squares
df Mean
Square
F Sig. Partial Eta
Squared
Noncent.
Parameter
Observed
Powerc
Corrected
Model
2331.267b 1 2331.267 3.570 .071 .125 3.570 .443
Intercept 1795509.341 1 1795509.341 2749.227 .000 .991 2749.227 1.000
Treatment 2331.267 1 2331.267 3.570 .071 .125 3.570 .443
Error 16327.400 25 653.096
Total 1822084.000 27
Corrected
Total
18658.667 26
a. Black/Hispanic_White = White
b. R Squared = .125 (Adjusted R Squared = .090)
c. Computed using alpha = .05

145
Null Hypothesis 4d
There is no significant interaction between treatment status and Black/Hispanic
performance as measured by the 2012 NJ ASK5.
This analysis differed from the analyses conducted to address Null Hypothesis 4a
in that it looked at the performance of Black and Hispanic students separately rather than
as a subset of Black and Hispanic students combined. To address this null hypothesis, a
factorial ANOVA was conducted incorporating the independent variables treatment and
Black/Hispanic (the dichotomous variable representing the race/ethnicity status, Black or
Hispanic). The results are shown in Tables 47 through 50. Levene's test of Equality was
applied to assess the homogeneity of variance. The resulting p-value (p>0.05), allowed
the null hypothesis of equal variances to be accepted and it is concluded that there are no
differences between the variances in the sample populations. Results are reported in
Table 48. All other assumptions for ANOVA were met (see Appendix C).
Black students in the Everyday Math Alternative Treatment (N= 50) had a mean
scale score of 211.60 (SD = 29.27). Hispanic students in the Everyday Math Alternative
Treatment (N= 40) had a mean scale score of 233.50 (SD = 33.45). Black students in the
Singapore Math Experimental Treatment (N=51) had a mean scale score of 205.94 (SD =
29.69). Hispanic students in the Singapore Math Experimental Treatment (N=37) had a
mean scale score of 225.92 (SD = 37.29). The interaction of treatment and race/ethnicity
(Black/Hispanic) was not statistically significant, suggesting that there was no significant
interaction between race/ethnicity (Black/Hispanic) and treatment with student
performance on the 2012 NJ ASK5. The independent variable Black/Hispanic was
statistically significant; p-value < 0.05, F(1, 177) = 18.526; and ηp2 = 0.096, indicating

146
that the performance level of Black students was significantly different, and in this case,
significantly worse than Hispanic students. Estimated marginal means are reported in
Table 50.
Based on the results, two additional analyses were run to determine whether
significant differences in the performance of Black and Hispanic students occurred across
both treatments (see Null Hypotheses 4e and 4f).
Table 47. Descriptive Statistics of Factorial ANOVA - Treatment and Black/Hispanic
Descriptive Statistics of Factorial ANOVA - Treatment and Black/Hispanic
Descriptive Statistics
Dependent Variable: MathScaleScore2012
Treatment Race Mean Std. Deviation N
Everyday Math_Alternative
Treatment
Black 211.600 29.2749 50
Hispanic 233.500 33.4457 40
Total 221.333 32.8904 90
Singapore Math_Experimental
Treatment
Black 205.941 29.6900 51
Hispanic 225.919 37.2875 37
Total 214.341 34.3554 88
Total
Black 208.743 29.4750 101
Hispanic 229.857 35.3150 77
Total 217.876 33.7102 178

147
Table 48. Levene's Test of Equality of Factorial ANOVA Treatment and Black/Hispanies
Levene's Test of Equality of Factorial ANOVA - Treatment and Black/Hispanic Scores
Levene's Test of Equality of Error Variancesa
Dependent Variable: MathScaleScore2012
F df1 df2 Sig.
2.051 3 174 .109
Tests the null hypothesis that the error variance of the dependent variable is equal across groups.
a. Design: Intercept + Treatment + Race + Treatment * Race
Table 49. Tests of Between-Subjects Effects of Factorial ANOVA - Treatment, Black/Hispanic
Tests of Between-Subjects Effects of Factorial ANOVA - Treatment, Black/Hispanic
Tests of Between-Subjects Effects
Dependent Variable: MathScaleScore2012
Source Type III Sum
of Squares
df Mean
Square
F Sig. Partial
Eta
Squared
Noncent.
Parameter
Observed
Powerb
Corrected Model 21391.701a 3 7130.567 6.903 .000 .106 20.708 .977
Intercept 8392645.808 1 8392645.808 8124.284 .000 .979 8124.284 1.000
Treatment 1912.973 1 1912.973 1.852 .175 .011 1.852 .272
black/Hispanic 19138.406 1 19138.406 18.526 .000 .096 18.526 .990
Treatment *
black/Hispanic
40.324 1 40.324 .039 .844 .000 .039 .054
Error 179747.580 174 1033.032
Total 8650822.000 178
Corrected Total 201139.281 177
a. R Squared = .106 (Adjusted R Squared = .091)
b. Computed using alpha = .05

148
Table 50. Estimated Marginal Means of Factorial ANOVA - Treatment, Black/Hispanic Estimated Marginal Means of Factorial ANOVA - Treatment, Black/Hispanic
Treatment * Race
Dependent Variable: MathScaleScore2012
Treatment Race Mean Std. Error 95% Confidence Interval
Lower Bound Upper Bound
Everyday Math_Alternative
Treatment
Black 211.600 4.545 202.629 220.571
Hispanic 233.500 5.082 223.470 243.530
Singapore
Math_Experimental
Treatment
Black 205.941 4.501 197.058 214.824
Hispanic 225.919 5.284 215.490 236.348
Figure 6. Estimated Marginal Means of MathScaleScore2012 - Black & Hispanic

149
Null Hypothesis 4e
There is no significant difference in the overall 2012 NJ ASK5 performance of
Black and Hispanic students in the Everyday Math Alternative Treatment.
An ANOVA was conducted comparing the 2012 NJ ASK5 mean scale scores of
Black students in the Everyday Math Alternative Treatment and Hispanic students in the
Everyday Math Alternative Treatment. The results are shown in Tables 51 through 53.
Levene's Test of Equality was applied to assess the homogeneity of variance. The
resulting p-value (p>0.05) allowed the null hypothesis of equal variances to be accepted,
and it is concluded that there are no differences between the variances in the sample
populations. Results are reported in Table 52. All other assumptions for ANOVA were
met (see Appendix C).
Black students in the Everyday Math Alternative Treatment (N= 50) had a mean
scale score of 211.60 (SD = 29.27). Hispanic students in the Everyday Math Alternative
Treatment (N= 40) had a mean scale score of 233.50 (SD = 33.45). The independent
variable Black/Hispanic was statistically significant; F(1, 90) = 10.954, p < 0.05, and ηp2
= 0.111, indicating that the performance of Black students was significantly different, and
in this case, significantly worse than Hispanic students.

150
Table 51. Descriptive Statistics of ANOVA - Black/Hispanic (Everyday Math)
Descriptive Statistics of ANOVA – Black/Hispanic (Everyday Math)
Descriptive Statisticsa
Dependent Variable: MathScaleScore2012
Black/Hispanic Mean Std. Deviation N
Black 211.60 29.275 50
Hispanic 233.50 33.446 40
Total 221.33 32.890 90
a. Treatment = Alternative Treatment (Everyday Math)
Table 52. Levene's Test of Equality of ANOVA – Black/Hispanic (Everyday Math)
Levene's Test of Equality of ANOVA – Black/Hispanic (Everyday Math)
Levene's Test of Equality of Error Variancesa,b
Dependent Variable: MathScaleScore2012
F df1 df2 Sig.
.702 1 88 .405
Tests the null hypothesis that the error variance of the dependent variable is equal across groups.
a. Treatment = Alternative Treatment (Everyday Math)
b. Design: Intercept + Black/Hispanic

151
Table 53. Tests of Between-Subjects Effects of ANOVA – Black/Hispanic (Everyday ath) Tests of Between-Subjects Effects of ANOVA – Black/Hispanic (Everyday Math)
Tests of Between-Subjects Effectsa
Dependent Variable: MathScaleScore2012
Source Type III Sum
of Squares
df Mean
Square
F Sig. Partial
Eta
Squared
Noncent.
Parameter
Observed
Powerc
Corrected
Model
10658.000b 1 10658.000 10.954 .001 .111 10.954 .905
Intercept 4402533.556 1 4402533.556 4524.912 .000 .981 4524.912 1.000
Black/Hispanic 10658.000 1 10658.000 10.954 .001 .111 10.954 .905
Error 85620.000 88 972.955
Total 4505238.000 90
Corrected
Total
96278.000 89
a. Treatment = Alternative Treatment (Everyday Math)
b. R Squared = .111 (Adjusted R Squared = .101)
c. Computed using alpha = .05
Null Hypothesis 4f
There is no significant difference in the overall 2012 NJ ASK5 performance of
Black and Hispanic students in the Singapore Math Experimental Treatment.
An ANOVA was conducted comparing the 2012 NJ ASK5 mean scale scores of
Black students in the Singapore Math Experimental Treatment and Hispanic students in
the Singapore Math Experimental Treatment. The results are shown in Tables 54 through
58. Levene's Test of Equality was applied to assess the homogeneity of variance. The
resulting p-value (p<0.05) caused the null hypothesis of equal variances to be rejected,
and it is concluded that there are significant differences between the variances in the

152
sample populations17 (see Table 55). All other assumptions for ANOVA were met (see
Appendix C).
Black students in the Singapore Math Experimental Treatment (N=51) had a
mean scale score of 205.94 (SD = 29.69). Hispanic students in the Singapore Math
Experimental Treatment (N=37) had a mean scale score of 225.92 (SD = 37.29). The
independent variable Black/Hispanic was statistically significant; p < 0.05, indicating
there was a significant difference between the performance of Black students in the
Singapore Math Treatment and Hispanic students in the Singapore Math Treatment.
Table 54. Descriptive Statistics of ANOVA – Black/Hispanic (Singapore Math) Descriptive Statistics of ANOVA – Black/Hispanic (Singapore Math)
Descriptive Statisticsa
Dependent Variable: MathScaleScore2012
Black/Hispanic Mean Std. Deviation N
Black 205.94 29.690 51
Hispanic 225.92 37.287 37
Total 214.34 34.355 88
a. Treatment = Experimental Treatment (Singapore Math)
________________________ 17 An Independent Samples t-test was run in addition to this analysis to verify the ANOVA findings (See Tables 57 and 58.)

153
Table 55. Levene's Test of Equality of ANOVA – Black/Hispanic (Singapore Math) Levene's Test of Equality of ANOVA – Black/Hispanic (Singapore Math)
Levene's Test of Equality of Error Variancesa,b
Dependent Variable: MathScaleScore2012
F df1 df2 Sig.
4.458 1 86 .038
Tests the null hypothesis that the error variance of the dependent variable is equal across groups.
a. Treatment = Experimental Treatment (Singapore Math)
b. Design: Intercept + Black/Hispanic
Table 56. Tests of Between-Subjects Effects of ANOVA – Black/Hispanic (Singapore Math) Tests of Between-Subjects Effects of ANOVA – Black/Hispanic (Singapore Math)
Tests of Between-Subjects Effectsa
Dependent Variable: MathScaleScore2012
Source Type III Sum
of Squares
df Mean
Square
F Sig. Partial
Eta
Squared
Noncent.
Parameter
Observed
Powerc
Corrected
Model
8558.192b 1 8558.192 7.819 .006 .083 7.819 .790
Intercept 3999220.783 1 3999220.783 3653.902 .000 .977 3653.902 1.000
Black/Hispanic 8558.192 1 8558.192 7.819 .006 .083 7.819 .790
Error 94127.580 86 1094.507
Total 4145584.000 88
Corrected
Total
102685.773 87
a. Treatment = Experimental Treatment (Singapore Math)
b. R Squared = .083 (Adjusted R Squared = .073)
c. Computed using alpha = .05

154
Table 57. Group Statistics of Independent Samples T-test – Black/Hispanic (Singapore Math) Group Statistics of Independent Samples T-test – Black/Hispanic (Singapore Math)
Group Statisticsa
Race/Ethnicity N Mean Std. Deviation Std. Error Mean
MathScaleScore2012 Black 51 205.941 29.6900 4.1574
Hispanic 37 225.919 37.2875 6.1300
a. Treatment = Singapore Math_Experimental Treatment
Table 58. Independent Samples T-test – Black/Hispanic (Singapore Math) Independent Samples T-test – Black/Hispanic (Singapore Math)
Independent Samples Testa
Levene's
Test for
Equality of
Variances
t-test for Equality of Means
F Sig. t df Sig.
(2-
tailed)
Mean
Difference
Std. Error
Difference
95% Confidence
Interval of the
Difference
Lower Upper
MathScaleScore2012
Equal
variances
assumed
4.458 .038 -
2.796
86 .006 -19.9777 7.1444 -
34.1803
-
5.7752
Equal
variances
not
assumed
-
2.697
66.590 .009 -19.9777 7.4068 -
34.7635
-
5.1919
a. Treatment = Singapore Math_Experimental Treatment

155
Subsidiary Question 5
How much variance in the 2012 NJ ASK5 mean scale score of Black students can
be explained by the predictor variables treatment, attendance, gender, and SES?
Null Hypothesis 5
H0: β0 = 0; the predictor variables treatment, attendance, gender, and SES account
for no variation in the performance of Black students on the 2012 NJ ASK5.
A simultaneous regression analysis was conducted to determine the degree to
which the predictor variables treatment, attendance, gender, and SES account for
variation in the performance of Black students on the 2012 NJ ASK. Basic descriptive
statistics, correlations, model summaries, ANOVA, and regression coefficients are shown
in Tables 59 through 63. Collinearity statistics revealed VIFs less than 2.5, indicating
that there was not a high correlation among the predictor variables (Allison, 1999). The
Durbin-Watson statistic was applied as a measure of correlation between the residuals. In
this analysis, the value of the Durbin-Watson statistic is 2.20, approximately equal to 2,
indicating no serial correlation between the residuals (Durbin & Watson, 1950, 1951).
A total of 101 Black students (M=208.74, SD=29.475) were considered in this
analysis. These students had a mean attendance of 354.51 (SD = 11.59). Model 1 did not
explain a significant proportion of variance in 2012 NJ ASK5 Black performance.
Overall results indicate that the predictor variables treatment, attendance, gender, and
SES did not account for a significant proportion of variance in the mathematics
performance of Black students.
Table 59. Descriptive Statistics of Simultaneous Regression Analysis (Black), Treatment, Attendance, Gender, and SES

156
Descriptive Statistics of Simultaneous Regression Analysis (Black), Treatment,
Attendance, Gender, and SES
Descriptive Statistics
Mean Std. Deviation N
MathScaleScore2012 208.74 29.475 101
Treatment .50 .502 101
Gender .62 .487 101
SES .84 .367 101
Attendance_2yr 354.5050 11.58997 101
Table 60. Model Summary of Simultaneous Regression Analysis (Black), Treatment, Attendance, Gender, and SES
Model Summary of Simultaneous Regression Analysis (Black), Treatment, Attendance,
Gender, and SES
Model Summaryb
Model
R
R
Square
Adjusted
R Square
Std. Error
of the
Estimate
Change Statistics
Durbin-
Watson
R Square
Change
F
Change df1 df2
Sig. F
Change
1 .201a .041 .001 29.467 .041 1.013 4 96 .405 2.199
a. Predictors: (Constant), Attendance_2yr, SES , Treatment, Gender
b. Dependent Variable: MathScaleScore2012

157
Table 61. ANOVA of Simultaneous Regression Analysis (Black), Treatment, Attendance, Gender, and SES
ANOVA of Simultaneous Regression Analysis (Black), Treatment, Attendance, Gender,
and SES
ANOVAb
Model Sum of Squares df Mean Square F Sig.
1 Regression 3519.395 4 879.849 1.013 .405a
Residual 83357.912 96 868.312
Total 86877.307 100
a. Predictors: (Constant), Attendance_2yr, SES , Treatment, Gender
b. Dependent Variable: MathScaleScore2012
Table 62. Coefficient Statistics of Simultaneous Regression Analysis (Black), Treatment, Attendance, Gender, and SES Coefficient Statistics of Simultaneous Regression Analysis (Black), Treatment,
Attendance, Gender, and SES
Coefficientsa
Model Unstandardized
Coefficients
Standardized
Coefficients
t Sig.
Correlations
Collinearity
Statistics
B
Std.
Error Beta
Zero-
order Partial Part Tolerance VIF
1 (Constant) 135.099 91.997 1.469 .145
Treatment -4.145 5.934 -.071 -.698 .487 -.096 -.071 -
.070
.977 1.024
Gender -9.023 6.181 -.149 -
1.460
.148 -.152 -.147 -
.146
.959 1.043
SES 4.860 8.164 .061 .595 .553 .037 .061 .060 .967 1.034
Attendance_2yr .218 .256 .086 .850 .397 .103 .086 .085 .983 1.017
a. Dependent Variable: MathScaleScore2012

158
Table 63. Residual Statistics of Simultaneous Regression Analysis (Black), Treatment,
Attendance, Gender, and SES Residual Statistics of Simultaneous Regression Analysis (Black), Treatment, Attendance,
Gender, and SES
Residuals Statisticsa
Minimum Maximum Mean Std. Deviation N
Predicted Value 195.89 220.39 208.74 5.932 101
Residual -65.703 73.096 .000 28.872 101
Std. Predicted Value -2.166 1.964 .000 1.000 101
Std. Residual -2.230 2.481 .000 .980 101
a. Dependent Variable: MathScaleScore2012
Subsidiary Question 6
How much variance in the 2012 NJ ASK5 mean scale score of Hispanic students
can be explained by the predictors treatment, attendance, gender, and SES?
Null Hypothesis 6
H0: β0 = 0; the predictor variables treatment, attendance, gender, and SES account
for no variation in the performance of Hispanic students on the 2012 NJ ASK5.
A simultaneous regression analysis was conducted to determine the independent
variable(s) best correlated with the performance of Hispanic students on the 2012 NJ
ASK5. Basic descriptive statistics, model summaries, ANOVA, and regression
coefficients are shown in Tables 64 through 67. Collinearity statistics revealed VIFs less
than 2, indicating that there was not a high correlation among the predictor variables
(Allison, 1999). The Durbin-Watson statistic was applied as a measure of correlation
between the residuals. In this analysis, the value of the Durbin-Watson statistic is 1.483,
approximately equal to 2, indicating no serial correlation between the residuals (Durbin
& Watson, 1950, 1951).

159
A total of 7718 Hispanic students (M=229.86, SD=35.315) were considered in this
analysis. These students had a mean attendance of 349.07 (SD = 19.49). Model 1, which
combined the predictor variables treatment, attendance, gender, and SES, explained a
significant proportion of variance (21.8%) in 2012 NJ ASK5 performance; F(4, 72) =
5.052, R = 0.467, R2adj = .175, p<0.05.
Only two variables in the model accounted for a significant proportion of
variation in the performance of Hispanic students on the 2012 NJ ASK5
• Attendance, β =0.462 (explaining 16.6% of variance), t(77) = 4.141, p=0.000
• SES, β =-0.226 (explaining 5% of variance), t(77) = -2.067, p=0.042
The variables treatment and gender were not significant predictors of performance
in this analysis.
Table 64. Descriptive Statistics of Simultaneous Regression Analysis (Hispanic), Treatment, Attendance, Gender, and SES Descriptive Statistics of Simultaneous Regression Analysis (Hispanic), Treatment,
Attendance, Gender, and SES
Descriptive Statistics
Mean Std. Deviation N
MathScaleScore2012 229.86 35.315 77
Treatment .48 .503 77
Gender .57 .498 77
SES .91 .289 77
Attendance_2yr 349.0714 19.48763 77
_______________________ 18Sample size (N = 77) does not meet the criterion for sample size as defined by Field (2009) and Green
(1991). Adequate sample size in this analysis would be 50 + 8k, where “k” equals the number of predictors,
or 82.

160
Table 65. Model Summary of Simultaneous Regression Analysis (Hispanic), Treatment, Attendance, Gender, and SES
Model Summary of Simultaneous Regression Analysis (Hispanic), Treatment, Attendance,
Gender, and SES
Model Summarya,c
Model R R
Square
Adjusted
R Square
Std. Error
of the
Estimate
Change Statistics Durbin-
Watson R Square
Change
F
Change
df1 df2 Sig. F
Change
1 .467b .218 .175 32.080 .218 5.025 4 72 .001 1.483
a. Black_Hispanic = Hispanic
b. Predictors: (Constant), Attendance_2yr, Gender, Treatment, SES
c. Dependent Variable: MathScaleScore2012
Table 66. ANOVA of Simultaneous Regression Analysis (Hispanic), Treatment, Attendance, Gender, and SES
ANOVA of Simultaneous Regression Analysis (Hispanic), Treatment, Attendance,
Gender, and SES
ANOVAa,b
Model Sum of Squares df Mean Square F Sig.
1
Regression 20684.652 4 5171.163 5.025 .001c
Residual 74098.777 72 1029.150
Total 94783.429 76
a. Black_Hispanic = Hispanic
b. Dependent Variable: MathScaleScore2012
c. Predictors: (Constant), Attendance_2yr, Gender, Treatment, SES

161
Table 67. Coefficient Statistics of Simultaneous Regression Analysis (Hispanic), Treatment, Attendance, Gender, and SES Coefficient Statistics of Simultaneous Regression Analysis (Hispanic), Treatment,
Attendance, Gender, and SES
Coefficientsa,b
Model Unstandardized Coefficients Standardized
Coefficients
t Sig.
B Std. Error Beta
1
(Constant) -36.309 70.173 -.517 .606
Treatment .233 7.600 .003 .031 .976
SES -27.618 13.359 -.226 -2.067 .042
Gender -2.191 7.537 -.031 -.291 .772
Attendance_2yr .838 .202 .462 4.141 .000
a. Black_Hispanic = Hispanic
b. Dependent Variable: MathScaleScore2012
Subsidiary Question 7
Is there a statistically significant difference in the 2012 NJ ASK5 performance of
Hispanic students based on SES classification and treatment status when
controlling for attendance; and is there significant interaction between treatment
status and SES classification for Hispanic students when controlling for
attendance?
Null Hypothesis 7a
There is no significant difference in the 2012 NJ ASK5 performance of Hispanic
students based on SES classification and treatment status when controlling for
attendance.
Null Hypothesis 7b
There is no significant interaction between treatment status and SES when
controlling for attendance.

162
A factorial ANCOVA was conducted comparing the 2012 NJ ASK5 mean scale
score of Hispanic students in the Everyday Math treatment to the 2012 NJ ASK5 mean
scale score of Hispanic students in the Singapore Math Treatment, controlling for
attendance. The results are shown in Tables 68 through 72. Levene's Test of Equality
was applied to assess the homogeneity of variance. The resulting p-value (p>0.05)
allowed the null hypothesis of equal variances to be accepted, and it is concluded that
there are no differences between the variances in the sample populations. See Table 69.
All other assumptions for ANCOVA were met (see Appendix C).
Low SES Hispanic students (N=70) had a mean scale score of 228.514 (SD =
35.58). Higher SES Hispanic students (N = 7)1819 had a mean scale score of 243.29 (SD
= 31.763). Low SES Hispanic students in the Everyday Math Alternative Treatment (N=
37) had a mean scale score of 233.00 (SD = 34.24). Low SES Hispanic students in the
Singapore Math Experimental Treatment (N=33) had a mean scale score of 223.49 (SD =
36.89). Higher SES Hispanic students in the Everyday Math Alternative Treatment (N=
3)20 had a mean scale score of 239.667 (SD = 25.38). Higher SES Hispanic students in
the Singapore Math Experimental Treatment (N=4)21 had a mean scale score of 246.00
(SD = 39.56). The independent variable SES was statistically significant with a p-value <
0.05; F(1, 76) = 4.366, ηp2 = 0.057, p = 0.040 indicating that low SES Hispanic students’
performance was significantly different than Higher SES Hispanic students and, in this
case, worse. The covariate attendance was also statistically significant with a p-value <
_____________________ 19 Small sample size (N = 7) could potentially reduce the statistical power of this analysis.
20 Small sample size (N = 3) could potentially reduce the statistical power of this analysis.
21 Small sample size (N = 4) could potentially reduce the statistical power of this analysis.

163
0.05; F(1, 76) = 20.804, ηp2 = 0.224, p = 0.000. Adjusted means are displayed as
Estimated Marginal Means in Tables 71 and 72. The independent variable treatment and
the interaction of treatment and SES was not statistically significant with p-values > 0.05,
indicating that there was no significant difference in treatment.
Table 68. Descriptive Statistics of Factorial ANCOVA (Hispanic), Treatment, Attendance, and SES Descriptive Statistics of Factorial ANCOVA (Hispanic), Treatment, Attendance, and SES
Descriptive Statistics
Dependent Variable: MathScaleScore2012
Treatment SES Mean Std. Deviation N
Everyday Math_Alternative
Treatment
HigherSES 239.667 25.3837 3
Low SES 233.000 34.2434 37
Total 233.500 33.4457 40
Singapore Math_Experimental
Treatment
HigherSES 246.000 39.5643 4
Low SES 223.485 36.8901 33
Total 225.919 37.2875 37
Total
HigherSES 243.286 31.7633 7
Low SES 228.514 35.5783 70
Total 229.857 35.3150 77
Table 69. Levene's Test of Equality of ANOVA (Hispanic), Treatment, Attendance, and SES
Levene's Test of Equality of ANOVA (Hispanic), Treatment, Attendance, and SES
Levene's Test of Equality of Error Variancesa
Dependent Variable: MathScaleScore2012
F df1 df2 Sig.
.239 3 73 .869
Tests the null hypothesis that the error variance of the dependent variable is equal across groups.
a. Design: Intercept + SYs1011Attendance + Treatment + SES + Treatment * SES

164
Table 70. Test of Between-Subject Effects of ANOVA (Hispanic), Treatment, Attendance, and SES Test of Between-Subject Effects of ANOVA (Hispanic), Treatment, Attendance, and SES
Tests of Between-Subjects Effects
Dependent Variable: MathScaleScore2012
Source Type III Sum
of Squares
df Mean
Square
F Sig. Partial
Eta
Squared
Noncent.
Parameter
Observed
Powerb
Corrected Model 23603.310a 4 5900.827 5.969 .000 .249 23.875 .979
Intercept 1419.662 1 1419.662 1.436 .235 .020 1.436 .219
SYs1011Attendance 20566.790 1 20566.790 20.804 .000 .224 20.804 .994
Treatment 2139.270 1 2139.270 2.164 .146 .029 2.164 .306
SES 4316.524 1 4316.524 4.366 .040 .057 4.366 .541
Treatment * SES 3005.615 1 3005.615 3.040 .085 .041 3.040 .405
Error 71180.119 72 988.613
Total 4163025.000 77
Corrected Total 94783.429 76
a. R Squared = .249 (Adjusted R Squared = .207)
b. Computed using alpha = .05
Table 71. Estimated Marginal Means (1) of ANOVA (Hispanic), Treatment, Attendance, and SES Estimated Marginal Means (1) of ANOVA (Hispanic), Treatment, Attendance, and SES
Estimates
Dependent Variable: MathScaleScore2012
Treatment Mean Std. Error 95% Confidence Interval
Lower Bound Upper Bound
Everyday Math_Alternative
Treatment
230.633a 9.520 211.656 249.610
Singapore Math_Experimental
Treatment
250.381a 9.002 232.436 268.326
a. Covariates appearing in the model are evaluated at the following values: SYs1011Attendance =
349.071.

165
Table 72. Estimated Marginal Means (2) of ANOVA (Hispanic), Treatment, Attendance, and SES Estimated Marginal Means (2) of ANOVA (Hispanic), Treatment, Attendance, and SES
2. Treatment * SES
Dependent Variable: MathScaleScore2012
Treatment SES Mean Std. Error 95% Confidence Interval
Lower Bound Upper Bound
Everyday Math_Alternative
Treatment
Higher SES 232.752a 18.216 196.439 269.066
Low SES 228.513a 5.262 218.024 239.003
Singapore
Math_Experimental
Treatment
Higher SES 275.153a 16.971 241.322 308.983
Low SES 225.610
a 5.493 214.660 236.561
a. Covariates appearing in the model are evaluated at the following values: SYs1011Attendance =
349.071.
Figure 7. Estimated Marginal Means of MathScaleScore2012 - Hispanic, SES, Attendance

166
Review of the Findings
This chapter concludes with a brief discussion of the results and findings
associated with each subsidiary question and the corresponding hypotheses. Also, see
Table 73. A complete evaluation of each hypothesis, along with future
recommendations, is included in Chapter 5.
Table 73. Treatment Level Comparisons of Mean Scale Scores on the 2012 NJ ASK5
Treatment Level Comparisons of Mean Scale Scores on the 2012 NJ ASK5
= Higher mean scale score
* Higher initial mean scale score as measured by the 2010NJ ASK3; ‘Yes’ – Mean difference is statistically
significant at the confidence level of ≥95% ; ‘No’ – Mean difference is not statistically significant at the
confidence level of ≥95%

167
Subsidiary Question 1
How much variance in the 2012 NJ ASK5 mean scale score can be explained by
the predictors treatment, attendance, gender, race/ethnicity, and SES?
Null Hypothesis 1
H0: β0 = 0; the predictor variables treatment, attendance, gender, Black&Hispanic/White
and SES account for no variation in student performance on the 2012 NJ ASK5. The null
hypothesis was rejected.
Exploratory regressions analyses revealed that the variables treatment, attendance,
gender, race/ethnicity (Black&Hispanic/White), and SES, combined, accounted for
21.8% of the variance in student performance as measured by the 2012 NJ ASK5.
However, only two variables, Black&Hispanic/White and attendance, were statistically
significant predictors of variance in student performance. Treatment, gender, and SES
were not significant predictors of performance in this analysis.
While treatment was not found to be a significant predictor variable in the
exploratory regression analyses, subsequent analyses incorporated treatment as a fixed or
grouping variable and were conducted to either validate initial findings or to make
comparisons between the treatment groups around significant predictors.

168
Subsidiary Question 2
Is there a statistically significant difference in the 2012 NJ ASK5 performance of
students in the Everyday Math Alternative Treatment and the Singapore Math
Experimental Treatment when controlling for attendance?
Null Hypothesis 2
There is no significant difference in the overall performance of the Everyday Math
Alternative Treatment and the Singapore Math Experimental Treatment as measured by
the 2012 NJ ASK5 when controlling for attendance. The null hypothesis was accepted.
An ANCOVA was conducted to determine whether there were statistically
significant differences in the overall performance of the Everyday Math Alternative
Treatment and the Singapore Math Experimental Treatment as measured by the 2012 NJ
ASK5 when controlling for attendance. The mean scale score of the Everyday Math
Alternative Treatment (N = 105) was 225.45 (SD = 33.43); the mean scale score of the
Singapore Math Experimental Treatment (N = 100) was 220.88 (SD = 37.75). Results
showed that the covariate attendance was statistically significant with a p-value < 0.05;
F(1, 76) = 9.343, ηρ2 = 0.044, p = 0.003. Results showed that the effect of treatment was
not statistically significant.

169
Subsidiary Question 3
To what extent do differences in performance exist when data are analyzed
according to 2012 NJASK5 performance levels (Partially Proficient, Proficient, and
Advanced Proficient) and treatment status, and is there significant interaction between the
performance levels and treatment?
Multiple analyses were conducted to examine the 2012 NJ ASK performance of
each treatment group at the three NJ ASK performance levels: Partially Proficient,
Proficient, and Advanced Proficient (t-tests, ANCOVA, and factorial ANCOVA).
Performance levels were described in Chapter 3, Table 5.
Null Hypothesis 3a
There is no significant difference between the Everyday Math Alternative
Treatment’s 2010 NJ ASK3 mean scale score at each performance level (Partially
Proficient, Proficient, and Advanced Proficient) and the Everyday Math Alternative
Treatment’s 2012 NJ ASK5 mean scale score at each performance level (Partially
Proficient, Proficient, and Advanced Proficient). The null hypothesis was rejected.
Null Hypothesis 3b
There is no significant difference between the Singapore Math Experimental
Treatment’s 2010 NJ ASK3 mean scale score at each performance level (Partially
Proficient, Proficient, and Advanced Proficient) and the Singapore Math Experimental
Treatment’s 2012 NJ ASK5 mean scale score at each performance level (Partially
Proficient, Proficient, and Advanced Proficient). The null hypothesis was rejected.

170
For both treatment groups, an Independent Samples t-test was conducted,
comparing 2010 NJ ASK3 performance at each performance level (Partially Proficient,
Proficient, and Advanced Proficient) prior to treatment and the performance of the same
cohort (scoring Partially Proficient, Proficient, or Advanced Proficient on the 2010 NJ
ASK3) after treatment. For both treatment groups, there was a statistically significant
difference between the mean scale score of students scoring Partially Proficient on the
2010 NJ ASK3 and the 2012 NJ ASK5 mean scale score of the same cohort of students.
In both treatment groups, the 2012 NJ ASK5 mean scale score was significantly higher,
suggesting that each treatment had a favorable impact on advancing the performance of
Partially Proficient students.
Everyday Math Alternative Treatment
• Partially Proficient (N=27); t(27)= -4.018, p < 0.05, d = 0.897
• 2010 NJ ASK3 (M=172.15, SD=19.13); 2012 NJ ASK5 (M=192.56,
SD=25.861)
Singapore Math Experimental Treatment
• Partially Proficient (N=34); t(34) = -5.753, p = < 0.05, d = 0.992
• 2010 NJ ASK3 (M=169.91, SD=18.99); 2012 NJ ASK5 (M=189.85,
SD=23.96)

171
For both treatment groups, there was a statistically significant difference between
the mean scale score of students scoring Advanced Proficient on the 2010 NJ ASK3 and
the mean scale score of the same cohort of students on the 2012 NJ ASK5. In both
treatment groups, the 2012 NJ ASK5 mean scale score was significantly lower,
suggesting that neither treatment had a favorable impact on advancing the performance of
Advanced Proficient students.
Everyday Math Alternative Treatment
• Advanced Proficient (N=26); t(26) = 4.377, p < 0.05, d = 0.545
• 2010 NJ ASK3 (M=275.19, SD=19.57); 2012 NJ ASK5 (M=262.69,
SD=25.884)
Singapore Math Experimental Treatment
• Advanced Proficient (N=28); t(28) = 4.377, p = < 0.05, d = 0.774
• 2010 NJ ASK3 (M=277.68, SD=19.50); 2012 NJ ASK5 (M=261.21,
SD=22.94)
For both treatment groups, there was no statistically significant difference
between the mean scale score of students scoring Proficient on the 2010 NJ ASK3 and
the mean scale score of the same cohort of students on the 2012 NJ ASK5.
Everyday Math Alternative Treatment
• Proficient (N=52); t(52)= .495, p = 0.319
• 2010 NJ ASK3 (M=221.19, SD=11.312); 2012 NJ ASK5 (M=223.90,
SD=18.085)
Singapore Math Experimental Treatment
• Proficient (N=38); t(38)= .495, p = 0.624.on the

172
• 2010 NJ ASK3 (M=220.84, SD=14.689); 2012 NJ ASK5 (M=218.92,
SD=28.237)
Null Hypothesis 3c
There is no significant interaction between the independent variables treatment
and performancelevel2012 (the categorical variable representing the 2012 NJ ASK5
proficiency levels: Advanced Proficient, Proficient, and Partially Proficient). The null
hypothesis was accepted.
A factorial ANOVA was conducted incorporating the independent variables
treatment and performancelevel2012 (the categorical variable representing the 2012 NJ
ASK5 proficiency levels: Advanced Proficient, Proficient, and Partially Proficient). The
mean scale score of Everyday Math students scoring Advanced Proficient (N=23) was
273.17 (SD = 16.30); scoring Proficient (N= 67) was 220.52 (SD = 13.92) and scoring
Partially Proficient (N= 15) was 174.27 (SD = 17.49). The mean scale score of Singapore
Math students scoring Advanced Proficient (N=26) was 269.50 (SD = 15.58), scoring
Proficient (N= 45) was 221.36 (SD = 15.47), and scoring Partially Proficient (N=29) was
176.55 (SD = 14.68). The interaction of treatment and performancelevel2012 was not
statistically significant at the p<0.05 level.

173
Null Hypothesis 3d
There is no significant difference between the mean scale scores of those students
scoring Proficient on the 2012 NJ ASK5 (scoring 200 and above) in the Everyday Math
Alternative Treatment and the mean scale score of those students scoring Proficient on
the 2012 NJ ASK5 (scoring 200 and above) in the Singapore Math Experimental
Treatment as measured by the 2012 NJ ASK5. The null hypothesis was accepted.
An ANOVA was conducted comparing the scale scores of those students in each
treatment scoring 200 and above on the 2012 NJ ASK5. The total number of Everyday
Math Treatment students meeting the criteria for proficiency by scoring Proficient or
Advanced Proficient on the Grade 5 NJ ASK was 90 (M= 233.98, SD = 27.25). The total
number of Singapore Math Treatment students meeting the criteria for proficiency by
scoring Proficient or Advanced Proficient on the Grade 5 NJ ASK was 71 (M=238.99,
SD = 27.98). Results showed that the effect of treatment was not statistically significant
at the p<0.05 level.
Null Hypothesis 3e
There is no significant difference between the mean scale scores of those students
scoring not proficient on the 2012 NJ ASK5 (scoring below 200) in the Everyday Math
Alternative Treatment and the mean scale score of those students scoring not proficient
on the 2012 NJ ASK5 (scoring below 200) in the Singapore Math Experimental
Treatment as measured by the 2012 NJ ASK5. The null hypothesis was accepted.
An ANOVA was conducted comparing the scale scores of those students in each
treatment scoring below 200 on the 2012 NJ ASK5. The total number of Everyday Math
Treatment students not meeting the criteria for proficiency (scoring less than 200) on the

174
Grade 5 NJ ASK was 15 (M= 174.27, SD = 17.487). The total number of Singapore Math
students not meeting the criteria for proficiency (scoring less than 200) on the Grade 5 NJ
ASK was 29 (M=176.55, SD = 14.681). Results showed that the effect of treatment was
not statistically significant at the p<0.05 level.
Subsidiary Question 4
Is there a statistically significant difference in the 2012 NJ ASK5 performance
level of students in the Everyday Math Alternative Treatment and the Singapore Math
Experimental Treatment based on race/ethnicity (Black, Hispanic, White, subset of Black
and Hispanic), and is there significant interaction between treatment status and
race/ethnicity (Black, Hispanic, White, subset of Black and Hispanic)?
Null Hypothesis 4a
There is no significant interaction between treatment status and
Black&Hispanic/White performance as measured by the 2012 NJ ASK5. The null
hypothesis was accepted.
A factorial ANOVA was conducted incorporating the independent variables
treatment and Black&Hispanic/White (the dichotomous variable representing the
race/ethnicity status, Black and Hispanic or White).
Black and Hispanic students in the Everyday Math Alternative Treatment (N= 90)
had a mean scale score of 221.33 (SD = 32.890). White students in the Everyday Math
Alternative Treatment (N= 15) had a mean scale score of 250.13 (SD = 25.743). Black
and Hispanic students in the Singapore Math Experimental Treatment (N=88) had a mean
scale score of 214.34 (SD = 34.355). White students in the Singapore Math Experimental
Treatment (N=12) had a mean scale score of 268.83 (SD = 25.316). The interaction of

175
treatment and race/ethnicity (Black&Hispanic/White) was not statistically significant
suggesting that there was no significant interaction between race/ethnicity
(Black&Hispanic/White) and treatment with student performance on the 2012 NJ ASK5.
The independent variable Black&Hispanic/White was statistically significant; p-value <
0.05, F(1, 204) = 37.554 and ηp2 = 0.157, indicating that the performance level of Black
and Hispanic students was significantly different, and in this case, significantly worse
than White students. Based on the results, two additional analyses were run to determine
whether significant differences in the performance level of the subset of Black and
Hispanic students and the subset of White students occurred across both treatments. (see
Null Hypotheses 4a and 4b).
Null Hypothesis 4b
There is no significant difference between the overall performance of the subset
of Black and Hispanic students in the Everyday Math Alternative Treatment and the
subset of Black and Hispanic students in the Singapore Math Experimental Treatment as
measured by the 2012 NJ ASK5. The null hypothesis was accepted.
An ANOVA was conducted comparing the 2012 NJ ASK5 mean scale score of
the subset of Black and Hispanic students in the Everyday Math treatment to the 2012 NJ
ASK5 mean scale score of the subset of Black and Hispanic students in the Singapore
Math treatment. Black and Hispanic students in the Everyday Math Alternative
Treatment (N= 90) had a mean scale score of 221.33 (SD = 32.89). Black and Hispanic
students in the Singapore Math Experimental Treatment (N=88) had a mean scale score
of 214.34 (SD = 34.36). The independent variable treatment was not statistically
significant with a p-value > 0.05, indicating that there was no significant difference in the

176
performance of the subset of Black and Hispanic students in the Everyday Math
treatment and the subset of Black and Hispanic students in the Singapore Math
Treatment.
Null Hypothesis 4c
There is no significant difference between the overall performance of White
students in the Everyday Math Alternative Treatment and White students in the
Singapore Math Experimental Treatment as measured by the 2012 NJ ASK5. The null
hypothesis was accepted.
An ANOVA was conducted comparing the 2012 NJ ASK5 mean scale score of
the subset of White students in the Everyday Math treatment to the 2012 NJ ASK5 mean
scale score of the subset of White students in the Singapore Math Treatment.
White students in the Everyday Math Alternative Treatment (N= 15) had a mean
scale score of 250.13 (SD = 25.74). White students in the Singapore Math Experimental
Treatment (N=12) had a mean scale score of 268.83 (SD = 25.32). The independent
variable treatment was not statistically significant with p-values > 0.05, indicating that
there was no significant difference in the performance levels of White students in the
Everyday Math treatment and White students in the Singapore Math Treatment.
Null Hypothesis 4d
There is no significant interaction between treatment status and Black/Hispanic
performance as measured by the 2012 NJ ASK5. The null hypothesis was accepted.
A factorial ANOVA was conducted incorporating the independent variables
treatment and Black or Hispanic. Black students in the Everyday Math Alternative
Treatment (N= 50) had a mean scale score of 211.60 (SD = 29.27). Hispanic students in

177
the Everyday Math Alternative Treatment (N= 40) had a mean scale score of 233.50 (SD
= 33.45). Black students in the Singapore Math Experimental Treatment (N=51) had a
mean scale score of 205.94 (SD = 29.69). Hispanic students in the Singapore Math
Experimental Treatment (N=37) had a mean scale score of 225.92 (SD = 37.29). The
interaction of treatment and Black/Hispanic was not statistically significant. The
independent variable Black/Hispanic was statistically significant; p-value < 0.05, F(1,
177) = 18.526; and ηp2 = 0.096. Based on the results, two additional analyses were run to
determine whether significant difference in the performance of Black and Hispanic
students occurred across both treatments (see Null Hypotheses 4e and 4f).
Null Hypothesis 4e
There is no significant difference in the overall 2012 NJ ASK5 performance of
Black and Hispanic students in the Everyday Math Alternative Treatment. The null
hypothesis was rejected.
An ANOVA was conducted comparing the 2012 NJ ASK5 mean scale scores of
Black students in the Everyday Math Alternative Treatment and Hispanic students in the
Everyday Math Alternative Treatment. Black students in the Everyday Math Alternative
Treatment (N= 50) had a mean scale score of 211.60 (SD = 29.27). Hispanic students in
the Everyday Math Alternative Treatment (N= 40) had a mean scale score of 233.50 (SD
= 33.45). The independent variable Black/Hispanic was statistically significant; F(1, 90)
= 10.954, p < 0.05, and ηp2 = 0.111, indicating that the performance of Black students
was significantly different, and in this case, significantly worse than Hispanic students.

178
Null Hypothesis 4f
There is no significant difference in the overall 2012 NJ ASK5 performance of
Black and Hispanic students in the Singapore Math Experimental Treatment. The null
hypothesis was rejected.
An ANOVA was conducted comparing the 2012 NJ ASK5 mean scale scores of
Black students in the Singapore Math Experimental Treatment and Hispanic students in
the Singapore Math Experimental Treatment. Black students in the Singapore Math
Experimental Treatment (N=51) had a mean scale score of 205.94 (SD = 29.69).
Hispanic students in the Singapore Math Experimental Treatment (N=37) had a mean
scale score of 225.92 (SD = 37.29). The independent variable Black/Hispanic was
statistically significant; F(1, 90) = 7.819, p < 0.05, and ηp2 = 0.006, indicating that the
performance of Black students was significantly different, and in this case, significantly
worse than Hispanic students.
Subsidiary Question 5
How much variance in the 2012 NJ ASK5 mean scale score of Black students can
be explained by the predictor variables treatment, attendance, gender, and SES?
Null Hypothesis 5
H0: β0 = 0; the predictor variables treatment, attendance, gender, and SES account
for no variation in the performance of Black students on the 2012 NJ ASK5. The null
hypothesis was accepted.
A simultaneous regression analysis was conducted to determine the degree to
which the predictor variables treatment, attendance, gender, and SES account for
variation in the performance of Black students on the 2012 NJ ASK.

179
A total of 101 Black students (M=208.74, SD=29.475) were considered in this
analysis. These students had a mean attendance of 354.51 (SD = 11.59). Overall results
indicate that the predictor variables treatment, attendance, gender, and SES did not
account for a significant proportion of variance in the mathematics performance of Black
students.
Subsidiary Question 6
How much variance in the 2012 NJ ASK5 mean scale score of Hispanic students
can be explained by the predictor variables treatment, attendance, gender, and SES?
Null Hypothesis 6
H0: β0 = 0; the predictor variables treatment, attendance, gender, and SES account
for no variation in the performance of Hispanic students on the 2012 NJ ASK5. The null
hypothesis was rejected.
A simultaneous regression analysis was conducted to determine the independent
variable(s) best correlated with the performance of Hispanic students on the 2012 NJ
ASK5. A total of 77 Hispanic students (M=229.86, SD=35.315) were considered in this
analysis. These students had a mean attendance of 349.07 (SD = 19.49). Model 1, which
combined with the predictor variables treatment, attendance, gender, and SES, was
significant; F(4, 72) = 5.052, R = 0.467, R2adj = .175, p<0.05. Only two variables in the
model accounted for a significant proportion of variation in the performance of Hispanic
students on the 2012 NJ ASK5:
• Attendance, β =0.462, t(77) = 4.141, p=0.000
• SES, β =-0.226, t(77) = -2.067, p=0.042

180
The variables treatment and gender were not significant predictors of performance in
this analysis.
Subsidiary Question 7
Is there a statistically significant difference in the 2012 NJ ASK5 performance of
Hispanic students based on SES classification and treatment status when controlling for
attendance; and is there significant interaction between treatment status and SES
classification for Hispanic students when controlling for attendance?
Null Hypothesis 7a
There is no significant difference in the 2012 NJ ASK5 performance of Hispanic
students based on SES classification and treatment status when controlling for
attendance. The null hypothesis was accepted.
Null Hypothesis 7b
There is no significant interaction between treatment status and SES when
controlling for attendance. The null hypothesis was accepted.
A factorial ANCOVA was conducted comparing the 2012 NJ ASK5 mean scale
score of Hispanic students in the Everyday Math treatment to the 2012 NJ ASK5 mean
scale score of Hispanic students in the Singapore Math Treatment, controlling for
attendance. Low SES Hispanic students (N=70) had a mean scale score of 228.514 (SD
= 35.58). Higher SES Hispanic students (N = 7) had a mean scale score of 243.29 (SD =
31.763).
Low SES Hispanic students in the Everyday Math Alternative Treatment (N= 37)
had a mean scale score of 233.00 (SD = 34.24). Low SES Hispanic students in the
181
Singapore Math Experimental Treatment (N=33) had a mean scale score of 223.49 (SD =
36.89).
Higher SES Hispanic students in the Everyday Math Alternative Treatment (N=
3) had a mean scale score of 239.667 (SD = 25.38). Higher SES Hispanic students in the
Singapore Math Experimental Treatment (N=4) had a mean scale score of 246.00 (SD =
39.56).
The independent variable SES was statistically significant with a p-value < 0.05;
F(1, 76) = 4.366, ηp2 = 0.057, p = 0.040, indicating that the performance of low SES
Hispanic students was significantly different, and in this case, worse, than higher SES
Hispanic students. The covariate attendance was also statistically significant with a p-
value < 0.05; F(1, 76) = 20.804, ηρ2 = 0.224, p = 0.000. The independent variables
treatment and the interaction of treatment and SES were not statistically significant with
p-values > 0.05, indicating that there was no significant difference in treatment.

182
CHAPTER V
SUMMARY OF FINDINGS, CONCLUSIONS, AND RECOMMENDATIONS
Introduction
The primary purpose of this study was to provide performance data to show how
two elementary school mathematics curricula, aligned to two different sets of standards,
impacted student performance on New Jersey State standardized tests. The study
provides data to assist stakeholders in better understanding the role that standards-aligned
curricular materials play in the development of students’ skills in elementary
mathematics by examining significant differences between the achievement effects of one
proposed Common Core State Standards-aligned mathematics program, Math in Focus:
Singapore Math (published by Houghton Mifflin Harcourt, 2010), and one NCTM-
aligned mathematics program, Everyday Mathematics (currently published by the Wright
Group/McGraw-Hill, 2007). The study takes place within the Large Northeastern Urban
Public School District – a district categorized within District Factor Group A, the lowest
grouping, indicative of the district’s relative socioeconomic status. The participants were
identified as the 2011-2012 cohort of fifth grade students within the Large Northeastern
Urban Public School District in the eight schools identified as either Singapore Math
Experimental Treatment or Everyday Math Alternative Treatment sites. The qualifying
Grade 5 sample was a representation of (a) general education students from one of the
four Large Northeastern Urban Public School District regions who (b) remained within
their respective schools sites for their third, fourth, and fifth grade years and (c) used
Everyday Mathematics as their core program in their third grade year. The experimental
treatment sample, 100 Grade 5 students, reflected the qualifying subset of students from

183
the four schools piloting the Math in Focus: Singapore Math (Houghton Mifflin
Harcourt, 2010). This group used the Singapore Math program as their core instructional
mathematics program in their fourth and fifth grade years.
Four additional schools with similar past performance trends, demographic
compositions, and within-school factors as compared to the piloting sites were selected
and paired with each of the experimental treatment sites. The alternative treatment
sample, 105 Grade 5 students, reflected the qualifying subset of students from the four
schools that continued to use the district-adopted program, Everyday Mathematics, 3rd
Edition (McGraw-Hill Education, 2007) in their fourth and fifth grade years.
This study employed an explanatory non-experimental research design, using post
hoc pre- and post-test data from 2010 and 2012 administrations of the New Jersey
Assessment of Skills and Knowledge (NJ ASK). Multiple analyses were employed in the
study, first to establish the comparability of the groups and control for initial differences,
then to determine if the implementation of a K-5 CCSSM-aligned mathematics program,
Singapore Math, is related to differences in performance on New Jersey Assessment of
Skills and Knowledge (NJ ASK) for Grade 5 general education students in comparison to
students using a NCTM-aligned elementary mathematics program, Everyday
Mathematics.
This research was guided by one overarching research question with seven
subsidiary questions. All primary analysis findings are reported in aggregate at the
treatment level. Findings, conclusions, and the potential implications for theory,
knowledge, practice, policy, and future research are discussed in this chapter.

184
Summary of Findings
This study examined the primary research question “What is the impact of
implementing a proposed CCSSM-aligned mathematics program, Singapore Math, on the
mathematics achievement of Grade 5 general education students as measured by the 2012
Grade 5 NJ ASK (NJ ASK5) in comparison to the mathematics achievement of Grade 5
general education students using a NCTM-aligned elementary mathematics program,
Everyday Mathematics, in the Large Northeastern Urban Public School District?”
Via research methods designed to test the null hypotheses, the following subsidiary
questions and their corresponding analyses and results are discussed.
Subsidiary Question 1
How much variance in the 2012 NJ ASK5 mean scale score can be explained by
the predictor variables treatment, attendance, gender, race/ethnicity, and SES?
Findings for Subsidiary Question 1. 18.5% of the variance in student
performance can be explained by the predictor variables treatment, attendance, gender,
race/ethnicity, and SES, whereas the significant proportions can be explained by
attendance (3.8%) and race/ethnicity (12.5%).
Exploratory regressions analyses revealed that the variables treatment, attendance,
gender, race/ethnicity, and SES, combined, accounted for a significant proportion of
variance in student performance (18.5%) as measured by the in 2012 NJ ASK5.
However, only two variables, Black&Hispanic/White (the dichotomous variable
representing race/ethnicity status, Black/Hispanic or White/Other) and attendance, were
statistically significant predictors of variance in student performance. The variable
attendance explained 3.8% of the variance in performance. The variable

185
Black&Hispanic/White explained 12.5% of the variance in performance. Treatment,
gender, and SES were not significant predictors of performance in this analysis. While
treatment was not found to be a significant predictor variable in the exploratory
regression analyses, subsequent analyses incorporated treatment as a fixed or grouping
variable and were conducted to either validate the initial findings or to make comparisons
between the treatment groups around the significant predictor variables: race/ethnicity
and attendance.
Subsidiary Question 2
Is there a statistically significant difference in the 2012 NJ ASK5 performance of
students in the Everyday Math Alternative Treatment and the Singapore Math
Experimental Treatment when controlling for attendance?
Findings for Subsidiary Question 2. There is no significant difference in the
overall performance of students in the Everyday Math Alternative Treatment and students
in the Singapore Math Experimental Treatment as measured by the 2012 NJ ASK5.
An ANCOVA was conducted to determine whether differences existed between
the Singapore Math Experimental Treatment and the Everyday Math Alternative
Treatment on overall performance as measured by the 2012 NJ ASK5, when controlling
for attendance. While the mean scale score of the Everyday Math Alternative Treatment
(225.45) was higher than the mean scale score of the Singapore Math Experimental
Treatment (220.88), the means did not differ significantly based upon treatment status.
The covariate attendance was statistically significant with a p-value = 0.003 and ηρ2 =
0.044.

186
Subsidiary Question 3
To what extent do differences in performance exist when data are analyzed
according to 2012 NJ ASK5 performance levels (Partially Proficient, Proficient, and
Advanced Proficient) and treatment status, and is there significant interaction between the
performance levels and treatment?
Findings for Subsidiary Question 3. There were no significant differences in the
overall performance of the Everyday Math Alternative Treatment and the Singapore
Math Experimental Treatment based on performance level:
• For both treatment groups, the 2012 NJ ASK5 mean scale score of the cohort
of students initially scoring Partially Proficient on the 2010 NJ ASK3 was
significantly higher than their 2010 NJ ASK3 mean scale score, with both
treatments having fairly large effect sizes
• For both treatment groups, the 2012 NJ ASK5 mean scale score of the cohort
of students initially scoring Advanced Proficient on the 2010 NJ ASK3 was
significantly lower than their 2010 NJ ASK3 mean scale score, with both
treatments having medium effect sizes
• There was no significant interaction between the performance levels and
treatment.
Multiple analyses were conducted (t-tests, ANOVA, and factorial ANOVA) to
examine the 2012 NJ ASK5 performance of each treatment group at the three NJ ASK
performance levels: Partially Proficient, Proficient, and Advanced Proficient.
For both treatments, an Independent Samples t-test was conducted comparing the 2010
NJ ASK3 performance at each performance level (Partially Proficient, Proficient, and

187
Advanced Proficient) prior to treatment and the performance of the same cohort (scoring
Partially Proficient, Proficient, or Advanced Proficient) on the 2010 NJ ASK3 after
treatment. For both treatment groups, (1) the 2012 NJ ASK5 mean scale score of the
cohort of students initially scoring Partially Proficient on the 2010 NJ ASK3 was
significantly different and, in this case, significantly higher than their 2010 NJ ASK3
mean scale score; (2) the 2012 NJ ASK5 mean scale score of the cohort of students
initially scoring Advanced Proficient on the 2010 NJ ASK3 was significantly different,
and in this case, significantly lower than their 2010 NJ ASK3 mean scale score; and (3)
the 2012 NJ ASK5 mean scale score of the cohort of students initially scoring Proficient
on the 2010 NJ ASK3 was not significantly different than their 2010 NJ ASK3 mean
scale score.
A factorial ANOVA was conducted incorporating the independent variables
treatment and performancelevel2012 (the categorical variable representing the 2012 NJ
ASK5 proficiency levels: Advanced Proficient, Proficient, and Partially Proficient). The
interaction of treatment and mathproficiecylevel2012 was not statistically significant,
suggesting that there was no significant difference in the overall performance of the
Everyday Math Alternative Treatment and the Singapore Math Experimental Treatment
based on performance level. The variable performancelevel2012 was the only statistically
significant variable in this analysis with p values < 0.05.
An ANOVA was conducted comparing the mean scale scores of those students in
each treatment meeting the criteria for “passing” by scoring Proficient or Advanced
Proficient on the 2012 NJ ASK5. While the mean scale score of Everyday Math
Treatment students “passing” the 2012 NJ ASK5 (233.98) was lower than the mean scale

188
score of Singapore Math Treatment students “passing” the 2012 NJ ASK5 (238.99), the
means do not differ significantly.
An ANOVA was conducted to compare the mean scale scores of those students in each
treatment “failing” the NJ ASK5 (scoring below 200). While the mean scale score of
Everyday Math Treatment students “failing” the 2012 NJ ASK5 (174.27) was lower than
the mean scale score of Singapore Math students “failing” the 2012 NJ ASK5 (176.55),
the means do not differ significantly.
Subsidiary Question 4
Is there a statistically significant difference in the 2012 NJ ASK5 performance of
students in the Everyday Math Alternative Treatment and the Singapore Math
Experimental Treatment based on race/ethnicity (Black, Hispanic, White, subset of Black
and Hispanic), and is there significant interaction between treatment status and
race/ethnicity (Black, Hispanic, White, subset of Black and Hispanic)?
Findings for Subsidiary Question 4. There were no significant differences in
the overall performance of the Everyday Math Alternative Treatment and the Singapore
Math Experimental Treatment based on race/ethnicity (Black, Hispanic, White, subset of
Black and Hispanic):
• Despite treatment, White students performed significantly better than the
subset of Black and Hispanic students on the 2012 NJASK5
• Despite treatment, Hispanic students performed significantly better than Black
students on the 2012 NJASK5
• There was no significant interaction between race/ethnicity
(Black&Hispanic/White) and treatment

189
• There was no significant interaction between race/ethnicity (Black/Hispanic)
and treatment.
Multiple analyses were conducted (e.g., ANOVA and factorial ANOVA) to
examine the 2012 NJ ASK performance of each treatment group based on race/ethnicity
(Black, Hispanic, White, subset of Black/Hispanic).
A factorial ANOVA was conducted incorporating the independent variables
treatment and Black&Hispanic/White (the dichotomous variable representing the
race/ethnicity status, Black and Hispanic or White). The interaction of treatment and
Black&Hispanic/White was not statistically significant, suggesting that there was no
significant difference in the overall performance of the Everyday Math Alternative
Treatment and the Singapore Math Experimental Treatment based on race/ethnicity. The
variable Black&Hispanic/White was the only statistically significant variable in this
analysis with p values < 0.05. Based on the results, two additional analyses were run to
determine whether significant differences in the performance of the subset of Black and
Hispanic students and the subset of White students occurred across both treatments.
An ANOVA, conducted to compare the 2012 NJ ASK mean scale scores of the
cohort of Black and Hispanic students in the Everyday Math Treatment (221.33) and the
cohort of Black and Hispanic students in the Singapore Math Experimental Treatment
(214.34), revealed that treatment was not statistically significant, indicating that there was
no significant difference in the 2012 NJ ASK performance of the cohort of Black and
Hispanic in the Everyday Math Treatment and the cohort of Black and Hispanic students
in the Singapore Math Treatment.

190
An ANOVA, conducted to compare the 2012 NJ ASK mean scale scores of the
subset of White students in the Everyday Math treatment22 (250.13) and White students
in the Singapore Math Experimental Treatment23 (268.83) revealed that treatment was not
statistically significant, indicating that there was no significant difference in the 2012 NJ
ASK performance of White in the Everyday Math treatment and White students in the
Singapore Math Treatment.
A factorial ANOVA was conducted incorporating the independent variables
treatment and Black/Hispanic (the dichotomous variable representing the race/ethnicity
status, Black or Hispanic). The interaction of treatment and Black&Hispanic was not
statistically significant, suggesting that there was no significant difference in the overall
performance of the Everyday Math Alternative Treatment and the Singapore Math
Experimental Treatment based on race/ethnicity. The variable Black&Hispanic was the
only statistically significant variable in this analysis with p values < 0.05. Based on the
results, two additional analyses were run to determine whether significant difference in
the performance of Black and Hispanic students occurred across both treatments.
A comparison between the 2012 NJ ASK5 mean scale scores of Black students in the
Everyday Math Alternative Treatment (211.60) and Hispanic students in the Everyday
Math Alternative Treatment (233.5) revealed the independent variable Black/Hispanic
was statistically significant; p-value < 0.05, ηp2 = 0.111, indicating the performance of
Black and Hispanic students, regardless of treatment, was significantly different.
A comparison between the 2012 NJ ASK5 mean scale scores of Black students in the Singapore Math Experimental Treatment (205.94) and Hispanic students in the ______________________ 22 Small sample size (N = 15) could potentially reduce the statistical power of this analysis. 23 Small sample size (N = 12) could potentially reduce the statistical power of this analysis.

191
Singapore Math Experimental Treatment (225.92) revealed that the independent variable
Black/Hispanic was statistically significant; p-value < 0.05, ηp2= 0.006, indicating that
performance of Black and Hispanic students, regardless of treatment, was significantly
different.
Subsidiary Question 5
How much variance in the 2012 NJ ASK5 mean scale score of Black students
can be explained by the predictors treatment, attendance, gender, and SES?
Findings for Subsidiary Question 5. There is no significant variance in the
2012 NJ ASK5 mean scale score of Black students that can be explained by the
predictors treatment, attendance, gender, and SES.
A simultaneous regression analysis was conducted to determine the degree to
which the predictor variables treatment, attendance, gender, and SES account for
variation in the performance of Black students on the 2012 NJ ASK. A total of 101
Black students (M = 208.74, SD = 29.33) were considered in this analysis. Overall
results indicate that the predictor variables treatment, attendance, gender, and SES did not
account for a significant proportion of variance in the mathematics performance of Black
students.
Subsidiary Question 6
How much variance in the 2012 NJ ASK5 mean scale score of Hispanic students
can be explained by the predictors treatment, attendance, gender, and SES?

192
Findings for Subsidiary Question 6. 21.8%, of the variance in the 2012 NJ
ASK5 mean scale score of Hispanic students can be explained by the predictors
treatment, attendance, gender, race/ethnicity and SES, whereas the significant proportions
can be explained by attendance (16.6%) and SES (5.1%).
A simultaneous regression analysis was conducted to determine the independent
variable(s) best correlated with the performance of Hispanic students on the 2012 NJ
ASK5. A total of 7724 Hispanic students (M=229.86, SD=35.315) were considered in this
analysis. The combination of the predictor variables treatment, attendance, gender, and
SES was significant; p<0.05, explained 21.8% of the variance in 2012 NJ ASK5
performance; however, only two variables in the model, attendance (explaining 16.6% of
variance), and SES (explaining 5.1% of variance), accounted for a significant proportion
of variation in the performance of Hispanic students on the 2012 NJ ASK5. The
variables treatment and gender were not significant predictors of performance in this
analysis.
__________________________
24 Sample size (N = 77) does not meet the criterion for sample size as defined by Field (2009) and Green
(1991). Adequate sample size in this ion analysis would be 50 + 8k, where ‘k’ equals the number of
predictors, or 82.

193
Subsidiary Question 7
Is there a statistically significant difference in the 2012 NJ ASK5 performance of
Hispanic students in the Everyday Math Alternative Treatment and the Singapore Math
Experimental Treatment based on SES when controlling for attendance; and is there
significant interaction between treatment status and SES when controlling for attendance?
Findings for Subsidiary Question 7.
• There is no statistically significant difference in the 2012 NJ ASK5
performance of Hispanic students in the Everyday Math Alternative
Treatment and the Singapore Math Experimental Treatment based on SES
when controlling for attendance.
• There is no significant interaction between treatment status and SES when
controlling for attendance.
A factorial ANCOVA was conducted comparing the 2012 NJ ASK5 mean scale
score of low SES Hispanic students (228.51) to higher SES Hispanic students (243.29)
based on treatment status while controlling for attendance. The independent variable SES
was statistically significant with a p-value < 0.05; F(1, 76) = 4.366, ηp2 = 0.057,
indicating that the performance of low SES Hispanic students was significantly different,
and in this case, worse, than higher SES Hispanic students. The covariate attendance was
also statistically significant with a p-value < 0.05; F(1, 76) = 20.804, ηp2 = 0.224. The
independent variable treatment and the interaction of treatment and SES were not
statistically significant, indicating that there was no significant difference in the effect of
treatment when controlling for attendance.

194
Discussion and Conclusions
Preliminary analyses designed to establish the homogeneity of the treatment
groups provided sufficient evidence to conclude that there were no statistically significant
differences between the Singapore Math Experimental Treatment sample and Everyday
Math Alternative Treatment sample based on the primary distributions of race/ethnicity
(White, Black, Hispanic, Other), gender (male, female), SES (students receiving free or
reduced lunch, students not receiving free or reduced lunch), and pre-test performance
(Proficient, Partially Proficient), providing well-matched, homogeneous comparison
groups. The subcategories Black or Hispanic, female, low SES, and Proficient
maintained the highest distributions between the Alternative Treatment and Experimental
Treatment samples. Overall, 75.6% of the entire sample can be characterized as low
SES, Black or Hispanic fifth grade general education students; 75% of the Singapore
Math sample and 76% of the Everyday Math sample fit this description.
Curriculum Findings
These data and statistical analyses indicate fairly consistent results regarding
differences between students’ performance on the 2012 NJ ASK5 in schools
implementing the Singapore Math program and in schools implementing Everyday
Mathematics. Generally, across all analyses, there were no substantial differences in
performance based upon treatment status. Overall, treatment was found to be the weakest
predictor of student performance. Similarly, there were no patterns of differential
treatment effects across the dimensions of race/ethnicity, gender, and SES.

195
While the mean scale score for Everyday Math’s females25 was higher than that of
Singapore Math’s females25, differences were not statistically significant. Pretest
differences were comparable.
While the mean scale score for Everyday Math’s Black and Hispanic subgroup
was higher than that of Singapore Math’s Black and Hispanic subgroup, differences were
not statistically significant. Pretest differences were comparable.
While the mean scale score for Everyday Math’s Hispanic students was higher
than that of Singapore Math’s Hispanic students, differences were not statistically
significant. Pretest differences were comparable.
While the mean scale score for Everyday Math’s low SES students was higher
than that of Singapore Math’s low SES students, differences were not statistically
significant. Pretest differences were comparable.
While the mean scale score for Everyday Math’s higher SES students was higher
than that of Singapore Math’s higher SES students, differences were not statistically
significant. Pretest differences were comparable.
While the mean scale score for Everyday Math’s Advanced Proficient students
was higher than that of Singapore Math’s Advanced Proficient students, differences were
not statistically significant. Pretest differences were comparable.
While the mean scale score for Singapore Math’s males26 was higher than that of
Everyday Math’s males26, differences were not statistically significant. Pretest
differences were comparable.
25 See Appendix D for t-test analysis (females). 26 See Appendix D for t-test analysis (males).

196
While the mean scale score for Singapore Math’s White students was higher than
that of Everyday Math’s White students, differences were not statistically significant.
Pretest differences were comparable.
While the mean scale score for Singapore Math’s Proficient students was higher
than that of Everyday Math’s Proficient students, differences were not statistically
significant. Pretest differences were comparable.
While the mean scale score for Singapore Math’s Partially Proficient students was
higher than that of Everyday Math Partially Proficient students, differences were not
statistically significant. Pretest differences were comparable.
While the mean scale score for Singapore Math’s “passing” (Proficient and
Advanced Proficient) students was higher than that of Everyday Math’s “passing”
(Proficient and Advanced Proficient) students, differences were not statistically
significant. The Everyday Math sample had an initial pretest higher “passing” (Proficient
and Advanced Proficient) mean scale score.
Summary of curriculum findings. The data and statistical analyses from this
study indicated there were no statistically significant differences based upon the students’
exposure to the Everyday Mathematics program or the Singapore Math program as
measured by fifth grade performance on the 2012 NJ ASK. It is important to note that
students in the Singapore Math Experimental Treatment faired equally as well as the
students in the Everyday Math Alternative Treatment on an NJ ASK-aligned assessment
measure that presumably gave advantage to the Everyday Math Alternative Treatment.
However, the extent of the advantage (if any) cannot be substantiated by the analytics
used in this study.

197
Overall research on elementary mathematics programs, when textbooks were
compared, has shown modest differences on standardized assessment measures with
small to moderate effect size suggesting that curriculum differences appear to be less
consequential than instructional differences (Hiebert & Grouws, 2007; Sconiers et al.,
2003; Slavin et al., 2007; NRC, 2004). While a key consideration for analyzing relative
curriculum effect is the environment and approach to its implementation, Hiebert et al.
(2007) explain that variables such as curriculum and their effects typically depend on the
system in which they function. Anthony and Walshaw (2009) contend that mathematics
pedagogy is not an isolated event but one that should be interpreted as a “complex web of
factors that can affect student learning” (p. 148). Based on collective reviews of
international studies and extending the work of Hiebert and Grouws (2007), the
researchers identified ten principles of effective mathematics pedagogy that extend well
beyond curriculum, incorporating practices relating to classroom community, classroom
discourse, teacher knowledge, and “worthwhile mathematical tasks” (p. 155):
• An ethic of care
• Arranging for learning
• Building on students’ thinking
• Worthwhile mathematical tasks
• Making connections
• Assessment for learning
• Mathematical communication
• Mathematical language
• Tools and representations

198
• Teacher knowledge
These principles reinforce that view of teaching practice as residing within a “nested
system” (p. 149) within the larger classroom learning community. Given the findings
noted within this study, recommendations for policy, practice, and future study and
concluding statements include variables relating specifically to teacher practice and are
framed within contexts supported by research that underscores the interrelation between
specific teaching behaviors and student learning (Stylianides & Ball, 2004; Hiebert &
Grouws, 2007; Anthony & Walshaw, 2009).

199
Performance-Level Findings
Although the data and statistical analyses indicate consistent results rejecting the
existence of a relationship between the implementation of the Everyday Mathematics
program and the Singapore Math program and student achievement on the NJ ASK,
several points merit further exploration. Of the analyses conducted, four resulted in
statistically significant differences with effect sizes large enough to be useful to educators
with regard to performance level comparisons and demographic comparisons.
Performance-level comparisons. For both treatment groups, the 2012 NJ ASK5
mean scale score of the cohort of students initially scoring Partially Proficient on the
2010 NJ ASK3 was significantly higher than their 2010 NJ ASK3 mean scale score, with
both treatments having fairly large effect sizes. For both treatment groups, the 2012 NJ
ASK5 mean scale score of the cohort of students initially scoring Advanced Proficient on
the 2010 NJ ASK3 was significantly lower than their 2010 NJ ASK3 mean scale score,
with both treatments having medium effect sizes.
Summary of performance-level findings. These findings prompted further
inquiry around (a) NJ ASK cut score reliability, (b) differences in difficulty on the 2010
NJ ASK3 and the 2012 NJ ASK5, and (c) differences in NJ ASK cut scores calculations
given the incongruousness of these differences occurring between higher performing and
lower performing groups across both treatments. NJ ASK scale scores have a range of
100 to 300. A student is classified as Partially Proficient if his or her scale score is lower
than 200. A student is classified as Advanced Proficient if his or her scale score is 250 or
higher. All other students are classified as Proficient.

200
Cut score reliability. Significant differences in performance levels could have
resulted from unreliable cut score calculations. The cut score is the point on a score scale
that separates one performance standard from another, thereby defining levels of
performance (Horn, Ramos, Blumer, & Madaus, 2000). The 2010 NJ ASK Grades 3-8
Technical Report calculates and reports cut score reliability as a measure of conditional
standard error, a reliability index (Kappa), and as a classification consistency index.
These statistics are estimates indicating how reliably the test classifies students into the
performance categories Partially Proficient, Proficient, and Advanced Proficient. The
2010 Grade 3 NJ ASK measure of standard error was 3.12. The consistency index, 75%,
indicated hypothetically that 75% percent of the examinees would be assigned to the
same achievement level if the same test was administered a second time or an equivalent
test was administered under the same conditions (NJDOE, 2011).
The 2012 NJ ASK Grades 3-8 Technical Report calculated and reported cut score
reliability as a measure of conditional standard error, whereas the 2012 NJ ASK5 ranges
fell between 2.83 and 3.22 (NJDOE, 2013). Both reports indicate fairly reliable cut score
classifications, suggesting that differences in the performance of the Partially Proficient
cohort and the Advanced Proficient cohort did not result from unreliable cut score
calculations.
Differences in difficulty. Significant differences in performance levels could
have resulted from differing degrees of item difficulty between the NJ ASK3 and the NJ
ASK5. For each NJ ASK administration, statistics are calculated that provide key
information about the “quality of each item from an empirical perspective” (NJDOE,
2011, p. 31). Item difficulty, expressed as a p-value, indicates the percentage of

201
examinees in the sample that answered the item correctly and generally falls within the
range of 0.20 to 0.90. A second calculation, the Item Discrimination Mean (measured as
an r-biserial statistic), reflects the correlation between the item score and the test
criterion score. Ultimately, it is an indication of the differences in the performance of
competent and less competent examinees. The 2010 and 2012 NJ ASK Technical
Reports reflect a similar degree of item difficulty, reporting an overall p-value of 0.67
(SD = 0.09) and a discrimination mean of 0.41 for the 2010 NJ ASK3 and an overall p-
value of 0.68 (SD = 0.13) and a discrimination mean of 0.42 for the 2012 NJ ASK5.
The reported statistics indicate a fairly similar degree of item difficulty on the
2010 NJ ASK3 and the 2012 NJ ASK5, suggesting that differences in the performance of
the Partially Proficient cohort and the Advanced Proficient cohort did not result from
differences in item difficulty.
Differences in the calculation of cut scores. Significant differences in
performance levels could have resulted from differences in the calculation of cut scores
on the NJ ASK3 as compared to the NJ ASK5. Each year, the cut score in raw points that
defines the performance levels on the NJ ASK may vary. Therefore, when comparing
scores across the years, it is important to determine whether any differences in
performance are large enough to suggest a difference in the standard reached (MacCann
& Stanley, 2004). To produce the scale score ranges, linear transformations were applied
to theta estimates and scale scores. Linear transformations can be used to transform raw
scores to scale scores. The NJDOE’s approach was adapted from Kolen and Brennan
(2004), in which raw scores are converted to scale scores by first specifying the scale

202
score equivalents of two raw score points, which, in turn, defines a linear raw-to-scale
score equivalent.
Equation 1: Linear Transformation Formula (NJDOE, 2011, 2013)
The formula presented in Equation 1 was used to obtain the slopes and intercepts for the
transformation functions, where θ2 and θ1 are person parameter estimates that correspond
to the cut score points27, and sc(y1) and sc(y
2) are scale score points. The 2010 NJ ASK
Grades 3-8 Technical Report reported the Grade 3 Proficient Cut Theta as 0.1712,
whereas the 2012 Grade 5 Proficient Cut Theta was 0.07726 (difference = 0.09). The
2010 Grade 3 Advanced Proficient Cut Theta was 1.47, whereas the 2012 Grade 5
Proficient Cut Theta was 1.6988 (difference = 0.22). See Table 74.
A smaller 2012 Grade 5 Proficient Cut Theta could explain the increase in Partial
Proficient means across both treatments. A larger 2012 Grade 5 Advanced Proficient Cut
Theta could explain the significant decrease in Advanced Proficient means across both
treatments. Had the cut score thetas been the same or comparable, significant differences
may not have resulted for the Partially Proficient and Advanced Proficient cohorts.
________________________
27sc(y1) is 200 and sc(y2) is 250
Table 74. Slope and Intercept of Theta to Scale Score Transformation

203
Slope and Intercept of Theta to Scale Score Transformation
Grade
Proficient Advanced Proficient
Slope Intercept
Raw
Score
Theta Scale
Score
Raw
Score
Theta Scale
Score
3 24 0.1731 200 39 1.4775 250 38.76 192.26
5 22 0.0773 200 38 1.6988 250 32.12 195.32
Demographic Findings
Race/ethnicity, addressed through multiple analyses, explained a significant
percentage (12.5%) of performance on the 2012 NJ ASK5. White students (M = 258.64)
performed significantly better than Black28 and Hispanic29 students combined (M =
217.88). Hispanic students (M = 229.86) performed significantly better than Black
students (M = 208.74). Attendance (16.6%) and SES (5.1%) explained a significant
percentage of the variance in the performance of Hispanic students on the 2012 NJ
ASK5.
Summary of demographic findings. Additional calculations showed the 2012
NJ ASK mean scale score of Black students to be close to two standard deviations below
that of White students. The 2012 NJ ASK mean scale score of Hispanic students was one
standard deviation below White students. These findings are consistent with the volumes
___________________________
28 White students (M = 258.64) performed significantly better than Black students (M = 208.78).
29 White students (M = 258.64) performed significantly better than Hispanic students (M = 229.86).

204
of research documenting the achievement gap in education (Brooks-Gunn et al., 1993;
Coleman et al., 1966; Gamoran, 1987; Gottfried et al., 2003; Jencks et al., 1972, 1979;
Lee, Bryk, & Smith, 1993; Smith, et al., 1997). The achievement gap in education refers
to the disparity in academic performance between groups of students (generally using
measures of standardized-test scores, course selection, dropout rates, and college-
completion rates, among other success measures) and is often used to describe
performance gaps between African-American and Hispanic students and their White
counterparts. Achievement gaps between students of different racial/ethnic backgrounds
remain large, with White and Asian/Pacific Islander students typically performing
significantly better than their Black, Hispanic, or American Indian/Alaska Native
counterparts. Studies have found that, on average, Black students score one standard
deviation below White students on standardized tests (NCES, 2009, 2011).
As most research supports that socioeconomic status (SES), closely associated
with race/ethnicity, is one of the strongest predictors of academic achievement (Atweh,
Meaney, McMurchy-Pilkington, Neyland, & Trinick, 2004), these findings are also fairly
consistent with studies examining academic disparities between students from low
income families and those from higher income families. This study revealed that SES
and attendance, more so than any other racial/ethnic subgroup, was a significant predictor
of Hispanic performance.
In one of the earlier and seminal curriculum effectiveness studies, Waite (2001)
found significant achievement differences on the Texas Assessment of Academic Skills
in mathematics for all student subcategories with the exception of Hispanic students,
attributing language barriers to slow student progress in achievement when Everyday

205
Mathematics was used. Difficulties in reading are much more likely to occur among poor
children, non-White children, and non-native speakers of English (Snow, Burns, &
Griffin, 1998). As the ability to understand written text is of paramount importance in
solving math word problems since it requires constructing meaning from text, children
have to have general language comprehension skills and the ability to accurately and
fluently identify written words (Snow, Burns, & Griffin, 1998). The language
proficiencies needed for problem solving may contribute to and possibly compound
differences in the performance of Hispanic students from low-income families compared
to those who are better off. Abedi, Lord, and Hofstetter (1998), in their study of LEP and
non-LEP math performance on a linguistically-modified NAEP assessment, found that
language-related background variables were strong predictors of eighth-grade
performance in math, whereas the length of time residing in the United States was the
strongest predictor of students’ math performance. Students familiar with two languages
may find problem-solving tasks more difficult when administered in the less familiar
language as compared with students who are routinely exposed to standard academic
English and students from homes where English is the only or primary language.
Attendance was also found to be a significant predictor of Hispanic performance
as measured on the 2012 NJ ASK5, explaining a statistically significant proportion of
variance (16.6%). Attendance was documented for all participants for school years 2010-
2011 and 2011-2012 (the two successive years reflected within this study) and reported
as the total possible number of days (370). Further analyses of the variable attendance

206
revealed that of all subgroups11 (Black, White, and Hispanic), Hispanic students had the
following attributes:
• greatest range in attendance, 118 days
• lowest mean attendance, 349 days
• greatest standard deviation for attendance, 19.49
• lowest minimum attendance, 251 days
A correlation analysis also revealed a statistically significant correlation between
Hispanic attendance and the Hispanic 2012 NJ ASK mean scale score. The effect size,
r = 0.408, indicates a moderately strong and positive linear relationship (see Appendix E).
The Hispanic population is currently the largest race or ethnic minority group in
the United States (U.S. Department of the Census, 2012), representing 16.7% of the total
U.S. population and 33.8% of the city of housing the Large Northeastern Urban Public
School District. Researchers who study Hispanic families have suggested that the role of
the family is significant in influencing the school performance of children (Collins,
Maccoby, Steinberg, Hetherrington, & Bornstein, 2000; Trice, Hughes, Odom, Woods, &
McClellan, 1995). Family support also strongly influences the academic achievement
and attendance of Hispanic students (Zoppi, 2006). Given the findings noted within this
study, recommendations for policy, practice, and future study along the lines of
developing a strong collaborative relationship between the Hispanic families and schools
11 Attendance Statistics (Note: Race/ethnicity status Other (N=2) is not reflected in the statistics below).
Black, Range = 53; White, Range = 33 Black, Mean = 354; White, Mean = 356 Black, Standard Deviation = 11.59; White, Standard Deviation = 9.56 Black, Minimum = 317; White, Minimum = 336

207
supported by relevant research (Chrispeels & Rivero, 2002; Delgado-Gaitan, 2004;
Quezada, Diaz & Sanchez, 2003) are discussed in this chapter.
Recommendations for Policy and Practice
As there were no conclusive findings favoring one program over the other, this
study reaffirms that curricular effectiveness, as it is an “integrated judgment based upon a
number of scientifically valid evaluations that combine social values, empirical evidence,
and theoretical rationales” (NRC, 2004, p. 4), cannot be established by a single
scientifically valid study. Instead, a corpus of research-based studies is needed (NRC,
2004) to provide educators with valid, informative, and credible data on curricular
effectiveness. As such, this study along with existing research should serve as a guide in
the selection, development, and refinement of instructional programs (Hiebert, 1999).
Incidental findings such as the significance and effect size of race/ethnicity and
SES and other compelling variables should influence future direction with regard to
implications for education policy and practice. Although this study suggests that
curriculum has small effects on student performance, research supports the correlation
between school-related factors and student achievement and success.
This study found conclusively that background factors relating to a student’s
race/ethnicity and SES were significantly tied to academic achievement. The concern
over achievement gaps in education has been addressed within recent NCLB legislation
calling for the prioritization of funding around state efforts addressing the achievement
gaps between high- and low-performing students, minority and nonminority students, and
disadvantaged students and their more advantaged peers. However, large-scale school
turnaround, takeover, and corporate education reform efforts, also licensed through

208
NCLB’s call to “states and districts willing to take on ambitious, comprehensive reforms”
and characterized by narrowed and test-driven curricula, school closings, competition,
and free-market strategies, rapid charter school expansion, and test-based evaluation of
teachers and school leaders are typically unfounded.
National Level Recommendations
Efforts and initiatives substantially founded on Essentialist perspectives that do
not take into account student background factors will not produce significant or sustained
results. Given the complexity of the variables relating to student background, (including
those variables not explored within this study such as language) national, state, and
district leaders must explore avenues that work toward the goal of mitigating those socio-
economic factors (family income level, parent education level) that research has to tied
long-lasting disparities in student achievement (Brooks-Gunn et al., 1993; Gamoran,
1987; Gottfried et al., 2003; Jencks et al., 1972, 1979; Lee, Bryk, & Smith, 1993; Smith,
et al., 1997). This includes measures impacting poverty (providing equal access to
quality education and healthcare, safe and affordable housing, adequate income supports)
State/District Level Recommendations
At the state and district levels, leadership should develop a local strategy to bring
additional resources into the schools, allowing schools to be more responsive to the needs
of students and families (G.E.D. classes, job training, university partnerships, etc.)
Further, there should be increased efforts to expand universal access to early math start
programs which should include early screening that is inarguably diagnostic in nature and
developmentally appropriate. Early screening can help to identify children in need of
concentrated educational supports or intervention “before failure occurs” (Jordan et al.,

209
2007, p. 36). In almost every state and school district, “children are screened for
potential reading difficulties in the primary grades” (Gersten & Jordan, 2005 as cited by
Jordan et al., 2007, p. 36). However, screening for potential math difficulties is in its
infancy (Gersten, Jordan, & Flojo, 2005). As a result, math difficulties, in a child’s
formative years, are likely to go unnoticed. Studies have tracked the relationship between
early mathematics achievement and later achievement. An understanding of number and
quantity as specific competencies has been found to have a sustained impact on
mathematical understandings beyond the early grades (Duncan et al., 2007; Jordan et al.,
2009; Sarama et al., 2009); therefore, one goal of states and districts should be to improve
the mathematics trajectory of all students.
Additionally, greater investments at the state level need to be made in teacher
education, specifically at the graduate level. High-achieving countries such as Sweden
and Finland invest heavily in graduate level teacher preparation programs aimed at
helping teachers teach “diverse learners – including special education students – for deep
understanding with a strong focus on how to use formative assessments in the service of
student learning” (Darling et al., 2008, p. 6).
School Level Recommendations
Since being introduced by Gene V. Glass in 1976 and spurred by the recent policy
movement toward the process of using scientifically or evidence-based research in
education since the NCLB Act of 2001 (USDOE, 2002), schools are more engaged in
data-driven practices. At the school level, leaders should disaggregate student
achievement data in broader and more meaningful ways, noting patterns in student
attendance, retention, and attrition rates and factoring in variables such as the length of

210
time students have been in the United States and how students are progressing toward the
development of cognitive/academic language proficiency.
As states move toward new standards, curricular materials, and professional
development models, students and classroom teachers should be fully supported. School
leaders should consider “pushing” supports into the classrooms (content coaches, media
specialists, school counselors, special education and English Language Learner supports).
School leaders should also establish and sustain strong and collaborative professional
development partnerships to increase the time in which low-performing, minority, and
disadvantaged students are in front of high quality and competent teachers while
engaging in rigorous and meaningful mathematics.
Recommendations for Future Study
The recommendations for future research are based on the theory that multiple
studies, set in multiple environments, will result in patterns that allow us to determine
which curricula are most effective in varied circumstances (Bhatt et al., 2012; Hiebert,
1999; NRC, 2004; Slavin et al., 2008). Many of the recommendations below suggest
revisiting this study once New Jersey’s statewide assessment measure, the New Jersey
Assessment of Knowledge and Skills, is replaced in 2014-2015 by the Common Core
State Standards aligned Partnership for Assessment of Readiness for College and Careers
(PARCC) assessment. The recommendations for future research follow:
Recommendation 1
Present sixth, seventh, and eighth grade (middle school) students within the Large
Northeastern Urban Public School District were third, fourth, and fifth grade students,
respectively, at the inception of the Singapore Math pilot. Over time, each piloting site

211
extended the Singapore Math program into its middle school classrooms while each non-
piloting site transitioned to the Connected Mathematics Project, another of the NSF-
endorsed curriculum projects. Standardized assessment data for Grades 3-8, in addition to
other meaningful indicators of performance, can be used to make longitudinal
comparisons to determine the differential effects of treatment over multiple years. Future
research could replicate the current study to measure student mathematics achievement
on a longitudinal basis.
Recommendation 2
This study used NJ ASK performance data to show how two elementary school
mathematics curricula impacted student performance. The PARCC assessments, which
will be ready for states to administer during the 2014-15 school year, will replace state
tests currently used to meet the requirements of the federal Elementary and Secondary
Education Act. The PARCC assessments are intended to be an improved measure of
students’ problem solving, communication, and reasoning skills. Using the 2014-2015
PARCC assessment as the dependent measure, future research could extend the current
study, using the same intact groups to measure mathematics performance.
Recommendation 3
As District Factor Groupings are closely tied to socioeconomic status (a variable
typically found to be a significant predictor of student performance), future research
could expand the current study to include other schools/districts in the same district factor
groupings that are using the programs explored in this study. This would increase the
sample size, thereby achieving greater degrees of statistical power (Cohen, 1988).

212
Recommendation 4
This study did not include the analyses of individual clusters in the research
design due to reported 2012 NJ ASK5 reliability coefficient alphas with ranges from .41 -
.78 per cluster (NJDOE, 2013). Future research could expand the current study, using
reliable standardized assessment measures as well as additional assessment measures
(performance-based assessments) to conduct statistical analyses based on CCSS domain
performance12.
Recommendation 5
At the time of this study, the NJ ASK tests were aligned to New Jersey State’s
Core Curriculum Content Standards (NJCCCS). Since the NJCCCS for mathematics
were philosophically aligned with the NCTM standards (1989, 2000), as is the Everyday
Mathematics program, the Everyday Math Alternative Treatment group had a presumed
degree of advantage over the Singapore Math Experimental Treatment group. Therefore,
this study could be refocused to determine if either program was more closely aligned to
the NJ ASK, using a content analysis procedure (such as the Surveys of Enacted
Curriculum), which compares the alignment or misalignment of “any two documents of
content standards, assessments, curriculum materials, and instructional practices”
(Martone & Sireci, 2009 as cited by Porter et al., 2011, p. 104), “defining content at the
intersections of topics and cognitive demands” (p. 104).
Recommendation 6
This study delimited the population to general education students who, at the time
of the administration of the NJ ASK3 and NJ ASK5, were not identified as special
12 The NJDOE adjusted the 3-5 NJASK in 2012-2013 and the 6-8 NJASK in 2013-2014 to align to the Common Core State Standards; no longer reporting cluster data. Data are reported in ‘domains’ reflective of the Common Core State Standards for Mathematics.

213
education classified or Limited English Proficient classified. After establishing adequate
comparability of the treatment groups, future research could replicate the current study to
include special classifications of students initially excluded from this study.
Recommendation 7
While reading level may contribute to variances observed in mathematics
performance (Sconiers et al., 2002), this study did not control for reading level. Using
the same intact groups, future research could replicate the current study to examine the
influence of reading level on student mathematics achievement, using NJ ASK 3 and 5
Language Arts Literacy scores as additional independent variables.
Recommendation 8
Whereas language-related background variables such as the length of time in
which LEP and non LEP students reside in the United States was found to be a strong
predictor of student mathematics performance (Abedi et al., 1998), future research could
replicate the current study to examine the mathematics achievement differences between
foreign-born and native-born Hispanic students after establishing adequate comparability
of the treatment groups.
Recommendation 9
This study defined a student’s socioeconomic status (SES) based upon New
Jersey Department of Education guidelines which use the status attributed to a student
qualifying for free or reduced-price lunch. This measure is based upon family income
level, parents' educational attainment, and parents' occupation as defined by the U.S.
government under the National School Lunch Program (NLSP). While SES typically
serves as a proxy for a composite of factors ultimately denoting parent income level,

214
additional family background characteristics are worthy of consideration (language,
culture, parenting styles, and parents’ involvement in child’s education). Future research
could incorporate a qualitative design that explores family background characteristics and
mathematics achievement in schools using a CCSSM-aligned mathematics program as
compared to schools using a NCTM-aligned elementary mathematics program.
Recommendation 10
Whereas this study incorporated a quantitative methodology, future research
could incorporate a descriptive-qualitative design that explores the influence of teacher
variables (teacher affect, degree of mathematics professional development, mathematics
content knowledge) on student perceptions in schools using a CCSSM-aligned
mathematics program as compared to schools using a NCTM-aligned elementary
mathematics program. Such methods may prove to benefit the body of research around
curriculum effectiveness.
Recommendation 11
Whereas this study incorporated a non-experimental design, this study could be
redesigned to incorporate a more purposeful experimental or quasi-experimental design
that increases the number of students assigned to each treatment; one group using the
Singapore Math Experimental Treatment, the other using the widely established program,
Everyday Mathematics. The redesigned study should employ a combination of
methodologies such as those recommended by the NRC (2004) (embedding a content
analysis, documenting the extent of coverage or opportunity to learn, delineating
alignment to assessed skills, including multiple forms of student outcomes and indicators
sensitive to curricular effects).

215
Recommendation 12
This study could be redesigned to incorporate a hierarchical linear modeling
(HLM) statistical design analysis methodology in order to examine differences in
achievement at the student and classroom levels. While ANOVA is appropriate to a
“tremendous variety of designs” (Raudenbush, 1993, p. 459), its methods “are not widely
applicable in larger-scale experiments when the data are unbalanced with some predictors
that are continuous” (p. 460). While regression allows for a mix of discrete and
continuous predictors, its benefits “are only available in fixed-effects models” (p. 461).
HLM duplicates the results of standard ANOVA but “extends the study of fixed and
random effects to include unbalanced data, predictors that are either continuous or
discrete, and random effects that co-vary” (p. 459). Applying a general two-level HLM
would allow the exploration of achievement at the student level, using level one factors
such as prior achievement, SES, gender, race/ethnicity, and attendance and at the
classroom-level, using level two factors such as extent of implementation, teacher content
knowledge (addressed via proxies such as degree attainment), and hours of content-
specific professional development.
Summary
Chapter I of this research study provided background information detailing the
current U.S. reform policies and efforts designed to encourage states to address gaps in
achievement specific to the STEM-related fields believed to influence economic growth.
As states begin the work of selecting new standards-aligned materials, this study uses
research-based methodology to provide timely and credible data on curricular
effectiveness, specifically data on the effectiveness of the two elementary school

216
mathematics curricula presented in this study. Chapter I included the purpose of the
study, statement of the problem, research questions, research hypotheses, significance of
the study, research design, limitations and delimitations of the study, and definitions of
relevant terms.
Chapter II provided a review of the relevant literature, depicting historical factors
relating to mathematics reform, research about mathematics learning, and concluding
with current findings relating to seminal studies in the field of curriculum effectiveness,
their documented impact on student achievement, and current studies relating to the
programs explored in this study.
Chapter III presented the setting for the study, treatment, participants, subsidiary
research questions and their accompanying null hypotheses, research design, data
collection, instrumentation, instrument reliability and validity, procedures, and methods
of data analysis.
Chapter IV presented the results and findings of this study. Multiple data analyses
were conducted and the results were reported and summarized to answer the seven
research questions and test the accompanying hypotheses, reporting the magnitude,
statistical significance, and validation of results.
Chapter V presented the findings and conclusions, providing potential
implications for theory, knowledge, practice, policy, and future research.
Final Thoughts
In the final analysis, broader questions arise. Do mathematics curricula matter,
and can schools use school-level resources to mitigate the negative effects of
disadvantage? While more research on the performance of disadvantaged students in

217
mathematics education is needed, it is important to note that disadvantage is not an
inherent construct of a student’s background as much as it is “relational and depend[s] on
the norms and practices within which students from diverse backgrounds have to
integrate” (Willis, 1998, as cited by Atweh et al., 2004, p. 8). If schools are to mitigate
the negative effects of disadvantage using school-level resources, namely curriculum in
its broader sense (the total learning experiences of the individual), then educational
structures must present a balance between delivering knowledge and the experiences of
the student (Dewey, 1902).
It is then the job of school leaders to cultivate a system of more progressive
practices where the student is not only factored into the equation, but is at its center. This
thinking encourages schools to establish a paradigm that emphasizes Tyler’s (1949)
educational imperatives whereby the structure of the school curriculum is responsive to
three central factors: (1) the nature of the learner (developmental factors, learner interests
and needs, life experiences, (2) the values and aims of society (democratizing principles,
values, and attitudes), and (3) knowledge of subject matter (what is believed to be worthy
and usable knowledge). This paradigm requires comprehensive and accurate methods for
determining progress (and failure) in learning, assessing the appropriateness of the
curriculum, and detecting the root causes of the observed effects. While this paradigm
does not necessarily eliminate the debate, it "mediates the hard edges of Essentialism"
(Christopher Tienken, personal communication, July14, 2010) by providing a basis for
more evolved and systemic approaches, at the school level, for assessing progress.
Assessment then becomes a learning-based measure that assesses both student
performance and the instructional model itself. Growth is sampled over time. Myopic

218
measures that assess only cognitive ability levels are deemphasized; and large-scale
multiple indexes such as student perception, engagement, and other “messy” variables are
considered. As second-order change is a gradual process, it is understood that “quick fix”
remedies are unlikely to make a long-term impact on the beliefs and practices so firmly
embedded in the traditional practices of mathematics classrooms. Rather, sustainable and
scalable approaches occurring at the school and governing levels, closest to the students,
are needed. These approaches should promote creativity, diversity, and equity.
Therefore, it is this researcher’s final recommendation that schools (1) promote a
shared commitment for curricular improvement and responsiveness, and (2) provide all
stakeholders with the time, resources, technical assistance, and expertise needed for
engaging in systemic efforts toward providing all students with the “knowledge and
experiences that enable them to grow in exercising intelligent control of subsequent
knowledge and experience” (Tanner & Tanner, 2007, p. 191). This and future
curriculum studies should serve to support schools in meeting these goals.

219
REFERENCES
Abedi, J., Lord, C., & Hofstetter, C. (1998). Impact of selected background variables on
students’ NAEP math performance. Los Angeles, CA: UCLA Center for the
Study of Evaluation/National Center for Research on Evaluation, Standards, and
Student Testing.
Achieve, (2008). The building blocks of success: Higher level math for all students.
Retrieved from www.achieve.org/files/BuildingBlocksofSuccess.pdf
Agodini, A., & Harris, B. (2011). Curriculum matters: Evidence from a randomized
control trial of four elementary schools. SREE Fall 2011 Conference Abstract
(pp. 1-4). Retrieved from www.sree.org/conferences/2011f/program/downloads/
abstracts/247.pdf
Agodini, R., Harris, B., Atkins-Burnett, S., Heaviside, S., Novak, T., & Murphy, R.
(2009). Achievement effects of four early elementary school math curricula:
Findings from first graders in 39 schools (NCEE 2009-4052). Washington, DC:
U.S. Department of Education, National Center for Education Evaluation and
Regional Assistance, Institute of Education Sciences (NCEE 2009-4052).
Ai, X., & Rivera, N. (2003). Linking ideas to practice: Effectiveness of coaching upon
teacher practice. Paper presented at the annual meeting of the American
Educational Research Association, Chicago, IL
American Institutes for Research. (2005). What the United States can learn from
Singapore's world-class mathematics (and what Singapore can learn from the
United States): An exploratory study. Washington, DC: Author. Retrieved from

220
www.air.org/news/documents/Singapore%20Report%20(Bookmark%20Version).
Amrein, A. L., & Berliner, D. C. (2002). High-stakes testing, uncertainty, and student
learning. Educational Policy Analysis Archives, 10(18). Retrieved from
http://epaa.asu.edu
Anthony, G., & Walshaw, M. (2009). Characteristics of effective teaching of
mathematics: A view from the west. Journal of Mathematics Education, 2(2),
147-164.
Atweh, B., Meaney, T., McMurchy, C., Neyland, J., & Trinick, T. (2004). Social justice
and sociocultural perspectives. In B. Perry, G. Anthony, & C. Diezmann (Eds.),
Research in mathematics education in Australasia 2000-2003 (pp. 29-52).
Brisbane, Australia: Post Pressed.
Balfanz, R. & Byrnes, V. (2012). Chronic absenteeism: Summarizing what we know from
nationally available data. Baltimore, MD: Johns Hopkins University Center for
Social Organization of Schools.
Ball, D. L., & Bass, H. (2003). Toward a practice-based theory of mathematical
knowledge for teaching. In B. Davis & E. Simmt (Eds.), Proceedings of the 2002
annual meeting of the Canadian Mathematics Education Study Group (pp. 3-14).
Edmonton, AB: CMESG/GDEDM.
Ball, D. L., Hill, H. H., & Bass, H. (2005, Fall). Knowing mathematics for teaching: Who
knows mathematics well enough to teach third grade, and how can we decide?
American Educator, 14-46.
221
Baxter, J. A., Woodward, J., & Olson, D. (2001). Effects of reform-based mathematics
instruction on low achievers in five third-grade classrooms. Elementary School
Journal, 101(5), 529-547.
Berends, M., Lucas, S. R., Sullivan, T. & Briggs, R. J. (2005). Examining gaps in
mathematics achievement among racial-ethnic groups, 1972-1992. Santa
Monica, CA: RAND Corporation. Retrieved from
http://www.rand.org/pubs/monographs/MG255 (Also available in print form).
Bhatt, R., & Koedel, C. (2012). Large-scale evaluations of curricular effectiveness: The
case of elementary mathematics in Indiana. Educational Evaluation and Policy
Analysis, 34(4), 391-412.
Bloom, H. S., Black, A. R., Hill, C. J., & Lipsey, M. W. (2008). Empirical benchmarks
for interpreting effect sizes in research. Child Development Perspectives,
2(3),172-177.
Bohon, S. A., Johnson, M. K., & Gorman, B K. (2006). College aspirations and
expectations among Latino adolescents in the United States. Social Problems,
53(2), 207–225.
Booth, J. L., & Siegler, R. S. (2006). Developmental and individual differences in pure
numerical estimation. Developmental Psychology, 41, 189–201.
Bozick, R., Ingels, S. J., & Owings, J. A. (2008). Mathematics coursetaking and
achievement at the end of high school: Evidence from the education longitudinal
study of 2002 (Statistical Analysis Report). Washington, DC: U.S. Department of
Education, National Center for Education Statistics. Retrieved from
nces.ed.gov/pubsearch/pubsinfo.asp?pubid=2008319

222
Braams, B. (2003). Spiraling through UCSMP everyday mathematics. Retrieved from
http://www.math.nyu.edu/mfdd/braams/links/emspiral.html [8/27/03]
Braun M. T. (2011, June). Exploratory regression analysis: A tool for selecting models
and determining predictor importance. Behavior Research Methods, 43(2), 331-
339. doi: 10.3758/s13428-010-0046-8
Brooks-Gunn, J., Guo, G., & Furstenberg, F. (1993). Who drops out of and who
continues beyond high school? Journal of Research on Adolescence, 3, 271–294.
Brooks-Gunn, J., Duncan, G. J., Klebanov, P. K., & Sealand, N. (1993). Do
neighborhoods influence child and adolescent development? American Journal of
Sociology, 99(2), 353-395.
Brooks-Gunn, J., Klebanov, P. K., & Duncan, G. J. (1996). Ethnic differences in
children’s intelligence test scores: Role of economic deprivation, home
environment, and maternal characteristics. Child Development, 67, 396–408.
Bull, R., Espy, K., & Wiebe, S. A. (2008). Short-term memory, working memory, and
executive functioning in preschoolers: Longitudinal predictors of mathematical
achievement at age 7 years. Developmental Neuropsychology, 33(3), 205-228. doi
10.1080/87565640 801982312
Carnevale, A. P., & Desrochers, D. M. (n. d.). The democratization of
mathematics. Paper prepared for the National Forum on Quantitative Literacy.
Retrieved from www.maa.org/ql/pgs21_31.pdf
Carnevale, A. P., & Desrochers, D. M. (2003). Standards for what? The
economic roots of K-16 reform. Princeton, NJ: Educational Testing Service.
Retrieved from www.learndoearn.org/For-Educators/Standards-for-What.pdf

223
Carroll, W. M. (2001). Students in a standards-based mathematics curriculum:
Performance on the 1999 Illinois State Achievement Test. Illinois Mathematics
Teacher, 52(1), 3-7.
CCSSO/NGA. (2010). Common core state standards for mathematics. Washington, DC:
Council of Chief State School Officers and the National Governors Association
Center for Best Practices. Retrieved from http://corestandards.org/
Chingos, M. M., & Whitehurst, G. J. R. (2012). Choosing blindly: Instructional
materials, teacher effectiveness, and the common core. Washington, DC: Brown
Center on Education Policy at Brookings Institute. Retrieved from
http://www.brookings.edu/~/media/research/files/reports/2012/4/10%20curriculu
m%20chingos%20whitehurst/0410_curriculum_chingos_whitehurst.pdf
Chrispeels, J. H., & Rivero, E. (2001). Engaging Latino families for student success:
How parent education can reshape parents' sense of place in the education of their
children. Peabody Journal of Education, 76(2), 1-29.
Clements, D. H., & Sarama, J. (2004). Learning trajectories in mathematics education
[Special issue]. Mathematical Thinking and Learning, 6(2).
Clements, D. H., & Sarama, J. (2009). Learning and teaching early math: The learning
trajectories approach. New York, NY: Routledge.
Coleman, J. S., Campbell, E. Q., Hobson, C. J., McPartland, J., Alexander M. Mood, A.
M., Weinfeld, F. D., & York, R. L. (1966). Equality of Educational Opportunity.
Washington, DC: U.S. Department of Health, Education, and Welfare, Office of
Education.

224
Common Core Standards Writing Team. (2011). Progressions for the Common Core
State Standards in Mathematics: K–5, Number and Operations in Base Ten.
Retrieved from http://commoncoretools.files.wordpress.com/2011/04/
ccss_progression_nbt_2011_04_073.pdf
Confrey, J., & Kazak, S. (2006). A 30-year reflection on constructivism. In A. Gutierrez
& P. Boero (Eds.), Handbook of research on the psychology of mathematics
education: Past, present and future (pp. 305-346). Rotterdam, The Netherlands:
Sense.
Conley, D. T. (2003). Understanding university success. A Report from Standards for
Success, a project of the Association of American Universities and the Pew
Charitable Trusts. Retrieved from www.s4s.org/UUS_Complete.pdf
Conley, D. T. (2003, January). Standards for success: What it takes to succeed in entry-
level university courses. Paper presented at the annual meeting of the American
Association of Colleges and Universities, Seattle, WA.
Conley, D. T. (2007). Redefining college readiness. Eugene, OR: Educational Policy
Improvement Center.
Cooper, H. M. and Lindsay, J. J. (1998). Research synthesis and meta-analysis. L.
Bickman, & D. J. Rog (Eds.), Handbook of applied social research methods (pp.
3-16). Thousand Oaks, CA: Sage.
Corcoran, T., Mosher, F. A., & Rogat, A. (2011). Learning progressions in mathematics:
A foundation for standards, curriculum, instruction, and assessment (Research
Report #RR-63). Philadelphia, PA: Consortium for Policy Research in Education.
Cuoco, A. A. (n.d.). Beyond problem solving: Mathematics as a way of thinking

225
about things. Paper prepared for the Education Development Center, New York.
Cuoco, A. A., Goldenberg, E. P., & Mark, J. (1997). Habits of mind: An
organizing principle for mathematics curriculum. Journal of Mathematical
Behavior, 15(4), 375-402.
Darling-Hammond, L., & McCloskey, L. (2008). Assessment for learning around the
world: What would it mean to be internationally competitive? Phi Delta Kappan,
90, (4), 263-272.
Daro, P., McCallum, B., & Zimba J. (2012). The K–8 publishers’ criteria for the
Common Core State Standards for Mathematics. Retrieved from
http://www.corestandards.org/assets/Math_Publishers_Criteria_K-
8_Summer%202012_FINAL.pdf
Davies, M., & Kandel, D. B. (1981). Parental and peer influences on adolescents'
educational plans: Some further evidence. American Journal of Sociology, 87,
363-387
Deary, I. J., Strand, S., Smith, P., & Fernandes, C. (2007). Intelligence and educational
achievement. Intelligence, 35, 13–21.
Delgado-Gaitán, C. (1991). Involving parents in the schools: A process of empowerment.
American Journal of Education, 100(1), 20-46.
Delgado-Gaitán, C. (2004). Involving Latino families in schools: Raising student
achievement through home-school partnerships. Thousand Oaks, CA: Corwin
Press, SAGE.
Dewey, J. (1902). The child and the curriculum. Chicago, IL: University of Chicago
Press.

226
Dindyal, J. (2006, July). The Singaporean mathematics curriculum: Connections to
TIMSS. In P. Grootenboer, R. Zevenbergen, & M. Chinnappan (Eds.),
Proceedings of the 29th annual conference of the mathematics education
Research group of Australasia, 1, 179-186.
Dorn, S. (2003). High-stakes testing and the history of graduation. Education Policy
Analysis Archives, 11(1), 1-29.
Duncan, G. J., & Brooks-Gunn, J. (1997). Income effects across the life-span: Integration
and interpretation. In G. J. Duncan & J. Brooks-Gunn (Eds.), Consequences of
growing up poor. New York, NY: Russell Sage Foundation.
Duncan, G. J., Chantelle J., Dowsett, A., Claessens, K. M., Aletha C. Huston,A. C.,
Pamela Klebanov, P., Pagani, L. S., Feinstein, L., Engel, M., Brooks-Gunn, J.,
Sexton, H., Duckworth, K., & Japel, C. (2007). School readiness and later
achievement. Developmental Psychology, 43,(6), 1428, Retrieved from
http://dx.doi.org/10.1037/0012-1649.43.6.1428.supp
Durbin, J., & Watson, G. S. (1950). Testing for serial correlation in least squares
regression, I. Biometrika, 37(3–4), 409–428. JSTOR 2332391
Durbin, J., & Watson, G. S. (1951). Testing for serial correlation in least squares
regression, II. Biometrika, 38(1–2), 159–179. JSTOR 2332325
Dynarski, M., Clarke, L., Cobb, B., Finn, J., Rumberger, R., & Smink, J. (2008). Dropout
prevention: A practice guide (NCEE 2008–4025). Washington, DC: U.S.
Department of Education. National Center for Education Evaluation and Regional
Assistance, Institute of Education Sciences. Retrieved from
http://ies.ed.gov/ncee/wwc.

227
Editorial Projects in Education (2011). Diplomas count: Beyond high school, before
baccalaureate. Education Week, 30(34). Retrieved from
http://www.edweek.org/go/dc11
Else-Quest, N. M., Hyde, J. S., & Linn, M. C. (2010). Cross-national patterns of gender
differences in mathematics achievement, attitudes, & affect: A meta-analysis.
Psychological Bulletin, 136, 103-127.
Embretson, S. E. (1995). The role of working memory capacity and general control
processes in intelligence. Intelligence, 20(2), 169-189.
Epstein, J. L., & MacIver, D. J. (1992). Opportunities to learn: Effects on eighth graders
of curriculum offerings and instructional approaches. Baltimore, MD: The Johns
Hopkins University, Center for Research on Effective Schooling for
Disadvantaged Students.
Fordham, S., & Ogbu, J. U. (1986). Black students’ school success: Coping with the
burden of ‘‘acting White.’’ The Urban Review, 18, 176–206.
Fuson, K. C., Carroll, W. M., & Drueck, J. V. (2000). Achievement results for second
and third graders using the standards-based curriculum Everyday Mathematics.
Journal for Research in Mathematics Education, 31(3), 277-295.
Gamoran, A. (1987). The stratification of high school learning opportunities. Sociology of
Education, 60, 135-155.
Gamoran, A, & Hannigan, E. (2000). Algebra for everyone? Benefits of college-
preparatory mathematics for students with diverse abilities in early secondary
school. EPAA, 22(3), 241-254.

228
Gaumer-Erickson, A. S., Kleinhammer-Tramill, J., & Thurlow, M. L. (2007). An
analysis of the relationship between high school exit exams and diploma options
and the impact on students with disabilities, Journal of Disability Policy Studies,
18, (1), 117-128. Retrieved from
http://www.redorbit.com/news/education/1086577/an_analysis_of_the_relationshi
p_between_high_school_exit_exams/
Geary, D. C. (2011). Cognitive predictors of achievement growth in mathematics: A 5-
year longitudinal study. Developmental Psychology, 47(6), 1539-1552.
doi:10.1037/a0025510
Geary, D. C., Bow-Thomas, C. C., & Yao, Y. (1992). Counting knowledge and skill in
cognitive addition: A comparison of normal and mathematically disabled
children. Journal of Experimental Child Psychology, 54, 372-391.
Gersten, R., Jordan, N. C., & Flojo, J. R. (2005). Early identification and interventions
for students with mathematics difficulties. Journal of Learning Disabilities, 38,
293-304.
Ginsburg, A., Leinwand, S., Anstrom, T. & Pollock, E. (2005). What the United States
can learn from Singapore’s world-class mathematics system. Washington, DC:
American Institutes for Research.
Ginsburg, P. H., & Baroody, A. J. (2003). Test of early mathematics ability examiner’s
manual. Austin, TX: Pro-ed.
Goldman, M., Retakh, V., Rubin, R., & Munnigh, H. (2009). The effect of Singapore
mathematics on student proficiency in a Massachusetts school district: A
longitudinal statistical examination. Bryn Mawr, PA: The Gabriella and Paul

229
Rosenbaum Foundation. Retrieved from http://www.utahsmathfuture.com/
SM_NMRSD_Report.pdf
Gottfried, A. W., Gottfried, A. E., Bathurst, K., Guerin, D. W., & Parramore, M. M.
(2003). Socioeconomic status in children’s development and family environment:
Infancy through adolescence. In M. H. Bornstein & R. H. Bradley (Eds.),
Socioeconomic status, parenting and child development (pp. 189–207). Mahwah,
NJ: Lawrence Erlbaum Associates.
Gottfried, M. A. (2009). Excused versus unexcused: How student absences in elementary
school affect academic achievement. Educational Evaluation and Policy Analysis,
31(4), 392–415.
Great Source. (2009). Math in focus: The Singapore approved research base. Boston,
MA: Houghton Mifflin Harcourt Publishing Company.
Halle, T., Kurtz-Costes, B., & Mahoney, J. (1997). Family influences on school
achievement in low-income, African American children. Journal of Educational
Psychology, 89, 527–537.
Hiebert, J., & Grouws, D. A. (2007). The effects of classroom mathematics teaching on
students‘ learning. In F. K. Lester (Ed.), Second handbook of research on
mathematics teaching and learning (pp. 371-404). Charlotte, NC: Information
Age Publishers.
Hill, H. C., & Ball, D. L. (2004). Learning mathematics for teaching: Results from
California’s Mathematics Professional Development Institutes. Journal of
Research in Mathematics Education, 35, 330-351.

230
Hill, H. C., Rowan, B., & Ball, D. L. (2005). Effects of teachers' mathematical
knowledge for teaching on student achievement. American Educational Research
Journal, 42(2), 371-406.
Hoven, J., & Garelick, B. (2007). Singapore math: Simple or complex? Educational
Leadership, 65(3), 28-36.
Hwang, J., McMaken, J., Porter, A., and Yang, R. (2011). Common Core Standards: The
new U.S. intended curriculum. Educational Researcher, 40, (3), 103-116.
Hyde, J. S., Fennema, E., & Lamon, S. (1990). Gender differences in mathematics
performance: A meta-analysis. Psychological Bulletin, 107, 139–155.
Isaacs, A. C., Carroll, W., & Bell, M. (2001). A research-based curriculum: The research
basis of the UCSMP Everyday Mathematics curriculum. Chicago, IL: University
of Chicago School Mathematics Project Elementary Component.
Jencks, C. (1979). Who gets ahead? The determinants of economic success in America.
New York, NY: Basic Books.
Jencks, C., & Phillips, M., Eds. (1998). The black-white test score gap. Washington DC.:
Brookings Institution Press.
Jensen A. R. (1998). The g factor: The science of mental ability. Westport, CT: Praeger.
Jordan, N. C., Kaplan, D., Ramineni, C., & Locuniak, M. N. (2009). Early math matters:
Kindergarten number competence and later mathematics outcomes.
Developmental Psychology, 45(3), 850-867.
Kamii, C., & Dominick, A. (1998). The harmful effects of algorithms in grades 1-4. In
L.J. Morrow & M. J. Kenney (Eds.), The teaching and learning of algorithms in

231
school mathematics (pp. 130-140). Reston, VA: National Council of Teachers of
Mathematics.
Kamii, C., & Joseph, L. L. (1989). Young children continue to reinvent arithmetic: 2nd
grade: Implications of Piaget's theory. New York, NY: Teachers College Press.
Klein, D. (2000). Weaknesses of everyday mathematics K-3. (Unpublished manuscript).
Retrieved from http://www.math.nyu.edu/mfdd/braams/nychold/report-klein-em-
00.html
Kober, N., & Rentner, D. (2011). Common Core State Standards: Progress and
challenges in school districts’ implementation. Center on Education Policy.
Retrieved from http://www.cep-dc.org/displayDocument.cfm?DocumentID=374
Koedel, C., & Bhatt, R. (2013, April 4). Which materials? Evaluating curricular
effectiveness [Web log comment]. Retrieved from
http://www.edpolicyinca.org/blog/which-materials-evaluating-curricular-
effectiveness
Kolen, M. J., & Brennan, R. L. (2004). Test equating, scaling, and linking: Methods and
practices (2nd ed.). New York, NY: Springer-Verlag
Kovas, Y., Haworth, C. M. A., Harlaar, N., Petrill, S. A., Dale, P. S., & Plomin, R.
(2007). Overlap and specificity of genetic and environmental influences on
mathematics and reading disability in 10‐year‐old twins. Journal of Child
Psychology and Psychiatry, 48, 914‐922.
Krajewski, K., & Schneider, W. (2009). Early development of quantity to number-word
linkage as a precursor of mathematical school achievement and mathematical

232
difficulties: Findings from a four-year longitudinal study. Learning and
Instruction, 9, 513–526. doi: 10.1016/j.learninstruc.2008.10.002
LaMarca, P. M, Redfield, D., Winter, P. C., Bailey, A. & Despriet, L. H. (2000). State
standards and state assessment systems: A guide to alignment. Washington, DC:
Council of Chief State School Officers. Retrieved from http://www.eric.ed.gov/
ERICDocs/data/ericdocs2sql/content_storage_01/0000019b/80/1a/33/5d.pdf
Leder, G. (1992). Mathematics and gender: Changing perspectives. In D. A. Grouws,
(Ed.), Handbook of Research on Teaching and Learning Mathematics (pp.597-622).
New York, NY: Macmillan.
Lee, V. E., & Bukam, D. T. (2003). Dropping out of high school: The role of school
organization and structure. American Educational Research Journal, 40(2), 353-
393.
Lee, V. E., Bryk, A., & Smith, J. (1993). The organization of effective secondary schools.
Review of Research in Education, 19, 171.
Leung, Shing On (2003). A practical use of vertical equating by combining IRT equating
and linear equating. Practical Assessment, Research & Evaluation, 8(23).
Retrieved from http://PAREonline.net/getvn.asp?v=8&n=23.
Libertus, M. E., Feigenson, L., & Halberda, J. (2011). Preschool acuity of the
approximate number system correlates with school math ability. Developmental
Science, 14(6), 1292-1300. doi: 10.1111/j.1467-7687.2011.01080.x
Locuniak, M. N., & Jordan, N. C. (2008). Using kindergarten number sense to predict
calculation fluency in second grade. Journal of Learning Disabilities, 41(5), 451-
459.

233
MacCann, R. G., & Stanley, G. (2004). Estimating the standard error of the judging in a
modified-angoff standards setting procedure. Practical Assessment, Research &
Evaluation, 9(5). Retrieved from http://PAREonline.net/getvn.asp?v=9&n=5
Madison, B., & Steen, L. (2003). Quantitative literacy: Why numeracy matters for
schools and colleges. Princeton, NJ: National Council on Education and the
Disciplines.
Marshall Cavendish Education. (2010a). Grade 3 math in focus: Singapore math 3A
[Teacher's edition]. Boston, MA: Houghton Mifflin Harcourt Publishing.
Marshall Cavendish Education. (2010b). Grade 3 math in focus: Singapore math 3B
[Teacher's edition] Boston, MA: Houghton Mifflin Harcourt .Company.
Marshall Cavendish Education. (2010c). Grade 4 math in focus: Singapore math 4A
[teacher's edition]. Boston, MA: Houghton Mifflin Harcourt Publishing.
Marshall Cavendish Education. (2010d). Grade 4 math in focus: Singapore math 4B
[Teacher's edition]. Boston, MA: Houghton Mifflin Harcourt Publishing.
Marshall Cavendish Education. (2010e). Grade 5 math in focus: Singapore math 5A
[Teacher's edition]. Boston, MA: Houghton Mifflin Harcourt Publishing.
Marshall Cavendish Education. (2010f). Grade 5 math in focus: Singapore math 5B
[Teacher's edition]. Boston, MA: Houghton Mifflin Harcourt Publishing.
Marshall Cavendish Education. (2010g). Math in focus: The Singapore approach
research base. Boston, MA: Houghton Mifflin Harcourt Publishing. Retrieved
from www.barrington220.org/site/handlers/filedownload.ashx?...pdf

234
McKnight, C. C., Crosswhite, F. J., Dossey, J. A., Kifer, E., Swafford, J. O., Travers, K.
J., & Cooney, T. J. (1987). The underachieving curriculum: Assessing U.S. school
mathematics from an international perspective. Champaign, IL: Stipes.
Mullis, I. V. S., Martin, M. O., Foy, P., & Arora, A. (2012). TIMSS 2011 international
results in mathematics. Chestnut Hill, MA: TIMSS & PIRLS International Study
Center, Boston College.
National Center for Education Statistics (2007). The condition of education special
analysis: High school coursetaking. Retrieved from
nces.ed.gov/programs/coe/2007/analysis/2007065.pdf
National Center for Education Statistics (2009). The nation’s report card: Mathematics
2009 (NCES 2010–451). Washington, DC: U.S. Department of Education,
Institute of Education Sciences.
National Center for Education Statistics (2011). The nation’s report card: Mathematics
2011 (NCES 2012–458). Washington, DC: U.S. Department of Education,
Institute of Education Sciences.
National Commission on Excellence in Education. (1983). A Nation at Risk: The
Imperative for Educational Reform. Washington, DC: National Commission on
Excellence in Education.
National Council of Teachers of Mathematics. (1980). An agenda for action: Directions
for school mathematics for the 1980s. Reston, VA: Author.
National Council of Teachers of Mathematics. (1989). Curriculum and evaluation
standards for school mathematics. Reston, VA: Author.

235
National Council of Teachers of Mathematics. (1991). Professional standards for
teaching mathematics. Reston, VA: Author.
National Council of Teachers of Mathematics. (1995). Assessment standards for school
mathematics. Reston, VA: Author.
National Council of Teachers of Mathematics. (2000). Principles and standards for
school mathematics. Reston, VA: Author.
National Council of Teachers of Mathematics. (2006). Curriculum focal points for
prekindergarten through grade 8 mathematics: A quest for coherence. Reston,
VA: Author. Retrieved from www.nctmmedia.org/cfp/full_document.pdf
National Governors Association Center for Best Practices & Council of Chief State
School Officers. (2010). Common Core State Standards for English language arts
and literacy in history/social studies, science, and technical subjects. Washington,
DC: Author.
National Mathematics Advisory Panel. (2008). Foundations for success: The final report
of the National Mathematics Advisory Panel. Washington, DC: U.S. Department
of Education. Retrieved from www.ed.gov/about/bdscomm/list/mathpanel/
report/final-report.pdf
National Research Council. (1998). Everybody counts: A report to the nation on the
future of mathematics education. Washington, DC: National Academy Press.
Retrieved from www.nap.edu/openbook.php?isbn=0309039770
National Research Council. (2001). Adding it up: Helping children learn mathematics.
Washington DC: National Academy Press.
Retrieved from www.nap.edu/openbook.php?isbn=0309069955

236
National Research Council. (2004). On evaluating curricular effectiveness: Judging
the quality of K-12 mathematics evaluations. Washington, DC: The National
Academies Press. Mathematical Sciences Education Board, Center for Education,
Division of Behavioral and Social Sciences and Education.
National Research Council. (2005). How students learn: Mathematics in the classroom.
Washington DC: National Academy Press.
Retrieved from www.nap.edu/openbook.php?isbn=0309089492
National Research Council. (2007). Rising above the gathering storm. Washington, DC:
National Academy Press. Retrieved from http://www.books.nap.edu/openbook.
php?isbn=0309100399
National Research Council. (2011). Report to Congress. Washington, DC: The National
Academies Press. Retrieved from http://www.nationalacademies.org/
annualreport/Report_to_Congress_2011.pdf
National Science Board. (2010), Globalization of science and engineering research: A
companion to science and engineering indicators 2010. Arlington, VA: National
Science Foundation.
National Science Board. (2012). Science and Indicators. Arlington, VA: National Science
Foundation.
The National Science Board Commission on Precollege Education in Mathematics,
Science, and Technology. (1983). Educating Americans for the 21st century: A
report to the American people and the national science board. Washington, DC:
National Science Foundation.

237
Neufeld, B., & Roper, D. (2003). Coaching: A strategy for developing instructional
capacity, promises and practicalities. Washington, DC: The Aspen Institute.
Retrieved from http://www.annenberginstitute.org/publications/reports.html
New Jersey Department of Education (1996). The New Jersey mathematics curriculum
framework. Trenton, NJ: New Jersey Department of Education. Retrieved from
http://dimacs.rutgers.edu/nj_math_coalition/framework.html
New Jersey State Department of Education. (2004a). District Factor Groups (DFG) for
school districts. Trenton, NJ: Author. Retrieved from
http://www.state.nj.us/education/finance/rda/dfg.pdf
New Jersey Department of Education. (2004b). New Jersey Core Curriculum Content
Standards for mathematics. Trenton, NJ: New Jersey Department of Education.
Retrieved from http://www.nj.gov/education/cccs/2004/s4_math.pdf
New Jersey Department of Education. (2008). New Jersey Core Curriculum Content
Standards for mathematics. Trenton, NJ: New Jersey Department of Education.
Retrieved from http://www.nj.gov/education/cccs/2004/s4_math_sands.doc
New Jersey Department of Education. (2010). 2009-2010 school report card. Trenton,
NJ: New Jersey Department of Education. Retrieved from
http://education.state.nj.us/rc/rc10/nav.php?c=13;d=3570
New Jersey Department of Education. (2011a). 2010-2011 school report card. Trenton,
NJ: New Jersey Department of Education. Retrieved from
http://education.state.nj.us/rc/rc11/nav.php?c=13;d=3570
New Jersey Department of Education. (2011b). New Jersey assessment of skills and
knowledge, 2010 technical report, grades 3-8. Trenton, NJ: New Jersey

238
Department of Education. Retrieved from
http://www.nj.gov/education/assessment/es/njask_tech_report10.pdf
New Jersey Department of Education. (2013). New Jersey assessment of skills and
knowledge, 2012 technical report, grades 3-8. Trenton, NJ: New Jersey
Department of Education. Retrieved from
http://www.nj.gov/education/assessment/es/njask_tech_report12.pdf
No Child Left Behind (NCLB) Act of 2001, Pub. L. No. 107-110, § 115, Stat. 1425
(2002).
North Central Regional Educational Laboratory. (2003). enGauge: 21st century skills for
21st century learners. Naperville, IL: Author.
Packer, A. (n.d.). What mathematics should “everyone” know and be able to do? Paper
prepared for the National Forum on Quantitative Literacy. Retrieved from
www.maa.org/ql/pgs33_42.pdf
Passolunghi, M. C., Vercelloni, B., & Schadee, H. (2007). The precursors of mathematics
learning: Working memory, phonological ability, and numerical competence.
Cognitive Development, 22, 165-184.
Pinar W. F., Reynolds, W. M., Slattery, P., & Taubman, P. M. (1995). Understanding
curriculum: An introduction to the study of historical and contemporary
curriculum discourses. New York, NY: Peter Lang.
Pinker, S. (1997) How the mind works. New York, NY: W.W. Norton & Company.
Poglinco, S., Bach, A., Hovde, K., Rosenblum, S., Saunders, M., & Supovitz, J. (2003).
The heart of the matter: The coaching model in America’s Choice schools.

239
Philadelphia, PA: Consortium for Policy Research in Education, University of
Pennsylvania. Retrieved from http://www.cpre.org/Publications/
Publications_Research.htm
Raudenbush, S.W. (1993). Hierarchical linear models as generalizations of certain
common experimental design models. In L.Edwards (Ed.). Applied analysis of
variance in behavioral science (pp. 459-496). New York, NY: Marcell Decker.
Resnick, R. M., Sanislo, G., & Oda., S. (2010). The complete K–12 report: Market facts
and segment analyses. Rockaway Park, NY: Education Market Research.
Richardson, K. (2012). How children learn number concepts: A guide to the critical
learning phases. Bellingham, WA: Math Perspectives Teacher Development
Center.
Ridley, D. (2008), The literature review: A step-by-step guide for students. London:
SAGE.
Riordan, J. E., & Noyce, P. E. (2001). Impact of two standards-based mathematics
curricula on student achievement in Massachusetts. Journal for Research in
Mathematics Education, 32(4), 368-398.
Roby, D. E. (2004). Research on school attendance and student achievement: A study of
Ohio schools. Educational Research Quarterly, 28, 3-14.
Rose, H., & Betts, J. R. (2001). Math matters: The links between high school curriculum,
college graduation, and earnings. San Francisco, CA: Public Policy Institute of
California. Retrieved from www.ppic.org/content/pubs/report/R_701JBR.pdf

240
Schmidt, W. H., Wang, H. C., & McKnight, C. C. (2005). Curriculum coherence: An
examination of U.S. mathematics and science content standards from an
international perspective. Journal of Curriculum Studies, 37(5), 525-559.
Schmidt, W. H., McKnight, C., Valverde, G. A., Houang, R. T., & Wiley, D. E. (1997).
Many visions, many aims: Volume I. A cross-national investigation of curricular
intentions in school mathematics. Dordrecht/Boston/London: Kluwer.
Schmidt, W. H., McKnight, C. C., Houang, R. T., Wang, H., Wiley, D. E., Cogan, L. S.,
& Wolfe, R. G. (2001). Why schools matter: A cross-national comparison of
curriculum and learning. San Francisco, CA: Jossey-Bass.
Schoenfeld, A. H. (2002). Making mathematics work for all children: Issues of
standards, testing, and equity. Education Researcher, 31(1), 13-25.
www.noycefdn.org/documents/Making_Math_Work-Schoenfeld.pdf
Sconiers, S., Isaacs, A., Higgins, T., McBride, J., & Kelso, C. (2003). The Arc Center tri-
state student achievement study. Lexington, MA: COMAP.
Sconiers, S., Isaacs, A., Higgins, T., McBride, J., & Kelso, C. (2003). Three-state student
achievement study project report: A report by the ARC Center at the Consortium
for Mathematics and Its Applications (Unpublished Manuscript). Boston, MA.
Retrieved from www.comap.com/elementary/projects/are
Secretary's Commission on Achieving Necessary Skills. (1991). What work requires of
schools. Springfield, VA: National Technical Information Service (NTIS PB92-
1467111NZ)
Slavin, R. E. (1986). Best-evidence synthesis: An alternative to meta-analytic and
traditional reviews. Educational Researcher, 15, (9), 5-11. Reprinted in W. R.

241
Shadish and C. S. Reichardt (Eds.), Evaluation Studies Review Annual (Vol. 12).
Newbury Park, CA: Sage.
Slavin, R. E. (2007). Educational research in the age of accountability. Boston, MA:
Allyn & Bacon.
Slavin, R. E. (2008). What works? Issues in synthesizing educational program
evaluations. Educational Researcher, 37(1), 5-14.
Slavin, R. E., & Lake, C. (2007). Effective programs in elementary mathematics: A best-
evidence synthesis. Baltimore, MD: Johns Hopkins University School of
Education’s Center for Data-Driven Reform in Education (CDDRE). Retrieved
from http://www.bestevidence.org/word/elem_math_feb_9_2007.pdf
Slavin, R. E., & Lake, C. (2008). Effective programs in elementary mathematics: A best-
evidence synthesis. Review of Educational Research, 78 (3), 427-515.
Slavin, R.E., Lake, C., & Groff, C. (2009). Effective programs in middle and high school
mathematics: A best-evidence synthesis. Review of Educational Research, 79 (2),
839-911.
Smith, J. R., Brooks-Gunn, J., & Klebanov, P. K. (1997). The consequences of living in
poverty for young children's cognitive and verbal ability and early school
achievement. In G. J. Duncan & J. Brooks-Gunn (Eds.), Consequences of growing
up poor (pp. 132-189). New York: Russell Sage Foundation.
Snow, C., Burns, S., & Griffin, P. (Eds.). (1998). Preventing reading difficulties in young
children. Washington, DC: National Academy Press (NAP).
SRA/McGraw-Hill. (2003). Everyday mathematics student achievement studies (Volume
4). Chicago, IL: SRA/McGraw-Hill.

242
Steele, C. M. (1997). A threat in the air: How stereotypes shape intellectual identity and
performance. American Psychologist, 52, 613–629.
Steele, C. M., & Aronson, J. (1995). Stereotype threat and the intellectual test
performance of African-Americans. Journal of Personality and Social
Psychology, 68, 797–811.
Steele, C. M., Spencer, S. J., Hummel, M., Carter, K., Harber, K., Schoem, D., & Nisbett,
R. (in press). African-American college achievement: A “wise” intervention.
Harvard Educational Review.
Steen, L. A. (1999). Algebra for all in eighth grade: What’s the rush? Middle matters.
(1991). National Association of Elementary School Principals, 8,(1), 6-7.
Retrieved from www.stolaf.edu/people/steen/Papers/algebra.html
Steen, L. A. (2003). Quantitative literacy: Why numeracy matters for schools and
colleges. Princeton, NJ: National Council on Education and the Disciplines.
Steffe, L. P., & Cobb, P. (1988). Construction of arithmetical meanings and strategies.
New York, NY: Springer-Verlag.
Steffe, L. P., & Gale, J. (Eds.). (1995). Constructivism in education. Hillsdale, NJ:
Erlbaum.
Stevenson H. W., Parker T., Wilkinson A., Hegion A., & Fish E. (1976). Longitudinal
study of individual differences in cognitive development and scholastic
achievement. Journal of Educational Psychology, 68, 377–400.
Stylianides, A. J., & Ball, D. L. (2004). A framework for studying the mathematical
knowledge needed for teaching: Knowledge of reasoning and proof. Paper

243
presented at the annual meeting of the American Educational Research
Association, San Diego, CA.
Tanner, D., & Tanner, L. (2007). Curriculum development: Theory into practice. Upper
Saddle River, NJ: Pearson Education.
Taub, G., Floyd, R. G., Keith, T. Z., & McGrew, K. S. (2008). Effects of general and
broad cognitive abilities on mathematics achievement from kindergarten
through high school. School Psychology Quarterly, 23(2), 187−198.
Thurlow, M., & Esler, A. (2000). Appeals processes for students who fail graduation
exams: How do they apply to students with disabilities? (Synthesis Report No.
36). Minneapolis, MN: University of Minnesota, National Center on Education
Outcomes. Retrieved from http://education.umn.edu/NCEO/OnlinePubs/
Synthesis36.html
Tyler, R. W. (1949). Basic principles of curriculum and instruction. Chicago, IL: The
University of Chicago Press.
U.S. Census Bureau. (2010a). American community survey. Washington, DC:
Government Printing Office.
U.S. Census Bureau. (2010b). ACS 5-year detailed tables. Retrieved from
https://www.census.gov/acs/www/data_documentation/2010_release/
U.S. Department of Education. (2009a). American Recovery and Reinvestment Act.
Washington, DC: U.S. Department of Education. Retrieved http://www2.ed.gov/
programs/racetothetop/executive-summary.pdf
244
U.S. Department of Education. (2009b). Race to the Top Program: Executive summary.
Washington, DC: Author. Retrieved from http://www2.ed.gov/programs/
racetothetop/executive-summary.pdf.
University of Chicago School Mathematics Project. (2005). Everyday mathematics
research summary. Retrieved from http://everydaymath.uchicago.edu/educators/
references/shtml
University of Chicago School Mathematics Project. (2007a). Fifth grade everyday
mathematics teacher's lesson guide (Vol. 1). Chicago, IL: SRA/McGraw-Hill.
University of Chicago School Mathematics Project. (2007b). Fifth grade everyday
mathematics teacher's lesson guide (Vol. 2). Chicago, IL: SRA/McGraw-Hill.
University of Chicago School Mathematics Project. (2007c). Fourth grade everyday
mathematics teacher's lesson guide (Vol. 1). Chicago, IL: SRA/McGraw-Hill.
University of Chicago School Mathematics Project. (2007d). Fourth grade everyday
mathematics teacher's lesson guide (Vol. 2). Chicago, IL: SRA/McGraw-Hill.
University of Chicago School Mathematics Project. (2007e). Third grade everyday
mathematics teacher's lesson guide (Vol. 1). Chicago, IL: SRA/McGraw-Hill
University of Chicago School Mathematics Project. (2007f). Third grade everyday
mathematics teacher's lesson guide (Vol. 2). Chicago, IL: SRA/McGraw-Hill.
Walberg, H. J. (1984). Families as partners in educational productivity. Phi Delta
Kappan, 65(6), 397-400.
Waite, R. D. (2000). A study of the effects of Everyday Mathematics on student
achievement of third-, fourth-, and fifth-grade students in a large north Texas

245
urban school district. Dissertation Abstracts International, 61(10), 3933A. (UMI
No. 9992659).
Wang, T. & Birdwell J. D. (2001) A Review of Everyday Math. Retrieved from
http://www.lit.net/orschools/A_Review_of_Everyday_Math.pdf
Webb, N. L. (1997). Criteria for alignment of expectations and assessments in
mathematics and science education (NISE Research Monograph No. 6). Madison,
WI: University of Wisconsin–Madison, National Institute for Science Education.
Webb, N. L. (1999). Alignment of science and mathematics standards and assessment in
four states (NISE Research Monograph No.18). Madison, WI: University of
Wisconsin–Madison, National Institute for Science Education.
What Works Clearinghouse (2006). Elementary school math. Washington, DC: U.S.
Department of Education. Retrieved from http://w-w-c.org
What Works Clearinghouse (2010). Everyday Mathematics. Washington, DC: U.S.
Department of Education. Retrieved from http://w-w-c.org
Zhao, Y. (2012). World class learners. Educating creative and entrepreneurial students.
New York, NY: Corwin Press.
Zhao, Y. (2012, December 11). Numbers can lie: What PISA and TIMSS truly tell us, if
anything? Retrieved from http://zhaolearning.com/2012/12/11/numbers-can-lie-
what-timss-and-pisa- truly-tell-us-if-anything/

246
APPENDIX A
NPS IRB Letter of Approval

247
APPENDIX B
Chi Square Preliminary Analyses
Null Hypothesis 1. There is no difference between the distribution of White, Black,
Hispanic, and Other students in each of the four Experimental Treatment sites and the
distribution of White, Black, Hispanic, and other students within each of the four
respective paired Alternative Treatment sites. To answer the null hypothesis, the
observed and expected frequencies of race/ethnicity for each Experimental Treatment site
and Alternative Treatment site were computed. These data were used for the chi-square
analysis.
Race/Ethnicity: Experimental Treatment Site 1 and Alternative Treatment Site 1
The result of the non-parametric chi-square test for Hypothesis 1 is shown in
Tables 1a - c. It can be seen that χ(3) = 371.423, p = 3.42E-80. This indicates that there
is sufficient evidence to reject the null hypothesis and conclude that there is a
statistically significant difference between the distribution of race/ethnicity between
Experimental Treatment Site 1 and Alternative Treatment Site 1. The majority of the
participants from Experimental Treatment Site 1 was Black (539). The majority of the
participants from Alternative Treatment Site 1 was Hispanic (291).

248
Table 1a Observed Frequencies (Race/Ethnicity)
White Black Hispanic Other Total
Experimental Treatment Site 1 2 539 12 2 555 Alternative Treatment Site 1 2 240 291 2 535 Total 4 779 303 4 1090
Table 1b Expected Frequencies (Race/Ethnicity)
White Black Hispanic Other Total
Experimental Treatment Site 1 2.04 396.65 154.28 2.04 555 Alternative Treatment Site 1 1.96 382.35 148.72 1.96 535 Total 4 779 303 4 1090
Table 1c Chi-Square Tests
Value Df Asymp. Sig. (2-sided)
Pearson Chi-Square 371.423 3 3.42E-80
N of Valid Cases 8
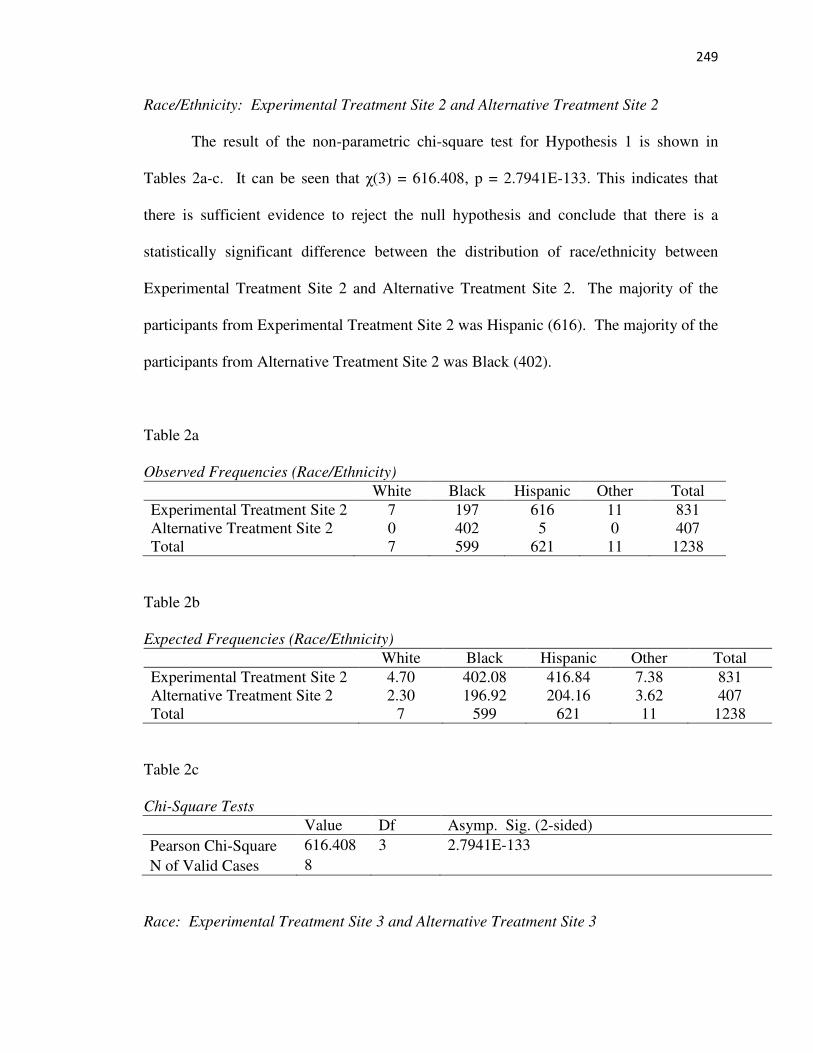
249
Race/Ethnicity: Experimental Treatment Site 2 and Alternative Treatment Site 2
The result of the non-parametric chi-square test for Hypothesis 1 is shown in
Tables 2a-c. It can be seen that χ(3) = 616.408, p = 2.7941E-133. This indicates that
there is sufficient evidence to reject the null hypothesis and conclude that there is a
statistically significant difference between the distribution of race/ethnicity between
Experimental Treatment Site 2 and Alternative Treatment Site 2. The majority of the
participants from Experimental Treatment Site 2 was Hispanic (616). The majority of the
participants from Alternative Treatment Site 2 was Black (402).
Table 2a Observed Frequencies (Race/Ethnicity)
White Black Hispanic Other Total
Experimental Treatment Site 2 7 197 616 11 831 Alternative Treatment Site 2 0 402 5 0 407 Total 7 599 621 11 1238
Table 2b Expected Frequencies (Race/Ethnicity)
White Black Hispanic Other Total
Experimental Treatment Site 2 4.70 402.08 416.84 7.38 831 Alternative Treatment Site 2 2.30 196.92 204.16 3.62 407 Total 7 599 621 11 1238
Table 2c Chi-Square Tests
Value Df Asymp. Sig. (2-sided)
Pearson Chi-Square 616.408 3 2.7941E-133
N of Valid Cases 8
Race: Experimental Treatment Site 3 and Alternative Treatment Site 3

250
The result of the non-parametric chi-square test for Hypothesis 1 is shown in
Tables 3a-c. It can be seen that χ(3) = 64.988, p =5.0465E-14. This indicates that there
is sufficient evidence to reject the null hypothesis and conclude that there is a
statistically significant difference between the distribution of race/ethnicity between
Experimental Treatment Site 3 and Alternative Treatment Site 3. The majority of the
participants from Experimental Treatment Site 3 was Hispanic (447). The majority of the
participants from Alternative Treatment Site 2 was Hispanic (644).
Table 3a Observed Frequencies (Race/Ethnicity)
White Black Hispanic Other Total
Experimental Treatment Site 3 321 79 447 6 853 Alternative Treatment Site 3 287 22 644 3 956 Total 608 101 1091 9 1809
Table 3b Expected Frequencies (Race/Ethnicity)
White Black Hispanic Other Total
Experimental Treatment Site 3 286.69 47.62 514.44 4.24 853.00 Alternative Treatment Site 3 321.31 53.38 576.56 4.76 956.00 Total 608.00 101.00 1091.00 9.00 1809.00
Table 3c Chi-Square Tests
Value Df Asymp. Sig. (2-sided)
Pearson Chi-Square 64.988 3 5.0465E-14
N of Valid Cases 8

251
Race: Experimental Treatment Site 4 and Alternative Treatment Site 4
The result of the non-parametric chi-square test for Hypothesis 1 is shown in
Tables 4a-c. It can be seen that χ(3) = 3.159518, p = 0.368.
This indicates that there is sufficient evidence to accept the null hypothesis and
conclude that there is no statistically significant difference between the distribution of
race/ethnicity between Experimental Treatment Site 4 and Alternative Treatment Site 4.
Table 4a Observed Frequencies (Race/Ethnicity)
White Black Hispanic Other Total
Experimental Treatment Site 4 2 433 16 2 453 Alternative Treatment Site 4 0 541 18 1 560 Total 2 974 34 3 1013
Table 4b Expected Frequencies (Race/Ethnicity)
White Black Hispanic Other Total
Experimental Treatment Site 4 0.89 435.56 15.20 1.34 453 Alternative Treatment Site 4 1.11 538.44 18.80 1.66 560 Total 2 974 34 3 1013
Table 4c Chi-Square Tests
Value Df Asymp. Sig. (2-sided)
Pearson Chi-Square 3.159518 3 0.368
N of Valid Cases 8

252
Summary for Hypothesis 1
The series of chi-square tests done for all four paired schools along the
distribution of race/ethnicity revealed that only Experimental Treatment Site 3 and
Alternative Treatment Site 3 have similar distribution of race/ethnicity, which resulted in
the acceptance of the null hypothesis. Moreover, both Black students and Hispanic
students equally maintained the highest distributions across four schools. A majority of
Black students was seen from Experimental Treatment Site 1, Alternative Treatment Site
2, Experimental Treatment Site 4, and Alternative Treatment Site 4, whereas a majority
of Hispanic students was seen from Alternative Treatment Site 1, Experimental
Treatment Site 2, Experimental Treatment Site 3 and Alternative Treatment Site 3.

253
Null Hypothesis 2. There is no difference between the distribution of White, Black,
Hispanic, and Other students in the Experimental Treatment sample (n=100) and the
distribution of White, Black, Hispanic, and Other students within the Alternative
Treatment sample (n=105). To answer the null hypothesis, the observed and expected
frequencies of race for the Experimental Treatment sample and the Alternative Treatment
sample were computed. These data were used for the chi-square analysis.
Race: Experimental Treatment Sample and Alternative Treatment Sample
The result of the non-parametric chi-square test for Hypothesis 2 is shown in
Tables 5a-c. It can be seen that χ(3) = 0.365, p = 0.947363825. This indicates that there
is sufficient evidence to accept the null hypothesis and conclude that there is no
statistically significant difference in the distribution of race between Experimental
Treatment sample and Alternative Treatment sample.
Table 5a Observed Frequencies (Race/Ethnicity)
White Black Hispanic Other Total
Experimental Treatment Sample 11 51 37 1 100 Alternative Treatment Sample 14 50 40 1 105 Total 25 101 77 2 205
Table 5b Expected Frequencies (Race/Ethnicity)
White Black Hispanic Other Total
Experimental Treatment Sample 12.20 49.27 37.56 0.98 100 Alternative Treatment Sample 12.80 51.73 39.44 1.02 105 Total 25 101 77 2 205
Table 5c Chi-Square Tests (Race/Ethnicity)
Value Df Asymp. Sig. (2-sided)
Pearson Chi-Square 0.365 3 0.947363825
N of Valid Cases 8

254
Summary for Hypothesis 2
The series of chi-square tests done for both the Alternative Treatment sample and
the Experimental Treatment sample along the distribution of race revealed a similar
distribution of race, which resulted in the acceptance of the null hypothesis. Moreover,
both Black students and Hispanic students maintained the highest distributions between
the Alternative Treatment and Experimental Treatment samples.
Null Hypothesis 3. There is no difference between the distribution of male students and
female students in each of the four Experimental Treatment sites and the distribution of
male students and female students within each of the four respective paired Alternative
Treatment sites. To answer the null hypothesis, the observed and expected frequencies of
gender for each Experimental Treatment site and Alternative Treatment site were
computed. These data were used for the chi-square analysis.

255
Gender: Experimental Treatment Site 1 and Alternative Treatment Site 1
The result of the non-parametric chi-square test for Hypothesis 3 is shown in
Tables 6a-c. It can be seen that χ(1) = 0.093, p = 0.760238393. This indicates that there
is sufficient evidence to accept the null hypothesis and conclude that there is no
statistically significant difference in the distribution of gender between Experimental
Treatment Site 1 and Alternative Treatment Site 1.
Table 6a Observed Frequencies (Gender)
Males Females Total
Experimental Treatment Site 1 276 279 555 Alternative Treatment Site 1 271 264 535 Total 547 543 1090
Table 6b Expected Frequencies (Gender)
Males Females Total
Experimental Treatment Site 1 278.518 276.482 555 Alternative Treatment Site 1 268.482 266.518 535 Total 547 543 1090
Table 6c Chi-Square Tests
Value Df Asymp. Sig. (2-sided)
Pearson Chi-Square 0.093 1 0.760238393
N of Valid Cases 4

256
Gender: Experimental Treatment Site 2 and Alternative Treatment Site 2
The result of the non-parametric chi-square test for Hypothesis 3 is shown in
Tables 7a-c. It can be seen that χ(1) = 0.018, p = 0.892534474. This indicates that there
is sufficient evidence to accept the null hypothesis and conclude that there is no
statistically significant difference between the distribution of gender between
Experimental Treatment Site 2 and Alternative Treatment Site 2.
Table 7a Observed Frequencies (Gender)
Males Females Total
Experimental Treatment Site 2 424 407 831 Alternative Treatment Site 2 206 201 407 Total 630 608 1238
Table 7b Expected Frequencies (Gender)
Males Females Total
Experimental Treatment Site 2 422.884 408.116 831 Alternative Treatment Site 2 207.116 199.884 407 Total 630 608 1238
Table 7c Chi-Square Tests
Value Df Asymp. Sig. (2-sided)
Pearson Chi-Square 0.018 1 0.892534474
N of Valid Cases 4

257
Gender: Experimental Treatment Site 3 and Alternative Treatment Site 3
The result of the non-parametric chi-square test for Hypothesis 3 is shown in
Tables 8a-c. It can be seen that χ(3) = 3.091, p =0.078706538. This indicates that there
is sufficient evidence to accept the null hypothesis and conclude that there is no
statistically significant difference between the distribution of gender between
Experimental Treatment Site 3 and Alternative Treatment Site 3.
Table 8a Observed Frequencies (Gender)
Males Females Total
Experimental Treatment Site 3 452 401 853 Alternative Treatment Site 3 467 489 956 Total 919 890 1809
Table 8b Expected Frequencies (Gender)
Males Females Total
Experimental Treatment Site 3 433.337 419.663 853 Alternative Treatment Site 3 485.663 470.337 956 Total 919 890 1809
Table 8c Chi-Square Tests
Value Df Asymp. Sig. (2-sided)
Pearson Chi-Square 3.091 1 0.078706538
N of Valid Cases 4

258
Gender: Experimental Treatment Site 4 and Alternative Treatment Site 4
The result of the non-parametric chi-square test for Hypothesis 3 is shown in
Tables 9a-c. It can be seen that χ(1) = 8.389, p = 0.004.
This indicates that there is a sufficient evidence to reject the null hypothesis and
conclude that there is a statistically significant difference in the distribution of gender
between Experimental Treatment Site 4 and Alternative Treatment Site 4. The majority
of the participants from Experimental Treatment Site 4 was Male (255). The majority of
the participants from Alternative Treatment Site 2 was Female (296).
Table 9a Observed Frequencies (Gender)
Males Females Total
Experimental Treatment Site 4 255 198 453 Alternative Treatment Site 4 264 296 560 Total 519 494 1013
Table 9b Expected Frequencies (Gender)
Males Females Total
Experimental Treatment Site 4 232.090 220.910 453 Alternative Treatment Site 4 286.910 273.090 560 Total 519 494 1013
Table 9c Chi-Square Tests
Value Df Asymp. Sig. (2-sided)
Pearson Chi-Square 8.389 1 0.004
N of Valid Cases 4

259
Summary for Hypothesis 3
The series of chi-square tests done for all four paired schools along the
distribution of gender revealed that Experimental Treatment Site 1 and Alternative
Treatment Site 1, Experimental Treatment Site 2 and Alternative Treatment Site 2, and
Experimental Treatment Site 3 and Alternative Treatment Site 3 have similar
distributions of gender which resulted in the acceptance of the null hypothesis.
Experimental Treatment Site 4 and Alternative Treatment Site 4 have significant
differences in the distribution of gender.

260
Null Hypothesis 4. There is no difference between the distribution of male and female
students in the Experimental Treatment sample (n=100) and the distribution of male and
female students in the Alternative Treatment sample (n=105). To answer the null
hypothesis, the observed and expected frequencies of gender for the Experimental
Treatment sample and the Alternative Treatment sample were computed. These data
were used for the chi-square analysis.
Gender: Experimental Treatment Sample and Alternative Treatment Sample
The result of the non-parametric chi-square test for Hypothesis 4 is shown in
Tables 10a-c. It can be seen that χ(1) = 0.179, p = 0.671923567.
This indicates that there is sufficient evidence to accept the null hypothesis and
conclude that there is no statistically significant difference in the distribution of gender
between Experimental Treatment sample and Alternative Treatment sample.
Table 10a Observed Frequencies (Gender)
Males Females Total
Experimental Treatment Sample 39 61 100 Alternative Treatment Sample 44 61 105 Total 83 122 205
Table 10b Expected Frequencies (Gender)
Males Females Total
Experimental Treatment Sample 40.488 59.512 100 Alternative Treatment Sample 42.512 62.488 105 Total 83 122 205
Table 10c Chi-Square Tests
Value Df Asymp. Sig. (2-sided)
Pearson Chi-Square 0.179 1 0.671923567
N of Valid Cases 4

261
Summary for Hypothesis 4
The series of chi-square tests done for both the Alternative Treatment sample and
the Experimental Treatment sample along the distribution of gender revealed a similar
distribution of males and females, which resulted in the acceptance of the null hypothesis.
Moreover, females maintained the highest distributions between the Alternative
Treatment and Experimental Treatment samples.
Null Hypothesis 5. There is no difference between the distribution of low-income
students and non-low-income students in each of the four Experimental Treatment sites
and the distribution of low-income students and non low-income students within each of
the four respective paired Alternative Treatment sites. To answer the null hypothesis, the
observed and expected frequencies of Socioeconomic Status (SES) for each of the four
Experimental Treatment sites and each of the four respective paired Alternative
Treatment sites were computed. These data were used for the chi-square analysis.

262
SES: Experimental Treatment Site 1 and Alternative Treatment Site 1
The result of the non-parametric chi-square test for Hypothesis 5 is shown in Tables 11a-
c. It can be seen that χ(1) = 95.489, p = 1.48724E-22. This indicates that there is
sufficient evidence to reject the null hypothesis and conclude that there is a statistically
significant difference between the distribution of SES between Experimental Treatment
Site 1 and Alternative Treatment Site 1. The proportions of low-income students and non
low-income students within the Experimental Treatment and Alternative Treatment sites
were also computed and are shown in Table 11. The majority of the participants from
Experimental Treatment Site 1 was low income (392). The majority of the participants
from Alternative Treatment Site 1 was low income (500).
Table 11a Observed Frequencies (SES)
Low Income Non Low Income Total
Experimental Treatment Site 1 392 163 555 Alternative Treatment Site 1 500 35 535 Total 892 198 1090
Table 11b Expected Frequencies (SES)
Low Income Non Low Income Total
Experimental Treatment Site 1 454.183 100.817 555 Alternative Treatment Site 1 437.817 97.183 535 Total 892 198 1090
Table 11c Chi-Square Tests
Value Df Asymp. Sig. (2-sided)
Pearson Chi-Square 95.489 1 1.48724E-22
N of Valid Cases 4

263
SES: Experimental Treatment Site 2 and Alternative Treatment Site 2
The result of the non-parametric chi-square test for Hypothesis 5 is shown in
Tables 12a-c. It can be seen that χ(1) = 0.137, p = 0.7114023. This indicates that there is
a sufficient evidence to accept the null hypothesis and conclude that there is not a
statistically significant difference between the distribution of SES between Experimental
Treatment Site 2 and Alternative Treatment Site 2.
Table 12a Observed Frequencies (SES)
Low Income Non Low Income Total
Experimental Treatment Site 2 691 140 831 Alternative Treatment Site 2 335 72 407 Total 1026 212 1238
Table 12b Expected Frequencies (SES)
Low Income Non Low Income Total
Experimental Treatment Site 2 688.696 142.304 831 Alternative Treatment Site 2 337.304 69.696 407 Total 1026 212 1238
Table 12c Chi-Square Tests
Value Df Asymp. Sig. (2-sided)
Pearson Chi-Square 0.137 1 0.7114023
N of Valid Cases 4

264
SES: Experimental Treatment Site 3 and Alternative Treatment Site 3
The result of the non-parametric chi-square test for Hypothesis 5 is shown in
Tables 13a-c. It can be seen that χ(1) = 23.845, p =1.04388E-6. This indicates that there
is a sufficient evidence to reject the null hypothesis and conclude that there is a
statistically significant difference between the distribution of SES between Experimental
Treatment Site 3 and Alternative Treatment Site 3. The majority of the participants from
Experimental Treatment Site 3 was low-income (748). The majority of the participants
from Alternative Treatment Site 3 was low-income (756).
Table 13a Observed Frequencies (SES)
Low Income Non Low Income Total
Experimental Treatment Site 3 748 105 853 Alternative Treatment Site 3 756 200 956 Total 1504 305 1809
Table 13b Expected Frequencies (SES)
Low Income Non Low Income Total
Experimental Treatment Site 3 709.183 143.817 853 Alternative Treatment Site 3 794.817 161.183 956 Total 1504 305 1809
Table 13c Chi-Square Tests
Value Df Asymp. Sig. (2-sided)
Pearson Chi-Square 23.845 1 1.04388E-06
N of Valid Cases 4

265
SES: Experimental Treatment Site 4 and Alternative Treatment Site 4
The result of the non-parametric chi-square test for Hypothesis 5 is shown in
Tables 14a-c. It can be seen that χ(1) = 0.431, p = 0.511468.
This indicates that there is sufficient evidence to accept the null hypothesis and
conclude that there is no statistically significant difference between the distribution of
SES between Experimental Treatment Site 4 and Alternative Treatment Site 4.
Table 14a Observed Frequencies (SES)
Low Income Non Low Income Total
Experimental Treatment Site 4 404 49 453 Alternative Treatment Site 4 492 68 560 Total 896 117 1013
Table 14b Expected Frequencies (SES)
Low Income Non Low Income Total
Experimental Treatment Site 4 400.679 52.321 453 Alternative Treatment Site 4 495.321 64.679 560 Total 896 117 1013
Table 14c Chi-Square Tests
Value Df Asymp. Sig. (2-sided)
Pearson Chi-Square 0.431 1 0.511468
N of Valid Cases 4

266
Summary for Hypothesis 5
The series of chi-square tests done for all four paired schools along the
distribution of SES revealed that Experimental Treatment Site 2 and Alternative
Treatment Site 2 and Experimental Treatment Site 3 and Alternative Treatment Site 3
have a similar distribution of SES, which resulted in the acceptance of the null
hypothesis. Moreover, low-income students maintained the highest distributions across
all 8 schools.
Null Hypothesis 6. There is no difference between the distribution of low SES and
higher SES students in the Experimental Treatment sample (n=100) and the distribution
of low SES and higher SES students in the Alternative Treatment sample (n=105). To
answer the null hypothesis, the observed and expected frequencies of SES for the
Experimental Treatment sample and the Alternative Treatment sample were computed.
These data were used for the chi-square analysis.

267
SES: Experimental Treatment Sample and Alternative Treatment Sample
The result of the non-parametric chi-square test for Hypothesis 6 is shown in
Tables 15a-c. It can be seen that χ(1) = 0.117, p = 0.732149986.
This indicates that there is sufficient evidence to accept the null hypothesis and
conclude that there is no statistically significant difference in the distribution of SES
between Experimental Treatment sample and Alternative Treatment sample.
Table 15a Observed Frequencies (SES)
Low SES Higher SES Total
Experimental Treatment Sample 85 15 100 Alternative Treatment Sample 91 14 105 Total 176 29 205
Table 15b Expected Frequencies (SES)
Low SES Higher SES Total
Experimental Treatment Sample 85.854 14.146 100 Alternative Treatment Sample 90.146 14.854 105 Total 176 29 205
Table 15c Chi-Square Tests
Value Df Asymp. Sig. (2-sided)
Pearson Chi-Square 0.117 1 0.732149986
N of Valid Cases 4

268
Summary for Hypothesis 6
The series of chi-square tests done for both the Alternative Treatment sample and
the Experimental Treatment sample along the distribution of SES revealed a similar
distribution of low SES and higher SES students which resulted in the acceptance of the
null hypothesis. Moreover, low SES students maintained the highest distributions
between the Alternative Treatment and Experimental Treatment samples.
Null Hypothesis 7. There is no difference between the distribution of Proficient students
(scoring 200 and above on the 2010 NJ ASK3) and Partially Proficient students (scoring
below 200 on the 2010 NJ ASK3) in the Experimental Treatment sample (n=100) and
Proficient students and Partially Proficient students in the Alternative Treatment sample
(n=105). To answer the null hypothesis, the observed and expected frequencies of
performance for the entire Experimental Treatment sample and the entire Alternative
Treatment sample were computed. These data were used for the chi-square analysis.
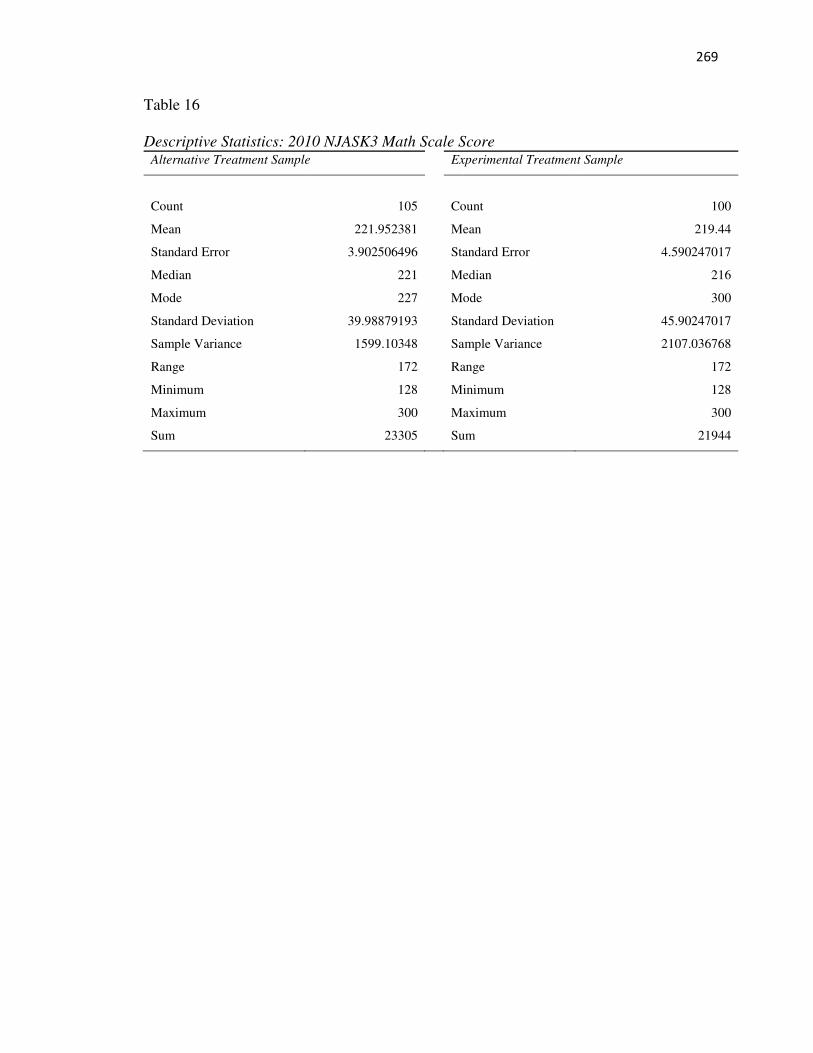
269
Table 16 Descriptive Statistics: 2010 NJASK3 Math Scale Score
Alternative Treatment Sample Experimental Treatment Sample
Count 105 Count 100
Mean 221.952381 Mean 219.44
Standard Error 3.902506496 Standard Error 4.590247017
Median 221 Median 216
Mode 227 Mode 300
Standard Deviation 39.98879193 Standard Deviation 45.90247017
Sample Variance 1599.10348 Sample Variance 2107.036768
Range 172 Range 172
Minimum 128 Minimum 128
Maximum 300 Maximum 300
Sum 23305 Sum 21944

270
Performance: Experimental Treatment Sample and Alternative Treatment Sample
The result of the non-parametric chi-square test for Hypothesis 7 is shown in
Tables 16a-c. It can be seen that χ(1) = 1.682, p = 0.19462.
This indicates that there is sufficient evidence to accept the null hypothesis and
conclude that there is no statistically significant difference in the distribution of
performance between Experimental Treatment sample and Alternative Treatment sample.
Table 16a Observed Frequencies (Performance)
Proficient Partially
Proficient Total
Experimental Treatment Sample 66 34 100 Alternative Treatment Sample 78 27 105 Total 144 61 205
Table 16b Expected Frequencies (Performance)
Proficient Partially
Proficient Total
Experimental Treatment Sample 70.244 29.756 100 Alternative Treatment Sample 73.756 31.244 105 Total 144 61 205
Table 16c Chi-Square Tests
Value Df Asymp. Sig. (2-sided)
Pearson Chi-Square 1.682 1 0.19462
N of Valid Cases 4

271
Summary for Hypothesis 7
The series of chi-square tests done for both the Alternative Treatment sample and
the Experimental Treatment sample along the distribution of performance revealed a
similar distribution of Proficient and Partially Proficient, which resulted in the acceptance
of the null hypothesis. Moreover, Proficient maintained the highest distributions between
the Alternative Treatment and Experimental Treatment samples.

272
APPENDIX C
Tests for Normality
Table 1a: Descriptive Statistics - Everyday Math (2010 NJ ASK 3and 2012 NJ ASK5
Data)
Descriptive Statisticsa
N Minimum Maximum Mean Std. Deviation
Statistic Statistic Statistic Statistic Std. Error Statistic
MathScaleScore2010 105 128 300 221.95 3.903 39.989
MathScaleScore2012 105 140 300 225.45 3.262 33.429
Attendance_2yr 105 313.00 370.00 354.9000 1.08887 11.15761
Valid N (listwise) 105
Table 1b: Skewness - Everyday Math (2010 NJ ASK 3and 2012 NJ ASK5 Data)
Skewness
Statistic Std. Error
MathScaleScore2010 .091 .236
MathScaleScore2012 .125 .236
Valid N (listwise)
a. Treatment = Alternative Treatment (Everyday Math)
Table 1c: Descriptive Statistics - Singapore Math (2010 NJ ASK 3and 2012 NJ ASK5
Data)
Descriptive Statisticsa
N Minimum Maximum Mean Std. Deviation
Statistic Statistic Statistic Statisti
c
Std. Error Statistic
MathScaleScore2010 100 128 300 219.44 4.590 45.902
MathScaleScore2012 100 146 300 220.88 3.775 37.752
Valid N (listwise) 100
Table 1d: Skewness_ Singapore Math (2010 NJ ASK 3and 2012 NJ ASK5 Data)
Skewness
Statistic Std. Error
MathScaleScore2010 .144 .241
MathScaleScore2012 .117 .241
Valid N (listwise)

273
Table 1e: Tests for Normality, Both Treatments (2010 NJ ASK 3and 2012 NJ ASK5
Data)
Tests for Normality
Treatment Kolmogorov-Smirnova
Statistic df Sig.
MathScaleScore2010
Alternative Treatment (Everyday Math)
.086 105 .052
Experimental Treatment (Singapore Math)
.070 100 .200*
MathScaleScore2012
Alternative Treatment (Everyday Math)
.083 105 .073
Experimental Treatment (Singapore Math)
.073 100 .200*

274
Race/Ethnicity - Black
Descriptive Statisticsa
N Minimum Maximum Mean Std.
Deviation
Skewness Kurtosis
Statistic Statistic Statistic Statistic Statistic Statistic Std.
Error
Statistic Std.
Error
MathScaleScore2010 101 128 300 206.98 33.827 -.163 .240 .252 .476
MathScaleScore2012 101 140 287 208.74 29.475 .196 .240 .134 .476
Valid N (listwise) 101
Race/Ethnicity - Hispanic
Descriptive Statisticsa
N Minimu
m
Maximu
m
Mean Std.
Deviatio
n
Skewness Kurtosis
Statisti
c
Statistic Statistic Statisti
c
Statistic Statisti
c
Std.
Erro
r
Statisti
c
Std.
Erro
r
MathScaleScore201
0
77 134 300 225.38 46.950 -.012 .274 -1.086 .541
MathScaleScore201
2
77 146 300 229.86 35.315 -.178 .274 -.220 .541
Valid N (listwise) 77
Race/Ethnicity – Black & Hispanic Subgroup, White
Tests of Normality
Race/ethnicity Kolmogorov-Smirnova Shapiro-Wilk
Statistic df Sig. Statistic df Sig.
MathScaleScore2010 Black&Hispanic .053 178 .200
* .984 178 .037
White .214 27 .003 .879 27 .005
MathScaleScore2012 Black&Hispanic .052 178 .200
* .990 178 .279
White .116 27 .200* .950 27 .213
SES
Tests of Normalitya
SES Kolmogorov-Smirnovb Shapiro-Wilk
Statistic df Sig. Statistic df Sig.

275
MathScaleScore2010 Not Low .152 16 .200
* .955 16 .567
Low SES .101 85 .031 .968 85 .032
MathScaleScore2012 Not Low .096 16 .200
* .983 16 .984
Low SES .074 85 .200* .986 85 .461
Gender
Tests of Normalitya
Gender Kolmogorov-Smirnovb Shapiro-Wilk
Statistic df Sig. Statistic df Sig.
MathScaleScore2010 Males .114 38 .200
* .971 38 .409
Females .091 63 .200* .976 63 .257
MathScaleScore2012 Males .149 38 .032 .969 38 .353
Females .073 63 .200* .987 63 .760

276
APPENDIX D
Independent Samples t-test (Gender)
Independent Samples t-test – Comparison of Males
Group Statisticsa
Treatment N Mean Std. Deviation Std. Error
Mean
MathScaleScore2012
Alternative Treatment
(Everyday Math)
44 227.18 36.437 5.493
Experimental Treatment
(Singapore Math)
39 229.64 36.904 5.909
Independent Samples Testa
Levene's
Test for
Equality of
Variances
t-test for Equality of Means
F Sig. t df Sig.
(2-
tailed)
Mean
Difference
Std. Error
Difference
95%
Confidence
Interval of the
Difference
Lower Upper
MathScaleScore2012
Equal
variances
assumed
.266 .608 -
.305
81 .761 -2.459 8.062 -
18.500
13.582
Equal
variances
not
assumed
-
.305
79.552 .761 -2.459 8.068 -
18.517
13.598

277
Independent Samples t-test – Comparison of Females
Group Statisticsa
Treatment N Mean Std. Deviation Std. Error
Mean
MathScaleScore2012
Alternative Treatment
(Everyday Math)
61 224.20 31.332 4.012
Experimental Treatment
(Singapore Math)
61 215.28 37.513 4.803
Independent Samples Testa
Levene's
Test for
Equality of
Variances
t-test for Equality of Means
F Sig. t df Sig.
(2-
tailed)
Mean
Difference
Std. Error
Difference
95%
Confidence
Interval of the
Difference
Lower Upper
MathScaleScore2012
Equal
variances
assumed
4.879 .029 1.425 120 .157 8.918 6.258 -
3.472
21.308
Equal
variances
not
assumed
1.425 116.310 .157 8.918 6.258 -
3.476
21.312

278
APPENDIX E
Correlation Analysis (Hispanic)
Descriptive Statistics
Mean Std. Deviation N
SYs1011Attendance 349.071 19.4876 77
MathScaleScore2012 229.857 35.3150 77
Correlation Analysis (Hispanic) – Attendance and 2012 NJ ASK5 Performance
Correlations
SYs1011Attendance MathScaleScore2012
SYs1011Attendance
Pearson Correlation 1 .408**
Sig. (2-tailed) .000
N 77 77
MathScaleScore2012
Pearson Correlation .408** 1
Sig. (2-tailed) .000
N 77 77
**. Correlation is significant at the 0.01 level (2-tailed).