A comparative analysis of Australian food distribution channels 2007
95
D E P A R T M E N T O F A G R I C U L T U R E , F I S H E R I E S A N D F O R E S T R Y A comparative analysis of Australian food distribution channels
Transcript of A comparative analysis of Australian food distribution channels 2007

D E P A R T M E N T O F A G R I C U L T U R E , F I S H E R I E S A N D F O R E S T R Y
A comparative analysis of Australian food distribution channels

A comparative analysis of Australian food distribution channelsPrepared for the Australian Government Department of Agriculture, Fisheries and Forestry by Freshlogic

© Commonwealth of Australia 2007
This work is copyright. The Copyright Act 1968 permits fair dealing for study, research, news reporting, criticism or review. Selected passages, tables or diagrams may be reproduced for such purposes provided acknowledgment of the source is included. Major extracts or the entire document may not be reproduced by any process without the written permission of the Executive Manager, Food and Agriculture Division, Australian Government Department of Agriculture, Fisheries and Forestry, GPO Box 858, Canberra ACT 2601.
ISBN 978-0-9803714-0-6
This publication should be cited as: Spencer, S & Kneebone, M 2007, FoodMap: A comparative analysis of Australian food distribution channels, Australian Government Department of Agriculture, Fisheries and Forestry, Canberra.
Other portfolio publications of possible interest include: ABARE 2007, Australian Food Statistics 2006, Australian Government Department of Agriculture, Fisheries and Forestry, Canberra. ABARE 2006, Australian Food Industry: Performance and Competitiveness, Australian Government Department of Agriculture, Fisheries and Forestry, Canberra. Food News Bulletin (published quarterly), Australian Government Department of Agriculture, Fisheries and Forestry, Canberra.
For copies of these publications contact: Australian Government Department of Agriculture, Fisheries and Forestry GPO Box 858, Canberra ACT 2601 Telephone: +61 2 6272 4161 Email: [email protected] Internet site: www.daff.gov.au/foodinfo
For other business information go to www.business.gov.au
Disclaimer
The Australian Government Department of Agriculture, Fisheries and Forestry seeks to publish its work to the highest professional standards. However, it cannot accept responsibility for any consequences arising from the use of information herein. Readers should rely on their own skill and judgment in applying any information for analysis to particular issues or circumstances.
Views expressed in this publication are not necessarily the views of the Commonwealth. This publication is made available on the understanding that the Commonwealth is not thereby engaged in rendering professional advice. Before relying on material in this publication, users should independently verify the accuracy, currency, completeness and relevance of the information for their purposes and obtain any appropriate professional advice.

A comparative analysis of Australian food distribution channelsiv
AcknowledgementsThe comparative analysis of Australian food distribution channels was initiated by the Australian Government Department of Agriculture, Fisheries and Forestry in 2006 in recognition of the need to provide more information to food companies to enable them to take advantage of emerging supply opportunities.
The project was conducted by Steve Spencer and Martin Kneebone, Directors of Freshlogic, and managed by staff in the Food Policy section of the Department’s Food and Agriculture Division.

A comparative analysis of Australian food distribution channels v
Contents
Acknowledgements . . . . . . . . . . . . . . . . . . . . . . . . . . . . . . . . . . . . . . . . . . . . . . . . . . . . . . . . . . . . . . . . . . . . . . . . . . . . . . . . . . . . . . . . . . . . . . . . . . . . . . . . . . . . . . . . . . . . . . . . . . . . . . . . . . . . . . . . . . . . . . . . . . . . . . .iv
Figures . . . . . . . . . . . . . . . . . . . . . . . . . . . . . . . . . . . . . . . . . . . . . . . . . . . . . . . . . . . . . . . . . . . . . . . . . . . . . . . . . . . . . . . . . . . . . . . . . . . . . . . . . . . . . . . . . . . . . . . . . . . . . . . . . . . . . . . . . . . . . . . . . . . . . . . . . . . . . . . . . . . . vi
Tables . . . . . . . . . . . . . . . . . . . . . . . . . . . . . . . . . . . . . . . . . . . . . . . . . . . . . . . . . . . . . . . . . . . . . . . . . . . . . . . . . . . . . . . . . . . . . . . . . . . . . . . . . . . . . . . . . . . . . . . . . . . . . . . . . . . . . . . . . . . . . . . . . . . . . . . . . . . . . . . . . . . . .vii
Glossary and abbreviations . . . . . . . . . . . . . . . . . . . . . . . . . . . . . . . . . . . . . . . . . . . . . . . . . . . . . . . . . . . . . . . . . . . . . . . . . . . . . . . . . . . . . . . . . . . . . . . . . . . . . . . . . . . . . . . . . . . . . . . . . . . . . . . . . . . . . . . . . . . . .vii
Executive summary . . . . . . . . . . . . . . . . . . . . . . . . . . . . . . . . . . . . . . . . . . . . . . . . . . . . . . . . . . . . . . . . . . . . . . . . . . . . . . . . . . . . . . . . . . . . . . . . . . . . . . . . . . . . . . . . . . . . . . . . . . . . . . . . . . . . . . . . . . . . . . . . . . . . . . . 1
Section 1 Introduction . . . . . . . . . . . . . . . . . . . . . . . . . . . . . . . . . . . . . . . . . . . . . . . . . . . . . . . . . . . . . . . . . . . . . . . . . . . . . . . . . . . . . . . . . . . . . . . . . . . . . . . . . . . . . . . . . . . . . . . . . . . . . . . . . . . . . . . . . . . . . . . . . . . 4
Section 2 The food industry environment . . . . . . . . . . . . . . . . . . . . . . . . . . . . . . . . . . . . . . . . . . . . . . . . . . . . . . . . . . . . . . . . . . . . . . . . . . . . . . . . . . . . . . . . . . . . . . . . . . . . . . . . . . . . . . . . . . . . . . . . . . . . .10
Section 3 Overview of the analysis. . . . . . . . . . . . . . . . . . . . . . . . . . . . . . . . . . . . . . . . . . . . . . . . . . . . . . . . . . . . . . . . . . . . . . . . . . . . . . . . . . . . . . . . . . . . . . . . . . . . . . . . . . . . . . . . . . . . . . . . . . . . . . . . . . . . .20
Section 4 Mapping food categories. . . . . . . . . . . . . . . . . . . . . . . . . . . . . . . . . . . . . . . . . . . . . . . . . . . . . . . . . . . . . . . . . . . . . . . . . . . . . . . . . . . . . . . . . . . . . . . . . . . . . . . . . . . . . . . . . . . . . . . . . . . . . . . . . . . . .32
Section 5 Mapping distribution channels . . . . . . . . . . . . . . . . . . . . . . . . . . . . . . . . . . . . . . . . . . . . . . . . . . . . . . . . . . . . . . . . . . . . . . . . . . . . . . . . . . . . . . . . . . . . . . . . . . . . . . . . . . . . . . . . . . . . . . . . . . . . . .56
Section 6 Supply chain participants. . . . . . . . . . . . . . . . . . . . . . . . . . . . . . . . . . . . . . . . . . . . . . . . . . . . . . . . . . . . . . . . . . . . . . . . . . . . . . . . . . . . . . . . . . . . . . . . . . . . . . . . . . . . . . . . . . . . . . . . . . . . . . . . . . . .76
Conclusion . . . . . . . . . . . . . . . . . . . . . . . . . . . . . . . . . . . . . . . . . . . . . . . . . . . . . . . . . . . . . . . . . . . . . . . . . . . . . . . . . . . . . . . . . . . . . . . . . . . . . . . . . . . . . . . . . . . . . . . . . . . . . . . . . . . . . . . . . . . . . . . . . . . . . . . . . . . . . . . .84
Bibliography. . . . . . . . . . . . . . . . . . . . . . . . . . . . . . . . . . . . . . . . . . . . . . . . . . . . . . . . . . . . . . . . . . . . . . . . . . . . . . . . . . . . . . . . . . . . . . . . . . . . . . . . . . . . . . . . . . . . . . . . . . . . . . . . . . . . . . . . . . . . . . . . . . . . . . . . . . . . . .87
A comparative analysis of Australian food distribution channelsvi
FiguresFigure 1 Channels of the Australian food market . . . . . . . . . . . . . . . . . . . . . . . . . . . . . . . . . . . . . .11Figure 2 Share of retail food market in 2006 . . . . . . . . . . . . . . . . . . . . . . . . . . . . . . . . . . . . . . . . .11Figure 3 Approach to the analysis . . . . . . . . . . . . . . . . . . . . . . . . . . . . . . . . . . . . . . . . . . . . . . . . .12Figure 4 Monthly year-on-year food sales by channel . . . . . . . . . . . . . . . . . . . . . . . . . . . . . . . . . . .14Figure 5 Relative growth rates in sales by major channel . . . . . . . . . . . . . . . . . . . . . . . . . . . . . . . .14Figure 6 Retailer “same store” sales v inflation . . . . . . . . . . . . . . . . . . . . . . . . . . . . . . . . . . . . . . .14Figure 7 Pressure points in the food value chain . . . . . . . . . . . . . . . . . . . . . . . . . . . . . . . . . . . . . .16Figure 8 Structure of food categories used in this analysis . . . . . . . . . . . . . . . . . . . . . . . . . . . . . .23Figure 9 Structure of food distribution channels used in this analysis . . . . . . . . . . . . . . . . . . . . . .24Figure 10 Overview of the approach to mapping of category & channels structures . . . . . . . . . . . .25Figure 11 Example assessment charts . . . . . . . . . . . . . . . . . . . . . . . . . . . . . . . . . . . . . . . . . . . . . .26Figure 12 Summary of the comparative assessments of value chains . . . . . . . . . . . . . . . . . . . . . . . .27Figure 13 Comparative assessment of Informed Market criteria . . . . . . . . . . . . . . . . . . . . . . . . . . .28Figure 14 Comparative assessment of Diversity criteria . . . . . . . . . . . . . . . . . . . . . . . . . . . . . . . . .28Figure 15 Comparative assessment of Innovation Adoption criteria . . . . . . . . . . . . . . . . . . . . . . . .29Figure 16 Comparative assessment of Value Capture criteria . . . . . . . . . . . . . . . . . . . . . . . . . . . . .29Figure 17 Comparative assessment of Primary yield criteria . . . . . . . . . . . . . . . . . . . . . . . . . . . . . .30Figure 18 Comparative assessment of Logistical Efficiency criteria . . . . . . . . . . . . . . . . . . . . . . . .30Figure 19 Dairy industry use of milk in products 2005/06. . . . . . . . . . . . . . . . . . . . . . . . . . . . . . . .33Figure 20 Dairy industry channel overview . . . . . . . . . . . . . . . . . . . . . . . . . . . . . . . . . . . . . . . . . .33Figure 21 Milk products value chain assessment . . . . . . . . . . . . . . . . . . . . . . . . . . . . . . . . . . . . . .34Figure 22 Milk products category map. . . . . . . . . . . . . . . . . . . . . . . . . . . . . . . . . . . . . . . . . . . . . .34Figure 23 Dairy products value chain assessment. . . . . . . . . . . . . . . . . . . . . . . . . . . . . . . . . . . . . .35Figure 24 Dairy products category map . . . . . . . . . . . . . . . . . . . . . . . . . . . . . . . . . . . . . . . . . . . . .35Figure 25 Use of flour in food products . . . . . . . . . . . . . . . . . . . . . . . . . . . . . . . . . . . . . . . . . . . .36Figure 26 Flour products channel overview . . . . . . . . . . . . . . . . . . . . . . . . . . . . . . . . . . . . . . . . . .36Figure 27 Bread & bakery products value chain assessment . . . . . . . . . . . . . . . . . . . . . . . . . . . . . .37Figure 28 Bread & bakery products category map . . . . . . . . . . . . . . . . . . . . . . . . . . . . . . . . . . . . .37Figure 29 Apparent shares of per-capita animal protein consumption . . . . . . . . . . . . . . . . . . . . . . .38Figure 30 Beef products channel overview . . . . . . . . . . . . . . . . . . . . . . . . . . . . . . . . . . . . . . . . . .38Figure 31 Lamb products channel overview . . . . . . . . . . . . . . . . . . . . . . . . . . . . . . . . . . . . . . . . . .39Figure 32 Beef & lamb value chain assessment . . . . . . . . . . . . . . . . . . . . . . . . . . . . . . . . . . . . . . .40Figure 33 Beef & lamb products category map. . . . . . . . . . . . . . . . . . . . . . . . . . . . . . . . . . . . . . . .40Figure 34 Source of pork consumed in domestic markets . . . . . . . . . . . . . . . . . . . . . . . . . . . . . . . .41Figure 35 Pork products channel overview. . . . . . . . . . . . . . . . . . . . . . . . . . . . . . . . . . . . . . . . . . .41Figure 36 Pork value chain assessment . . . . . . . . . . . . . . . . . . . . . . . . . . . . . . . . . . . . . . . . . . . . .42Figure 37 Pork and smallgoods category map. . . . . . . . . . . . . . . . . . . . . . . . . . . . . . . . . . . . . . . . .42
Figure 38 Poultry products channel overview . . . . . . . . . . . . . . . . . . . . . . . . . . . . . . . . . . . . . . . .43Figure 39 Chicken meat value chain assessment. . . . . . . . . . . . . . . . . . . . . . . . . . . . . . . . . . . . . . .44Figure 40 Poultry products category map . . . . . . . . . . . . . . . . . . . . . . . . . . . . . . . . . . . . . . . . . . .44Figure 41 Source of edible seafood volumes consumed in domestic markets . . . . . . . . . . . . . . . . . .45Figure 42 Seafood products channel overview . . . . . . . . . . . . . . . . . . . . . . . . . . . . . . . . . . . . . . . .45Figure 43 Fresh seafood value chain assessment . . . . . . . . . . . . . . . . . . . . . . . . . . . . . . . . . . . . . .46Figure 44 Fresh seafood products category map . . . . . . . . . . . . . . . . . . . . . . . . . . . . . . . . . . . . . .46Figure 45 Processed seafood value chain assessment . . . . . . . . . . . . . . . . . . . . . . . . . . . . . . . . . . .47Figure 46 Processed seafood products category map . . . . . . . . . . . . . . . . . . . . . . . . . . . . . . . . . . .47Figure 47 Egg value chain assessment. . . . . . . . . . . . . . . . . . . . . . . . . . . . . . . . . . . . . . . . . . . . . .48Figure 48 Egg products category map . . . . . . . . . . . . . . . . . . . . . . . . . . . . . . . . . . . . . . . . . . . . . .48Figure 49 Fruit and vegetable products channel overview. . . . . . . . . . . . . . . . . . . . . . . . . . . . . . . .49Figure 50 Fresh fruit & vegetable value chain assessments. . . . . . . . . . . . . . . . . . . . . . . . . . . . . . .50Figure 51 Fresh fruit & vegetables category map . . . . . . . . . . . . . . . . . . . . . . . . . . . . . . . . . . . . . .50Figure 52 Processed fruit & vegetable value chain assessment . . . . . . . . . . . . . . . . . . . . . . . . . . . .51Figure 53 Processed fruit & vegetables category map . . . . . . . . . . . . . . . . . . . . . . . . . . . . . . . . . .51Figure 54 Dry food groceries value chain assessment . . . . . . . . . . . . . . . . . . . . . . . . . . . . . . . . . . .52Figure 55 Dry food grocery products category map . . . . . . . . . . . . . . . . . . . . . . . . . . . . . . . . . . . .52Figure 56 Alcoholic beverages value chain assessment. . . . . . . . . . . . . . . . . . . . . . . . . . . . . . . . . .53Figure 57 Alcoholic beverages category map . . . . . . . . . . . . . . . . . . . . . . . . . . . . . . . . . . . . . . . . .53Figure 58 Chilled beverages value chain assessment . . . . . . . . . . . . . . . . . . . . . . . . . . . . . . . . . . .54Figure 59 Chilled beverages category map. . . . . . . . . . . . . . . . . . . . . . . . . . . . . . . . . . . . . . . . . . .54Figure 60 Full service supermarket value chain assessment. . . . . . . . . . . . . . . . . . . . . . . . . . . . . . .57Figure 61 Full service supermarket channel map. . . . . . . . . . . . . . . . . . . . . . . . . . . . . . . . . . . . . . .58Figure 62 Independent & convenience retail value chain assessments. . . . . . . . . . . . . . . . . . . . . . .59Figure 63 Independent & convenience retail channel map . . . . . . . . . . . . . . . . . . . . . . . . . . . . . . .60Figure 64 Independent & convenience retail value chain assessments. . . . . . . . . . . . . . . . . . . . . . .61Figure 65 Specialty retail channel map . . . . . . . . . . . . . . . . . . . . . . . . . . . . . . . . . . . . . . . . . . . . .62Figure 66 QSR value chain assessments. . . . . . . . . . . . . . . . . . . . . . . . . . . . . . . . . . . . . . . . . . . . .63Figure 67 QSR channel map . . . . . . . . . . . . . . . . . . . . . . . . . . . . . . . . . . . . . . . . . . . . . . . . . . . . .64Figure 68 Independent takeaway value chain assessments . . . . . . . . . . . . . . . . . . . . . . . . . . . . . . .65Figure 69 Independent takeaway channel map. . . . . . . . . . . . . . . . . . . . . . . . . . . . . . . . . . . . . . . .66Figure 70 Dining out value chain assessments . . . . . . . . . . . . . . . . . . . . . . . . . . . . . . . . . . . . . . . .67Figure 71 Dining out channel map. . . . . . . . . . . . . . . . . . . . . . . . . . . . . . . . . . . . . . . . . . . . . . . . .68Figure 72 Events and leisure channel map . . . . . . . . . . . . . . . . . . . . . . . . . . . . . . . . . . . . . . . . . . .70Figure 73 Institutional healthcare value chain assessments . . . . . . . . . . . . . . . . . . . . . . . . . . . . . .71Figure 74 Institutional healthcare channel map. . . . . . . . . . . . . . . . . . . . . . . . . . . . . . . . . . . . . . .72

A comparative analysis of Australian food distribution channels vii
Figure 75 Other institutional food value chain assessment. . . . . . . . . . . . . . . . . . . . . . . . . . . . . . .73Figure 76 Other institutional food channel map. . . . . . . . . . . . . . . . . . . . . . . . . . . . . . . . . . . . . . .74Figure 77 Foodservice distributors value chain assessment. . . . . . . . . . . . . . . . . . . . . . . . . . . . . . .77Figure 78 Specialist meat retailers value chain assessment. . . . . . . . . . . . . . . . . . . . . . . . . . . . . . .78Figure 79 Specialist meat wholesalers value chain assessment . . . . . . . . . . . . . . . . . . . . . . . . . . . .79Figure 80 Different forms of integration being taken in meat wholesaling. . . . . . . . . . . . . . . . . . . .79Figure 81 Liquor wholesalers value chain assessment . . . . . . . . . . . . . . . . . . . . . . . . . . . . . . . . . . .80Figure 82 Distribution franchises value chain assessment . . . . . . . . . . . . . . . . . . . . . . . . . . . . . . .81Figure 83 Commercial caterers value chain assessment . . . . . . . . . . . . . . . . . . . . . . . . . . . . . . . .82
TablesTable 1 Summary of opportunities identified in the study. . . . . . . . . . . . . . . . . . . . . . . . . . . . . . . . .7Table 2 Category growth comparisons . . . . . . . . . . . . . . . . . . . . . . . . . . . . . . . . . . . . . . . . . . . . . .14Table 3 Summary of pressure points in the food supply chain . . . . . . . . . . . . . . . . . . . . . . . . . . . . .17Table 4 Summary of information challenges in the food supply chain . . . . . . . . . . . . . . . . . . . . . . .22Table 5 Assessment criteria used in the comparative analysis . . . . . . . . . . . . . . . . . . . . . . . . . . . . .26Table 6 Dairy industry major products 2005/06 . . . . . . . . . . . . . . . . . . . . . . . . . . . . . . . . . . . . . . .33Table 7 Grains industry market mix . . . . . . . . . . . . . . . . . . . . . . . . . . . . . . . . . . . . . . . . . . . . . . . .36Table 8 Seafood market mix in 2005 . . . . . . . . . . . . . . . . . . . . . . . . . . . . . . . . . . . . . . . . . . . . . . .45Table 9 Fruit & vegetable market mix in 2005 . . . . . . . . . . . . . . . . . . . . . . . . . . . . . . . . . . . . . . . .49Table 10 Structure of the grocery retail channel. . . . . . . . . . . . . . . . . . . . . . . . . . . . . . . . . . . . . . .57Table 11 Structure of the independent & convenience retail channels . . . . . . . . . . . . . . . . . . . . . . .59Table 12 Structure of the specialty retail channels . . . . . . . . . . . . . . . . . . . . . . . . . . . . . . . . . . . . .61Table 13 Structure of the QSR channel. . . . . . . . . . . . . . . . . . . . . . . . . . . . . . . . . . . . . . . . . . . . . .63Table 14 Structure of the independent takeaway channel . . . . . . . . . . . . . . . . . . . . . . . . . . . . . . . .65Table 15 Structure of the dining out channel . . . . . . . . . . . . . . . . . . . . . . . . . . . . . . . . . . . . . . . . .67Table 16 Structure of the events & leisure channel . . . . . . . . . . . . . . . . . . . . . . . . . . . . . . . . . . . . .69Table 17 Structure of the institutional healthcare channel . . . . . . . . . . . . . . . . . . . . . . . . . . . . . . .71Table 18 Structure of the other institutional food channel . . . . . . . . . . . . . . . . . . . . . . . . . . . . . . .73Table 19 Major foodservice distributors . . . . . . . . . . . . . . . . . . . . . . . . . . . . . . . . . . . . . . . . . . . . .77Table 20 Examples of specialist meat retailers . . . . . . . . . . . . . . . . . . . . . . . . . . . . . . . . . . . . . . . .78Table 21 Examples of specialist meat wholesalers. . . . . . . . . . . . . . . . . . . . . . . . . . . . . . . . . . . . . .79Table 22 Examples of liquor wholesalers . . . . . . . . . . . . . . . . . . . . . . . . . . . . . . . . . . . . . . . . . . . .80Table 23 Examples of major commercial caterers . . . . . . . . . . . . . . . . . . . . . . . . . . . . . . . . . . . . . .82
Glossary and abbreviationsABS Australian Bureau of Statistics
Category A food or beverage group
Channel A segment of the retail market
FMCG Fast moving consumer goods
Foodservice The supply of food and beverages and other related inputs to food establishments providing meals
FSS Full service supermarkets
NDC National distribution centre
QSR Quick service restaurant
RDC Regional distribution centre

A comparative analysis of Australian food distribution channels1
Executive summary Executive Summary
A comparative analysis of Australian food distribution channels1
Purpose of the study
The Department of Agriculture, Fisheries and Forestry commissioned this study to provide a comparative analysis of Australian food distribution channels. The analysis covers grocery retail, convenience stores and the various channels and sub-channels that make up what is known as foodservice.
Approach
Against a background of change in the food industry, the analysis has sought to explain the structures of important distribution flows, categories and channels. The work has found each category and channel has its own peculiarities, driven by the nature of the product, the product’s sources, the competitive environment within the supply chain and marketplace, and the different ownership and integration arrangements.
As part of the mapping and analysis process, the study has provided a relative assessment of the nature of the value chains for the major food and beverage categories in terms of their ability to capture and add value.
One of the study’s major aims is to identify opportunities to improve food industry performance in the face of changing consumer preferences, pressures from the global food market, and the strategic responses of major food sector participants.
Major findings
The domestic food market is highly competitive. The retail food market is concentrated in the grocery retail channel, but recent trends indicate that independent fresh food specialists and takeaway and dining out establishments are winning a greater “share of stomach” as consumers eat outside the home more.
The pressures of performance and increasing competition on the major retail chains will continue to compel them to streamline costs and drive category performance in existing supermarket networks, alongside the expansion of their retail format. At the same time, Australian consumers are demanding more convenience and time-saving solutions to shopping and meal preparation.
Over time, these forces will continue to shape the requirements and opportunities for retailers, as well as suppliers of fresh and processed foods. Analysis indicates that food sales into the foodservice sector will continue to grow faster than conventional grocery retail channels.
On the whole, the assessment shows a food industry undergoing significant challenges, yet at a category level it finds vastly different conditions and approaches to respond to challenge and opportunity.
Opportunities
Suppliers have significant opportunity to tap into the increasing growth and diversity of non-supermarket retail channels, especially those providing convenience meals and eating occasions that meet increasingly complex consumer needs.
Many of these channels are growing faster than the average being achieved by the total food market. At the same time, the diversity presents challenges in assessing and managing the complex volume and value determinants in each channel and sub-channel of the retail market.
Product and process innovation will play a large part in the success that can be achieved. This will add convenience to a product solution rather than the traditional approach of supplying commodity lines in the form also available in retail stores.
The institutional market is also growing in importance as a higher proportion of our population is ageing. Increased concerns about the nutritional content of diets of people living in care will increase the sophistication of the meal offering.
As the institutional sector expands and the performance demands rise, cost management will become more critical and will increase the likely role of contract meal preparation to specification.
The environment continues to provide opportunity for new entrants in food retail, not only in specialty areas and specific food categories but also where there is scope to improve the integration of an offering across added-value processing and wholesale supply.
As a result, specialists (meat, fresh food, bakery, deli, etc) and those focusing on convenience—including independent grocery outlets able to offer greater product flexibility—will have more influence.

A comparative analysis of Australian food distribution channels 2
Executive Summary
A comparative analysis of Australian food distribution channels 2
The way forward
Opportunities for the food industry to improve performance and capture value are based on four major themes:
a) Innovation in product form
b) Service opportunities in specialty retail channels
c) Scope to provide better solutions to capitalise on growth in institutional foodservice
d) Scope to improve information and intelligence on market conditions, consumer needs and the requirements of foodservice establishments.
The opportunities in a) to c), however, will be realised only with a much greater investment in information and intelligence. This will give the industry a better understanding of how to scope, develop and deliver solutions offered by an evolving market.
An inability to address information challenges will limit the industry’s scope to take advantage of changing market and supply chain conditions—and to respond to the significant pressure points, identified in this report, in grocery retail markets.
Industry sectors and category participants need to overcome their resistance to working with one another to obtain and share information on the overall market. This will be achieved only if the investment required provides a clearer picture of the overall market, the conditions within supply chains, as well as an effective basis to analyse trends in consumer preferences. Collective industry or sector investments will have a role in providing a better information environment, but only where the investment can provide a better “whole of industry” result—i.e. to grow total business or capture more value, or both.
Challenges
This study identifies a number of information challenges and deficiencies.
The grocery retail market is well serviced with information that allows ready analysis of the changes occurring in demand. On the other hand, the foodservice sector, which deals with the supply of food and meals eaten out of the home, is extremely diverse and poorly serviced with information. The study noted only one sector—the dairy industry—with an arrangement to collate data on foodservice value and volume. Most sectors rely, at best, “on estimates”.
The lack of reliable information is the result of food sales data outside the grocery channel being syndicated. This makes it difficult to develop precise measures of the share of food sales and, importantly for the food industry, the relative rates of growth through the different channels outside of grocery stores. Surveys of retail sales activity provide good indicators of change at a broad level but fail to inform at the detailed level needed to assist investment and marketing decisions.
Without such data sources, food industry suppliers cannot, and will not be able to, fully understand, and take better advantage of the growth opportunities in the current and future climate.
The food sector is under increasing competitive pressure from commodity imports in fresh and processed products. This will ultimately take a greater share of available foodservice opportunities. Food businesses can protect themselves by understanding the local market better, by tailoring how they cater for and build sustainable relationships, and by overcoming barriers to commoditisation. Without better knowledge of the size of the market and product opportunities and threats, many suppliers will continue to treat foodservice channels as “residual” markets.
A large element of available opportunities will come from suppliers providing a solution rather than a packaged product. It will be critical however to firstly gain an understanding of the breadth of need through distribution channels based on the varying needs of buyers and establishment operators.


Section 1 Introduction
This section sets out the study’s purpose and the approach taken, and summarises the major findings used in the analysis.

section 1 Introduction
A comparative analysis of Australian food distribution channels5
section 1 IntroductionBackground
Project background
The Australian food industry is undergoing a period of rapid change. Significant rationalisation and integration of the supply chain are occurring as large retailers seek efficiencies through greater savings in scale and cost. Changing lifestyles, demographics and consumer food-shopping habits are driving the evolution of food distribution and retailing formats. An increasing volume of food is now being distributed through non-supermarket channels, and the diversification and growth of these channels are providing significant opportunities for food processors.
Information on non-supermarket distribution channels, however, is often limited and fragmented, making it difficult for many food companies to understand the evolving industry structure and take advantage of emerging supply opportunities.
The Department
The Australian Government Department of Agriculture, Fisheries and Forestry has dual roles: to provide customer services to the agricultural, food, fisheries and forestry industries, and to address natural resource management challenges. The Department also helps build and promote the whole food-and-fibre chain, from paddock to plate, for domestic and international markets. Its contribution to its customers is to help their industries become more competitive, profitable and sustainable.
Terms of reference
The objective of the project is to identify the various distribution channels for Australian foods, examine their respective attributes and features and analyse their sourcing and supply requirements.
The aim of the study is to:
• identify the various distribution channels for Australian foods, including examination of their respective characteristics, features and growth prospects
• document the types of products distributed through those channels and the volume and value of those products
• analyse the customer/supplier relationships existing within the identified channels and examine the features of profitable and sustainable business relationships
• analyse the nature of information-sharing, supply-chain collaboration and innovation within each channel and identify opportunities to improve supply-chain competitiveness
• identify opportunities for food companies to better meet the needs of the distribution channels e.g. better portion control or prepared food options
• investigate ways in which the efficiency and profitability of the non-supermarket food sector could be improved.
Outline of the approach
The study describes the structure of food and beverage distribution in the Australian retail market.
It includes:
• an outline of the major changes affecting the food retail market segments
• a mapping of the structure of food distribution chains in the Australian food industry

section 1 Introductionsection 1 Introduction
A comparative analysis of Australian food distribution channels 6
Approach and Findings
• identification of drivers of volume and value for major food groups within each of the channels—both in terms of the specific factors to each master and sub-channel and general economic and other market influences that affect the level of business activity
• assessment of each value chain’s relative ability to create and capture value
• identification of the following in respect of major channels and categories:
– opportunities for enhancing the returns to food industry participants
– scope for greater innovation
– scope for reduction in key risks areas
– knowledge and information gaps
– capacity development opportunities
– opportunities to improve competitiveness of supply chains.
The key component of the comparative analysis has been to explain the structures of a number of important distribution flows and categories and channels, using a consistent charting approach as outlined on page 25.
Sections 4 and 5 provide a mapping of supply chains from two aspects:
1. The supply of major categories of food to the market—based on the structure of categories (see page 23)
2. The servicing of major food distribution channels—based on the channel structure (see page 24).
Each category and channel has its own peculiarities, driven by the nature of the product and its sources, the competitive environment within the supply chain and marketplace, and the ownership structures. Section 6 profiles some important supply chain participants in order to expand on that analysis.
Assessment methodology
As part of the mapping and analysis process, a relative assessment of the nature of the value chains for the major food and beverage categories has been conducted in terms of their ability to capture and add value. The process is explained on page 26.
An overall comparative analysis of the food categories is presented on page 27.
The assessments are based on whole-of-chain and whole-of-category, and reflect an attempt to encompass general category conditions in each case. There will be exceptions where better-than-“category average” performance will exist through innovation in product, process and marketing.
Major findings
The study has identified, on pages 7 and 8, opportunities for food industry participants to consider. These have been drawn from the overall report, including comparative assessments of value-chain structures, the state of the information in use across the food industry, and an examination of the dynamics within channels and sub-channels of the consumer market.
Significant changes are having an impact on the Australian food sector. These are arising from:
• increasing globalisation of food production and retail markets
• trends in consumer preference
• application of supply chain and category management strategies by major retail groups.
Section 2 outlines the nature of these forces and their effect on Australian food and beverage industries. The effects of the changes and the strategies being implemented to address retailer performance are outlined on page 15.
These pressures, identified on pages 17 and 18, give rise to challenges and opportunities for food industry participants.
The process of mapping, quantifying and assessing the respective distribution chains has led to a number of information challenges, summarised on pages 21 and 22.
section 1 Introduction
A comparative analysis of Australian food distribution channels7
section 1 Introduction
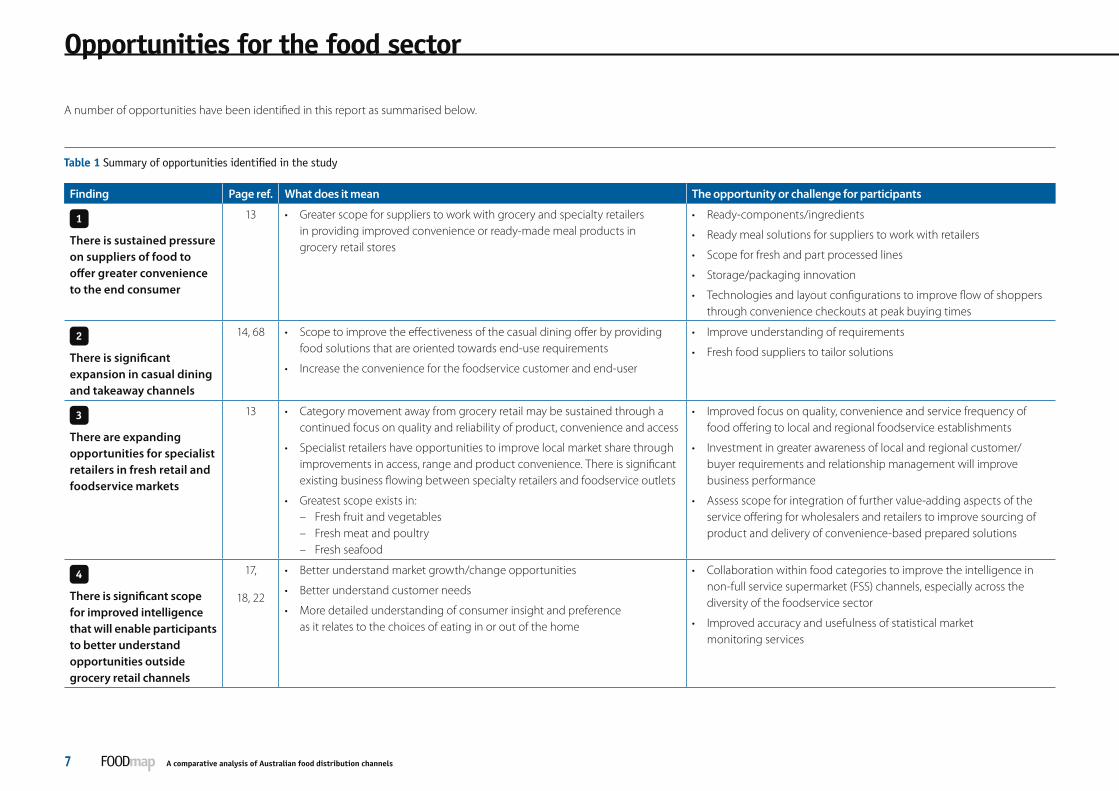
A number of opportunities have been identified in this report as summarised below.
Table 1 Summary of opportunities identified in the study
Finding Page ref. What does it mean The opportunity or challenge for participants
1 There is sustained pressure on suppliers of food to offer greater convenience to the end consumer
13 • Greater scope for suppliers to work with grocery and specialty retailers in providing improved convenience or ready-made meal products in grocery retail stores
• Ready-components/ingredients
• Ready meal solutions for suppliers to work with retailers
• Scope for fresh and part processed lines
• Storage/packaging innovation
• Technologies and layout configurations to improve flow of shoppers through convenience checkouts at peak buying times
2 There is significant expansion in casual dining and takeaway channels
14, 68 • Scope to improve the effectiveness of the casual dining offer by providing food solutions that are oriented towards end-use requirements
• Increase the convenience for the foodservice customer and end-user
• Improve understanding of requirements
• Fresh food suppliers to tailor solutions
3 There are expanding opportunities for specialist retailers in fresh retail and foodservice markets
13 • Category movement away from grocery retail may be sustained through a continued focus on quality and reliability of product, convenience and access
• Specialist retailers have opportunities to improve local market share through improvements in access, range and product convenience. There is significant existing business flowing between specialty retailers and foodservice outlets
• Greatest scope exists in:– Fresh fruit and vegetables– Fresh meat and poultry– Fresh seafood
• Improved focus on quality, convenience and service frequency of food offering to local and regional foodservice establishments
• Investment in greater awareness of local and regional customer/buyer requirements and relationship management will improve business performance
• Assess scope for integration of further value-adding aspects of the service offering for wholesalers and retailers to improve sourcing of product and delivery of convenience-based prepared solutions
4 There is significant scope for improved intelligence that will enable participants to better understand opportunities outside grocery retail channels
17,
18, 22
• Better understand market growth/change opportunities
• Better understand customer needs
• More detailed understanding of consumer insight and preference as it relates to the choices of eating in or out of the home
• Collaboration within food categories to improve the intelligence in non-full service supermarket (FSS) channels, especially across the diversity of the foodservice sector
• Improved accuracy and usefulness of statistical market monitoring services
Opportunities for the food sector

section 1 Introductionsection 1 Introduction
A comparative analysis of Australian food distribution channels 8
Finding Page ref. What does it mean The opportunity or challenge for participants
5 Some categories suffer from a general lack of market knowledge and limited collaboration in managing supply chain information
22 • Certain categories and channels are characterised by poor information flows and market visibility
• These are more pronounced where numbers of disaggregated suppliers deal through significant intermediaries
• This contributes to a lack of understanding of the growth patterns in markets outside FSS channels
• Understanding of total market will aid management of market
• Collaboration to overcome the voids of information that are created by intermediaries
• Encourage and support self-regulatory options for primary sectors that will bring improved visibility and enable more informed decisions by participants.
• These options include use of codes of practice by market participants in fresh products, and forms of selling terms and arrangements in other markets susceptible to pressure points
• Skills and capacity development in supply chain relationship and information management is a critical enabler to improvement
6 Nutritional/cost trade-off in meals served in institutional care
71 • Our ageing population and increasing demands on institutional care will place greater demands on institutional food suppliers to improve the balance of cost and nutritional content of meals provided through that channel
• Increasing tendency by the owners of institutional facilities to further outsource primary meal preparation and delivery functions in order to reduce overall costs
• That trend is concurrent with a greater awareness of the importance of diet management in care facilities
• As the market becomes more sophisticated, greater opportunities will emerge for suppliers to align with commercial caterers to enhance the quality and cost-effectiveness of the meal offering
• Scope to develop more tailored meal solutions for meals served in hospitals and other care facilities
7 Trend towards greater supply of meals through contract arrangements
8 Growth in interest in specialty niche foods
13 • Increasing interest and knowledge in quality specialty foods which enhance the overall eating experience
• Interest may be based on ethical grounds or a wish to indulge in “the story” of the food
• Scope for wider penetration into non-FSS markets and foodservice outlets
• Invest to better understand market and supply chain options in order to effectively reach the target market
• Improve awareness of local and regional specialty suppliers, distributors and retailers


Section 2 The food industry environment
The food industry is affected by a number of macro-trends, partly derived from global sources but also a product of the nature of our consumer base and the ways in which the food retail market has evolved. This section gives an overview of the structure of the food retail market in Australia, and
an insight into the evolving trends and pressures on food industry value chains. It outlines the food industry environment as the setting for the food distribution channels shown in sections 4 and 5.
section 2 The food industry environment
A comparative analysis of Australian food distribution channels11
section 2 The food industry environmentSize and composition
grocery
convenience
specialised
retail
takeaway
dining out
event / leisure
institutional
foodservice
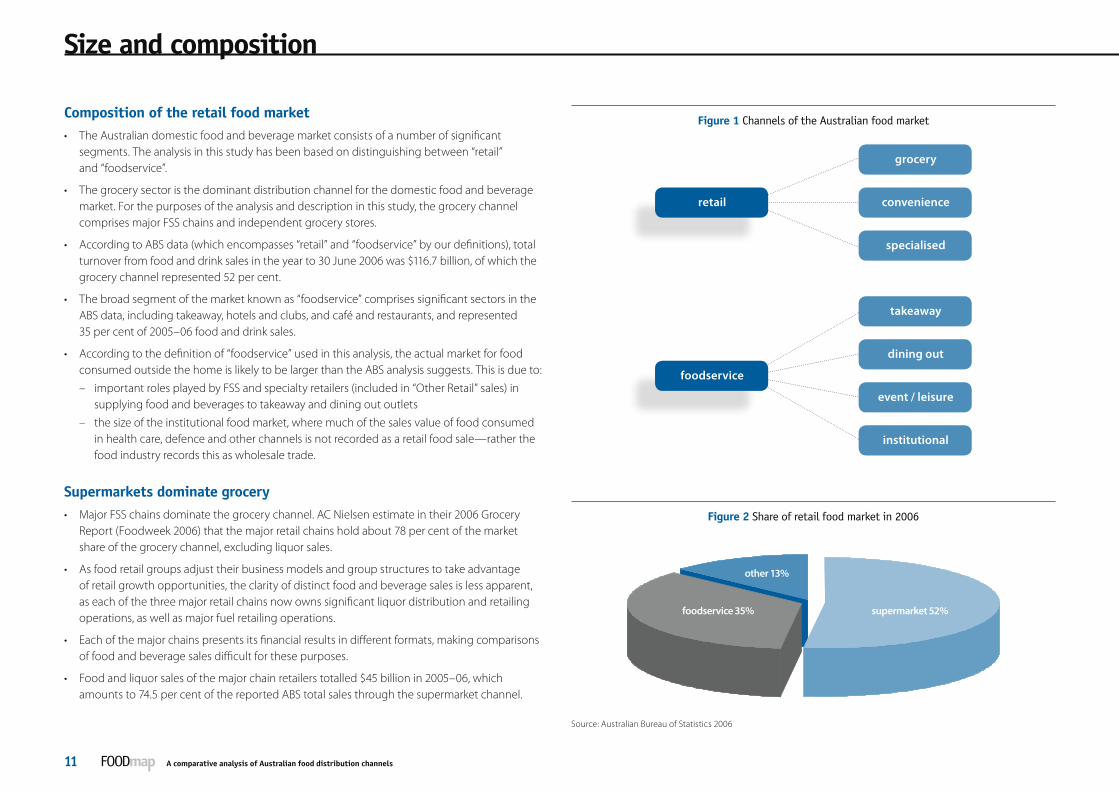
Figure 1 Channels of the Australian food market
Figure 2 Share of retail food market in 2006
other 13%
foodservice 35% supermarket 52%
Source: Australian Bureau of Statistics 2006
Composition of the retail food market • The Australian domestic food and beverage market consists of a number of significant
segments. The analysis in this study has been based on distinguishing between “retail” and “foodservice”.
• The grocery sector is the dominant distribution channel for the domestic food and beverage market. For the purposes of the analysis and description in this study, the grocery channel comprises major FSS chains and independent grocery stores.
• According to ABS data (which encompasses “retail” and “foodservice” by our definitions), total turnover from food and drink sales in the year to 30 June 2006 was $116.7 billion, of which the grocery channel represented 52 per cent.
• The broad segment of the market known as “foodservice” comprises significant sectors in the ABS data, including takeaway, hotels and clubs, and café and restaurants, and represented 35 per cent of 2005–06 food and drink sales.
• According to the definition of “foodservice” used in this analysis, the actual market for food consumed outside the home is likely to be larger than the ABS analysis suggests. This is due to:
– important roles played by FSS and specialty retailers (included in “Other Retail” sales) in supplying food and beverages to takeaway and dining out outlets
– the size of the institutional food market, where much of the sales value of food consumed in health care, defence and other channels is not recorded as a retail food sale—rather the food industry records this as wholesale trade.
Supermarkets dominate grocery• Major FSS chains dominate the grocery channel. AC Nielsen estimate in their 2006 Grocery
Report (Foodweek 2006) that the major retail chains hold about 78 per cent of the market share of the grocery channel, excluding liquor sales.
• As food retail groups adjust their business models and group structures to take advantage of retail growth opportunities, the clarity of distinct food and beverage sales is less apparent, as each of the three major retail chains now owns significant liquor distribution and retailing operations, as well as major fuel retailing operations.
• Each of the major chains presents its financial results in different formats, making comparisons of food and beverage sales difficult for these purposes.
• Food and liquor sales of the major chain retailers totalled $45 billion in 2005–06, which amounts to 74.5 per cent of the reported ABS total sales through the supermarket channel.
section 2 The food industry environmentsection 2 The food industry environment
A comparative analysis of Australian food distribution channels 12
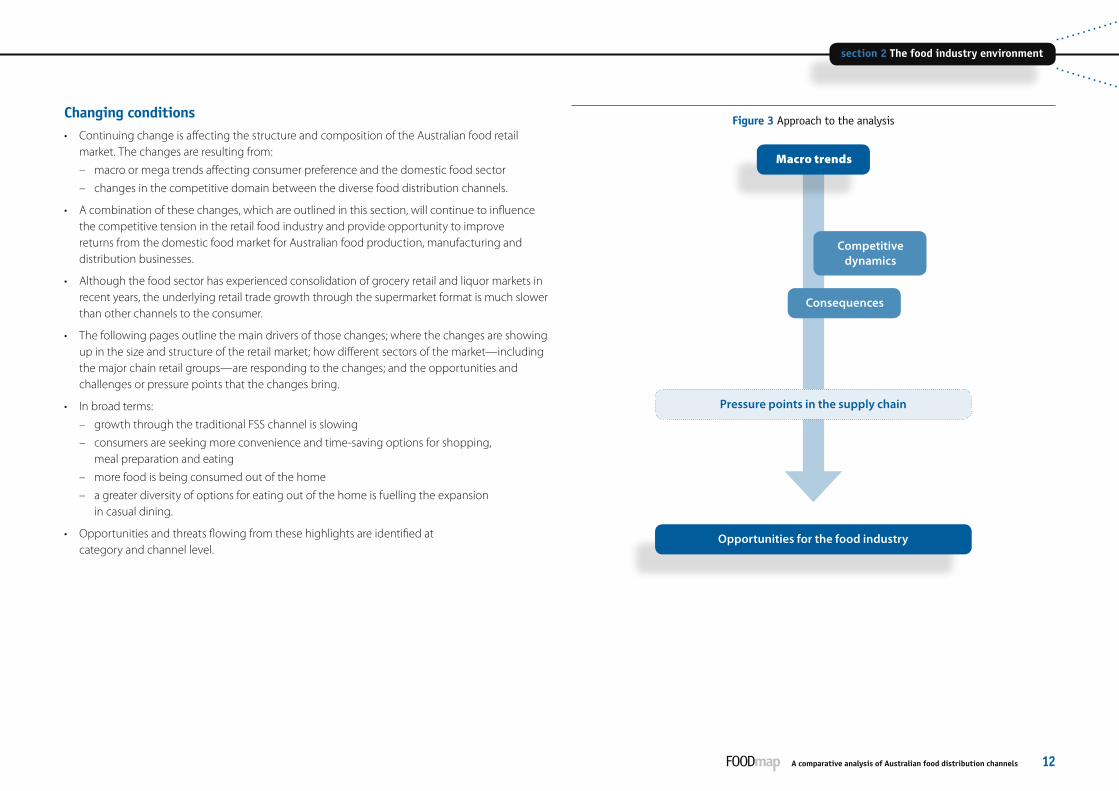
Figure 3 Approach to the analysis
Opportunities for the food industry
Macro trends
Competitive dynamics
Consequences
Pressure points in the supply chain
Changing conditions • Continuing change is affecting the structure and composition of the Australian food retail
market. The changes are resulting from:
– macro or mega trends affecting consumer preference and the domestic food sector
– changes in the competitive domain between the diverse food distribution channels.
• A combination of these changes, which are outlined in this section, will continue to influence the competitive tension in the retail food industry and provide opportunity to improve returns from the domestic food market for Australian food production, manufacturing and distribution businesses.
• Although the food sector has experienced consolidation of grocery retail and liquor markets in recent years, the underlying retail trade growth through the supermarket format is much slower than other channels to the consumer.
• The following pages outline the main drivers of those changes; where the changes are showing up in the size and structure of the retail market; how different sectors of the market—including the major chain retail groups—are responding to the changes; and the opportunities and challenges or pressure points that the changes bring.
• In broad terms:
– growth through the traditional FSS channel is slowing
– consumers are seeking more convenience and time-saving options for shopping, meal preparation and eating
– more food is being consumed out of the home
– a greater diversity of options for eating out of the home is fuelling the expansion in casual dining.
• Opportunities and threats flowing from these highlights are identified at category and channel level.

section 2 The food industry environment
A comparative analysis of Australian food distribution channels13
section 2 The food industry environmentTrends
• Changing consumer demographics
– households are getting smaller
– the “working family” is an increasingly dominant force
– the ageing population—people are living longer and family sizes remain static.
• Consumers are expressing more complex personal wants and desires
– personal aspirations are more diverse
– consciousness of the importance of “wellness” is higher
– the need for time and individual control is greater.
• Advancing technologies
– tools and toys are increasing the “time critical” aspects of business and daily life.
• There is increasing demand for convenience, reflected in
– flexible shopping times and better access to retail outlets
– reduced meal preparation time
• People are shopping more frequently
• People are eating out of home more frequently
– this is serviced by a growing “casual dining” market with many options
• There is a greater diversity of eating occasions as eating “on the go” becomes more prevalent
• People are spending less of their household income on food
• There is a greater need to understand the integrity of food production systems and food origins
• More complex drivers of value for the discerning consumer, reflected in:
– general indifference towards local origin/source product compared to imported low-price goods
– widening interest in products that contribute to a “healthy eating” regime.
• Retail sales growth through the grocery supermarket channel is lower compared with foodservice channels
– overall rate of growth through the grocery channel has been slower
– this is further based on low growth rates in underlying “same store” sales
• There is a movement in food category sales towards “convenience”, shown in
– snacking products over wholefoods
– ready-prepared meals and components over ingredients
• There is greater requirement for pack and portion sizes of products to offer convenience and versatility
• Consciousness of the importance of healthy eating, which is expanding product functionality, is growing
• The diversity of the restaurant and café channel with the expansion of “casual dining” is growing significantly
• Greater diversity in retail food offers expansion in specialty retail areas, which may vary according to:
– category focus
– ease of selection
– size/range of offering
– geographic location of outlets.
Major, undeniable trends affecting how consumers shop and eat are creating significant change in the food industry environment. These are not specific to Australia but are also affecting mature consumer markets in all developed countries at varying speeds and degrees.
There are a number of major, undeniable consumer trends…
…which are driving change and food market conditions…
…resulting in structural change in markets and value chains

section 2 The food industry environmentsection 2 The food industry environment
A comparative analysis of Australian food distribution channels 14
Major trends
Channel growth rates • The gap in the growth variations between distribution channels is increasing and confirming that
“share of stomach” is moving towards specialty retailers and foodservice, especially dining out.
• Sales of food and beverages through restaurants and cafés have been growing much faster than the grocery channel.
Lower growth in major supermarkets • Major food retailers report “same store” sales as an indication of sales growth from stores open
for more than a year in each reporting period. This allows the relative importance of new and existing outlets contributing to sales growth to be identified.
• Over the past three years, FSS “same store” sales have broadly tracked with the level of food inflation, indicating an underlying lack of sales volumes growth without the benefit of new store additions.
• In addition, recent analysis indicates that independent grocery outlets and specialised fresh food retailers are taking share away from the FSS channel.
• The recent effects of fruit shortages distort some of the food CPI data. (Source: ABS, Coles and Woolworths financial reports).
Different stories of category growth• Generally, higher sales growth has been achieved through the grocery channel in categories
where products offer lifestyle (addressing wellness and dietary issues) and convenience benefits.
• While these patterns are broadly applicable, there are exceptions.
Table 2 Category growth comparisons
Faster volume growth Slow/no volume growth
• Nutritious snacks
• Flavoured milk
• Sport/energy drinks
• Yoghurt
• Canned fish
• Frozen meals
• Fresh fruit and vegetables
• Carbonated beverages
• White milk
• Cheese
• Rice
• Eggs
Figure 4 Monthly year-on-year food sales by channel
0%
5%
10%
15%
20%Café RestaurantTakeawaySupermarkets
Nov–06Oct–06Sep–06Aug–06Jul–06Jun–06May–06Apr–06Mar–06Feb–06Jan–06Dec–05Nov–05
Figure 5 Relative growth rates in sales by major channel
0
2
4
6
8
103 years compound growth2005/06 growth
otherrest & cafétakeawaysupermarkets
Figure 6 Retailer “same store” sales v inflation
0
2
4
6
8
10Food CPIColesWoolworths
Q107Q406Q306Q206Q106Q405Q305Q205Q105Q404Q304Q204Q104Q403Q303Q203
Source: Australian Bureau of Statistics, grocery retail financial reports provided to the Australian Stock Exchange 2006

section 2 The food industry environment
A comparative analysis of Australian food distribution channels15
section 2 The food industry environmentGrocery retail competition
Domestic market settings• Concentration of grocery retail market
• Size and scale of existing major grocery retail networks
• Retailer preference for a “discounting” model as the lead consumer proposition
• Strong influence of large-volume, low-cost Asian producers and manufacturers
Strong market shifts• Channel shift to “out of home” eating
• Category movement to convenience
• Erosion of the traditional retail format
• Increasing retail competition from specialists such as discounters, independents and category experts (in fruit and vegetables, meat, bakery)
Investor expectations• Competitive pressure to demonstrate growth
in shareholder wealth
• Global rating of retailer performance by capital markets
• Abundant case studies of strong performance improvement across aspects of retail operations in the Northern Hemisphere
• Expansion of the retailer “stable” to provide earnings growth that meets market expectations
– other consumer markets outside food in fuel/convenience, liquor, pharmacy, home office
• Focus on reduction in supply chain and overhead costs
– consolidation of suppliers to both reduce resources at the interface and the cost of doing business
– improved logistics
– passing a higher portion of supply chain management obligations back to suppliers
• Expansion of the role of private labels
– this will include labels in “tiers of value”
– may represent opportunity for some suppliers and a threat to others
• Pressure to localise the FSS appeal to counter competitors
– tailoring shop format/location/offering
• Response to the proliferation of fads and niches relevant to diet, functionality and image
For food manufacturers
• Growth challenge for food manufacturers
• Potential loss of business relationships with retail customers
• More difficult to justify or recoup brand investments
• Increased difficulty to convert innovation to higher value-extraction
• Increased costs of supply chain
• Increased competition from imported product
• Increased pressure on supplier margins across brands and private label exposures
For fresh product suppliers
• Increased pressure on wholesalers to earn margin, weakening the flow of information and demand signals
• More selective product specifications
• Greater competition increasing the fragmentation of supply sectors
• Demand for better “shelf-life” performance of fresh products
The strong market trends in a highly competitive food retail market, overlaid on the existing settings in the domestic market structures, have strongly influenced strategies by FSS retailers. The implementation of those strategies to meet expectations of the capital providers to food retailers has led to acute pressure points within the Australian food market.
…have shaped major FSS retailer strategies…
…resulting in several pressure points
Page 16 identifies the sectors experiencing these pressure points, and pages 17 and 18 explain their implication.
section 2 The food industry environmentsection 2 The food industry environment
A comparative analysis of Australian food distribution channels 16
Some key pressures in food value chains
Import
processing/ manufacturingprimary
production
foodservice
Import
Import
retail
wholesaling
distribution
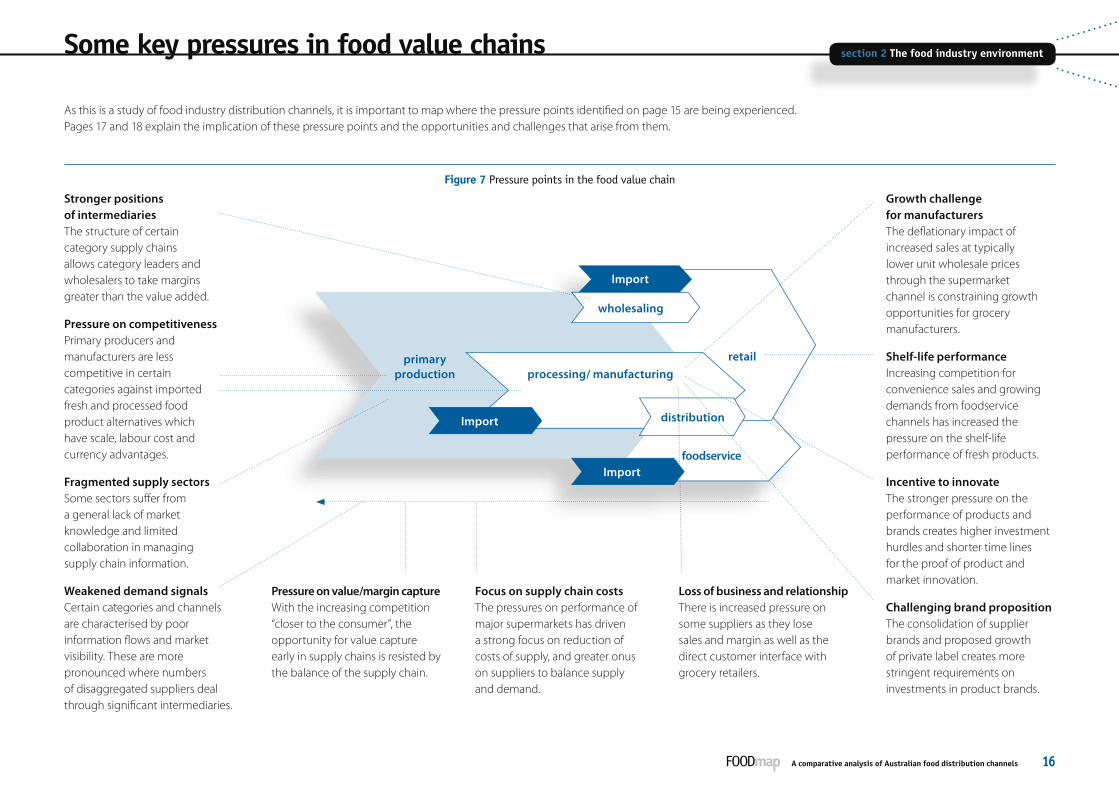
As this is a study of food industry distribution channels, it is important to map where the pressure points identified on page 15 are being experienced. Pages 17 and 18 explain the implication of these pressure points and the opportunities and challenges that arise from them.
Stronger positions of intermediaries The structure of certain category supply chains allows category leaders and wholesalers to take margins greater than the value added.
Pressure on competitiveness Primary producers and manufacturers are less competitive in certain categories against imported fresh and processed food product alternatives which have scale, labour cost and currency advantages.
Fragmented supply sectors Some sectors suffer from a general lack of market knowledge and limited collaboration in managing supply chain information.
Weakened demand signals Certain categories and channels are characterised by poor information flows and market visibility. These are more pronounced where numbers of disaggregated suppliers deal through significant intermediaries.
Figure 7 Pressure points in the food value chain
Growth challenge for manufacturers The deflationary impact of increased sales at typically lower unit wholesale prices through the supermarket channel is constraining growth opportunities for grocery manufacturers.
Shelf-life performance Increasing competition for convenience sales and growing demands from foodservice channels has increased the pressure on the shelf-life performance of fresh products.
Incentive to innovate The stronger pressure on the performance of products and brands creates higher investment hurdles and shorter time lines for the proof of product and market innovation.
Challenging brand proposition The consolidation of supplier brands and proposed growth of private label creates more stringent requirements on investments in product brands.
Pressure on value/margin capture With the increasing competition “closer to the consumer”, the opportunity for value capture early in supply chains is resisted by the balance of the supply chain.
Focus on supply chain costs The pressures on performance of major supermarkets has driven a strong focus on reduction of costs of supply, and greater onus on suppliers to balance supply and demand.
Loss of business and relationship There is increased pressure on some suppliers as they lose sales and margin as well as the direct customer interface with grocery retailers.
section 2 The food industry environment
A comparative analysis of Australian food distribution channels17
section 2 The food industry environment
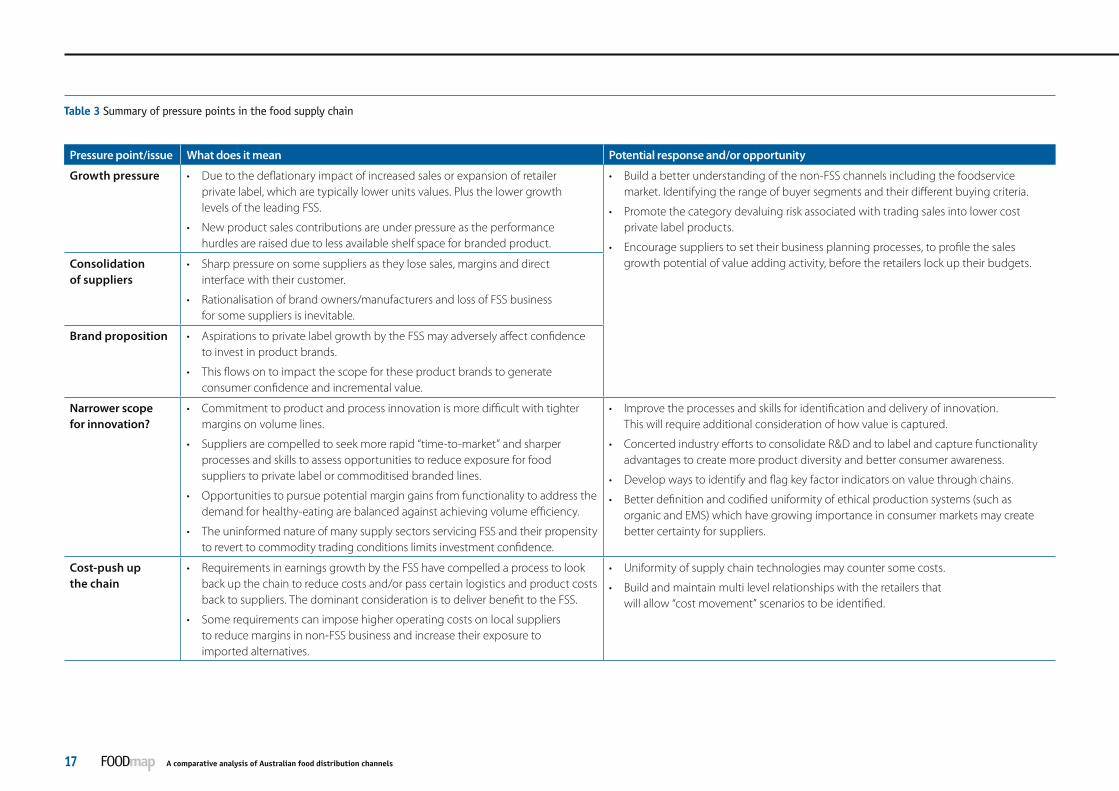
Table 3 Summary of pressure points in the food supply chain
Pressure point/issue What does it mean Potential response and/or opportunity
Growth pressure • Due to the deflationary impact of increased sales or expansion of retailer private label, which are typically lower units values. Plus the lower growth levels of the leading FSS.
• New product sales contributions are under pressure as the performance hurdles are raised due to less available shelf space for branded product.
• Build a better understanding of the non-FSS channels including the foodservice market. Identifying the range of buyer segments and their different buying criteria.
• Promote the category devaluing risk associated with trading sales into lower cost private label products.
• Encourage suppliers to set their business planning processes, to profile the sales growth potential of value adding activity, before the retailers lock up their budgets. Consolidation
of suppliers• Sharp pressure on some suppliers as they lose sales, margins and direct
interface with their customer.
• Rationalisation of brand owners/manufacturers and loss of FSS business for some suppliers is inevitable.
Brand proposition • Aspirations to private label growth by the FSS may adversely affect confidence to invest in product brands.
• This flows on to impact the scope for these product brands to generate consumer confidence and incremental value.
Narrower scope for innovation?
• Commitment to product and process innovation is more difficult with tighter margins on volume lines.
• Suppliers are compelled to seek more rapid “time-to-market” and sharper processes and skills to assess opportunities to reduce exposure for food suppliers to private label or commoditised branded lines.
• Opportunities to pursue potential margin gains from functionality to address the demand for healthy-eating are balanced against achieving volume efficiency.
• The uninformed nature of many supply sectors servicing FSS and their propensity to revert to commodity trading conditions limits investment confidence.
• Improve the processes and skills for identification and delivery of innovation. This will require additional consideration of how value is captured.
• Concerted industry efforts to consolidate R&D and to label and capture functionality advantages to create more product diversity and better consumer awareness.
• Develop ways to identify and flag key factor indicators on value through chains.
• Better definition and codified uniformity of ethical production systems (such as organic and EMS) which have growing importance in consumer markets may create better certainty for suppliers.
Cost-push up the chain
• Requirements in earnings growth by the FSS have compelled a process to look back up the chain to reduce costs and/or pass certain logistics and product costs back to suppliers. The dominant consideration is to deliver benefit to the FSS.
• Some requirements can impose higher operating costs on local suppliers to reduce margins in non-FSS business and increase their exposure to imported alternatives.
• Uniformity of supply chain technologies may counter some costs.
• Build and maintain multi level relationships with the retailers that will allow “cost movement” scenarios to be identified.

section 2 The food industry environmentsection 2 The food industry environment
A comparative analysis of Australian food distribution channels 18
Pressure point/issue What does it mean Potential response and/or opportunity
Lack of cost competitiveness
• Due to low economies of scale, high cost of inputs and inefficiencies in production methods.
• Some retailers are investing in locating resources in these markets to manage overseas sourcing and supply.
• This is more pronounced in categories that have operated in a “protected” domestic market—primarily seafood, horticulture and pork.
• Improve information and its dissemination on benchmarking of total supply costs from specific sectors against competitors.
Inadequate demand signals
• More pronounced with smaller to medium sized businesses dealing through intermediaries.
• The development of the skills & capabilities to respond has slowed.
• Encourage and support self-regulatory options for primary sectors that will bring improved visibility and enable more informed decisions by participants. These options include use of codes of practice by market participants in fresh products, and forms of selling terms and arrangements in other markets susceptible to pressure points.
• Encourage the R&D and adoption of systems-based solutions to effectively disseminate ongoing market information to supply chain participants.
• Skills and capacity development in supply chain relationship and information management is a critical enabler to improvement.
• Review current industry data capture methods and mechanisms to disseminate to participants. Identify and explore ways to improve these methods and mechanisms based on cost/benefit considerations.
Intermediaries exploiting gate keeping
• Pressure increased by the appointed category leaders taking margins greater than the value they add from primary producers. This reflects cost and performance pressure on those intermediaries themselves to mask value in order to preserve margins.
• This is compounded by the low level of trading visibility in some sectors.
Fragmented supply sectors
• Unwillingness to collaborate in forecasting processes erodes the capacity to manage supply.
• Resulting commodity conditions are an unstable platform for adding value.
Selective product specifications
• Bring pressure to find outlets for the grade of product that does not meet the FSS specification.
• Improve awareness of distribution channels outside the FSS which may provide opportunity to develop sustainable relationships
• Adjust R&D selection criteria to focus on all the total return from the total crop/carcass.
Better “shelf-life” performance of products
• Greater competition for convenience purchases has extended the critical retail times.
• This has increased the pressure on fresh, perishable standards and caused higher levels of wastage to be costed into margins that are sought from suppliers.
• Encourage R&D of product, logistics and merchandising solutions that will reduce shrinkage.
• Encourage working with distribution channels that have the operational capacity to reduce waste.


Section 3 Overview of the analysis
This section describes the approach to mapping food chains (as applied in sections 4 and 5), and the methodology used in the comparative analysis in respect of each of the food
categories and distribution channels. The section also summarises the critical information challenges affecting a full analysis of food industry structure
and performance, and the implications of information gaps and deficiencies.
section 3 Overview
A comparative analysis of Australian food distribution channels21
section 3 OverviewApproach
The approach taken
• The major content in sections 4 and 5 provides a mapping of supply chains from two aspects:
1. The supply of major categories of food to the market—the structure of categories is shown on page 23.
2. The servicing of major food distribution channels—the map of the value chain structure in foodservice markets in the industry is based on the channel structure on page 24.
• Volume and value summaries of the share of major segments of food markets have been included in the analysis of food categories where the information is available.
• The analysis of categories identifies the key trends affecting category performance and outlook, and the influences affecting the mix of sales—in volume and value terms—across the food distribution channels.
• The drivers of volume and value have also been identified for each of the channels and sub-channels of the domestic retail market. These will be both specific factors to each master channel and sub-channel and general economic or policy issues, or both, that generally affect the level of business activity.
Assessment
• Throughout the analysis, the report provides summary assessments of the different value chains. Page 26 outlines the process used.
• Where appropriate, the report identifies the following factors in respect of the major channels and categories:
– opportunities to enhance the returns to food industry participants
– scope for greater innovation
– scope to reduce key risk areas
– the identified knowledge and information gaps
– capacity development opportunities
– opportunities to improve the competitiveness of supply chains.
Information challenges
• Retail sales information exists for the FSS segment of the grocery retail market.
• Beyond that sub-channel—which nonetheless represents a significant portion of estimated total retail sales of food—the information and data-sets across the other retail channels, and the entire foodservice channel, are generally poor.
• ABS produces monthly estimates of total retail sales through relevant channels which do not line-up with the categorisation used in this report. The ABS methodology uses a survey technique to estimate total sales values on a regular basis.
• Some industries have determined estimates of the sales values and volumes into each of the major retail and foodservice channels at a high level. However, these remain based on assumptions as to sales mix beyond the first point of distribution outside their own enterprises. This is subject to large variation as distributors themselves have a diverse mix of business across different sub-channels of the foodservice market.
• Industry practices and attitudes to sharing data are very different. This is influenced by the competitive conditions within the sector and the nature of corporate ownership. In this regard, there are significant contrasts between collaborative industries (dairy), highly competitive industries which do not share information (red meat, poultry) and disparate sectors where the nature of the supply chain prevents data aggregation (fruit and vegetables).
• Page 22 sets out some of the critical information challenges in the food industry. An inability to address these will limit the scope for industry participants to take advantage of changing market conditions and to respond to the significant pressure points outlined on page 15.

section 3 Overviewsection 3 Overview
A comparative analysis of Australian food distribution channels 22
Information issues
Table 4 Summary of information challenges in the food supply chain
Issue What does it mean Implication
The lack of visibility through the chain prevents clear signals
• In certain food and drinks sectors knowledge of the retail/market mix wholesale distribution is a significant limitation on the ability of suppliers to understand trends that are operating in the foodservice and specialty retail market.
• In these cases (such as in fresh food, meat, milk, seafood, liquor) the market dynamics are masked by knowledge of customer dynamics by dominant wholesale participants.
• Whilst strong intelligence is possessed by suppliers who service the convenience and foodservice channels through route distribution, the observance of trends that may affect channel conditions and influences may be overlooked.
The void of reliable foodservice information
• Channels outside of FSS are poorly understood by most sectors and many manufacturers and consequently suffer from poor intelligence and similar “gatekeeper” issues as fresh produce markets.
• Suppliers rely on information provided back to them by distributors.
• Foodservice will continue to be regarded by a large number of suppliers with an orientation to servicing the FSS channel as “residual” business, resulting in its treatment as a commodity channel.
• Opportunities to improve product and service tailoring will be missed without greater intimacy with buyer/customer needs.
Product form affects completeness of information
• Further complications are apparent in the case of meat—red meat, pork and poultry—where the accounting for “carcass use” through carcass weight converted to meat portions and cuts relies on significant assumptions about carcass recovery.
• Overlaying this issue with the strong role that wholesalers play in red meat ensures that channel share information is weak.
• The lack of shared information may prevent a full understanding of the volume and value of the total market, and the scope for potential increased value through the interpretation of trends—especially those in foodservice sectors.
• Participants in manufacturing and wholesaling presently prefer to limit total market information for competitive advantage.
Different cultures regarding the sharing of information
• There are very different industry cultures as to the sharing of data. This is influenced by the competitive conditions within the sector and the nature of corporate ownership of major food businesses.
• There is incomplete information of the market trends for the red meat, poultry, pork and seafood sectors.
• This aspect has been assessed in our comparative analysis of the value chains later in this section.
Different market structures affecting information systems
• In perishable categories, the pressure to quickly clear fresh product in markets with large numbers of suppliers and/or buyers, will challenge adequacy of information and signals.
• Structural conditions create opportunity for participants to preserve “gate keeping” roles with information, preventing demand signals reaching suppliers, and stifling innovation.
Accuracy of information • Lack of accuracy of the trend information on food sales—ABS information, which is gathered by survey method, is at a very high level.
• Reliability of overall information is questionable without deeper segmentation into channels.

section 3 Overview
A comparative analysis of Australian food distribution channels23
section 3 OverviewFood and beverage categories
The category structure adopted for this analysis is consistent with that used by major FSS retailers and foodservice wholesalers for the bulk of food sales volumes.
Hot
Chilled
Ambient
Alcoholic
Fresh
Processed
Fresh
Processed
Referred to as “dry grocery” in our analysis
Breakfast cereals
Fats & oils
Pasta
Rice & noodles
Cheese
Milk
Spreads
Yoghurts/desserts
Beef/lamb/pork
Poultry
Seafood
Fruit
Vegetables
Sauces & condiments
Biscuits & confectionery
Cakes, desserts, toppings
Jams & spreads
Snackfoods
Beverages
Bakery
Dairy
Animal protein
Horticulture
Grains
Category
Supply industry
Figure 8 Structure of food categories used in this analysis
The structure of food categories relevant to this study is set out below.

section 3 Overviewsection 3 Overview
A comparative analysis of Australian food distribution channels 24
Food distribution channels
Outlet numbers*Sub-channelMaster channel
745
1900
3859
2580
1360
123
354
2290
528
8262
1772
2700
N/A
1950
8959
5234
20 562
5417
4171
10 625
These sub-channels include large groups of independent stores under common ownership, “banner” groups of independently-owned stores as well as single “corner store” outlets
There is some blurring between the takeaway and restaurant channels as a large number of restaurants across ethnic styles offer a takeaway option
The differentiator in these sub-channels is that food is provided as part of a service or accommodation, whereas in all others it is purchased by a consumer
Bakery
Delicatessen
Butcher & poultry
Fruit & vegetables
Corporate (workplace)
Correctional
Defence
Aged care
Hospitals
Education
Full-service supermarkets
Independent supermarkets
Independent stores
Convenience stores
Sandwich bars
Independent takeaway
Quick-serve restaurants (QSR)
Restaurants & cafés
(Pubs), clubs & function centres
Event and travel catering
Hotels and motels
Grocery
Convenience
Specialised
Takeaway
Dining out
Event/leisure
Institutional
Retail
Foodservice
* The number of outlets has been compiled by reference to sources that include ABS, industry and directories
Figure 9 Structure of food distribution channels used in this analysis
The classification of distribution channels used in this report recognises important distinctions between a number of sub-channels of retail and foodservice segments of the market.

section 3 Overview
A comparative analysis of Australian food distribution channels25
section 3 OverviewApproach to the analysis
Section 4 of this document maps the structures of the supply of major food groups into the various food distribution channels—or “where the food goes”.
This includes—where available—an analysis of the share of total food supply that are consumed by each major retail sales channel.
Case studies
• Throughout the analysis, case studies are provided to illustrate a number of points relevant to the assessment of distribution channels.
• These case studies provide profiles of specific types of supply chain participants—these are contained in section 6 of the document.
• Additional case studies are provided at the food category level.
Section 6 of this document profiles key supply chain participants who operate across supply chains and distribution channels.
FSS Retailer
Independent Retailer
Specialty Retailer
Takeaway
Institutional
Dining out
Event/leisure
Supplier/processor
Caterers
Delivery franchisee
Foodservice distributor
Section 5 of this document describes how the various food retail channels and sub-channels are serviced—“how the market is serviced” to the last point for sale to consumers.
Figure 10 Overview of the approach to mapping of category and channels structures
The mapping of the supply of major food categories to channels and sub-channels of the retail market has been conducted from two directions to provide an effective understanding of the structure of food distribution in the industry.

section 3 Overviewsection 3 Overview
A comparative analysis of Australian food distribution channels 26
Assessment of supply chains
Introduction• The analysis in this report has included a number of “point in time”
comparative measures of each value chain’s ability to create and capture value.
• This has been done using criteria to evaluate each food category under six headings (as shown in the table to the right), which have been used in the value chain assessment tool.
• The report contains assessments of:
– the ability of each supply chain for each food product category to create and capture value by reference to the six factors on the right
– the ability for value to be created and captured in each distribution channel and sub-channel based on four relevant factors—two of the six not deemed applicable to channel-specific conditions.
• The scores in each case have been scaled one to 10 and aggregated using a weighted scoring system, presented in a uniform chart as shown in each case in examples below.
• The assessments are generalised, taking account of the overall tendency in each case. At a detailed level within each food category and distribution channel there will be examples which differ significantly to the general conditions in each case, where niches and better added-value are being seen.
• The overall results are summarised on the following page. Pages 28 to 30 provide an overview of the results for food categories under each of the six criteria.
Table 5 Assessment criteria used in the comparative analysis
Assessment criteria Assessment criteria
Informed market* • Accepted common views of market size & structure• Level of knowledge of product category market size & growth• Common approach to how customers/consumers are segmented• Accurate and timely market monitors & controls in place• Level of awareness of distribution options/alternatives• Extent to which demand drivers are identified• Demand drivers uniformly managed/influenced by chain• Understanding of customer and consumer intimacy• Extent to which market positively manages supply and demand
Diversity of products & services*
• Value range of products/services• Extent of differentiated product/service on offer• Mixture of supplier and retailer brands• Diversity of product attributes
Innovation* • Volume of innovations accepted in market in last two years• Effectiveness of R&D facilitators in place• Innovation contribution to growth last two years• Level of confidence to invest in innovation• Level of demand for new products from trade buyers• Use of technology in transaction management
Value captured • Extent of value added from primary producer to consumer• Number of ownership changes in the chain• Chain/market capacity to influence margins based on value added• Industry return on investment• Margins taken in relation to value added
Primary product yield • Income generation from each proportion of output• Extent of waste and non utilised production
Logistical efficiency* • The number of physical handling steps in the chain• Common product specifications• Specifications reflect end-user preference• Duplication of transport facilities• Utilisation of capital infrastructure
*These factors only are used in the assessments of distribution channels
Figure 11 Example assessment charts
Logistical efficiency
Primary product yield
Value capture
Innovation adoption
Diversity of products & services
Informed market 4.0
3.6
4.0
3.9
3.8
2.7
Category
Logistical efficiency
Innovation adoption
Diversity of products & services
Informed market 4.0
3.6
3.9
4.0
Channel

section 3 Overview
A comparative analysis of Australian food distribution channels27
section 3 OverviewAssessment of supply chains
2.0
2.5
3.0
3.5
4.0
1.5 2.0 2.5 3.0 3.5 4.0
Assessment Summary
PeopleSt
ruct
ura
l
Fruit
Fresh Seafood
Vegetables
Eggs
Red meatPork
Processed Seafood
Processed F&V
Bread
Chilled beverages
Grocery
ChickenMilk
Alcoholic beveragesDairy
• The common denominators in these categories are the higher number of participants, existence of a wholesale market clearance function in the chain and low levels of market information.
• These conditions flow on to challenge the capacities to innovate, limit the diversity of offers, and consequently result in limited success in capturing value.
• The common denominators in these categories are lower numbers of participants, informed markets, greater diversity and stronger brands.
• These conditions have led to higher levels of innovation, a higher primary product yield and as a direct consequence, greater value capture.
Assessment summary
• The chart on the right provides an overview of the relative situation for each food category based on the combination of the six criteria.
• This assessment of all categories reflects the relative ability to create and capture value.
• In this regard, the category “people” refers to the state of people and capacity issues (or the “software”) which have combined the assessments of:
– how well categories choose to be or are informed
– the apparent innovation adoption
– the demonstrated ability to recognise and capture value.
• The category “structure” refers to the state of structure and process issues (or the “hardware”) which have combined the assessments of:
– the diversity of products and services that can be achieved
– the yield from primary product
– logistical efficiency achieved in the chain.
Figure 12 Summary of the comparative assessments of value chains

section 3 Overviewsection 3 Overview
A comparative analysis of Australian food distribution channels 28
Assessment of supply chains—informed market
0 1 2 3 4 5
Chilled beverages
Alcoholic beverages
Grocery
Processed Fruit & Veg
Vegetables
Fruit
Eggs
Processed seafood
Seafood
Chicken
Pork
Red meat
Bread
Dairy
Milk
0 1 2 3 4 5
Chilled beverages
Alcoholic beverages
Grocery
Processed Fruit & Veg
Vegetables
Fruit
Eggs
Processed seafood
Seafood
Chicken
Pork
Red meat
Bread
Dairy
Milk
Figure 13 Comparative assessment of Informed Market criteria
• Fewer participants in a market typically correlate with higher levels of market knowledge, and therefore informed markets.
• Chains with “wholesale markets” that serve to link multiple producers and varying outputs with multiple distributors are typically working with less informed markets.
Note
• Assessments have been made of the chains as a whole
The criteria
• Accepted common views of market size and structure
• Level of knowledge of product category market size and growth
• Common approach to how customers/consumers are segmented
• Accurate and timely market monitors and controls in place
• Level of awareness of distribution options and alternatives
• Extent to which demand drivers are identified
Figure 14 Comparative assessment of Diversity criteria
• Categories with lower scope for processing are more limited in diversity.
• More informed markets lead to greater diversity, with indications that the higher levels of knowledge have been applied to develop expanded offers.
• The existence of competing brands also correlates with higher diversity as the brand strengths and economies provide the platforms for product and service extensions.
• Demand drivers uniformly managed and influenced by chain.
• Understanding of customer and consumer intimacy.
• Extent to which market positively manages supply and demand.
Note
• Assessments have been made of the chains as a whole
The criteria
• Value range of products and services
• Extent of differentiated product and service on offer
• Mixture of supplier and retailer brands
• Diversity of product attributes

section 3 Overview
A comparative analysis of Australian food distribution channels29
section 3 OverviewAssessment of supply chains—innovation
Figure 15 Comparative assessment of Innovation Adoption criteria
• Fragmented and poorly informed markets that rely on a commodity trading base to clear perishable stock are more challenged to develop and adopt innovation.
• These conditions make it difficult to establish the value for the innovation as the value base of the category is unstable. Typically it takes longer to establish innovations in these conditions.
Note
• Assessments have been made on the chains as a whole
The criteria
• Volume of innovations accepted in market in past two years
• Effectiveness of research and development facilitators in place
• Innovation contribution to growth in past two years
• Level of confidence to invest in innovation
• Level of demand for new products from trade buyers
• Use of technology in transaction management
0 1 2 3 4 5
Chilled beverages
Alcoholic beverages
Grocery
Processed Fruit & Veg
Vegetables
Fruit
Eggs
Processed seafood
Seafood
Chicken
Pork
Red meat
Bread
Dairy
Milk
Figure 16 Comparative assessment of Value Capture criteria
• The higher levels of value-capture are where there are the highest levels of product processing, diversity of products and services and brand strength. These conditions also lever off a more informed market understanding.
• There are also indications that categories that enjoy a greater balance between buying and selling power lead to higher levels of “value capture”.
Note
• Assessments have been made on the chains as a whole
The criteria
• Extent of value added from primary producer to consumer
• Number of ownership changes in the chain
• Chain/market capacity to influence margins based on value added
• Industry return on investment
• Margins taken in relation to value added
0 1 2 3 4 5
Chilled beverages
Alcoholic beverages
Grocery
Processed Fruit & Veg
Vegetables
Fruit
Eggs
Processed seafood
Seafood
Chicken
Pork
Red meat
Bread
Dairy
Milk

section 3 Overviewsection 3 Overview
A comparative analysis of Australian food distribution channels 30
Assessment of supply chains—product yield
Figure 17 Comparative assessment of Primary yield criteria
• Categories with greater diversity of product and services have higher levels of primary product yield.
• Categories where the majority of the product is sold in one processed or packaged form have low levels of brand strength—they also face stiff competition from competing global alternatives because processed product outputs have the lowest yield.
Note
• Assessments have been made of the chains as a whole
The criteria
• Income generation from each proportion of output
• Extent of waste and unused production
0 1 2 3 4 5
Chilled beverages
Alcoholic beverages
Grocery
Processed Fruit & Veg
Vegetables
Fruit
Eggs
Processed seafood
Seafood
Chicken
Pork
Red meat
Bread
Dairy
Milk
Figure 18 Comparative assessment of Logistical Efficiency criteria
• This is driven by (a) the number of participants, (b) the perishable nature of the product and (c) the product’s proximity to market.
• Products in which fewer participants are involved and where there is scope to locate production and processing close to end markets, and which—when finished—can be held for days rather than hours, can achieve higher efficiency. However, even in fragmented markets where a product needs to be handled correctly, or risks having its price return directly affected, the correct handling methods are applied.
• Some categories are exposed to cool chain breakdown, particularly leading into and at the retail interface with consumers—such weaknesses erode the value of a consistent approach from the balance of the chain.
Note
• Assessments have been made of the chains as a whole
The criteria
• The number of physical handling steps in the chain
• Common product specifications
• Specifications reflect end-user preference
• Duplication of transport facilities
• Utilisation of capital infrastructure
0 1 2 3 4 5
Chilled beverages
Alcoholic beverages
Grocery
Processed Fruit & Veg
Vegetables
Fruit
Eggs
Processed seafood
Seafood
Chicken
Pork
Red meat
Bread
Dairy
Milk


Section 4 Mapping food categories
This section describes the distribution structures evident in the supply of major food and beverage categories to the Australian domestic retail market. They span dairy,
animal protein, horticulture, drinks and other major grocery food lines. The section outlines the most significant product flows and the major drivers of volume and value in each case.
The assessments of the relative performance of each category distribution structure are provided by applying the methodology shown in section 3.

section 4 Mapping food categories
A comparative analysis of Australian food distribution channels33
section 4 Mapping food categoriesDairy
cheese 36%
casein 4% other 4%
powders 36%
milk 20%
Multiple uses45%
Export
Grocery
Convenience
Specialised
Retail30%
Foodservice
Takeaway
Dining out
Event/leisure
Institutional
10%
Multiple usesIndustrial15%
7%
Production Processing93%
Imported
In overall terms, the dairy industry processes and markets about 50 per cent of national milk production into domestic food and beverage markets.
Figure 19 Dairy industry use of milk in products 2005/06
Table 6 Dairy industry major products 2005/06
Key industry statistics in 2006 (000 tonnes)
Australian Produced
Imported Exported Domestic
Packaged milk 2065 1 86 2067
Cheese 373 60 202 240
Butter 146 7 82 80
Milk powders 386 17 381 22
Source: Dairy Australia 2006
Figure 20 Dairy industry channel overview
Source: Dairy Australia 2006

section 4 Mapping food categoriessection 4 Mapping food categories
A comparative analysis of Australian food distribution channels 34
FSS Retailer
Independent retailer
Takeaway
Dining out
Event/leisure
Institutional
Caterers
Foodservice distributor
Cash & carry
Specialty retailer
QSR
ProcessingMilk production
Distribution franchise
57%
Dominant or major flow of product to market
Overview
This category refers to packaged milk drinks. White milk products have about 90 per cent of product sales. Three major companies dominate the milk processing sector, and there are a number of other regional and niche processors, accounting for the total output. FSS retailers represent an estimated 57 per cent of the milk retail market, and drive the value in the milk category.
Outside this channel—due to the demand patterns and chilled product form—milk processors service the market through owned or franchised distributors offering direct delivery to independent retail and foodservice establishments. The nature of these distribution activities makes it impossible to quantify the proportion of the market represented by foodservice outlets.
Key features of channels to market
• Dominant influence on processor suppliers by main chain supermarkets
• Specialised milk and chilled drinks distributors deliver non-FSS sales
• Small volumes of product are sold to small foodservice outlets
Dominant drivers of value
• Milk products compete in a beverage market, but prices have evolved from a traditional cost-plus pricing approach used when prices were regulated
• Private label product price for volume lines
Major trends and dynamics
• Overall market growth has typically tracked close to the rate of population growth
• Over the past several years, unit price has grown steadily
Figure 21 Milk products value chain assessment
Figure 22 Milk products category map
Logistical efficiency
Primary product yield
Value capture
Innovation adoption
Diversity of products & services
Informed market 3.9
3.4
2.4
2.83.8
3.6
2.6
Milk products—packaged white and flavoured milk
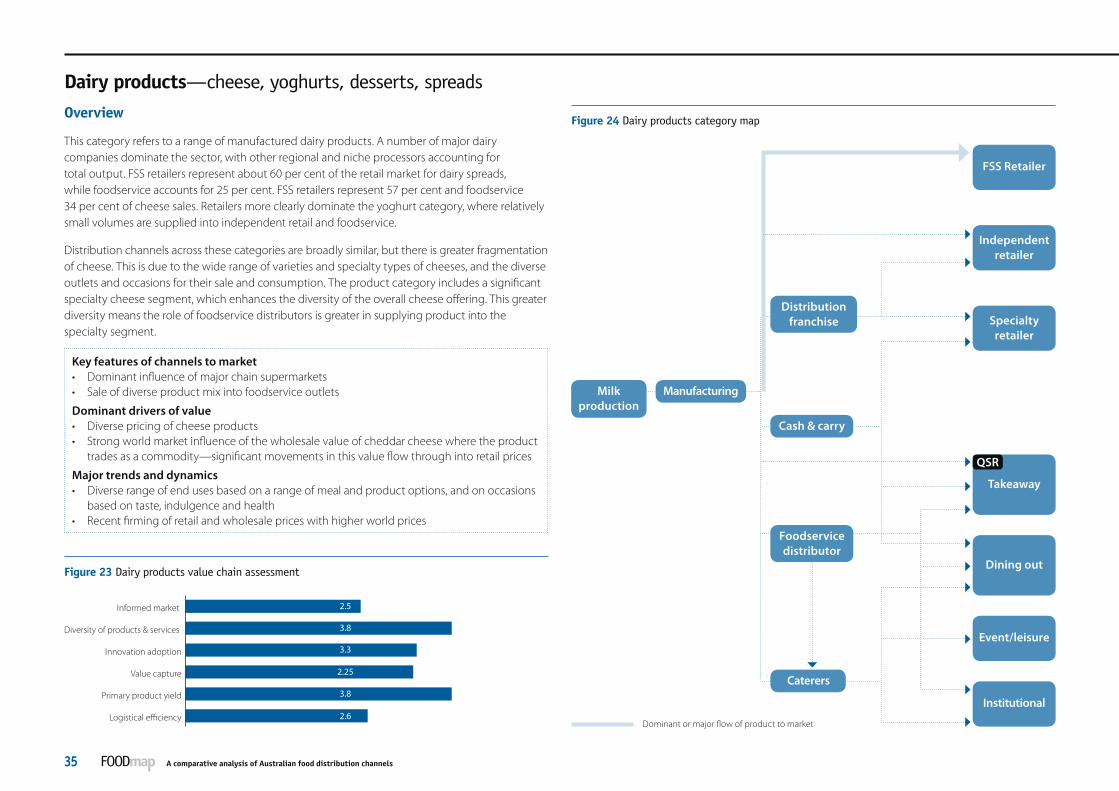
section 4 Mapping food categories
A comparative analysis of Australian food distribution channels35
section 4 Mapping food categories
Caterers
Foodservice distributor
Cash & carry
Distribution franchise
Milk production
Dominant or major flow of product to market
Manufacturing
FSS Retailer
Independent retailer
Specialty retailer
Takeaway
Dining out
Event/leisure
Institutional
QSR
Logistical efficiency
Primary product yield
Value capture
Innovation adoption
Diversity of products & services
Informed market 2.5
3.8
3.3
2.25
3.8
2.6
Overview
This category refers to a range of manufactured dairy products. A number of major dairy companies dominate the sector, with other regional and niche processors accounting for total output. FSS retailers represent about 60 per cent of the retail market for dairy spreads, while foodservice accounts for 25 per cent. FSS retailers represent 57 per cent and foodservice 34 per cent of cheese sales. Retailers more clearly dominate the yoghurt category, where relatively small volumes are supplied into independent retail and foodservice.
Distribution channels across these categories are broadly similar, but there is greater fragmentation of cheese. This is due to the wide range of varieties and specialty types of cheeses, and the diverse outlets and occasions for their sale and consumption. The product category includes a significant specialty cheese segment, which enhances the diversity of the overall cheese offering. This greater diversity means the role of foodservice distributors is greater in supplying product into the specialty segment.
Key features of channels to market • Dominant influence of major chain supermarkets • Sale of diverse product mix into foodservice outlets
Dominant drivers of value• Diverse pricing of cheese products• Strong world market influence of the wholesale value of cheddar cheese where the product
trades as a commodity—significant movements in this value flow through into retail prices
Major trends and dynamics• Diverse range of end uses based on a range of meal and product options, and on occasions
based on taste, indulgence and health • Recent firming of retail and wholesale prices with higher world prices
Figure 23 Dairy products value chain assessment
Figure 24 Dairy products category map
Dairy products—cheese, yoghurts, desserts, spreads

section 4 Mapping food categoriessection 4 Mapping food categories
A comparative analysis of Australian food distribution channels 36
Grains
pastry 5%
packet mix 8%
bread 57%biscuit/pasta 15%
other food 15%
Note: Estimates of channel share are based on information provided by the Flour Millers Council of Australia
Multiple uses12%
Export
Grain Production
Flour milling
Grocery
Convenience
Specialised
Retail51%
Foodservice
Takeaway
Dining out
Event/leisure
Institutional
12%
Multiple usesIndustrial25%
In overall terms, the grains industry processes and markets about 10-15 per cent of national grains production into domestic consumer markets, into a variety of product forms. For the purposes of this analysis, the focus is on flour products, which include bread and pastry, as well as consumer and foodservice products. These products represent the majority of food uses.
Figure 25 Use of flour in food products Figure 26 Flour products channel overview
Table 7 Grains industry market mix
Key industry statistics—average last 6 years (000 tonnes)
Australian Production
Domestic food use
Feed use Export
Wheat 21 611 2343 2862 16 406
Barley 7813 166 2307 5007
Other course grains 4343 235 3602 517
Source: Australian Food Statistics 2006
Source: Flour Millers Council of Australia

section 4 Mapping food categories
A comparative analysis of Australian food distribution channels37
section 4 Mapping food categories
FSS Retailer
Independent retailer
Specialty retailer
Caterers
Foodservice distributor
Flour products
Franchised distribution
Flour milling
Bread production
O/B
O/B
O/B
Dominant or major flow of product to market
Own bakeryO/B
Takeaway
Dining out
Event/leisure
Institutional
QSR
Overview
The relevant total market in this regard is in bread and bakery product retail sales. This category covers the supply of packet bread products (produced by major bread manufacturers) and flour products supplied to retail bakeries. Retail bakeries include in-house bakeries operated by FSS retailers, franchised bakery chains and independent bread shops and bakeries. Two major companies, which are also leaders in the packet bread market, dominate the supply of flour products.
FSS retailers hold an estimated 59 per cent of the bread retail market (of which in-house production accounts for about 23 per cent), while specialty bakeries account for 30 per cent, and independent retail the rest.
Distribution flows are dominated by the direct supply from bread makers to retailers; and by the supply of flour products from flour millers to franchised and independent bakeries. Pastry and other bakery products into foodservice outlets are more fragmented because of the wide range of specialty products and the diverse outlets and occasions for their sale and consumption.
Key features of channels to market • Major roles for FSS and independent bakery
Dominant drivers of value• Complex set of drivers—mostly associated with a base value set in volume lines of product• Increased choice and unit value as a result of differentiation through bread style and feature
Major trends and dynamics• Move towards high-fibre products supported by healthy eating trends • Strong growth in the franchise model in recent years, depending on convenience location,
which has depleted sales of independent bakeries • Significant expansion of FSS retailer kitchens offering low-priced private label lines• Added value from significant expansion of product variety, style and functionality
Figure 27 Bread and bakery products value chain assessment
Figure 28 Bread and bakery products category map
Bread and bakery products
Logistical efficiency
Primary product yield
Value capture
Innovation adoption
Diversity of products & services
Informed market 3.6
3.8
2.6
3.6
2.4
2.5

section 4 Mapping food categoriessection 4 Mapping food categories
A comparative analysis of Australian food distribution channels 38
Meat
pork 20%
poultry 32%
beef & veal 29%
seafood 9%
sheep 10%
Multiple usesExport66%
Production Processing
Grocery
Convenience
Specialised
Retail23%
Foodservice
Takeaway
Dining out
Event/leisure
Institutional
11%
Major production and processing facilities, which have developed to service export markets, dominate the beef industry. Beef has the largest share of per capita meat consumption of product sold fresh in retail channels. Poultry meat, however, has overtaken beef in total per capita intake of meat protein due to the growth in size and diversity of foodservice markets for chicken. The ongoing strong influence from export market conditions has seen greater development of specialist beef producers and contract production facilities supplying domestic retail and foodservice markets.
Market shares of beef consumption
• Assessments are based on the apparent volumes sold through major channels according to industry supply and market share data.
Figure 30 Beef products channel overview
Beef
Source: ABARE commodity statistics and Australian Food Statistics 2006
Figure 29 Apparent shares of per capita animal protein consumption
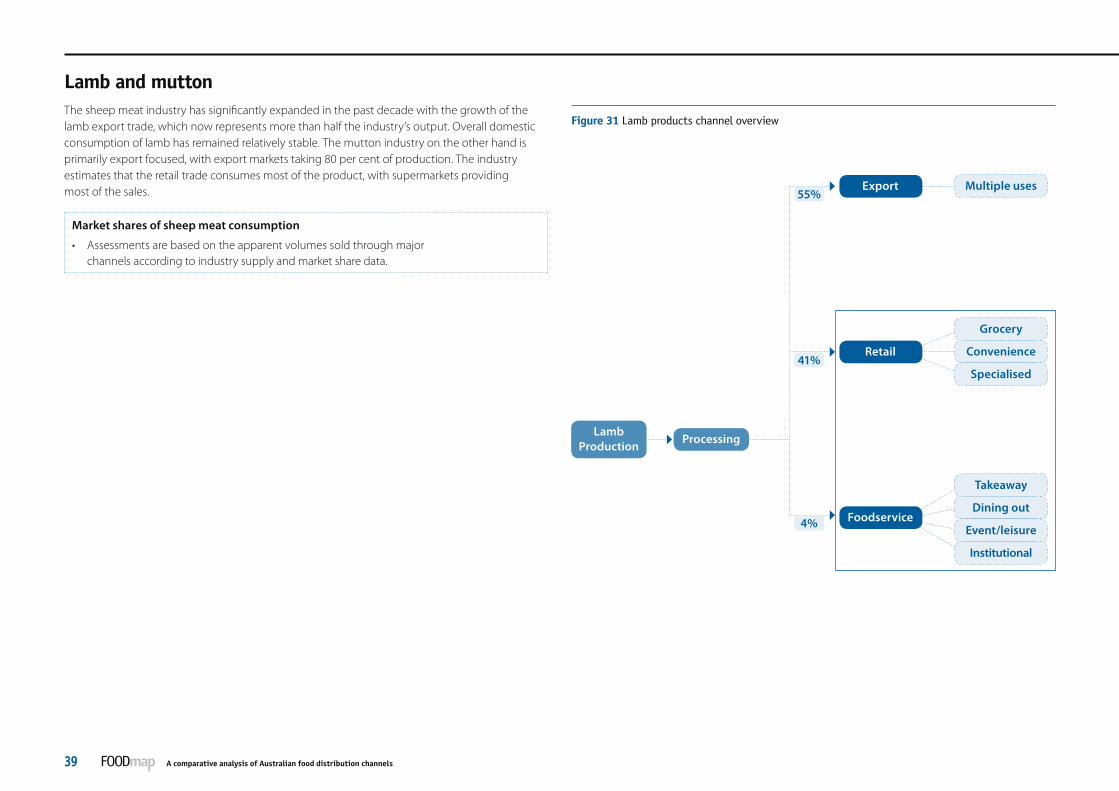
section 4 Mapping food categories
A comparative analysis of Australian food distribution channels39
section 4 Mapping food categories
Multiple uses55%
Export
Lamb Production
Processing
Grocery
Convenience
Specialised
Retail41%
Foodservice
Takeaway
Dining out
Event/leisure
Institutional
4%
The sheep meat industry has significantly expanded in the past decade with the growth of the lamb export trade, which now represents more than half the industry’s output. Overall domestic consumption of lamb has remained relatively stable. The mutton industry on the other hand is primarily export focused, with export markets taking 80 per cent of production. The industry estimates that the retail trade consumes most of the product, with supermarkets providing most of the sales.
Market shares of sheep meat consumption
• Assessments are based on the apparent volumes sold through major channels according to industry supply and market share data.
Figure 31 Lamb products channel overview
Lamb and mutton

section 4 Mapping food categoriessection 4 Mapping food categories
A comparative analysis of Australian food distribution channels 40
Caterers
Dominant or major flow of product to market
Producer
Meat wholesaler
Further processing
Processing
Foodservice distributor
FSS Retailer
Independent retailer
Specialty butcher
Takeaway
Dining out
Event/leisure
Institutional
QSR
Overview
Beef and lamb distribution channels are similar and have been combined for this analysis. Share-of-sales volumes made through FSS chains dominate the red meat retail market. FSS chains have been increasingly contracting the growing-out of cattle and meat processing through abattoirs to ensure cost stability and quality consistency. Meat industry research indicates that FSS retailers hold about 66 per cent of the beef retail market (lamb 66 per cent) while butchers account for 28 per cent (lamb 29 per cent), with sales direct into the independent retail and foodservice channels accounting for the rest.
Direct supply from processors to retailers dominates distribution flows for these categories. Meat wholesalers play a central role outside FSS channels, supplying independent retailers, butchers and foodservice outlets. A significant volume of meat is on-sold from specialist butchers to foodservice operators in takeaway and dining out segments, as well as some supply to local institutional healthcare establishments.
Key features of channels to market • Dominant influence of major chain supermarkets through their major share of
the domestic consumer market• Major role for meat wholesalers in distribution to non-FSS channels
Dominant drivers of value• Major influence on wholesale values by movements in export returns • At retail, the diversity of cuts, quality and meal occasion compared with major
competing meats such as chicken
Major trends and dynamics• Increased direct sourcing by FSS chains• Increased value-adding and integration featuring wholesalers and specialty retailers
Figure 32 Beef and lamb value chain assessment
Logistical efficiency
Primary product yield
Value capture
Innovation adoption
Diversity of products & services
Informed market 2.8
3.0
2.6
2.6
3.3
2.3
Beef and lamb
Figure 33 Beef and lamb products category map
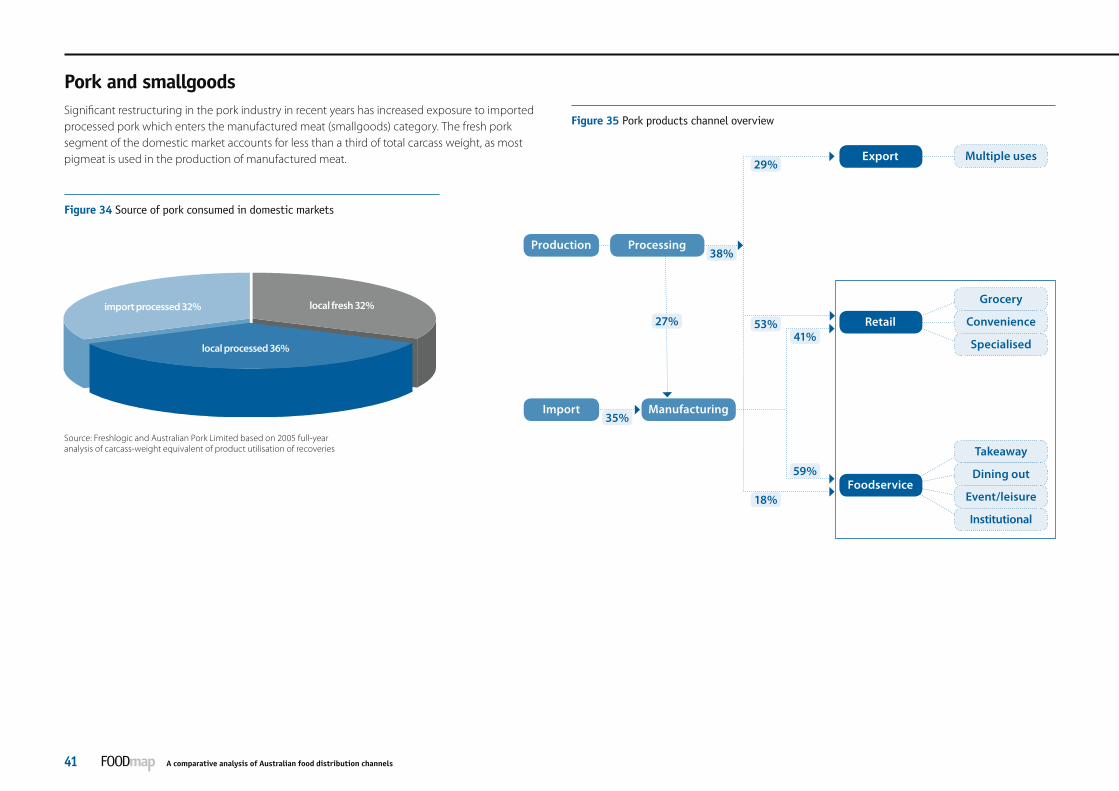
section 4 Mapping food categories
A comparative analysis of Australian food distribution channels41
section 4 Mapping food categories
import processed 32%
local processed 36%
local fresh 32%
Multiple uses29%
Export
Import Manufacturing
Grocery
Convenience
Specialised
Retail53%
Foodservice
Takeaway
Dining out
Event/leisure
Institutional
18%
41%
59%
Production Processing38%
35%
27%
Significant restructuring in the pork industry in recent years has increased exposure to imported processed pork which enters the manufactured meat (smallgoods) category. The fresh pork segment of the domestic market accounts for less than a third of total carcass weight, as most pigmeat is used in the production of manufactured meat.
Pork and smallgoods
Figure 35 Pork products channel overview
Source: Freshlogic and Australian Pork Limited based on 2005 full-year analysis of carcass-weight equivalent of product utilisation of recoveries
Figure 34 Source of pork consumed in domestic markets

section 4 Mapping food categoriessection 4 Mapping food categories
A comparative analysis of Australian food distribution channels 42
Caterers
Dominant or major flow of product to market
Import
Foodservice distributor
Meat wholesaler
Smallgoods manufacturing
Processing
Smallgoods distributor
Cash and carry
Production
FSS Retailer
Independent retailer
Takeaway
Dining out
Event/leisure
Institutional
Specialty retailer
Retail pork distribution channels are more complex than other meat sectors due to the amount of pork consumed in the manufactured meat sector. About 56 per cent of carcass output in domestic pigmeat production is processed into fresh pork cuts.
Meat industry sources estimate that FSS retailers hold about 66 per cent of the fresh pork market while butchers account for 26 per cent, and sales direct into the independent retail and foodservice channels account for the rest.
The direct supply from processors to retailers dominates distribution flows for these categories. Meat wholesalers and specialist smallgoods distributors play a central role outside FSS channels, supplying independent retailers, butchers and foodservice outlets.
Key features of channels to market
• Dominant influence of major chain supermarkets through a major share of the domestic consumer markets in fresh and manufactured products
• Major role for wholesalers in distribution to non-FSS channels
Dominant drivers of value
• Carcass return based on blended fresh and manufactured yields
• For fresh retail product, the diversity of cuts, quality and meal occasion compared with major competing meats such as beef and chicken
Major trends and dynamics
• Increased import of ham and bacon products
• Reduction in export competitiveness
Figure 36 Pork value chain assessment
Overview
Figure 37 Pork and smallgoods category map
Logistical efficiency
Primary product yield
Value capture
Innovation adoption
Diversity of products & services
Informed market 2.7
2.7
2.8
2.6
3.6
2.3

section 4 Mapping food categories
A comparative analysis of Australian food distribution channels43
section 4 Mapping food categories
Multiple usesExport
Further processing
Grocery
Convenience
Specialised
Retail
Foodservice
Takeaway
Dining out
Event/leisure
Institutional
Production Fresh product
The poultry meat industry has experienced steady market and production growth and features two major elements: fresh poultry meat sold primarily through the retail channels, and processed poultry, which has a large market share in foodservice channels. The sector has benefited from improved cost-competitiveness and the consistent quality of meat retailed as fresh meat, as well as the expansion in the role of chicken meat in takeaway markets—especially through the QSR channel. Industry data is scant due to the concentration of ownership of integrated processing activities and the sector’s highly competitive nature.
Poultry meat
Figure 38 Poultry products channel overview
For these purposes
• Fresh poultry product is fresh whole and portions, and supplied: – through grocery and specialty retail channels– to takeaway (hot chicken) outlets– to dining establishments.
• Processed poultry includes frozen and further transformed products:– Portions and cuts sold through takeaway food outlets– Portions and snack products sold frozen in retail outlets.

section 4 Mapping food categoriessection 4 Mapping food categories
A comparative analysis of Australian food distribution channels 44
Caterers
Dominant or major flow of product to market
Processing
Frozen foods distributor
Poultry meat wholesaler
Production FSS Retailer
Independent retailer
Specialty retailer
Takeaway
Dining out
Event/leisure
Institutional
QSR
Foodservice distributor
Overview
The distribution channels relevant to poultry meat encompass both fresh poultry and processed products. The structures are comparably as complex as other meat sectors due to the extent of chicken meat that is consumed in the manufactured meat sector. The other major difference is the strong concentration of ownership in chicken processing. A small number of vertically integrated processors are engaged in growing, first stage and further processing of about 80 per cent of poultry meat.
Industry sources estimate that FSS retailers hold about 69 per cent of the retail fresh poultry market while butchers account for 18 per cent, and direct sales into the independent retail and foodservice channels account for the rest.
The direct supply from processors to retailers and into the high-volume QSR channel dominates distribution flows for these categories. For retail markets outside the FSS channels, foodservice wholesalers and specialist chilled and frozen food distributors play a major role in supplying independent foodservice outlets offering takeaway and dining facilities.
Key features of channels to market • Dominant influence of major chain supermarkets and QSR channels through
a major share of the domestic consumer market
Dominant drivers of value• Uniformity and consistency of product quality• The range of primary meal occasions and cut/portion types compared with
majorcompeting meats such as beef and pork• Meal value in primary takeaway/fast food market
Major trends and dynamics• Improved competitiveness of poultry meat• Increasing total poultry demand resulting from bigger foodservice markets,
mostly through the takeaway channels
Figure 39 Chicken meat value chain assessment
Figure 40 Poultry products category map
Logistical efficiency
Primary product yield
Value capture
Innovation adoption
Diversity of products & services
Informed market 3.6
3.3
2.6
3.3
3.8
2.7

section 4 Mapping food categories
A comparative analysis of Australian food distribution channels45
section 4 Mapping food categoriesSeafood
aquaculture 7%
import 69%
local wildcatch 24%Multiple uses
11%Export
Imported Processed
Grocery
Convenience
Specialised
Retail51%
Foodservice
Takeaway
Dining out
Event/leisure
Institutional
38%
80%
20%
Fresh
In overall terms, the seafood industry is highly reliant on imported product—which generally lands in frozen or further processed form—to supply a large portion of the domestic market requirement. A significant portion of seafood is sold in processed form (canned or in frozen meal portions), and a large component of imported frozen fish is sold into the domestic market as fresh product.
Figure 41 Source of edible seafood volumes* consumed in domestic markets Figure 42 Seafood products channel overview
Table 8 Seafood market mix in 2005
Key industry statistics—edible seafood volumes (2005, ‘000 tonnes)
Sourced Domestic fresh Export Domestic processed
Wildcatch 82 63 19 -
Aquaculture 24 18 6 -
Imported 178 107 - 71
Data supplied by Seafood Australia
Source: Data supplied by Seafood Australia * This includes fresh and processed seafood markets
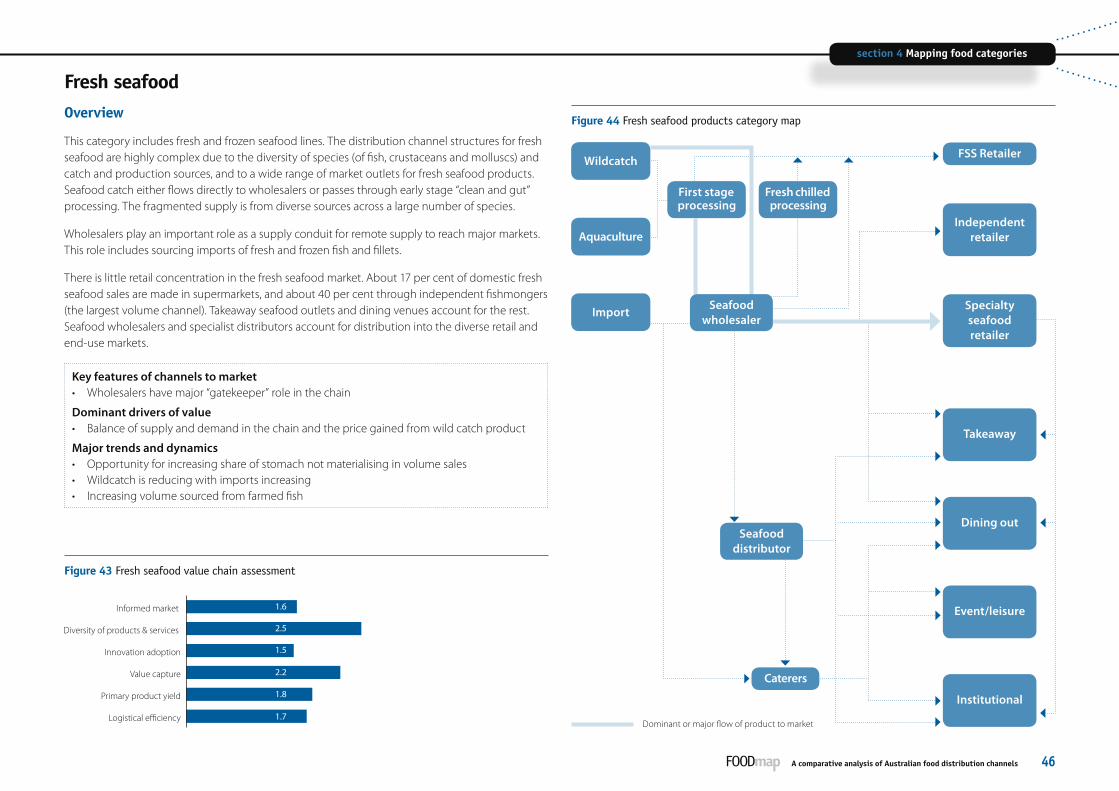
section 4 Mapping food categoriessection 4 Mapping food categories
A comparative analysis of Australian food distribution channels 46
FSS Retailer
Independent retailer
Specialty seafood retailer
Takeaway
Dining out
Event/leisure
Institutional
Caterers
Aquaculture
Import
Fresh chilled processing
Wildcatch
Seafood wholesaler
First stage processing
Dominant or major flow of product to market
Seafood distributor
Overview
This category includes fresh and frozen seafood lines. The distribution channel structures for fresh seafood are highly complex due to the diversity of species (of fish, crustaceans and molluscs) and catch and production sources, and to a wide range of market outlets for fresh seafood products. Seafood catch either flows directly to wholesalers or passes through early stage “clean and gut” processing. The fragmented supply is from diverse sources across a large number of species.
Wholesalers play an important role as a supply conduit for remote supply to reach major markets. This role includes sourcing imports of fresh and frozen fish and fillets.
There is little retail concentration in the fresh seafood market. About 17 per cent of domestic fresh seafood sales are made in supermarkets, and about 40 per cent through independent fishmongers (the largest volume channel). Takeaway seafood outlets and dining venues account for the rest. Seafood wholesalers and specialist distributors account for distribution into the diverse retail and end-use markets.
Key features of channels to market • Wholesalers have major “gatekeeper” role in the chain
Dominant drivers of value• Balance of supply and demand in the chain and the price gained from wild catch product
Major trends and dynamics• Opportunity for increasing share of stomach not materialising in volume sales• Wildcatch is reducing with imports increasing• Increasing volume sourced from farmed fish
Figure 43 Fresh seafood value chain assessment
Figure 44 Fresh seafood products category map
Logistical efficiency
Primary product yield
Value capture
Innovation adoption
Diversity of products & services
Informed market 1.6
2.5
1.5
2.2
1.8
1.7
Fresh seafood

section 4 Mapping food categories
A comparative analysis of Australian food distribution channels47
section 4 Mapping food categories
Seafood wholesaler
Caterers
Dominant or major flow of product to market
Import
First stage processing
FMCG processing
Foodservice distributor
Seafood distributor
FSS Retailer
Independent retailer
Specialty retailer
Takeaway
Dining out
Event/leisure
Institutional
Wildcatch
Aquaculture
Overview
This category includes processed seafood products and portions which are in the form of canned and frozen packaging. The distribution channel structures for processed seafood are far less complex than fresh and frozen seafood lines.
There is much higher retail market concentration in processed products as FSS retailers have a dominant market share of the sales of consumer pack products. About 87 per cent of canned product volumes are sold in supermarkets, while 25 per cent of frozen portion products are sold through this channel. A portion of the rest of these lines is distributed by manufacturers and seafood wholesalers to the foodservice sector.
Key features of channels to market
• Strong role of FSS in processed volume lines
• Wholesalers have major “gatekeeper” role in the chain
Dominant drivers of value
• Private label product price for volume lines
Major trends and dynamics
• Increasing volumes of imported processed volumes at lowering unit prices
• Increased demand for portion-prepared product
Figure 45 Processed seafood value chain assessment
Processed seafood
Figure 46 Processed seafood products category map
Logistical efficiency
Primary product yield
Value capture
Innovation adoption
Diversity of products & services
Informed market 3.3
2.5
2.5
2.6
3.3
2.3

section 4 Mapping food categoriessection 4 Mapping food categories
A comparative analysis of Australian food distribution channels 48
Eggs
FSS Retailer
Independent retailer
Specialty retailer
Production
48%
Wholesale egg distributor
Foodservice distributor
Caterers
Grading & packing
Fresh produce distributor
Dominant or major flow of product to market
Takeaway
Dining out
Event/leisure
Institutional
QSR
Overview
Sales through FSS chains dominate the egg category.
Industry sources estimate that FSS retailers hold about 48 per cent of the egg retail market, with other significant retail sales of packaged eggs made through independent food stores and specialty fresh food stores such as greengrocers.
The dominant distribution flows are direct supply from egg companies to FSS retailers, independent and specialty retailers and QSR chains which centrally procure food. Specialist egg distributors (“box” marketers) and foodservice distributors supply the diverse end-use markets where eggs are used as food ingredients and meal components.
Key features of channels to market • Major FSS have dominant role but a significant volume of product moves into independent
retail and foodservice• Large volume of business through “box” market, which involves direct distribution into non-FSS
points of retail sale—pressure from this channel depends on balance of supply and demand
Dominant drivers of value• Balance of demand and supply in the chain, which fluctuates according to chick placements• The relationship between private label and discount retail price offerings is the key price
point driving value • Product differentiation based on production system—barn versus free range, organic,
etc—and packaging• Significant differentials in price between private label and branded lines
Major trends and dynamics• Growth in consumption in recent years
Figure 47 Egg value chain assessment
Figure 48 Egg products category map
Logistical efficiency
Primary product yield
Value capture
Innovation adoption
Diversity of products & services
Informed market 3.2
2.9
2.5
2.3
2.4
2.7

section 4 Mapping food categories
A comparative analysis of Australian food distribution channels49
section 4 Mapping food categoriesHorticulture
Multiple uses14% Export
Imported Processed
Grocery
Convenience
Specialised
Retail61%
Foodservice
Takeaway
Dining out
Event/leisure
Institutional
25%
55%
30%
Raw/fresh64%
70%
36%
15%
30%
In overall terms, the industry is supplied with locally produced product. This has driven local producers to be largely oriented to producing for the fresh domestic markets. Potatoes and tomatoes dominate processing volumes. Lower cost imports are a modest five per cent of local production but continue to take share from local product in the processing sector.
Fruit and vegetables
Figure 49 Fruit and vegetable products channel overviewTable 9 Fruit and vegetable market mix in 2005
Key industry statistics—2004/05 (000 tonnes)
Australian Production
Domestic fresh Processed Export
Fruit 1750 1085 394 271
Vegetables 3094 1585 1334 175
Total 4844 2670 1728 446
Source: Data supplied by Horticulture Australia Limited

section 4 Mapping food categoriessection 4 Mapping food categories
A comparative analysis of Australian food distribution channels 50
FSS Retailer
Independent retailer
Specialty retailer
Takeaway
Dining out
Event/leisure
Institutional
QSR
Production
Import
55%
Broker
Fresh cut processing
Fresh food wholesaler
Fresh produce distributor
Caterers
10%
35%
Dominant or major flow of product to market
Fresh fruit and vegetables Overview
This category includes fruit and vegetables sold fresh to consumers at retail, or to foodservice establishments for use in meal preparation. There is concentration at retail, with FSS retailers commanding an estimated 55 per cent share of sales, but there is also considerable strength in the specialty fresh food retail channel, which has been capturing share.
Fresh food wholesalers in central market facilities play a significant role in pricing and distributing product into retail and foodservice channels. Direct sourcing arrangements by FSS retailers account for a significant share of the channel’s intake.
The tightening of quality specifications into the FSS channel over time has left a substantial volume of quality product available to specialty fresh food retailers. This has helped specialists capture market share from the FSS channel.
Key features of channels to market • FSS have a major lead with convenience and dominate retail share with 65 per cent,
but are exposed to challenges of 24-hour operation• Specialist retailers have increased share by competing on value quality• “Category managers” to FSS have major “gatekeeper” roles in the chain
Dominant drivers of value• Balance of supply and demand throughout seasons• Primary volume lines of staple fruit and vegetable
Major trends and dynamics• Cost-competition from imported produce • Competition from snack foods to provide more convenient fruit “fix” • Climatic change impacting supply lines
Figure 50 Fresh fruit & vegetable value chain assessments
Figure 51 Fresh fruit & vegetables category map
Logistical efficiency
Primary product yield
Value capture
Innovation adoption
Diversity of products & services
Informed market 1.8
1.9
2.1
1.9
1.3
2.0
Fruit
Logistical efficiency
Primary product yield
Value capture
Innovation adoption
Diversity of products & services
Informed market 1.5
2.3
2.5
1.9
1.8
2.2
Vegetable

section 4 Mapping food categories
A comparative analysis of Australian food distribution channels51
section 4 Mapping food categories
Production
Frozen food distributor
Caterers
Processor
Foodservice distributor
Cash & carry
Dominant or major flow of product to market
FSS Retailer
Independent retailer
Takeaway
Dining out
Event/leisure
Institutional
Import
Overview
This category includes fruit and vegetables processed into canned, bottled or frozen products. The distribution structures are similar to generic dry grocery lines.
There is significant concentration at retail level with FSS retailers dominating sales. Direct sourcing arrangements of imported product account for an increasing share of the channel’s intake with the expansion of private label volumes.
A number of wholesale businesses supply the independent retail and foodservice markets, including specialist frozen food distributors.
Key features of channels to market
• Major FSS dominate, but a significant volume of product moves into specialty retail and foodservice through foodservice distributors
Dominant drivers of value
• Private label presence/share and the use of “everyday low pricing” practices ensure competitiveness
• Additives and other differentiators provide scope for product extension
• Incidence/opportunity for imported processed product to fill role in this category, including private label lines
Major trends and dynamics
• FSS stores are still commanding growth in dry grocery categories, which are less susceptible to pressure from consumers’ convenience preferences
Figure 52 Processed fruit & vegetable value chain assessment
Processed fruit and vegetables
Figure 53 Processed fruit & vegetables category map
Logistical efficiency
Primary product yield
Value capture
Innovation adoption
Diversity of products & services
Informed market 3.2
2.9
2.5
2.3
2.4
2.7

section 4 Mapping food categoriessection 4 Mapping food categories
A comparative analysis of Australian food distribution channels 52
Dominant or major flow of product to market
Franchised/supplier delivery
Caterers
Processor
Foodservice distributor
Cash & carry
FSS Retailer
Independent retailer
Specialty retailer
Takeaway
Dining out
Event/leisure
Institutional
Overview
This distribution channel structure covers a wide variety of dry grocery food products. It includes hot beverages, biscuits, shelf-stable desserts, packaged flour products, cooking ingredients (such as sauces, herbs, spices and condiments, fats and oils) and confectionery. The distribution structures are relatively generic for each product line.
There is significant concentration in the retail market for such goods, with FSS retailers commanding a dominant share of sales in each case, although case-by-case the retail market share will vary. Direct sourcing arrangements account for a high proportion of product supply.
A number of wholesale businesses supply the independent retail and foodservice markets, including foodservice distributors.
Key features of channels to market • Major FSS dominate but a significant volume of product moves into specialty retail and
foodservice through foodservice distributors
Dominant drivers of value• Private label presence/share and use of “everyday low pricing” practices ensure
competitiveness of offering• Additives and other differentiators provide scope for product extension • Incidence/opportunity for imported processed product to fill a role in category,
including private label lines
Major trends and dynamics• FSS stores still commanding growth in dry grocery categories, which are less susceptible
to pressure from consumers’ convenience preferences • Decreasing volumes in ingredients for “scratch-preparation” meals
Figure 54 Dry food groceries value chain assessment
Dry groceries
Figure 55 Dry food grocery products category map
Logistical efficiency
Primary product yield
Value capture
Innovation adoption
Diversity of products & services
Informed market 3.8
4.1
3.0
2.7
3.2
2.6

section 4 Mapping food categories
A comparative analysis of Australian food distribution channels53
section 4 Mapping food categoriesBeverages
FSS Retailer
Independent retailer
Specialty retailer
Dining out
Event/leisure
Institutional
Liquor wholesaler
Caterers
50%
Pubs/clubs
Dominant or major flow of product to market
Importer
Brewer/distiller/
winemaker
Overview
This category includes beer, wines, spirits and packaged products, as well as sales of alcoholic beverages through hotels, restaurants, cafés and catered venues.
There is increasing concentration of the retail market for packaged beer, wines and spirits with FSS retailers expanding their networks of liquor stores, which compete with a large number of independent liquor stores and hotel bottle shops. Brewers, wineries and importers supply FSS retailers direct.
Some liquor wholesalers directly service many independent liquor stores, hotels, clubs, licensed dining and catered venues. A large percentage of independent liquor stores operate under banner marketing and promotional activities, which are managed by wholesalers as part of their supply relationships.
Key features of channels to market • Increasing sales volume through FSS-owned outlets acquiring and expanding networks
Dominant drivers of value• FSS role in retail sector, increasing influence of price promotion as a competitive weapon• Product image marketing
Major trends and dynamics• Oversupply of wine and increasing low-cost export competition has reduced unit value• Slow growth in overall consumption (with beer sales flat), but moderate increases in value• Growth towards premium product in spirits and beer segments• Growth of larger scale liquor (barn) outlet• Consolidation of liquor wholesalers into major groups to resist FSS expansion and influence
Figure 56 Alcoholic beverages value chain assessment
Alcoholic beverages
Figure 57 Alcoholic beverages category map
Logistical efficiency
Primary product yield
Value capture
Innovation adoption
Diversity of products & services
Informed market 3.3
4.1
2.8
3.0
3.3
2.4
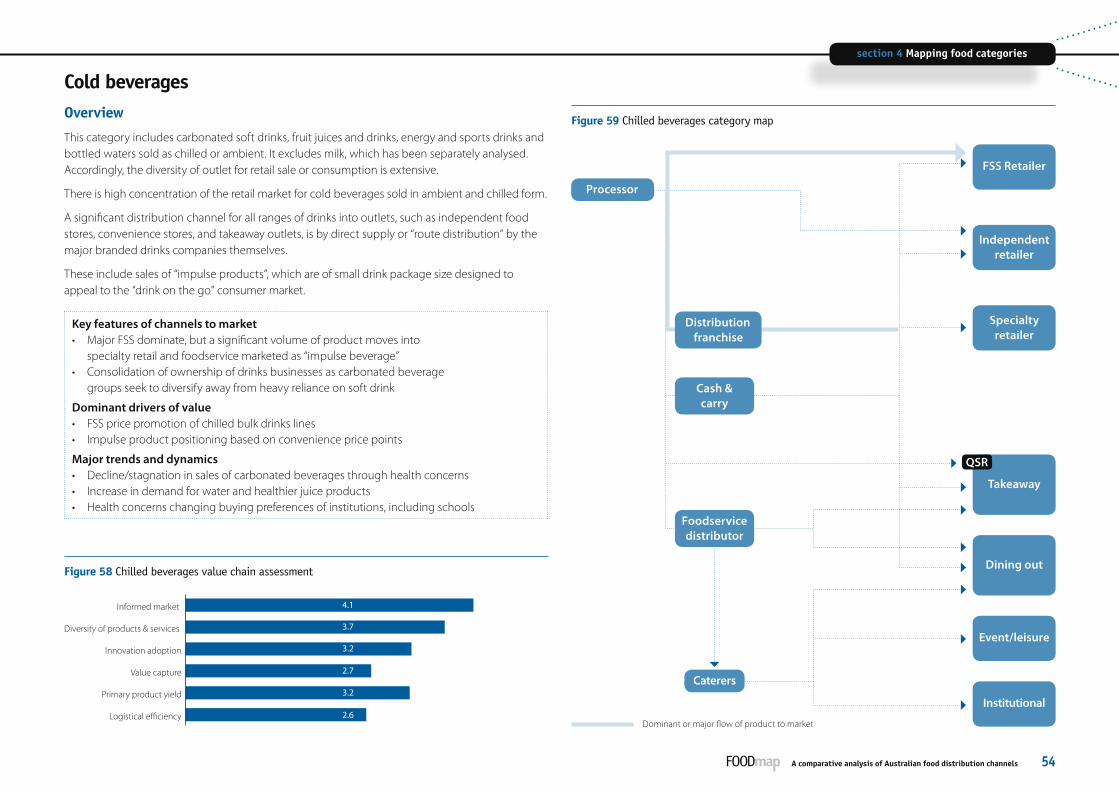
section 4 Mapping food categoriessection 4 Mapping food categories
A comparative analysis of Australian food distribution channels 54
Caterers
Foodservice distributor
Cash & carry
Processor
Dominant or major flow of product to market
FSS Retailer
Independent retailer
Specialty retailer
Takeaway
Dining out
Event/leisure
Institutional
QSR
Distribution franchise
Overview
This category includes carbonated soft drinks, fruit juices and drinks, energy and sports drinks and bottled waters sold as chilled or ambient. It excludes milk, which has been separately analysed. Accordingly, the diversity of outlet for retail sale or consumption is extensive.
There is high concentration of the retail market for cold beverages sold in ambient and chilled form.
A significant distribution channel for all ranges of drinks into outlets, such as independent food stores, convenience stores, and takeaway outlets, is by direct supply or “route distribution” by the major branded drinks companies themselves.
These include sales of “impulse products”, which are of small drink package size designed to appeal to the “drink on the go” consumer market.
Key features of channels to market • Major FSS dominate, but a significant volume of product moves into
specialty retail and foodservice marketed as “impulse beverage” • Consolidation of ownership of drinks businesses as carbonated beverage
groups seek to diversify away from heavy reliance on soft drink
Dominant drivers of value• FSS price promotion of chilled bulk drinks lines• Impulse product positioning based on convenience price points
Major trends and dynamics• Decline/stagnation in sales of carbonated beverages through health concerns• Increase in demand for water and healthier juice products • Health concerns changing buying preferences of institutions, including schools
Figure 58 Chilled beverages value chain assessment
Cold beverages
Figure 59 Chilled beverages category map
Logistical efficiency
Primary product yield
Value capture
Innovation adoption
Diversity of products & services
Informed market 4.1
3.7
3.2
2.7
3.2
2.6


Section 5 Mapping distribution channels
This section describes the distribution structures evident in the supply to the major channels of the Australian domestic retail market. The structures span grocery and independent/specialty
retail, takeaway and dining out and the various sub-channels of the institutional food market. The section also outlines the nature and composition of participants in food retail,
and the major drivers of volume and value in each case.
The assessments of the relative performance of each channel are provided by applying the methodology shown in section 3.

section 5 Mapping distribution channels
A comparative analysis of Australian food distribution channels57
section 5 Mapping distribution channelsGrocery retail
Overview
The FSS retail channel dominates sales of most food and beverages categories. Major chain retailers have large national store networks covering all inner city, suburban and regional centres. Smaller chains or independent banner groups have less comprehensive coverage of the market.
A key feature of the channel structure is the means by which retailers manage direct supply logistics on national or regional bases, through national (NDC) and regional distribution centres (RDC). The type of products supplied through these centres will depend on the nature of the products, and their availability or dependence on regional supply sources. RDCs will tend to be used for fresh product lines, whereas an NDC is more likely to supply dry groceries, for example. In some cases supplier or franchised direct-store delivery services will service parts of the retailer networks, especially those in regional centres.
Drivers of volume and value in this channel
General factors
• General level of consumer confidence and spending
• Consumer preference for greater convenience, and the trend towards eating out versus meal preparation
• Drift of business from non-aligned grocery and convenience outlets towards FSS and banner independent groups countered by erosion of same-store business due to changing consumer preferences and greater competition from independent and specialty retailers
Volume
• Number and geographical location of outlets
• Mix of size and type of outlet
• Service and convenience offering
• Promotional activities to drive specific category volumes
Value
• Price points of major competing lines
• Promotional practices
Figure 60 Full service supermarket value chain assessment
Table 10 Structure of the grocery retail channel
Chain Numbers* Offering
Woolworths/Safeway 756 Full-service supermarkets, limited number of inner-city smaller stores with convenience offering
Coles Group 737 Full-service supermarkets, limited number of inner-city smaller stores with convenience offering
IGA 279 Number of Supa-IGA stores which offer a FSS proposition equivalent to major chains
* Numbers at June 2006 (actual reported or estimated by Freshlogic)
Logistical efficiency
Innovation adoption
Diversity of products & services
Informed market 3.4
3.0
2.6
3.8

section 5 Mapping distribution channelssection 5 Mapping distribution channels
A comparative analysis of Australian food distribution channels 58
Full service
supermarkets
Franchised distributor
NDC
RDC
Broker
Food manufacturer
Fresh food supplier
Figure 61 Full service supermarket channel map

section 5 Mapping distribution channels
A comparative analysis of Australian food distribution channels59
section 5 Mapping distribution channels
Overview
Independent grocery and convenience store channels have a minority share of retail sales in most food and beverages categories and offer a limited range of products based on servicing the convenience needs of passing consumers. This channel includes specialist discount food stores, which offer a limited range of food and drinks at often deeply discounted prices to attract shoppers.
A significant percentage of convenience stores are located within petrol stations or suburban strips or village shopping centres. Chains or banner groups of independent and convenience stores are serviced by regional distribution centres.
Drivers of volume and value in this channel
General factors
• General level of consumer confidence and spending
• Drift of business towards FSS and banner independent groups from non-aligned grocery and convenience outlets
• Consumer preference for greater convenience and trend towards eating out versus meal preparation
• Expansion of FSS-allied or branded fuel outlets gaining greater share of convenience market
• Expansion of independent banner group networks through store acquisition and opening
• Expansion in the network of specialist discounters (Aldi) based on narrow range and selective demographic location
Volume
• Number and geographical location of outlets, including co-location with other specialist outlets
• Mix of size and type of outlet
• Service offering or composition, including co-location with fuel
• Promotional activities, including cross-promotion between FSS chains and discount fuel offers
Value
• Price points of major volume lines, to reflect more convenience value than competition pricing
Figure 62 Independent & convenience retail value chain assessments
Table 11 Structure of the independent & convenience retail channels
Chain Numbers* Examples of offering
Convenience
Woolworths 491 fuel • Woolworths/Safeway stores as part of petrol stations (some aligned to a fuel partner)
Coles/Shell 599 • Express stores in city locations and fuel stores
7-eleven 360 • Stand-alone stores or integrated in petrol stations
Other groups 357 • Stand-alone stores or integrated in petrol stations
Independent
Metcash banner groups
1209 IGA, 662 Foodworks
Metcash as a wholesaler serviced 2700 independent outlets (including IGA and Foodworks) at June 2006.
Other 850 Other independents include banner groups such as Night Owl, as well as independent “corner stores”
Discount retailers
Franklins 80 Limited range, not full service offering
Aldi 120 Limited range, discount lines
* Numbers at June 2006 (actual reported or estimated by Freshlogic)
Logistical efficiency
Innovation adoption
Diversity of products & services
Informed market 3.1
2.7
2.8
2.9
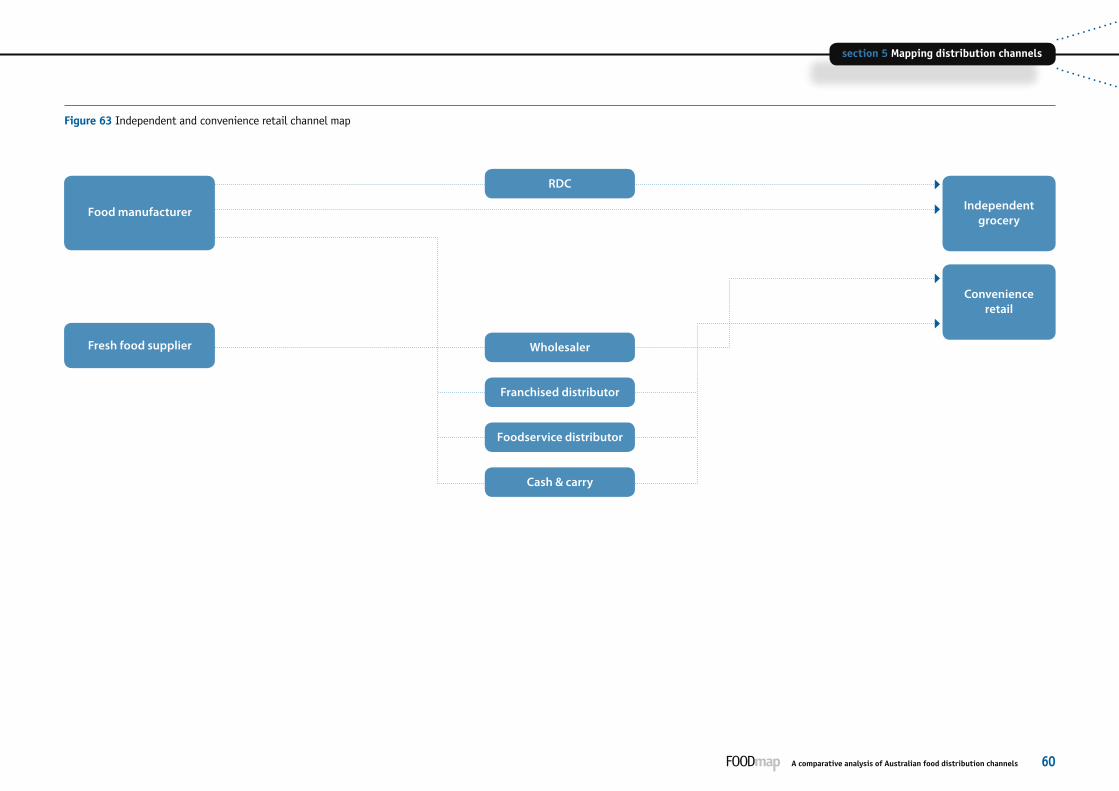
section 5 Mapping distribution channelssection 5 Mapping distribution channels
A comparative analysis of Australian food distribution channels 60
Independent grocery
RDC
Wholesaler
Food manufacturer
Fresh food supplier
Convenience retail
Franchised distributor
Foodservice distributor
Cash & carry
Figure 63 Independent and convenience retail channel map
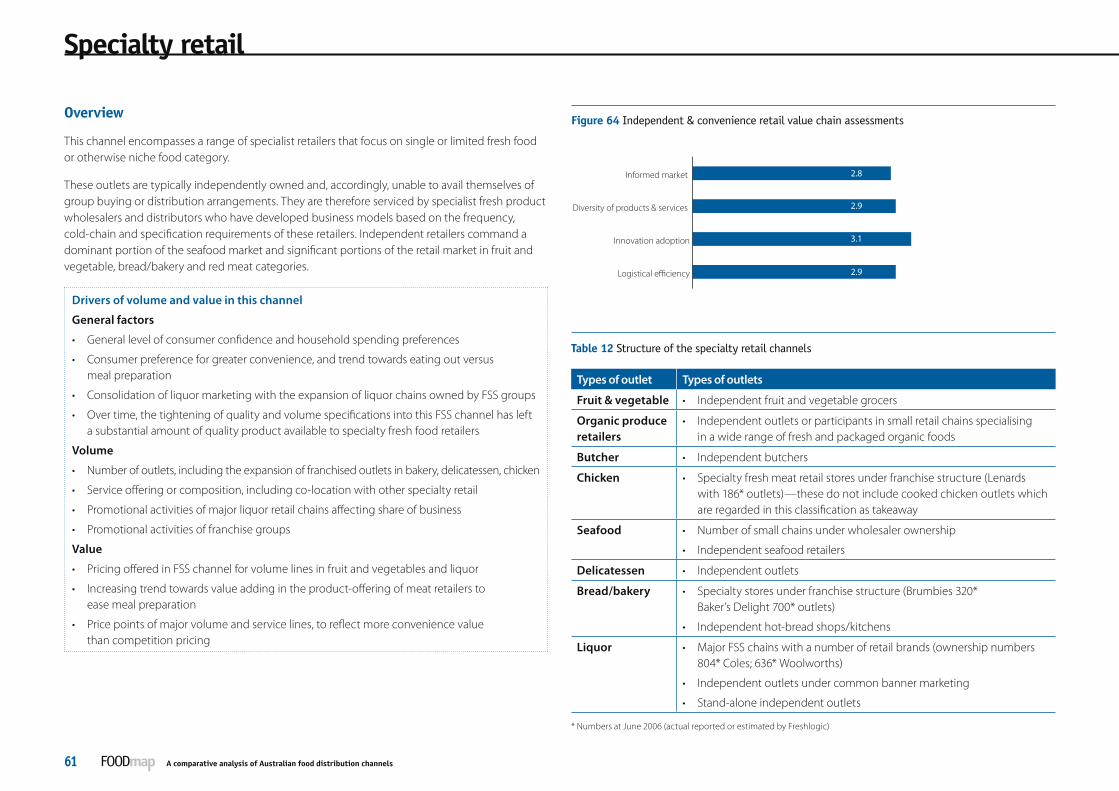
section 5 Mapping distribution channels
A comparative analysis of Australian food distribution channels61
section 5 Mapping distribution channelsSpecialty retail
Overview
This channel encompasses a range of specialist retailers that focus on single or limited fresh food or otherwise niche food category.
These outlets are typically independently owned and, accordingly, unable to avail themselves of group buying or distribution arrangements. They are therefore serviced by specialist fresh product wholesalers and distributors who have developed business models based on the frequency, cold-chain and specification requirements of these retailers. Independent retailers command a dominant portion of the seafood market and significant portions of the retail market in fruit and vegetable, bread/bakery and red meat categories.
Drivers of volume and value in this channel
General factors
• General level of consumer confidence and household spending preferences
• Consumer preference for greater convenience, and trend towards eating out versus meal preparation
• Consolidation of liquor marketing with the expansion of liquor chains owned by FSS groups
• Over time, the tightening of quality and volume specifications into this FSS channel has left a substantial amount of quality product available to specialty fresh food retailers
Volume
• Number of outlets, including the expansion of franchised outlets in bakery, delicatessen, chicken
• Service offering or composition, including co-location with other specialty retail
• Promotional activities of major liquor retail chains affecting share of business
• Promotional activities of franchise groups
Value
• Pricing offered in FSS channel for volume lines in fruit and vegetables and liquor
• Increasing trend towards value adding in the product-offering of meat retailers to ease meal preparation
• Price points of major volume and service lines, to reflect more convenience value than competition pricing
Figure 64 Independent & convenience retail value chain assessments
Table 12 Structure of the specialty retail channels
Types of outlet Types of outlets
Fruit & vegetable • Independent fruit and vegetable grocers
Organic produce retailers
• Independent outlets or participants in small retail chains specialising in a wide range of fresh and packaged organic foods
Butcher • Independent butchers
Chicken • Specialty fresh meat retail stores under franchise structure (Lenards with 186* outlets)—these do not include cooked chicken outlets which are regarded in this classification as takeaway
Seafood • Number of small chains under wholesaler ownership
• Independent seafood retailers
Delicatessen • Independent outlets
Bread/bakery • Specialty stores under franchise structure (Brumbies 320* Baker’s Delight 700* outlets)
• Independent hot-bread shops/kitchens
Liquor • Major FSS chains with a number of retail brands (ownership numbers 804* Coles; 636* Woolworths)
• Independent outlets under common banner marketing
• Stand-alone independent outlets
* Numbers at June 2006 (actual reported or estimated by Freshlogic)
Logistical efficiency
Innovation adoption
Diversity of products & services
Informed market 2.8
2.9
3.1
2.9
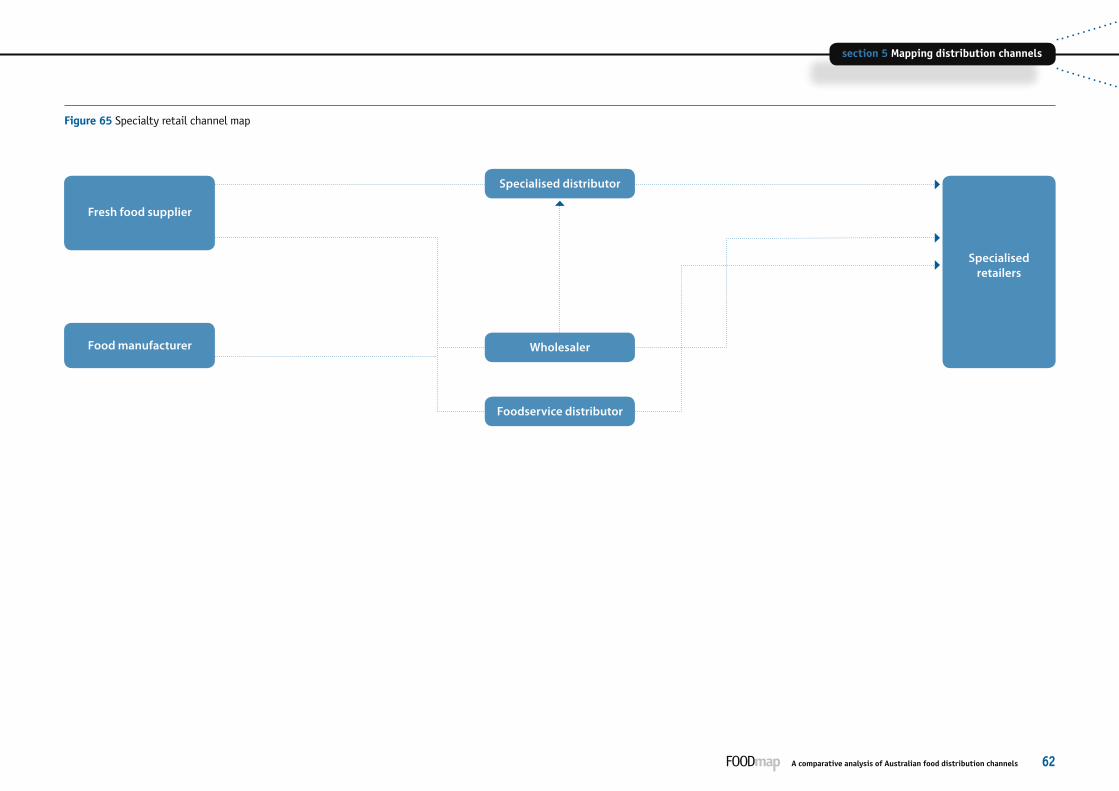
section 5 Mapping distribution channelssection 5 Mapping distribution channels
A comparative analysis of Australian food distribution channels 62
Specialised
retailers
Foodservice distributor
Specialised distributor
Fresh food supplier
Food manufacturer Wholesaler
Figure 65 Specialty retail channel map

section 5 Mapping distribution channels
A comparative analysis of Australian food distribution channels63
section 5 Mapping distribution channelsQuick service restaurants (QSR)
Overview
This channel encompasses large integrated chains of quick service restaurants (QSR) or takeaway food outlets. It represents a significant share in the takeaway retail food market, across burgers, chicken, pizza and salad meals. These outlets are typically franchised, and their meal and product ingredients are centrally purchased and supplied, according to tight specifications, through sophisticated logistics management practices. The supply arrangements generally involve either outsourced or in-house component processing and preparation. This will include pre-cooking, shredding and cutting, and pre-packaging of some fast-moving meal items.
Drivers of volume and value in this channel
General factors
• Consumer preference for greater convenience and trend towards eating out versus meal preparation
• Growth in consumer preference for takeaway as a casual dining option is clawing business away from retail and café/restaurant channels
• Consumer trend towards healthier eating has changed menu offerings towards fresher, salad-based products—this trend has been led by salads chain Subway and followed by others, and has offset potential loss of business due to dietary concerns
Volume
• Number of outlets—most major chains plan ongoing expansion of outlet numbers
• The increasing diversity of menu offering or composition within certain chains, and across the entire channel
• Growth in breakfast as a meal occasion
• Promotional activities based on menu features or meal packages
Value
• Price points of major competing meal package or components lines
Figure 66 QSR value chain assessments
Table 13 Structure of the QSR channel
Product offering
Major Group N
um
bers*
Hot
snacks
Bu
rgers
Fresh
salads
Pizza
Ice-cream/
drin
ks Other
Boost 155
Domino 425
Donut King 270
Eagle Boys 170
Hungry Jacks 594
KFC 712
McDonalds 745
Nandos 120 Chicken meals
NZ Natural 100
Oporto 87 Chicken meals
Pizza Hut 325
Red Rooster 254
Subway 977
Wendys 300
* Numbers at June 2006 (actual reported or estimated by Freshlogic)
Logistical efficiency
Innovation adoption
Diversity of products & services
Informed market 4.0
3.6
4.0
3.9

section 5 Mapping distribution channelssection 5 Mapping distribution channels
A comparative analysis of Australian food distribution channels 64
Quick service restaurants Food manufacturer
Fresh food supplier
Drinks manufacturer Chilled drinks distributor
Fresh cut processor
Wholesaler
Figure 67 QSR channel map

section 5 Mapping distribution channels
A comparative analysis of Australian food distribution channels65
section 5 Mapping distribution channelsIndependent takeaway
Overview This channel encompasses many independent takeaway food outlets covering different food groups or offerings, or both. These outlets are typically independently owned and accordingly unable to avail themselves of group buying or distribution arrangements. They are therefore serviced by a number of specialist fresh product and foodservice wholesalers and distributors who have developed business models based on the frequency, cold-chain and specification requirements of these retailers.
Drivers of volume and value in this channel
General factors
• Growth in consumer preference for takeaway as a casual dining option is clawing business away from retail and café/restaurant channels, but this is offset by the expansion of menu offering and network scale of QSR chains
• Consumer trend towards healthier eating has changed menu offerings towards fresher, salad-based products
• Loss of “fast food” business due to dietary concerns
• Growth in sandwich bar business where coffee is offered
Volume
• Number and location of outlets—with respect to traffic/catchment configuration for customer numbers
• Type of outlet
• Day parts or meal/social occasions serviced
• Days of the week of operation
Value
• Service offering
• Specialisation or quality positioning of the offering (gourmet/indulgence versus standard fare)
• Price points of major competing lines and/or meal packages
Figure 68 Independent takeaway value chain assessments
Table 14 Structure of the independent takeaway channel
Type Comments
Chicken Hot chicken outlets
Ethnic Includes specialised Chinese/Asian takeaway, Italian takeaway, noodle bars, sushi chains
In addition to specific takeaway offering, there are a large number of restaurants that offer a takeaway option
Pizza Takeaway only
Sandwich bars Still regarded as the major takeaway food outlet. These outlets are experiencing direct competition from Subway outlets
Seafood Fish & chips outlets
Logistical efficiency
Innovation adoption
Diversity of products & services
Informed market 2.2
3.5
3.0
2.6
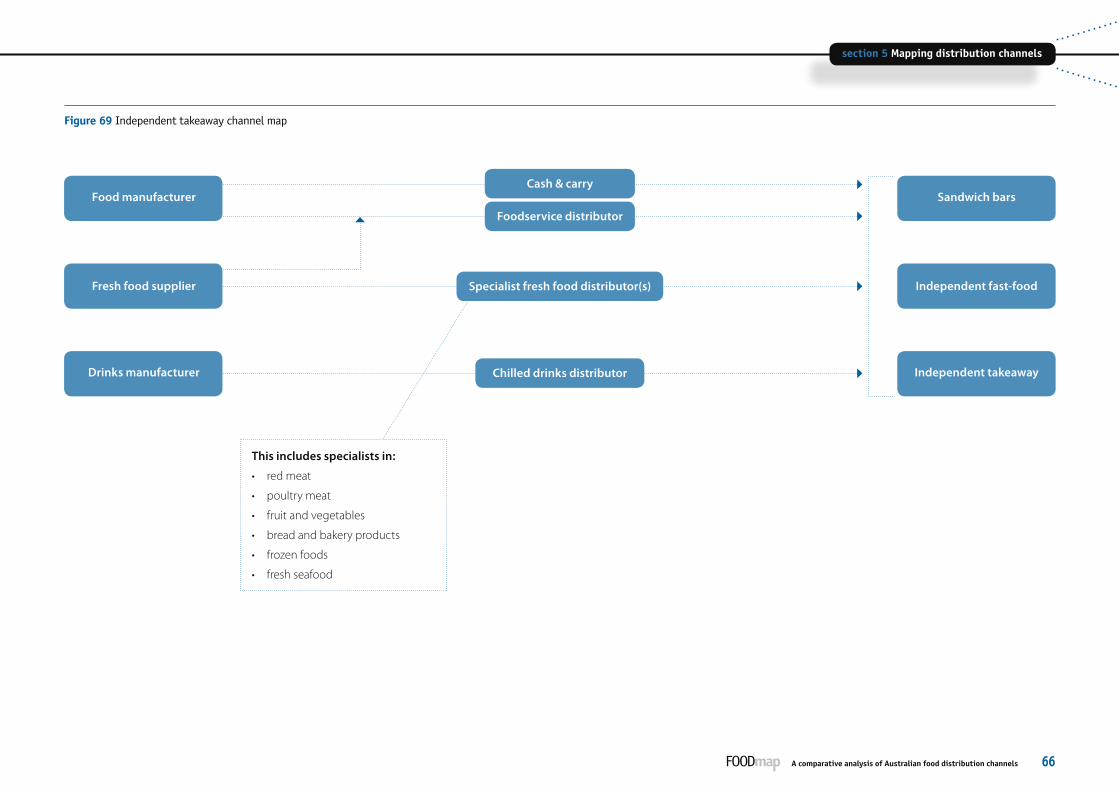
section 5 Mapping distribution channelssection 5 Mapping distribution channels
A comparative analysis of Australian food distribution channels 66
Cash & carrySandwich bars
Independent fast-food
Independent takeaway
Foodservice distributor
This includes specialists in:
• red meat
• poultry meat
• fruit and vegetables
• bread and bakery products
• frozen foods
• fresh seafood
Food manufacturer
Fresh food supplier
Drinks manufacturer Chilled drinks distributor
Specialist fresh food distributor(s)
Figure 69 Independent takeaway channel map

section 5 Mapping distribution channels
A comparative analysis of Australian food distribution channels67
section 5 Mapping distribution channelsDining out
Overview
This channel encompasses many independent dining and function venues. The outlets are typically independently owned and accordingly serviced by specialist fresh product and foodservice wholesalers and distributors offering services to meet the frequency, cold-chain and specification requirements of these retailers. Specialist meat, fruit and vegetable and seafood retailers service a significant portion of the fresh product needs of these establishments.
Drivers of volume and value in this channel
General factors
• Growth in consumer preference for casual dining reflected in the general increase in retail spending in the channel
• Growth of coffee as a focus for casual meeting and snacking occasions driving increased business into café channel
• Increasing consumer consciousness of cuisine
• Improved variety of restaurant offering
• Growth in breakfast as a meal occasion
• Growth in the numbers of outlets of coffee franchises and groups
Volume
• Number of outlets
• Seatings per night
• Breadth of menu offering
• Day parts, or meal and social occasions, or events serviced
Value
• Average main meal price
• Percentage of beverage in the sales mix
• Outlet location
Figure 70 Dining out value chain assessments
Table 15 Structure of the dining out channel
Chain Numbers* Offering
Café 7273
These include a wide variety of cuisine styles and ethnicity. Restaurant 15 380
Total 22 653
These include:
Restaurant with identified takeaway option
1390This is based on those outlets that promote a takeaway option but will be small compared to actual practice
Restaurants and cafés with licenses
18 900Including BYO permits in Victoria. This number has grown by 4200 or 28% in the period since June 2003
* Numbers at June 2006 (actual reported or estimated by Freshlogic)
Logistical efficiency
Innovation adoption
Diversity of products & services
Informed market 2.4
3.6
2.7
2.7
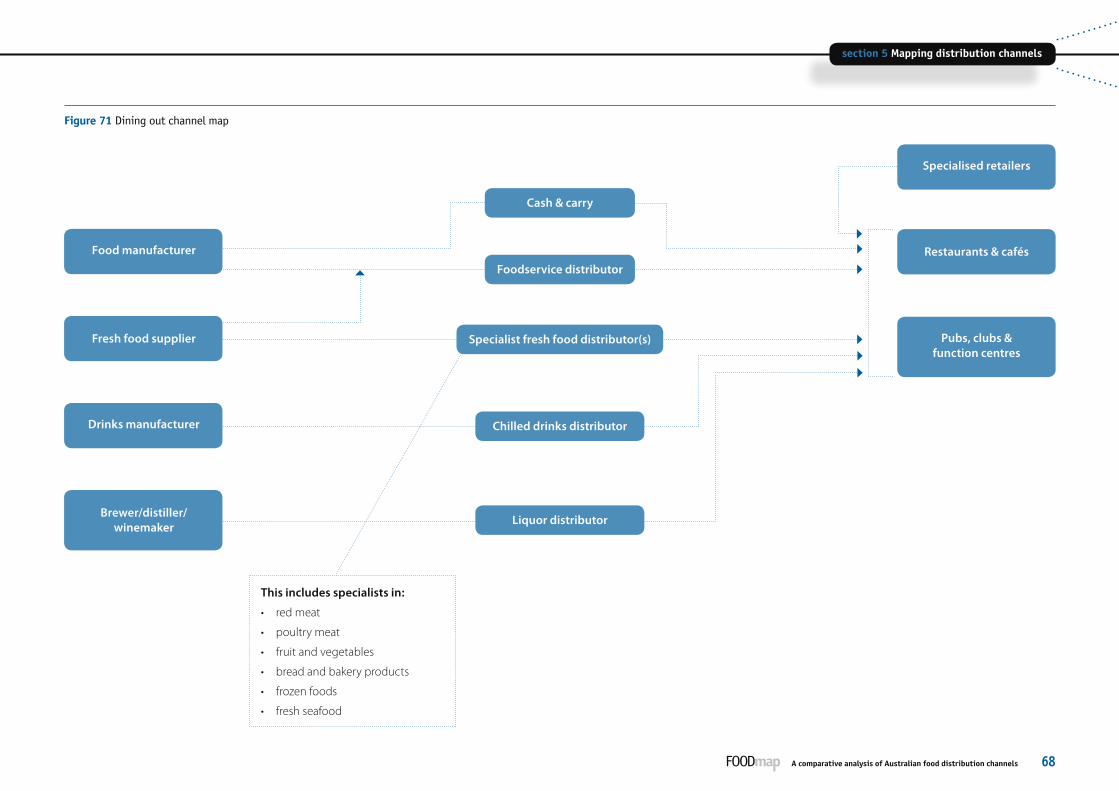
section 5 Mapping distribution channelssection 5 Mapping distribution channels
A comparative analysis of Australian food distribution channels 68
Chilled drinks distributor
Cash & carry
Restaurants & cafés
Pubs, clubs & function centres
Foodservice distributor
Specialist fresh food distributor(s)
This includes specialists in:
• red meat
• poultry meat
• fruit and vegetables
• bread and bakery products
• frozen foods
• fresh seafood
Specialised retailers
Liquor distributor
Food manufacturer
Fresh food supplier
Drinks manufacturer
Brewer/distiller/winemaker
Figure 71 Dining out channel map

section 5 Mapping distribution channels
A comparative analysis of Australian food distribution channels69
section 5 Mapping distribution channelsEvents & leisure
Overview
This channel encompasses many sporting and major event venues, and involves a large range of meal formats and price/value. Travel-catering includes the food and drinks supply to airline companies and to a large percentage of food outlets located in airport terminals.
Major catering companies (see page 82) generally manage and cater for event-and-travel food and drink. This includes full management of multi-outlet venues offering a range of QSR-style facilities through to formal meal sittings. The supply to airlines is typically from in-house and dedicated outsourced kitchens.
Drivers of volume and value in this channel
General factors
• Increased consumer preference for more time spent on leisure activities
• Improved marketing of sports as entertainment leading to growing crowd attendances at major sporting events
• Expansion of meal and snack options available at venues
• Improvement in sophistication of service offering by commercial and contract catering providers
Volume
• Number of major events and their prominence
• Number of outlets provided at major venues
• Type of outlet
Value
• Service offering and range provided
• Value range catered by event
• Price points of major competing lines
Table 16 Structure of the events & leisure channel
Typical Events Nature of food
Football codes—AFL, NRL, Rugby, Soccer
Major national code competitions and representative games. Involves casual snacks & drinks to full meals to support corporate marketing around a 2.5–3 hour event with finals involving some full day events
Cricket venues International & national representative games. Involves casual snacks & drinks around a full day/night event. International games reach venue capacity
Horse racing carnivals at defined seasonal windows
Casual snacks, drinks, casual meals through to full meals around full events
Grand Prix, Indy and other motor racing
Casual snacks and drinks through to full range meals to support corporate marketing. Full day event
Australian Open Tennis & State tournaments
Casual snacks, drinks and casual meals through to full meals around day long events
Corporate AGMs Casual snacks & drinks timed to appease shareholder scrutiny of management & director remuneration
Travel
Airport terminals Supply to a range of casual dining and convenience outlets and foodcourts
Airline Pre-prepared food packages for in-flight service, meals and components for business class air travel, and sea/rail meal sittingsOther rail/sea transport
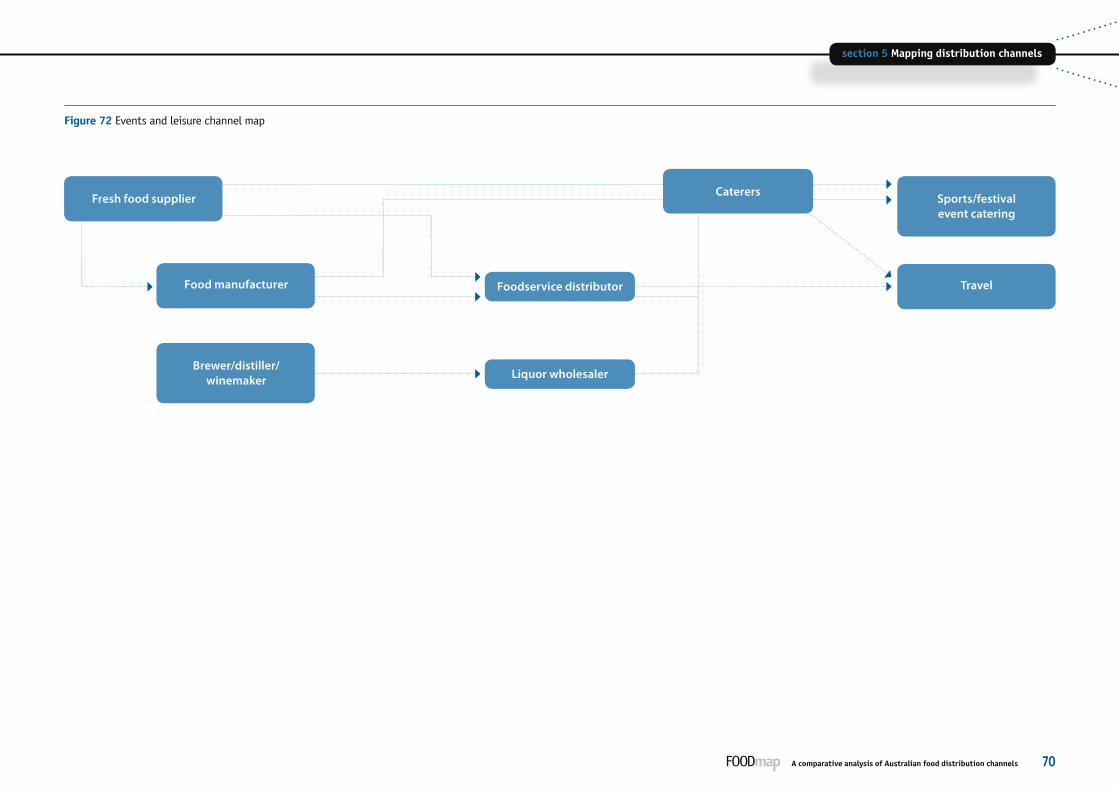
section 5 Mapping distribution channelssection 5 Mapping distribution channels
A comparative analysis of Australian food distribution channels 70
Fresh food supplier Sports/festival event catering
TravelFoodservice distributorFood manufacturer
Brewer/distiller/winemaker
Caterers
Liquor wholesaler
Figure 72 Events and leisure channel map

section 5 Mapping distribution channels
A comparative analysis of Australian food distribution channels71
section 5 Mapping distribution channelsInstitutional healthcare
Overview
This channel encompasses the supply of meals to many government and independent healthcare institutions which provide beds.
These facilities are generally serviced either through in-house kitchens or outsourced catering services. Commercial caterers are the largest provider of meal and kitchen management solutions to this segment, with the service package varying according to industrial practices, cost constraints and the size and location of the institution. These caterers source meals and their components according to requirements, and underpin these with supply arrangements from manufacturers and fresh food suppliers.
Drivers of volume and value in this channel
General factors
• Ageing population, with more infirm and aged patients in managed care
• Trend towards the consolidation of kitchens in regions, and the provision of cook-chill facilities in individual establishments
• Trend towards outsourcing of hospital and aged-care kitchens to contract caterers
• Greater precision in nutritional requirement
Volume
• Number of beds in institutions offering care
• Occupancy levels
• Nature of service offered by aged-care establishments—provided meals versus own-preparation
Value
• Cost constraint on meal portion cost, countered with nutritional requirement and solution
Figure 73 Institutional healthcare value chain assessments
Table 17 Structure of the institutional healthcare channel
Meal-serving institutions
Beds
Hospitals 829 76 076
Public
Private
Day/surgery
462
235
132
41 500
21 960
12 570
Public and private hospitals
Aged care 2778 201 790
Retirement villages
Nursing homes
Hostels
Other aged care
300
933
906
639
35 400
62 550
53 900
49 900
Diverse range of institutions in terms of their size, levels of care and treatment options/services.
Source: Freshlogic based on private database of establishments
Logistical efficiency
Innovation adoption
Diversity of products & services
Informed market 2.7
2.5
2.5
2.5

section 5 Mapping distribution channelssection 5 Mapping distribution channels
A comparative analysis of Australian food distribution channels 72
Hospitals
Aged care
Foodservice distributor
Specialised retailers
Chilled drinks distributor
Specialist fresh food distributor(s)
Caterers
In-house kitchen
Food manufacturer
Fresh food supplier
Drinks manufacturer
Figure 74 Institutional healthcare channel map

section 5 Mapping distribution channels
A comparative analysis of Australian food distribution channels73
section 5 Mapping distribution channelsOther institutional food
Overview
This channel generally encompasses contract catering services to kitchen and dining venues. Commercial caterers are the largest provider of meal and kitchen management solutions to this segment, with the service package varying according to industrial practices, cost constraints and the size and location of the institution. These caterers source meals and their components according to requirements, and underpin these with supply arrangements from manufacturers and fresh food suppliers.
Drivers of volume and value in this channel
General factors
• Government policy on defence and education spending
• Consolidation of corporation/organisational facilities into sites warranting service by an internal canteen
• Household trends affecting portion of lunches taken in lunchbox versus those bought at tuck shop
• Community pressure for greater control over quality of food offered in school canteens
Volume
• Number of defence personnel employed in field
• Number of educational institutions offering meals through dining halls and canteens, and their student numbers
• Meal occasions served
Value
• Budgetary limits on food spending
• Price points of major competing lines
Figure 75 Other institutional food value chain assessment
Table 18 Structure of the other institutional food channel
Volume indicators Comments
Defence 51 500 permanent force*
Estimated to provide an annual number of 8.7 million meals served across the 10 major field sites where permanent troops are stationed (Freshlogic estimate based on discussion with industry sources)
Prisons 26 000 prisoner numbers*
Food is generally serviced through in-house kitchens using inmate staff.
Schools Student numbers in schools equipped with canteens or offering boarding
6594* Primary
Servicing a total of 3.34 million* students
1468* Secondary
1164* Combined
Tertiary institutions
761 000* full-time students in 38 campus universities
Meals sold through canteens operated either by the institution itself or contract caterers
Corporate Numbers of company canteens and staffing
Mostly major corporations offering in-house canteens
Employees in remote mining facilities
Companies serving meals to mining camps
* Source: Australian Bureau of Statistics 2006
Logistical efficiency
Innovation adoption
Diversity of products & services
Informed market 2.7
2.3
3.6
2.9

section 5 Mapping distribution channelssection 5 Mapping distribution channels
A comparative analysis of Australian food distribution channels 74
Defence
Education
Foodservice distributor
Chilled drinks distributor
Specialist fresh food distributor(s)
Caterers
Correctional
Corporate (workplace)
In-house kitchen
Food manufacturer
Fresh food supplier
Drinks manufacturer
Figure 76 Other institutional food channel map


Section 6 Supply chain participants
The distribution maps in sections 4 and 5 identify significant participants who act as intermediaries and provide value-adding product transformation and service along key distribution chains. These maps are worthy of further
description to help understand the dynamics of the food industry more fully.
This section describes each of these enterprises, their roles and the factors affecting their place, now and in the future.

section 6 Supply chain participants
A comparative analysis of Australian food distribution channels77
section 6 Supply chain participants
Foodservice distributors
Role• Wholesale distribution of a wide range of products to small foodservice outlets
Value-added• Providing a range of cost-effective means for food suppliers to distribute product to numerous
and diverse retail and foodservice commercial buyers
Major factors affecting sector• Growth and capture of “share of stomach” by the foodservice channels
• Limited visibility of sub-channel market sizes and shares
• Consolidation of wholesale and distribution activities has been led by major participants
• Major suppliers seeking greater direct understanding of market growth opportunities
• Continued viability of the customer base of smaller enterprises in markets that are consolidating
• Price competitiveness, for smaller business customers, with the discount supermarkets
Opportunities to improve• Expanding the range of products on offer into fresh and chilled product to provide a
complete one-stop solution
• Better information resources would provide scope to improve response to market signals and directional trends
• Good value-chain contributor with a diverse range-of-services offer for the many and varied segments.
• Rewarded with above-average value capture
Figure 77 Foodservice distributors value chain assessment
Table 19 Major foodservice distributors
Group Product groups Business model/structure
Dry groceries
Chilled products
Fresh fruit & veg
Fresh meat
Catering supplies
Prepared meals &
meal com
ponents
Bidvest South African parent
PFD Private company
NAFDA
Countrywide
Metcash—Campbells
Cash and carry operations for small business operators in foodservice and independent/convenience retail
Golden State Foods
Fresh specialist—US based group
Value capture
Logistical efficiency
Innovation adoption
Diversity of products & services
Market knowledge 2.9
3.1
2.8
3.1
2.8
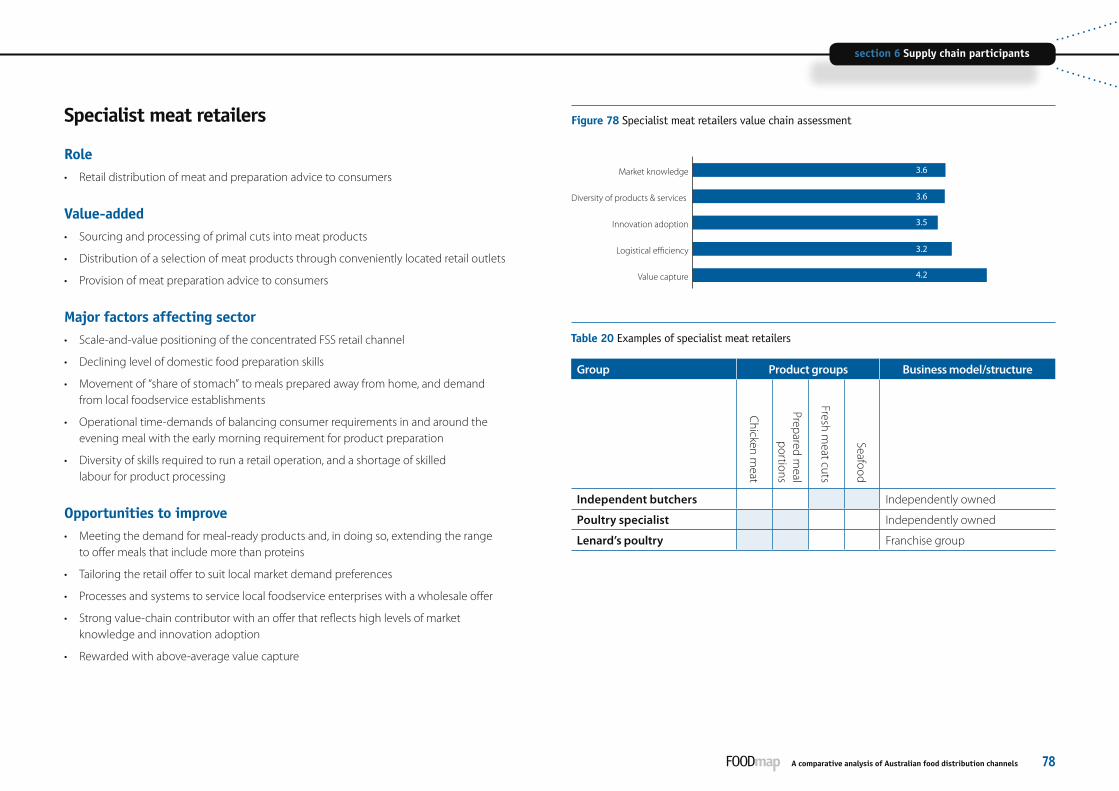
section 6 Supply chain participantssection 6 Supply chain participants
A comparative analysis of Australian food distribution channels 78
Figure 78 Specialist meat retailers value chain assessment
Table 20 Examples of specialist meat retailers
Group Product groups Business model/structureChicken m
eat
Prepared meal
portions
Fresh meat cuts
Seafood
Independent butchers Independently owned
Poultry specialist Independently owned
Lenard’s poultry Franchise group
Specialist meat retailers
Role• Retail distribution of meat and preparation advice to consumers
Value-added• Sourcing and processing of primal cuts into meat products
• Distribution of a selection of meat products through conveniently located retail outlets
• Provision of meat preparation advice to consumers
Major factors affecting sector• Scale-and-value positioning of the concentrated FSS retail channel
• Declining level of domestic food preparation skills
• Movement of “share of stomach” to meals prepared away from home, and demand from local foodservice establishments
• Operational time-demands of balancing consumer requirements in and around the evening meal with the early morning requirement for product preparation
• Diversity of skills required to run a retail operation, and a shortage of skilled labour for product processing
Opportunities to improve• Meeting the demand for meal-ready products and, in doing so, extending the range
to offer meals that include more than proteins
• Tailoring the retail offer to suit local market demand preferences
• Processes and systems to service local foodservice enterprises with a wholesale offer
• Strong value-chain contributor with an offer that reflects high levels of market knowledge and innovation adoption
• Rewarded with above-average value capture
Value capture
Logistical efficiency
Innovation adoption
Diversity of products & services
Market knowledge 3.6
3.6
3.5
3.2
4.2
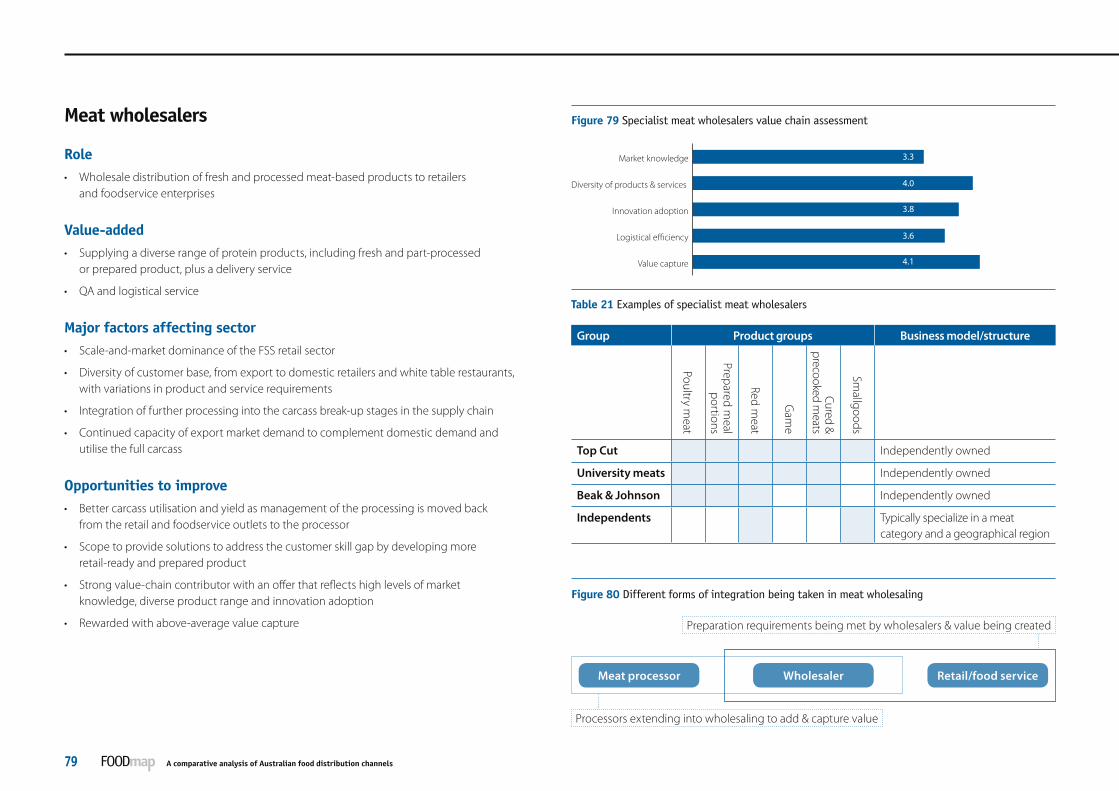
section 6 Supply chain participants
A comparative analysis of Australian food distribution channels79
section 6 Supply chain participants
Preparation requirements being met by wholesalers & value being created
Processors extending into wholesaling to add & capture value
Wholesaler Retail/food serviceMeat processor
Meat wholesalers
Role• Wholesale distribution of fresh and processed meat-based products to retailers
and foodservice enterprises
Value-added• Supplying a diverse range of protein products, including fresh and part-processed
or prepared product, plus a delivery service
• QA and logistical service
Major factors affecting sector• Scale-and-market dominance of the FSS retail sector
• Diversity of customer base, from export to domestic retailers and white table restaurants, with variations in product and service requirements
• Integration of further processing into the carcass break-up stages in the supply chain
• Continued capacity of export market demand to complement domestic demand and utilise the full carcass
Opportunities to improve• Better carcass utilisation and yield as management of the processing is moved back
from the retail and foodservice outlets to the processor
• Scope to provide solutions to address the customer skill gap by developing more retail-ready and prepared product
• Strong value-chain contributor with an offer that reflects high levels of market knowledge, diverse product range and innovation adoption
• Rewarded with above-average value capture
Figure 79 Specialist meat wholesalers value chain assessment
Table 21 Examples of specialist meat wholesalers
Group Product groups Business model/structure
Poultry meat
Prepared meal
portions
Red meat
Gam
e
Cured & precooked m
eats
Smallgoods
Top Cut Independently owned
University meats Independently owned
Beak & Johnson Independently owned
Independents Typically specialize in a meat category and a geographical region
Figure 80 Different forms of integration being taken in meat wholesaling
Value capture
Logistical efficiency
Innovation adoption
Diversity of products & services
Market knowledge 3.3
4.0
3.8
3.6
4.1

section 6 Supply chain participantssection 6 Supply chain participants
A comparative analysis of Australian food distribution channels 80
Figure 81 Liquor wholesalers value chain assessment
Table 22 Examples of liquor wholesalers
Group Customer groups
FSS outlets
Liquor Stores
Hotels & Clubs
Events
Restaurants & Cafés
Other
ALM (Metcash)
Independent Liquor group
LMG
Other small groups & independents
Value capture
Logistical efficiency
Innovation adoption
Diversity of products & services
Market knowledge 4.0
2.6
2.4
3.5
2.8
Liquor wholesalers
Role• To distribute wholesale a generic range of beverage products—beer, wine,
spirits—to specialty retail and foodservice outlets
Value-added• Range and product multiples, particularly the capacity to deliver smaller quantities
• Providing access for liquor suppliers to a diverse market of end-users
Major factors affecting sector• Limited visibility of sub-channel market sizes and shares
• Consolidation of wholesale and distribution activities has been led by major retailers
• Major suppliers seeking greater direct understanding of market growth opportunities
Opportunities to improve• Better information resources would provide scope to improve the response to market
signals and directional trends
• Moderate value-chain contributor with strong market knowledge, a generic range of products, and logistics for small customers
• Challenged to capture incremental value
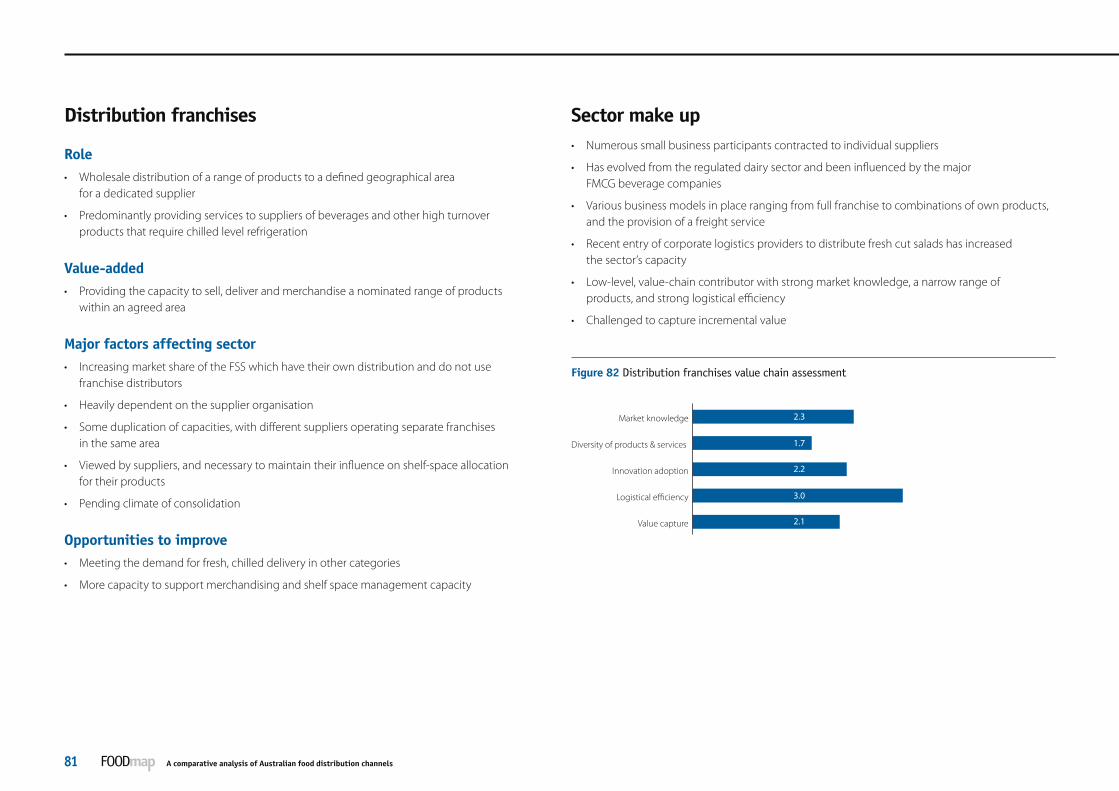
section 6 Supply chain participants
A comparative analysis of Australian food distribution channels81
section 6 Supply chain participants
Distribution franchises
Role• Wholesale distribution of a range of products to a defined geographical area
for a dedicated supplier
• Predominantly providing services to suppliers of beverages and other high turnover products that require chilled level refrigeration
Value-added• Providing the capacity to sell, deliver and merchandise a nominated range of products
within an agreed area
Major factors affecting sector• Increasing market share of the FSS which have their own distribution and do not use
franchise distributors
• Heavily dependent on the supplier organisation
• Some duplication of capacities, with different suppliers operating separate franchises in the same area
• Viewed by suppliers, and necessary to maintain their influence on shelf-space allocation for their products
• Pending climate of consolidation
Opportunities to improve• Meeting the demand for fresh, chilled delivery in other categories
• More capacity to support merchandising and shelf space management capacity
Sector make up • Numerous small business participants contracted to individual suppliers
• Has evolved from the regulated dairy sector and been influenced by the major FMCG beverage companies
• Various business models in place ranging from full franchise to combinations of own products, and the provision of a freight service
• Recent entry of corporate logistics providers to distribute fresh cut salads has increased the sector’s capacity
• Low-level, value-chain contributor with strong market knowledge, a narrow range of products, and strong logistical efficiency
• Challenged to capture incremental value
Figure 82 Distribution franchises value chain assessment
Value capture
Logistical efficiency
Innovation adoption
Diversity of products & services
Market knowledge 2.3
1.7
2.2
3.0
2.1

section 6 Supply chain participantssection 6 Supply chain participants
A comparative analysis of Australian food distribution channels 82
Figure 83 Commercial caterers value chain assessment
Table 23 Examples of major commercial caterers
Group Channels serviced
Corporate
Institutions
Major events
Travel (incl. term
inals)
Education
Functions
Spotless
Eurest
Delaware North
Sodexho
Independents (large number of small to medium operations)
Commercial caterers
Role• Providing a combination of food supply, preparation and on-site service for events, sporting
venues and workplace/school canteens.
Value-added• Providing a single point of contact for the supply and management of food catering
Major factors affecting sector• Growth and capture of “share of stomach” by the foodservice channels
• Consumer sensitivity to the quality of food on school menus
• The inclusion of services to manage and dispense the food is a growth component
Opportunities to improve• Move more processing back up the chain by encouraging suppliers with capacity
Sector make up • Diverse range of business sizes from public listed corporate companies—for example,
Spotless—with national offers through to numerous smaller independents servicing postcode-size catchments
• Cafés and restaurants increasingly offering catering service
• Strong, informed value-chain contributor above the mid-point on all factors
• Rewarded with above-average value capture
• Scope for further value growth
Value capture
Logistical efficiency
Innovation adoption
Diversity of products & services
Market knowledge 3.7
3.7
3.2
3.8
4.0


Conclusion
Conclusion
A comparative analysis of Australian food distribution channels85
Conclusion
Opportunities
Section 2 describes the significant changes affecting food distribution chains in the Australian food and beverage industry.
Against a highly dynamic background, the opportunities for the food industry to improve performance and value-capture are under four major headings.
a) Innovation in product form
The opportunity for suppliers is to offer greater convenience to consumers by working with retailer customers to:
– improve tailoring of ready-made components and ingredients
– provide competitive ready made meal solutions in conjunction with retailers
– deliver storage and packaging innovation that aids convenience and product versatility
– adopt technologies and layout configurations to improve the shopper flow through convenience checkouts at peak buying times.
b) Service opportunities in specialty retail and foodservice
Opportunities for specialist retailers in fresh retail and foodservice markets are expanding. The movement away from grocery retail may be sustained through a continued focus on product quality and reliability, and convenience and access. Opportunity exists from:
– an improved focus on quality, convenience and service frequency of food offering to local and regional foodservice establishments
– investment in greater awareness of local and regional customer/buyer requirements and relationship management, which will improve business performance
– assessing the scope for integrating further value-adding aspects of the service-offering to wholesalers and retailers so as to improve product sourcing and delivery of convenience-based prepared solutions.
The significant expansion in the diversity and range of casual dining and takeaway options is providing access opportunities for food suppliers as consumers express greater need for convenience. There is scope for:
– fresh-food suppliers to invest in research to define a relevant market catchment of local dining and catering establishments
– investment in an improved understanding of tailored product solutions, quality expectations and delivery, based on removing preparation time and cost.
Interest in specialty niche foods has expanded. Discerning, affluent consumers are increasingly interested in quality specialty foods to enhance the overall eating experience. This may be based on ethical grounds—for example, organic foods—or a wish to indulge in “the story” of the food.
The scope for food suppliers to penetrate more deeply into non-FSS markets and foodservice outlets may come with:
– investment to understand and reach consumers better
– improved awareness of local and regional specialty suppliers, distributors and retailers.
c) Solutions to capitalise on growth in institutional foodservice
As the population ages, there will be continuing demands for more sophisticated meal solutions through the institutional care market. Owners of institutional facilities are increasingly tending to outsource primary meal preparation and delivery functions to reduce overall costs. As providers attempt to offer more cost-effective contracted delivery systems, greater concern for nutritional benefits in foods is being expressed in buyer practices.

ConclusionConclusion
A comparative analysis of Australian food distribution channels 86
Information is the key
The challenge to provide better intelligence on the dynamics of the food industry is daunting in view of the complexity of retail and foodservice channels, and the current state of information sharing. Improved intelligence means not only understanding the sales trends at “last points” but also the forces affecting competitiveness and the changing supply-and-demand conditions within the distribution channels.
Most of the opportunities listed in this report can be realised only with a much greater investment in information and intelligence. This will allow better understanding of how to scope, develop and deliver the solutions an evolving market offers.
An inability to address information challenges will limit the scope of industry participants to take advantage of changing market and supply-chain conditions brought on by changes in the grocery retail channel, and to respond to the significant pressure points outlined in this report.
The way forward in overcoming these information gaps will meet resistance in two significant forms:
– historical attitudes and practices towards information sharing—especially in fresh food categories
– the competitive threat from making market conditions more visible, giving rise to a propensity to “mask” conditions for commercial advantage—dominant suppliers may see this as giving weaker rivals an advantage.
The ability of industry sectors and category participants to overcome this resistance will depend on (a) a value proposition that can establish a better picture of the overall food market and (b) the conditions within, and competition between, foodservice and specialty retail sub-channels. These will provide a basis to predict the effect of trends in consumer preferences.
Collective industry or sector investments will have a role in a better information environment only where such investment enables the achievement of a better “whole of industry” result—to grow business or capture more value, or both. Any viable solution will undoubtedly include a significant role for commercial-in-confidence pooling of intelligence.
Opportunities exist:
– to develop more tailored solutions—to balance nutritional and value requirements—for meals served in hospitals and other care facilities
– for suppliers to align with commercial caterers to enhance the quality and cost-effectiveness of the meal offering as the institutional market becomes more sophisticated.
d) Improving information and intelligence on market conditions
There is significant scope for better intelligence in non-FSS channels. This will help suppliers understand opportunities outside grocery retail channels through:
– collaboration within food categories, especially across the diverse foodservice sector
– more accurate and useful statistical market monitoring services.
Some categories suffer from a general lack of market knowledge and limited collaboration in managing supply chain information. The scope for improved understanding of market trends and needs can come through:
– collaboration to overcome the information voids created by intermediaries
– support for self-regulatory options for primary sectors to improve visibility and enable participants to make more informed decisions—these options include use of codes of practice by market participants in fresh products, and forms of selling terms and arrangements in other markets susceptible to pressure points
– skills and capacity development in supply-chain relationship and information management—this is a critical enabler to improvement.
Conclusion
A comparative analysis of Australian food distribution channels87
Bibliography
Materials referenced in this report are as follows:
Australian Bureau of Agricultural and Resource Economics 2006, Australian Commodity Statistics 2006, ABARE, Canberra
Australian Bureau of Agricultural and Resource Economics 2006, Australian Fisheries Statistics 2005, ABARE, Canberra
Australian Bureau of Agricultural and Resource Economics 2006, Australian Food Statistics 2006, ABARE, Canberra
Australian Bureau of Statistics 2006, Prisoners in Australia, Australian Bureau of Statistics, Canberra
Australian Bureau of Statistics 2005, Cafés and Restaurants in Australia 2003-04, Australian Bureau of Statistics, Canberra
Australian Bureau of Statistics 2006, Clubs, Pubs, Taverns and Bars, Australia 2004-05, Australian Bureau of Statistics, Canberra
BIS Shrapnel 2004, The Australian Foodservice Market, 8th edition, BIS Shrapnel, Sydney
Dairy Australia 2006, In Focus, produced by Dairy Australia, Melbourne
Foodweek 2006, Industry Yearbook and Directory, Huntleys’ Publications, Sydney
Meat & Livestock Australia 2006, Market Briefs, Meat and livestock market information, MLA, Sydney
National Food Industry Strategy 2005, Capabilities and Competing: High Performance in the Food and Beverage Industry, NFIS Limited, Canberra
Regmi, A and Gehlhar, M 2005, New Directions in Global Food Markets (Agriculture information bulletin no. 794), United States Department of Agriculture Economic Reporting Service, Washington

D E P A R T M E N T O F A G R I C U L T U R E , F I S H E R I E S A N D F O R E S T R Y
DAFF job no. 950559