A Common Analytical Model for Resilience Measurement ... · PDF filea Common analytical model...
52
A Common Analytical Model for Resilience Measurement CaUSaL FRaMEWORK aND METHODOLOGICaL OPTIONS Technical Series No. 2 Food Security Information Network FSIN Resilience Measurement Technical Working Group November 2014
Transcript of A Common Analytical Model for Resilience Measurement ... · PDF filea Common analytical model...

A Common Analytical Model for Resilience MeasurementCauSal Framework aNd meThodologiCal opTioNS
Technical Series No. 2Food Security Information NetworkFSIN
Resilience Measurement Technical Working Group
November 2014

This paper supports the overall objectives of the Food Security information Network (FSiN) tostrengthen information systems for food and nutrition security and promote evidence-based analysisand decision making.
This paper has undergone peer review in compliance with strict procedures established by the FSiNTechnical working group, which do not necessarily reflect the specific review procedures of all partnerorganizations.
The views expressed and the designations employed in this document are those of the author(s) anddo not necessarily reflect the views of Fao, iFpri, wFp or their governing bodies.
The designations employed and the presentation of information do not imply the expression of anyopinion whatsoever on the part of Fao, iFpri or wFp or their governing bodies. The mention of specificcompanies or products of manufacturers, whether or not these have been patented, does not implythat these have been endorsed or recommended by Fao, iFpri or wFp in preference to others of asimilar nature that are not mentioned.
Fao, iFpri and wFp encourage the use and dissemination of material in this information product.reproduction and dissemination thereof for non-commercial uses are authorized provided thatappropriate acknowledgement of Fao, iFpri and wFp as the source is given and that Fao’s, iFpri’s orwFp's endorsement of users’ views, products or services is not implied in any way.
all requests for translation and adaptation rights and for resale and other commercial use rights shouldbe addressed to the FSiN secretariat at [email protected].
© wFp 2014

A Common Analytical Model for Resilience MeasurementCauSal Framework aNd meThodologiCal opTioNS
November 2014
Food Security Information NetworkFSIN


Table of Contents
Acknowledgements 3
I. Background 4
II. Preface to the Common Analytical Model 6Conceptual models, analytical models and the utility of a common analytical model 6The importance of context in resilience measurement 7Building on knowledge gained from existing models of resilience measurement 8
III. Resilience Measurement Common Analytical Model 10Component 1. resilience measurement Construct: elaborating upon the basic definition 12Component 2. resilience Causal Framework 13Component 3. resilience Capacity data Structure: indicators and measurement properties 16Component 4. resilience measurement expected Trajectory 18Component 5. resilience measurement data Collection methods 21Component 6. resilience measurement estimation procedures 27
IV. Conclusion 33
V. References 34
VI. Annex: Review of Selected Models for Measuring Resilience 40Fao Conceptual Framework 40dFid/TaNgo resilience Conceptual Framework 42Tufts livelihoods Change over Time (lCoT) model 44oXFam and aCCra: From characteristic-based approaches to capacity-focused approaches 45

List of Figures
Figure 1. Components of the common analytical model for resilience measurement 11Figure 2. resilience Causal Framework 14Figure 3. Food security and resilience over time 19Figure 4. Food security and resilience with multiple shocks 20Figure 5. Fao resilience Conceptual Framework used in Somalia 41Figure 6. dFid/TaNgo resilience Conceptual Framework 43Figure 7. detailed "livelihoods cycle" framework adapted for Tigray, ethiopia 44
List of Formulas
Formula 1. Simplified estimation model 27Formula 2. Time-sensitive model with subjective measures 28Formula 3. Functional form estimating food security using resilience capacity 31
List of Tables
Table 1. resilience Capacities data Structure 17

a Common analytical model for resilience measurement - FSiN Technical Series No. 2
3
Acknowledgements
This paper was prepared jointly by mark a. Constas (Cornell university), Timothy r. Frankenberger(TaNgo international), John hoddinott (iFpri), Nancy mock (Tulane university), donato romano(university of Florence), Chris Béné (institute of development Studies), and dan maxwell (Tuftsuniversity) under the overall leadership of arif husain, Chief economist and deputy director, policy,programme and innovation division, world Food programme (wFp) and luca russo, Senioreconomist, agriculture development economics (eSa) division, the Food and agricultureorganization of the united Nations (Fao). detailed review was provided through a peer-reviewprocess in which greg Collins (uSaid), Jon kurtz (mercy Corps), and rachel Scott (oeCd) provideduseful critiques on various aspects of the paper. additional technical review was provided by theother members of the Food Security information Network (FSiN) resilience measurement Technicalworking group: Tesfaye Beshah (igad), gero Carletto (world Bank), richard Choularton (wFp),dramane Coulibaly (Fao), marco d'errico (Fao), katie downie (ilri), alessandra garbero (iFad), kyluu (Tulane university), eugenie reidy (uNiCeF) and Nigussie Tefera (european Commission, Jointresearch Centre).
The paper also benefited from detailed feedback and insights offered by John mcharris and astridmathiassen (wFp). Thanks are due to kostas Stamoulis, director, agricultural economics division(Fao) for his views on the paper and for useful discussions on the overall direction of the resiliencemeasurement Technical working group. a special note of gratitude is owed to alexis hoskins (wFp,FSiN Secretariat) for the direction and guidance she has provided across all aspects of the resiliencemeasurement Technical working group.
Véronique de Schutter (wFp) coordinated the editing, printing and publishing process, with supportfrom Cecilia Signorini (wFp). Zoe hallington provided much appreciated editorial assistance in thefinal review stages. graphic design and layout services were provide by energylink.

a Common analytical model for resilience measurement - FSiN Technical Series No. 2
4
I. Background
The combined effects of climatic changes, economic forces and socio-political conditions haveincreased the frequency and severity of risk exposure among vulnerable populations. recognizingthe challenges created by more complex risk scenarios, the concept of resilience has captured theinterest of varied groups of stakeholders concerned with how to reduce vulnerability and promotesustainable development. resilience is viewed as valuable because it seen as providing a unifiedresponse to shocks resulting from catastrophic events and crises, and to the stressors associated withthe ongoing exposure to risks that threaten well-being. The idea of resilience also holds particularappeal as a generalized ability to respond to an array of threats that have become more difficult topredict.
as interest in resilience has increased, so too has the need for a shared view of how to measureresilience. in recognition of this need, the Food Security information Network established theresilience measurement Technical working group (rm-Twg).1 The overarching goal of the rm-Twgis to provide guidance on how the analytical and procedural requirements of resilience measurementmight be presented as a set of practices that are technically sound and conceptually well developed.To this end, the rm-Twg is focused on producing a series of papers, technical bulletins andconsultation documents on different aspects of resilience measurement.
as the initial publication of the FSiN resilience measurement Technical Series, the first rm-Twgpaper (Constas et al. 2014) described ten key design principles for resilience measurement.2 Theobjectives of this first paper (referred to here as paper No. 1) were to provide a clear definition ofresilience and to describe the range of analytical demands associated with resilience measurement.it was important to begin with a clear definition because identifying key concepts is a preconditionfor sound measurement. Thus, paper No. 1 offered the following definition of resilience:
“Resilience is defined as a capacity that ensures stressors and shocks do not have long-lastingadverse development consequences.”
resilience capacity is therefore a concept with well-defined practical consequences. The actualcontribution it might make to improving a given development outcome is best demonstratedthrough an empirically testable relationship that links resilience capacities to the outcome of interest.paper No. 1 includes a basic formula in which resilience is identified as a predictor that can exert itsinfluence in relation to other predictor variables. The function is expressed in the following simplifiedformula:3
Food security = f (vulnerability, resilience capacity, shocks)
1. The resilience measurement working group, co-sponsored by the european union and uSaid, is comprised of 20individuals from government and non-government organizations. The full list of members is available athttp://www.fsincop.net/topics/resilience-measurement/technical-working-group/en/
2. a detailed discussion of the design principles may be found at http://www.fsincop.net/topics/resilience-measurement/en/3. although food security is specified as the outcome of interest, the rm-Twg agreed that resilience measurement could
also be applied to a wider class of development outcomes.

a Common analytical model for resilience measurement - FSiN Technical Series No. 2
5
The inclusion of shocks and resilience capacity in the formula are two key features of resiliencemeasurement: an optimal combination of resilience capacities can only be identified by measuringshocks. The formula is not meant to contain all the variables of interest; it was presented as asimplified expression that indicates the functional value of resilience capacity and sets the stage formore complete formulaic expressions upon which measurement work may be based.
as increased risk exposure is one of the main reasons for an interest in resilience, it is important to treatresilience as a capacity because of the effect that it may have on a food security or other developmentoutcome in the face of shocks.4 The inclusion of resilience capacity alongside vulnerability signifies thatresilience is not merely the inverse of vulnerability. rather resilience represents a particular set ofmeasurable resources and capabilities that households, communities and other units (e.g., wider systems)may use to prepare for and respond to a shock or combination of shocks. Being vulnerable means havingan increased probability of being exposed to risks, with such exposure presenting a threat to one’s well-being. resilience is a dynamic relationship that explains how a given set of capacities can reduce thevulnerability of a household (or other unit) and help it absorb, adapt and transform in the face of shocksand stressors. Thus, the function allows for the possibility that some populations can be both vulnerableand resilient. much has been written about the relationship between vulnerability and resilience (seeadger 2006; miller et al. 2010) and the issue of how best to represent the relationship as a function is stillunder debate. understanding the exact nature of this relationship will ultimately be settled as an empiricalmatter by examining the results from studies that report on the interaction between vulnerability andresilience as predictors of food security and as predictors of other development outcomes.
Building on the principles and extending the definition of resilience offered in paper No. 1, this secondpaper in the FSiN resilience measurement Technical Series is based on the premise that resilience canemerge as a topic of common interest only if a reasonable degree of consensus can be reached onhow resilience might be measured. This is because measurement comprises the set of practices thatallow one to translate concepts into technical practices that produce data. To help promote suchconsensus, this paper proposes a common analytical model within which the tasks of constructingresilience measurement may be specified and developed. at an operational level, the goal is toprovide a resilience-focused analytical model to answer questions about what data should becollected, at what points in time, using what tools, at what levels and subject to what types of analysis.
The paper is organized into four main sections. as a preface to the common analytical model, section twodescribes the general purposes served by analytical models and highlights elements of selected analyticalmodels of resilience measurement that have been applied to development. Section three describes thestructural arrangement of the components that constitute the common analytical model. Section fourdescribes each of the components and provides guidance on the methodological and analytical featuresof resilience measurement. The paper closes with a few comments that describe the utility of a commonanalytical model and highlight the kind of work that is needed to further advance resilience measurement.
4. using a latent variables modelling approach to measure resilience, some of the foundational work on resilience (see alinoviet al. 2009, 2010; Fao, 2014) treated resilience as both an unobserved outcome and as a predictor variable. Building onthe Fao model, Ciani and romano (2013) provided a focused analysis of how resilience can be used as a predictor of foodsecurity in the face of shocks. recent work on the resilience index measurement and analysis model, the next generationof the Fao model, allows resilience to be treated as either a predictor or an outcome.

a Common analytical model for resilience measurement - FSiN Technical Series No. 2
6
II. Preface to the Common Analytical Model
The data and insights generated by measurement can provide a basis for policy development,intervention and programme evaluation, and project implementation. using measurement data as afoundation for action is best justified when the logic of measurement is well expressed. To this end,the common analytical model is meant to promote the articulation of the logic of resiliencemeasurement.
To order to start describing the logic of resilience measurement, this section is structured aroundthree objectives. First, it seeks to clarify the purpose of an analytical model compared with that of aconceptual model. Second, the modelling approaches used in a selected number of studies arebriefly examined to identify some of the core components of the common analytical model forresilience. The reference to existing models of resilience acknowledges that significant work has beendone on measuring resilience and that this provides a useful starting point for constructing acommon analytical model for resilience measurement. recognizing the importance of context, thissection closes by describing the aspiration to propose a common analytical model that is bothbroadly applicable and sensitive to local conditions.
Conceptual models, analytical models and the utility of a common analytical model
models are used in many fields to provide simplified expressions or illustrations of complex, oftenabstract, phenomena. Such expressions are useful because they focus attention on the most criticalelements of a problem, programme or set of conditions. models also suggest how those elementsmight be connected, theoretically or practically, thereby providing a more coherent account of somecomplex reality. Conceptual models and analytical models are often used interchangeably inproblem modelling and programme development. it is therefore important to distinguish betweenthese two types of model before explaining the purpose of an analytical model for measurement.
a conceptual model could take the form of a theory of change associated with an intervention, or alogic model used to organize an evaluation. it considers a set of relationships that are viewed asdetermining a particular outcome (e.g., food security, stunting or poverty). This type of model usuallypresents a graphic depiction of the relationship; it typically displays a chronological sequence and/orfunctional dependencies among the key elements that constitute the relationship. in this way,conceptual frameworks offer detailed nominal and relational information: objects of interest arenamed, cause and effect relations are suggested, and contextual factors are noted. however, from ameasurement perspective, conceptual models do not show how to move from this graphicrepresentation to the technical practices and analytical procedures that are central to measurement.while data elements and causal relations may be implied, conceptual frameworks do not usuallyspecify what data will be collected, how they will be collected, and how they will be analysed. whileconceptual frameworks attempt to capture the concepts and constructs that should be measured,analytical frameworks go farther by providing more specific guidance on how to measure andestimate actual indicators related to a given construct – in this case, resilience.
a Common analytical model for resilience measurement - FSiN Technical Series No. 2
7
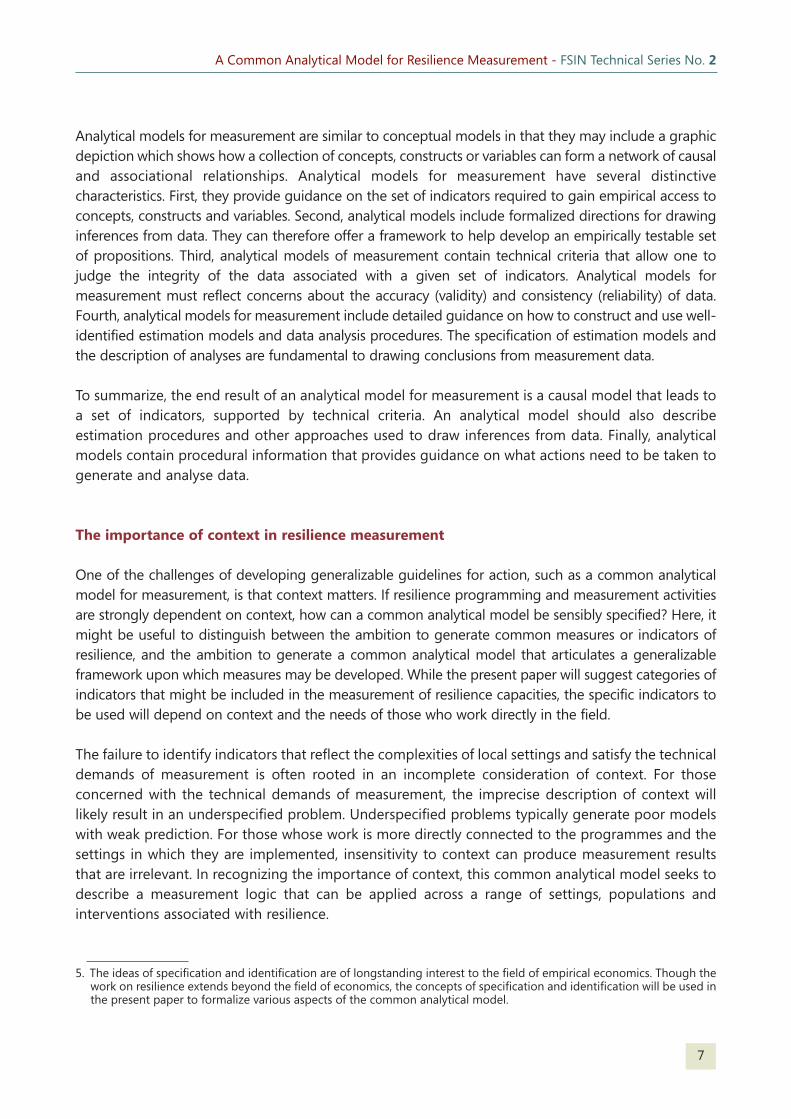
analytical models for measurement are similar to conceptual models in that they may include a graphicdepiction which shows how a collection of concepts, constructs or variables can form a network of causaland associational relationships. analytical models for measurement have several distinctivecharacteristics. First, they provide guidance on the set of indicators required to gain empirical access toconcepts, constructs and variables. Second, analytical models include formalized directions for drawinginferences from data. They can therefore offer a framework to help develop an empirically testable setof propositions. Third, analytical models of measurement contain technical criteria that allow one tojudge the integrity of the data associated with a given set of indicators. analytical models formeasurement must reflect concerns about the accuracy (validity) and consistency (reliability) of data.Fourth, analytical models for measurement include detailed guidance on how to construct and use well-identified estimation models and data analysis procedures. The specification of estimation models andthe description of analyses are fundamental to drawing conclusions from measurement data.
To summarize, the end result of an analytical model for measurement is a causal model that leads toa set of indicators, supported by technical criteria. an analytical model should also describeestimation procedures and other approaches used to draw inferences from data. Finally, analyticalmodels contain procedural information that provides guidance on what actions need to be taken togenerate and analyse data.
The importance of context in resilience measurement
one of the challenges of developing generalizable guidelines for action, such as a common analyticalmodel for measurement, is that context matters. if resilience programming and measurement activitiesare strongly dependent on context, how can a common analytical model be sensibly specified? here, itmight be useful to distinguish between the ambition to generate common measures or indicators ofresilience, and the ambition to generate a common analytical model that articulates a generalizableframework upon which measures may be developed. while the present paper will suggest categories ofindicators that might be included in the measurement of resilience capacities, the specific indicators tobe used will depend on context and the needs of those who work directly in the field.
The failure to identify indicators that reflect the complexities of local settings and satisfy the technicaldemands of measurement is often rooted in an incomplete consideration of context. For thoseconcerned with the technical demands of measurement, the imprecise description of context willlikely result in an underspecified problem. underspecified problems typically generate poor modelswith weak prediction. For those whose work is more directly connected to the programmes and thesettings in which they are implemented, insensitivity to context can produce measurement resultsthat are irrelevant. in recognizing the importance of context, this common analytical model seeks todescribe a measurement logic that can be applied across a range of settings, populations andinterventions associated with resilience.
5. The ideas of specification and identification are of longstanding interest to the field of empirical economics. Though thework on resilience extends beyond the field of economics, the concepts of specification and identification will be used inthe present paper to formalize various aspects of the common analytical model.

a Common analytical model for resilience measurement - FSiN Technical Series No. 2
8
Building on knowledge gained from existing models of resilience measurement
Various conceptual models for resilience measurement have been developed by researchers, non-governmental organizations, and national and international agencies. of the growing number ofmodels now in circulation, a limited number are supported by one or more empirical studies (seealinovi et al. 2009 and 2010; Ciani and romano 2013 maxwell et al. 2013; Smith et al. 2014).6 ananalysis of indicators and modelling procedures used in the four cited approaches reveals a gooddeal of consistency on the substantive elements (what needs to be measured) and themethodological features (the type of data collection tools) needed for resilience measurement. in theinterest of brevity, seven key characteristics of resilience measurement found in one or more of thefour selected models are highlighted:
1. Types of shocks – data on shocks may include widely experienced shocks (covariate shocks), localor individualized shocks (idiosyncratic shocks), and low-intensity stressors that can have acumulative negative effect on development. Specific types of shock that contribute to resiliencemeasurement include, for example, the effects of climate change, distinct weather events, conflictshocks, economic shocks, geological shocks, pests and disease.
2. Objective and subjective measures – data on shocks may include objective measures thatrecord basic data on shocks and stressors (i.e., intensity, scope, frequency) and subjectivemeasures (i.e., the perceived effect of shocks and stressors).
3. Resilience capacities – resilience capacity is necessarily multidimensional. it must encompass arange of indicators including economic (assets, markets, supply chains), social (social capital, socialnetworks), technological (agricultural practices), environmental (resources, natural resourcemanagement practices), infrastructure-related (roads), safety (conflict mitigation practices) andinstitutional (government) resources and capabilities.
4. Resilience dynamics – resilience capacity is time and event dependent. The effect that resiliencecapacities have on well-being in the face of shocks can be found by measuring well-being beforeand after shocks.
5. Grouping indicators – Factors such as the location of a target population or the type of livelihoodgroup affect both the probability of being exposed to a shock and/or stressor, and the capacitiesa target population has available to absorb, adapt, or transform in the face of shocks and/orstressors. The four studies collected locational and other data in order to analyse sub-groups.
6. Brief summaries of the models used in each of the studies cited are provided in the annex.

a Common analytical model for resilience measurement - FSiN Technical Series No. 2
9
6. Environmental context – The environmental conditions in which people live enable or limit theirrisk exposure and the opportunity to absorb, adapt and transform in the face of shocks. Thus arange of environmental factors are considered, such as climate and climate change, the state andmanagement of natural resources, agro-ecological zones and changes in the risk landscapeassociated with the environment and ecological systems.
7. Types of data – resilience measures may include a selection of quantitative and qualitative data,thereby generating the data needed to examine relationships, to construct and test predictionmodels to assess impact, and to describe local contexts in detail.
although this is not a comprehensive review of the available resilience measures, the analysis of thefour cited approaches helps validate recommendations from paper No. 1 and provides details onmeasurement that inform the development of the common analytical model for resiliencemeasurement proposed in section three of this paper.

a Common analytical model for resilience measurement - FSiN Technical Series No. 2
10
III. Resilience Measurement Common Analytical Model
a common analytical model for resilience measurement provides a logical structure within which theprocess of developing measures might be organized. The aim is to present a model that can beadapted to meet the needs of specific measurement situations while ensuring some degree ofstandardization across all measurement exercises.
To promote a shared perspective on resilience measurement, the common analytical modelpresented here comprises six components, each of which addresses a practical measurementquestion:
• Resilience construct assumptions – what are the basic assumptions about the nature ofresilience capacity that will influence the selection of indicators used to construct measures?
• Resilience causal framework – how is resilience capacity positioned in a dynamic relationshipthat explains well-being in the face of shocks? what types of indicators need to be measured, atwhat points in time, at what scale and using which methods in order to measure the effect ofresilience?
• Resilience indicators and data structure – what specific indicators are needed to measureresilience? what special characteristics of those indicators might help model resilience dynamics?
• Resilience expected trajectory – what is the expected rate of change? what factors affect therate of change of development outcomes over time, in the face of shocks and stressors, and inrelation to interventions and contexts?
• Resilience measurement data collection – what types of data collection tools and perspectivesare needed to obtain accurate data on resilience?
• Resilience measurement estimation procedures – how might data be analysed to drawinferences about the effect resilience capacities have on development outcomes in the face ofshocks and stressors?
The common analytical model is based on accepted foundations of measurement practice derivedfrom classical (e.g., Crocker and algina 1986; Cronbach and meehl 1955; Nunnally and Bernstein1994) and contemporary (e.g., preacher et al. 2013) theories of measurement. Figure 1 shows theanalytical elements and their foundational measurement practices, as well as the six components thatconstitute the common analytical model for resilience measurement.

a Common analytical model for resilience measurement - FSiN Technical Series No. 2
11
Building on the basic definition of resilience provided in paper No. 1, the portion of the model labelledResilience Construct Assumptions gives a more detailed definition of resilience as the object ofmeasurement. The Resilience Causal Framework and the Resilience Indicators and Data Structurecomponents are the core of the analytical model. The former describes the causal pathways, while thelatter addresses the substantive elements of resilience measurement. highlighting the importance ofmeasuring change over time, the Resilience Expected Trajectory component provides insights into thepath-dependent nature of resilience. The Resilience Measurement Data Collection componentdescribes how multiple data collection approaches are needed for resilience measurement, withspecial attention given to collecting contextually sensitive data at multiple scales. Finally, the ResilienceMeasurement Estimation Procedure component explores different approaches to identify howresilience-related variables can be organized to predict well-being in the face of shocks.
These six analytical components are explored in detail below. The discussion of each starts with apractical measurement question highlighting the importance of that component in the process ofdeveloping resilience measures. while each component is important, the Resilience Causal Framework(component two) is perhaps most central to advancing a common analytical model for resilience. Thisis because causal frameworks have implications for the theories of change that guide programming.They also specify a causal relationship that will inform the contents and structure of an estimation model.
Figure 1. Components of the common analytical model for resilience measurement
Analytical Elements forResilience Measurement
Foundations of SoundMeasurement
• Construct validity• latent properties• operationalization• multidimensionality• reliability standards• Validity standards• utility standards
Product of AnalyticalModel of ResilienceMeasurement
appropriately focused,technically rigorousresiliencemeasurements
resilienceConstruct assumptions
resilience CausalFramework
resilience indicators anddata Structure
resilience expected Trajectory
resilience measurementdata Collection
resilience measurementestimation procedure
a Common analytical model for resilience measurement - FSiN Technical Series No. 2
12
Component 1. Resilience Measurement Construct: Elaborating upon the basic definition
• Practical measurement question: what are the basic assumptions about the nature of resiliencecapacity that will influence the selection of indicators used to construct measures?
all measurement requires a clear definition of the construct to be measured. definitions then need tobe developed in order to specify indicators. in the case of resilience, paper No. 1 defined it as “a capacitythat ensures stressors and shocks do not have long-lasting adverse development consequences.”
a key part of the definition in need of elaboration concerns the temporal features of resilience. Theresilience construct and associated measurement can be located at two different points in time. First,resilience can be measured to produce a set of ex-ante indicators that are hypothesized as representingcharacteristics that predict the future well-being of a reference group, such as a household orcommunity, in the face of shocks. ex-post indicators are also needed to examine how one or more setsof well-being indicators change over time for a target group. well-being may be measured in terms ofseveral types of indicators (e.g., food security, poverty, physical health, safety) or through a combinationof indicators. while both ex-ante and ex-post indicators are needed to model resilience, it is importantto keep resilience firmly positioned as a capacity. The general assumption here is that investments anddevelopment programmes can help to support or build resilience capacity.
while it is true that certain well-being outcomes that change over time in the face of shocks andstressors may provide evidence of the effect of resilience capacities, this does not mean that theseindicators (e.g., food security or poverty) are the equivalent of resilience indicators. The focus of theresilience construct advanced here is resilience capacities, whose influences can be measured againsta given outcome such as food security or poverty.
There are four additional features of resilience as an ex-ante capacity:
1. resilience capacity is a positive influence: it is meant to improve well-being outcomes in the faceof shocks and stressors. while there are negative factors that are important for predicting well-being outcomes, these factors should not be counted as part of the resilience capacity construct.To the contrary, negative factors are – by definition – incapacities. as such, they may be vital formodelling but are distinct from resilience capacity.
2. resilience capacity is defined as a multi-dimensional human-centric construct. it is therefore seenas residing in human attributes and in the processes and structures created by humans. Structuresand processes include institutions, systems of governance, policies and programmes.
3. resilience capacity depends on the characteristics of the environments on which the well-being ofshock-prone populations depend. environments include the set of ecological resources or servicesand the agro-ecological conditions that are important for food security, livelihoods and otherdevelopment outcomes. environmental conditions also influence the severity of a shock. Forexample, the impacts of flooding and droughts are magnified by degraded lands that causehigher run-off rates and the depletion of essential soil nutrients.

a Common analytical model for resilience measurement - FSiN Technical Series No. 2
13
4. Consistent with perspectives developed in the field of ecology (Folke et al. 2002) and applied todevelopment studies (Béné et al. 2012; Frankenberger et al. 2014), the resilience construct is seenas representing three types of capacities in response to shocks and stressors: i) the capacity toabsorb shocks and stressors, ii) the capacity to adapt to shocks and stressors, and iii) the capacityto transform in the face of shocks and stressors. it may therefore be useful to know how differentcapacities (e.g., human capital) contribute to the ability to absorb, adapt or transform in the faceof shocks.
Combining these four features with the key characteristics of analytic models summarized earlierproduces a set of basic claims that bring further definition to the resilience construct provided in paperNo. 1. To elaborate on the definition originally provided, the resilience construct can be viewed as:
• an ex-ante capacity that serves a predictive function. The effect of resilience capacity may beobserved ex post in connection with selected indicators of food security and well-being;
• exerting a positive effect on food security and well-being in the face of shocks and stressors; • Supporting different functional outcomes, including the ability to absorb, adapt and transform in
the face of shocks; • a capacity that resides in households and in the larger aggregates (e.g., communities, institutions)
that support households; • Something to be observed at a given point in time and over extended periods because the effects
of resilience capacity are path-dependent and time-sensitive; • a multi-dimensional construct comprised of human, social, financial, physical and natural
resources or capitals; • a multi-level construct where the indicators needed to model resilience may be drawn from
households, communities or higher levels, depending on the nature of the intervention and theassociated theory of change/causal model; and
• Fundamentally connected to an interdependent set of ecological resources and agro-ecologicalconditions on which the capacity to respond to shocks and stressors strongly depends.
as elaborations on the basic definition, these eight aspects of the construct are consistent with theresilience measurement principles described in paper No. 1, and they help focus the set of indicatorsthat might be used to measure resilience. This presentation of resilience as a construct is reflected atvarious points in the description of the elements of the common analytical model that follows.
Component 2. Resilience Causal Framework
• Practical measurement question: how is resilience capacity positioned in a dynamic relationship thatexplains well-being in the face of shocks? what types of indicators need to be measured, at whatpoints in time, at what scale and using which methods in order to measure the effect of resilience?
Causal frameworks are useful because they focus measurement activities and because they provide apotential link between the logic of interventions and the organization of data analysis that follows

a Common analytical model for resilience measurement - FSiN Technical Series No. 2
14
measurement. The development of well-specified causal frameworks involves organizing the focus ofmeasurement as an observable sequence. a fundamental quality of a causal framework for resilience istherefore the presentation of measurement as a sequence of ordered and observable attributes, eventsand conditions. The presentation of resilience as a sequence of associated data collection opportunitiesdescribes the variety of indicators that need to be collected in a particular order (see Constas and Barrett2013). a second quality of well-specified causal frameworks is that the sequence of ordered, observableevents and conditions are represented as networks of testable cause and effect relationships. Theopportunity to test the validity of causal networks allows one to examine the effectiveness ofprogrammes. Such tests also help to strengthen the analyses on which claims of effectiveness are based.
reflecting the two qualities of a well-specified causal framework, The Resilience Causal Framework(rCF) presented here provides a further organizational scheme in which the task of developingresilience measures can be conceptualized and implemented. in Figure 2, the key features of the rCFare expressed in the four boxed components, each of which highlights the categories of indicatorsneeded to model resilience.
Figure 2. Resilience Causal Framework
Resilience Defined as an Instrumental Capacity that AffectsWell-Being in the Face of Shocks and Stresses
indicators required to model resilience
MultipleScales• household• Community• region• National• Systems
• resilience capacities• initial well-being • initial vulnerability
• Natural disasters• pest/disease outbreaks• political conflicts• economic shocks/stresses...
initial Statesand Capacities
Shocks andStressors
Subsequent Statesand Trajectories
• resilience capacities• well-being • Vulnerability
Ex-ante Component Disturbance Component Ex-post Component
Categories of Indicators Categories of Indicators
• political factors• Cultural factors• agro-ecological factors...
Categories of Indicators
Local Components
Contextual Factors
Categories of Indicators
MultipleMethods• Quantitative• Qualitative• objective• Subjective
Operational and Analytical Goal of Resilience Measurement
Collect and analyze data to model recovery and well-being trajectories over time as afunction of initial states and shocks/stressors, mediated by resilience capacity
Time and Event Sensitive Measurement

a Common analytical model for resilience measurement - FSiN Technical Series No. 2
15
Several features of the rCF should be highlighted. Structurally, the indicators move from ex-ante todisturbance to ex-post components, indicating a causal pathway. This pathway can be viewed asboth event-sensitive and time-sensitive. Thus, resilience can be linked to disturbances and to changesin well-being measured at non-arbitrary periods (i.e., beyond simple baseline/end-line datacollection plans, or seasonal collections). when the rCF is applied to actual measurement situations,it will be important to articulate how the general causal pathway and timing of data collection canbe aligned with a programme-based theory of change. on a substantive level, the four boxedcomponents emphasize the need to select and/or construct specific sets of indicators7 as part ofresilience measurement.
• Ex-ante component – This generates data to describe the initial state (t=1), before a shock, usingcategories of indicators that represent:
o the development outcome of interest (e.g., food security) in a way that is sensitive to the factthat well-being states are not static. The use of dynamic initial-state measurements of foodsecurity of two different households may, for example, yield the same food security score butwith different patterns of food security (e.g., worsening, improving, oscillatory) observed overtime;
o resilience capacity as a set of skills, abilities, relationships and resources held by a household,community or larger unit; and
o variables that influence the likelihood and consequences of risk exposure (e.g., vulnerability).
decisions about the specific set of resilience capacities to be measured will be informed by provenor hypothetical claims about which resilience capacities are most effective in relation to a particularshock or stressor.
• Disturbance component – This generates data to describe the intensity and effects of varioustypes of shocks and stressors, including:
o natural disasters/stressors, such as floods, droughts, earthquakes and the climate;o pest and disease outbreaks that threaten agricultural production;o political conflicts that directly threaten well-being and/or disrupt the systems (social systems,
governments and institutions, physical infrastructure, markets) on which well-being depends;and
o economic shocks and stressors that affect asset holdings, asset consumption patterns, marketfunctions, food and commodity prices, and other economic disturbances that may affect well-being.
7. The listing of indicators shown in the model for each component is meant to be illustrative rather than exhaustive. manyother indicators could be included under a given component. The selection of actual indicators will be a function of howthe relationship among ex-ante, disturbance and ex-post components is modelled and how each component and inter-component interactions are affected by context.

a Common analytical model for resilience measurement - FSiN Technical Series No. 2
16
it is important to collect disturbance information that not only records exposure to a shock but alsoreflects how shocks and their effects are often highly interactive. it is also useful to measure howshocks and stressors are perceived, including how they affect expectations and aspirations related tofuture well-being. although aspirations are noted here as part of the disturbance component, theway in which shock exposure affects long-term aspirations should also be examined.
• Ex-post component – This generates data to describe the end state when the last round ofmeasurement data are collected, using categories of indicators that represent:
o resilience capacity as a set of skills, abilities, relationships and resources held by a household,community or larger unit. Note: it is important to measure both ex-ante and ex-post indicatorsbecause the resources that comprise resilience capacity are often sacrificed to meet short-termneeds;
o variables that influence the likelihood and consequences of risk exposure (e.g., vulnerability); ando development outcomes using indicators related to, for example, food security, poverty or safety.
data collection for monitoring and evaluation often follows a simple pre-post design with a singlemeasurement taken at some point after an intervention. The timing of an ex-post (or ex-ante)measure should not simply follow a baseline, midline, end-line data collection scheme, because therelationship of these conventional moments of measurement is arbitrary relative to the shock. rather,the decision about when to collect data could be informed by a theory of expected rate of changefor an outcome of interest. as part of resilience measurement planning, it is useful to consider howlong it will take for a given outcome to reach an expected level. it is also important to take ex-anteand ex-post measures at more than one point in time to increase the accuracy of non-staticmeasures. This ensures that observed patterns of adaptation and transformation are not short-lived.where relevant, data collection should also reflect seasonal or other normal fluctuations in indicators.
The contextual component of the rCF is an additional set of indicators focused on data needed to describehow situational factors can affect the three main components of the model: i) initial states (includingresilience capacity), ii) the occurrence and experience of disturbances, and iii) the subsequent states.although a sample of contextual factors have been cited (political, cultural, social, agro-ecological, etc.), thespecific contextual factors to be included as part of resilience measurement is determined by local settingsand by theories of change. This point is elaborated upon in the section below on data collection.
The bracket on the far left of Figure 2 highlights the importance of collecting resilience data atmultiple scales. The systems level is the highest and most complex level at which resilience data canbe collected. The far right of the framework underlines the need for multiple methods.
Component 3. Resilience Capacity Data Structure: Indicators and measurement properties
• Practical measurement question: what specific indicators are needed to measure resilience? whatspecial characteristics of those indicators could help model resilience dynamics?

a Common analytical model for resilience measurement - FSiN Technical Series No. 2
17
The development of a data structure is an important step in the process of developing measures. a datastructure specifies indicators and organizes them into a structure that describes their properties. The datastructure provided here for resilience capacity is organized according to i) data elements that representresilience capacities, ii) resilience functions, and iii) measurement tactics. The data elements compriseresilience capacity categories and sample indicators. The resilience functions highlight the idea that resiliencecapacities may serve different functions, allowing a unit to absorb, adapt or transform in the face of a shockand stressors. The measurement tactics represent some of the methodological features of data collection.
reflecting the general guidance presented in paper No. 1 and drawing on the analysis of variousstudies of resilience (alinovi et al. 2009 and 2010; Ciani and romano 2013; Smith et al. 2014; maxwellet al. 2013), Table 1 outlines a proposed data structure to inform the selection and development ofindicators for resilience capacity.
Table 1. Resilience Capacities Data Structure
* aldrich, 2013**includes both physical and mental wellness
Resilience Capacities Data Structure: Data Elements, Resilience Functions and Measurement Tactics
Data Elements for Resilience Capacity
ResilienceCapacityCategories
Social capital*rC-SC
Human CapitalrC–hC
EconomicresourcesrC-er
ServiceinfrastructurerC-Si
LivelihoodstrategiesrC-lS
Inst. &governance rC-ig
Risk strategiesrC-rS
Tech. &innovationrC-Ti
Social protectionrC-Sp
Agro-ecological rC-ae
Sample Indicators
• Bonding• Bridging• linking
• education• Skills & abilities• health and wellness**
• assets -financial & productive• market access/mechanisms• Supply chain efficiency
• roads & transportation• water & sanitation• medical
• Food security & financial• diversity• adaptive
• Coverage • Structural integrity• effectiveness
• risk exp. history/perception• risk landscape assessment• problem definition• decision making & planning
• agriculture• Food handling/production• Business
• Focus & type • Strategic aim • integration & duration
• Soils & water resources• Cropping/grazing practices• Natural resource management
Response toShocks
Perspectives and Methods
Levels Measured
Time Periods andTrigger Events
Resilience Functions
Measurement Tactics to Increase Validity of Resilience Measures
• absorb• adapt• Transform
• objective• Subjective• Quantitative • Qualitative
• individual• household• Community• higher levels
• Short term• medium term• long term• event sensitive

a Common analytical model for resilience measurement - FSiN Technical Series No. 2
18
The indicators in Table 1 can either be combined into a single composite scale using factor analysisor incorporated into multiple regression analysis. The choice depends on the qualities of the dataand on analytical capacity.
in addition to the indicators in the second column of the table, several other sets of indicators canbe prioritized because of the way they are likely to affect observed resilience dynamics:
• gender • ethnic/cultural identity • livelihood groups • agro-ecological zones • geography and other spatial factors that affect shock exposure.
These variables and others identified as relevant according to explicit inclusion criteria (i.e., reflectingvariables that are consistent with a given theory of change) will help identify how resilience capacitychanges as a function of variables that are important programmatically, theoretically or contextually.
Component 4. Resilience Measurement Expected Trajectory8
• Practical measurement question: what is the expected rate of change? what factors affect the rateof change of development outcomes over time, in the face of shocks and stressors, and in relationto interventions and contexts?
one of the key strategies used to collect accurate resilience data is to recognize that data collectedat any point in time represent a temporal cross-section of a trajectory. The idea that observed states(e.g., well-being) are path-dependent has been well documented in resilience literature. here, pathdependency refers to trajectories that show how well-being may change over time in the face ofshocks. Figure 3 illustrates this idea: it charts the food security status of two households, hh-Q (thesolid line) and hh-r (the dashed line), over time.
initially, both households have the same food security status. in the aftermath of a shock, their foodsecurity falls. hh-Q’s food security gradually recovers. By contrast, hh-r’s food security recoversmore slowly and never fully regains its pre-shock level. hh-Q is resilient to this shock; hh-r is not.
8. This section of the paper is drawn from hoddinott 2014.

a Common analytical model for resilience measurement - FSiN Technical Series No. 2
19
Now consider a variant of the paths shown above. Figure 4 shows two households that begin withsimilar levels of food security. Both experience a shock that causes food security to fall, and bothrecover and return to their pre-shock food security status, at moderately similar rates. however, whena second shock occurs, household Y (hh-Y) recovers quickly but household Z (hh-Z) does not.instead, its food security falls to a new, lower level. hh-Z seemed resilient in the face of one shockbut could not manage a second. The reason for this difference lies in the two households’ differentcapacities to respond. For example, a household might be forced to sell off assets (therebycompromising future food security), or they might undertake a risky income-generating activity thatcould have undesirable future consequences (e.g., migrating to a distant region to work, orundertaking transactional sex to obtain money for food, thereby increase their risk of contractinghiV). Thus, they might at first appear resilient, but in fact, their future food security is endangered.
Figure 3. Food security and resilience over time
* FCS = Food Consumption Score
FCS
ShoCk Time
hh-r
hh-Q

a Common analytical model for resilience measurement - FSiN Technical Series No. 2
20
hoddinott (2006) provides an example of these processes at work in the context of the 1994–95drought in southern africa. in his survey of resettlement localities in three parts of rural Zimbabwe,households’ principal assets were land, livestock and human capital. These assets were used togenerate income from agricultural activities. in non-drought years, agricultural activities (mainlymaize production, cash crops such as tobacco and cotton, and income from livestock) accounted forjust under 80 percent of total household income. in 1994–95, rainfall fell by 20 to 40 percent(depending on location), more than halving agricultural incomes. household responses to this shockdiffered markedly by level of asset ownership. Both econometric evidence (owens, hoddinott andkinsey 2003) and conversations with farmers indicated that at least two oxen were needed forploughing and that the absence of these severely restricted households’ ability to generate income.households with more than two oxen were three times more likely to sell at least one ox thanhouseholds with one or two oxen – showing that the threat of losing a key productive assetsignificantly influenced household behaviour. however, women in households that did not sell oxenlost more body mass, and pre-school children in households with low oxen holdings experienced areduction in growth rate that proved to be permanent.
Figure 4. Food security and resilience with multiple shocks
* FCS = Food Consumption Score
FCS
ShoCk # 1 ShoCk # 2 Time
hh-Y
hh-Z

a Common analytical model for resilience measurement - FSiN Technical Series No. 2
21
The study illustrated several other issues: the difficult decisions households face following a significantincome shock; the way these decisions are affected by the threat of a drought that may create a povertytrap and a general decline in well-being; and the value of examining causal assumptions more closelyto understand how household responses to shocks are shaped by intra-household allocation rules.9 also,it is often assumed that in the aftermath of a shock, the households who suffer the most are the onesselling assets. Yet in this case, it was quite the opposite: those suffering the irreversible consequences ofthe 1994–95 drought were the children in households who did not sell assets.
For the purpose of collecting resilience measurement data, a number of lessons can be drawn fromthis discussion:
• High-frequency measurement data – To be sensitive to resilience dynamics, measurement datashould be collected with a frequency that allows one to map the trajectory of well-being overtime. Collecting data more frequently will reveal path dependencies (i.e., how well-being is anobserved trajectory that changes over time) with special reference to shock exposure.
• Operational definition of resilience and resilience pathways – although resilience is measuredas the ability to achieve and maintain a level of well-being above an acceptable threshold, aconsistent upward trajectory may indicate a ‘resilience pathway’ even in cases where acceptablelevels of food security, poverty, etc. have not been reached.
• Integration of intervention planning and trajectories – insights gained from data on how well-beingfluctuates over time in the face of shocks could help identify optimal points of entry for an intervention.
Component 4 also raises questions about whether resilience capacity should be measured against athreshold (i.e., a minimum acceptable state of food security or well-being) and/or according to atrajectory (Barrett and Constas 2014). These decisions are important for calibrating measures and formaking claims about the effectiveness of a given intervention.
Component 5. Resilience Measurement Data Collection Methods
• Practical measurement question: what types of data collection tools and perspectives are neededto obtain accurate data on resilience?
in line with the recommendations provided in paper No. 1, the following elements would strengthenmeasurement data collected for resilience:
• Analysis of contextual factors – The focus on contextual factors requires one to consider howlocal conditions, situations and the features of settings affect the capacity to deal with shocks andstressors and/or directly affect the outcome of interest.
9. Very loosely, these can be described as: ‘who does what’, ‘who gets what’ and ‘who decides who does what and gets what’.See haddad, hoddinott and alderman (1997) for a lengthier treatment.

a Common analytical model for resilience measurement - FSiN Technical Series No. 2
22
• A systems perspective – The tasks of conceptualizing, measuring and modelling resilience canbe informed by a systems perspective. it is important to construct measures that are sensitive tothe highly interconnected sets of relationships that affect development outcomes in the face ofshocks and stressors.
• Use of multiple data collection methods – resilience measurement requires quantitative andqualitative data collection methods. The strongest measurement designs will identify ways tointegrate both methods to deepen descriptions and strengthen inferences.
These three features of resilience measurement are described in more detail in the sections thatfollow.
Analysis of contextual factors – Contextual factors can mediate and moderate the effects ofinterventions and programmes that aim to affect development outcomes. in general, context refersto the set of geographical, social, cultural, political and historical factors that influence howinterventions are implemented and how effects are analysed. This could be anything from nationalpolitical corruption, land elevation or agro-ecological zone to household traits not considered inresilience programming (e.g., certain demographic variables or attributes). Contextual variables aresometimes referred to as background variables that describe the properties of the settings andcharacteristics of populations that can affect observed outcomes. There is no rule to decide whatshould be counted as a contextual factor. This is because background variables are defined accordingto the aims of the intervention and the way in which one or more outcome variables are affected bycontext. For measurement, context should be described in practical terms as part of an intervention’stheory of change and in technical terms as part of a data collection protocol.
one of the challenges of discussing context is coherence. how might the various aspects of contextbe expressed in a way that conveys the interdependencies among sources of contextual influence?a systems perspective, as a tool for organizing multiple influences, provides a good response to thisquestion.
A systems perspective – it has been argued that development outcomes, such as food security andeconomic well-being, are the result of a complex series of relationships that can be understoodthrough a systems perspective. ecologists have long asserted the need to approach questions aboutresilience in this way (see holling 1973). Concepts that are central to resilience in development havebeen defined and subjected to empirical testing by ecologists (see gunderson, allen and holling2010).
many different scientific articles have highlighted the benefits of adopting the concept of resilienceas a framework for analysing empirical problems (Carpenter et al. 2001; Berkes et al. 2003;gunderson and Folke 2005; walker et al. 2006). Certainly many would agree that one of the mostuseful characteristics of resilience is its ability to help frame problems within a systemic approach andto think ‘holistically’ – something that is particularly relevant in the context of development, forseveral reasons.

a Common analytical model for resilience measurement - FSiN Technical Series No. 2
23
First, a systems approach is useful because many of the shocks that affect households and/or societiesare becoming increasingly covariate, affecting groups of households or even entire communities(world Bank 2000; heltberg 2007). wherever the vulnerability of individuals is intensified by theirsocial and economic dependence on others who appear, themselves, to be affected by the samedisasters and shocks, the holistic (systemic) nature of resilience and its emphasis on theinterdependency of distinct system components is particularly helpful. good examples of covariateshocks are climate-related shocks, natural disasters or economic crises (e.g., Carter et al. 2007).
The resilience approach is therefore useful because it gives a systems view of social-ecologicalinteractions, which appears necessary to understand the links between human systems, ecosystems,and shocks and trends. The multi-scalar view of resilience can also help identify the relationshipbetween (and ideally, the complementarities of) different types of interactions, as well as the thresholdsof different types of systems. it is important to consider thresholds or tipping points that when crossedmay lead to systems-state change. For example, many innovations and conflict studies show howthresholds in human behavioural change are crossed when critical mass is achieved. it therefore helpsto identify some general characteristics that make a system resilient in a context of uncertainty andexposure to multiple types of risk. as such, a systems portrayal of risk may shed light on the multiplesources of vulnerability that can affect households or society at different scales (wisner et al. 2004.
Second, adopting a systems approach helps explain why many of the processes and dynamics thataffect people and/or their environments occur across scales, from local to global (adger et al. 2005)and are often characterised by feedbacks (Folke 2006). in practical terms, if resilience is understoodas a concept related to systems, those who are in a position to affect change (e.g., policy makers,program developers) should be better able to evaluate the likelihood and desirability of shifts ortransitions among different system configurations. Carpenter et al. (2006) speak of the importanceof cross-scale effects in their reflections about research needs in relation to Socio-economic Status(SeS) and the millennium ecosystem assessment. They cite the example of the loss of bufferingcoastal ecosystems that has eventually exposed extensive stretches of coastline to catastrophicdamage, such as the 2004 asian tsunami or recurrent hurricanes in the gulf of mexico.
in the context of rural livelihoods, resilience and its emphasis on systems and holistic thinking alsohas some resonance in relation to natural resources and the environment. poor people arerecognized as depending more heavily on natural resources (reddy and Chakravarty 1999; Beck andNesmith 2001; Béné et al. 2009). Thus, the resilience of a community is inextricably linked to thecondition of the environment and the status of its resources. emphasizing this social-ecologicaldependence helps define (or redefine) the vulnerable groups (thereby improving interventiontargeting). it may also help to design better ‘green’ public works programmes for environmentalrehabilitation or natural resource conservation (such as reforestation and soil conservation measures,e.g., kuriakose et al. 2012).
The application of systems approaches to resilience measurement has a number of importantimplications. embracing a systems approach implies that measurement must occur on multiple scales(temporal, spatial, jurisdictional, institutional) and using multi-method approaches.

a Common analytical model for resilience measurement - FSiN Technical Series No. 2
24
as noted in paper No. 1, a systems perspective in analysing resilience and its determinants leads toconsideration of systems thinking and multiple scales or levels of scales in resilience measurement.For each of the four components – ex-ante, disturbance components, ex-post and contextualcomponents – the important drivers of resilience at the level of interest may occur at different levels(or scales) of the system. Note that ‘scale’ and ‘level’ of measurement are terms that are useddifferently by various disciplines.10 in this analysis, they are used interchangeably.
For example, the (ex-ante or ex-post) measurement of well-being is often conducted at individual orhousehold level, whereas resilience capacities may include factors measured at different levels of thesystem. These levels may depend on whether the factors are related to vulnerability or resilience: soilquality (vulnerability) could be measured at ecological level, while the capacity for collective action(resilience) might operate at community level. in other cases, resilience measurement is directed tosubnational or national level, meaning that interventions and measurements are captured andmonitored at regional, district, ecological, community or household level.
Similarly, the disturbance component can be measured at household level, though this measuretypically reflects the household respondent’s subjective experience of exposure. This may differ fromthe actual hazard exposure, which is best measured by environmental data (e.g., land condition,rainfall). of course, hazards also have different geographic boundaries and different scales(depending upon their coverage). however, sensitivity to exposure should be measured at householdlevel, as this is the primary unit of analysis. Chronic stressors are often political, environmental andcultural, which are frequently regional but can be at higher or lower levels of the system. Forexample, cultural values that encourage behaviours that erode the natural resource base or hinderthe empowerment of women can have a negative impact on resilience.
The important point here is to analyse the levels at which the most critical factors influence aparticular measurement component. in some cases, these factors could be pre-identified throughsecondary analysis of data, for example, time series analysis or the re-analysis of large-scalehousehold surveys such as the living Standards measurement Surveys. alternatively or in parallel,formal qualitative techniques can be used to identify the key factors operating on a given system.importantly, this multi-scale measurement requirement also has consequences for the frequency ofsurvey/monitoring. empirical sciences – particularly terrestrial and marine ecology – have shownthat there is a form of linear relationship between spatial and temporal scales: lower-level dynamicsand processes usually operate at higher frequencies than larger-scale phenomena (Steele 1989;levin 1992). For instance, changes in oceanic circulation systems usually occur over longer timescales (generally decades), than the evolution of individual organisms (seasons or years) (haury etal. 1978). in our case, dynamics important at individual level (e.g., changes in well-being, foodsecurity or asset levels) may need to be recorded relatively frequently (e.g., monthly), especially tocapture their change in relation to a particular shock. But changes occurring at higher level (e.g.,changes in community attitudes towards collective action or changes in natural resource
10. different domains of interest to resilience measurement may have differing spatial boundaries or boundary mismatch. Thismay occur, for example, when administrative and agro-ecosystem boundaries are not aligned, which is usually the case.

a Common analytical model for resilience measurement - FSiN Technical Series No. 2
25
degradation) may have to be monitored less frequently (e.g., annually or bi-annually). Theseconsiderations have important consequences for recommended approaches to resiliencemeasurement.
Use of multiple methods – multiple methods are needed to measure variables that determine orcapture resilience capacity. This is because of the dynamic, contextualized and multi-level nature ofresilience and its determinants. There are two basic classes of technique: qualitative and quantitative. Qualitative methods include focus groups, key informant interviews, participatory impact evaluationand techniques for eliciting rankings from local populations. Qualitative information takes the formof words or narrative that cannot be expressed meaningfully in numeric format. This type ofinformation does not often lend itself for inclusion as modules in questionnaires. however, it can beused well in a variety of ways in resilience measurement. it can be used to develop locally relevantresilience measurement indicators for quantitative assessment. it can also help identify key localdrivers of resilience among populations. Qualitative methods are often employed to measure certainvariables and behaviours such as conflict dynamics, local resilience mechanisms and aspects of socialcapital. They are also used to generate indicators that are later incorporated into quantitativemethods (see below) or that better focus measurement strategies on the most importantdeterminants or manifestations of resilience.
Social relations are key to determining resilience, particularly for households, but also forcommunities, whether they face idiosyncratic or covariate risk. Social relations are extremely difficultto capture solely with quantitative information, and the impact of social relations on resilience andlivelihoods or poverty outcomes is extremely difficult to predict in the absence of good qualitativeinformation. Qualitative and subjective information is critical to answering questions about whysome households or communities are resilient and others not (as opposed to whether they areresilient). This information can help explain behaviour and decision-making processes by revealingmotivational or cultural value systems and beliefs (maxwell 2013).
Quantitative methods are usually associated with population or spatial probability sampling, wherethe goal is to generate estimates of populations or the characteristics of environmental or socio-environmental systems, including measuring change over time. Quantitative work seeks to drawinferences about household or community resilience and to judge spatial and geographiccounterfactuals scientifically.
it is important to distinguish qualitative and quantitative methods from objective and subjectivemeasures. Subjective and objective measures can be used in either quantitative or qualitativemethods.11 Subjective measures are any form of respondent rating or assessment, but in resiliencework they are typically associated with coping behaviours, risk exposure and social capital. objectiveassessment methods are those that do not rely on respondent judgements. These includeenvironmental data sourced from satellites, some types of anthropometric assessments, observableassets and surveillance data on mortality.
11. See maxwell (2013) for a more extended discussion on the use of subjective and qualitative data.

a Common analytical model for resilience measurement - FSiN Technical Series No. 2
26
Qualitative and quantitative assessment methods are often used together to measure resilience andits determinants. This combination may improve resilience measurement by identifying the mostimportant factors to measure and validating measures through the convergence of evidence.Sometimes these methods are used iteratively or sequentially to develop an assessment frameworkfor resilience measurement. in this case, depending upon the availability of secondary data, thesecondary analysis of quantitative data (surveys, administrative records) may be used to identify keydrivers and manifestations of resilience and vulnerability. when secondary data are not available, orimmediately after reviewing available data, formal qualitative methods may be the first applicationof measurement used to identify potential indicators in the framework. Quantitative measures canthen be developed and tested, and qualitative methods can be used to interpret the quantitativefindings. This approach is one of the most commonly used in the field to date.
an alternative approach utilizes qualitative methods to capture attributes related to resilience, oftencommunity factors collected from key informant interviews or focus groups. These community traitscan then be summarized quantitatively across communities, or they can be represented as indicatorvariables and integrated with household data to develop a multi-level data set.
These methods also can be used to calibrate measurement across time. For example, between ex-ante and ex-post measures, a combination of qualitative and quantitative methods can be used toidentify the aspects of stressors and shocks that are most closely related to vulnerability andresilience, as well as to identify anticipated capacity, vulnerability and well-being outcomes. The validity of difficult-to-measure variables around social capital, for example, can be improvedusing convergence-of-evidence approaches where qualitative methods applied at community levelare corroborated with subjective information from household surveys.
objective and subjective measures can be used in complementary ways to better understandperceived risk as a function of risk exposure, a potentially important driver of resilience andvulnerability. For example, covariate risk exposure from natural hazards may be best measuredquantitatively from objective environmental data, while ‘sensitivity to hazards’ exposure might bestbe measured through subjective data such as perceived risk and coping behaviours, to differentiatebetween risk exposure and perceived risk.
The use of different techniques also depends on data availability and the specific objectives of theresilience measurement exercise. Quantitative data include retrospective time series data, householdsurveys and systematically collected data that can be enumerated at higher levels in the system(communities, districts). Qualitative methods can be used to produce data that can be quantified,albeit with great care. it is vital to ensure that the strengths and weakness of quantitative andqualitative data are described and understood.

a Common analytical model for resilience measurement - FSiN Technical Series No. 2
27
Component 6. Resilience Measurement Estimation Procedures12
• Practical measurement question: how might data be analysed to draw inferences about the effectthat resilience capacities have on development outcomes in the face of shocks and stressors?
This component of the common analytical model seeks to frame resilience measurement in the formof a typical regression model. as noted earlier, there are many models of resilience in circulation. Themain benefit of an analytical model is that it provides an explicit approach to translate ideas intoempirical content or data. The aim of an estimation model is to show how variables might be relatedto each other. Thus, a key part of an analytical model is the formalized, symbolic expression ofrelationships to be tested. in general, these expressions specify a causal relationship in which a givenvariable or set of variables (predicted or dependent variables) is seen as the functional outcome ofanother set of variables (predictor or explanatory variables). expressions of this kind are variously referredto as functional forms, specifications, estimation models, formulae, prediction models, or simply models.
in paper No. 1, and in the introduction to this paper, a simplified version of a resilience estimationmodel was presented. This initial simplified version is now elaborated upon in three ways. First, theoriginal model, referred to here as the simplified model, is modified to demonstrate the time-sensitive quality of resilience and to highlight the need for both objective and subjective measures.reflecting elements of the common analytical model, this creates a more complex estimation model:the Time-Sensitive Model with Subjective Measures. in this initial discussion of estimation models, theoriginal model and the time-sensitive resilience model are presented without using econometricconventions. Then, the set of assumptions used to construct an estimation model for resilience arepresented. Finally, a more fully developed model with more precisely defined variables and aneconometric formulation is presented. This final presentation of the estimation, presented as afunctional form, is offered as an illustration and as a way to highlight the value of specifying modelsthat can be empirically tested.
Modification of the simplified model. A simplified = model shows the function of resiliencecapacity as a variable that might exert its influence in relation to other variables that affect the well-being of a household, community or other unit affected by shocks and stressors. The function wasexpressed in the following simple form:
Simplified estimation model:
Food security = f (vulnerability, resilience capacity, shocks)
in addition to demonstrating the instrumental value of resilience capacity, the simplified resiliencemodel was introduced to indicate that resilience should be defined both in ordinary language andas a formula.
12. although the aim of this section is to provide a reasonably general presentation, the description of estimation proceduresfor resilience measurement is the most technical aspect of the common analytical model. readers who are less interestedin estimation procedures may elect to proceed directly to section four, Conclusions.

a Common analytical model for resilience measurement - FSiN Technical Series No. 2
28
To reflect the temporal sensitivity principle presented in paper No. 1, and as preparation for a moreelaborate econometric presentation, a time dimension may be added to the simplified resiliencemodel. a time dimension can be included using a subscript t (t=1, 2, 3,..n) indicating that multiplemeasurements are taken over time. The first measurement is taken at t=1, the second measurementis taken at t=2 until the last measurement when t=n. The modified version of the simplified resiliencemodel, which includes a time dimension with both subjective and objective measures of shocks, is asfollows:
Time-sensitive model with subjective measures:
Food securityt = f (vulnerabilityt, resilience capacityt, shockto, s)
The subscript t for food security means food security at time t, such as baseline data collected priorto an intervention. The change in food security may be measured as the difference between foodsecurity at t and food security at t+1.13 The first predictor variable, vulnerability, shows howvulnerability changes over time (t=1, 2, 3,…n), with observed decreases in vulnerability possiblyattributed to resilience. The second predictor variable, resilience capacity, is a composite of variablesthat are hypothesized as ensuring that a unit (e.g., household or community) does not suffer adverseconsequences in the face of shocks and stressors. it represents the set of resources that enable theunit to prepare for and/or respond to the effects of a shock. The time-sensitive component isincluded here to reflect how the dimensions that constitute resilience capacity may change overtime. long-term well-being may, for example, be compromised to meet short-term needs. The thirdpredictor, shock, represents one or more events or conditions that threaten the well-being of largenumbers of people (covariate shocks) or smaller, more isolated numbers of people (idiosyncraticshocks). The o, S for the shock term superscript indicates that both objective (data on occurrence)and subjective (data on perceptions of shocks and stressors) measures should be included. The timesubscript for shocks suggests that both the objective and subjective features of the shocks changeover time.
Framing resilience capacity within a formal estimation model. Considering that “resilience is thecapacity that ensures adverse stressors and shocks do not have long-lasting adverse developmentconsequences” (paper No. 1: p. 13), two observations set the stage for introducing an illustrativeestimation model. First, the specific resilience capacities used in an estimation model can be indexedto food security, poverty or any other well-being concept that represents a development outcomeof interest. Second, resilience, unlike related concepts (e.g., vulnerability), emphasizes the long-lasting effects on the outcome variable as it captures a household’s capacity to absorb, adapt andtransform in response to shocks.
13. in the case of an impact evaluation with an intervention, the estimation procedure might use a difference-in-differencesmethod where the change in food security would involve a further comparison of changes in food security observedbetween an intervention condition and a control condition.

a Common analytical model for resilience measurement - FSiN Technical Series No. 2
29
By examining how an outcome changes over time in the face of shocks, the dependent variable inthe estimation model measures the resilience of a household and of larger units that may affect thehousehold. Note that resilience is not only a genuinely dynamic concept, involving the process ofpreparing for and responding to shocks, it is also defined with reference to the “long-lasting”consequences of a given shock.
The estimation model, and the analytical model from which it is derived, must be able to capture allpossible pathways to well-being in the face of shocks. These pathways may be very different, evenacross households living in the same context. as a result, the estimation model must be able toexpress the causal relationship linking risks and outcomes (the risk chain) and account forheterogeneity.
The estimation model for resilience analysis should be general enough to be applied in differentcontexts and flexible enough to be context-specific. Consistent with the principles of resiliencemeasurement noted in paper No. 1, the resilience model should be indexed to a specific well-beingoutcome. This means that the dependent variable should be an indicator of well-being status, suchas food security. The specific indicator to be used depends on the objectives and scale of the analysis.households would seem to be the most suitable entry point for the analysis of resilience to foodinsecurity.14 if this is the case, a suitable welfare status indicator is household food consumption atdifferent points in time, or changes in food consumption between two points in time. however, thereis no reason to restrict the analysis to household food consumption: any household welfare indicatorcould be used (e.g., nutritional or health status) (cf. hoddinott and kinsey 2001).
adopting a household perspective does not mean disregarding the importance of the relationshipsbetween households and the broader system they belong to (e.g., the community or district). rather,this means acknowledging that systems comprise hierarchies, and that each level involves a differenttemporal and spatial scale. Therefore, if the analysis level is different, say food security at communityor higher hierarchical level (e.g., district, province, state, region), the dependent variable indicatorsmay change (e.g., the proportion of food-insecure population, the food security gap, or the averagedaily energy consumption in the population).15
This also means acknowledging that the broader system helps determine household food securityperformance, including resilience to food insecurity (this is the ‘setting’ in the risk chain).operationally, this means that the characteristics of the broader system that the household belongsto should be explicitly accounted for in the analytical framework and in the model.
14. The household is the unit within which the most important decisions to manage both ex-ante and ex-post risk are taken.This includes how risk-related decisions affecting food security, are made: e.g., what income-generating activities to engagein, how to allocate food and non-food consumption among household members, what strategies to implement to manageand cope with risks.
15. as will be clear from the discussion below, the estimation model needs to be modified to account for these changes in thedependent variable. For instance, a higher level of analysis and bigger covariate, as opposed to idiosyncratic, shocks wouldrequire modification of the model. usually, this also translates into a longer timeframe for the analysis. however, the longerthe period of analysis the higher the likelihood of compounding effects from multiple shocks, which can complicate thetask of identifying causal mechanisms.

a Common analytical model for resilience measurement - FSiN Technical Series No. 2
30
The timeframe for the analysis also depends on the analytical objectives: specifically, it depends onthe level of the analysis and on the livelihood strategies adopted by a given household (which in turndefine the risk landscape it lives in and the options available to manage risks). indeed, the choice oftimeframe is embedded in the definition of resilience, which focuses on the “long-lasting” adverseconsequences of shocks. generally speaking, the longer the time period covered by the analysis, thebetter for assessing these consequences (e.g., the ability of the household to recover [or achieve] awelfare status above the established normative threshold).16
The issue of how short the minimum timeframe should be for a meaningful analysis depends on thehousehold livelihood strategy. The strategies used by pastoralists or farmers are completely differentfrom those of rickshaw drivers or urban wage earners in terms of the speed of income generationand asset building, as well as in their temporal patterns (e.g., seasonal or not seasonal). operationally,this means that i) the model should explicitly control for heterogeneity in livelihood strategies andtheir risk profiles, and ii) the timeframe should be long enough to give the household a chance torecover (e.g., three to five complete production cycles). more often than not, this means consideringan analytical timeframe that spans many years.
The closest reference for a quantitative analysis of resilience that builds on economic work isvulnerability analysis. according to hoddinott and Quisumbing (2010), there are three mainapproaches to assessing vulnerability: vulnerability as expected poverty (Vep), vulnerability as lowexpected utility (Veu) that minimizes future well-being, and vulnerability as uninsured exposure torisk (Ver). all these approaches are econometric models that estimate a welfare measure – usuallyhousehold consumption and variants of it.
measures of Vep and Veu estimate vulnerability as the likelihood that realized consumption will fallbelow a normative threshold. These approaches measure household vulnerability over all individualhouseholds, yielding a measure of aggregate vulnerability. Ver does not estimate probabilities; instead,it assesses whether observed shocks generate welfare losses. Ver measures are ex-post assessments ofhow far a negative shock causes a household to deviate from its expected level of welfare.
recalling the definition of resilience introduced in paper No. 1, the Ver provides a suitable basicanalytical framework to assess resilience, especially when using available data sources such as theliving Standards measurement Survey data and related household data sets. The basic estimationprocedure is defined below, along with suggested enhancements based upon the availability ofricher data sets, which are coming online for the purpose of measuring resilience.
The description of the functional form of an estimation model for resilience presented in the nextsection is written for audiences interested in the statistical and econometric aspects of resiliencemeasurement. The readers who are more interested in the conceptual treatment of resiliencemeasurement may skip to the concluding section of the paper, section four.
16. however, the longer the period of analysis the higher the likelihood of compounding effects from multiple shocks, whichcan complicate the task of identifying causal mechanisms.

a Common analytical model for resilience measurement - FSiN Technical Series No. 2
31
Estimation model for food security using resilience capacity. a basic model is defined below,where h denotes the h-th household living in village v at time t. as the dependent variable, foodconsumption17 (Δln FChtv) might be defined as the difference between log food consumptionbetween t and t+1, i.e., the rate of growth of food consumption, or other well-being outcome, overthe period under consideration. Then the impact of the shocks occurring between t and t+1 on foodconsumption of the h-th household can be estimated according to the following relationship:
Functional form estimating food security using resilience capacity:
Δln FChvt = ∑iαiCS(i)vt + ∑iβiiS(i)hvt + ∑vtδvtrChvt + γXhvt + θZhv + Δεhvt
where CSvt is a vector of covariant shocks occurring between t and t+1. The term iS(i)htv representsa vector of idiosyncratic shocks over the same period (including both objective and subjectiveelements as noted above); rChtv is a vector of categorical and continuous variables18 that indicatethe resilience capacities employed by a given household at time t; Xhvt and Zhv are, respectively,time-varying and time-invariant household characteristics (or characteristics from possibly higher-level aggregates); and Δεhvt is a stochastic error term.
The estimated values for α and β identify the magnitude of the impacts of covariate and idiosyncraticshocks, respectively. The impacts of both covariate and idiosyncratic shocks are countered by theeffects of private resilience capacities (i.e., from within households) and public responses (i.e., fromsocial programmes, resources and policies).19 By quantifying the impact of these shocks, thisapproach identifies which risks would be an appropriate focus of policy and estimates the effect ofresilience capacities. moreover, considering the well-known asymmetric impact of positive andnegative shocks, it may be useful to disaggregate the shock variables into positive and negativeshock components (dercon and krishnan 2003).
The econometric estimation of the model above can be best performed if panel data are available. hereit is important to recall that resilience measurement requires a comparison between ex-ante and ex-poststates with resilience capacities as a mediator. using cross-sectional data would suggest two keyassumptions: first, that cross-sectional variance can be used to estimate the inter-temporal variance; andsecond, that there is no correlation between observed shocks and unobservable household characteristics.alternatively, if repeated cross-sections drawn from the same sampling frame are available, cluster panelscan be created, though this will only capture the inter-temporal variation of a representative household percluster. This may not be appropriate if household characteristics vary widely across clusters. panel dataanalysis allows the analysis of changes at individual level. if estimates are derived through fixed effectregression, one can control for unobservable time-invariant characteristics of households andcommunities. The types of panel data sets needed for this work are not routinely feasible for applied field
17. For the purposes of illustration, food consumption is used as an outcome representing food security. any developmentoutcome or other indicator of food security may be inserted as the outcome of interest.
18. This variable can also be disaggregated into the absorptive, adaptive and transformative capacities that represent the multi-dimensional nature of resilience capacity.
19. The impacts of these private and public responses may be quantified if the variable rC is appropriately disaggregated.

a Common analytical model for resilience measurement - FSiN Technical Series No. 2
32
assessment and monitoring. This argues for the judicious use of secondary data sources to identify keyresilience drivers, which should be monitored over time in project environments.
practitioners and policymakers want to know which segments of the population are less resilient thanothers, so they can improve targeting. The population strata showing a larger impact can be identifiedby modifying the equation and introducing an interaction term between the shock variable and avector of dummy variables indicating household characteristics (harrower and hoddinott 2005;Skoufias and Quisumbing 2005). in this specification, the sign and size of the coefficient of theinteraction term identifies the extent to which there is higher or lower covariation between the shockand consumption changes in the group of households with this specific characteristic relative to thereference group of households without this characteristic. along similar lines, the Student’s t-valueassociated with this coefficient allows one to test whether this difference is significant.
generally speaking, a non-resilient household is one that shows poor risk management in the faceof negative shocks (dercon and krishnan 2003). This feature can be used as a strategy to assess whatmakes a household non-resilient. Shocks are included as determinants of food consumption changein the equation. it is then straightforward to identify sources of resilience/non-resilience by lookingat the magnitude and statistical significance of risk variables’ estimates. in order to designappropriate social protection instruments, one needs to examine the existing capacities thathouseholds use to cope with idiosyncratic and covariate shocks. This can be done by regressing riskmanagement mechanisms (capacities) on shocks and household characteristics (Skoufias andQuisumbing 2005). By allowing shocks to interact with fixed household characteristics, one can alsodetermine whether different types of households are more or less likely to use a given set ofcapacities to manage risk. Furthermore, cross-tabulating the responses to shocks (private and/orpublic) to welfare impacts (significant/non-significant) provides information on the efficacy of theserisk management capacities. This can be used by policymakers to identify intervention priorities(hoddinott and Quisumbing 2010). The information can be further disaggregated by householdcharacteristics as a way of determining how effectively public responses are targeted.
Estimation models, inference and qualitative methods. although the task of specifying an estimationmodel requires a range of inputs, there is a tendency to view such modelling as an exercise inquantitative analysis. To provide a more complete picture, it is useful to think about the inferentialobjective that is served by specifying and testing estimation models. estimation models of resilience areimportant because, with an associated quantitative expression, they clarify the relationship between aset of variables that are meant to predict an outcome in the face of shocks and stressors, and outcomeof interests such as food security. an estimation model can help identify the strength of theserelationships, and it helps describe the degree to which such relationships converge or diverge in a givenpopulation. however, estimation models do not provide highly detailed descriptions of local contexts.Quite often, they explain a relatively small – albeit statistically significant – portion of the variation in thevariables they are meant to predict. while estimation models provide a technically defensible way ofestimating the effects of intervention, they do not offer special insights into how people perceive andexperience an intervention as a part of their everyday lives. There are some questions for whichestimation models are well designed, and others for which qualitative methods are more appropriate.as a general rule for designing resilience measurements, inferences will be strongest and descriptionsmost complete when both qualitative and quantitative methods are employed.

a Common analytical model for resilience measurement - FSiN Technical Series No. 2
33
IV. Conclusion
resilience is a new concept for development and one that continues to be applied as a potentialsolution to a broad range of problems. The introduction of a new orienting concept offers theopportunity to reinvigorate and more effectively focus work within a given field. a new concept, suchas resilience, can provide a different lens through which to explore policies, formulate interventions,and plan studies. however, the opportunity to make progress on a new concept is often hamperedby the tendency to represent and/or measure the concept based on a logic that is largely unspecifiedor opaque. The articulation of a common analytical model can facilitate progress by promotingtransparency of the logic upon which measurement depends. The opportunity to achieve progressthat is scientifically defensible is enhanced by the presentation of a common analytical model, evenif the model itself is not widely accepted. uniform acceptance of ideas is not a hallmark of science.on the contrary, science depends on open debate and active dissent (see popper 1962). in theinterest of advancing a scientific approach to resilience measurement, a common analytical model isintroduced. Two benefits of a common analytical model for resilience measurement are thatstrategies for developing measures will be transparent and openly debated, and that argumentsaround resilience measurement may be brought into sharper focus.
Comprised of six components, the common analytical model introduces a set of issues upon whichresilience measurement may be based. The resilience Causal Framework illustrates a basic causalpathway that identifies the points at which data should be collected to predict the food security (orother well-being outcome) of households, and possibly other units (e.g., communities), in the face ofshocks and stressors. The model defines resilience capacity as a multi-dimensional, multi-levelmediator of shocks and stressors. it draws attention to the need to collect data on initial states,shocks, subsequent (post-shock) states and contextual influences. The model also suggests how toconstruct resilience capacity measures, proposing ten categories of indicators. The discussion ofmethods covers the importance of multiple methods (quantitative and qualitative), as well asobjective and subjective indicators. Finally, from an analytical perspective, the paper describesestimation models that might be used to assess the impact of resilience.
in closing, the common analytical model is useful because it provides a shared point of reference todevelop and apply measurements across varied contexts. To that end, this paper proposes a commonanalytical model for resilience measurement that is both broadly applicable and technically sound.The model is broadly applicable because it is general enough to be adapted across a variety ofsettings and interventions. it is technically sound because it provides an identifiable causalframework for resilience and recommends perspectives and procedures to guide measurement. Thenext stage of work on resilience measurement involves generating an array of data sets that can beused to describe how resilience capacity is distributed across different settings and populations andto test hypotheses about the effects of related interventions. a systematic review of data on resiliencewill lead to improved measurement. The analysis of data, obtained from multiple studies of peoplewho live in shock-prone contexts, will also allow an assessment of how much value resilience capacityadds to the effectiveness of development and humanitarian strategies.

a Common analytical model for resilience measurement - FSiN Technical Series No. 2
34
V. References
ACCRA. 2012. The ACCRA Local Adaptive Capacity Framework. An ACCRA Brief. available at:http://community.eldis.org/.59d669a7/aCCra%20local_adaptive%20policy_new.pdf
Adger, W., Amell, N. & Tompkins, E. 2005. Successful Adaptation and Climate Change Across Scales.global environmental Change. 15(2), 77–86.
Adger, W. 2006. Vulnerability. global environmental Change. 16(3), 268–281.
Aldrich, D.P. 2012. Building Resilience: Social Capital in Post-Disaster Recovery. Chicago: university ofChicago press.
Alinovi, L., D’Errico, M., Mane, E. & Romano, D. 2010. Livelihoods Strategies and HouseholdResilience to Food Insecurity: an Empirical Analysis to Kenya. paper prepared for the Conferenceon “promoting resilience through Social protection in Sub-Saharan africa”, organized by theeuropean report of development in dakar, Senegal, 28–30 June 2010.
Alinovi, L., Mane, E. & Romano, D. 2009. Measuring Household Resilience to Food Insecurity:Application to Palestinian Households. working paper. eC–Fao Food Security programme.
Barrett, C. & Constas, M. 2014. Toward a Theory of Resilience for International DevelopmentApplications. proceedings of the National academy of Sciences. published ahead of print, 22September 2014. Vol. 111 No. 40, 14625-14630.
Beck, T. & Nesmith, C. 2001. Building on Poor People's Capacities: The Case of Common PropertyResources in India and West Africa. world development 29(1): 119–133.
Béné, C. 2013. Towards a Quantifiable Measure of Resilience. idS working paper 434, Brighton:institute of development Studies, p. 27.
Béné, C., Wood, R.G., Newsham, A. & Davies, M. 2012. Resilience: New Utopia or New Tyranny?Reflection about the Potentials and Limits of the Concept of Resilience in Relation to VulnerabilityReduction Programmes. idS working paper. Vol. 2012 No. 405. Centre for Social protectionworking paper No. 006. institute of development Studies (idS) and Centre for Social protection(CSp). September 2012.
Béné, C., Steel, E., Kambala Luadia, B. & Gordon, A. 2009. Fish as the “Bank in the Water” -Evidence from Chronic-Poor Communities in Congo. Food policy 34, 104–118.
Berkes, F., Colding, J. & Folke, C. 2003. Navigating Social-Ecological Systems: Building Resilience forComplexity and Change. Cambridge: Cambridge university press.

a Common analytical model for resilience measurement - FSiN Technical Series No. 2
35
Brooks N., Aure, E. & Whiteside, M. 2014. Assessing the Impact of ICF Programmes onHousehold and Community Resilience to Climate Variability and Climate Change. draftreport. london: dFid. available at:https://www.gov.uk/government/uploads/system/uploads/attachment_data/file/279639/draft-measuring-resilience-report.pdf
Carpenter S., Walker, B., Anderies, J.M. & Abel, N. 2001. From Metaphor to Measurement:Resilience of What to What? ecosystems 4(8): 765–781.
Carpenter, S., DeFries, R., Dietz, T., Mooney, H., Polasky, S., Reid, W. & Scholtes, R. 2006.Millennium Ecosystem Assessment: Research Needs. Science 314(5797): 257–258.
Carter, M., Little, P., Mogues, T. & Negatu, W. 2007. Poverty Traps and Natural Disasters in Ethiopiaand Honduras. world development 35(5): 835–856.
Ciani, F. & Romano, D. 2013. Testing for household resilience to food insecurity: Evidence fromNicaragua. department of economics and management. university of Florence. Job marketpaper available at: http://ageconsearch.umn.edu/bitstream/172958/2/Testing%20for%20household%20resilience%20to%20Food_Federico%20Ciani%20and%20donato%20romano.pdf
Constas, M., Frankenberger, T. & Hoddinott, J. 2014. Resilience Measurement Principles: Towardan Agenda for Measurement Design. resilience measurement Technical working group.Technical Series No. 1. rome: Food Security information Network. available at:http://www.fsincop.net/fileadmin/user_upload/fsin/docs/resources/FSiN_29jan_weB_medium%20res.pdf
Constas, M. & Barrett, C. 2013. Principles of Resilience Measurement for Food Insecurity: Metrics,Mechanisms and Implementation Plans. paper presented at the expert Consultation onresilience measurement related to Food Security, 19–21 February 2013. rome: Fao and wFp.
Crocker, L. & Algina, J. 1986. Introduction to Classical and Modern Test Theory. New York: harcourt,Brace, Jovanovich.
Cronbach, L. & Meehl, P. 1955. Construct Validity in Psychological Tests. psychological Bulletin, 52:281–302.
Department for International Development (DFID). 2011. Defining Disaster Resilience: A DFIDApproach Paper. london: dFid.
Dercon, S. & Krishnan, P. 2003. Food Aid and Informal Insurance. wider discussion paper,16095774; No. 2003/09. doi: 10.1093/0199276838.003.0015

a Common analytical model for resilience measurement - FSiN Technical Series No. 2
36
FAO. 2014. Household Resilience in Dolow, Somalia. Baseline Analysis for Impact Evaluation of FAO-UNICEF-WFP Resilience Strategy. February 2014. rome: Fao, uNiCeF, wFp.
Folke, C. 2006. Resilience: The Emergence of a Perspective for Social-Ecological Systems Analyses.global environmental Change. 16(3): 253-267.
Folke, C., Colding, J. & Berkes, F. 2002. Building Resilience for Adaptive Capacity in Social-EcologicalSystems. in Berkes F., Colding, J. & Folke, C. (eds.). Navigating Social-Ecological Systems: BuildingResilience for Complexity and Change. Cambridge, uk: Cambridge university press.
Frankenberger, T. & Nelson, S. 2013. Background Paper for the Expert Consultation on ResilienceMeasurement for Food Security. paper presented at the expert Consultation on resiliencemeasurement related to Food Security, 19–21 February 2013. rome: Fao and wFp.
Frankenberger, T., Mueller, M., Spangler, T. & Alexander, S. 2014. Community Resilience:Conceptual framework and Measurement Feed the Future Learning Agenda. october 2013.rockville, md: westat.
Frankenberger, T., Spangler, T., Nelson, S. & Langworthy, M. 2012. Enhancing Resilience to FoodSecurity Shocks in Africa. discussion paper. November 2012. uSaid, dFid, world Bank. available at:http://www.fsnnetwork.org/sites/default/files/discussion_paper_usaid_dfid_wb_nov._8_2012.pdf
Gunderson, L., Allen, C. R. and Holling, C. S. 2010. Foundations of ecological resilience. island press,New York, New York, uSa.
Gunderson, L. & Folke, C. 2005. “resilience - Now more Than ever”. Ecology and Society 10(2).
Haddad, L., Hoddinott, J. & Alderman, H. (eds.). 1997. Intrahousehold Resource Allocation inDeveloping Countries: Models, Methods and Policy. Baltimore: Johns hopkins university press.
Harrower, S. & Hoddinott, J. 2005. Consumption Smoothing in the Zone Lacustre, Mali. Journal ofafrican economies 14(4): 489–519. doi: http://jae.oxfordjournals.org/content/14/4/489
Haury, L.R., McGowan, J.C., and Wiebe, P.H. 1978. Pattern and Processes in the Time-Space Scalesof Plankton Distributions. in Steele, h. (ed.) Spatial Pattern in Plankton Communities. New York:plenum, pp. 277–327.
Heltberg, R. 2007. Helping South Asia Cope Better with Natural Disasters: The Role of SocialProtection. development policy review 25(6): 681–698.
Hoddinott, J. 2014. Understanding Resilience for Food and Nutrition Security. paper prepared for theiFpri 2020 conference “Building resilience for Food and Nutrition Security,” 15–17 may inaddis ababa.

a Common analytical model for resilience measurement - FSiN Technical Series No. 2
37
Hoddinott, J. 2006. Shocks and their Consequences Across and Within Households in RuralZimbabwe, Journal of development Studies, vol. 42, pp. 301–321.
Hoddinott, J. & Kinsey, B. 2001. Child Growth in the Time of Drought. oxford Bulletin of economicsand Statistics, vol. 63, pp. 409–436.
Hoddinott, J. & Quisumbing, A. 2010. methods for microeconometric risk and Vulnerabilityassessment. in Fuentes-Nieva, r. & Seck, p. (eds.). Risk, Vulnerability and Human Development:On the brink. london: palgrave macmillan – united Nations development programme.
Holling, C.S. 1973. Resilience and stability of ecological systems. annual review of ecology andSystematics 4: 1-23.
Hughes, K. 2012. Oxfam’s Attempt to Measure Resilience. powerpoint presentation at the americanevaluation association (aea) meeting, october 2012. available at:http://www.disasterriskreduction.net/fileadmin/user_upload/drought/docs/oxfam_presentation_resilience_aea_10_2012.pdf
Kuriakose, A., Heltberg, R., Wiseman, W., Costella, C., Ciprik R. & Cornelius, S. 2012. ClimateResponsive Social Protection: Background Paper for the World Bank's New Social ProtectionStrategy, washington dC: world Bank Social development and Social protection.
Levin, S. A. 1992. The problem of pattern and Scale in ecology. Ecology 73(6):1943–1967.
Maxwell, D. 2013. On the Use of Subjective and Qualitative Data in Resilience Measurement for FoodSecurity. paper prepared for the resilience measurement Technical working group. rome:Food Security information Network.
Maxwell, D., Vaitla, B., Tesfay, G. & Abadi, N. 2013. Resilience, Food Security Dynamics and PovertyTraps in Northern Ethiopia. Analysis of a Biannual Panel Data Set, 2011–2013. Somerville, mass.:Feinstein international Center.
McCreight, R. 2010. Resilience as a Goal and Standard in Emergency Management. Journal ofhomeland Security and emergency management 7(1), 1–7.
Messick, S. 1988. The Once and Future Issues of Validity: Assessing the Meaning of Consequences ofMeasurement. in wainer, h. (ed). Test Validity. hillsdale, NJ: lawrence erlbaum associates.
Miller, F., Osbahr, H., Boyd, E., Thomalia, F., Bharwani, S., Ziervogel, G., Walker, B., Birkmann, J.,Vander Leeuw, S., Rockstrom, J., Hinkel, J., Downing, T., Folke, C. & Nelson, D. 2010.Resilience and Vulnerability: Complementary or Conflicting Concepts. ecology and Society 15(3). available at: http://www.ecologyandsociety.org/vol15/iss3/art11/

a Common analytical model for resilience measurement - FSiN Technical Series No. 2
38
Mitchell, A. 2013. Risk and Resilience: From Good Idea to Good Practice. a scoping study for theexperts group on risk and resilience. organisation for economic Co-operation anddevelopment. december 2013. available at: http://www.oecd.org/dac/governance-development/FiNal%20wp%2013%20resilience%20and%20risk.pdf
Nunally, J. & Bernstein, I. 1994. Psychometric Theory (3rd edition). New York: mcgraw hill.
Oxfam. 2011. Consultation Document: The ACCRA Local Adaptive Capacity Framework (LAC).accessed at: http://policy-practice.oxfam.org.uk/our-work/climate-change-drr/accra
Owens, T., Hoddinott, J. & Kinsey, B. 2003. The Impact of Agricultural Extension on Farm Productionin Resettlement Areas of Zimbabwe. economic development and Cultural Change, vol. 51, pp.337–358.
Preacher, K.J., Zhang, G., Kim, C. & Mels, G. 2013. Choosing the Optimal Number of Factors inExploratory Factor Analysis: A Model Selection Perspective. multivariant Behaviour research, vol.48, pp. 28–56.
Popper, K. 1962. The Open Society and Its Enemies (4th edition). New York: harper & row.
Reddy, S.C. & Chakravarty, S. P. 1999. Forest Dependence and Income Distribution in a SubsistenceEconomy: Evidence from India. world development 27(7): 1141–1149.
Rival, L. 2009. The Resilience of Indigenous Intelligence. in hastrup, k. (ed.). The question of resilience:Social responses to climate change. Viborg, denmark: det kongelige danske VidenskabernesSelskab, pp. 293–313.
Skoufias, E. & Quisumbing, A. R. 2005. Consumption Insurance and Vulnerability to Poverty: ASynthesis of the Evidence from Bangladesh, Ethiopia, Mali, Mexico and Russia. european Journalof development research 17(1): 24–58.
Smith, L., Frankenberger, T., Langworthy, B., Martin, S., Spangler, T., Nelson, S. & Downen, J.2014. Ethiopia Pastoralist Areas Resilience Improvement and Market Expansion (PRIME) ProjectImpact Evaluation. Baseline Survey report. 5 may 2014.
Steele, J.H. 1989. Discussion: Scale and Coupling in Ecological Systems. in roughgarden, J., may, r.m.and levin, S. a. (eds.) Perspective in Theoretical Ecology. princeton, uSa: princeton universitypress, pp. 177–180.
Vaitla, B., Tesfay, G., Rounseville, M. and Maxwell, D. 2012. Resilience and Livelihoods Change inTigray, Ethiopia. Feinstein international Center, Tufts university. october 2012.

a Common analytical model for resilience measurement - FSiN Technical Series No. 2
39
Walker, B. H., Anderies, J.M., Kinzig, A.P. & Ryan, P. 2006. Exploring Resilience in Social-EcologicalSystems through Comparative Studies and Theory Development: Introduction to the SpecialIssue. ecology & Society 11(1): 12.
Wilson, G. A. 2012. Community Resilience and Environmental Transitions. london: earthscan fromroutledge press.
Winderl, T. 2014. Disaster Resilience Measurements: Stocktaking of Ongoing Efforts in DevelopingSystems for Measuring Resilience. draft report. 3 January 2014. uNdp/BCpr.
Wisner B., Blaikie, P., Cannon, T. & Davis, I. 2004. At Risk: Natural Hazards, People’s Vulnerabilityand Disasters (2nd edition). New York, NY: routledge, p. 471.
World Bank. 2000. World Development Report 2000/2001. attacking poverty. New York: publishedfor the world Bank by oxford university press.

a Common analytical model for resilience measurement - FSiN Technical Series No. 2
40
VI. Annex: Review of Selected Models for Measuring Resilience
as interest in resilience grows among agencies, donors and other stakeholders, so too does the needfor agreement on a conceptual framework that provides a comprehensive picture of the specificelements that contribute to resilience.
a resilience conceptual framework should help users understand how shocks and stressors affectlivelihood outcomes and household well-being. it should also help identify the key leverage pointsto be used in developing a theory of change, which in turn informs programming designed toenhance resilience (Frankenberger et al. 2014). ultimately, a conceptual framework for resilienceassessment can highlight the types of indicators that might be used to determine whetherhouseholds, communities and higher-level systems (e.g., national, regional, global) are on atrajectory toward greater vulnerability or greater resilience (dFid 2011; Frankenberger et al. 2012).
FAO Conceptual Framework
resilience thinking has evolved considerably over the last seven years. Since 2008, Fao has beendeveloping a framework for measuring resilience (alinovi et al. 2009).
Fao’s methodology to measure resilience to food insecurity identifies and weights the differentdimensions of household resilience through an econometric structural equation model. The resultsof this analysis inform programme investment, targeting, design and impact evaluation. Themethodology was first applied in the west Bank and gaza Strip to measure household resilience tofood insecurity. it was later applied in other countries as a:
• Diagnostic tool (ethiopia, kenya and the Sudan) to empirically measure household resilience tofood insecurity according to their different livelihood strategies; and as an
• Impact evaluation indicator (Somalia, South Sudan and the Sudan) to improve the design offuture interventions and related accountability mechanisms.
in Fao's analytical framework, resilience explains why one household returns to a desired level offood security while a similar household does not. Fao’s model, therefore, explains the interactionbetween shocks and their effects on households, with resilience accounting for the difference inoutcomes between two similar households exposed to the same shock. For Fao, the outcomeexamined is food security.
according to the model, the outcome for a given household is a function of (i) the probability ofbeing affected by a natural crisis due to the geographical location of the household; (ii) theprobability of suffering from a shock due to a particular set of household characteristics thatdetermine a household’s livelihood; and (iii) the resilience of the household.

a Common analytical model for resilience measurement - FSiN Technical Series No. 2
41
in the most recent update used in Somalia (Fao 2014), the model considers resilience as a latentvariable made up of multiple components (Figure 5). each component is a latent variable because itcannot be observed directly. The components are agricultural assets, non-agricultural assets,agricultural practice and technology, income and food access, access to basic services, social safetynets, adaptability and sensitivity.
initially, Fao’s model used factor analysis to calculate the latent variables (e.g., in kenya, and in thewest Bank and gaza Strip). Variables were selected that could be used as a proxy for each dimensionof resilience.
recent exercises have used exploratory factor analysis (i.e., the measurement model is a structuralequation model). Factor analysis assumes that the residual errors (unique factors) are uncorrelatedwith each other and are uncorrelated with the common (latent) variable. For food security analyses,the latter assumption cannot be accepted, because the probability of intra-dimensional correlationis high. Thus, structural equation modelling has been adopted, which includes correlation betweenresidual errors. although this method requires a greater number of computations than previousexercises, it allows for model calibration until a satisfactory level of goodness-of-fit is achieved.
The study conducted by the university of Florence expands on the original approach developed byalinovi et al. (2009) by applying it to a specific shock event. it measures the food security resilienceof rural households affected by hurricane mitch in Nicaragua in 1999, and it produces a singleagricultural resilience index, which is itself a composite index made up of 11 latent variablesestimated through factor analysis (Ciani and romano 2013). Though based on the Fao model, it adds
Figure 5. FAO Resilience Conceptual Framework used in Somalia
Source: Fao 2014
T0
adaptivity
Sens
itivi
ty
Social Safety Nets
assets
access to Basic Services
income and Food access
T1
endogenousShocks
hou
seho
ld r
espo
nse
mec
hani
sms
prog
ram
me
polic
y Su
ppor
t
exogenousShocks
adaptivitySe
nsiti
vity
Social Safety Nets
assets
access to Basic Services
income and Food access

a Common analytical model for resilience measurement - FSiN Technical Series No. 2
42
certain household characteristics, as well as social, economic and physical connectivity, whichsuggest whether households are able to tap into alternative options for taking advantage ofopportunities and accessing the resources needed to deal effectively with shocks, i.e., to adapt(Frankenberger and Nelson 2013).
DFID/TANGO Resilience Conceptual Framework
The disaster resilience framework promoted by dFid (2011) involves four elements that describeresilience: context, disturbance, the capacity to deal with disturbance and reaction to disturbance. Thisapproach considers whose resilience (e.g., individuals, households, communities, national governments),resilience to what (the shock or stress to which the system is exposed), the degree of exposure (large-scale versus differential exposure), sensitivity (ability to cope in the short-term), the ability to adapt –both in anticipation of and in response to – changing conditions over the long term, and how the systemresponds to the disturbance (e.g., survive, cope, recover, learn, transform) (Brooks et al. 2014).
while dFid’s framework approaches resilience primarily from a disaster risk reduction (drr)perspective, other approaches include climate change adaptation (aCCra 2012; oxfam 2011) andimproved livelihoods (alinovi et al. 2010). one of the challenges of a drr-centric approach is theshort funding cycle (often less than two years), which limits the ability of resilience programming topromote and improve adaptive capacity or address the longer-term enabling conditions necessaryto remove the structural causes of vulnerability. a longer-term systems approach was needed thatcombined emergency aid with development programming; an approach that was multi-sectoral andthat promoted synergistic partnerships/alliances between Ngos and other actors.
The resilience framework presented by Frankenberger et al. (2012) – and updated here –integrateslivelihoods, drr and climate change adaptation approaches into a single framework for assessingresilience (Figure 6) (Frankenberger et al. 2014). This integrated systems approach emphasizes theimportance of absorptive, adaptive and transformative capacities that include access to productiveassets, household livelihood strategies, and institutional structures and processes, as well aspreparedness, prevention, response and recovery activities formulated to achieve well-beingoutcomes in response to shocks and climate-related stresses.
The important variables of interest are composite measures based on several other measures. in manyof these cases, principal Components analysis (pCa) or polychoric factor analysis is used to constructan index. These techniques reduce a set of ‘input’ variables that are hypothesized to be related to oneanother by detecting the structure of the relationships among the input variables from their correlationmatrix. pCa can be used when all of the input variables are continuous. polychoric factor analysis20 isthe pCa analogue that is used when some variables are binary or ordinal. For both, the variables arecombined using weights that represent their correlations with the single variable produced.
20. kolenikov, S. & angeles, g. (2004), The use of discrete data in PCA: Theory, simulations, and applications to socioeconomicindices, working paper wp-04-85, meaSure/evaluation project, Carolina population Center, university of North Carolina,Chapel hill.

a Common analytical model for resilience measurement - FSiN Technical Series No. 2
43
indexes are constructed using this technique only if the signs of the weights for the input variablesare as expected (positive or negative), given the conceptual understanding of the relationshipsbetween the input variables and the indicator being measured.
Note that for all indexes constructed, the first principal component (or equivalent, for polychoricfactor analysis) is used to construct the index. This component, which accounts for as much of thevariability in the data as possible, always turns out to be the one for which the input variables enterwith the appropriate sign – a positive indication of the conceptual validity of the indicators. multivariate regression analysis is used to investigate the structural relationships that arehypothesized to exist between the key variables of the analysis (well-being outcomes, shockexposure and resilience capacities) for the population being studied. This approach has been appliedin Niger, Somalia and, more recently, ethiopia.
Figure 6. DFID/TANGO Resilience Conceptual Framework
Contexte.g., social,ecosystems,political,religious, etc.
Context
Level of aggregation
Exposure
Livelihood Assets
Livelihood Strategies
Structure/Processes
Sensitivity
Disturbancee.g., naturalhazard,conflict, foodshortage, fuelprice increase
Reaction todisturbancee.g., survive,cope, recover,learn,transform
Livelihoodoutcomes
Resilience pathway
Vulnerable pathway
Absorptive,adaptive andtransformative capacities
Adaptivestate toshock
Stresses
Bouncebackbetter
Bounceback
(-)
(+)
Recoverbutworsethanbefore
Collapse
Food Security
Adequatenutrition
Environmentalsecurity
FoodInsecurity
Malnutrition
Environmentaldegradation
Shocks

a Common analytical model for resilience measurement - FSiN Technical Series No. 2
44
Tufts Livelihoods Change Over Time (LCOT) Model
The Feinstein international Center at Tufts university, in collaboration with world Vision and theCollege of dryland agriculture and Natural resources at mekelle university in Tigray, is measuringresilience in Northern ethiopia by assessing “livelihoods change over time” (lCoT) (maxwell et al.2013; Vaitla et al. 2012). The lCoT conceptual model adopted here captures static livelihoodoutcomes (e.g., food security, health status, education level), which are typically measured in a fairlylinear manner, as well as more complex outcomes based on dynamic interactions between livelihoodstrategies, policies and programmes, and institutions, which can enhance or limit householdresponses. Based on a livelihoods cycle framework, the lCoT assessment involves first understandingthe shocks inherent in the system (i.e., what types of shocks or hazards are occurring within thetargeted population), and subsequently how a given shock affects different stages of the livelihoodscycle (i.e., how assets are affected by a particular shock, how production and other decisions areimpacted by a shock, and how policies/institutions mitigate the risk of a shock). Such information isthen used to identify who is most vulnerable to what types of shocks. rather than collect the largeamount of data required to directly measure various parts of the livelihoods cycle, a model is usedto estimate relationships between initial asset levels, variables at different stages of the livelihoodscycle, and outcome measures of household resilience (maxwell et al. 2013; Vaitla et al. 2012). Figure7 illustrates the livelihoods cycle framework:
Figure 7. Detailed "livelihoods cycle" framework adapted for Tigray, Ethiopia
Source: maxwell et al. 2013
Livelihood OutcomesConsumption (food, health,water, education, etc.)investments (livestock, etc.)SavingsCoping - trade-offs
Decisions &Strategies
Assets &Income
PIPs / Vulnerabilityharmful traditional practicersindebtedness / inability to payFamily size and obligations
PIPs / Vulnerabilityaccess to natural resources
perceptions of hazardsaccess to credit
input prices
PIPs / Vulnerabilityremittances
output pricespSNp transfers
actual rainfall/hazards
ConsumptionSavingsinvestmentCoping
AssetsNaturalphisicalhumanFinancialSocial
“Income”Cash
in-kind
agriculture (fertilizer, seeds)destockingBorrowinglabor allocation
Consumption/InvestmentDecisions and Behaviors
Production/ExchangeDecisions and Behaviors

a Common analytical model for resilience measurement - FSiN Technical Series No. 2
45
To measure resilience, the study utilizes a number of indices, scores and individual variables to lookat changes in seven indicators of livelihoods outcomes and household well-being across years (i.e.,from hunger season to hunger season): household Food insecurity and access Scale (hFiaS), CopingStrategies index (CSi), Food Consumption Score (FCS), illness Score, Value of productive assets, Netdebt, and income (per capita daily expenditure). The hFiaS, CSi and FCS are used to assess foodsecurity. an illness score measures human capital. additional scores (or indices) include access tocommunity resources (i.e., access to community-owned land, pasture/grazing land, water sources,forest resources); support network score (i.e., ability to access non-family networks in case of ashock); social participation score (i.e., household participation in formal and informal groups); andcrop diversity index (i.e., cropping system patterns). asset variables include both those more likely tochange in the short term (e.g., value of land, livestock, productive assets) as well as those more likelyto change over the long term (e.g., literacy, participation in social organizations).
OXFAM and ACCRA: From characteristic-based approaches to capacity-focused approaches
Thinking on resilience has evolved from a characteristics-based approach to a capacity-focusedapproach. promoted by oxfam gB (hughes 2012), aCCra (2012) and others, the ‘characteristicsbased approach’ attempts to identify reliable determinants of household and community resiliencethat can be assessed before shocks occur. it focuses on asset-based approaches, as well as theintangible processes and functions that support adaptive capacity.
The approach developed by oxfam gB measures resilience based on a number of dimensions thatwere hypothesized to characterize resilience using the alkire-Foster index (Brooks et. al. 2014).measurement is based on characteristics/proxies without consideration of the shock. oxfamconsiders five dimensions as key to resilience: livelihood viability, innovation potential, contingencyresources and support access, integrity of natural and built environment, and social and institutionalcapability (hughes 2012). Though oxfam views these five dimensions as critical to householdresilience, the specific characteristics determining resilience and/or adaptation in a particular contextvary widely.
The africa Climate Change resilience alliance (aCCra) is a consortium of Ngos (oxfam gB, theoverseas development institute [odi], Save the Children alliance, Care international and worldVision international), which developed the local adaptive Capacity Framework (laC) (Frankenbergerand Nelson 2013). in the laC framework, adaptive capacity is broken down into five characteristics:asset base, institutions and entitlements, knowledge and information, innovation and flexible andforward decision-making, and governance.
These characteristic-based approaches are often derived using bottom-up participatory methods(winderl 2014). defining a set of resilient characteristics has the advantage of being adapted todifferent geographical settings, cultures and environments. identifying a set of characteristics as aproxy for resilience tends to be case-specific and cannot be easily generalized (winderl 2014).

a Common analytical model for resilience measurement - FSiN Technical Series No. 2
46
The most significant weakness of an inductive characteristic-based approach to resiliencemeasurement is the problem of circular logic, whereby resilience is measured using the very samecharacteristics that are considered the key elements of resilience (winderl 2014). another significantlimitation to the characteristics-based approach is that it does not address whether thecharacteristics identified are actually relevant when different shocks occur (Frankenberger andNelson 2013). as the work of Béné et al. (2012) highlights, resilience is a process rather than a staticstate, and as such, its determinants are constantly changing as the social, economic andenvironmental landscapes within which households and communities operate also change.
although a resilience approach can bridge the gap between humanitarian aid and developmentactivities, it must also provide clear guidance on resilience programming that is different fromexisting sector-specific approaches (mitchell 2013). mitchell (2013) suggests that the added value ofa resilience approach combines core programming with risk management approaches that buildabsorptive, adaptive and transformative capacities. Thus, resilience is not the primary programmeobjective (i.e., the ‘what’), but rather defines how programming is implemented to achieve theprimary objective. This is consistent with the resilience framework presented in Figure 2, in thatsuccess of the intervention is measured not by ‘resilience’ per se but by achieving certain positivelivelihood outcomes (e.g., food security, adequate nutrition).
This underscores another shift in resilience thinking over the last few years: improved resiliencecapacity is best measured with multiple types of indicators, including those that measure the shock(s)and/or stressors that occur, rather than with single outcome indices. many existing resilience indicesdo not take into account different types of shocks and stressors. guidance from the rm-Twgsuggests resilience can be measured as a capacity (absorptive, adaptive and transformativecapacities) that enables households and communities to maintain a minimum threshold conditionwhen exposed to shocks and stressors (Constas et al. 2014).


resilience has emerged as a framework for enhancing people’s and communities’ capacities to reducetheir exposure, cope with and/or adapt to shocks. however, a common understanding of how toassess and predict resilience levels, and to evaluate the impact of resilience programmes, is lacking.in this context, the Resilience Measurement Technical Working Group (rm-Twg) was established underthe auspices of the Food Security information Network (FSiN) to identify and promote means ofoperationalizing the concept of resilience in humanitarian and development practice, primarilythrough research and technical oversight related to resilience measurement.
operationalizing resilience measurement will require that practitioners provide credible, data-basedinsights into the attributes, capacities and processes observed at various scales (e.g., individual,household, community, national) and maximize the use of available data from ongoing resilienceinitiatives.
Therefore, the rm-Twg promotes the adoption of best practice in resilience measurement throughcollaborative development of three primary outputs:
• a paper on resilience measurement principles and definition of resilience;• a common analytical framework for resilience measurement; and• technical guidelines for resilience measurement.
For more information and to join the community of practice: www.fsincop.net
phot
o cr
edits
: wFp
Technical Series No. 2Food Security Information NetworkFSIN
Resilience Measurement Technical Working Group