A colorful past, a bright future Quarterly Financial ...
29
"A colorful past, a bright future" Quarterly Financial Report First Quarter 2020
Transcript of A colorful past, a bright future Quarterly Financial ...
"A colorful past, a bright future"
Quarterly Financial Report
First Quarter 2020
First Quarter 2020 Financial Report (This report contains un-audited financial information as of February 25, 2020)
Table of Contents
Section Page
I. Executive Summary 1 II. Economic Report 2 III. Financial Results 12 IV. Outstanding Debt 24 V. Investments 24 VI. Interfund Loans 26
Attachments
A. Expenditure Summary by Fund 27 B. Revenue Summary by Fund 30 C. Outstanding Debt 33 D. Investment Portfolio Tables 35
- - - - - For additional information on the City’s financial performance please contact Natasha Ramras in the City’s Financial & Management Services Department at 360-487-8484.
I. Executive Summary
As this report was being drafted, the financial instability has been unravelling at the global level. It is highly likely the Coronavirus will have a noticeable impact on the global impact during the remainder of the year. It is also highly likely that there will be a recession during 2020. It is too early to estimate the impact on the City. The City has anticipated an economic slowdown during the 2019-2020 biennium and has taken measures to withstand the impacts of a mild recession on the City’s finances.
The national economy continued to grow through the fourth quarter of 2019, according to the advance estimate published by the Bureau of Economic Analysis. Real GDP (Gross Domestic Product) increased by 2.1% in the fourth quarter. The increase in real GDP in the last quarter of the year reflected positive contributions from personal consumption expenditures (PCE), federal government spending, residential fixed investment, state and local government spending, and exports private inventory investment. Imports, which are a subtraction in the calculation of GDP, increased. City of Vancouver General Fund revenues in 2019 totaled $172.9 million, one percent above the forecasted revenues for the year. The 2019 revenue is approximately $2.9 million higher than comparable revenues from 2018. Tax revenues overall are slightly below forecast, as the increases in the city utility and sales tax revenues were offset by lower than anticipated utility revenue on private utilities. Planning permits, miscellaneous revenue, and an accounting true up of the interfund services charges made up the bulk of the increase in revenues. General Fund expenditures at the end of 2019 totaled $165.9 million, $0.5 million lower than those in the prior year and below budget. Several large purchases, such as the land for the replacement operations center did not take place as anticipated in 2019 and were delayed until 2020. In total, a little over $4.0 million will be carried forward from 2019 budget to 2020 budget. The General Fund operating cash balance was $54.9 million at the end of March 2020. Following is detailed information on the main revenue sources of the General Fund. Cumulatively, the five major sources of revenue listed on the chart below represent more than 85% of the total revenues in the City’s General Fund.
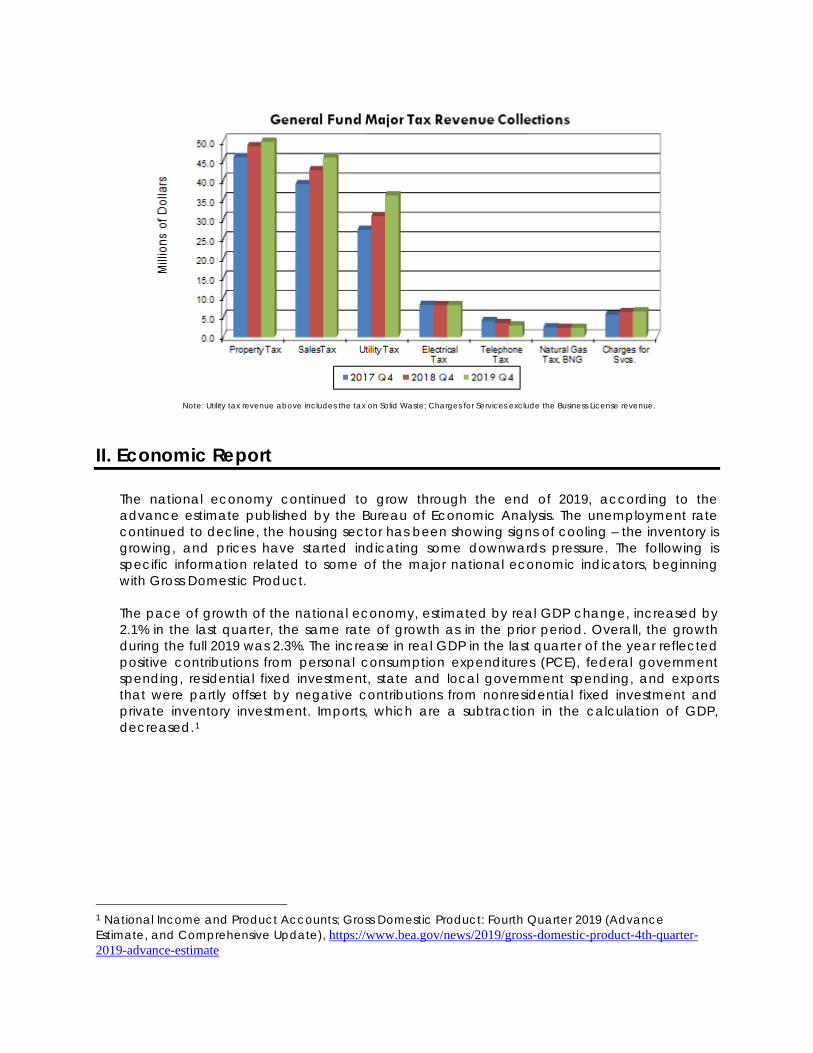
Note: Utility tax revenue above includes the tax on Solid Waste; Charges for Services exclude the Business License revenue.
II. Economic Report The national economy continued to grow through the end of 2019, according to the advance estimate published by the Bureau of Economic Analysis. The unemployment rate continued to decline, the housing sector has been showing signs of cooling – the inventory is growing, and prices have started indicating some downwards pressure. The following is specific information related to some of the major national economic indicators, beginning with Gross Domestic Product. The pace of growth of the national economy, estimated by real GDP change, increased by 2.1% in the last quarter, the same rate of growth as in the prior period. Overall, the growth during the full 2019 was 2.3%. The increase in real GDP in the last quarter of the year reflected positive contributions from personal consumption expenditures (PCE), federal government spending, residential fixed investment, state and local government spending, and exports that were partly offset by negative contributions from nonresidential fixed investment and private inventory investment. Imports, which are a subtraction in the calculation of GDP, decreased.1
1 National Income and Product Accounts; Gross Domestic Product: Fourth Quarter 2019 (Advance Estimate, and Comprehensive Update), https://www.bea.gov/news/2019/gross-domestic-product-4th-quarter-2019-advance-estimate
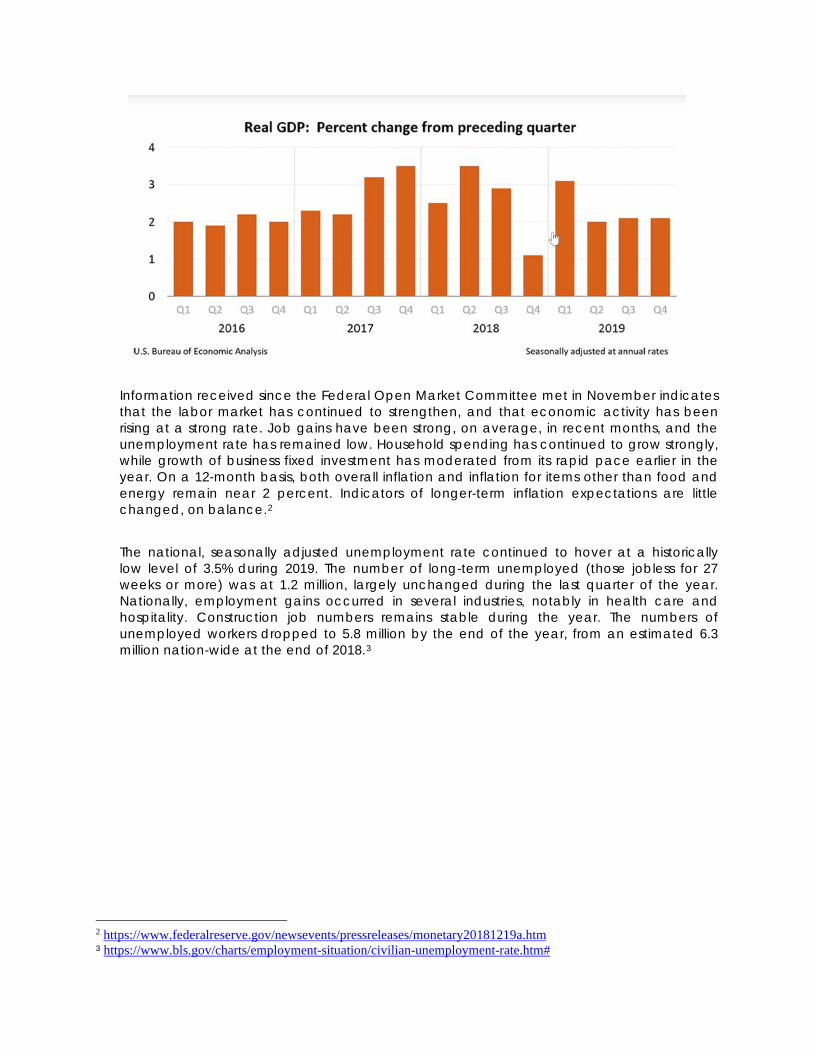
Information received since the Federal Open Market Committee met in November indicates that the labor market has continued to strengthen, and that economic activity has been rising at a strong rate. Job gains have been strong, on average, in recent months, and the unemployment rate has remained low. Household spending has continued to grow strongly, while growth of business fixed investment has moderated from its rapid pace earlier in the year. On a 12-month basis, both overall inflation and inflation for items other than food and energy remain near 2 percent. Indicators of longer-term inflation expectations are little changed, on balance.2
The national, seasonally adjusted unemployment rate continued to hover at a historically low level of 3.5% during 2019. The number of long-term unemployed (those jobless for 27 weeks or more) was at 1.2 million, largely unchanged during the last quarter of the year. Nationally, employment gains occurred in several industries, notably in health care and hospitality. Construction job numbers remains stable during the year. The numbers of unemployed workers dropped to 5.8 million by the end of the year, from an estimated 6.3 million nation-wide at the end of 2018.3
2 https://www.federalreserve.gov/newsevents/pressreleases/monetary20181219a.htm 3 https://www.bls.gov/charts/employment-situation/civilian-unemployment-rate.htm#
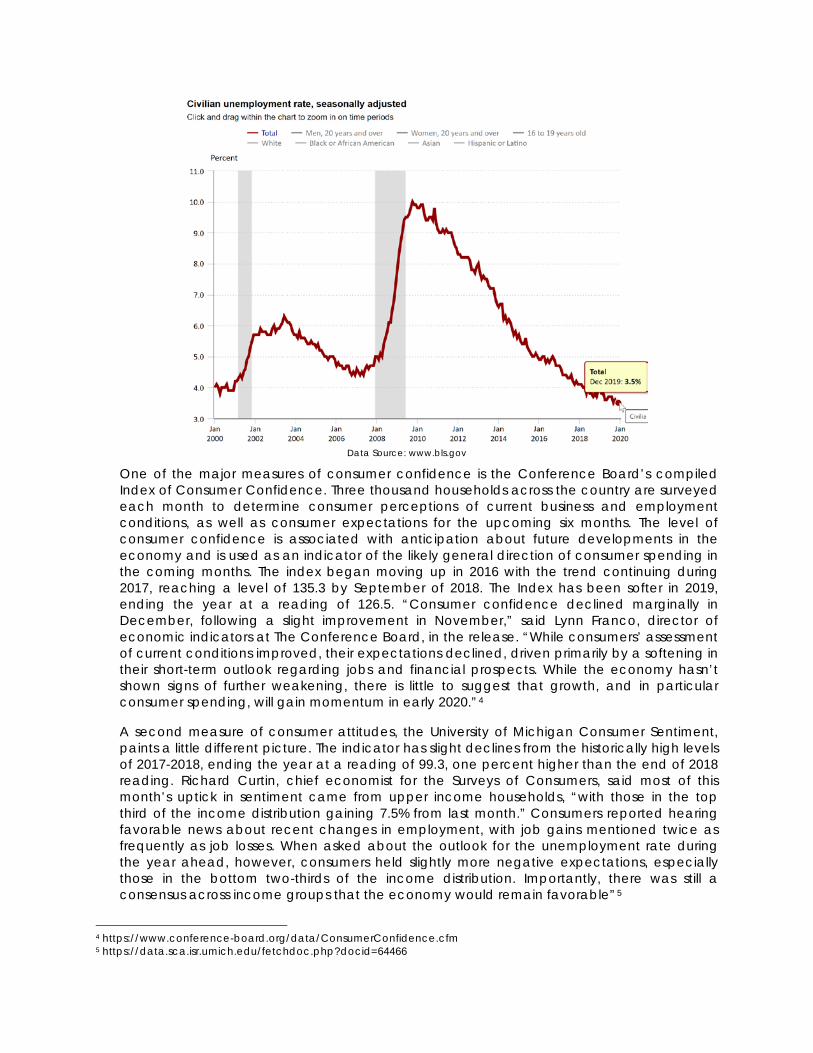
Data Source: www.bls.gov
One of the major measures of consumer confidence is the Conference Board’s compiled Index of Consumer Confidence. Three thousand households across the country are surveyed each month to determine consumer perceptions of current business and employment conditions, as well as consumer expectations for the upcoming six months. The level of consumer confidence is associated with anticipation about future developments in the economy and is used as an indicator of the likely general direction of consumer spending in the coming months. The index began moving up in 2016 with the trend continuing during 2017, reaching a level of 135.3 by September of 2018. The Index has been softer in 2019, ending the year at a reading of 126.5. “Consumer confidence declined marginally in December, following a slight improvement in November,” said Lynn Franco, director of economic indicators at The Conference Board, in the release. “While consumers’ assessment of current conditions improved, their expectations declined, driven primarily by a softening in their short-term outlook regarding jobs and financial prospects. While the economy hasn’t shown signs of further weakening, there is little to suggest that growth, and in particular consumer spending, will gain momentum in early 2020.”4
A second measure of consumer attitudes, the University of Michigan Consumer Sentiment, paints a little different picture. The indicator has slight declines from the historically high levels of 2017-2018, ending the year at a reading of 99.3, one percent higher than the end of 2018 reading. Richard Curtin, chief economist for the Surveys of Consumers, said most of this month’s uptick in sentiment came from upper income households, “with those in the top third of the income distribution gaining 7.5% from last month.” Consumers reported hearing favorable news about recent changes in employment, with job gains mentioned twice as frequently as job losses. When asked about the outlook for the unemployment rate during the year ahead, however, consumers held slightly more negative expectations, especially those in the bottom two-thirds of the income distribution. Importantly, there was still a consensus across income groups that the economy would remain favorable”5
4 https://www.conference-board.org/data/ConsumerConfidence.cfm 5 https://data.sca.isr.umich.edu/fetchdoc.php?docid=64466
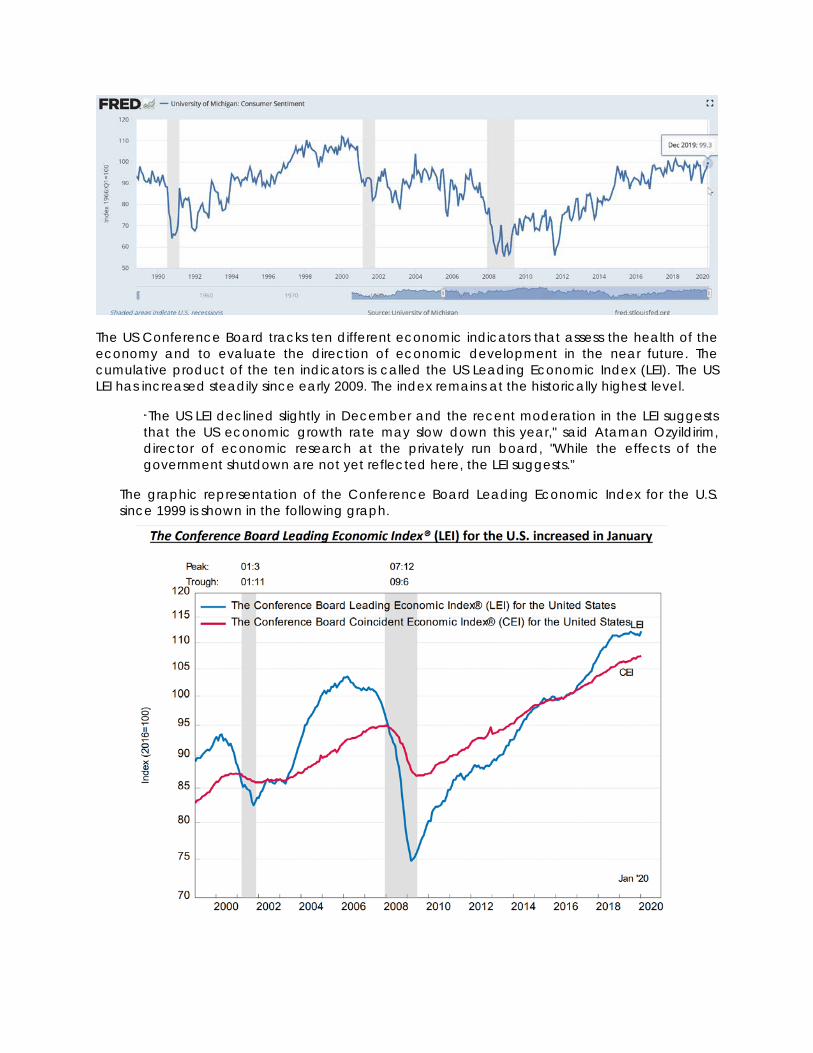
The US Conference Board tracks ten different economic indicators that assess the health of the economy and to evaluate the direction of economic development in the near future. The cumulative product of the ten indicators is called the US Leading Economic Index (LEI). The US LEI has increased steadily since early 2009. The index remains at the historically highest level.
“The US LEI declined slightly in December and the recent moderation in the LEI suggests that the US economic growth rate may slow down this year," said Ataman Ozyildirim, director of economic research at the privately run board, "While the effects of the government shutdown are not yet reflected here, the LEI suggests.”
The graphic representation of the Conference Board Leading Economic Index for the U.S. since 1999 is shown in the following graph.
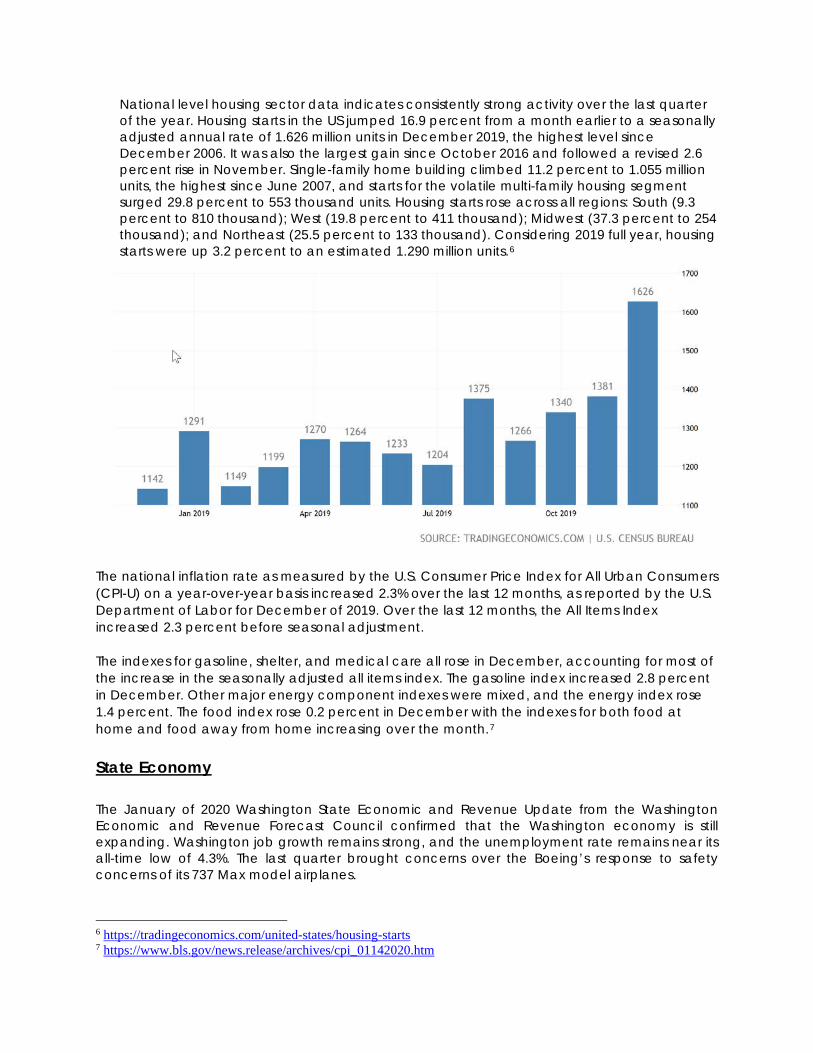
National level housing sector data indicates consistently strong activity over the last quarter of the year. Housing starts in the US jumped 16.9 percent from a month earlier to a seasonally adjusted annual rate of 1.626 million units in December 2019, the highest level since December 2006. It was also the largest gain since October 2016 and followed a revised 2.6 percent rise in November. Single-family home building climbed 11.2 percent to 1.055 million units, the highest since June 2007, and starts for the volatile multi-family housing segment surged 29.8 percent to 553 thousand units. Housing starts rose across all regions: South (9.3 percent to 810 thousand); West (19.8 percent to 411 thousand); Midwest (37.3 percent to 254 thousand); and Northeast (25.5 percent to 133 thousand). Considering 2019 full year, housing starts were up 3.2 percent to an estimated 1.290 million units.6
The national inflation rate as measured by the U.S. Consumer Price Index for All Urban Consumers (CPI-U) on a year-over-year basis increased 2.3% over the last 12 months, as reported by the U.S. Department of Labor for December of 2019. Over the last 12 months, the All Items Index increased 2.3 percent before seasonal adjustment. The indexes for gasoline, shelter, and medical care all rose in December, accounting for most of the increase in the seasonally adjusted all items index. The gasoline index increased 2.8 percent in December. Other major energy component indexes were mixed, and the energy index rose 1.4 percent. The food index rose 0.2 percent in December with the indexes for both food at home and food away from home increasing over the month.7
State Economy
The January of 2020 Washington State Economic and Revenue Update from the Washington Economic and Revenue Forecast Council confirmed that the Washington economy is still expanding. Washington job growth remains strong, and the unemployment rate remains near its all-time low of 4.3%. The last quarter brought concerns over the Boeing’s response to safety concerns of its 737 Max model airplanes.
6 https://tradingeconomics.com/united-states/housing-starts 7 https://www.bls.gov/news.release/archives/cpi_01142020.htm
Seattle home prices ended the year with a demonstrated 3.3% increase over the prior year. Washington housing construction remains strong. Washington exports declined sharply over the year for the second consecutive quarter. Year-over-year exports decreased 33.4% in the third quarter of 2019 following a 27.6% decline in the second quarter. The large declines were mostly because of transportation equipment exports (mostly Boeing planes) which fell 41.9% in the second quarter and 53.1% in the third quarter. Boeing suspended deliveries of the 737 Max in March, which clearly affected second and third quarter exports. However, third quarter exports of agricultural products also declined 8.3% over the year and exports of all other commodities declined 8.2% over the year. Seattle consumer price inflation remains above the national average. During 2019, the Seattle CPI rose 2.2% compared to the 2.3% increase in the U.S. City Average.
State of Washington General Fund revenues continue to slightly exceed forecast.8 Local Economy
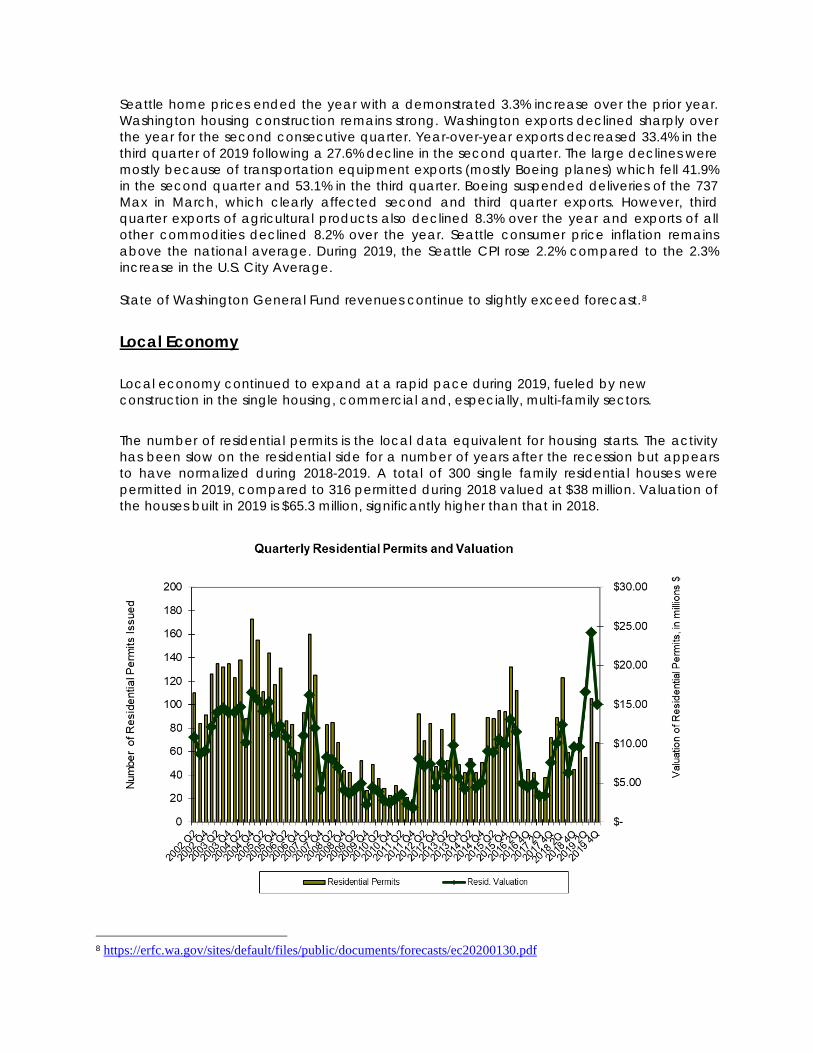
Local economy continued to expand at a rapid pace during 2019, fueled by new construction in the single housing, commercial and, especially, multi-family sectors. The number of residential permits is the local data equivalent for housing starts. The activity has been slow on the residential side for a number of years after the recession but appears to have normalized during 2018-2019. A total of 300 single family residential houses were permitted in 2019, compared to 316 permitted during 2018 valued at $38 million. Valuation of the houses built in 2019 is $65.3 million, significantly higher than that in 2018.
8 https://erfc.wa.gov/sites/default/files/public/documents/forecasts/ec20200130.pdf
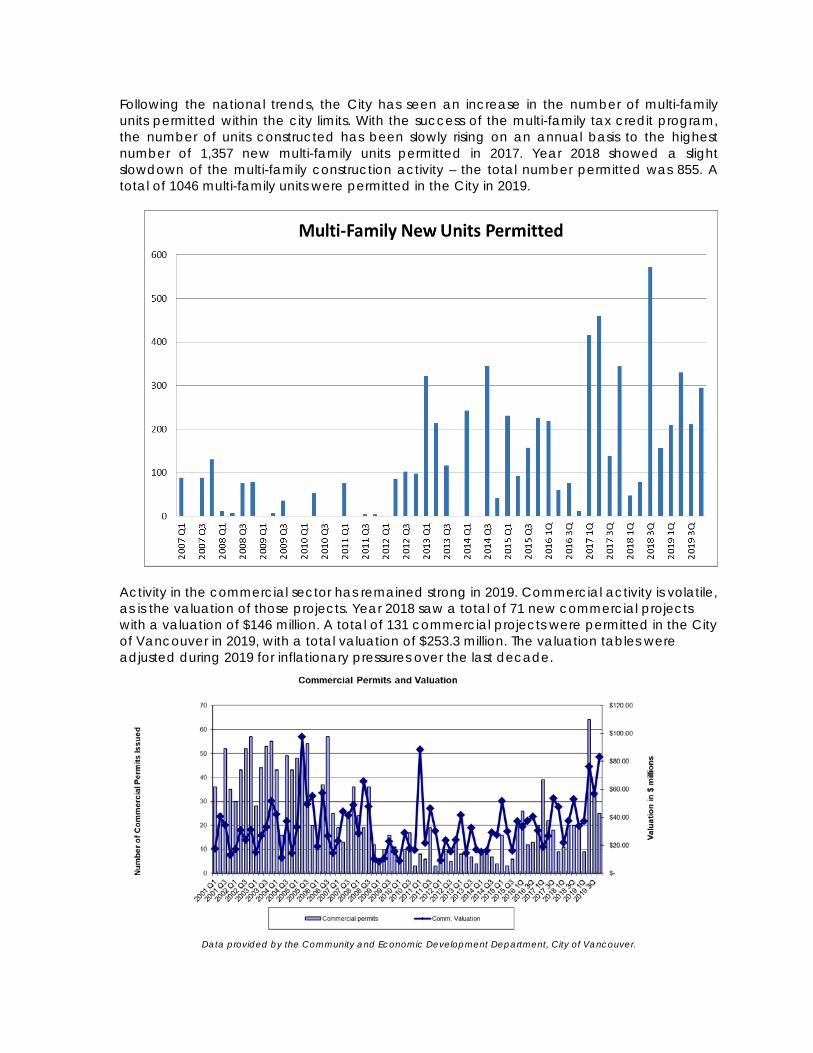
Following the national trends, the City has seen an increase in the number of multi-family units permitted within the city limits. With the success of the multi-family tax credit program, the number of units constructed has been slowly rising on an annual basis to the highest number of 1,357 new multi-family units permitted in 2017. Year 2018 showed a slight slowdown of the multi-family construction activity – the total number permitted was 855. A total of 1046 multi-family units were permitted in the City in 2019.
Activity in the commercial sector has remained strong in 2019. Commercial activity is volatile, as is the valuation of those projects. Year 2018 saw a total of 71 new commercial projects with a valuation of $146 million. A total of 131 commercial projects were permitted in the City of Vancouver in 2019, with a total valuation of $253.3 million. The valuation tables were adjusted during 2019 for inflationary pressures over the last decade.
Data provided by the Community and Economic Development Department, City of Vancouver.
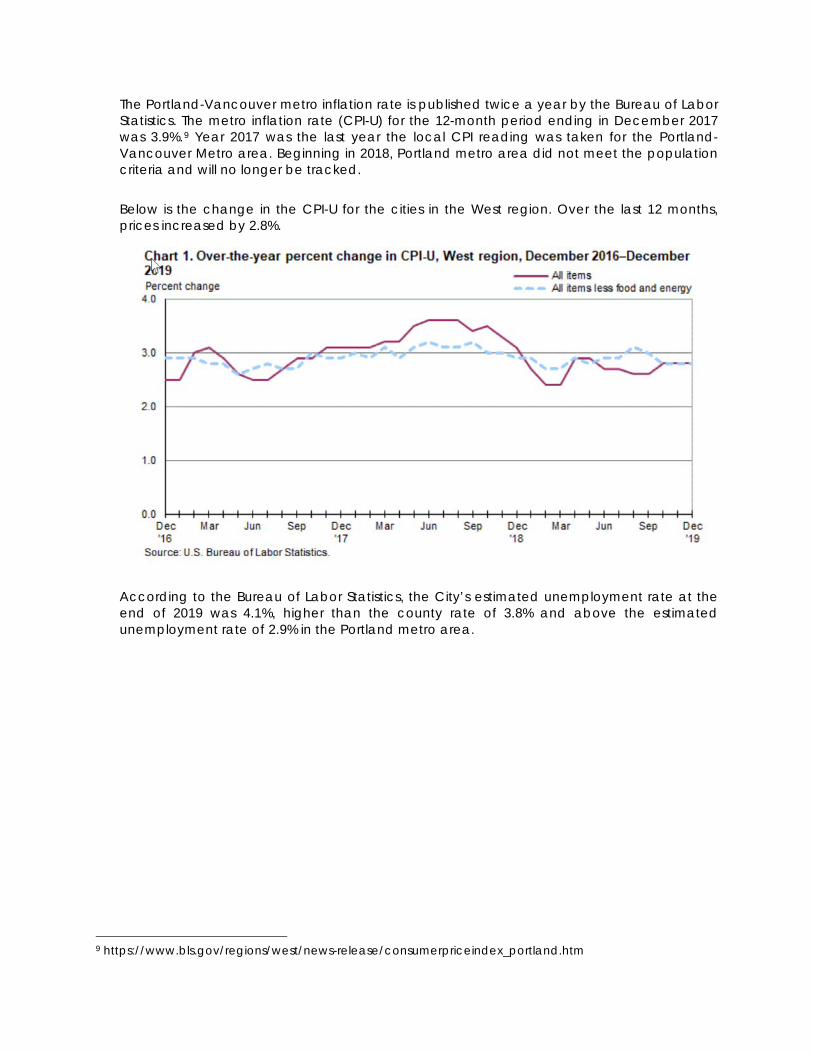
The Portland-Vancouver metro inflation rate is published twice a year by the Bureau of Labor Statistics. The metro inflation rate (CPI-U) for the 12-month period ending in December 2017 was 3.9%.9 Year 2017 was the last year the local CPI reading was taken for the Portland-Vancouver Metro area. Beginning in 2018, Portland metro area did not meet the population criteria and will no longer be tracked.
Below is the change in the CPI-U for the cities in the West region. Over the last 12 months, prices increased by 2.8%.
According to the Bureau of Labor Statistics, the City’s estimated unemployment rate at the end of 2019 was 4.1%, higher than the county rate of 3.8% and above the estimated unemployment rate of 2.9% in the Portland metro area.
9 https://www.bls.gov/regions/west/news-release/consumerpriceindex_portland.htm
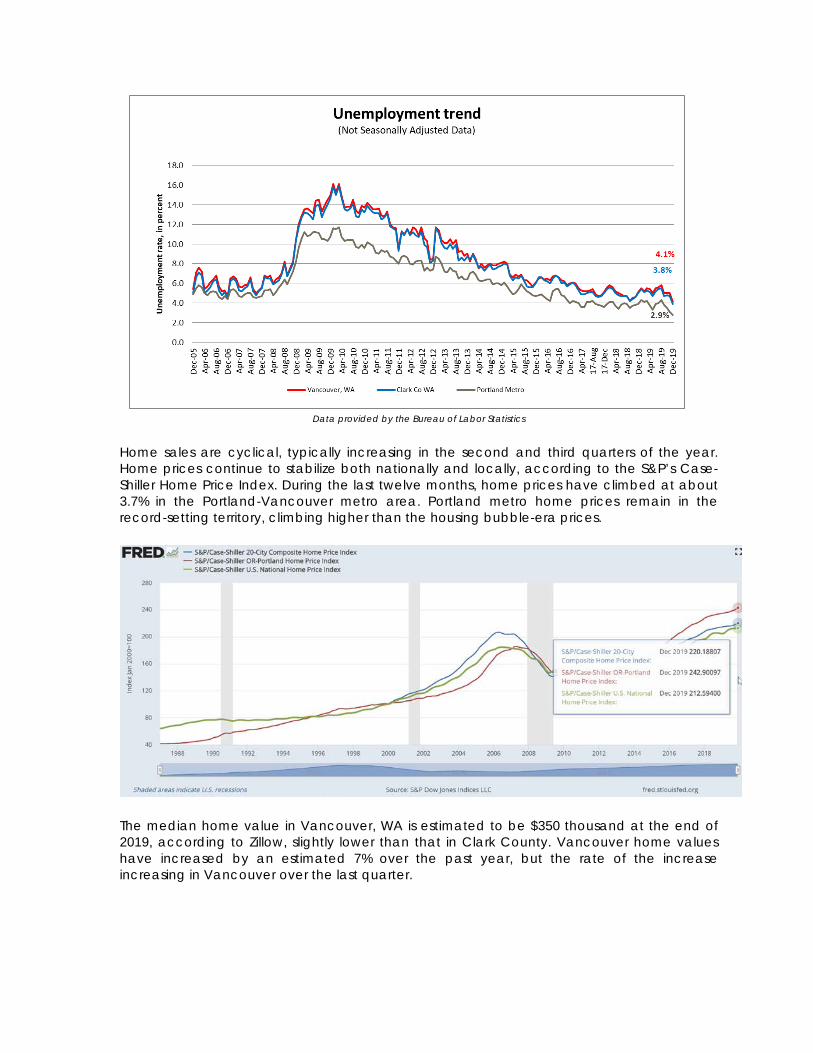
Data provided by the Bureau of Labor Statistics
Home sales are cyclical, typically increasing in the second and third quarters of the year. Home prices continue to stabilize both nationally and locally, according to the S&P’s Case-Shiller Home Price Index. During the last twelve months, home prices have climbed at about 3.7% in the Portland-Vancouver metro area. Portland metro home prices remain in the record-setting territory, climbing higher than the housing bubble-era prices.
The median home value in Vancouver, WA is estimated to be $350 thousand at the end of 2019, according to Zillow, slightly lower than that in Clark County. Vancouver home values have increased by an estimated 7% over the past year, but the rate of the increase increasing in Vancouver over the last quarter.
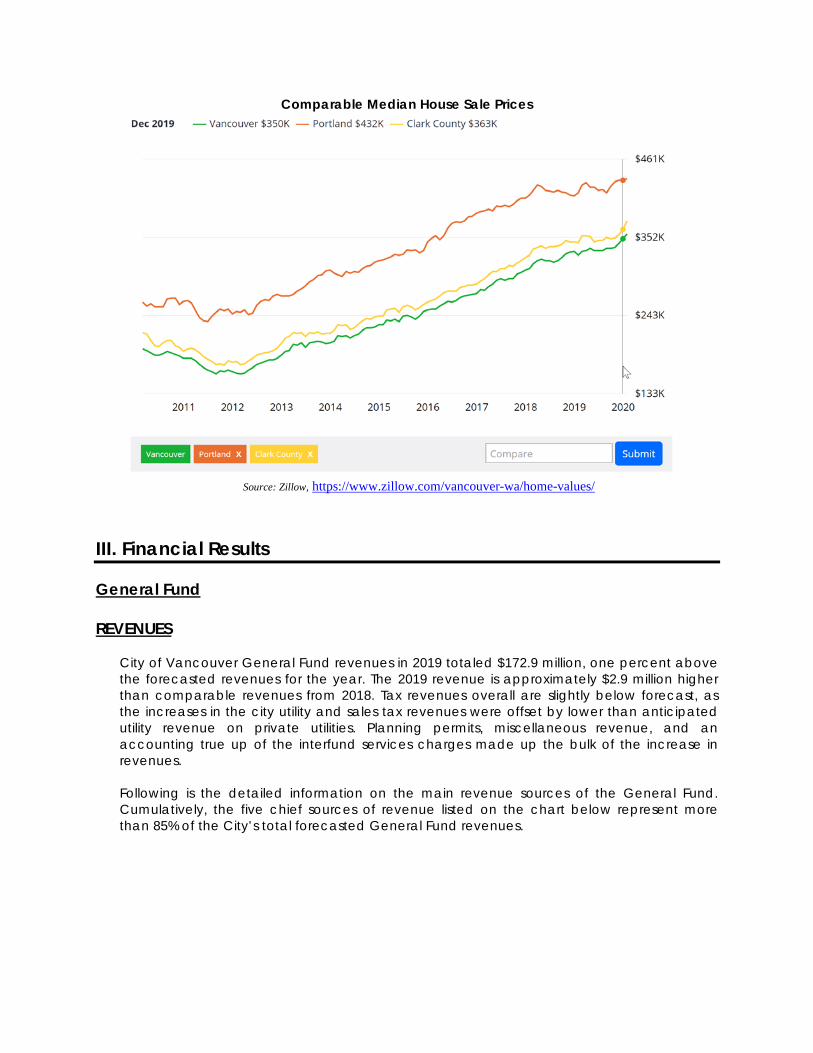
Comparable Median House Sale Prices
Source: Zillow, https://www.zillow.com/vancouver-wa/home-values/
III. Financial Results General Fund REVENUES
City of Vancouver General Fund revenues in 2019 totaled $172.9 million, one percent above the forecasted revenues for the year. The 2019 revenue is approximately $2.9 million higher than comparable revenues from 2018. Tax revenues overall are slightly below forecast, as the increases in the city utility and sales tax revenues were offset by lower than anticipated utility revenue on private utilities. Planning permits, miscellaneous revenue, and an accounting true up of the interfund services charges made up the bulk of the increase in revenues. Following is the detailed information on the main revenue sources of the General Fund. Cumulatively, the five chief sources of revenue listed on the chart below represent more than 85% of the City’s total forecasted General Fund revenues.
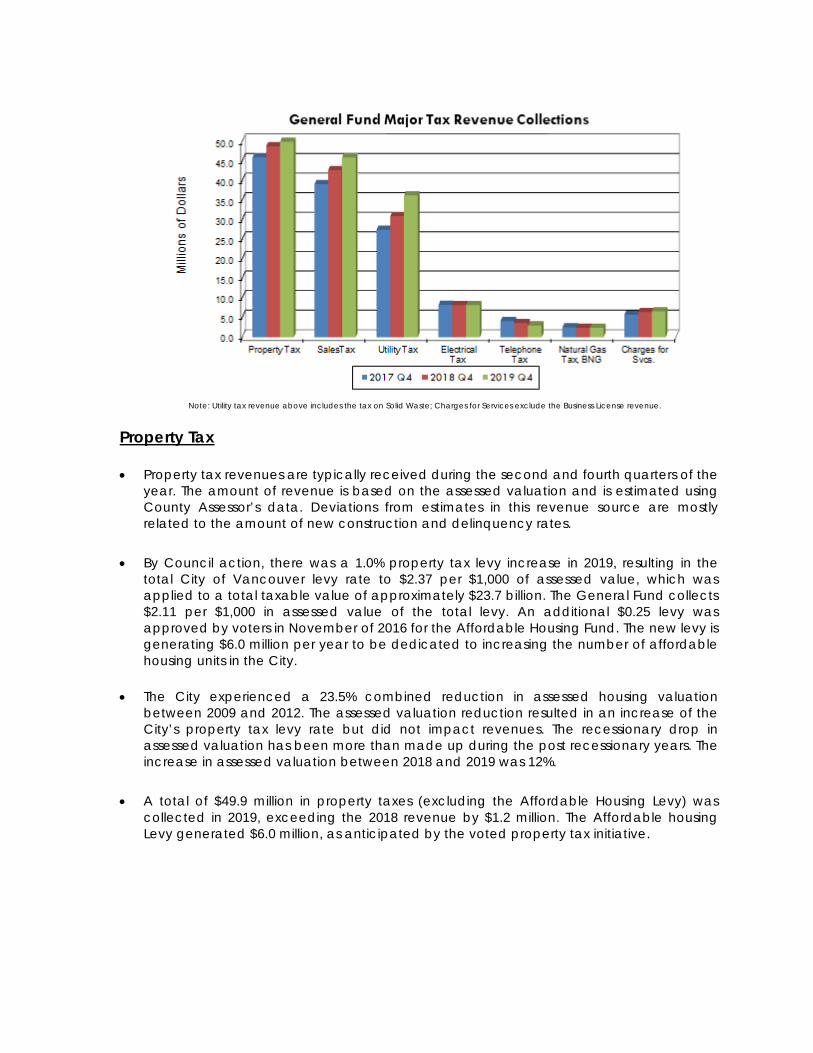
Note: Utility tax revenue above includes the tax on Solid Waste; Charges for Services exclude the Business License revenue.
Property Tax • Property tax revenues are typically received during the second and fourth quarters of the
year. The amount of revenue is based on the assessed valuation and is estimated using County Assessor’s data. Deviations from estimates in this revenue source are mostly related to the amount of new construction and delinquency rates.
• By Council action, there was a 1.0% property tax levy increase in 2019, resulting in the total City of Vancouver levy rate to $2.37 per $1,000 of assessed value, which was applied to a total taxable value of approximately $23.7 billion. The General Fund collects $2.11 per $1,000 in assessed value of the total levy. An additional $0.25 levy was approved by voters in November of 2016 for the Affordable Housing Fund. The new levy is generating $6.0 million per year to be dedicated to increasing the number of affordable housing units in the City.
• The City experienced a 23.5% combined reduction in assessed housing valuation between 2009 and 2012. The assessed valuation reduction resulted in an increase of the City’s property tax levy rate but did not impact revenues. The recessionary drop in assessed valuation has been more than made up during the post recessionary years. The increase in assessed valuation between 2018 and 2019 was 12%.
• A total of $49.9 million in property taxes (excluding the Affordable Housing Levy) was
collected in 2019, exceeding the 2018 revenue by $1.2 million. The Affordable housing Levy generated $6.0 million, as anticipated by the voted property tax initiative.
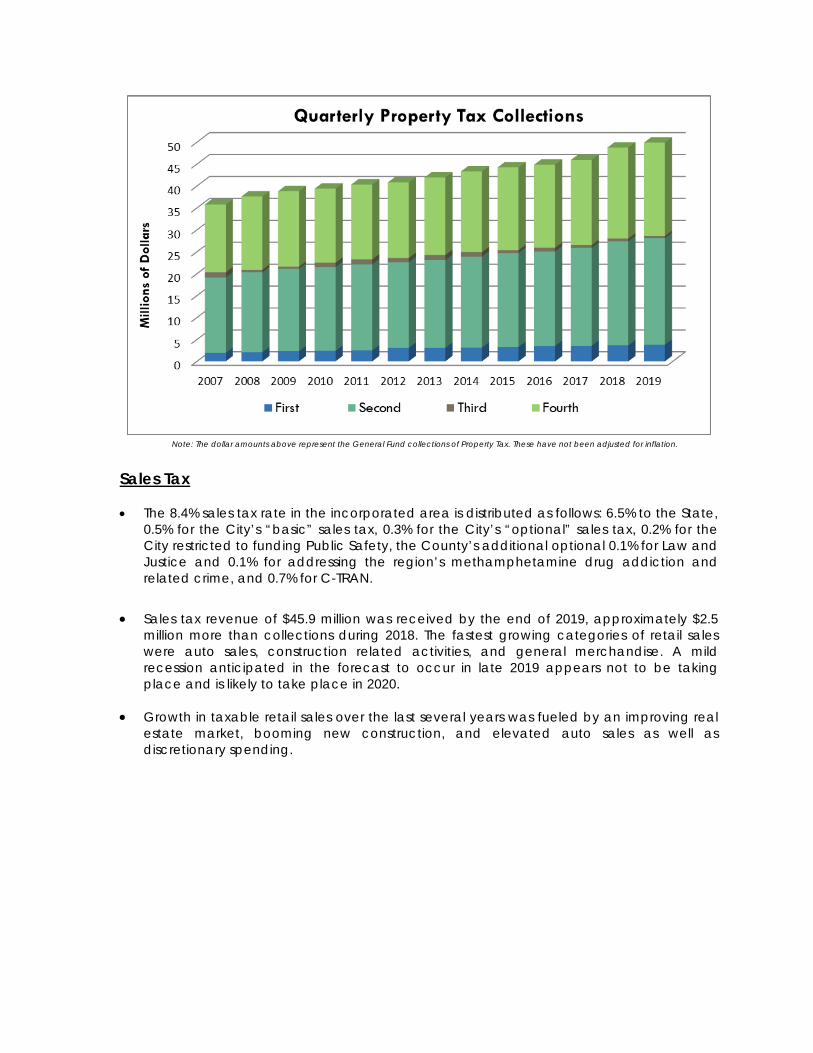
Note: The dollar amounts above represent the General Fund collections of Property Tax. These have not been adjusted for inflation.
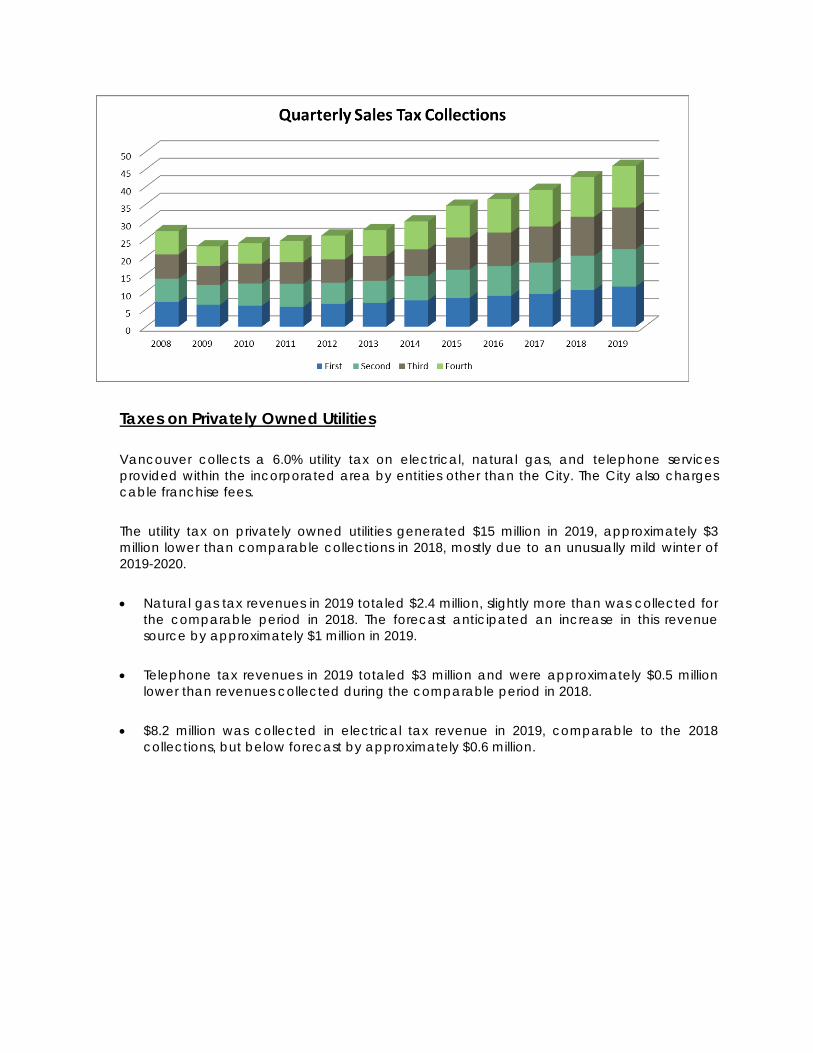
Sales Tax
• The 8.4% sales tax rate in the incorporated area is distributed as follows: 6.5% to the State,
0.5% for the City’s “basic” sales tax, 0.3% for the City’s “optional” sales tax, 0.2% for the City restricted to funding Public Safety, the County’s additional optional 0.1% for Law and Justice and 0.1% for addressing the region’s methamphetamine drug addiction and related crime, and 0.7% for C-TRAN.
• Sales tax revenue of $45.9 million was received by the end of 2019, approximately $2.5
million more than collections during 2018. The fastest growing categories of retail sales were auto sales, construction related activities, and general merchandise. A mild recession anticipated in the forecast to occur in late 2019 appears not to be taking place and is likely to take place in 2020.
• Growth in taxable retail sales over the last several years was fueled by an improving real
estate market, booming new construction, and elevated auto sales as well as discretionary spending.
Taxes on Privately Owned Utilities Vancouver collects a 6.0% utility tax on electrical, natural gas, and telephone services provided within the incorporated area by entities other than the City. The City also charges cable franchise fees. The utility tax on privately owned utilities generated $15 million in 2019, approximately $3 million lower than comparable collections in 2018, mostly due to an unusually mild winter of 2019-2020.
• Natural gas tax revenues in 2019 totaled $2.4 million, slightly more than was collected for
the comparable period in 2018. The forecast anticipated an increase in this revenue source by approximately $1 million in 2019.
• Telephone tax revenues in 2019 totaled $3 million and were approximately $0.5 million
lower than revenues collected during the comparable period in 2018.
• $8.2 million was collected in electrical tax revenue in 2019, comparable to the 2018 collections, but below forecast by approximately $0.6 million.
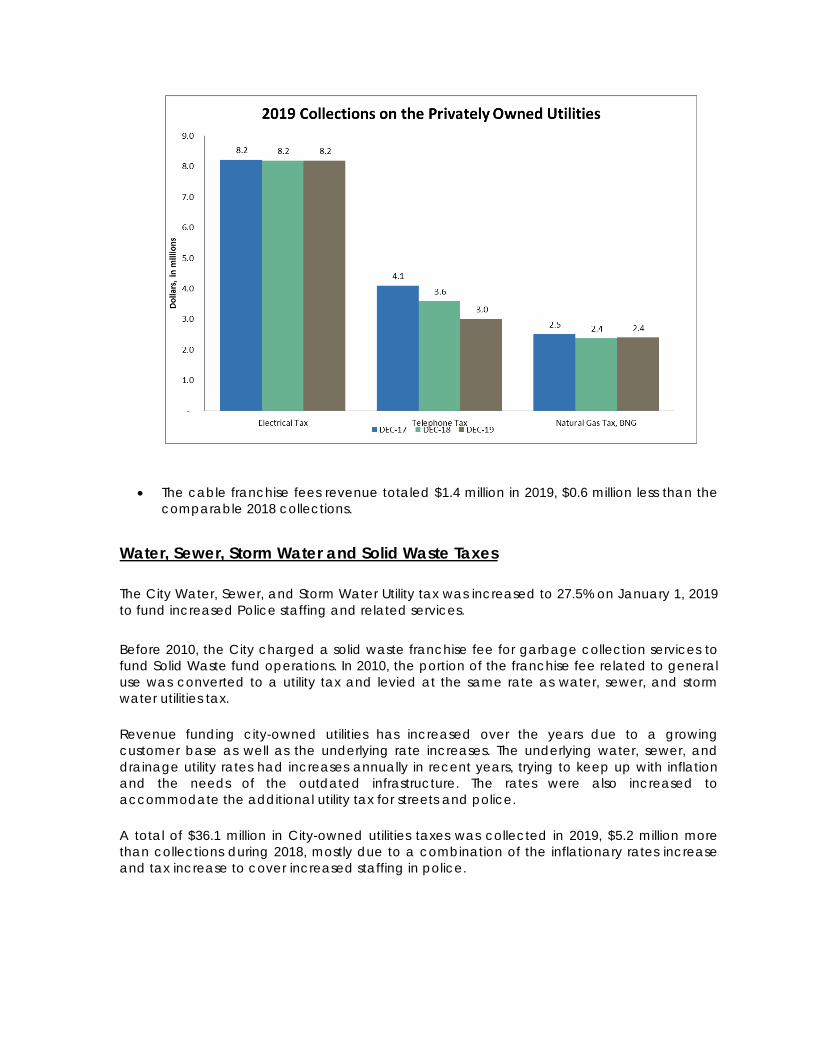
• The cable franchise fees revenue totaled $1.4 million in 2019, $0.6 million less than the
comparable 2018 collections.
Water, Sewer, Storm Water and Solid Waste Taxes
The City Water, Sewer, and Storm Water Utility tax was increased to 27.5% on January 1, 2019 to fund increased Police staffing and related services. Before 2010, the City charged a solid waste franchise fee for garbage collection services to fund Solid Waste fund operations. In 2010, the portion of the franchise fee related to general use was converted to a utility tax and levied at the same rate as water, sewer, and storm water utilities tax. Revenue funding city-owned utilities has increased over the years due to a growing customer base as well as the underlying rate increases. The underlying water, sewer, and drainage utility rates had increases annually in recent years, trying to keep up with inflation and the needs of the outdated infrastructure. The rates were also increased to accommodate the additional utility tax for streets and police. A total of $36.1 million in City-owned utilities taxes was collected in 2019, $5.2 million more than collections during 2018, mostly due to a combination of the inflationary rates increase and tax increase to cover increased staffing in police.

In 2019, residential water revenues generated approximately 80.0% of total water user revenues, while residential sewer fee revenues made up 66.0% of total sewer user revenues. The makeup of revenues has been relatively stable over the years.
Grant & Entitlement Revenues
The City anticipated receiving approximately $0.9 million in grants in the General Fund in 2019. The largest grants are the COPS grant that partially funds additional Police staff, the Brownfield and Commute Trip Reduction grants in the Community and Economic Development department. Through the end of 2019, the City received approximately $1.2 million in grant reimbursements. Most grants are cost-reimbursable, with the majority of the reimbursement funding coming in during the second through fourth quarters of the year.
Charges for Goods and Services The largest fee-revenue generating program areas at the City are the Development Review Services and Recreation programs. The 2019 revenue generated by these two sources is $5.7 million. Land Use and Other Planning Permits
From 2008 through 2010, the City experienced a significant decrease in both the number of single-family residential permits issued and in their valuation. Collections from 2011 through 2013 remained relatively flat, but 2014 through 2019 saw significant annual increases in land
use fees. So far, year 2019 appears generated the largest amount of revenue compared with recent history. Through the end of the year, land use fees generated $1.4 million in revenue compared to $1.2 million generated last year.
Recreation Program Fees
The City anticipated receiving $4.4 million in recreation fees in 2019. Recreation fee revenues tracked closely to that in 2018. The total recreation fee revenue received through the end of the year was $4.2 million, approximately $50 thousand higher than comparable revenues in 2018.
EXPENDITURES
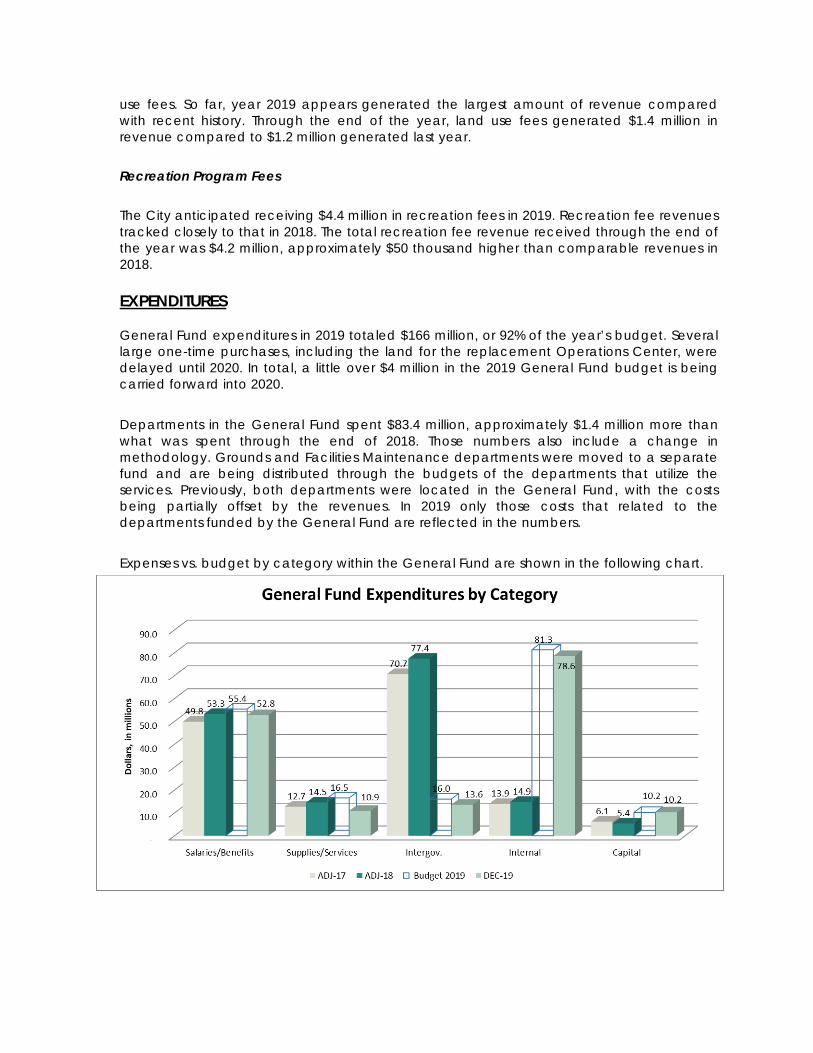
General Fund expenditures in 2019 totaled $166 million, or 92% of the year’s budget. Several large one-time purchases, including the land for the replacement Operations Center, were delayed until 2020. In total, a little over $4 million in the 2019 General Fund budget is being carried forward into 2020. Departments in the General Fund spent $83.4 million, approximately $1.4 million more than what was spent through the end of 2018. Those numbers also include a change in methodology. Grounds and Facilities Maintenance departments were moved to a separate fund and are being distributed through the budgets of the departments that utilize the services. Previously, both departments were located in the General Fund, with the costs being partially offset by the revenues. In 2019 only those costs that related to the departments funded by the General Fund are reflected in the numbers. Expenses vs. budget by category within the General Fund are shown in the following chart.
• General Fund salaries and benefits expenditures totaled $52.8 million in 2019, or 95% of the budget for the year.
• General Fund supplies and services category expenditures were $10.9 million, or 66% of the budget. Several large professional services contracts are being carried forward into 2020 due to the timing of the expenditures.
• Intergovernmental expenditures include payments by the City to other jurisdictions based on inter-local agreements. Intergovernmental expenditures reached $13.6 million in 2019, or 84.7% of the budget for the year. The City has not made any payments for Jail services this year due to delays in billing. This category, beginning with 2019, excludes support of Fire, Street, and other funds. Due to a methodology change, those transfers are now grouped in the “Internal” category.
• Internal expenditures include transfers between City funds. For example, General Fund’s
support of Fire, Street, CVTV and other funds as well as cost of internal services, such as Grounds and Facilities Maintenance, Finance, HR, IT, Risk, and Equipment Services. The interfund transfers previously fell into the Intergovernmental expenditures. Through the end of 2019, interfund expenses were at $88.4 million, or 97% of the budget for the year.
• Capital expenses totaled $0.5 million and are mostly reflective of the City purchasing
equipment and supporting capital funds.
Cash Balance
• The General Fund operating cash balance was $61.9 million at the end of March 2020. The balance was $21.1 million more than the cash balance at the end of March 2019.
• In addition to the operating cash balance, the General Fund had an emergency reserve totaling $13.9 million at the end of March 2020, compared to $13.2 million at the end of March 2019. The Council updated the emergency reserve balance financial policy in 2012, requiring that the emergency reserve balance equals 7.0% of actual external revenues in the preceding fiscal year for the General, Street, and Fire Funds. These funds are intended to be used only for extraordinary events, such as natural disasters.
Fund Balance • The cash balance represents a snapshot at a particular point in time, while the fund
balance factors in revenues and expenditures that are anticipated to occur by the end of the year.
• The total fund balance in the General Fund at the end of 2019 $65.3 million, according to the City’s audited financial statements, slightly lower than the 2018 ending balance of $66.6 million. The balance is composed of the Non-spendable, ($1.3 million), Restricted, Committed, Assigned, and Unassigned balances. The Restricted balance of $0.1 million represents grant revenue received in advance of expenditures in VPD. The Committed balance of $17.9 million represents reserves in accordance with the City Financial
Policies, including the City Emergency reserve of $12.3 million, Revenue Stabilization reserve of $4.7 million, and a capital reserve of $0.9 million. The balance pays for the ongoing operations of the General Fund when incoming seasonal revenues are not sufficient to cover expenses and eliminates the need for short-term borrowing. The Assigned reserve is estimated at $0.9 million. The Unassigned balance of $45.1 million contains Working Capital to ensure sufficient cash flow in the fund; the remaining $11.2 million portion of the balance was determined to be undesignated at the end of 2019, compared to $11.2 million at the end of 2018.
Street Fund
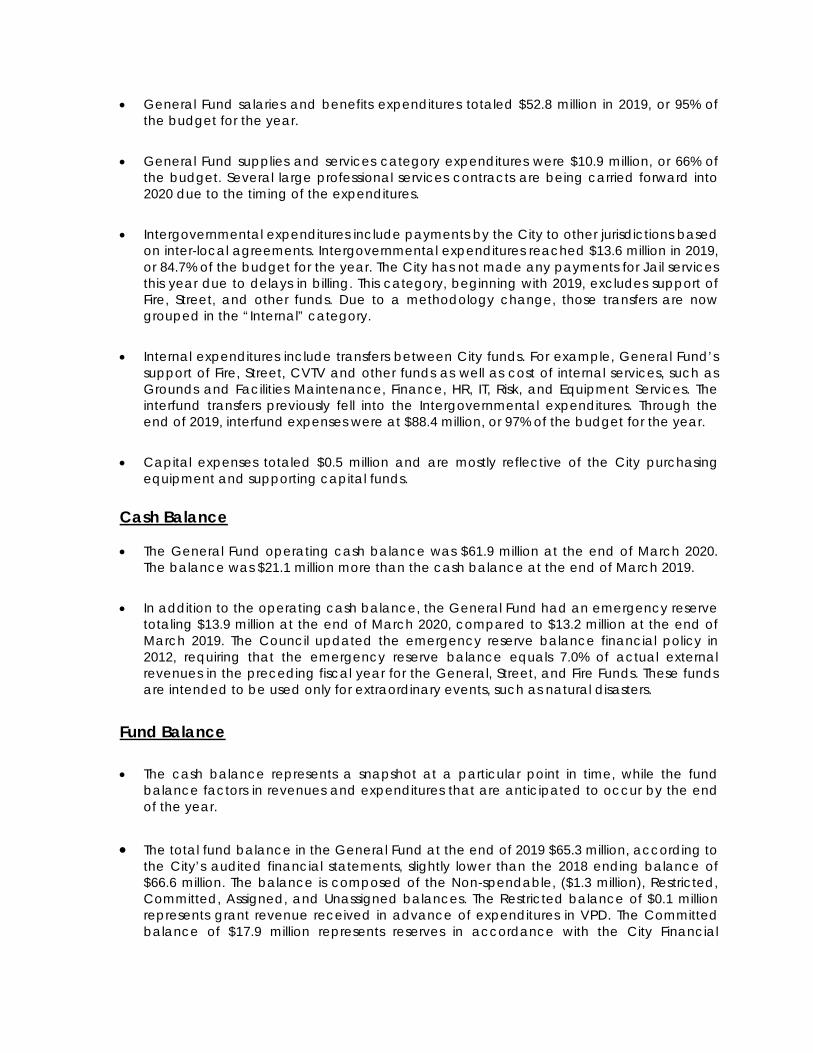
• Street Fund expenditures in 2019 totaled $16 million, or 86% of the budget, on par with the
2018 spending. • Street Fund revenues (excluding a budgeted general fund transfer) in 2019 totaled $5.3
million, comparable to those in 2018. The fund’s largest sources of revenue are state-shared revenues from the motor vehicle fuel tax (MVFT), permit fees and a transfer from the General Fund. Beginning in 2018, REET revenue is being received by the Operating Street Initiatives Fund (fund 103) to better match the consolidated Pavement Management Program which was moved to the same fund for the ease of operations.
• Motor Vehicle Fuel Tax (MVFT) revenues totaled $3.6 million in 2019, slightly less than those
in 2018. This revenue source is a set tax per gallon that does not depend on the price of gasoline. The significant nation-wide increase in gasoline prices over the past two years has resulted in declining gasoline consumption. The decline in consumption negatively impacted tax revenue collections state-wide and decreased the proportionate share of the tax received by the City.
Real Estate Excise Tax (REET)
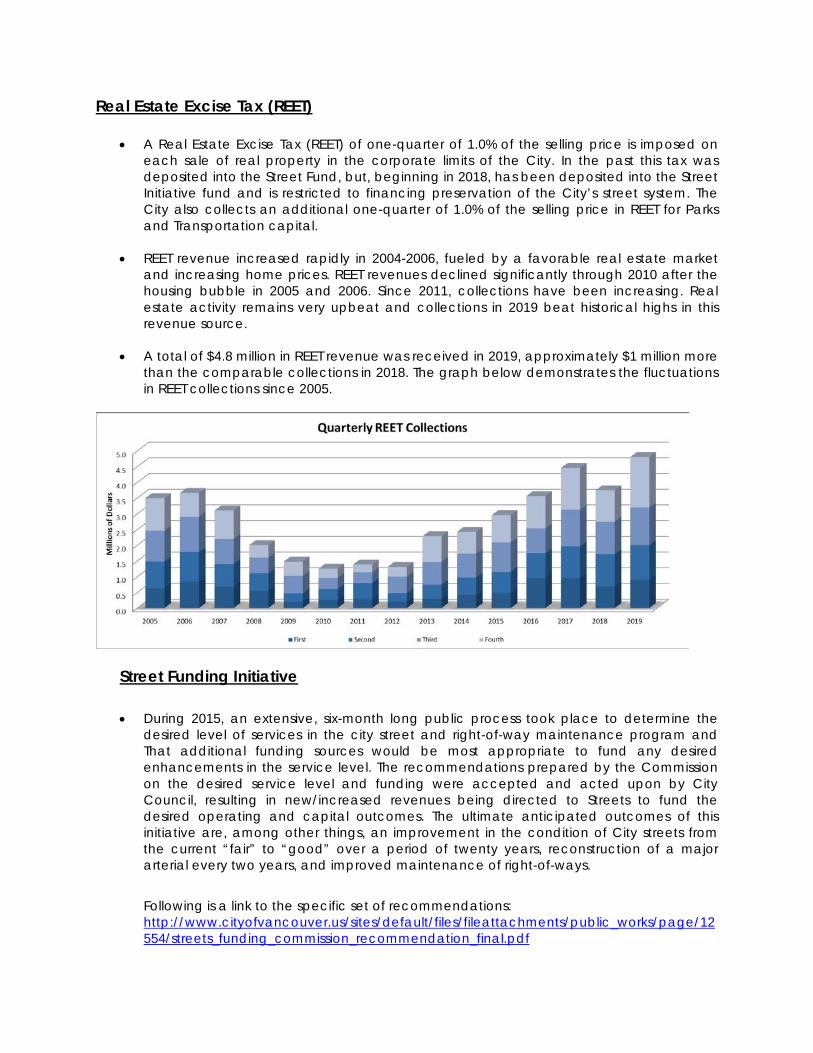
• A Real Estate Excise Tax (REET) of one-quarter of 1.0% of the selling price is imposed on each sale of real property in the corporate limits of the City. In the past this tax was deposited into the Street Fund, but, beginning in 2018, has been deposited into the Street Initiative fund and is restricted to financing preservation of the City’s street system. The City also collects an additional one-quarter of 1.0% of the selling price in REET for Parks and Transportation capital.
• REET revenue increased rapidly in 2004-2006, fueled by a favorable real estate market
and increasing home prices. REET revenues declined significantly through 2010 after the housing bubble in 2005 and 2006. Since 2011, collections have been increasing. Real estate activity remains very upbeat and collections in 2019 beat historical highs in this revenue source.
• A total of $4.8 million in REET revenue was received in 2019, approximately $1 million more
than the comparable collections in 2018. The graph below demonstrates the fluctuations in REET collections since 2005.
Street Funding Initiative
• During 2015, an extensive, six-month long public process took place to determine the desired level of services in the city street and right-of-way maintenance program and That additional funding sources would be most appropriate to fund any desired enhancements in the service level. The recommendations prepared by the Commission on the desired service level and funding were accepted and acted upon by City Council, resulting in new/increased revenues being directed to Streets to fund the desired operating and capital outcomes. The ultimate anticipated outcomes of this initiative are, among other things, an improvement in the condition of City streets from the current “fair” to “good” over a period of twenty years, reconstruction of a major arterial every two years, and improved maintenance of right-of-ways. Following is a link to the specific set of recommendations: http://www.cityofvancouver.us/sites/default/files/fileattachments/public_works/page/12554/streets_funding_commission_recommendation_final.pdf
• 2016 was the first year of the new Street Initiatives revenue. The City pre-funded the
activities related to right-of-way maintenance with City dollars so that some of the results could be seen in 2016. A portion of the new revenue - vehicle license fees – started coming into the Transportation Benefits District (TBD) fund beginning July 1, 2016. Beginning in 2018, the entire Pavement Management program was consolidated in the Street Initiatives fund for easier operational management and ease of presentation.
Below is the financial information related to the Operating Street Initiatives and the Capital Street Initiatives funds. Attachment B to the Quarterly report further breaks down revenues received by the Street Funding Initiative – Operating fund by type of revenue.
2018 2019 Budget 2019 % of Budget Revenues Street Fund 15,266,522 14,021,358 14,066,098 100.3% Street Initiatives Fund 12,039,069 12,335,611 14,499,820 117.5% Transportation Benefits District 3,821,136 4,815,000 4,904,749 101.9% Expenditures Street Fund 15,965,429 18,519,444 15,946,488 86.1% Street Initiatives Fund 10,292,588 13,156,408 11,649,270 88.5% Transportation Benefits District 2,855,539 3,400,872 2,824,843 83.1%
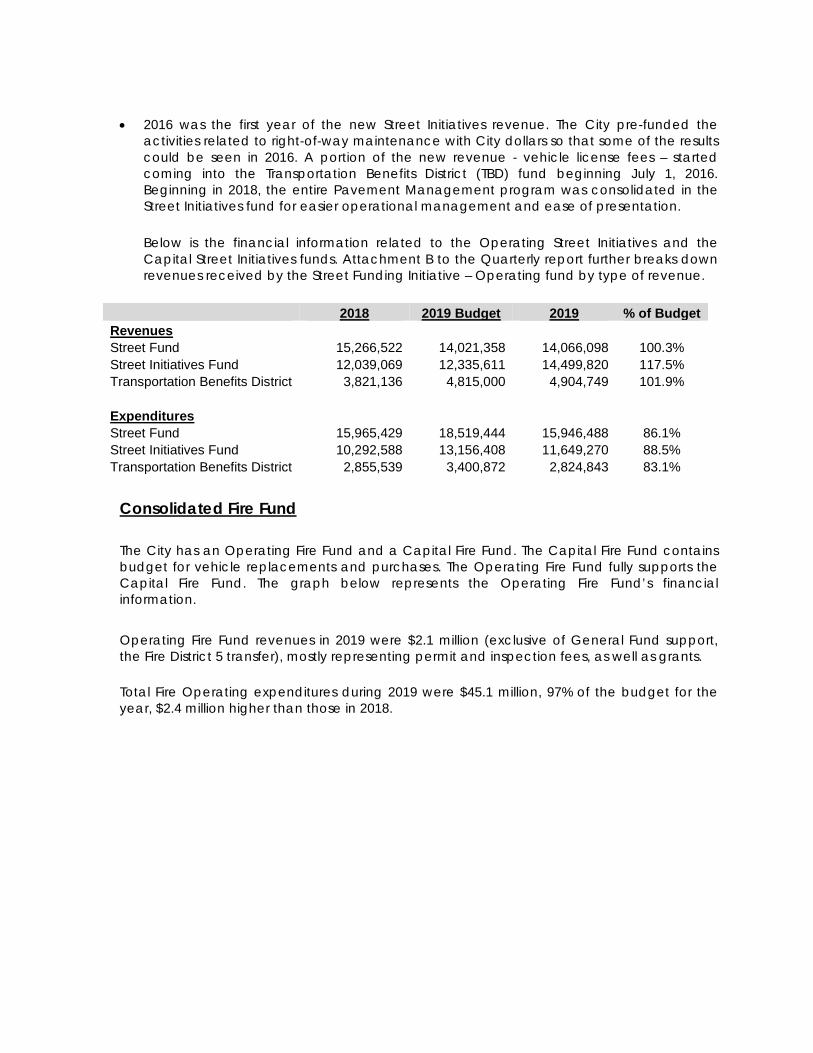
Consolidated Fire Fund
The City has an Operating Fire Fund and a Capital Fire Fund. The Capital Fire Fund contains budget for vehicle replacements and purchases. The Operating Fire Fund fully supports the Capital Fire Fund. The graph below represents the Operating Fire Fund’s financial information. Operating Fire Fund revenues in 2019 were $2.1 million (exclusive of General Fund support, the Fire District 5 transfer), mostly representing permit and inspection fees, as well as grants. Total Fire Operating expenditures during 2019 were $45.1 million, 97% of the budget for the year, $2.4 million higher than those in 2018.
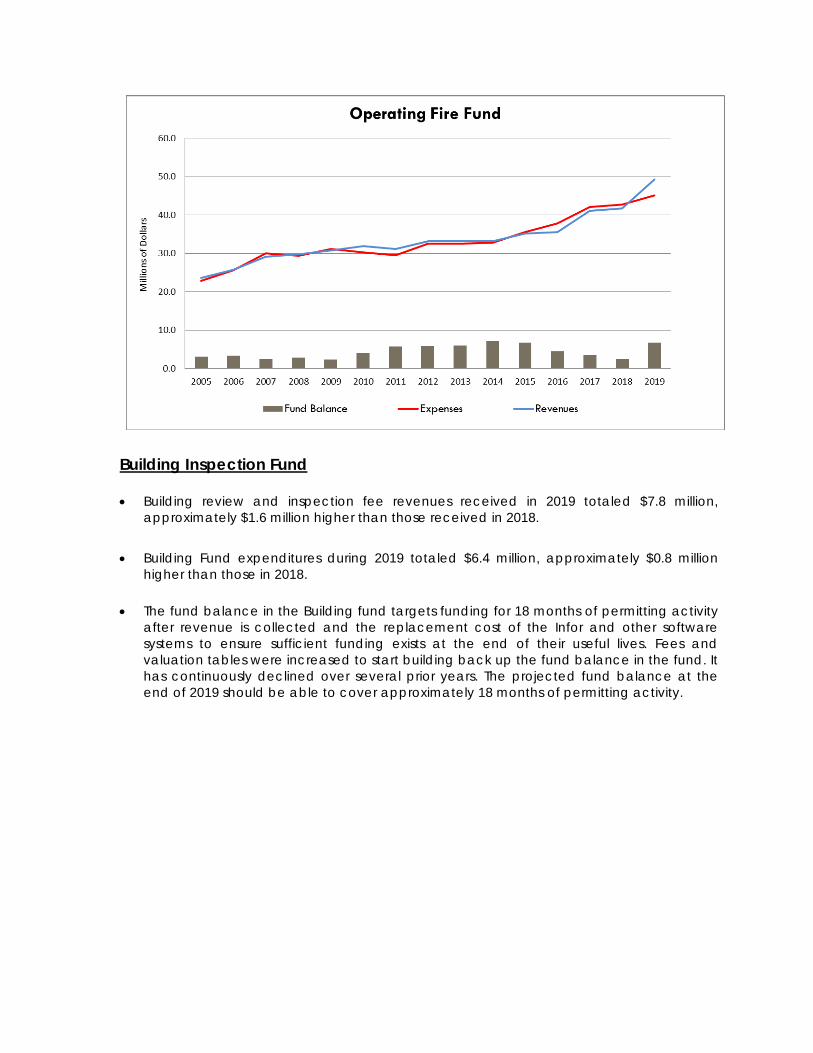
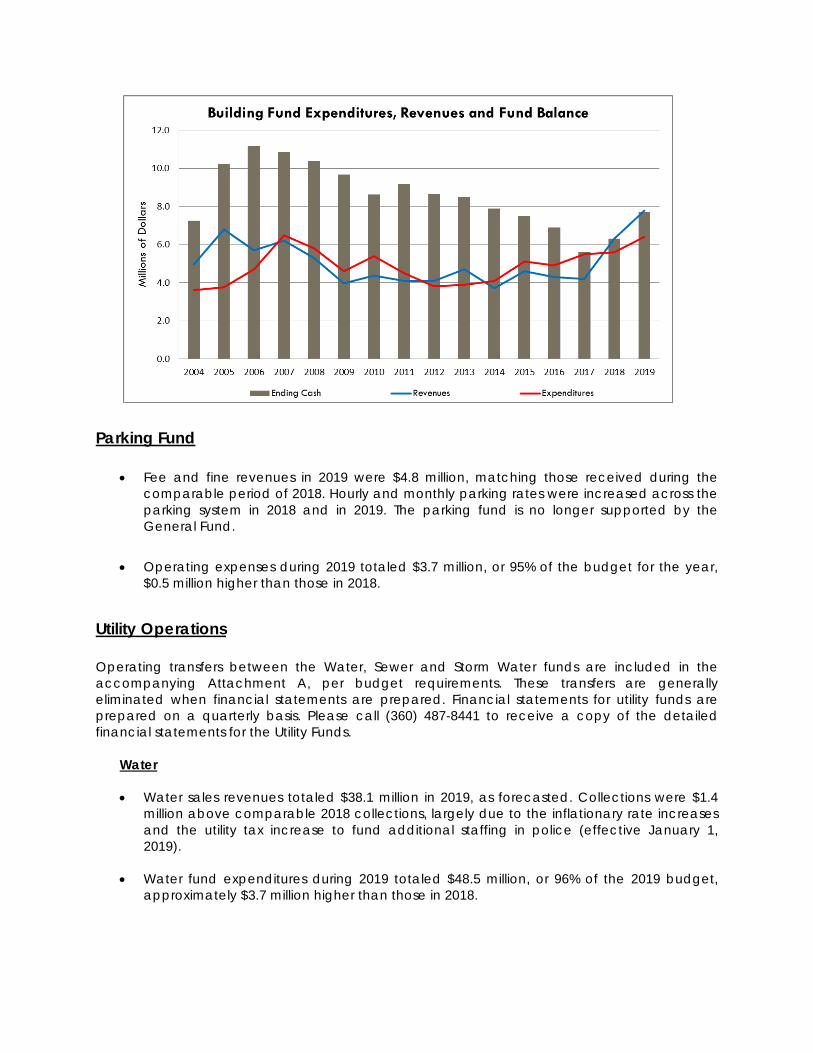
Building Inspection Fund
• Building review and inspection fee revenues received in 2019 totaled $7.8 million, approximately $1.6 million higher than those received in 2018.
• Building Fund expenditures during 2019 totaled $6.4 million, approximately $0.8 million
higher than those in 2018. • The fund balance in the Building fund targets funding for 18 months of permitting activity
after revenue is collected and the replacement cost of the Infor and other software systems to ensure sufficient funding exists at the end of their useful lives. Fees and valuation tables were increased to start building back up the fund balance in the fund. It has continuously declined over several prior years. The projected fund balance at the end of 2019 should be able to cover approximately 18 months of permitting activity.
Parking Fund
• Fee and fine revenues in 2019 were $4.8 million, matching those received during the comparable period of 2018. Hourly and monthly parking rates were increased across the parking system in 2018 and in 2019. The parking fund is no longer supported by the General Fund.
• Operating expenses during 2019 totaled $3.7 million, or 95% of the budget for the year, $0.5 million higher than those in 2018.
Utility Operations
Operating transfers between the Water, Sewer and Storm Water funds are included in the accompanying Attachment A, per budget requirements. These transfers are generally eliminated when financial statements are prepared. Financial statements for utility funds are prepared on a quarterly basis. Please call (360) 487-8441 to receive a copy of the detailed financial statements for the Utility Funds.
Water
• Water sales revenues totaled $38.1 million in 2019, as forecasted. Collections were $1.4 million above comparable 2018 collections, largely due to the inflationary rate increases and the utility tax increase to fund additional staffing in police (effective January 1, 2019).
• Water fund expenditures during 2019 totaled $48.5 million, or 96% of the 2019 budget, approximately $3.7 million higher than those in 2018.
Sewer • Fee revenues in the Sewer Fund were $49 million in 2019, approximately $2.8 million
above the comparable 2018 revenues. Sewer rates had inflationary increases in 2019 and an adjustment for a utility tax increase to fund increased police staffing.
• Sewer expenditures during 2019 totaled $50.6 million, comparable to those in 2018.
Storm Water • A total of $18.1 million in storm water fee revenue was received in 2019, approximately
$1.7 million higher than the 2018 comparable revenues. In 2019, the rates had an inflationary increase as well as an adjustment for a utility tax increase to fund increased police staffing.
• Overall, the expenditures in the Storm Water fund were $17.6 million in 2019, or 90% of the
overall 2019 budget, approximately $0.8 million higher than comparable 2018 expenses. Internal Service Funds
Equipment Services Operating and Capital Funds
A total of $7.3 million was spent by Equipment Services on operating activities in 2019, or 97% of the budget for the year. The ER&R Capital fund spent $6.1 million by the end 2019, or 51% of the budget for the year. The amount spent so far represents the City’s attempt to replace the vehicles that are at or beyond their useful lives.
Technology ER&R Fund
A total of $5.0 million, or 85% of the budget, was spent on technology and software replacement through September 2019. A large portion of the 2019 budget was earmarked to finish the replacement of the City’s 17-year-old ERP System, Oracle. The new system, WorkDay went live in April of 2019.
Internal Administrative Services Fund
$17.1 million was spent by Internal Services departments (IT, Finance, HR and Civil Legal) in 2019, approximately 93% of the budget for the year.
Risk Fund A total of $6.7 million was spent in 2019, approximately $0.6 million higher than was spent in 2018, largely driven by settled claims and the cost increases of the liability and workers compensation insurances.
Benefits and Self-Insured Health Insurance Funds
A total $21 million was spent in 2019 on employee benefits, including health insurance and payments to medical trusts, approximately $1.1 million more than was spent last year. The cost increase was associated with the increase in the cost of health and benefits costs as well as the claims activity.
IV. Outstanding Debt
At the end of the first quarter of 2020, the City had around $60 million of general obligation (G.O.) debt outstanding and approximately $3.8 million of revenue bond debt outstanding. General obligation debt is backed by the full faith and credit of the City and by general taxes. Revenue bond debt is supported by a pledge of specific revenues. All the City’s revenue bond debt is supported by the City’s water and sewer utilities. The weighted-average interest rate for the City’s general obligation debt is 3.06%, while the average interest rate for the City’s revenue bond debt is 4.00%.
A complete list of the City’s outstanding debt is included in Attachment C.
V. Investments
Market Conditions
• The Federal Reserve is committed to using its full range of tools to support the U.S. economy in this challenging time, thereby promoting its maximum employment and price stability goals.
• The coronavirus outbreak is causing tremendous human and economic hardship across the United States and around the world. The virus and the measures taken to protect public health are inducing sharp declines in economic activity and a surge in job losses. Weaker demand and significantly lower oil prices are holding down consumer price inflation. The disruptions to economic activity here and abroad have significantly affected financial conditions and have impaired the flow of credit to U.S. households and businesses.
• The ongoing public health crisis will weigh heavily on economic activity, employment, and inflation in the near term, and poses considerable risks to the economic outlook over the medium term. Considering these developments, the Committee decided to maintain the target range for the federal funds rate at 0 to 1/4 percent. The Committee expects to maintain this target range until it is confident that the economy has weathered recent events and is on track to achieve its maximum employment and price stability goals.
• The Committee will continue to monitor the implications of incoming information for the economic outlook, including information related to public health, as well as global developments and muted inflation pressures, and will use its tools and act as appropriate to support the economy. In determining the timing and size of future adjustments to the stance of monetary policy, the Committee will assess realized and expected economic conditions relative to its maximum employment objective and its symmetric 2 percent inflation objective. This assessment will include a wide range of information, including measures of labor market conditions, indicators of inflation pressures and inflation expectations, and readings on financial and international developments.
• To support the flow of credit to households and businesses, the Federal Reserve will continue to purchase Treasury securities and agency residential and commercial mortgage-backed securities in the amounts needed to support smooth market functioning, thereby fostering effective transmission of monetary policy to broader financial conditions. In addition, the Open Market Desk will continue to offer large-scale over-night and term repurchase agreement operations. The Committee will closely monitor market conditions and is prepared to adjust its plans as appropriate.
.
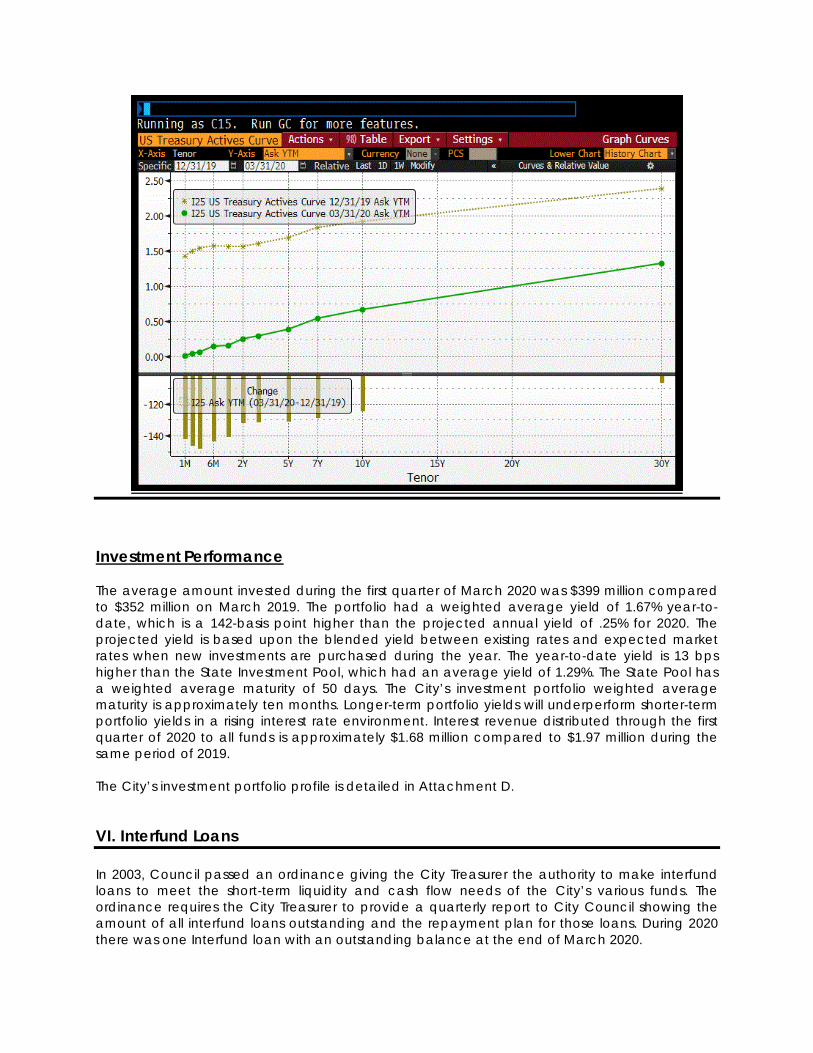
Investment Performance The average amount invested during the first quarter of March 2020 was $399 million compared to $352 million on March 2019. The portfolio had a weighted average yield of 1.67% year-to-date, which is a 142-basis point higher than the projected annual yield of .25% for 2020. The projected yield is based upon the blended yield between existing rates and expected market rates when new investments are purchased during the year. The year-to-date yield is 13 bps higher than the State Investment Pool, which had an average yield of 1.29%. The State Pool has a weighted average maturity of 50 days. The City’s investment portfolio weighted average maturity is approximately ten months. Longer-term portfolio yields will underperform shorter-term portfolio yields in a rising interest rate environment. Interest revenue distributed through the first quarter of 2020 to all funds is approximately $1.68 million compared to $1.97 million during the same period of 2019. The City’s investment portfolio profile is detailed in Attachment D.
VI. Interfund Loans In 2003, Council passed an ordinance giving the City Treasurer the authority to make interfund loans to meet the short-term liquidity and cash flow needs of the City’s various funds. The ordinance requires the City Treasurer to provide a quarterly report to City Council showing the amount of all interfund loans outstanding and the repayment plan for those loans. During 2020 there was one Interfund loan with an outstanding balance at the end of March 2020.
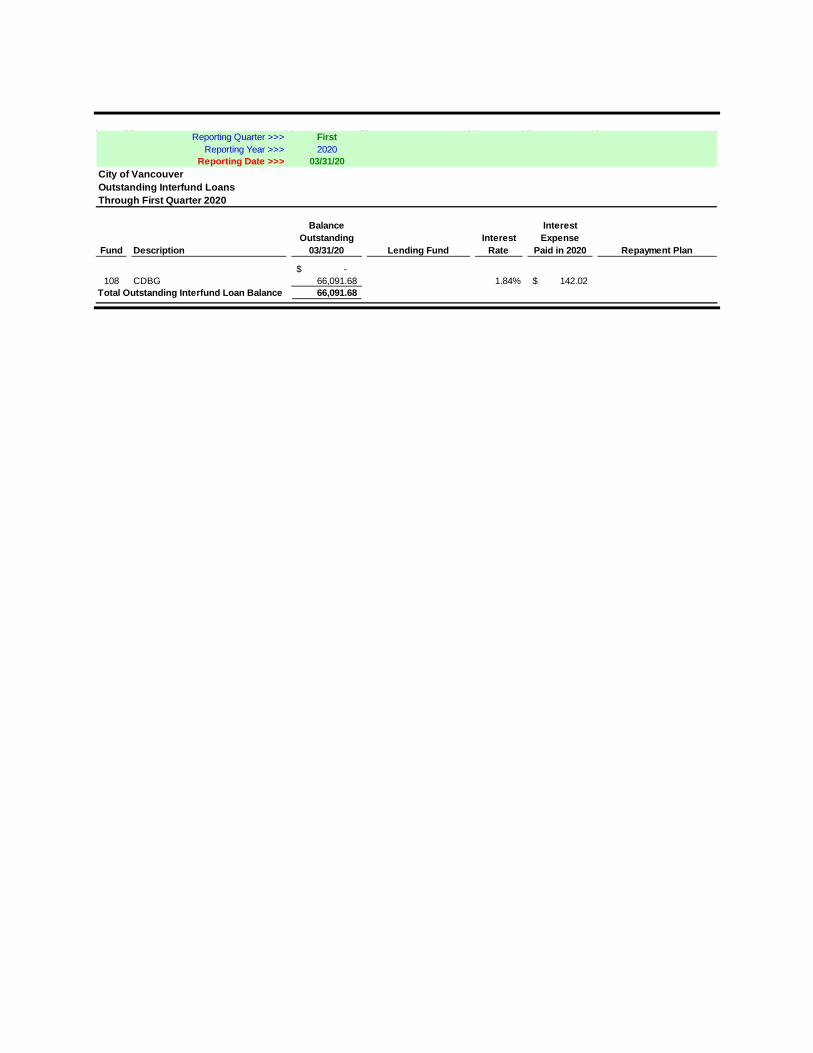
Reporting Quarter >>> FirstReporting Year >>> 2020
Reporting Date >>> 03/31/20City of Vancouver Outstanding Interfund LoansThrough First Quarter 2020
Balance InterestOutstanding Interest Expense
Fund Description 03/31/20 Lending Fund Rate Paid in 2020 Repayment Plan
-$ 108 CDBG 66,091.68 1.84% 142.02$
Total Outstanding Interfund Loan Balance 66,091.68