
Webinar - Deeper Insights Through Intelligent Community Engagement

A Closer Look at
Arts Engagement in California
Insights from the NEA’s Survey of Public Participation in the Arts
JANUARY 2015 AUTHORS:
Jennifer Novak-Leonard
Jaclyn Wong
Ned English

NORC | A Closer Look at Arts Engagement in California: Insights from the NEA’s Survey of Public Participation in the Arts
I
Contents
Acknowledgements ................................................................................................................. III
Executive Summary .................................................................................................................. 1
Key Findings ....................................................................................................................... 2
The Changing Landscape of Arts Participation ...................................................................... 5
Data & Analysis Methods .................................................................................................... 6
Conceptual Frames ............................................................................................................. 7
Organization of the Report .................................................................................................. 8
“Receptive” Arts Participation ............................................................................................... 10
Key Observations.............................................................................................................. 10
Arts Attendance ................................................................................................................ 10
Venues for Arts Attendance .............................................................................................. 14
Arts Consumption through Electronic Media ..................................................................... 15
Reading Books & Literature .............................................................................................. 18
“Participatory” Arts Participation .......................................................................................... 19
Key Observations.............................................................................................................. 19
Art-Sharing using Electronic Media ................................................................................... 19
Arts Learning .................................................................................................................... 21
Art-Making & Art-Sharing .................................................................................................. 25
A New Look at “Arts Participation” ....................................................................................... 28
Defining “Arts Participation” .............................................................................................. 28
Technical Notes ...................................................................................................................... 33
Data ................................................................................................................................ 33
Weights & Statistical Significance ..................................................................................... 33
Geography ........................................................................................................................ 34
Summary Tables ............................................................................................................... 35
References .............................................................................................................................. 43

NORC | A Closer Look at Arts Engagement in California: Insights from the NEA’s Survey of Public Participation in the Arts
II
Figures
Figure 1: CA Adults’ Rates of Arts Participation, by Mode of Participation ............................... 8
Figure 2: Percent of Adults Attending Arts Events, 2002-2012 .............................................. 11
Figure 3: Percent of CA Adults Who Attended Arts Activities or Events, by Region ............... 13
Figure 4: Percent of CA Adults Who Saw an Art Exhibit or Attended a Performing Arts Event, by Venue Type...................................................................................................... 14
Figure 5: Percent of CA Adults Who Consumed Arts through Electronic Media, by Type of Media .................................................................................................................... 15
Figure 6: Percent of Adults Who Read Books or Literary Works,
by Race/Ethnicity & Nativity .................................................................................. 18
Figure 7: Percent of Adults Who Shared Art through Electronic Media, Significant Differences by Region ............................................................................................................. 20
Figure 8: Percent of Adults Taking Art Classes or Lessons in Prior in 12 Months, by Age ..... 22
Figure 9: Percent of CA Adults Who Ever Engaged in Arts Learning, by Learning Format .... 23
Figure 10: Percent of CA Adults Who Ever Took Arts Lessons or Classes, Whether In Childhood or Only as an Adult .............................................................................. 24
Figure 11: Percent of CA Adults Who Ever Took Arts Lessons, Whether In or Out of School 25
Figure 12: Percent of CA Adults Participating in Art-Making & Art-Sharing Activities,
by Region .......................................................................................................... 27
Figure 13: Map of CA Metro Regions ..................................................................................... 34

NORC | A Closer Look at Arts Engagement in California: Insights from the NEA’s Survey of Public Participation in the Arts
III
Tables
Table 1: Ranking of CA Adult Rates of Attending Arts Events & Activities At Least Once ..... 12
Table 2: Percent of CA Adults Accessing Arts using Electronic Media, by Race/Ethnicity & Nativity .................................................................................................................. 16
Table 3: Proportions of Handheld/Mobile & Internet Users Accessing Arts,
by Race/Ethnicity .................................................................................................. 17
Table 4: Ranking of Adult Participation Rates in Art-Sharing using Electronic Media ............. 19
Table 5: Ranking of Adult Participation Rates in Art-Making & Art-Sharing Activities ............. 26
Table 6: US and California Population Profiles ...................................................................... 35
Table 7: Topline Statistics: CA vs. US Adult Rates of Participation ........................................ 36
Table 8: Significant Odds-Ratios for General SPPA Modes of Arts Participation, within California .............................................................................................................. 38
Table 9: Percent of Adults Participating in General SPPA Modes of Participation, by Socio-Demographic Variables ......................................................................................... 40
Acknowledgements
We are grateful to Melissa Menzer in the National Endowment for the Arts’ Office of Research and
Analysis and Steven Shewfelt, formerly with the NEA, for fielding our questions about the 2012 Survey
of Public Participation in the Arts. We wish to extend a special thank you to Sunil Iyengar, Director,
NEA Office of Research and Analysis, for continuously engaging with us about our evolving
understanding of what arts participation is, and how it can be measured. This report was strengthened by
insights from our colleagues, Betty Farrell, Executive Director, and Gwen Rugg, Program Coordinator, at
the Cultural Policy Center at the University of Chicago; and Kathleen Parks, Senior Vice President,
NORC. We are grateful to our NORC colleagues Wei Zeng and Lee Fiorio for their expertise on survey
weights. We are especially grateful to the James Irvine Foundation for their support, financial and
intellectual, and especially to Kevin Rafter, Manager, Impact Assessment and Learning, and our liaison at
the James Irvine Foundation.

NORC | A Closer Look at Arts Engagement in California: Insights from the NEA’s Survey of Public Participation in the Arts
1
Executive Summary
California’s cultural sector is undergoing massive change, with consequences for the ways in which
individuals experience art and for the ways in which organizations and artists deliver their artistic
products and engage with participants. California is experiencing dramatically shifting demographics;
rapid technological advances offer new opportunities for artistic expression and access; people’s
expectations are changing about the structure of work and leisure time experiences --- these are some of
the most significant forces that are reshaping the landscape of the cultural sector and how people
encounter, engage with, and participate in art.
Over the last three decades, the term arts participation has essentially been understood as arts attendance
within the non-profit arts field. The field’s key indicator of arts participation over this time has been
attendance at any of the following seven “benchmark” arts events – performances of ballet, musical and
nonmusical theater, jazz, classical music, opera, and visiting an art museum – at least once during a 12
month period. This indicator stems from the National Endowment for the Arts’ Survey of Public
Participation in the Arts (SPPA), which is the only long-standing, national source of data on arts
participation in the US. Begun in the early 1980s with a focus on tracking the health of non-profit arts
organizations in the NEA’s funding portfolio, the SPPA primarily emphasized audience attendance.
Since 2002, rates of attendance at benchmark arts in California have steadily declined.1 Even attendance
at a wider range of arts events, extending beyond the benchmark arts, fell ten percentage points between
2002 and 2012 in California. Over the same time, despite socio-demographic changes within the state,
arts audiences in California remained disproportionately drawn from the population with higher incomes
(in 2012, 49% of arts attendees had household incomes of $75,000 or more compared to 41% of
Californian households) and higher levels of education (in 2012, 41% of arts attendees had at least a
college degree compared to 31% of California’s population). Despite California’s historic shift in 2014,
with Hispanics surpassing Non-Hispanic Whites as the largest portion of the state’s population, adult arts
audiences remain 55% Non-Hispanic White even though they only comprise 43% of the state’s adult
population, and 40% of the state’s overall population.2
Yet, evidence of interest in the arts among California’s highly diverse population – along with the artistic
impulse to engage creatively – is pervasive, and this evidence is shared in this report. The shifting
landscape for artistic and cultural expression and experience has implications for how artists and
organizations share their expertise and work. This requires a deeper understanding of how adults in
California are participating in arts and how participation varies across the state’s diverse population. The

NORC | A Closer Look at Arts Engagement in California: Insights from the NEA’s Survey of Public Participation in the Arts
2
non-profit arts field’s understanding of arts participation can no longer rely on measures of arts
attendance alone.
This report is the first in a two-part study commissioned by the James Irvine Foundation to understand
what California’s residents do to participate in the arts and, importantly, how that varies across the state’s
diverse population. This first part draws on data from the National Endowment for the Arts’ recently
released 2012 Survey of Public Participation in the Arts, from which the NEA published detailed findings
for the US in A Decade of Arts Engagement: Findings from the Survey of Public Participation in the Arts,
2002-2012.
The second part of the study will share findings from a new state-wide survey that takes a different
perspective on arts participation. The Cultural Lives of Californians is based on findings from a new
survey that complements the SPPA by offering a different starting perspective to capturing a broad range
of artistic and cultural activity, and nuance about the role these activities play in Californians’ daily
cultural lives. During the survey’s design phase, we studied the SPPA, and conducted in-depth interviews
with cultural experts and an extensive review of the literature and existing survey tools, which are
available in The Changing Landscape of Arts Participation: A Synthesis of Literature and Expert
Interviews [http://arts.gov/sites/default/files/irvine-literature-review.pdf] from the National Endowment
for the Arts. Our initial findings from The Cultural Lives of Californians will be released in March 2015.
The two-part study as a whole aims to expand how arts participation is understood and to better
understand the implications of the changing cultural landscape for the non-profit arts field and beyond.
Key Findings
The most common form of arts participation among adults in California, as measured in the 2012 SPPA,
is consuming arts through electronic media. Seventy-seven percent of the state’s adults accessed arts
through TV, radio, computers, or handheld or mobile devices. The rate of consuming arts through
electronic media is almost 1.5 times the rate at which Californian adults attend art (53%) or make art
(54%). Just over half (52%) of adult internet-users in California accessed arts content, and 71% of adult
handheld or mobile device-users did so. The rates of accessing arts content using handheld or mobile
devices are relatively even across race/ethnicity and immigrant groups; however, those who self-identify
as Hispanic report any use of the Internet and mobile devices at much lower rates than the rest of the
state’s population. Non-Hispanic Asian/Pacific Islanders are 31% less likely to access arts using the TV
or radio compared to Non-Hispanic Whites. TV and radio are especially important means of accessing art

NORC | A Closer Look at Arts Engagement in California: Insights from the NEA’s Survey of Public Participation in the Arts
3
content for those living outside of California’s largest metropolitan regions - the Bay Area, Greater
Sacramento, Los Angeles, Orange and San Diego counties.
Even after accounting for socio-demographic differences between California’s largest metropolitan
regions and other parts of the state, adults living in the state’s large urban areas are more likely to create
visual arts, while those living outside of these areas are more likely to make textile-based art, such as
weaving, crocheting, quilting, needlepoint, knitting, or sewing.
In general, Non-Hispanic Whites report participating in art at the highest rates. Yet, educational
attainment, age, income, immigrant status, and living in metropolitan areas in California are more
important in explaining arts participation than race or ethnicity. However, even after accounting for these
socio-demographic factors, some differences by race/ethnicity persist:
■ Non-Hispanic Asian/Pacific Islander adults are less likely to access arts using electronic media, attend
arts events, and make or share art compared to Non-Hispanic Whites
■ Hispanic adults are less likely to take art lessons or classes compared to Non-Hispanic Whites
■ Blacks/African-Americans participate at the highest rates in social dance compared to any other
SPPA measure. Even after controlling for other socio-demographic variables, Non-Hispanic
Blacks/African-Americans are more likely than Non-Hispanic Whites to dance socially.
Education and age are significant predictors of differences for multiple kinds of arts participation
measured in the 2012 SPPA:
■ One’s level of education is the strongest explanatory factor for differences in rates across all arts
participation measures. Having at least a college degree is the single strongest predictor of whether
one participates in the arts.
■ Youth (18-24) and Seniors (65-74) generally engage in arts at higher rates than those of other ages.
However, the odds of engaging in the most active forms of participation – making art and sharing art
electronically – are lower among older age cohorts. Individuals aged 75 and older tend to participate
in arts at the lowest rates of all adults.
Higher levels of household income and nativity (whether or not a person was born in the US) are
important predictors of arts attendance:

NORC | A Closer Look at Arts Engagement in California: Insights from the NEA’s Survey of Public Participation in the Arts
4
■ Immigrants are less likely to attend arts events, even after controlling for the influence of socio-
demographic factors. Immigrants comprise almost 30% of California’s population.3
■ Individuals with household incomes of $75,000 or more have higher odds of attending arts events,
especially arts events that take place in theaters, concert halls, and auditoriums.
The most popular venue, as measured in the 2012 SPPA, for adults in California to attend arts is a park or
open-air facility (18%). However, 25% of adults in California attended arts events in spaces other than
those enumerated by the 2012 SPPA, which included community centers, schools and colleges, places of
worship, restaurants, theaters, and art museums.4

NORC | A Closer Look at Arts Engagement in California: Insights from the NEA’s Survey of Public Participation in the Arts
5
The Changing Landscape of Arts Participation
California’s cultural sector is undergoing massive change, with consequences for the ways in which
individuals experience art and for the ways in which organizations and artists deliver their artistic
products and engage with people. Dramatically shifting demographics, rapid technological advances that
offer new opportunities for artistic expression, and changing expectations about the structure of work and
leisure time experiences are all forces that are reshaping arts participation and the landscape of the
cultural sector.
California is at the forefront of the US’s historic demographic shift toward becoming a ‘majority-
minority’ society by the early 2040s, meaning that for the first time in US history the Non-Hispanic
White population will make up less than half of the nation’s population. California was confirmed as a
‘majority-minority’ state after the 2000 Census and, in 2014, California experienced a historic shift when
the size of the Hispanic population surpassed that of Non-Hispanic Whites; Latinos now have a plurality
in the state.5 California is home to more immigrants than any other state with immigrants comprising
almost 30% of the state’s population, double the portion in the US population.6 Given the diversity of the
California population, it is not surprising that artistic forms and practices that are meaningful sources of
creative expression have expanded and diversified as well. The rapid technological advances of our era,
which have provided many new means of consuming, interacting with, and creating art, have contributed
to a cultural landscape that is more varied, as well as more intertwined and embedded in daily life, than
ever before.
Over the last three decades, the term arts participation has essentially been understood as arts attendance
within the non-profit arts field. The field’s key indicator of arts participation over this time has been
attendance at any of the seven “benchmark” arts events – performances of ballet, musical and nonmusical
theater, jazz, classical music, opera, and visiting an art museum – at least once during the previous 12-
month period. This indicator stems from the National Endowment for the Arts’ Survey of Public
Participation in the Arts (SPPA), which is the only long-standing, national source of data on arts
participation in the US. Begun in the early 1980s with a focus on tracking the health of the nonprofit arts
organizations in the NEA’s funding portfolio, the SPPA emphasized arts audience attendance.7
Since 2002, rates of attendance at benchmark arts in California have steadily declined.8 Even attendance
at a wider range of arts events, extending beyond the benchmark arts, fell ten percentage points between
2002 and 2012 in California. Over the same time, despite socio-demographic changes within the state,
arts audiences in California remained disproportionately drawn from the population with higher incomes

NORC | A Closer Look at Arts Engagement in California: Insights from the NEA’s Survey of Public Participation in the Arts
6
(in 2012, 49% of arts attendees had household incomes of $75,000 or more compared to 41% of
Californian households) and higher levels of education (in 2012, 41% of arts attendees had at least a
college degree compared to 31% of California’s population). Despite California’s historic shift in 2014,
with Hispanics surpassing Non-Hispanic Whites as the largest portion of the state’s population, adult arts
audiences remain 55% Non-Hispanic White even though they only comprise 43% of the state’s adult
population, and 40% of the state’s overall population.9 Additionally, previous studies have documented
that people who identify as Non-White participate at higher rates in forms of arts participation other than
attendance, and have noted that attendance measures do not adequately capture how these populations
engage in art. Given California’s shifting demographics, the focus on arts attendance disproportionately
focuses attention on how one segment of the population tends to participate in arts.
How people are engaging with arts in forms both familiar and new has implications for how organizations
share their expertise and deliver their artistic products. The cultural sector’s understanding of arts
participation can no longer rely on measures of arts attendance alone. Given this, the questions that need
to be answered now are: how are adults in California participating in arts? How does that participation
vary across California’s increasingly diverse population?
This report takes a first step toward answering these questions. It is the first in a two-part study
commissioned by the James Irvine Foundation to document the ways in which California’s residents
participate in the arts and, importantly, how that varies across the state’s diverse population. To inform
these questions, this report uses data from the National Endowment for the Arts’ 2012 Survey of Public
Participation in the Arts. The 2012 SPPA underwent the most extensive update in its history in an effort
to capture a broader spectrum of ways that people engage with arts than it has ever before. This report
provides the first in-depth look at arts participation on the state-level, making use of the 2012 SPPA’s
new, larger sample size.
Data & Analysis Methods
The National Endowment for the Arts’ Survey of Public Participation in the Arts (SPPA) has served as
the primary source of data on adult participation in the arts in the US since 1982. The SPPA is
administered approximately every five years, with the most recent data collected in 2012. The survey was
administrated to a nationally representative sample of individuals aged 18 or older as a supplement to the
July 2012 Current Population Survey, which was conducted by the US Census Bureau. The NEA doubled
its national sample – from 18,444 in 2008 to 35,735 in 2012, the largest national SPPA sample yet –
permitting a more nuanced look at arts participation at the state level and, for states with adequate data, a

NORC | A Closer Look at Arts Engagement in California: Insights from the NEA’s Survey of Public Participation in the Arts
7
look at differences within states as well. The 2012 SPPA sample in California is 2,793, the largest state-
level subsample within the SPPA, and serves as the basis of this report.10
Between the 2008 and 2012 data collections, the SPPA survey instrument underwent its most extensive
changes to date. Changes were made in an effort to update the survey so that it would better represent the
many ways people engage with arts in contemporary society; but the survey also maintains comparability
with previously collected data in order to enable trend analysis. For example, the revised 2012 SPPA
includes new questions about attending film festivals; attending literary or storytelling events; identifying
the types of venues where people go to see performances or exhibitions; and sharing art (one’s own or
others’) by posting it online. Most questions asked in the SPPA consider arts participation occurring
within the 12 months preceding data collection. However, the SPPA also includes questions about arts
learning and attendance during childhood, and we examine both types of questions.
In this report, we address how adults in California are participating in arts and how that participation
varies across California’s increasingly diverse population by estimating rates of participation for
California as a whole and across subpopulations. These estimated rates are available in Table 9 in the
Appendix. Additionally, we look at the net effects of a range of socio-demographic characteristics and the
extent to which these characteristics explain differences in how Californian adults participate in arts. To
do this, we use multivariate logistic regression, controlling for the influence of race and ethnicity, gender,
living within a metro area, education level, income, age, immigrant status and, if foreign born, the number
of years spent living in the US.11
Conceptual Frames
Different conceptual frames offer ways of describing and categorizing arts participation behavior. The
SPPA has used “modes” to describe the primary categories of arts participation it has traditionally
measured: live attendance, live personal creation and performance-based activities, and media-based
engagement with arts.12 In the past, the media-based engagement solely emphasized consumption, but the
2012 SPPA asked new questions about sharing art online, and creating art online or by using mobile
devices. The NEA describes the 2012 SPPA as measuring five modes of arts participation: arts
attendance, reading books and literature, arts consumption through electronic media, art-making and art-
sharing, and arts learning. Figure 1 shows Californian adults’ rates of participation in each of the SPPA’s
general modes, as well as a more specific measure of sharing art online.

NORC | A Closer Look at Arts Engagement in California: Insights from the NEA’s Survey of Public Participation in the Arts
8
Figure 1: CA Adults’ Rates of Arts Participation, by Mode of Participation
13
Californian adults engaged in arts at higher rates than other American adults, with the exception of
reading books and literature, which is equivalent to the rate for the US as a whole. Even after controlling
for differences between California and the rest of the US in terms of socio-demographic composition, the
odds of a California adult engaging in arts were approximately 5% higher than those for other adults in
the US.14
Organization of the Report
As explored in Getting in on the Act: How Arts Groups are Creating Opportunities for Active
Participation, audiences can simply be present at an event to see and take in art (“receptive audience
involvement”), but they can also be active creative contributors to and participants in the final artistic
product while attending (“participatory involvement”). The latter form of involvement redefines what
“audience” has traditionally meant. The audience involvement spectrum builds on a framework originally
conceived to conceptualize arts participation, writ large.15 We apply the movement along the spectrum
from “receptive” involvement to “participatory” – which ranges from sharing, learning, and building upon
others’ artistic work to creating completely original creative work – as a guiding principal for how we
present findings from the SPPA data in this report. In the following report sections, we examine
Californians’ arts participation rates through attendance at arts events and activities, through the
10%
45%
53%
54%
56%
77%
0% 20% 40% 60% 80% 100%
Arts Learning throughClasses or Lessons
Art-Sharing through Electronic Media
Visual and Performing Arts Attendance
Art-Making or Art-Sharing
Reading Books & Literature
Arts Consumption through Electronic Media
Topline Statistics: CA Adults' Rates of Arts Participation, by Mode of Participation

NORC | A Closer Look at Arts Engagement in California: Insights from the NEA’s Survey of Public Participation in the Arts
9
consumption of arts via electronic media, through reading, through sharing art through electronic means,
through arts learning, and through active participatory involvement in making and doing art.

NORC | A Closer Look at Arts Engagement in California: Insights from the NEA’s Survey of Public Participation in the Arts
10
“Receptive” Arts Participation
Receptive, or consumptive, forms of arts participation are those where audiences watch or take in the
completed works of others. Overall, the 2012 SPPA shows that modes of receptive arts participation are
the most common among Californian adults. Over three-quarters (77%) consumed art through electronic
media, with the majority using TV or radio to access arts content; over half (56%) read books or literary
works; and over half (53%) attended visual or performing arts events. In this section, we look at how
participation in each of these modes varies within California.
Key Observations
■ Higher levels of education and household incomes continue as key predictors of arts attendance.
■ In 2012, adults in California attended events and activities where they could curate their own
experience at higher rates than events that typically offer less flexibility and control over for one’s
experience.
■ Half (52%) of adult internet-users in California accessed arts content, and 71% of adult handheld or
mobile device-users accessed arts content. These rates of accessing arts among technology-users are
relatively consistent across race/ethnicity and immigrant groups; however, those who are immigrant,
US-born Hispanic, or US-born Asian use these technologies at much lower rates.
■ Immigrant adults in California are reading books and literary works at approximately half the rate of
US-born adults.
Arts Attendance
Over the past two decades, the rate at which adults in California attend the arts has been in decline.16 The
declining rate holds for attendance at benchmark arts events,17 as well as attendance defined more
broadly.18 Rates of adults’ attendance at benchmark arts events declined from 44% in 2002 to 38% in
2012; attendance defined more broadly fell from 58% to 48% over the same ten years.

NORC | A Closer Look at Arts Engagement in California: Insights from the NEA’s Survey of Public Participation in the Arts
11
Figure 2: Percent of Adults Attending Arts Events, 2002-2012
19
In 2012, 63% of Californian adults went to the movies, the most popular form of arts attendance
measured by the SPPA. Going to the movies was more than twice as popular as visiting an art museum,
the next most popular form of attendance-based arts participation.
Approximately one in four Californian adults attended an art museum, craft fair or visual arts festival,
historic park or monument, or outdoor performing arts festival. These types of events tend to offer people
a lot of control over their own experience during the actual event or visit: choice over what to see and do,
and degrees of flexibility as to when to arrive and depart or whether or not to engage in different aspects
of the event. These events can be considered “destination” activities, meaning that they offer flexibility by
virtue of more flexible or longer hours and mobility while attending. In contrast, the other attendance
activities that rank lower in Table 1, tend to be “event” activities that typically have precise start and end
times and a set program.20 Overall, more Californians went to events that tended to offer more control and
flexibility over their experience.
58%
52%
48%
44%42%
38%
35%
40%
45%
50%
55%
60%
2002 2008 2012
Percent of CA Adults Attending Arts Events, 2002-2012
Attendance (all comparable) Benchmark Arts

NORC | A Closer Look at Arts Engagement in California: Insights from the NEA’s Survey of Public Participation in the Arts
12
Table 1: Ranking of CA Adult Rates of Attending Arts Events & Activities21
Ranking of CA Adult Rates of Attending Arts Events & Activities
(did at least once during 12 months)
Movie-going 63.1%
Art museum 26.7%
Craft fair or visual arts festival 25.0%
Historic park or monument 24.9%
Outdoor performing arts festival 24.5%
Musical play 16.8%
Any other music or dance performance 12.8%
Non-musical play 10.3%
Live Latin, Spanish, or salsa music 9.5%
Live classical music 8.6%
Live jazz 8.2%
Dance (other than ballet) 6.1%
Live book reading or a poetry or story-telling event 4.7%
Film festival 3.6%
Live ballet 2.9%
Live opera 2.7%
Overall, Non-Hispanic Whites attended visual and performing arts at a higher rate (63%) than other race
and ethnicity groups; 22 the rate of visual and performing arts attendance for Hispanics, Non-Hispanic
Asian/Pacific Islanders, and African Americans each approximately 45% (Table 9). However, after
controlling for the influence of other socio-demographic variables, we find that the differences seen in
attendance rates by race/ethnicity are largely explained by:
■ Higher levels of education. The higher one’s education is, the higher his/her chances are of attending
arts events. The chances of attending are highest for those with at least a college degree.
How do we understand movie-going? Like “event” activities, movies are typically a commitment of a couple
hours to watch a set program. From this perspective, movie-going might most be like going to see theater. In
contrast to the high rate of movie-going, however, only 21% of Californian adults attended live theater at all
(musical or nonmusical). But, going to the movies can also be like “destination” activities today. With the rise of
multiplexes, many movie -theaters offer a range of start times throughout the day and evening, every day of the
week. Larger complexes often have a range of movies on offer at any given time, so one could go to the complex
to see a specific film at a set time or decide once they arrive what they are most interested in seeing.

NORC | A Closer Look at Arts Engagement in California: Insights from the NEA’s Survey of Public Participation in the Arts
13
■ Higher household incomes. People with household incomes of $100,000 or more have higher chances
of attending arts, generally, and specifically benchmark arts events.
■ Identifying as an immigrant. Immigrant adults are less likely to attend visual and performing arts.
This is of particular importance to California given that almost 30% of the state’s population is
immigrant, the largest portion of immigrants of any state, and is twice the national population rate
(13%).
A greater portion of Californian adults living in the state’s metro regions attended benchmark arts than
those living outside the large metro regions (41% vs. 33%). These regions also tend to have the highest
densities of non-profit arts organizations,23 suggesting that issues of access may also be affecting the rates
of participation. Attendance rates are significantly higher for Californian adults living in the state’s urban
regions, compared to those living outside of those areas specifically for visiting art museums, touring
historic parks or monuments, and attending musical plays, classical music, and jazz performances (Figure
3). However, after controlling for variations in socio-demographic characteristics between the regions,
adults living in metro regions have 5% higher odds of attending or touring historic parks or monuments.
Figure 3: Percent of CA Adults Who Attended Arts Activities or Events, by Region
Significantly different rates only
29%27%
19%
10% 10%
22%21%
14%
7% 6%
0%
5%
10%
15%
20%
25%
30%
35%
40%
45%
50%
Art museum Historic park ormonument
Musical play Live classical music Live jazz
Percent of CA Adults Who Attended Arts Activities or Events, by Region
Metro Regions Remainder of CA

NORC | A Closer Look at Arts Engagement in California: Insights from the NEA’s Survey of Public Participation in the Arts
14
Venues for Arts Attendance
The most commonly reported venue for arts attendance in California is a park or open-air facility (18%).
Among those attending arts events, however, immigrants report attending arts events at parks or open-air
facilities, art museums or galleries, theaters, and other locations at significantly lower rates than US-born
adults living in California (Figure 4). A notable difference is that one-third (34%) of US-born Asians
attended arts at a restaurant, bar, nightclub, or coffee shop, but only 5% of Asian immigrants reported
doing so.
Figure 4: Percent of CA Adults Who Saw an Art Exhibit or Attended a Performing Arts Event, by Venue Type
Rates reported for US-Born and Foreign born where there are significant differences
Californian adults living in the state’s large metro regions report a higher rate of arts attendance at
restaurants, bars, nightclubs, and coffee shops compared to adults living outside the metro regions (16%
vs. 8%). However, a quarter of Californian adults (25%) attended arts events at venues and spaces other
than those measured by the SPPA; 15% of Californian adults reported attending benchmark arts events in
2%
7%
5%
9%
11%
11%
15%
16%
15%
21%
6%
7%
7%
25%
0% 10% 20% 30%
Community center
Church, synagogue or other place of worship
Elementary, middl,e or high school
College or university campus
Restaurant, bar, nightclub, or coffee shop
Theater, concert hall, or auditorium
Art museum or gallery
Park or open-air facility
Other
Percent of CA Adults Who Saw an Art Exhibit or Attended a Performing Arts Event,by Venue Type
All California Adults US-Born, CA Adults Foreign Born, CA Adults

NORC | A Closer Look at Arts Engagement in California: Insights from the NEA’s Survey of Public Participation in the Arts
15
spaces other than those enumerated by the SPPA.24 Overall, 17% of Californian adults attended free
music, theater, or dance performances in 2012.
Where are California’s adults attending arts events? More detail on where Californian adults engage in specific
kinds of arts and cultural participation is a key dimension of participation investigated in the second part of this study.
The California Survey of Arts & Cultural Participation captures information on where Californian adults engage in
different types of arts participation – where they attend events, as well as where they create and actively engage in
art themselves. Prior research conducted in California’s Inland Regions shows that the home is an important space,25
and we investigate the use of private spaces, including one’s own or a friend’s home to engage in arts.
Arts Consumption through Electronic Media
In 2012, a larger share of Californian adults consumed arts through electronic media than any other form
of arts participation. Over three-quarters (77%) of Californian adults consumed arts through TV or radio,
a handheld or mobile device, online, or by using a DVD, CD, tape, or record player at least once during
the twelve months covered by the survey.
Figure 5: Percent of CA Adults Who Consumed Arts through Electronic Media, by Type of Media
28%
37%
40%
59%
0% 10% 20% 30% 40% 50% 60% 70%
DVD, CD, tape or record player
Internet
Handheld or mobile device
TV or radio
Percent of CA Adults Who Consumed Arts through Electronic Media, by Type of Media

NORC | A Closer Look at Arts Engagement in California: Insights from the NEA’s Survey of Public Participation in the Arts
16
The largest share of Californian adults (59%) used TV or radio to access art. TV and radio are particularly
important to California’s Hispanic and Non-Hispanic Black/African-American populations, with access to
the arts through TV or radio being almost 30% greater than for any other form of electronic media.
Immigrants in California access arts through electronic means at a rate that is 12% lower than that of the
state’s US-born residents and a rate that is almost 20% lower for accessing arts through handheld or
mobile devices or through the Internet.
Table 2: Percent of CA Adults Accessing Arts using Electronic Media, by Race/Ethnicity & Nativity
TV or radio Handheld or
mobile device Internet
DVD, CD, tape, or record
player
All CA Adults 59% 40% 37% 28%
US-Born 64% 47% 44% --
Immigrant 50% 29% 25% --
White, Non-Hispanic 64% 47% 46% 28%
Hispanic 61% 32% 26% 26%
US-Born -- 46% 37% --
Immigrant -- 21% 18% --
Asian/Pacific Islander, Non-Hispanic 32% 41% 34% 33%
US-Born 54% 71% -- --
Immigrant 28% 35% -- --
Black/African-American, Non-Hispanic 75% 33% 46% 38%
^ Rates for US and Immigrant are reported when there are significant differences at p ≤ .10 between the groups
Connectivity & Mobility – Are they the same? Of the modes of arts participation measured by the SPPA, arts
participation via electronic media has been revised in each iteration of the survey in effort to keep pace with
rapidly evolving technology. One such evolution is the growth of using cell phones and other mobile devices to
connect to the Internet. According to a 2013 study by the Pew Research Center, 57% of all American adults now
use a cell phone to access the Internet and approximately one-third of these users primarily access the Internet
using cell phones. The study finds that those aged 18-29, Non-Whites, and those with relatively low income and
education levels are the most likely to primarily access the Internet using cell phones (Duggan & Smith, 2013).
The SPPA, however, does not specify the kind of device used to access arts on the Internet, nor is the use of a
mobile device to consume arts synonymous with Internet use. Of those who reported using the Internet to access
arts, 71% also reported using a handheld or mobile device to consume arts. Of those adults in California who did
not report using the Internet to access arts, 23% reported that they used a handheld or mobile device to watch or
listen to arts content. Survey questions will evolve as technology, and the role it plays in our lives, evolves.

NORC | A Closer Look at Arts Engagement in California: Insights from the NEA’s Survey of Public Participation in the Arts
17
Controlling for socio-demographic differences, Asian/Pacific Islanders are 31% less likely than Non-
Hispanic Whites to access arts using the TV or radio. Accessing arts using a DVD or CD player, record
player, or tape player to watch or listen to arts is important to those with low household incomes.26
Half (52%) of adult Internet-users in California accessed arts content, and 71% of adult handheld or
mobile device-users accessed arts content (Table 3). The ability to choose when and how to participate is
central to this medium. There are relatively small differences in rates when looking across race and
ethnicity groups; however, there are significant disparities in the rates of accessing art through
handheld/mobile devices and the Internet across race and ethnicity groups in California. Hispanics report
the lowest rates of access, with 45% accessing art through a handheld/mobile device and 55% using the
Internet at all during the prior twelve months. Immigrant adults who have lived in the US for less than
five years are the most likely to access arts via the Internet; their odds of doing so are 12% higher than
US-born Californian adults.
Table 3: Proportions of Handheld/Mobile & Internet Users Accessing Arts, by Race/Ethnicity
HANDHELD OR MOBILE DEVICE INTERNET
% Adults using during
prior 12 months
% Users accessing
arts
% Adults using during
prior 12 months
% Users accessing
arts
All CA Adults 57% 71% 72% 52%
White, Non-Hispanic 65% 73% 81% 57%
Hispanic 45% 72% 55% 49%
Asian/Pacific Islander, Non-Hispanic 62% 66% 82% 42%
Black/African American, Non-Hispanic 58% 57% 77% 60%
A greater portion of adults living outside the large metro regions accessed art through TV or radio,
compared to those living inside the metro regions (68% vs. 53%). After controlling for socio-
demographic factors, adults living outside the metro regions have 12% higher odds of accessing art via
TV or radio. Adults under age 35 are the most likely to use the Internet or to use mobile devices to access
arts content; overall, age does not predict the use of TV or radio to access the arts.

NORC | A Closer Look at Arts Engagement in California: Insights from the NEA’s Survey of Public Participation in the Arts
18
Reading Books & Literature
In 2012, 56% of adults in California engaged in voluntary reading, which is defined in the SPPA as
reading literature or reading books that are not required for work or school, including novels or short
stories, poetry, and plays. Forty-three percent of adults in California read literary works during the same
period, a significantly lower proportion than the national rate of 47%. California’s lower rate of literary
reading is largely accounted for by California’s lower rate of reading novels or short stories, 41% of
Californian adults compared to 45% of US adults. Within the state, there are wide disparities between the
rates at which Californian adults read – the portion of US-born adults who read voluntarily is
approximately double the portion of immigrant adults.
Figure 6: Percent of Adults Who Read Books or Literary Works, by Race/Ethnicity & Nativity
Immigrant adults in California are 15% less likely to read books or literary works, even after controlling
for differences in socio-demographic characteristics, including education. Increasingly higher levels of
educational attainment significantly predict higher reading rates among Californian adults.
Californian adults living outside the large metro regions are 15% more likely to read voluntarily than
those residing in the metro regions, even after controlling for differences in socio-demographics. In
general, Californians read books and literature at the same level as adults across the US. However,
Californians report reading novels and short stories at a lower rate (41%) than the US as a whole (45%).
58%
45%
67%
27%
58%
52%
71%
0% 10% 20% 30% 40% 50% 60% 70% 80%
Black/African-American, NonHispanic
Foreign-Born
US-Born
Foreign-Born
US-Born
Foreign-Born
US-Born
Asia
n/P
acific
Isla
nder
His
panic
White
Percent of Adults Who Read Books or Literary Works, by Race/Ethnicity & Nativity

NORC | A Closer Look at Arts Engagement in California: Insights from the NEA’s Survey of Public Participation in the Arts
19
“Participatory” Arts Participation
We are currently living in a participatory culture wherein people have come to expect that they will
connect, contribute, and create through the arts. Participatory arts can include a range of activity that
varies in the degree to which an individual contributes his or her own creative energy. The SPPA asks a
series of questions about how people share art electronically, engage in arts learning, and actively join in
the making and doing of art.
Key Observations
■ People in younger age cohorts are more likely to engage in participatory arts, generally.
■ Higher levels of educational attainment predict increasingly greater odds of sharing art electronically.
■ Household incomes – both lower ($30-39,999) and higher ($75,000+) – predict participation in art-
making.
■ Asian/Pacific Islanders report significantly low levels of active art-making, even after controlling for
socio-demographic factors
■ Hispanics report the lowest levels of taking arts lessons or classes amongst all race/ethnicity groups,
and this significant difference persists after controlling for socio-demographic factors
Art-Sharing using Electronic Media
Almost half (45%) of adults in California shared art through electronic media; sharing photography and
music were the most commonly shared forms of art.
Table 4: Ranking of Adult Participation Rates in Art-Sharing using Electronic Media
Ranking of Adult Participation Rates in Art-Sharing using Electronic Media
(e-mailed, or posted or shared online)
photography 27.9%
music 26.2%
one's own photography 18.4%
film or videos 17.9%
other visual art 7.4%
dance 5.9%
poetry, short stories, novels, or plays 5.8%
one's own visual arts 4.8%
one's own films or videos 3.1%

NORC | A Closer Look at Arts Engagement in California: Insights from the NEA’s Survey of Public Participation in the Arts
20
Ranking of Adult Participation Rates in Art-Sharing using Electronic Media
(e-mailed, or posted or shared online)
one's own poetry, short stories, novels, or plays 2.8%
one's own scrapbooking 2.6%
one's own music 2.6%
one's own dance 0.1%
After controlling for variations by socio-demographic composition, higher levels of educational
attainment predict greater likelihoods of sharing art online, and increased age predicts lower likelihoods
of sharing art online.
Overall, Californians living in the state’s more urban regions reported higher rates of sharing art through
electronic means. Specifically, these adults shared photography, visual art, dance, and creative writing
(poetry, short stories, novels, or plays) at significantly higher rates than Californians living in the
remainder of the state.
Figure 7: Percent of Adults Who Shared Art through Electronic Media, Significant Differences by Region
Significantly different rates only
31%
9%8% 7%
24%
5%3% 4%
0%
5%
10%
15%
20%
25%
30%
35%
photography other visual art dance poetry, short stories,novels, or plays
Percent of Adults Who Shared Art through Electronic Media, Significant Differences by Region
Metro Regions Remainder of CA

NORC | A Closer Look at Arts Engagement in California: Insights from the NEA’s Survey of Public Participation in the Arts
21
Engaging in Arts through Support for the Arts
In addition to making, sharing, attending, and consuming art, the SPPA includes several questions about being engaged by supporting the arts through various means. In 2012:
● 12% of CA adults donated money, goods, or services to an arts or cultural organization
● 8% purchased or acquired art
● 7% are members of, or subscribe to, an arts or cultural organization
Non-Hispanic Whites do each of these activities – donate, purchase or acquire art, and subscribe to an arts or cultural organization – at statistically significant higher rates compared to other race/ethnic groups:
● 19% of CA White, Non-Hispanic adults donated money, goods, or services to an arts or cultural organization (compared to 6% of Hispanics)
● 12% purchased or acquired art (compared to 5% of Hispanic and 3% of Non-Hispanic Asian/Pacific Islander)
● 14% subscribed to an arts or cultural organizations (compared to 2% of Hispanics and; 6% of Non-Hispanic Asian/Pacific Islanders)

NORC | A Closer Look at Arts Engagement in California: Insights from the NEA’s Survey of Public Participation in the Arts
22
Arts Learning
In 2012, 10% of adults in California reported taking arts classes or lessons in the previous 12 months,
which is a greater portion than in the US population as a whole (7%). Hispanics are 6% less likely than
Non-Hispanic Whites to have taken classes during the prior year after controlling for socio-demographic
factors. Those aged 35-64 or 75 or older also had lower chances of having taken arts classes or lessons
(Figure 8). As is true for most measures of arts participation, higher levels of educational attainment also
predict higher rates of having taken art classes.
Figure 8: Percent of Adults Taking Art Classes or Lessons in Prior in 12 Months, by Age
20%
12%
7% 6% 7%
16%
5%
0%
5%
10%
15%
20%
25%
30%
18-24 25-34 35-44 45-54 55-64 65-74 75+
Percent of Adults Taking Art Classes or Lessons in Prior 12 Months, by Age

NORC | A Closer Look at Arts Engagement in California: Insights from the NEA’s Survey of Public Participation in the Arts
23
Looking at how Californians have ever engaged in arts-learning as measured by the SPPA, the most
commonly learned form is making music – 63% of Californian adults report having learned how to sing
or play an instrument through classes or lessons, or through other means, sometime in their life. Almost
half (46%) of all Californian adults have learned arts outside of formal classes or lessons during their
lifetime, with almost 1 in 4 adults learning how to sing or play an instrument, or to dance, through other
means. Such high rates of arts learning beg more questions about how and when during their lives they
learned, and how being involved in arts learning outside of more formal lessons or classes influenced or
continues to shape whether and how they participate in the arts through other modes.
Figure 9: Percent of CA Adults Who Ever Engaged in Arts Learning, by Learning Format
8%
14%
17%
17%
21%
24%
25%
39%
5%
19%
16%
8%
22%
15%
12%
24%
0% 10% 20% 30% 40% 50% 60% 70%
Theater
Photography or filmmaking
Music appreciation
Creative writing
Dance
Art appreciation or art history
Visual Arts
Voice-training/Playing Instrument
Percent of CA Adults Who Ever Engaged in Arts Learning, by Learning Format
Ever taken class or lesson Ever learned through other means

NORC | A Closer Look at Arts Engagement in California: Insights from the NEA’s Survey of Public Participation in the Arts
24
For those adults who took arts classes or lessons, the majority took them in childhood. However,
Californian adults also report starting to learn an artistic form through classes in adulthood; this is
especially true for art appreciation and photography and filmmaking (Figure 10).
Figure 10: Percent of CA Adults Who Ever Took Arts Lessons or Classes, Whether In Childhood or Only as an Adult
Californians who took classes or lessons during childhood may have done so in or out of school,
depending on the artistic form itself. Most Californians who took classes in childhood learned how to sing
or to play an instrument. In addition to asking the question about childhood arts education, the 2012
SPPA included new questions about childhood arts attendance: 57% of Californian adults reported that
they attended an art museum or gallery before the age of 18, and 58% reported that they attended a live
music, theater, or dance performance as a child.
7%
7%
10%
11%
14%
13%
18%
35%
1%
7%
7%
6%
7%
12%
7%
5%
0% 10% 20% 30% 40%
Theater
Photography or filmmaking
Music appreciation
Creative writing
Dance
Art appreciation or art history
Visual Arts
Voice-training/Playing Instrument
Percent of CA Adults Who Ever Took Arts Lessons or Classes, Whether In Childhood or Only as an Adult
In childhood Only as an adult

NORC | A Closer Look at Arts Engagement in California: Insights from the NEA’s Survey of Public Participation in the Arts
25
Figure 11: Percent of CA Adults Who Ever Took Arts Lessons or Classes, Whether In or Out of School
Art-Making & Art-Sharing
In 2012, 54% of Californian adults engaged in art-making or art-sharing.27 The most commonly reported
art-making activity in California is social dancing (36%). Non-Hispanic Blacks/African-Americans
participate at the highest rates in social dance compared to any other SPPA measure. Even after
controlling for other socio-demographics, Non-Hispanic Blacks/African-Americans are 24% more likely
than Non-Hispanic Whites to dance socially; Non-Hispanic Asian/Pacific Islanders are 17% less likely to
dance socially. Overall, Hispanics and Asian/Pacific Islanders engaged in art-making and art-sharing
activities at lower rates than Non-Hispanic Whites and Non-Hispanic Black/African-Americans. After
controlling for differences attributable to socio-demographic characteristics, Non-Hispanic Asian/Pacific
Islanders remain 23% less likely than Non-Hispanic Whites to participate in art making as measured in
the SPPA. Educational attainment of at least some college experience is a significant positive predictor of
engaging in art-making, while older ages generally predict significantly lower odds of art-making.
6%
9%
13%
14%
6%
22%
15%
17%
1%
3%
2%
1%
10%
1%
3%
9%
2%
2%
2%
2%
5%
2%
7%
13%
0% 10% 20% 30% 40%
Theater
Photography or filmmaking
Music appreciation
Creative writing
Dance
Art appreciation or art history
Visual Arts
Voice-training/Playing Instrument
Percent of CA Adults Who Ever Took Arts Lessons or Classes, Whether In or Out of School
in school out of school both

NORC | A Closer Look at Arts Engagement in California: Insights from the NEA’s Survey of Public Participation in the Arts
26
Table 5: Ranking of CA Adult Participation Rates in Art-Making & Art-Sharing Activities
Ranking of CA Adult Participation Rates in Art-Making & Art-Sharing Activities
Did social dancing 36.0%
Created photographs for artistic purposes 16.0%
Did weaving, crocheting, quilting, needlepoint, knitting, or sewing 14.6%
Edited photographs 13.8%
Played a musical instrument alone or with others 13.7%
Sang, either alone or with others 9.0%
Created leatherwork, metalwork, or woodwork 8.8%
Created visual art 7.7%
Did scrapbooking 6.8%
Created or performed music 6.6%
Practiced or performed dance 6.6%
Did creative writing 6.5%
Created pottery, ceramics, or jewelry 6.2%
Recorded, edited, or remixed music 5.6%
Created films or videos as an artistic activity 4.7%
Used a computer, a handheld or mobile device, or the Internet to create visual art 4.4%
Edited or remixed films or videos 3.5%
Participated in a book club or reading group 3.2%
Used a computer, a handheld or mobile device, or the Internet to create music 2.3%
Taught any art classes or lessons 2.3%
Practiced or performed classical music 2.3%
Practiced or performed choral music, or sang in glee club or choir 2.2%
Created or performed dance 2.0%
Did acting 1.9%
Practiced or performed Latin, Spanish, or salsa music 1.4%
Practiced or performed jazz 1.0%
Recorded, edited, or remixed dance performances 1.0%
Practiced or performed opera 0.5%
Practiced or performed a musical or non-musical play 0.4%
28
In 2012, the SPPA asked two new questions about whether one makes art on one’s own or with others. Of
Californian adults who played a musical instrument during the prior 12 months, the majority (58%) did so
on their own. In contrast, 87% of Californian adults who performed or practiced singing during the prior
12 months did so with others.29
Even after controlling for socio-demographic differences in and outside the large metro regions, those
living outside of the large metro regions are 8% more likely to engage in textile art-making, including
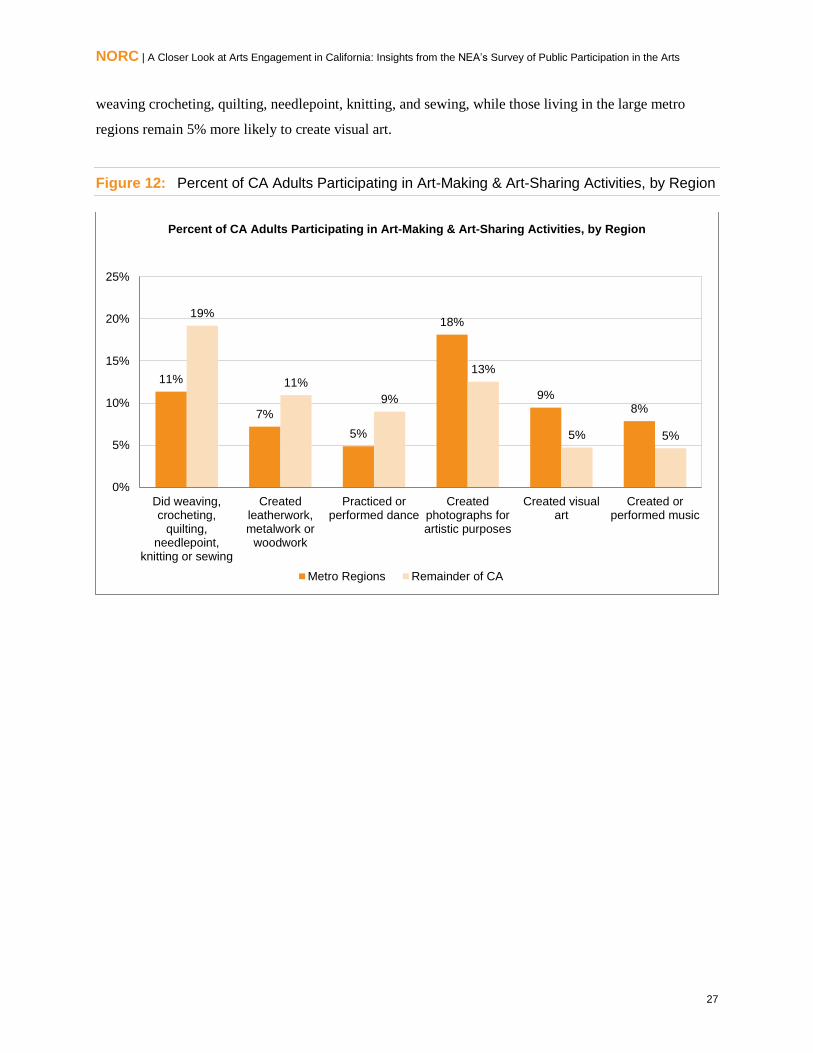
NORC | A Closer Look at Arts Engagement in California: Insights from the NEA’s Survey of Public Participation in the Arts
27
weaving crocheting, quilting, needlepoint, knitting, and sewing, while those living in the large metro
regions remain 5% more likely to create visual art.
Figure 12: Percent of CA Adults Participating in Art-Making & Art-Sharing Activities, by Region
11%
7%
5%
18%
9%8%
19%
11%
9%
13%
5% 5%
0%
5%
10%
15%
20%
25%
Did weaving,crocheting,
quilting,needlepoint,
knitting or sewing
Createdleatherwork,metalwork or
woodwork
Practiced orperformed dance
Createdphotographs forartistic purposes
Created visualart
Created orperformed music
Percent of CA Adults Participating in Art-Making & Art-Sharing Activities, by Region
Metro Regions Remainder of CA

NORC | A Closer Look at Arts Engagement in California: Insights from the NEA’s Survey of Public Participation in the Arts
28
A New Look at “Arts Participation”
This report is the first in a two-part study that aims to expand how arts participation is understood and to
better understand the implications of the changing cultural landscape for the non-profit arts field and
beyond. The 2012 SPPA is the most expansive national survey on arts participation yet – expansive both
in terms of the sheer number of people surveyed, which is double that of earlier years, as well as the range
of arts participation behaviors that it asks about. However, this look at California using the 2012 SPPA
likely raises more questions than it answers, given the drastically changing nature of the state’s
demographics and rapid adoption of technology. There is more to understand about how Californian
adults engage with and experience art in order to help organizations and artists be better informed about
the implications for their artistic products and work.
The second part of the study, which will be released in March 2015, takes a new look at arts
participation. To complement data from the SPPA, which maintains much of its traditional emphasis on
arts attendance, the new Cultural Lives of Californians survey measures how people living in California
are making and doing art, as well as their engagement in a broad range of artistically and aesthetically
creative activity that Californians themselves view as arts and cultural participation. The new data will
enable an even fuller and richer understanding of how adults in California are encountering, engaging
with, and participating in art.
Defining “Arts Participation”
Recognizing that we need to know much more about the range of artistic and aesthetically creative
activities that defines participation requires us to expand our thinking about what counts – pushing
ourselves to think more about how people engage in artistic or creative expression as opposed to how
they ‘participate’ in art, which often implies a Western, high-art frame of reference for what gets counted.
The second part of this study therefore asks: What are the many ways that people engage in artistic and
aesthetic practices? How are these activities interwoven
with personal, family, and community practices? How do
people collaborate creatively in-person and virtually?
As noted earlier, the SPPA began in 1982 and was
originally developed to help monitor the health of non-
profit arts organizations, specifically as measured by
attendance at benchmark arts events. The NEA has
“We are currently observing big changes and
the rise of new cultural paradigms and
behaviour, armed with a set of research
tools elaborated in the last century and
adapted to analyse social life through a well-
defined taxonomy that is every year less
adequate for helping our understanding.”
(UNESCO Institute for Statistics 2012)

NORC | A Closer Look at Arts Engagement in California: Insights from the NEA’s Survey of Public Participation in the Arts
29
updated the SPPA’s questions over the years in an effort to better reflect changes in Americans’ cultural
consumption patterns, with the most substantial revisions to-date made in the 2012 SPPA. However,
striking the balance between adding innovative questions to reflect contemporary society and keeping
measures as they are in order to enable trends analyses over time is a challenge. This challenge is not
unique to the US; the charge to develop research tools that reflect the new cultural paradigms and
participatory ethos has been issued internationally.30 Capturing information on more types of behaviors
that involve engaging in art also opens the questions of where do people engage in artistic practices?; is
their engagement a regular part of their life?; and what do people like to do?
Including More Forms of Art
The ways in which we describe and understand digital technologies as new means of consuming,
interacting with, and creating art are evolving as technology continually changes.31 The ability to choose
when and how to participate is central to this medium.32 This implies that media consumers control their
consumption and production; therein lies the definition of online participatory culture. While much is still
evolving, we already know that digital technologies are enabling new forms of art. For instance, platforms
such as online gaming, crowd-sourced art, writing and posting fan-fiction, and sharing YouTube content
(either self-created or otherwise) are forms of online cultural and arts participation. How people create
and consume art through and because of technology will be of increasing importance in the future.
There are a large number and variety of folk arts in which people across the US take part, though they
have not traditionally been captured in arts participation studies because these experiences often do not
take place in connection with formal arts organizations, nonprofit or otherwise.33 Folk art and
“traditional” cultural experiences tend to revolve around activities that celebrate or pass on heritage, such
as traditional music and dance, ceremonial occasions, and learning a community-specific art or craft, such
as Hmong embroidery or Chinese calligraphy. Family and community members pass many of these folk
arts down through the generations, and many of these activities take place within the home. For example,
an important part of traditional Hmong activity in the San Joaquin Valley, California is the private home
ceremony that involves playing the qeej, a bamboo mouth organ.
The distinctions between artistic genres are blending and blurring over time. The SPPA asks specifically
about genres within some artistic forms, such as ballet within dance, and classical and jazz within music;
but how well-understood the boundaries of these artistic genres are is not clear, either to audiences or
among artists. Art creators do not necessarily assign themselves to a genre or even a precise artistic form,
and classifications are seemingly less relevant for audiences as other dimensions of arts experiences, such
as having more control and flexibility over arts activities and experiences, come to the fore.

NORC | A Closer Look at Arts Engagement in California: Insights from the NEA’s Survey of Public Participation in the Arts
30
Setting boundaries on what gets counted
Key challenges that must be faced are the lack of consensus about what constitutes artistic or creative
expression and then which of these forms of expression are relevant for measurement purposes. Different
community aesthetics and values may determine what is artistic, and what may ‘count’ for one
community may not for another. But, due to the very nature of a survey research tool, boundaries must be
drawn around what gets asked. What counts as ‘arts participation’ for measurement purposes and what the
implications are that stem from that decision are vitally important questions we grappled with while
designing and fielding the survey for our research about the Cultural Lives of Californians. The survey is
designed to capture a broader and deeper understanding about what people do with arts, where they
engage in arts, and what role arts engagement plays in their lives. The survey also provides the
opportunity for learning about ‘what counts’ from California’s residents themselves. The James Irvine
Foundation is making an important investment in the future of the arts in California by developing and
broadening the understanding of arts participation through a survey-based data collection process with
findings that will be shared broadly.

NORC | A Closer Look at Arts Engagement in California: Insights from the NEA’s Survey of Public Participation in the Arts
31
1 Data source: National Endowment for the Arts, Survey of Public Participation in the Arts Cumulative
File, 1982-2008; and National Endowment for the Arts, Survey of Public Participation in the Arts, 2012
2 Adult population estimates for California were calculated using Annual Estimates of the Resident
Population by Sex, Age, Race, and Hispanic Origin for the United States and States: April 1, 2010 to July
1, 2012. Source: U.S. Census Bureau, Population Division.
3 Johnson and Hill (2014)
4 One possible location is the home. A. S. Brown, Novak, and Kitchener (2008) documented that the
home and places of worship are important spaces for cultural activity, particularly for non-white residents
of California’s Inland Empire and San Joaquin Valley.
5 Demographers and the California Department of Finance project that the shift to California having a
Latino plurality occurred in March 2014. Researchers expect to confirm the shift in 2015 when the U.S.
Census Bureau releases American Community Survey data from 2014.
6 American Community Survey (2011)
7 Tepper and Gao (2008, p. 26)
8 Data source: National Endowment for the Arts, Survey of Public Participation in the Arts Cumulative
File, 1982-2008; and National Endowment for the Arts, Survey of Public Participation in the Arts, 2012
9 Adult population estimates for California were calculated using Annual Estimates of the Resident
Population by Sex, Age, Race, and Hispanic Origin for the United States and States: April 1, 2010 to July
1, 2012. Source: U.S. Census Bureau, Population Division.
10 Additional information and SPPA documentation is available online:
http://arts.gov/publications/additional-materials-related-to-2012-sppa
11 Results and documentation of all analyses can be made available upon request.
12 Novak-Leonard and Brown (2011)
13 Table 7 in the Appendix provides a summary of all individual SPPA measures that are aggregated into
each general category. The general category measures if an individual did any of the individual activities
within a general category at least once between July 2011 and July 2012.
14 Conclusions are based on logistic regressions controlling for sex, race and ethnicity, living within a
large metro area within California as defined for the purpose of this report, education level, income, age,
being immigrant and, if foreign born, the number of years spent living in the US. All likelihoods used in
this report control for above-listed socio-demographic variables.
15 A. Brown (2004)
16 California percentages for all comparable measures in 2002 and 2008 originally published in Markusen,
Gadwa, Barbour, and Beyers (2011)

NORC | A Closer Look at Arts Engagement in California: Insights from the NEA’s Survey of Public Participation in the Arts
32
17 Attendance at benchmark arts is defined as having attended any of the following seven events –
performances of ballet, musical and nonmusical theater, jazz, classical music, opera, and visiting an art
museum – at least once in the prior 12 months.
18 In addition to attendance at the seven types of events included in the benchmark arts events, attendance
defined more broadly (All Comparable Attendance measures) includes measures of attendance at dance
performances (other than ballet) and craft fairs, and visiting historic parks.
19 The percentage presented in Figure 2 for attendance in 2012 is less than the percentage in Figure 1
because all of the individual attendance measures available in 2012 are not available for all years in this
trend analysis.
20 Novak-Leonard and Brown (2011)
21 The SPPA questions ask respondents to exclude elementary and high school performances for questions
about attending musical and non-musical plays; Latin, Spanish, or salsa music performances; and
performances of classical music, jazz, dance (other than ballet), ballet, and opera.
22 Table 7 details the attendance-based events aggregated for this rate.
23 Markusen et al. (2011, p. 3)
24 The question about specific venues was fielded for the first time in the 2012 SPPA. More remains to be
learned about its efficacy, as well as how well people can categorize the places where they have attended
events. Prior pilot research suggests that people can name specific places or venues, but cannot
categorize them well, for example, as a community center or restaurant.
25 A. S. Brown et al. (2008)
26 Individuals reporting household incomes of $30-39,999 used these older forms of technology to access
arts significantly more than adults in other income brackets after controlling for all other socio-
demographic variables.
27 Table 7 in the Appendix contains comparisons between California and US participation rates.
28 California-specific 2008 rates for a sample of art-making activities are available in Nichols (2009).
29 The SPPA question wording varies in how it asks these two questions: "During the last 12 months did
you play a musical instrument?” and “During the last 12 months did you perform or practice any
singing?” If a respondent answered positively, the a follow-up was asked about whether the respondent
ever did the activity with others.
30 UNESCO Institute for Statistics (2012)
31 This section of the report draws upon an extensive literature review conducted during the design phase
of the California Survey of Arts & Cultural Participation
32 Jenkins (2006)
33 Peters and Cherbo (1998); Petersen (1996); Wali, Severson, and Longoni (2002)

NORC | A Closer Look at Arts Engagement in California: Insights from the NEA’s Survey of Public Participation in the Arts
33
Technical Notes
Data
The rates for arts participation in the US as a whole were originally published in the National Endowment
for the Arts’ How A Nation Engages with Art: Highlights From The 2012 Survey of Public Participation
in the Arts (NEA Research Report #57, November 2014). The report is available online:
http://arts.gov/sites/default/files/highlights-from-2012-SPPA-revised-11-14.pdf.
In its report, the NEA aggregates subsets of individual SPPA measures to generate groupings of arts
activities and reports topline statistics. This report largely follows suit for comparing participation modes
in California to the US as a whole, and lists the individual measures for the aggregate indicators in Table
7. In some cases, the NEA’s groups are defined by virtue of the survey’s modular design.
In this report, we examine differences within the state by ethnicity and race, nativity, education, income,
age, and gender when the California-SPPA sample contains sufficient data to look at these subpopulations
with statistical confidence. The California-SPPA sample did not contain sufficient subsamples to examine
differences in rates for Native Americans or individuals who identify themselves with two or more races,
which make up about 3% of California’s population.
California's Adult Population (2011) 28,419,702
White, Non-Hispanic 43.8%
Hispanic 33.7%
Asian, Non-Hispanic 14.0%
Black/African-American, Non-Hispanic 5.6%
Other, Non-Hispanic 3.0%
Data Source: American Community Survey 2011, 1% Sample
In addition, we look at differences between California’s metropolitan regions – the Bay Area; Greater
Sacramento; and Los Angeles, Orange, and San Diego counties – and the remainder of the state.
Weights & Statistical Significance
After comparing the California subsample in the public use file for the 2012 SPPA to the American
Community Survey (ACS), we concluded that the use of additional weights could introduce additional
variance thus reducing the efficiency of our sample estimates. We therefore use the weights as provided
in the 2012 SPPA public use file. Replicate weights, also made available by the NEA, were used to

NORC | A Closer Look at Arts Engagement in California: Insights from the NEA’s Survey of Public Participation in the Arts
34
compute more reliable standard errors for all estimates in this report. Throughout this report, we discuss
differences and predictors in the text that have p-values of lesser than or equal to 10%.
Geography
Geography was split into “Large Metro Regions” and “Remainder of California.” Counties included in
the “Large Metro Regions” category are:
1. Alameda
2. Contra Costa
3. El Dorado
4. Los Angeles
5. Marin
6. Napa
7. Orange
8. Placer
9. Sacramento
10. San Diego
11. San Francisco
12. San Mateo
13. Santa Clara
14. Santa Cruz
15. Solano
16. Sonoma
17. Sutter
18. Yolo
19. Yuba
These regions comprise the Bay Area; Greater Sacramento; and Los Angeles, Orange, and San Diego
Counties and are designated in the red areas in Figure 13.
Figure 13: Map of CA Metro Regions

NORC | A Closer Look at Arts Engagement in California: Insights from the NEA’s Survey of Public Participation in the Arts
35
Summary Tables
Table 6: US and California Population Profiles
US and California Population Profiles
United States California
Total Population 311,609,369 37,686,586
SEX
Male 49% 50%
Female 51% 50%
RACE/ETHNICITY White, Non-Hispanic 63% 40%
Hispanic or Latino 17% 38%
Black or African American, Non-Hispanic 12% 6%
American Indian and Alaska Native, Non-Hispanic 1% <1%
Asian, Non-Hispanic 5% 13%
Native Hawaiian and Other Pacific Islander, Non-Hispanic <1% <1%
Other, Non-Hispanic 2% 3%
EDUCATIONAL ATTAINMENT Less than high school diploma 14% 19%
High school graduate (includes equivalency) 28% 21%
Some college or associate's degree 29% 30%
Bachelor's degree 18% 19%
Graduate or professional degree 11% 11%
FOREIGN-BORN 13% 27%
Entered 2010 or later 1% 1%
Entered 2000 to 2009 4% 7%
Entered before 2000 8% 19%
INCOME IN THE PAST 12 MONTHS
Median household income (dollars) $ 51,771 $ 59,368
AGE Under 5 years 6% 7%
5 to 17 years 17% 18%
18 to 24 years 10% 11%
25 to 34 years 13% 14%
35 to 44 years 13% 14%
45 to 54 years 14% 14%
55 to 64 years 12% 11%
65 to 74 years 7% 6%
75 years and over 6% 5%
Median age (years) 37.3 35.4
POPULATION IN CA LARGE METRO REGIONS -- 69%*
Data: 2012 ACS 3-year estimates * Calculated from 2012 ACS 3-year county population estimates

NORC | A Closer Look at Arts Engagement in California: Insights from the NEA’s Survey of Public Participation in the Arts
36
Table 7: Topline Statistics: CA vs. US Adult Rates of Participation
US California
Arts Consumption through Electronic Media 71% 77% ***
Used TV, radio, or the Internet to access art or arts programming 61% 66% ***
Music of any kind 57% 63% ***
Ballet, modern or contemporary dance or dance programs or shows 11% 14% **
Programs or information about the visual arts, books, or writers 14% 19% ***
Theater productions, such as a musical or stage play 7% 7%
Books, short stories, or novels read aloud 7% 10% ***
Opera 4% 5%
Used a handheld or mobile device to access art 38% 40%
Music of any kind 34% 39% **
Novels, short stories, or plays 16% 17%
Visual artworks such as painting, sculpture, graphic design, or photography 8% 10% **
Theater or dance performances 3% 4%
Used a DVD or CD player, a record player, or a tape player to watch or listen to music or to programs about theater, dance, visual arts, or literature 27% 28%
Movie-going 59% 63% *
Voluntary Reading 58% 56%
Books not required for work or school 55% 54%
Literary reading 47% 43% **
Novels or short stories 45% 41% **
Poetry 7% 8%
Plays 3% 3%
Art-Making or Art-Sharing 50% 54% **
Created, performed, or shared art through various activities 50% 54% **
Social dancing 32% 36% **
Weaving, crocheting, quilting, needlepoint, knitting, or sewing 13% 15%
Played a musical instrument, alone or with others 12% 13%
Sang, either alone or with others 9% 9%
Created leatherwork, metalwork, or woodwork 8% 9%
Created pottery, ceramics, or jewelry 5% 6% *
Acting 1% 2%
Performed or practiced a specific form 10% 11%
Dance of any kind 5% 7% *
Choral singing or singing in a choir or glee club 3% 2%
Classical music 2% 2%
Latin, Spanish, or salsa music 1% 1%
Jazz 1% 1%
Musical or non-musical play 1% <1%
Opera <1% 1%

NORC | A Closer Look at Arts Engagement in California: Insights from the NEA’s Survey of Public Participation in the Arts
37
US California
Visual and Performing Arts Attendance 49% 53% **
Attended a visual arts event or activity 39% 44% **
Touring a park, monument, building, or neighborhood for historic or design purposes 24% 25%
Attending a visual arts festival or crafts fair 22% 25%
Visiting an art museum or gallery 21% 27% ***
Attended a performing arts event 37% 42% ***
Outdoor performing arts festivals 21% 24% **
Musical or non-musical play 18% 21% *
Classical music; jazz; or Latin, Spanish, or salsa music 17% 21% **
Dance of any kind 7% 8%
Opera 2% 3%
Art-Sharing through Electronic Media 40% 45% ***
Photography 27% 28%
Music of any kind 21% 26% ***
Films or videos 14% 18% ***
Other visual artworks such as painting, sculpture, or graphic design 6% 7% *
Dance of any kind 5% 6%
Poetry, plays, or novels or short stories 4% 6% *
Arts Learning through Classes or Lessons 7% 10% **
*** significant at p ≤ .01, ** significant at p ≤ .05, * significant at p ≤ .10
Aggregated rates of arts participation described in the National Endowment for the Arts’ How A Nation
Engages with Art: Highlights From The 2012 Survey of Public Participation in the Arts (2014).

NORC | A Closer Look at Arts Engagement in California: Insights from the NEA’s Survey of Public Participation in the Arts
38
Table 8: Significant Odds-Ratios for General SPPA Modes of Arts Participation, within California
(1) (2) (3) (4) (5) (6) (7)
Arts Consumption
through Electronic Media
Reading
Books & Literature
Art-Making or Art-Sharing
Visual or Performing
Arts Attendance
Art-Sharing through
Electronic Media
Arts Learning through
Classes or Lessons
Attended Benchmark
Arts
Male 0.881*** 0.897*** 0.958* 0.935* 0.941***
Black/African-American, Non-Hispanic
Hispanic 0.937*
American Indian, Non-Hispanic
Asian/Pacific Islander, Non-Hispanic 0.870* 0.798*** 0.896**
2 or more races, Non-Hispanic
Resides in Metro Area 0.915*** 0.922** 0.901***
High school graduate/GED 1.126**
Some College/Assoc Degree 1.165** 1.383*** 1.294*** 1.276*** 1.228*** 1.100*** 1.248***
Bachelor's Degree 1.224*** 1.558*** 1.249*** 1.460*** 1.396*** 1.127** 1.528***
Advanced Degree 1.216** 1.700*** 1.309*** 1.537*** 1.528*** 1.177** 1.575***
$10-19.9k
$20-29.9k
$30-39.9k 1.247***
$40-49.9k 0.857**
$50-74.9k
$75-99.9k 1.173*
$100-149.9k 1.162* 1.165** 1.168**
$150k+ 1.250** 1.228*** 1.201**

NORC | A Closer Look at Arts Engagement in California: Insights from the NEA’s Survey of Public Participation in the Arts
39
(1) (2) (3) (4) (5) (6) (7)
Arts Consumption
through Electronic Media
Reading
Books & Literature
Art-Making or Art-Sharing
Visual or Performing
Arts Attendance
Art-Sharing through
Electronic Media
Arts Learning through
Classes or Lessons
Attended Benchmark
Arts
< 5 Years US residence 0.786*
5-10 Years US residence 0.830** 0.775***
>10 Years US residence 0.864*** 0.924* 0.880***
25-34 0.838*** 0.913* 0.854** 0.906*
35-44 0.883** 0.906* 0.859*** 0.914*
45-54 0.830*** 0.917* 0.825*** 0.859***
55-64 0.910* 0.736*** 0.837***
65-74 0.786*** 0.737***
75+ 0.855** 0.698*** 0.760*** 0.656*** 0.809*** 0.882**
Constant 2.154*** 1.721*** 1.747*** 1.542*** 1.573*** 1.298*** 1.249**
Observations 1797 2766 1948 2790 1820 1828 2790
R-squared 0.092 0.242 0.162 0.205 0.179 0.089 0.260
*** p<0.01, ** p<0.05, * p<0.1

NORC | A Closer Look at Arts Engagement in California: Insights from the NEA’s Survey of Public Participation in the Arts
40
Table 9: Percent of Adults Participating in General SPPA Modes of Participation, by Socio-Demographic Variables
(A) (B) (C) (D) (E) (F) (G) (H) (I)
n=
Arts Consumption
through Electronic
Media
Reading Books &
Literature
Art-Making &
Art-Sharing
Visual & Performing
Arts Attendance
Art-Sharing through
Electronic Media
Arts Learning through
Classes or Lessons
Attendance at Benchmark Arts Events
CALIFORNIA ADULTS 2,793 77% 56% 54% 53% 45% 10% 38%
+/- 4% 5% 5% 4% 4% 3% 4%
GENDER
Female 1,462 77% 62% 60% 55% 47% 12% 41%
+/- 5% 4% 5% 5% 5% 3% 4%
Male 1,331 76% 49% 48% 51% 43% 9% 34%
+/- 5% 6% 6% 5% 6% 4% 4%
RACE & ETHNICITY
White, Non-Hispanic 1,357 81% 69% 62% 63% 48% 14% 49%
+/- 5% 5% 6% 5% 6% 4% 5%
Hispanic 907 75% 42% 51% 45% 39% 5% 26%
+/- 7% 7% 8% 7% 7% 3% 5%
Asian/Pacific Islander, Non-Hispanic 346 66% 49% 40% 47% 49% 9% 38%
+/- 12% 9% 9% 10% 12% 7% 10%
African American, Non-Hispanic 115 88% 58% 63% 40% 43% 16% 31%
+/- 9% 17% 20% 16% 16% 15% 15%
EDUCATION
Less than high school diploma 455 62% 22% 36% 26% 27% 2% 8%
+/- 10% 7% 9% 7% 9% 3% 4%
HS Grad or equivalent 633 74% 42% 46% 39% 32% 3% 22%
+/- 8% 9% 8% 7% 8% 3% 6%
Some College/Assoc Degree 838 82% 66% 67% 60% 51% 14% 42%
+/- 6% 5% 7% 5% 7% 5% 6%
Bachelor's Degree 575 84% 75% 61% 75% 62% 15% 65%
+/- 7% 6% 8% 6% 8% 5% 7%
Advanced Degree 292 81% 84% 64% 80% 67% 19% 70%
+/- 10% 6% 10% 7% 12% 10% 8%
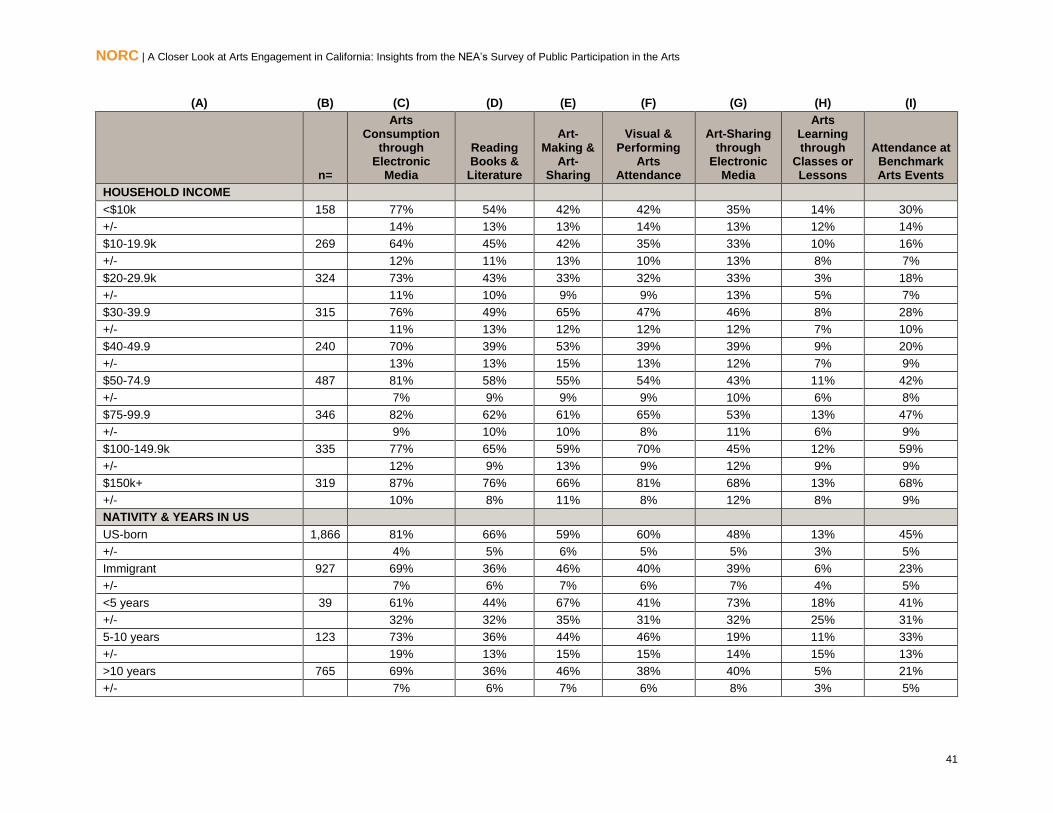
NORC | A Closer Look at Arts Engagement in California: Insights from the NEA’s Survey of Public Participation in the Arts
41
(A) (B) (C) (D) (E) (F) (G) (H) (I)
n=
Arts Consumption
through Electronic
Media
Reading Books &
Literature
Art-Making &
Art-Sharing
Visual & Performing
Arts Attendance
Art-Sharing through
Electronic Media
Arts Learning through
Classes or Lessons
Attendance at Benchmark Arts Events
HOUSEHOLD INCOME
<$10k 158 77% 54% 42% 42% 35% 14% 30%
+/- 14% 13% 13% 14% 13% 12% 14%
$10-19.9k 269 64% 45% 42% 35% 33% 10% 16%
+/- 12% 11% 13% 10% 13% 8% 7%
$20-29.9k 324 73% 43% 33% 32% 33% 3% 18%
+/- 11% 10% 9% 9% 13% 5% 7%
$30-39.9 315 76% 49% 65% 47% 46% 8% 28%
+/- 11% 13% 12% 12% 12% 7% 10%
$40-49.9 240 70% 39% 53% 39% 39% 9% 20%
+/- 13% 13% 15% 13% 12% 7% 9%
$50-74.9 487 81% 58% 55% 54% 43% 11% 42%
+/- 7% 9% 9% 9% 10% 6% 8%
$75-99.9 346 82% 62% 61% 65% 53% 13% 47%
+/- 9% 10% 10% 8% 11% 6% 9%
$100-149.9k 335 77% 65% 59% 70% 45% 12% 59%
+/- 12% 9% 13% 9% 12% 9% 9%
$150k+ 319 87% 76% 66% 81% 68% 13% 68%
+/- 10% 8% 11% 8% 12% 8% 9%
NATIVITY & YEARS IN US
US-born 1,866 81% 66% 59% 60% 48% 13% 45%
+/- 4% 5% 6% 5% 5% 3% 5%
Immigrant 927 69% 36% 46% 40% 39% 6% 23%
+/- 7% 6% 7% 6% 7% 4% 5%
<5 years 39 61% 44% 67% 41% 73% 18% 41%
+/- 32% 32% 35% 31% 32% 25% 31%
5-10 years 123 73% 36% 44% 46% 19% 11% 33%
+/- 19% 13% 15% 15% 14% 15% 13%
>10 years 765 69% 36% 46% 38% 40% 5% 21%
+/- 7% 6% 7% 6% 8% 3% 5%

NORC | A Closer Look at Arts Engagement in California: Insights from the NEA’s Survey of Public Participation in the Arts
42
(A) (B) (C) (D) (E) (F) (G) (H) (I)
n=
Arts Consumption
through Electronic
Media
Reading Books &
Literature
Art-Making &
Art-Sharing
Visual & Performing
Arts Attendance
Art-Sharing through
Electronic Media
Arts Learning through
Classes or Lessons
Attendance at Benchmark Arts Events
AGE
18-24 266 80% 55% 68% 59% 59% 20% 40%
+/- 11% 10% 10% 10% 10% 9% 10%
25-34 473 84% 61% 50% 53% 45% 12% 37%
+/- 8% 9% 9% 9% 10% 6% 8%
35-44 521 74% 48% 56% 51% 56% 7% 31%
+/- 10% 9% 8% 9% 10% 5% 9%
45-54 525 74% 52% 51% 54% 46% 6% 39%
+/- 8% 7% 9% 7% 8% 4% 7%
55-64 462 77% 56% 61% 54% 37% 7% 43%
+/- 9% 7% 9% 7% 9% 5% 7%
65-74 311 80% 72% 46% 61% 36% 16% 49%
+/- 9% 8% 9% 8% 12% 8% 8%
75+ 235 66% 52% 31% 29% 17% 5% 23%
+/- 11% 11% 10% 9% 10% 5% 8%
REGION OF CA
Large Metro Areas 1,681 73% 53% 50% 54% 47% 10% 41%
+/- 5% 5% 6% 5% 5% 3% 4%
Remainder of State 1,112 82% 60% 60% 53% 42% 12% 33%
+/- 5% 8% 7% 8% 7% 5% 6%
Table 9 includes the rates of participation in the general categories of arts participation, as defined by the NEA, for each socio-demographic group
examined in this report. Column A lists the socio-demographic groups examined; Column B is the sample size available in the 2012 SPPA;
Columns C-I are the rates of participation for each general category of arts participation. The second row included for each socio-demographic
group is the margin of error based on a 95% confidence interval for each estimated rate of participation. Statistically, this means we are 95%
confident that the true rate of participation lies within the range defined by subtracting and adding the margin of error to the estimated rate of
participation. The margin of error is smaller for socio-demographic groups that have larger samples available in the 2012 SPPA.

NORC | A Closer Look at Arts Engagement in California: Insights from the NEA’s Survey of Public Participation in the Arts
43
References
Bohn, S., et. al. . (2014). California’s Future. San Francisco, CA: Public Policy Institute of California.
Brown, A. (2004). The Values Study: Rediscovering the Meaning and Value of Arts Participation:
Connecticut Commission on Culture and Tourism.
Brown, A. S., Novak, J. L., & Kitchener, A. (2008). Cultural Engagement in California’s Inland Regions.
San Francisco, CA: WolfBrown.
Brown, A. S., Novak-Leonard, J. L., & Gilbride, S. (2011). Getting In on the Act. San Francisco, CA: The
James Irvine Foundation.
Duggan, M., & Smith, A. (2013). Cell Internet Use 2013. Washington, DC: Pew Research Center.
Jenkins, H. (2006). Convergence Culture: Where Old and New Media Collide. New York City: New
York University Press.
Johnson, H., & Hill, L. (2014). California's Future: Population California's Future. San Francisco, CA:
Public Policy Institute of California.
Markusen, A., Gadwa, A., Barbour, E., & Beyers, W. (2011). California’s Arts and Cultural Ecology:
James Irvine Foundation.
National Endowment for the Arts. (2014). How a Nation Engages with Art: Highlights from the 2012
Survey of Public Participation in the Arts Research Report (Vol. 57). Washington, DC: National
Endowment for the Arts.
Nichols, B. (2009). State and Regional Differences in Arts Participation: A Geographic Analysis of the
2008 SPPA NEA Research Note. Washington, DC: National Endowment for the Arts.
Novak-Leonard, J. L., & Brown, A. (2011). Beyond Attendance: A multi-modal understanding of arts
participation Research Report. Washington, DC: National Endowment for the Arts.
Peters, M., & Cherbo, J. (1998). The Missing Sector: The Unincorporated Arts. Journal of Arts
Management, Law & Society, 28(2), 115-129.
Petersen, E. (1996). The Changing Faces of Tradition: A report on the folk and traditional arts in the
United States Research Report. Washington, DC: The Urban Institute.
Tepper, S., & Gao, Y. (2008). Engaging Art: What Counts? In S. J. Tepper & B. Ivey (Eds.), Engaging
Art. New York: Routledge.
UNESCO Institute for Statistics. (2012). Measuring Cultural Participation. Montreal: UIS.
Wali, A., Severson, R., & Longoni, M. (2002). Informal Arts: Finding Cohesion, Capacity and Other
Cultural Benefits in Unexpected Places. Chicago: Chicago Center for Arts Policy at Columbia
College.


