A Christian Perspective - Calvin College 36 Year Total World Population Predicted World Population...
8
James Bradley, Calvin College Andrew Busch, Fremont High School, Fremont, Michigan David Klanderman, Trinity Christian College Eve Ricketts, Grand Rapids Christian High School Gary Talsma, Calvin College Mathematics: A Christian Perspective Materials prepared on behalf of the Kuyers Institute of Calvin College, March 2006 © Gino Santa Maria. Image from BigStockPhoto.com. STUDENT VERSION
Transcript of A Christian Perspective - Calvin College 36 Year Total World Population Predicted World Population...

James Bradley, Calvin College Andrew Busch, Fremont High School, Fremont, Michigan David Klanderman, Trinity Christian College Eve Ricketts, Grand Rapids Christian High School Gary Talsma, Calvin College
Mathematics: A Christian Perspective
Materials prepared on behalf of the Kuyers Institute of Calvin College, March 2006
© Gino Santa Maria. Image from BigStockPhoto.com.
STUDENT VERSION
Page 2
Table of Contents
Chapter 1: Why Study Math?.......................................................................... Page 3
Chapter 2: Mathematics, Modernism, and Postmodernism .......................... Page 15
Chapter 3: Fibonacci Numbers and the Golden Ratio .................................. Page 28
Chapter 4: Exponential Functions................................................................. Page 35
Chapter 5: Hypercubes................................................................................. Page 41
Chapter 6: Paper or Plastic? No, Thanks! .................................................... Page 55
Chapter 7: The Indian Ocean Tsunami: December 26, 2004 ....................... Page 70
Chapter 8: The Gender Gap......................................................................... Page 87
Chapter 9: Simpson’s Paradox................................................................... Page 102
© 2007 THE KUYERS INSTITUTE.
Kuyers Institute for Christian Teaching and Learning www.pedagogy.net www.calvin.edu/kuyers Layout and Design by Teresa Wyngarden. Images from Clipart.com and BigStockPhoto.com.
Copies may be made for nonprofit classroom use only.
Not for commercial printing.
Page 35
Year Total World Population Year Total World Population Year Total World Population
1000 310,000,000 1900 1,650,000,000 1960 3,024,000,000
1250 400,000,000 1910 1,750,000,000 1970 3,697,000,000
1500 500,000,000 1920 1,860,000,000 1980 4,442,000,000
1750 790,000,000 1930 2,070,000,000 1990 5,280,000,000
1800 980,000,000 1940 2,300,000,000 2000 6,086,000,000
1850 1,260,000,000 1950 2,520,000,000
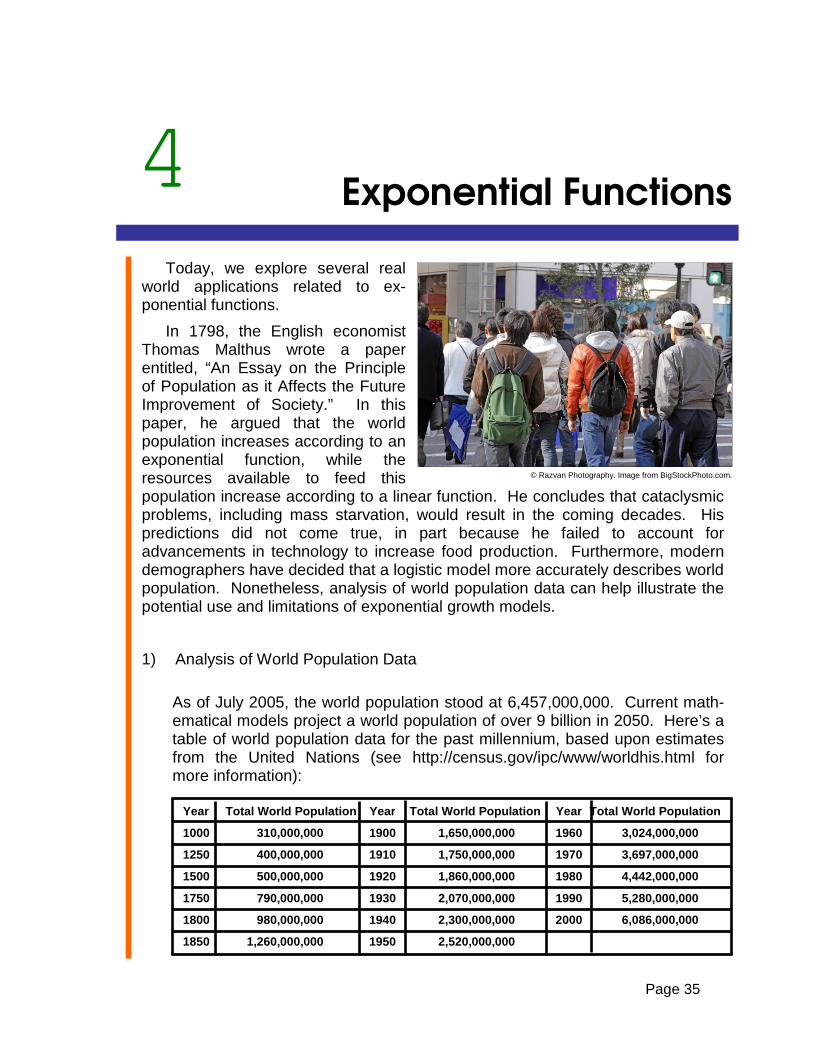
Exponential Functions
Today, we explore several real
world applications related to ex-ponential functions.
In 1798, the English economist Thomas Malthus wrote a paper entitled, “An Essay on the Principle of Population as it Affects the Future Improvement of Society.” In this paper, he argued that the world population increases according to an exponential function, while the resources available to feed this population increase according to a linear function. He concludes that cataclysmic problems, including mass starvation, would result in the coming decades. His predictions did not come true, in part because he failed to account for advancements in technology to increase food production. Furthermore, modern demographers have decided that a logistic model more accurately describes world population. Nonetheless, analysis of world population data can help illustrate the potential use and limitations of exponential growth models.
1) Analysis of World Population Data
As of July 2005, the world population stood at 6,457,000,000. Current math-ematical models project a world population of over 9 billion in 2050. Here’s a table of world population data for the past millennium, based upon estimates from the United Nations (see http://census.gov/ipc/www/worldhis.html for more information):
4
© Razvan Photography. Image from BigStockPhoto.com.

Page 36
Year Total World Population Predicted World Population
1000 310,000,000
1250 400,000,000
1500 500,000,000
1750 790,000,000
1800 980,000,000
1850 1,260,000,000
1900 1,650,000,000
1910 1,750,000,000
1920 1,860,000,000
1930 2,070,000,000
1940 2,300,000,000
1950 2,520,000,000
1960 3,024,000,000
1970 3,697,000,000
1980 4,442,000,000
1990 5,280,000,000
2000 6,086,000,000
a. Graph this data. Use a graphing calculator if available. For the TI 83+ and similar machines, place the year data in L1 and the Population data in L2. Turn your statplot 1 on and graph. Describe the shape of this graph.
b. How can you use the data table to justify that a linear model is unreasonable?
c. Since these data do not fit a linear model, we cannot apply linear regression techniques to find an equation which “best” fits the data. Instead, use the “ExpReg” option on your graphing calculator. Record the result below. Note that the form for a general exponential function is: f(x) = a(bx). If no graphing calculators or equivalent technological tools are available, then your teacher will supply the exponential model that best fits this set of data.
d. How well does this model “fit” the data? There are three ways to answer this question.
First, you can compare the graph of the exponential function obtained in #3 to the graph of the actual data. This is easily done with the graphing calculator, and can otherwise be done carefully by hand. Describe your findings below.
Second, you can com-pare the numerical values of the actual data and the correspond ing values “predicted” by the exponential model. Com-plete the table:
Third, you can inspect the value of “r” that was produced with the ex-ponential function by your calculator. This value is analogous to the linear correlation coefficient that you may have en-countered in prior work. It value ranges from -1.00 to 1.00, where values of

Page 37
±1.00 represent a perfect fit. Based upon all three of the above analyses, describe how well the exponential model fits the data.
e. Discuss some of the potential effects of ever larger populations on the use of the earth’s resources, on pollution, and on global warming. How do these potential effects relate to our responsibility to be stewards of the creation?
2) “Think Globally—Act Locally”
Regardless of the trends in population growth, there are decisions that each individual person makes that will affect the impact on the environment. We first consider the amount of garbage that we discard each week. Suppose that you made a commitment to reduce the amount of garbage that you produce this year by 5%. This may mean reducing the amount of packing (e.g., declining a bag at the grocery store), reusing a product (e.g., taking your own empty bags to the grocery store), or recycling a product (e.g., beverage can). Furthermore, suppose that you commit to a 5% reduction of this lower amount of garbage in the following year, and so forth.
a. What is the general formula that would model this situation?

Page 38
b. If you currently produce 500 pounds of garbage per year, then how many pounds will you produce 10 years from now?
c. How many years must you continue this commitment to cut your amount of garbage in half? (Note: It is not necessary to know the initial amount of garbage. Why not?)
d. Next, suppose that higher gasoline costs encourage motorists to purchase more fuel efficient (and less polluting) vehicles. At the end of 2005, there were approximately 2,000,000 hybrid vehicles in use worldwide. This total is expected to grow by 20% per year for the foreseeable future. What exponential function would model this situation?
e. If this trend continues, when will the number of hybrid cars in use first exceed 10 million? What is the time required for the number of hybrid cars to double?
© Michael Shake. Image from BigStockPhoto.com.
Page 39
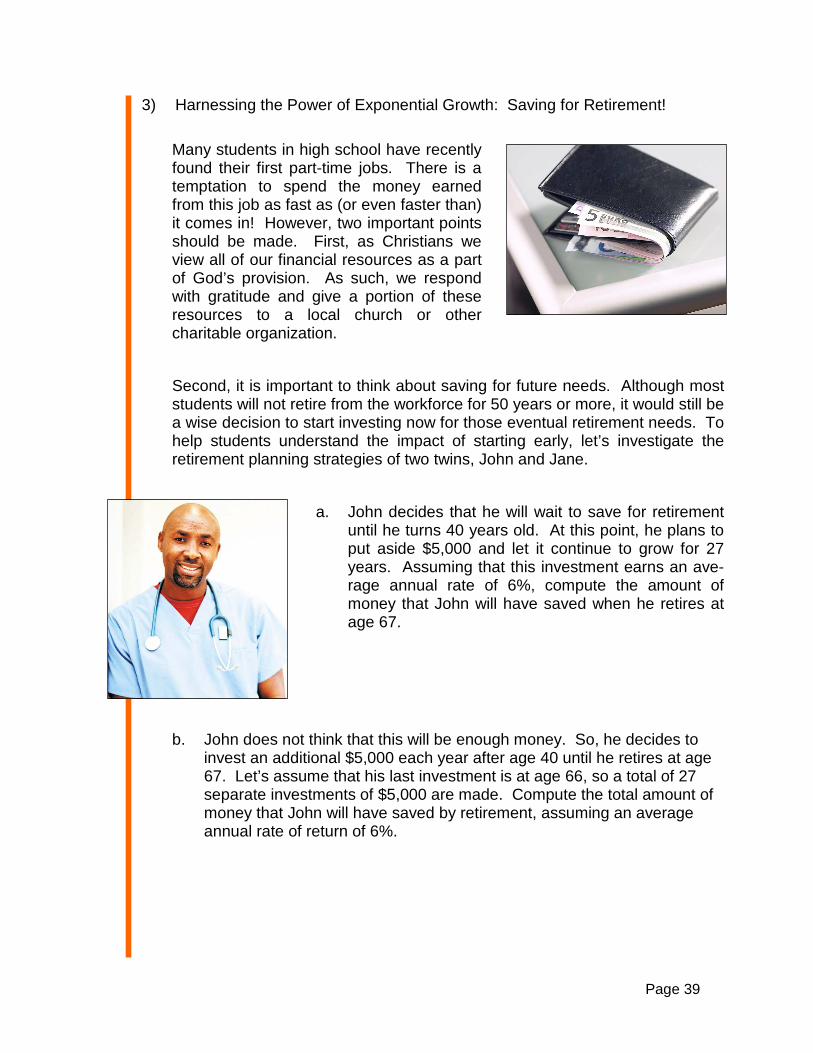
3) Harnessing the Power of Exponential Growth: Saving for Retirement!
Many students in high school have recently found their first part-time jobs. There is a temptation to spend the money earned from this job as fast as (or even faster than) it comes in! However, two important points should be made. First, as Christians we view all of our financial resources as a part of God’s provision. As such, we respond with gratitude and give a portion of these resources to a local church or other charitable organization.
Second, it is important to think about saving for future needs. Although most students will not retire from the workforce for 50 years or more, it would still be a wise decision to start investing now for those eventual retirement needs. To help students understand the impact of starting early, let’s investigate the retirement planning strategies of two twins, John and Jane.
a. John decides that he will wait to save for retirement until he turns 40 years old. At this point, he plans to put aside $5,000 and let it continue to grow for 27 years. Assuming that this investment earns an ave-rage annual rate of 6%, compute the amount of money that John will have saved when he retires at age 67.
b. John does not think that this will be enough money. So, he decides to invest an additional $5,000 each year after age 40 until he retires at age 67. Let’s assume that his last investment is at age 66, so a total of 27 separate investments of $5,000 are made. Compute the total amount of money that John will have saved by retirement, assuming an average annual rate of return of 6%.
Page 40
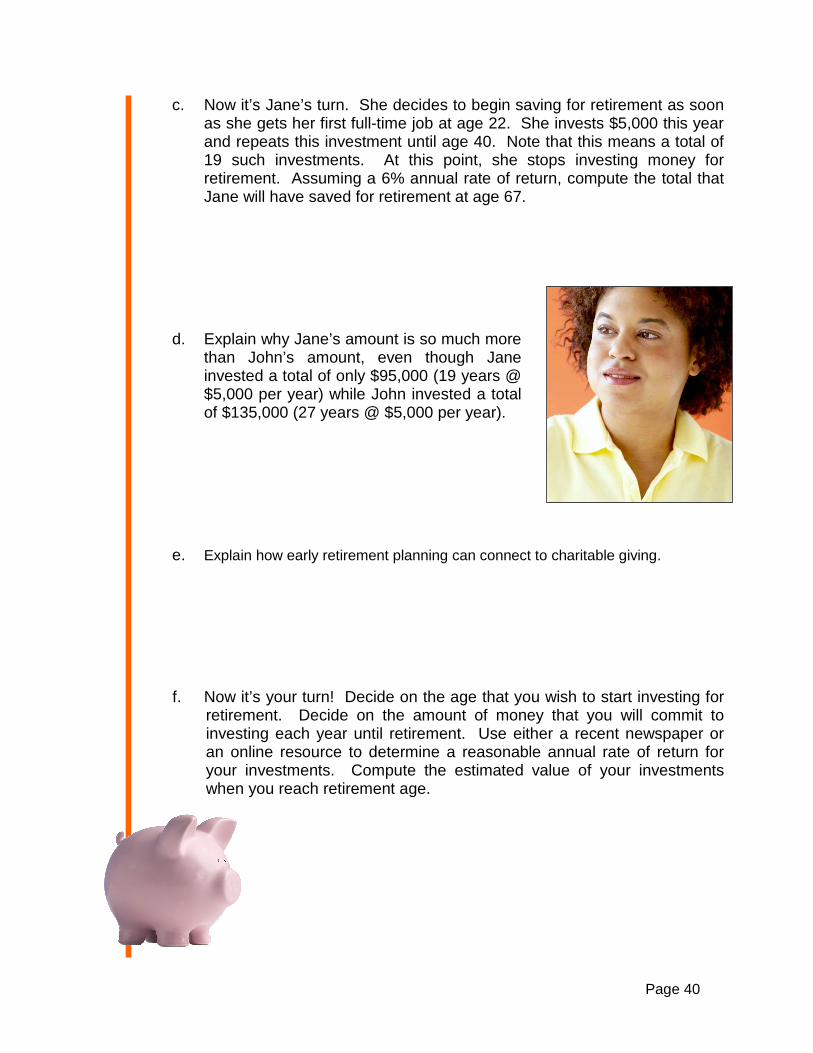
c. Now it’s Jane’s turn. She decides to begin saving for retirement as soon as she gets her first full-time job at age 22. She invests $5,000 this year and repeats this investment until age 40. Note that this means a total of 19 such investments. At this point, she stops investing money for retirement. Assuming a 6% annual rate of return, compute the total that Jane will have saved for retirement at age 67.
d. Explain why Jane’s amount is so much more than John’s amount, even though Jane invested a total of only $95,000 (19 years @ $5,000 per year) while John invested a total of $135,000 (27 years @ $5,000 per year).
e. Explain how early retirement planning can connect to charitable giving.
f. Now it’s your turn! Decide on the age that you wish to start investing for retirement. Decide on the amount of money that you will commit to investing each year until retirement. Use either a recent newspaper or an online resource to determine a reasonable annual rate of return for your investments. Compute the estimated value of your investments when you reach retirement age.