A CFD Parametric Study of Geometrical Variations on the Pressure Pulsations and Performance...
15
A CFD parametric study of geometrical variations on the pressure pulsations and performance characteristics of a centrifugal pump R. Spence a, * , J. Amaral-Teixeira b a Clyde Pumps Limited, 149 Newlands Road, Cathcart, Glasgow G44 4EX, UK b School of Engineering, Cranfield University, Cranfield, Bedfordshire ML43 0AL, UK article info Article history: Received 2 April 2008 Received in revised form 8 October 2008 Accepted 26 November 2008 Available online 6 December 2008 abstract Pressure pulsations may be troublesome during the operation and performance of centrifugal pumps. Such pressure pulsations have traditionally been investigated experimentally but numerical analysis techniques allow these effects to be explored. The multi-block, structured grid CFD code TASCflow has been used to investigate the time variation of pressure within a complete double entry, double volute centrifugal pump. This investigation has taken the form of a parametric study covering four geometric parameters, namely the cutwater gap, vane arrangement, snubber gap and the sidewall clearance. Tagu- chi methods allowed the number of transient analyses to be limited to a total of 27. Three flow rates were investigated and the pulsations were extracted at 15 different locations covering important pump regions. Taguchi post-processing analysis tools were used to rank the relative importance of the four geo- metric parameters at each location for each flow rate. The cutwater gap and vane arrangement were found to exert the greatest influence across the various monitored locations and the flow range. A ratio- nalisation process aimed at increased component life and reduced noise/vibration through reductions in pressure pulsations has produced geometric recommendations, which should be useful to designers. Ó 2008 Elsevier Ltd. All rights reserved. 1. Introduction Centrifugal pumps are used in a wide range of applications and they can handle a variety of liquids at relatively high pressures and/or temperatures. The present work focuses on a scaled down version of a high energy, double entry double volute pump. Double entry pumps are used in applications that would require a high flow in a single stage pump. However, due to the high energies in- volved these pumps tend to suffer more from pressure pulsations than single entry pumps. A number of investigators have considered the effect of geome- try modifications on the pressure variations within pumps, either by monitoring the pressure directly or through changes in the axial and/or radial thrust. Uchida et al. [1] performed tests that involved monitoring the radial force and pump performance for different volute cutwater gaps and cutwater shapes using a single entry end suction pump. In 1978, Makay and Szamody [2] reported research into the ma- jor causes of pump failure (see also Ref. [3]). They suggested that emphasis on gaining high efficiencies at design conditions led to undesirable flow features at part load operation and provided a thorough examination of pumps and pump design relating to per- formance difficulties. Makay and Szamody highlighted the impor- tance of internal pump clearances, especially those between rotating and stationary parts where high gradients exist. A later re- port [4], which covered similar ground recommended that the safe minimum flow for a large feed pump should be 25% of the design flow condition; also that on double entry impellers the impeller blade should be staggered (or clocked) to minimise hydraulic forces and that for double entry impellers the central shroud should be extended to the impeller outer diameter. Unfortunately, these recommendations were not presented with any back up information or discussion of the possible performance changes in the pump due to either design modification. Sudo et al. [5] provide some experimental information concerning the variation in pres- sure pulsations at the pump discharge due to the cutwater gap, skew of the cutwater tongue and the clocking of the impeller. Sudo et al. report that the staggered impeller vanes produce pulsation amplitudes of around a quarter of those present for an inline impeller arrangement, but their measurements were some dis- tance from the pump discharge. It has generally been accepted that while the accuracy of CFD analyses has not yet achieved a level that is equivalent to experi- mental techniques, its ability to correctly predict the direction of any changes is reliable [6]. Others consider that CFD can be partic- ularly adept in aiding understanding of the effect of ranges of parameters [7]. Yet little has been published regarding CFD being used for parametric studies, although work performed at the Uni- versity of Oviedo has recently compared two impeller diameters, i.e. González-Pérez et al. [8] and Blanco et al. [9]. Earlier work by Spence and Teixeira [10] has shown the feasibility of generating 0045-7930/$ - see front matter Ó 2008 Elsevier Ltd. All rights reserved. doi:10.1016/j.compfluid.2008.11.013 * Corresponding author. E-mail address: [email protected] (R. Spence). Computers & Fluids 38 (2009) 1243–1257 Contents lists available at ScienceDirect Computers & Fluids journal homepage: www.elsevier.com/locate/compfluid
-
Upload
cesar-audiveth -
Category
Documents
-
view
28 -
download
2
Transcript of A CFD Parametric Study of Geometrical Variations on the Pressure Pulsations and Performance...
Computers & Fluids 38 (2009) 1243–1257
Contents lists available at ScienceDirect
Computers & Fluids
journal homepage: www.elsevier .com/ locate /compfluid
A CFD parametric study of geometrical variations on the pressure pulsationsand performance characteristics of a centrifugal pump
R. Spence a,*, J. Amaral-Teixeira b
a Clyde Pumps Limited, 149 Newlands Road, Cathcart, Glasgow G44 4EX, UKb School of Engineering, Cranfield University, Cranfield, Bedfordshire ML43 0AL, UK
a r t i c l e i n f o
Article history:Received 2 April 2008Received in revised form 8 October 2008Accepted 26 November 2008Available online 6 December 2008
0045-7930/$ - see front matter � 2008 Elsevier Ltd. Adoi:10.1016/j.compfluid.2008.11.013
* Corresponding author.E-mail address: [email protected] (R. Spence).
a b s t r a c t
Pressure pulsations may be troublesome during the operation and performance of centrifugal pumps.Such pressure pulsations have traditionally been investigated experimentally but numerical analysistechniques allow these effects to be explored. The multi-block, structured grid CFD code TASCflow hasbeen used to investigate the time variation of pressure within a complete double entry, double volutecentrifugal pump. This investigation has taken the form of a parametric study covering four geometricparameters, namely the cutwater gap, vane arrangement, snubber gap and the sidewall clearance. Tagu-chi methods allowed the number of transient analyses to be limited to a total of 27. Three flow rates wereinvestigated and the pulsations were extracted at 15 different locations covering important pumpregions. Taguchi post-processing analysis tools were used to rank the relative importance of the four geo-metric parameters at each location for each flow rate. The cutwater gap and vane arrangement werefound to exert the greatest influence across the various monitored locations and the flow range. A ratio-nalisation process aimed at increased component life and reduced noise/vibration through reductions inpressure pulsations has produced geometric recommendations, which should be useful to designers.
� 2008 Elsevier Ltd. All rights reserved.
1. Introduction
Centrifugal pumps are used in a wide range of applications andthey can handle a variety of liquids at relatively high pressuresand/or temperatures. The present work focuses on a scaled downversion of a high energy, double entry double volute pump. Doubleentry pumps are used in applications that would require a highflow in a single stage pump. However, due to the high energies in-volved these pumps tend to suffer more from pressure pulsationsthan single entry pumps.
A number of investigators have considered the effect of geome-try modifications on the pressure variations within pumps, eitherby monitoring the pressure directly or through changes in the axialand/or radial thrust. Uchida et al. [1] performed tests that involvedmonitoring the radial force and pump performance for differentvolute cutwater gaps and cutwater shapes using a single entryend suction pump.
In 1978, Makay and Szamody [2] reported research into the ma-jor causes of pump failure (see also Ref. [3]). They suggested thatemphasis on gaining high efficiencies at design conditions led toundesirable flow features at part load operation and provided athorough examination of pumps and pump design relating to per-formance difficulties. Makay and Szamody highlighted the impor-tance of internal pump clearances, especially those between
ll rights reserved.
rotating and stationary parts where high gradients exist. A later re-port [4], which covered similar ground recommended that the safeminimum flow for a large feed pump should be 25% of the designflow condition; also that on double entry impellers the impellerblade should be staggered (or clocked) to minimise hydraulicforces and that for double entry impellers the central shroudshould be extended to the impeller outer diameter. Unfortunately,these recommendations were not presented with any back upinformation or discussion of the possible performance changes inthe pump due to either design modification. Sudo et al. [5] providesome experimental information concerning the variation in pres-sure pulsations at the pump discharge due to the cutwater gap,skew of the cutwater tongue and the clocking of the impeller. Sudoet al. report that the staggered impeller vanes produce pulsationamplitudes of around a quarter of those present for an inlineimpeller arrangement, but their measurements were some dis-tance from the pump discharge.
It has generally been accepted that while the accuracy of CFDanalyses has not yet achieved a level that is equivalent to experi-mental techniques, its ability to correctly predict the direction ofany changes is reliable [6]. Others consider that CFD can be partic-ularly adept in aiding understanding of the effect of ranges ofparameters [7]. Yet little has been published regarding CFD beingused for parametric studies, although work performed at the Uni-versity of Oviedo has recently compared two impeller diameters,i.e. González-Pérez et al. [8] and Blanco et al. [9]. Earlier work bySpence and Teixeira [10] has shown the feasibility of generating
Nomenclature
b2 impeller outlet widthB3 volute widthDd discharge branch diameterDs suction branch diameterD2 impeller outlet diameterEff hydraulic efficiencynpj number of level factor trials [npj = 3]p pressurepj factor totals: summation of the results relating to a par-
ticular factor levelp�r normalised relative pressure; p�r ¼ ðp� p1Þ=ðqu2
2=2Þp1 pump suction pressureQn nominal flow rateRL leading edge blade radiusR1 inlet eye radiusR3 radius to cutwatertB blade thicknessu2 circumferential speed at the impeller outletyGM the grand mean (average of all response values)yP the predicted response
z blade number (per side)bL average leading edge blade angleDp peak-to-peak pressure pulsationDp� normalised pressure pulsation; Dp� ¼ Dp=ðqu2
2=2ÞDP effect for factor p, where DP ¼ ðp1=np1Þ � ðp�1=np�1Þ(DP/2) half effect for factor ph total blade wrap angleq density of the fluid
Suffixesi 1 denotes inlet2 denotes outlet3 denotes cutwaterj level of Taguchi factor (�1: low, 0: mid, +1: high)p denotes geometric factorA cutwater gapB snubber gapC sidewall clearanceD vane arrangementAB interaction of factors A and B
1244 R. Spence, J. Amaral-Teixeira / Computers & Fluids 38 (2009) 1243–1257
a numerical model of a complete pump geometry and conductingCFD analyses using this model over a flow range from 1.00Qn(BEP) down to 0.25Qn. That study also compared the pressure pul-sations from the numerical analysis at locations within the impel-ler, volute and leakage flow passages with experimental test dataand reasonable agreement was found. The numerical model wasalso found to correctly predict pressure pulsation trends for differ-ent pump geometries. Additionally, information relating to some ofthe internal flow features observed within the pump both at BEPand reduced flow rates has also been published [11].
This present paper uses the analysis in [10] to provide a widerparametric study that investigates the effect of various geometryfeatures on the pressure pulsations in the pump. A survey of liter-ature and industrial experience provided a shortlist of key param-eters in the design process and that are likely to have an effect onthe pressure variation in the pump. These key areas are, the cutwa-ter clearance gap [radial distance between impeller blade tip andthe volute cutwater], the snubber clearance gap [radial distancebetween the shroud outer diameter and the volute casing], side-wall clearance [minimum axial distance between the impellershroud and the volute casing] and blade clocking or stagger [on adouble entry impeller this is the practice of offsetting the arrange-ment of blades on one side of the impeller so that they do not coin-cide with the blades on the opposite side]. The parametric studyutilises a Taguchi array to reduce the number of analyses requiredat each flow rate, with three flow rates being investigated, namely1.00Qn, 0.50Qn and 0.25Qn. The array provides a framework forthe post-processing of the results and allows the reduction of thepressure pulsations in conjunction with the adjustment of theabove variables. This is a rationalisation process that does not so-lely focus on reducing the pressure pulsation since other criticalfactors, such as the pump generated head, are also considered.Broadly, the objective of this rationalisation is to assist the devel-opment of pump designs, which will achieve reduced levels of pul-sations without significant loss in performance.
2. Pump geometry
The centrifugal pump simulated is of a double entry, double vo-lute type, shown in Fig. 1, with a specific speed of 0.74. The doubleentry impeller has a maximum diameter of 366 mm, with 6 back-
wards curved blades per side. It should be noted that the largestimpeller diameter used in the investigation was deliberately over-sized for the pump design. The impeller blade has average inlet andoutlet angles of 26� and 22.5�, respectively, with the blade wrapangle being 102�. The cutwater tongue is at a diameter of380 mm, with a radius of 12 mm. The pump operates at a speedof 1400 rpm, with a duty flow condition of 550 m3/h. The duty flowcondition used in all analyses relates to the design flow rate for theoriginal pump and so the pump will not be operating at its optimalflow condition. Table 1 provides a list of the main characteristics ofthe pump.
The geometrical factors considered for the parametric study areshown in Fig. 2 and the values given in Table 2. Three cutwatergaps are considered, 3.83%, 6.00% and 7.95%, based on the actualblade diameter. The change in cutwater gap was achieved byreducing the impeller blade diameter (corresponding impellerblade diameters are 366, 358.5 and 352 mm, respectively). Threesnubber gap sizes are also considered, namely 0.27%, 1.10% and1.27%, also based on the shroud diameter, along with three side-wall leakage flow clearances that are for convenience termed100%, 50% and 25% where 100% corresponds with a 12 mm clear-ance in this case. Finally three different impeller arrangementsare considered, an inline or straight arrangement, a mid positionstagger (30�) and a quarter position stagger (15�). Fig. 3 showsthe different impeller arrangements. It should be noted that thestaggered impeller arrangements contain a central hub extendedto the outer impeller diameter, while the inline impeller termi-nates the hub at a radius part way through the impeller. Table 2provides information relating to the various arrangementsanalysed.
3. Numerical model
The numerical simulation is conducted using CFX-TASCflow,which utilises a finite element based finite volume method to solvethe unsteady three-dimensional Navier–Stoker equations on astructured grid. CFX-TASCflow also has the advantages of includingsome turbomachinery specific capabilities at the pre- and post-stages of the simulation.
As has been noted earlier, a previous paper [10] contains de-tailed information concerning the generation of the numerical

Table 1Main characteristics of pump arrangements.
Location Description Parameter Value
Double entryimpeller
Inlet eye diameter (m) D1 0.177Average leading edge blade angle (o) bL 26Maximum impeller outlet diameter (m) D2 0.366Average trailing edge blade angle (o) bT 22.5Impeller outlet width (m) b2 0.061Blade number (per side) z 6Total blade wrap angle (o) h 102Blade thickness (m) tB 0.007Leading edge blade radius (m) r 0.002
Double volute Suction branch diameter (m) Ds 0.400Discharge branch diameter (m) Dd 0.300Volute width (m) B3 0.105Radius to cutwater (m) R3 0.190
Fig. 2. Geometric factor locations within the pump.
Fig. 1. Pump type with horizontal cross section.
Table 2Geometric configuration of Taguchi arrangements.
Experimentalarrangement
Cutwatergap
Snubbergap
Sidewallclearance
Vanearrangement
1 3.83% [�1] 0.27% [�1] 100% [+1] 0� [�1]2 3.83% [�1] 1.10% [0] 50% [0] 15� [0]3 3.83% [�1] 1.64% [+1] 25% [�1] 30� [+1]4 6.00% [0] 0.27% [�1] 50% [0] 30� [+1]5 6.00% [0] 1.10% [0] 25% [�1] 0� [�1]6 6.00% [0] 1.64% [+1] 100% [+1] 15� [0]7 7.95% [+1] 0.27% [�1] 25% [�1] 15� [0]8 7.95% [+1] 1.10% [0] 50% [0] 30� [+1]9 7.95% [+1] 1.64% [+1] 100% [+1] 0� [�1]
R. Spence, J. Amaral-Teixeira / Computers & Fluids 38 (2009) 1243–1257 1245
model. This previous paper includes descriptions of the grid inde-pendence checks conducted, in addition to the examination of dif-ferent boundary conditions and turbulence models with a view to
achieving a robust analysis in a reasonable timeframe while pre-serving the accuracy of the analyses. Information relating to theinterpretation of the data gained from the analyses and compari-sons with industrial experimental tests are also provided in thisprevious work. A brief summary of this work is contained below.
3.1. Grid generation
The pump is split into a number of component parts for model-ling. The component parts included: (a) the double suction inlet,(b) the leakage flow paths comprising the snubber gap, sidewallclearance and wear ring gaps, (c) the pump impeller (both sides),(d) the double volute and (e) a mid block between the two sidesof the impeller (the mid block is only present for staggered impel-ler arrangements). Due to the size and complexity of the pump carewas taken regarding the distribution of grid elements in the model.A detailed grid independence check was conducted for the impellergrid using single passageway sizes ranging from 10,000 to 85,000elements, with the influence of the volute on the flow in the impel-ler grid being factored into the check. This concluded that animpeller grid size of 22,000 elements/nodes per passageway wassufficient to reliably model the pressure in the impeller. The impel-ler model consisted of 12 passageways and totalled 227,126 ele-ments. Care was taken to concentrate grid in the cutwater regionof the volute and the axial distribution at the impeller interfacereplicated the impeller grid distribution. In total, 391,848 elementswere used to model the volute. The leakage flow path model wasgenerated in such a way that multiple snubber and sidewall geo-metric arrangements could be analysed through use of a single gridand the block-off feature in CFX-TASCflow. The leakage flow path
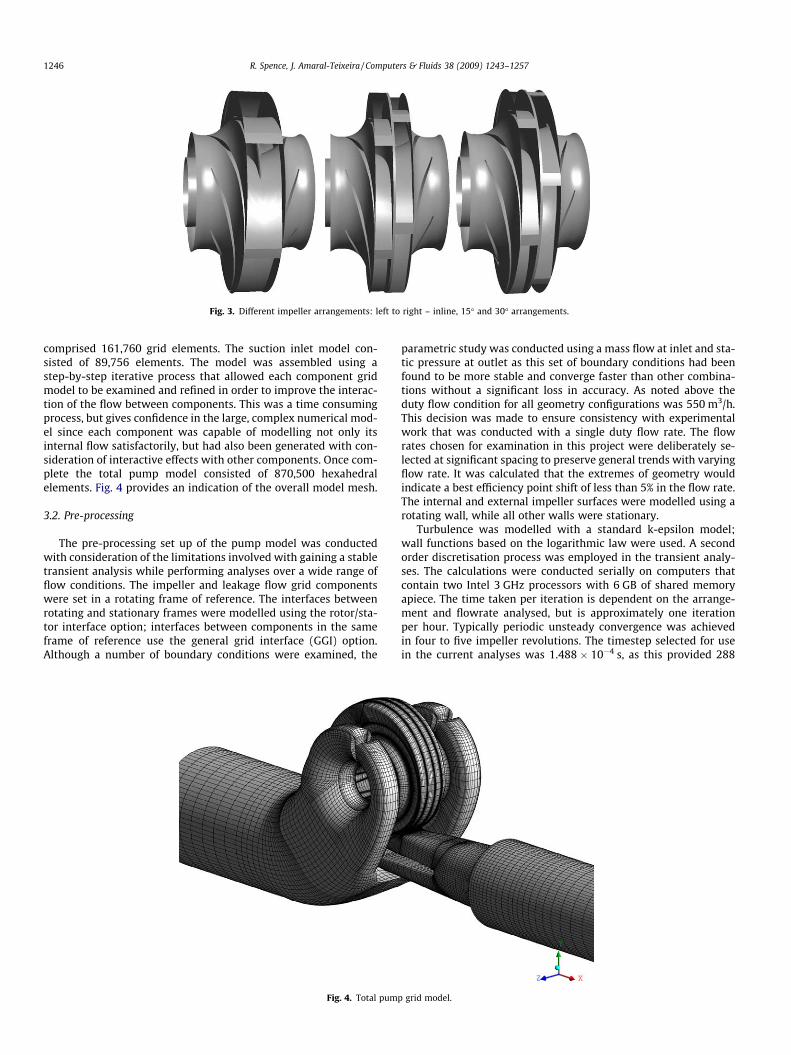
Fig. 3. Different impeller arrangements: left to right – inline, 15� and 30� arrangements.
1246 R. Spence, J. Amaral-Teixeira / Computers & Fluids 38 (2009) 1243–1257
comprised 161,760 grid elements. The suction inlet model con-sisted of 89,756 elements. The model was assembled using astep-by-step iterative process that allowed each component gridmodel to be examined and refined in order to improve the interac-tion of the flow between components. This was a time consumingprocess, but gives confidence in the large, complex numerical mod-el since each component was capable of modelling not only itsinternal flow satisfactorily, but had also been generated with con-sideration of interactive effects with other components. Once com-plete the total pump model consisted of 870,500 hexahedralelements. Fig. 4 provides an indication of the overall model mesh.
3.2. Pre-processing
The pre-processing set up of the pump model was conductedwith consideration of the limitations involved with gaining a stabletransient analysis while performing analyses over a wide range offlow conditions. The impeller and leakage flow grid componentswere set in a rotating frame of reference. The interfaces betweenrotating and stationary frames were modelled using the rotor/sta-tor interface option; interfaces between components in the sameframe of reference use the general grid interface (GGI) option.Although a number of boundary conditions were examined, the
Fig. 4. Total pump
parametric study was conducted using a mass flow at inlet and sta-tic pressure at outlet as this set of boundary conditions had beenfound to be more stable and converge faster than other combina-tions without a significant loss in accuracy. As noted above theduty flow condition for all geometry configurations was 550 m3/h.This decision was made to ensure consistency with experimentalwork that was conducted with a single duty flow rate. The flowrates chosen for examination in this project were deliberately se-lected at significant spacing to preserve general trends with varyingflow rate. It was calculated that the extremes of geometry wouldindicate a best efficiency point shift of less than 5% in the flow rate.The internal and external impeller surfaces were modelled using arotating wall, while all other walls were stationary.
Turbulence was modelled with a standard k-epsilon model;wall functions based on the logarithmic law were used. A secondorder discretisation process was employed in the transient analy-ses. The calculations were conducted serially on computers thatcontain two Intel 3 GHz processors with 6 GB of shared memoryapiece. The time taken per iteration is dependent on the arrange-ment and flowrate analysed, but is approximately one iterationper hour. Typically periodic unsteady convergence was achievedin four to five impeller revolutions. The timestep selected for usein the current analyses was 1.488 � 10�4 s, as this provided 288
grid model.

R. Spence, J. Amaral-Teixeira / Computers & Fluids 38 (2009) 1243–1257 1247
time steps per impeller rotation (48 time steps per blade passage).This timestep was chosen based upon the work of Koumoutsos [12]who conducted transient analyses of a centrifugal pump using timesteps equivalent to 250 and 500 time steps per revolution and con-cluded that 250 time steps per revolution (50 time steps per revo-lution) was adequate for a reliable and accurate analysis. Thus, theselection of the timestep, giving a greater number of time steps perimpeller revolution, was considered to have preserved the accu-racy and stability of the analysis, with the Courant Freidrich Levy(CFL) number being less than 30. Transient results files were cre-ated after every second iterative loop.
3.3. Pressure pulsation monitoring locations
The pressure pulsation level was investigated at 15 locationsaround the pump. Fig. 5 provides the circumferential position ofa number of the locations in the volute and leakage flow passage.
Leakage flow locations (in casing wall in leakage flow path atback of impeller)
C1 – 60 mm ahead of the leading edge cutwater (not shown).C2 – 30 mm ahead of the leading edge cutwater.C3 – at the leading edge cutwater.C4 – 30 mm past the leading edge cutwater.C10 – 60 mm ahead of the leading edge cutwater, opposite to C1(not shown).
Volute locations (at splitter, 25 mm axially offset from pumpcentreline)
C5 – 5 mm back from the cutwater leading edge.C6 – 15 mm back from the cutwater leading edge.C7 – 30 mm back from the cutwater leading edge.C8 – 50 mm back from the cutwater leading edge.C9 – Top, centre of the pump (not shown).Cd – Pump discharge (not shown).
Impeller positions (all not shown)
Shroud B (above blade) – shroud outer diameter, positionedabove an impeller blade.Shroud M (mid passage) – shroud outer diameter, positionedmid way between two impeller blades.Blade P – located on the pressure face of an impeller blade atthe trailing edge.Blade S – located on the suction face of an impeller blade at thetrailing edge.
Fig. 5. Sketch of the circumferential position of the volute cutwater (C5, C6, C7 andC8) and sidewall (C2, C3 and C4) monitoring locations.
In order to keep the presentation manageable the results givenin this paper are restricted to a single monitoring position in eachof the major pump regions, e.g. C4 for leakage flow path, C6 for vo-lute cutwater, C9 for general volute/towards discharge and Blade Pfor the impeller outlet. Results at some of the other positions willbe mentioned in discussion.
3.4. Summary of experimental comparison
The uncertainty in the present analysis has been minimised andassessed through two approaches. Firstly through convergencestudies as described in Section 3.1 and by comparison with indus-trial based experiments. The former have shown that the presentmesh size, for the impeller, is within 3% of a much finer grid. Thelatter is described in detail in Refs. [10,11] but the results are sum-marised here for convenience.
Table 3 provides a comparison of the CFD simulation (arrange-ment 2) with experimental data for the 0.25Qn and 1.00Qn flowrates. The table gives an indication of the percentage variation ofthe CFD simulation with the industrial test results at a selectionof locations around the pump (with the difference being dividedby the experimental value). The agreement at the impeller shroudwhere the pulsation levels are relatively high is excellent and typ-ically the differences are significantly lower for all flow rates thanthe average, being as low as 7%. It should be pointed out that the C5and C6 positions (which show a higher difference) are very sensi-tive to the actual monitored location because of the high pressurepulsation gradients in the vicinity of the cutwater tongue. Theshroud and C9 (towards the discharge) positions are importantlocations for monitoring within the pump as the estimation of fa-tigue levels in the impeller requires information at the impellershroud and the C9 position can be used to provide a more generalindication of pressure pulsations within the pump. At these loca-tions the variations are better than average and can reach levelsas low as 3%. Generally within the pump, the differences have anaverage value across all locations being between 25% and 30%,but it is important to note that all of these comparisons show sub-stantial improvement over previous pulsation work performed byLongatte and Kueny [13] and Talha [14] who, respectively, reportedover prediction of pulsations by 1000% and 300% in comparisonwith experimental tests.
In general the relationship between the numerical simulationand experimental test is rather complex. The percentage variationwith the experimental values does not appear to show any identi-fiable improvement at flow rates closer to the BEP flow condition.However, the pulsation variation at 1.00Qn is approximately halfthat calculated for 0.25Qn for both arrangements when averagedacross all measured locations. Unfortunately only limited experi-mental performance data is available for comparison, i.e. no
Table 3Percentage variations for pressure pulsations and generated head with industrialexperimental tests for arrangement 2.
Pump location Arrangement 2
Percentage variation Normalised pulsation value (�10�3)
1.00Qn 0.25Qn 1.00Qn 0.25Qn
C1 35 12 56 101C3 8 20 56 169C4 40 22 67 189C5 27 16 231 315C6 21 27 200 268C8 20 3 81 330C9 3 22 49 67Shroud 12 7 128 281Head 3.9 6.8 – –
1248 R. Spence, J. Amaral-Teixeira / Computers & Fluids 38 (2009) 1243–1257
efficiency information was recorded. However, for the arrange-ment shown, the comparison of the available data indicates thatthe CFD simulation predicts the pump generated head to within4% of the experiment at the 1.00Qn flow rate, with this increasingto 7% at the lowest flow condition.
3.5. Presentation and discussion of results
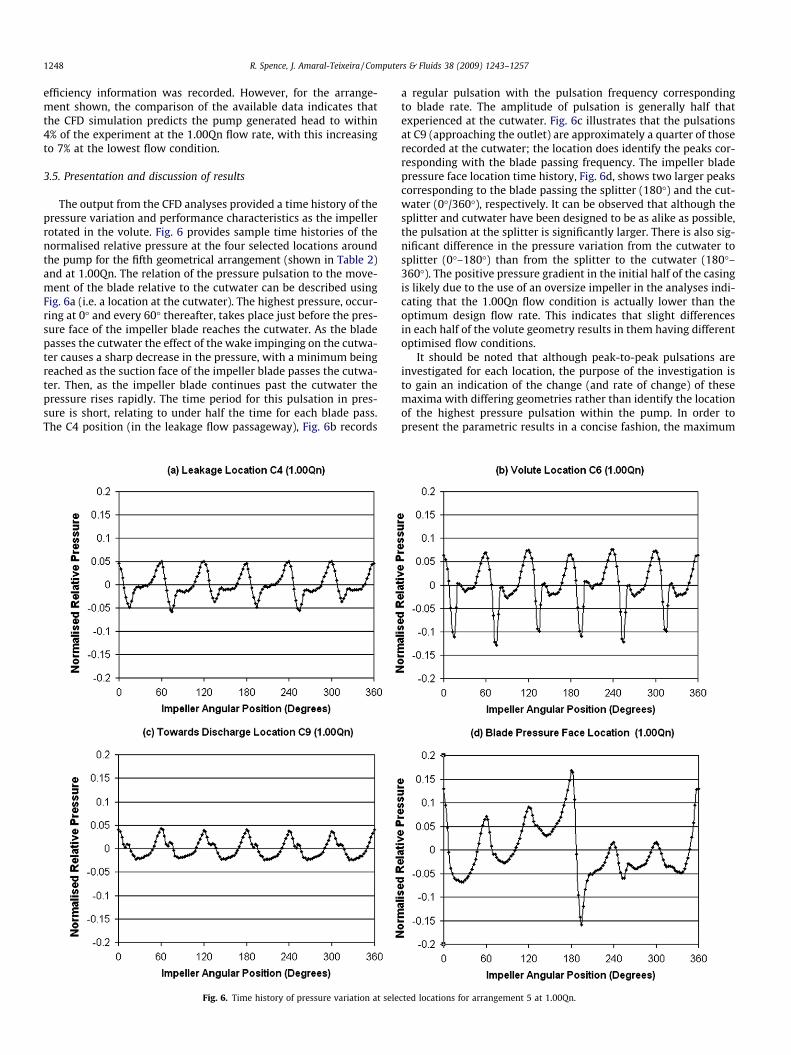
The output from the CFD analyses provided a time history of thepressure variation and performance characteristics as the impellerrotated in the volute. Fig. 6 provides sample time histories of thenormalised relative pressure at the four selected locations aroundthe pump for the fifth geometrical arrangement (shown in Table 2)and at 1.00Qn. The relation of the pressure pulsation to the move-ment of the blade relative to the cutwater can be described usingFig. 6a (i.e. a location at the cutwater). The highest pressure, occur-ring at 0� and every 60� thereafter, takes place just before the pres-sure face of the impeller blade reaches the cutwater. As the bladepasses the cutwater the effect of the wake impinging on the cutwa-ter causes a sharp decrease in the pressure, with a minimum beingreached as the suction face of the impeller blade passes the cutwa-ter. Then, as the impeller blade continues past the cutwater thepressure rises rapidly. The time period for this pulsation in pres-sure is short, relating to under half the time for each blade pass.The C4 position (in the leakage flow passageway), Fig. 6b records
Fig. 6. Time history of pressure variation at sele
a regular pulsation with the pulsation frequency correspondingto blade rate. The amplitude of pulsation is generally half thatexperienced at the cutwater. Fig. 6c illustrates that the pulsationsat C9 (approaching the outlet) are approximately a quarter of thoserecorded at the cutwater; the location does identify the peaks cor-responding with the blade passing frequency. The impeller bladepressure face location time history, Fig. 6d, shows two larger peakscorresponding to the blade passing the splitter (180�) and the cut-water (0�/360�), respectively. It can be observed that although thesplitter and cutwater have been designed to be as alike as possible,the pulsation at the splitter is significantly larger. There is also sig-nificant difference in the pressure variation from the cutwater tosplitter (0�–180�) than from the splitter to the cutwater (180�–360�). The positive pressure gradient in the initial half of the casingis likely due to the use of an oversize impeller in the analyses indi-cating that the 1.00Qn flow condition is actually lower than theoptimum design flow rate. This indicates that slight differencesin each half of the volute geometry results in them having differentoptimised flow conditions.
It should be noted that although peak-to-peak pulsations areinvestigated for each location, the purpose of the investigation isto gain an indication of the change (and rate of change) of thesemaxima with differing geometries rather than identify the locationof the highest pressure pulsation within the pump. In order topresent the parametric results in a concise fashion, the maximum
cted locations for arrangement 5 at 1.00Qn.

R. Spence, J. Amaral-Teixeira / Computers & Fluids 38 (2009) 1243–1257 1249
peak-to-peak pressure pulsations results for all nine arrangementsand the three flow rates have been extracted from graphs similar toFig. 6. These are presented in Tables 4–6, respectively. It is clearthat the pressure pulsations increase as the flow decreases and thatthe largest pulsations exist at the trailing edge of the impellerblade. The pulsations at the volute cutwater are larger than thosein the leakage region and the cutwater gap and vane arrangementare the geometric parameters with the strongest effects.
4. Taguchi background
Taguchi’s concept was to design a quality product rather thaninspecting a product to determine if it was a quality product. TheTaguchi methodology optimises the configurations used in a para-metric study such that fewer configurations are required to iden-tify the relative importance of the selected parameters. The
Table 4Normalised pressure pulsation (�10�3) and pump performance results for 1.00Qn flow ra
Arr. Single rotation average performance Normalised pressure pulsations (�10�3)
Head (m) Hyd. eff. (%) Leakage flow path locations Volut
C1 C2 C10 C3 C4 C5
1 36.1 85.7 94 87 94 90 101 2532 34.7 86.7 56 43 61 56 67 2313 35.2 87.3 38 35 37 63 95 2644 32.7 87.4 30 30 33 38 48 1725 33.8 86.8 89 75 89 85 109 2426 32.9 88.3 56 45 49 40 42 1337 30.9 88.3 50 44 45 41 42 1188 30.3 88.6 23 19 25 27 36 1349 31.8 86.6 72 70 73 73 77 199
Table 5Normalised pressure pulsation and pump performance results for 0.50Qn flow rate.
Arr. Single rotation average performance Normalised pressure pulsations (�10�3)
Head (m) Hyd. eff. (%) Leakage flow path locations Volut
C1 C2 C10 C3 C4 C5
1 39.3 44.1 58 63 56 83 107 2332 39.0 42.0 38 51 42 73 94 2893 39.0 42.0 25 29 30 63 87 2254 37.3 39.6 42 43 42 54 64 2605 37.9 41.5 45 50 49 89 132 3086 37.0 39.5 33 25 26 35 50 1777 35.7 37.7 26 26 27 29 43 1598 36.0 37.8 24 30 29 37 45 1439 36.3 39.3 60 55 58 68 79 223
Table 6Normalised pressure pulsation and pump performance results for 0.25Qn flow rate.
Arr. Single rotation average performance Normalised pressure pulsations (�10�3)
Head (m) Hyd. eff. (%) Leakage flow path locations Volute l
C1 C2 C10 C3 C4 C5 C
1 39.5 33.1 114 115 125 123 132 313 22 38.2 33.2 101 124 77 169 189 315 23 39.4 32.8 63 59 50 98 111 272 24 37.5 30.4 49 50 43 62 72 206 25 38.4 32.3 95 90 90 112 136 209 26 37.3 30.1 59 77 59 96 102 176 17 35.9 28.3 42 40 46 45 58 223 18 35.8 28.0 38 47 45 55 61 231 19 36.0 32.6 99 82 94 88 87 214 2
Taguchi approach sets out configurations (or arrangements) to beconducted using an appropriate orthogonal array; the terminologyused in these arrays includes ‘‘factors” – an item that is to be variedduring the simulations, ‘‘level” – the number of times a factor is tobe varied during the simulations and ‘‘configuration number” – thenumber of simulations that are required to be run to complete theanalysis. Thus, the cutwater gap is a ‘‘factor”, which has three lev-els (i.e. 3.83%, 6.00% and 7.95%). In total, the simulations conductedin this work are to investigate four, three level factors (i.e. cutwatergap, snubber gap, sidewall clearance and vane arrangement).
The selection of an appropriate Taguchi array is dependent onthe number of factors and the levels of the factors to be analysed.The letter L and a subscript number identify the arrays. Roy [15]provides a table of common orthogonal arrays and their relatednumber of factors and levels, which indicates that for the currentrequirement the L9 array is appropriate. To produce a full factorial
te.
e locations Impeller outlet locations
C6 C7 C8 C9 Blade press.face
Blade suct.face
Shroudblade pos.
Shroudmid pos.
259 217 167 72 411 185 181 149200 134 81 49 332 254 128 115208 180 119 25 381 234 178 160140 122 94 22 247 189 78 73203 185 143 65 327 207 206 137108 79 67 40 228 167 122 114
96 83 74 34 175 131 75 6298 83 50 15 148 126 74 68
153 149 113 44 206 155 129 84
e locations Impeller outlet locations
C6 C7 C8 C9 Blade press.face
Blade suct.face
Shroudblade pos.
Shroudmid pos.
263 340 316 86 693 444 432 540221 218 185 44 628 291 228 355226 204 173 36 582 319 295 364210 188 159 28 526 373 217 261237 287 278 68 578 333 275 359136 124 154 32 423 338 197 275116 140 163 36 416 347 191 279124 111 109 21 421 312 196 214163 186 196 49 455 297 260 252
ocations Impeller outlet locations
6 C7 C8 C9 Blade press.face
Blade suct.face
Shroud bladepos.
Shroud midpos.
83 330 293 113 648 373 355 52268 309 330 67 580 291 281 32864 303 182 44 714 319 340 38816 184 160 34 576 380 270 35333 298 294 80 611 379 288 48374 174 151 46 430 338 253 36771 136 165 43 427 347 201 35973 158 124 26 468 312 54 28327 227 170 68 473 351 261 388

1250 R. Spence, J. Amaral-Teixeira / Computers & Fluids 38 (2009) 1243–1257
parameter study of the geometric variables, the number of casesrequired would be 243 (4 factors with 3 levels at 3 flow rates).The Taguchi approach reduces this to 27 cases. The layout of theL9 array with the various factors and levels is shown in Table 2.It was considered that an L4 array with two factors and two levelscould be used to provide additional information for the significantfactors from the L9 array. Two L4 arrays have been used and theseare shown in Tables 4 and 5, consisting of arrangements previouslyanalysed as part of the larger L9 array. The particular arrangementsused to form the smaller L4 arrays depend on the results of the L9
array.Pressure pulsations have been used as the quality characteristic,
with ‘‘the lower the better” being set as the criterion of evaluation.Other quality characteristics such as the pump performance [e.g.the pump generated head, or hydraulic efficiency (calculated be-tween the pump suction and discharge)] could also be selectedwith its own criterion of evaluation. The analysis conducted onthe L9 array result data is essentially an analysis of variance (ANO-VA) as detailed in Roy [15].
5. Taguchi post-processing of results
5.1. Response averages
One aspect of the Taguchi method utilises response averages,calculated for each location and flow rate in relation to a specificgeometry parameter variable, to provide detail relating to theinfluence of the geometric factors on the pulsations (and generatedhead). For example, to calculate the response average at locationC6 relating to the 3.83% cutwater gap at 1.00Qn, the average ofthe C6 pressure pulsations would be calculated from arrangements1, 2 and 3. The Taguchi method splits each of the four geometricalparameter variables into their ‘‘levels”, termed high [+1], mid [0]and low [�1]; the relation of these levels to the geometrical vari-ables is shown in Table 2. Sample calculated response average val-ues for each level and for all parameters are shown for the C6location in Table 7 for the duty flow condition. These averagesare provided for a selection of locations across the three flow ratesin Figs. 7 and 8 showing the effect of the cutwater gap and vanearrangement, respectively. Due to the discrete geometry changesinvolved the vane arrangement graphs are simply joined withstraight lines rather than curves. It should also be noted that thescale for Figs. 7d and 8d (both blade pressure locations) is doublethat used at the other locations. These graphs together with thegeneral pulsation and performance data provide detail relating tothe influence of the dominant geometric parameters mentionedabove (vane arrangement and cutwater gap). The influence of thecutwater gap is most significant at the impeller outlet and at cir-cumferential positions close to the cutwater. It should be notedthat for location C6 (Fig. 7b) that there is a slight reduction inthe rate of pulsation reduction as the cutwater increases at1.00Qn and 0.25Qn flow rates. Fig. 9a illustrates the strong influ-ence of the cutwater diameter on the generated head, with thehead decreasing as the cutwater gap increases (the power graph,not shown, shows similar trends). The reduction in head and power
Table 7Response averages for location C6 at 1.00Qn.
Arrangement Response average pressure pulsation (Normalised)
�1 0 +1
Cutwater gap 0.222 0.150 0.116Snubber gap 0.165 0.167 0.156Sidewall clearance 0.169 0.164 0.155Vane arrangement 0.205 0.134 0.149
are as a direct effect of the cutwater gap being modified by chang-ing the impeller outlet diameter. Pump scaling laws predict thatthe head will reduce with the square of the impeller diameter.The vane arrangement has an effect on the pulsations at most ofthe monitored locations. Typically the inline vane arrangementhas larger pulsations than either of the two staggered vanearrangements, with the 15� vane arrangement being closer to the30� vane results rather than the inline arrangement. The vanearrangement has the strongest effect on the pressure pulsationsat the leakage flow and volute locations that are remote from thecutwater position. Reductions in the pressure pulsations local tothe cutwater (shown clearly at C6, Fig. 8b) and the impeller bladepressure face location, Fig. 8d, due to the vane arrangement aregenerally less than reductions due to the cutwater gap increase.On some occasions the 15� stagger vane produces lower pulsations,yet at others the 30� stagger vane arrangement is lower. Fig. 9billustrates that the vane arrangement has a small but noticeableinfluence on the performance characteristics, with the head andpower (not shown) reducing slightly when moving from an inlinearrangement to a staggered arrangement. It is possible that thereduction in the generated head is caused by additional frictionloss present due to the central hub extending to the outlet in thestaggered case instead of terminating earlier in the inline arrange-ment. The pump hydraulic efficiency is generally larger for a stag-gered impeller arrangement than an inline vane arrangement.
5.2. Percentage contributions
One other important aspect of the Taguchi method is the abilityto calculate the percentage contribution of a geometric parameterto a specified quality characteristic. The percentage contributionsare calculated from an analysis of variance that effectively mea-sures how far the pulsation values for a specific geometry variablevary from the mean. The amount that the high and low parameterlevels vary from the mean provides a measure of that parameter’sinfluence on a particular quality characteristic. This is converted into a percentage value to provide a measure of the contribution rel-ative to the other parameters. Again percentage contributions havebeen calculated for each specific location and for all flow rates. Asummary of the contributions for the three flow conditions, atthe same locations as earlier, is provided in Tables 8–10 for flowrates 1.00Qn, 0.50Qn and 0.25Qn, respectively. The percentagecontributions provide a great deal of information regarding theimportance of the various geometric factors and it is interestingto observe how at some locations the trends are consistent acrossthe flow range, while other locations experience significantvariations.
In the leakage flow passageway the vane arrangement is thedominant parameter although this dominance reduces as the flowrate reduces, especially in locations circumferentially close to thecutwater. The cutwater gap shows a lesser contribution, howeverthis increases as the flow rate decreases and for locations circum-ferentially close to the cutwater. The snubber gap and sidewallclearance generally have a significantly lesser effect, although thiscan become more significant at lower flow rates. In the volute, thecutwater is the controlling parameter for pulsations close to thecutwater, with this influence decreasing significantly the greaterthe distance from the cutwater (i.e. down to 16% at C9 for1.00Qn). The vane arrangement shows the opposite trend, withits percentage contributions being around 30% close to the cutwa-ter and increasing to 80% prior to the splitter. The trends in pulsa-tion in the volute are relatively consistent across the flow rangeexamined, with the exception that snubber and sidewall clearanceshave an increased influence at the lower flow rates. At the impellertrailing edge the cutwater gap is effectively the sole parametereffecting the pressure pulsation at the duty flow condition and

Fig. 7. Cutwater gap normalised response averaged pressure pulsations.
R. Spence, J. Amaral-Teixeira / Computers & Fluids 38 (2009) 1243–1257 1251
although reduces at lower flows continues to be dominant. Thevane arrangement shows an increasing influence as the flow re-duces, with the snubber gap and sidewall varying in importancedepending on the flow rate. In relation to the performance charac-teristic, the cutwater gap exhibits the largest contribution to thepump generated head at all flows (this contribution is around90% at all flow rates). The power characteristic is again dominatedby the cutwater gap, especially at the higher flow rates, with thevane arrangement being of secondary importance. It is interestingto note that while the head and power contributions for the vanearrangement are relatively low, the contribution to the hydraulicefficiency at 1.00Qn and 0.50Qn is surprisingly large.
5.3. Interactive effects and predictive equations
The L9 array provides useful information in the form of the per-centage contributions, but does not provide information on inter-action effects between the geometric parameters. Of the fourfactors investigated, the cutwater gap and the vane arrangementare the two most important by a significant degree. An L4 Taguchiarray can now be used to gauge the interactive effect betweenthese two factors. The investigation was performed in two stages.For the first stage, a single array was formed for each flow rate,with the vane arrangement being limited to either being inline orwith a 30� stagger and the cutwater being variable between3.83% and 7.95%. Predictive equations can be generated, generalform shown by Eq. (1) [16], which can gauge the effect of the cut-water gap for both inline and staggered vanes. The second stage ar-ray was formed for each flow rate, for cutwater gap values of 3.83%and 7.95% and vane arrangements of 15� and 30� stagger. This ar-ray generated further equations that can be used to investigate the
relationship between the pulsation at specific pump locations andthe pump geometry.
yP ¼ yGM þDA
2
� �� Aþ DB
2
� �� Bþ DAB
2
� �� AB ð1Þ
5.3.1. Stage 1 (vane: inline and 30� stagger, cutwater gap values: 3.83%and 7.95%)
The array used for stage 1 is indicated in Table 11. The interac-tion between the cutwater gap and the vane arrangement is inves-tigated through representing the response averages in graphicalform. Fig. 10 provides an interaction plot at the 1.00Qn flow condi-tion for a selection of locations within the pump. Parallel lines indi-cate little or no interaction, whereas lines with very differentgradients indicate an interactive relationship between the param-eters being studied. Thus, interaction does exist between the twofactors examined, but not at every location. The interaction ap-pears strongest close to the trailing edge of the impeller and almostnon-existent at location C6. Similar plots (not shown) are producedfor the other flow rates; these indicate that as the flow rate reducesthe strength of the interactive effect can change significantlydepending on the location. Table 12 provides a list of the calculatedresponse averages, half effects (D/2) and grand mean values for aselection of pump locations for 1.00Qn and 0.25Qn flow conditions,inclusive of the interactive effect. A comparison of the half effectsshows that while the most important factor can switch betweenthe cutwater gap and the vane arrangement, the interaction effectsare never the most important and at positions away from theimpeller are generally the least influential factor.
From the above information predictive equations can be gener-ated to estimate the pressure pulsation at any of the reported
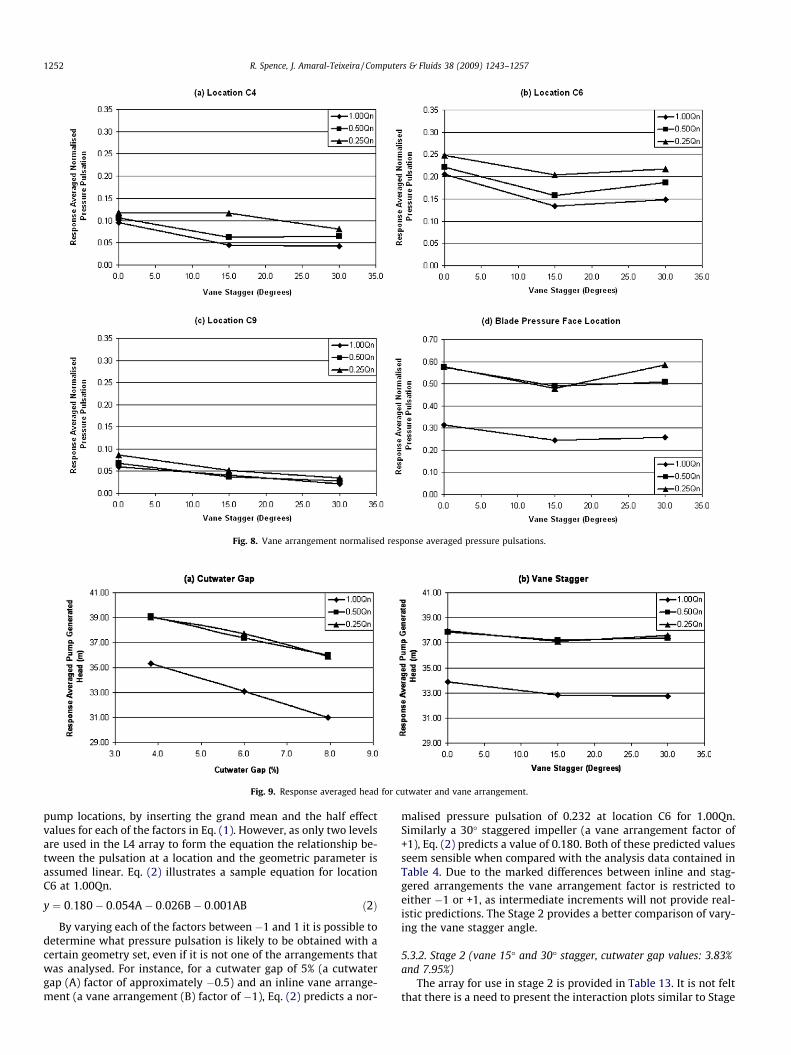
Fig. 8. Vane arrangement normalised response averaged pressure pulsations.
Fig. 9. Response averaged head for cutwater and vane arrangement.
1252 R. Spence, J. Amaral-Teixeira / Computers & Fluids 38 (2009) 1243–1257
pump locations, by inserting the grand mean and the half effectvalues for each of the factors in Eq. (1). However, as only two levelsare used in the L4 array to form the equation the relationship be-tween the pulsation at a location and the geometric parameter isassumed linear. Eq. (2) illustrates a sample equation for locationC6 at 1.00Qn.
y ¼ 0:180� 0:054A� 0:026B� 0:001AB ð2Þ
By varying each of the factors between �1 and 1 it is possible todetermine what pressure pulsation is likely to be obtained with acertain geometry set, even if it is not one of the arrangements thatwas analysed. For instance, for a cutwater gap of 5% (a cutwatergap (A) factor of approximately �0.5) and an inline vane arrange-ment (a vane arrangement (B) factor of �1), Eq. (2) predicts a nor-
malised pressure pulsation of 0.232 at location C6 for 1.00Qn.Similarly a 30� staggered impeller (a vane arrangement factor of+1), Eq. (2) predicts a value of 0.180. Both of these predicted valuesseem sensible when compared with the analysis data contained inTable 4. Due to the marked differences between inline and stag-gered arrangements the vane arrangement factor is restricted toeither �1 or +1, as intermediate increments will not provide real-istic predictions. The Stage 2 provides a better comparison of vary-ing the vane stagger angle.
5.3.2. Stage 2 (vane 15� and 30� stagger, cutwater gap values: 3.83%and 7.95%)
The array for use in stage 2 is provided in Table 13. It is not feltthat there is a need to present the interaction plots similar to Stage
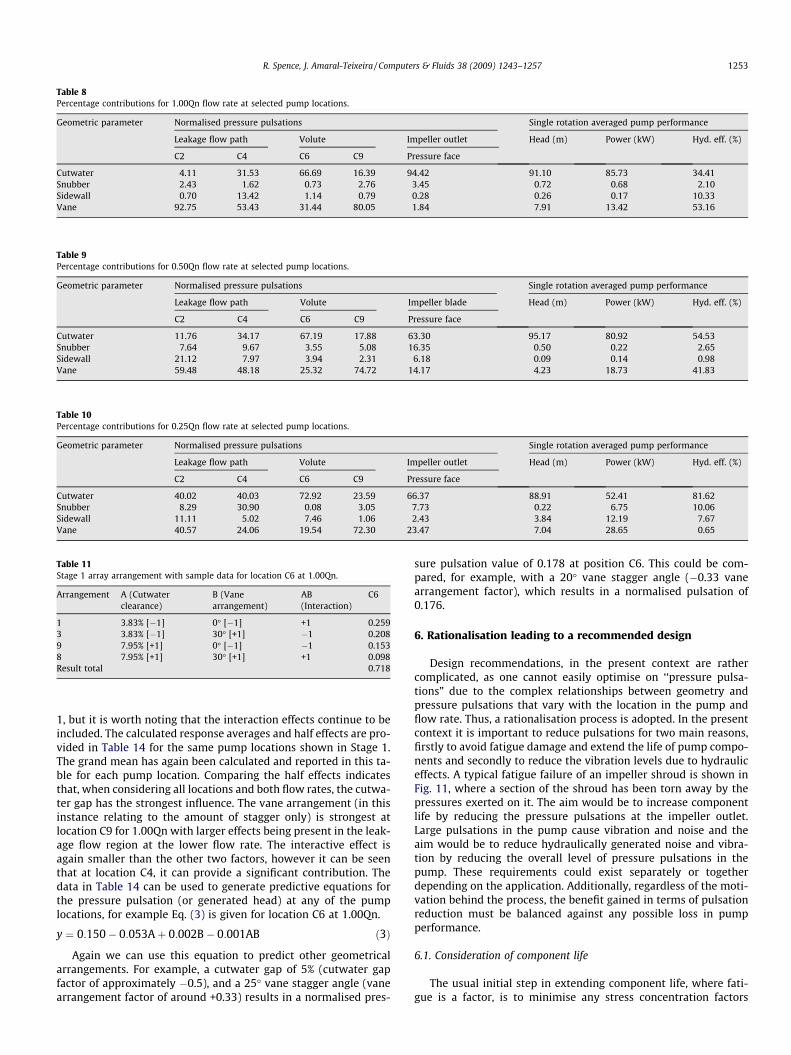
Table 8Percentage contributions for 1.00Qn flow rate at selected pump locations.
Geometric parameter Normalised pressure pulsations Single rotation averaged pump performance
Leakage flow path Volute Impeller outlet Head (m) Power (kW) Hyd. eff. (%)
C2 C4 C6 C9 Pressure face
Cutwater 4.11 31.53 66.69 16.39 94.42 91.10 85.73 34.41Snubber 2.43 1.62 0.73 2.76 3.45 0.72 0.68 2.10Sidewall 0.70 13.42 1.14 0.79 0.28 0.26 0.17 10.33Vane 92.75 53.43 31.44 80.05 1.84 7.91 13.42 53.16
Table 9Percentage contributions for 0.50Qn flow rate at selected pump locations.
Geometric parameter Normalised pressure pulsations Single rotation averaged pump performance
Leakage flow path Volute Impeller blade Head (m) Power (kW) Hyd. eff. (%)
C2 C4 C6 C9 Pressure face
Cutwater 11.76 34.17 67.19 17.88 63.30 95.17 80.92 54.53Snubber 7.64 9.67 3.55 5.08 16.35 0.50 0.22 2.65Sidewall 21.12 7.97 3.94 2.31 6.18 0.09 0.14 0.98Vane 59.48 48.18 25.32 74.72 14.17 4.23 18.73 41.83
Table 10Percentage contributions for 0.25Qn flow rate at selected pump locations.
Geometric parameter Normalised pressure pulsations Single rotation averaged pump performance
Leakage flow path Volute Impeller outlet Head (m) Power (kW) Hyd. eff. (%)
C2 C4 C6 C9 Pressure face
Cutwater 40.02 40.03 72.92 23.59 66.37 88.91 52.41 81.62Snubber 8.29 30.90 0.08 3.05 7.73 0.22 6.75 10.06Sidewall 11.11 5.02 7.46 1.06 2.43 3.84 12.19 7.67Vane 40.57 24.06 19.54 72.30 23.47 7.04 28.65 0.65
Table 11Stage 1 array arrangement with sample data for location C6 at 1.00Qn.
Arrangement A (Cutwaterclearance)
B (Vanearrangement)
AB(Interaction)
C6
1 3.83% [�1] 0� [�1] +1 0.2593 3.83% [�1] 30� [+1] �1 0.2089 7.95% [+1] 0� [�1] �1 0.1538 7.95% [+1] 30� [+1] +1 0.098Result total 0.718
R. Spence, J. Amaral-Teixeira / Computers & Fluids 38 (2009) 1243–1257 1253
1, but it is worth noting that the interaction effects continue to beincluded. The calculated response averages and half effects are pro-vided in Table 14 for the same pump locations shown in Stage 1.The grand mean has again been calculated and reported in this ta-ble for each pump location. Comparing the half effects indicatesthat, when considering all locations and both flow rates, the cutwa-ter gap has the strongest influence. The vane arrangement (in thisinstance relating to the amount of stagger only) is strongest atlocation C9 for 1.00Qn with larger effects being present in the leak-age flow region at the lower flow rate. The interactive effect isagain smaller than the other two factors, however it can be seenthat at location C4, it can provide a significant contribution. Thedata in Table 14 can be used to generate predictive equations forthe pressure pulsation (or generated head) at any of the pumplocations, for example Eq. (3) is given for location C6 at 1.00Qn.
y ¼ 0:150� 0:053Aþ 0:002B� 0:001AB ð3Þ
Again we can use this equation to predict other geometricalarrangements. For example, a cutwater gap of 5% (cutwater gapfactor of approximately �0.5), and a 25� vane stagger angle (vanearrangement factor of around +0.33) results in a normalised pres-
sure pulsation value of 0.178 at position C6. This could be com-pared, for example, with a 20� vane stagger angle (�0.33 vanearrangement factor), which results in a normalised pulsation of0.176.
6. Rationalisation leading to a recommended design
Design recommendations, in the present context are rathercomplicated, as one cannot easily optimise on ‘‘pressure pulsa-tions” due to the complex relationships between geometry andpressure pulsations that vary with the location in the pump andflow rate. Thus, a rationalisation process is adopted. In the presentcontext it is important to reduce pulsations for two main reasons,firstly to avoid fatigue damage and extend the life of pump compo-nents and secondly to reduce the vibration levels due to hydrauliceffects. A typical fatigue failure of an impeller shroud is shown inFig. 11, where a section of the shroud has been torn away by thepressures exerted on it. The aim would be to increase componentlife by reducing the pressure pulsations at the impeller outlet.Large pulsations in the pump cause vibration and noise and theaim would be to reduce hydraulically generated noise and vibra-tion by reducing the overall level of pressure pulsations in thepump. These requirements could exist separately or togetherdepending on the application. Additionally, regardless of the moti-vation behind the process, the benefit gained in terms of pulsationreduction must be balanced against any possible loss in pumpperformance.
6.1. Consideration of component life
The usual initial step in extending component life, where fati-gue is a factor, is to minimise any stress concentration factors
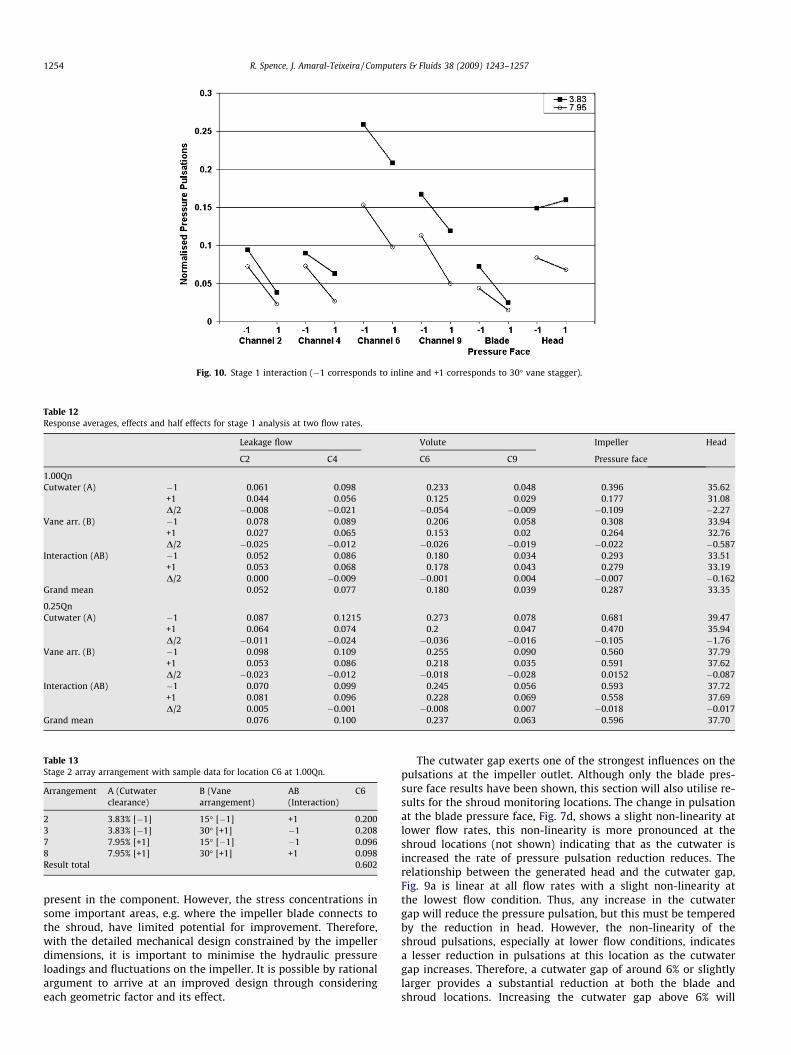
Fig. 10. Stage 1 interaction (�1 corresponds to inline and +1 corresponds to 30� vane stagger).
Table 12Response averages, effects and half effects for stage 1 analysis at two flow rates.
Leakage flow Volute Impeller Head
C2 C4 C6 C9 Pressure face
1.00QnCutwater (A) �1 0.061 0.098 0.233 0.048 0.396 35.62
+1 0.044 0.056 0.125 0.029 0.177 31.08D/2 �0.008 �0.021 �0.054 �0.009 �0.109 �2.27
Vane arr. (B) �1 0.078 0.089 0.206 0.058 0.308 33.94+1 0.027 0.065 0.153 0.02 0.264 32.76D/2 �0.025 �0.012 �0.026 �0.019 �0.022 �0.587
Interaction (AB) �1 0.052 0.086 0.180 0.034 0.293 33.51+1 0.053 0.068 0.178 0.043 0.279 33.19D/2 0.000 �0.009 �0.001 0.004 �0.007 �0.162
Grand mean 0.052 0.077 0.180 0.039 0.287 33.35
0.25QnCutwater (A) �1 0.087 0.1215 0.273 0.078 0.681 39.47
+1 0.064 0.074 0.2 0.047 0.470 35.94D/2 �0.011 �0.024 �0.036 �0.016 �0.105 �1.76
Vane arr. (B) �1 0.098 0.109 0.255 0.090 0.560 37.79+1 0.053 0.086 0.218 0.035 0.591 37.62D/2 �0.023 �0.012 �0.018 �0.028 0.0152 �0.087
Interaction (AB) �1 0.070 0.099 0.245 0.056 0.593 37.72+1 0.081 0.096 0.228 0.069 0.558 37.69D/2 0.005 �0.001 �0.008 0.007 �0.018 �0.017
Grand mean 0.076 0.100 0.237 0.063 0.596 37.70
Table 13Stage 2 array arrangement with sample data for location C6 at 1.00Qn.
Arrangement A (Cutwaterclearance)
B (Vanearrangement)
AB(Interaction)
C6
2 3.83% [�1] 15� [�1] +1 0.2003 3.83% [�1] 30� [+1] �1 0.2087 7.95% [+1] 15� [�1] �1 0.0968 7.95% [+1] 30� [+1] +1 0.098Result total 0.602
1254 R. Spence, J. Amaral-Teixeira / Computers & Fluids 38 (2009) 1243–1257
present in the component. However, the stress concentrations insome important areas, e.g. where the impeller blade connects tothe shroud, have limited potential for improvement. Therefore,with the detailed mechanical design constrained by the impellerdimensions, it is important to minimise the hydraulic pressureloadings and fluctuations on the impeller. It is possible by rationalargument to arrive at an improved design through consideringeach geometric factor and its effect.
The cutwater gap exerts one of the strongest influences on thepulsations at the impeller outlet. Although only the blade pres-sure face results have been shown, this section will also utilise re-sults for the shroud monitoring locations. The change in pulsationat the blade pressure face, Fig. 7d, shows a slight non-linearity atlower flow rates, this non-linearity is more pronounced at theshroud locations (not shown) indicating that as the cutwater isincreased the rate of pressure pulsation reduction reduces. Therelationship between the generated head and the cutwater gap,Fig. 9a is linear at all flow rates with a slight non-linearity atthe lowest flow condition. Thus, any increase in the cutwatergap will reduce the pressure pulsation, but this must be temperedby the reduction in head. However, the non-linearity of theshroud pulsations, especially at lower flow conditions, indicatesa lesser reduction in pulsations at this location as the cutwatergap increases. Therefore, a cutwater gap of around 6% or slightlylarger provides a substantial reduction at both the blade andshroud locations. Increasing the cutwater gap above 6% will

Table 14Response averages, effects and half effects for stage 2 analysis at two flow rates.
Leakage flow Volute Impeller Head
C2 C4 C6 C9 Pressure face
1.00QnCutwater (A) �1 0.039 0.081 0.204 0.037 0.356 34.95
+1 0.031 0.039 0.097 0.024 0.161 30.61D/2 �0.004 �0.021 �0.053 �0.006 �0.097 �2.172
Vane arr. (B) �1 0.043 0.054 0.148 0.041 0.253 32.80+1 0.027 0.065 0.153 0.02 0.264 32.76D/2 �0.008 0.005 0.002 �0.011 0.005 �0.017
Interaction (AB) �1 0.0395 0.068 0.152 0.029 0.278 33.04+1 0.031 0.051 0.149 0.032 0.240 32.52D/2 �0.004 �0.008 �0.001 0.001 �0.019 �0.262
Grand mean 0.035 0.060 0.150 0.031 0.259 32.78
0.25QnCutwater (A) �1 0.091 0.15 0.265 0.055 0.647 38.79
+1 0.043 0.059 0.172 0.034 0.447 35.85D/2 �0.024 �0.045 �0.047 �0.010 �0.100 �1.47
Vane arr. (B) �1 0.082 0.123 �0.047 0.055 0.503 37.02+1 0.053 0.086 �0.047 0.035 0.591 37.62D/2 �0.014 �0.019 �0.001 �0.010 0.044 0.297
Interaction (AB) �1 0.049 0.084 0.217 0.043 0.570 37.63+1 0.085 0.125 0.220 0.046 0.524 37.01D/2 0.018 0.020 0.002 0.001 �0.023 �0.307
Grand mean 0.067 0.105 0.219 0.045 0.547 37.32
Fig. 11. Typical impeller shroud failure.
R. Spence, J. Amaral-Teixeira / Computers & Fluids 38 (2009) 1243–1257 1255
provide a lower amount of pulsation reduction at the shroud for acontinuing reduction in head.
The vane arrangement has a mixed effect on the pressure pulsa-tions at the impeller outlet. Fig. 8d shows that the staggeredarrangement appears to decrease the pulsations at the impellerblade tip at all flow rates (with the exception of the 30� staggerat the lowest flow condition). At shroud locations (not shown),both staggered arrangements provide significant pulsation reduc-tions in comparison to the inline blade impeller. Fig. 9b indicatesthat while a staggered impeller will reduce the generated head,the 15� stagger involves a greater reduction that the 30� stagger.As the failure mechanism for impellers is focused at the impellervane/shroud connection caused by pressure across the shroud spanat outlet, it is judged that reduction of pressure variation at theimpeller outlet is of significant importance when considering thelife of the impeller. On this basis a staggered impeller is a betteroption than the inline impeller. However, there is some uncer-tainty whether the 30� stagger should be preferred over the 15�arrangement.
It is considered that a tight snubber gap will prevent the pulsa-tion from passing into the leakage flow area; causing the pulsationenergy to remain close to the impeller outlet. Conversely, a largesnubber gap allows the pulsation to pass into the leakage flow re-gion causing large shifts in pressure, which can cause shuttling ifthe gap is sufficiently large [17]. Therefore, some mid size snubbergap that is large enough to allow the pulsation to pass away fromthe impeller tip into the leakage path, yet not enough to cause theshuttling effect is required. In industry, a general rule of thumbrelating to the snubber gap is that the length of the snubber gapshould be approximately six times its height in order to attenuatethe pressure pulsations. The shroud thickness for the analysedimpeller is 7 mm, indicating that the ‘‘maximum” snubber gapaccording to these rules would be 0.64% (3 mm in this study). Asthe snubber gap can cause some reduction in pulsation at the low-er flow rates, it is recommended that the snubber gap be calculatedusing the 0.64% figure and rounded up to the nearest millimetre.
The sidewall clearance exhibits only a small effect on the pulsa-tion at the impeller outlet region, and any contribution occurs atthe lower flow conditions. Thus, while the sidewall clearance hasno apparent effect on the performance of the pump, results indi-cate that maintaining a 100% clearance gap (12 mm for this study)may provide slight benefits at lower flows.
6.2. Pump noise and vibration levels
The pump noise and vibration levels due to blade passing fre-quency relates directly to general pulsation levels within thepump. Published literature by Srivastav et al. [18] has noted thatthe blade passing frequency dominates the vibration spectra andgoverns the overall vibration level, with the strength of the fre-quency being dependent on the radial gap. These unsteady interac-tions are also related to the radial force due to an imbalance in thepressure field at the impeller outlet, which is a cause of pumpvibration. Therefore, both the vibration and acoustic levels can berelated in some manner to the general variation in pressure withinin the pump.
The influence of the cutwater gap is largest close to the cutwa-ter, but its influence reduces significantly over a relatively smalldistance. The response averages plotted in Fig. 7a, (C6), indicatethat there is a greater reduction in the pulsation in these regions

1256 R. Spence, J. Amaral-Teixeira / Computers & Fluids 38 (2009) 1243–1257
up to a cutwater gap of 6.00% than for larger gap values, for a sim-ilar reduction in head. Location C9, Fig. 7c indicates that away fromthe cutwater there is a lesser effect with a similar trend to thatshown at locations C4 and C6. Thus, 6.00% appears to provide asubstantial pressure pulsation reduction in the pump while limit-ing the reduction in the generated head.
A staggered impeller provides significant reductions in pulsa-tion at most locations in the volute, especially those that are cir-cumferentially distant from the cutwater. Both staggered vanearrangements provide significant benefits over the inline arrange-ment at 1.00Qn and 0.50Qn and in some cases 15� is better than30�. Fig. 9b indicates that a 30� stagger generates a consistentlyhigher head than the 15� arrangement. This is unexpected as gen-eral opinion in industry considers that a mid position staggerforces the jet flow from one side of the impeller to mix with wakeflow on the opposite side resulting in relatively high mixing losses.A plot of the axial movement of fluid (i.e. mixing) over a 2D annulararea at the impeller outlet is plotted in Fig. 12 for the 30� and 15�stagger angles, respectively (impeller blade positions are shown). Itis immediately apparent that the 30� vane stagger arrangement(Fig. 12a) includes axial mixing of the flow over a considerably lar-ger area than the 15� stagger (Fig. 12b), where a higher level ofmixing is indicated by a darker region. However, this larger mixingregion does not appear to have had a significant effect on the pumpgenerated head, although for other impeller designs this may notbe the case. This is can likely be attributed to the 30� arrangementallowing a large amount of diffusion as the flow exits the impellerresulting in a lower fluctuation in flow rate. Therefore, in this casea 30� vane arrangement is recommended but this cannot be a uni-versal recommendation.
Both the snubber gap and sidewall clearance parameters havesmall effect on the pulsation according to the percentage contribu-tions. Therefore, for noise and vibration considerations neitherparameter contributes significantly for the sizes analysed.
6.3. Final recommendations
Although the pump geometry has been examined using two dif-ferent motivations there is some agreement between the two. Con-sideration of the two rationalised arrangements allows a final‘‘optimised” or recommended arrangement to be selected,
� The minimum cutwater gap should be 6% of the impeller diam-eter (11 mm in this study).
Fig. 12. Axial velocity at the impeller outlet, illustrating mix
� The vane arrangement should use a 30� stagger (i.e. a mid posi-tion stagger).
� The diametral snubber gap should be approximately 0.64% of theimpeller diameter, rounded to the nearest millimetre (3 mm inthis study).
� The sidewall clearance should be 100% (12 mm in this study).
7. Conclusions
A numerical model of an entire double entry, double volute cen-trifugal pump has been used to conduct a parametric study cover-ing four main geometric parameters. The parameters include thecutwater gap, vane arrangement, snubber gap and sidewall clear-ance, with three different configurations being used for eachparameter. A total of 33 transient analyses have been conducted,representing 45,000 h of continual analysis time and consistingof over 550 GB of analysis and result data. The pressure levels pre-dicted by the numerical analysis give rise to an enormous andinteresting data set. The results have been presented by concen-trating on selected locations around the pump.
An L9 Taguchi array has been successfully constructed for 15pressure monitoring locations and three performance character-istics. The analysis of the array identified the dominant geomet-rical influences on the pulsations and the performance of thepump. In general, the cutwater gap and vane arrangement arethe two strongest influences on the pressure pulsation, withthe snubber gap and sidewall clearance being considerably lessimportant. Detailed information has been presented on pressurepulsations and performance characteristics both in terms of non-dimensional values and percentage contributions, which will as-sist understanding of the pump behaviour and the effect of thegeometric variables.
Smaller L4 Taguchi arrays have been employed to determine theimportance of the interactive effect between the cutwater gap andvane arrangement. The interactive effect can be more importantthan the parameter of secondary importance, but is never as largeas the dominant parameter. Basic information has been presented,which allows predictive equations to be obtained that can identifyexpected pressure pulsations at specific pump locations forarrangements different from those analysed. The equations arelimited to linear relationships and are bounded by the maximumand minimum values used for the relevant geometric parametersused in the analyses.
ing between the two sides of the double entry impeller.
R. Spence, J. Amaral-Teixeira / Computers & Fluids 38 (2009) 1243–1257 1257
The pressure pulsation information has been used with a viewto firstly, increasing the component life and secondly, reduce thenoise and vibration. This has been achieved through a rationalisa-tion process and geometric recommendations have been derivedthat satisfy both requirements. These guidelines should be usefulto designers.
Acknowledgements
This work was supported throughout by Clyde Pumps Limitedand Cranfield University.
References
[1] Uchida N, Inaichi K, Shirai T. Radial force on the impeller of a centrifugal pump.Bull Jpn Soc Mech Eng 1971;14:1106–17.
[2] Makay E, Szamody O. Survey of feed pump outages. Prepared for Electric PowerResearch Institute Research, Project 641. Report: FR-754; 1978.
[3] Spence R, Purdom T. Prediction of impeller loadings using CFD analysistechniques. Presented at IMechE seminar, up and coming in fluid machinery.London: IMechE; 17th November 1999.
[4] Makay E, Szamody O. Recommended design guidelines for feedwater pump inlarge power generating units (1980). Prepared for Electric Power ResearchInstitute Research, Project 1266-18, Report: CS-1512; 1980.
[5] Sudo S, Komatsu T, Kondo M. Pumping plant noise reduction: reduction ofpressure pulsation in pump discharge pipe systems. Hitachi Rev1980;29(5):217–22.
[6] Gallimore S. Axial flow compressor design. Presented at the successfulexploitation of CFD in turbomachinery design. 1 Birdcage Walk, London:IMechE; 19th March 1998.
[7] Denton J, Dawes W. CFD for turbomachinery design. Presented at IMechEseminar the successful exploitation of CFD in turbomachinery design. London;19th March 1998.
[8] González-Pérez J, Parrondo J, Santolaria C, Blanco E. Steady and unsteady radialforces for a centrifugal pump with impeller to tongue gap variation. ASME JFluids Eng 2006;128:454–62.
[9] Blanco E, Parrondo JL, Barrio R, González J, Santolaria C, Fernández J. Fluid-dynamic radial forces at the blade-passing frequency in a centrifugal pumpwith different impeller diameters. In: IAHR international meeting of the workgroup on cavitation and dynamic problems in hydraulic machinery andsystems, 28–30 June 2006, Barcelona, Spain.
[10] Spence RRG, Teixeira JA. Investigation into pressure pulsations in a centrifugalpump by numerical and experimental methods. J Comput Fluids2008;37:690–704.
[11] Spence RRG, Teixeira JA. A CFD analysis of a complete double entry centrifugalpump. In: Proceedings of the 15th annual meeting of the association ofcomputational mechanics in engineering, Glasgow, UK, 2nd–3rd April 2007.
[12] Koumoutsos A. Unsteady flow interactions in centrifugal turbomachineryconfigurations. Unpublished PhD Thesis. Cranfield: Cranfield University; 1999.
[13] Longatte F, Kueny JL. Analysis of rotor–stator–circuit interactions in acentrifugal pump. ASME paper FEDSM99-6866; 1999.
[14] Talha A. Etude hydroacoustique d’une pompe centrifuge et de son circuitimmédiat par l’analyse expérimentale des pressions et des vitesseinstationnaires. PhD Thesis. Université de Lille; 1996. Cited in: Longatte F,Kueny JL. Analysis of rotor–stator–circuit interactions in a centrifugal pump.ASME paper FEDSM99-6866; 1999.
[15] Roy R. A primer on the Taguchi method. New York: Van Nostrand Reinhold; 1990.[16] Schmidt S, Launsby R. Understanding industrial designed experiments. 4th
ed. Colorado Springs: Air Academy Press; 2005.[17] Makay E, Nass D. Gap-narrowing rings make booster pumps quiet at low flow.
Power 1982:87–8.[18] Srivastav OP, Pandu KRM, Gupta K. Effect of radial gap between impeller and
diffuser on vibration and noise in a centrifugal pump. Institute of MechanicalEngineers (India). Tech J Mech Eng MC1 2003;84:36–9.