A Case Study Report on Assessment of Eutrophication Status in ... · A Case Study Report on...
22
A Case Study Report on Assessment of Eutrophication Status in Changjiang (Yangtze) River Estuary and its Adjacent Area, China Chinese Academy of Science Institute of Oceanology July 2011
Transcript of A Case Study Report on Assessment of Eutrophication Status in ... · A Case Study Report on...
A Case Study Report
on Assessment of Eutrophication Status
in Changjiang (Yangtze) River Estuary and its
Adjacent Area, China
Chinese Academy of Science
Institute of Oceanology
July 2011
Contents 1 Scope of Assessment......................................................................................................................1
1.1 Selection of assessment area ..........................................................................................1 1.2 Collection of relevant information .................................................................................4
1.2.1 Information on the assessment area that is necessary and relevant to eutrophication assessment.................................................................................4
1.2.2 Eutrophication related information/data from organizations: .............................5 1.3 Selection of assessment parameters ...............................................................................6
1.3.1 Categorization of monitored parameters .............................................................6 1.3.2 Selection of assessment parameters of each assessment category ......................6 1.3.3 Setting the assessment values..............................................................................9 1.3.4 Setting subareas...................................................................................................9
2 Data processing..............................................................................................................................9 3 Setting of assessment criteria .......................................................................................................10
3.1 Setting of identification criteria of the assessment data ...............................................10 3.2 Setting of classification criteria of the assessment parameters ....................................10
4 Assessment process and results....................................................................................................12 4.1 Assessment categories..................................................................................................12
4.1.1 Assessment of Category I..................................................................................12 4.1.2 Assessment of Category II ................................................................................14 4.1.3 Assessment of Category III ...............................................................................15
4.2 Assessment results .......................................................................................................16 5 Conclusion and recommendations ...............................................................................................18
5.1 Conclusion ...................................................................................................................18 5.2 Recommendations........................................................................................................18
References.......................................................................................................................................19
1
1 Scope of Assessment
1.1 Selection of assessment area
The Changjiang River Estuary is the largest estuary in China. The length of it from Xuliujing to the mouth is about 110 km and the width of estuary mouth is about 90 km. It is a mesotidal, partially mixed estuary characterized by semidiural tides, with a mean tidal amplitude of 2.8 m (Shi, 2004) and tidal currents of 1.0 - 2.0 m s-1.
The Changjiang River’s basin is characterized by many industrial and urban centers, especially along its lower reaches and the estuary. With the influence of the dense population, the extensive use of chemical fertilizers and domestic waste, the Changjiang River Estuary is facing the challenge of environmental deterioration. In recent decades, the Changjiang River Estuary has received a high loading of anthropogenic nutrients from more and more activities in agriculture, sewage due to massive economic growth and urban development. Investigations revealed that concentrations of nitrogen and phosphorus increased both inshore and offshore from the 1960s to 2004. Nitrate concentrations inshore increased nearly 9-fold since the early 1960s. Nitrate concentrations inshore demonstrated a fast ascending trend from 1960s to 1980s, which plateaued by the 1990s, and since then, the nitrate concentration has increased slowly. Also, SRP concentrations have increased about 3- to 4-fold since the 1960s.
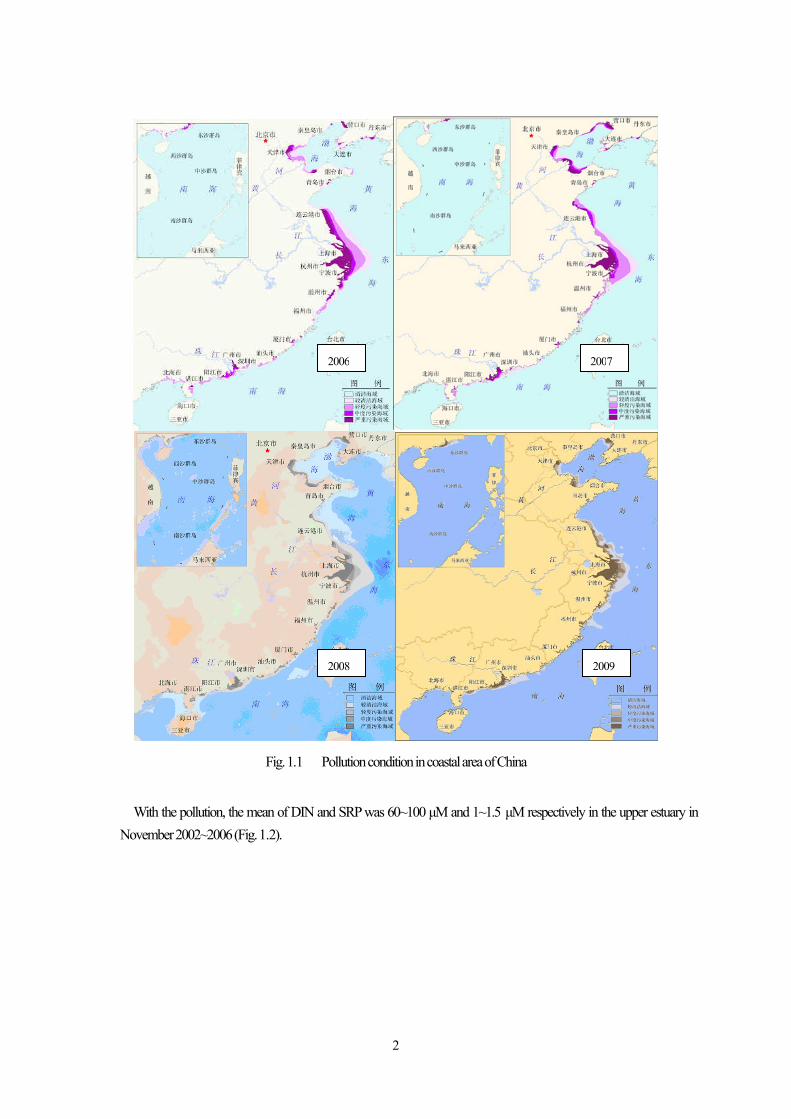
According to Bulletin of Marine Environmental Quality of China, pollution conditions in coastal area of China in 2006~2009 are presented in Fig. 1.1 (State Oceanic Administration, 2006~2009). It can be concluded that pollution in the Changjiang River estuary is the most serious in coastal area of China. It should be noted that the main pollutants in this estuary are inorganic nitrogen, soluble reactive phosphorus and petroleum and the pollution is more serious inshore than offshore.
2
Fig. 1.1 Pollution condition in coastal area of China
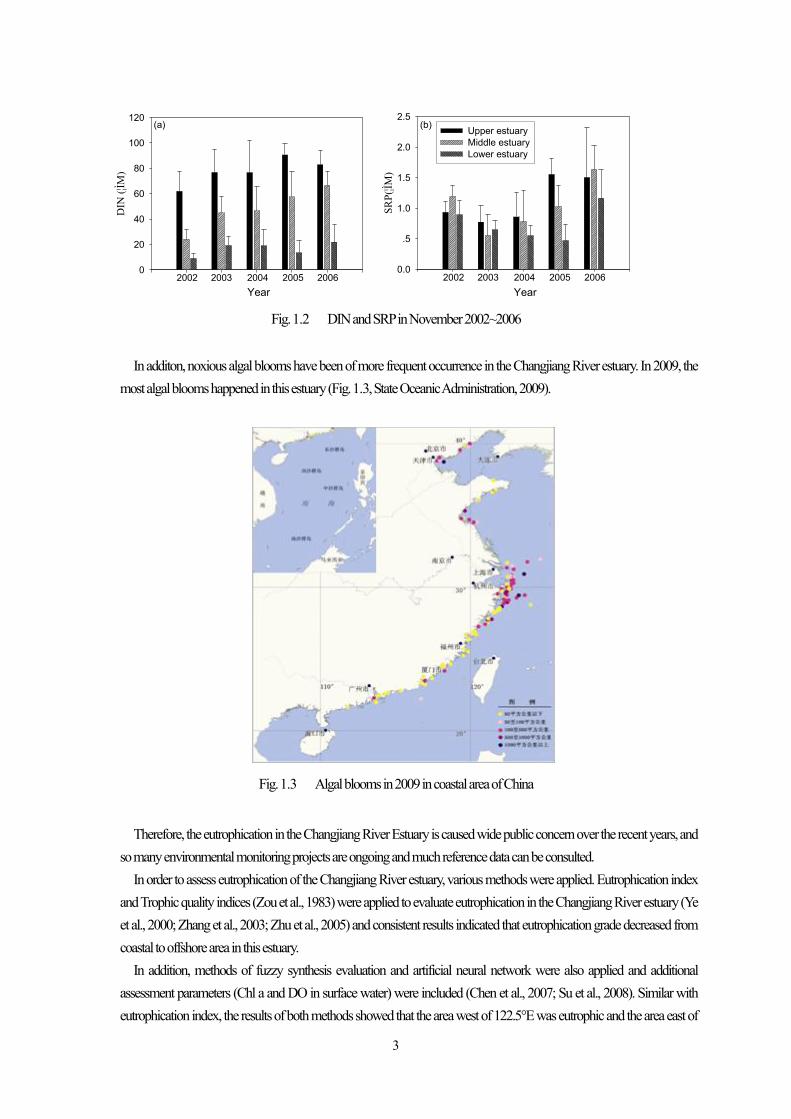
With the pollution, the mean of DIN and SRP was 60~100 μM and 1~1.5 μM respectively in the upper estuary in November 2002~2006 (Fig. 1.2).
2006 2007
2008 2009
3
DIN
(¦ÌM
)
0
20
40
60
80
100
120
2002 2003 2004 2005 2006
(a)
Year
SRP(
¦ÌM)
0.0
.5
1.0
1.5
2.0
2.5Upper estuaryMiddle estuaryLower estuary
2002 2003 2004 2005 2006
(b)
Year
Fig. 1.2 DIN and SRP in November 2002~2006
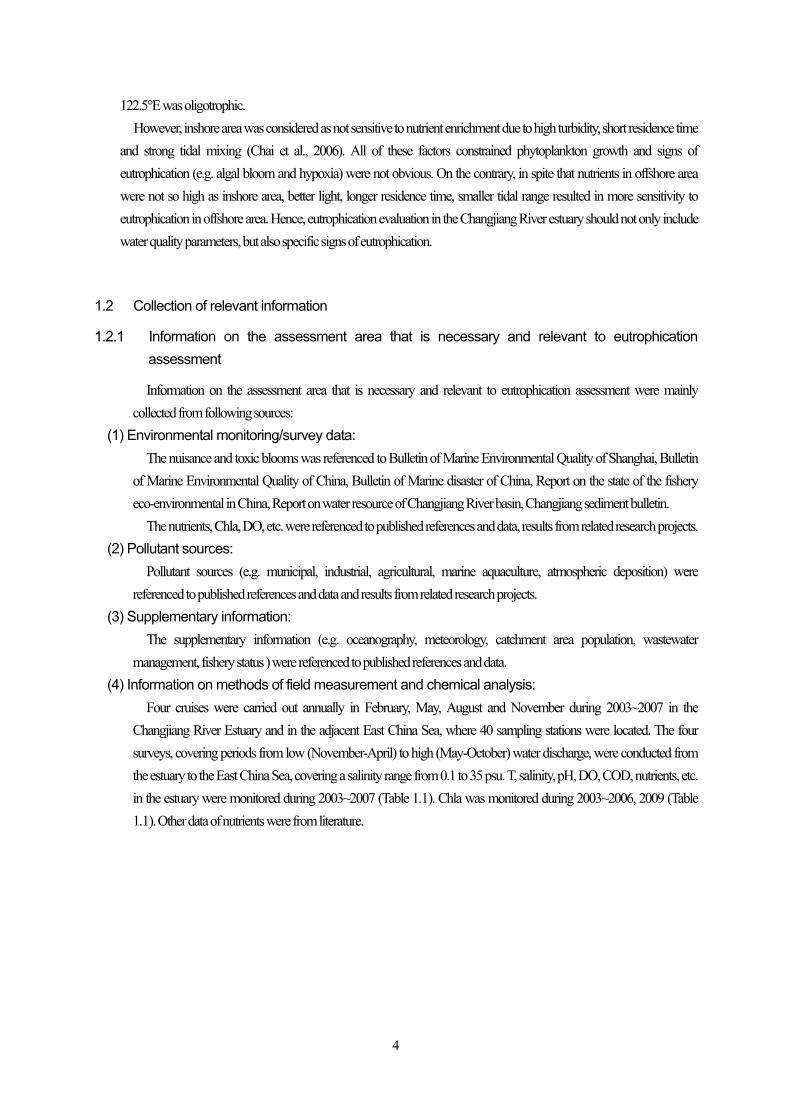
In additon, noxious algal blooms have been of more frequent occurrence in the Changjiang River estuary. In 2009, the most algal blooms happened in this estuary (Fig. 1.3, State Oceanic Administration, 2009).
Fig. 1.3 Algal blooms in 2009 in coastal area of China
Therefore, the eutrophication in the Changjiang River Estuary is caused wide public concern over the recent years, and so many environmental monitoring projects are ongoing and much reference data can be consulted.
In order to assess eutrophication of the Changjiang River estuary, various methods were applied. Eutrophication index and Trophic quality indices (Zou et al., 1983) were applied to evaluate eutrophication in the Changjiang River estuary (Ye et al., 2000; Zhang et al., 2003; Zhu et al., 2005) and consistent results indicated that eutrophication grade decreased from coastal to offshore area in this estuary.
In addition, methods of fuzzy synthesis evaluation and artificial neural network were also applied and additional assessment parameters (Chl a and DO in surface water) were included (Chen et al., 2007; Su et al., 2008). Similar with eutrophication index, the results of both methods showed that the area west of 122.5°E was eutrophic and the area east of
4
122.5°E was oligotrophic. However, inshore area was considered as not sensitive to nutrient enrichment due to high turbidity, short residence time
and strong tidal mixing (Chai et al., 2006). All of these factors constrained phytoplankton growth and signs of eutrophication (e.g. algal bloom and hypoxia) were not obvious. On the contrary, in spite that nutrients in offshore area were not so high as inshore area, better light, longer residence time, smaller tidal range resulted in more sensitivity to eutrophication in offshore area. Hence, eutrophication evaluation in the Changjiang River estuary should not only include water quality parameters, but also specific signs of eutrophication.
1.2 Collection of relevant information
1.2.1 Information on the assessment area that is necessary and relevant to eutrophication assessment
Information on the assessment area that is necessary and relevant to eutrophication assessment were mainly collected from following sources:
(1) Environmental monitoring/survey data: The nuisance and toxic blooms was referenced to Bulletin of Marine Environmental Quality of Shanghai, Bulletin
of Marine Environmental Quality of China, Bulletin of Marine disaster of China, Report on the state of the fishery eco-environmental in China, Report on water resource of Changjiang River basin, Changjiang sediment bulletin.
The nutrients, Chla, DO, etc. were referenced to published references and data, results from related research projects. (2) Pollutant sources:
Pollutant sources (e.g. municipal, industrial, agricultural, marine aquaculture, atmospheric deposition) were referenced to published references and data and results from related research projects.
(3) Supplementary information: The supplementary information (e.g. oceanography, meteorology, catchment area population, wastewater
management, fishery status ) were referenced to published references and data. (4) Information on methods of field measurement and chemical analysis:
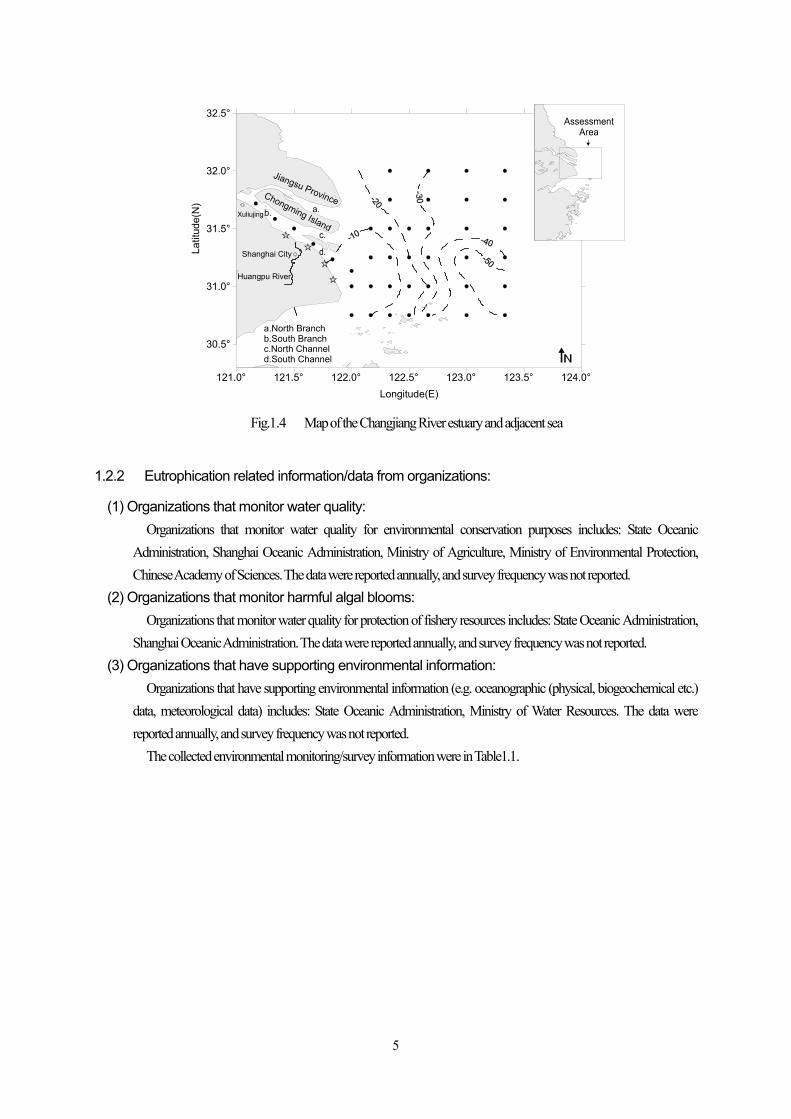
Four cruises were carried out annually in February, May, August and November during 2003~2007 in the Changjiang River Estuary and in the adjacent East China Sea, where 40 sampling stations were located. The four surveys, covering periods from low (November-April) to high (May-October) water discharge, were conducted from the estuary to the East China Sea, covering a salinity range from 0.1 to 35 psu. T, salinity, pH, DO, COD, nutrients, etc. in the estuary were monitored during 2003~2007 (Table 1.1). Chla was monitored during 2003~2006, 2009 (Table 1.1). Other data of nutrients were from literature.
5
121.0° 121.5° 122.0° 122.5° 123.0° 123.5° 124.0°Longitude(E)
30.5°
31.0°
31.5°
32.0°
32.5°
Latit
ude(
N)
Shanghai City
Xuliujing
Chongming Island
Jiangsu Provincea.b.
c.
d.
a.North Branchb.South Branchc.North Channeld.South Channel
Assessment Area
Huangpu River
Fig.1.4 Map of the Changjiang River estuary and adjacent sea
1.2.2 Eutrophication related information/data from organizations:
(1) Organizations that monitor water quality: Organizations that monitor water quality for environmental conservation purposes includes: State Oceanic
Administration, Shanghai Oceanic Administration, Ministry of Agriculture, Ministry of Environmental Protection, Chinese Academy of Sciences. The data were reported annually, and survey frequency was not reported.
(2) Organizations that monitor harmful algal blooms: Organizations that monitor water quality for protection of fishery resources includes: State Oceanic Administration,
Shanghai Oceanic Administration. The data were reported annually, and survey frequency was not reported. (3) Organizations that have supporting environmental information:
Organizations that have supporting environmental information (e.g. oceanographic (physical, biogeochemical etc.) data, meteorological data) includes: State Oceanic Administration, Ministry of Water Resources. The data were reported annually, and survey frequency was not reported.
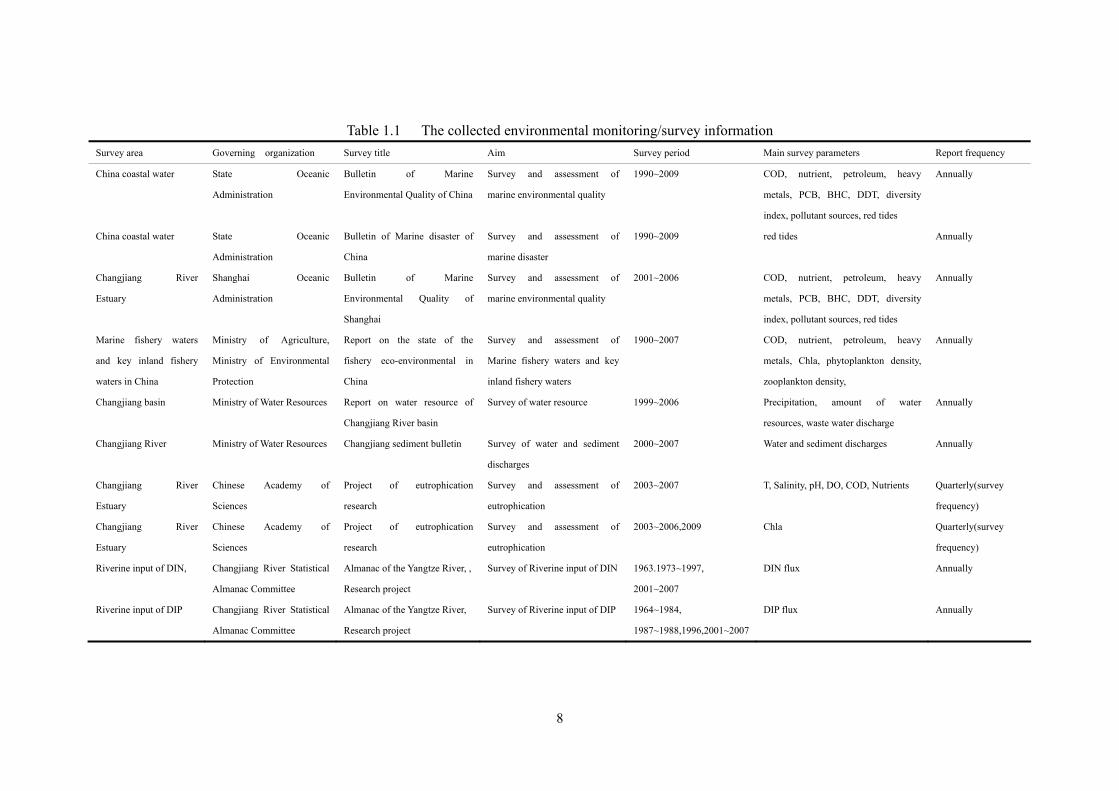
The collected environmental monitoring/survey information were in Table1.1.
6
1.3 Selection of assessment parameters
1.3.1 Categorization of monitored parameters
From the selected environmental monitoring programs, all eutrophication related parameters that are monitored within the assessment area were categorized into one of the following 3 assessment categories (Table 1.2):
(1) Category I Parameters that indicate degree of nutrient enrichment (2) Category II Parameters that indicate direct effects of nutrient enrichment (3) Category III Parameters that indicate indirect effects of nutrient enrichment
1.3.2 Selection of assessment parameters of each assessment category
Considering assessment parameters that are applicable for the assessment procedure on the basis of their data reliability and continuity, assessment parameters were set as following (Table 1.2):
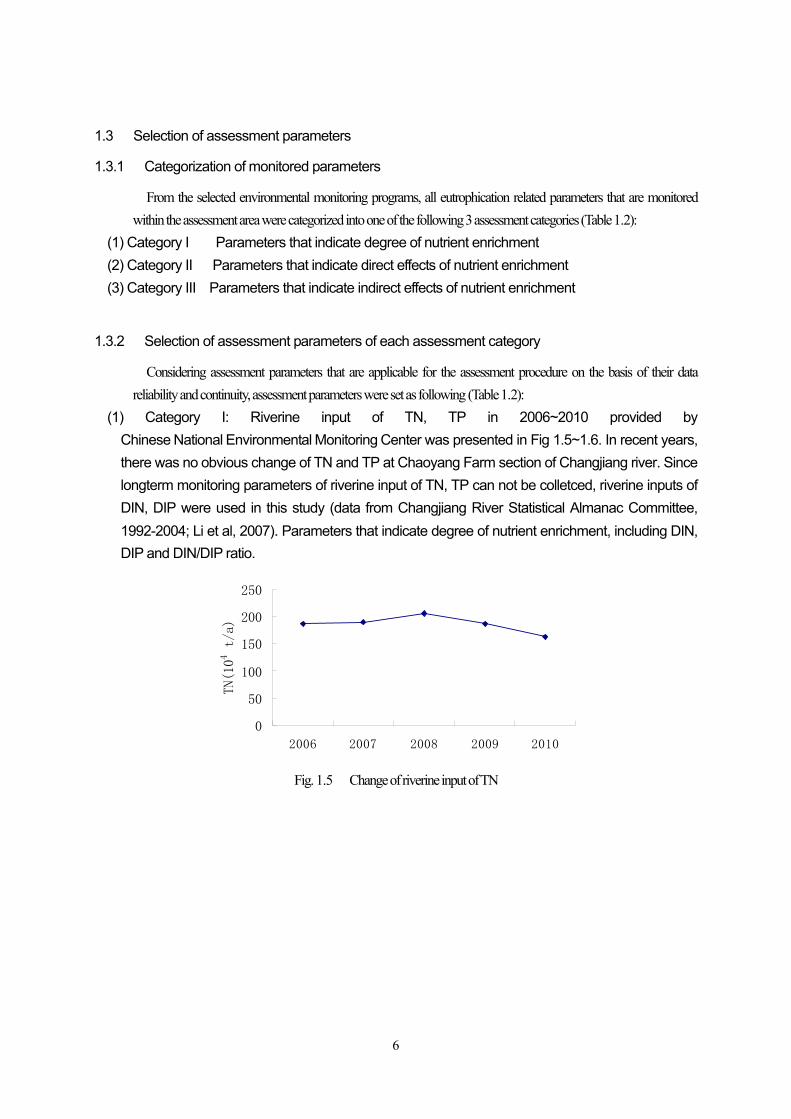
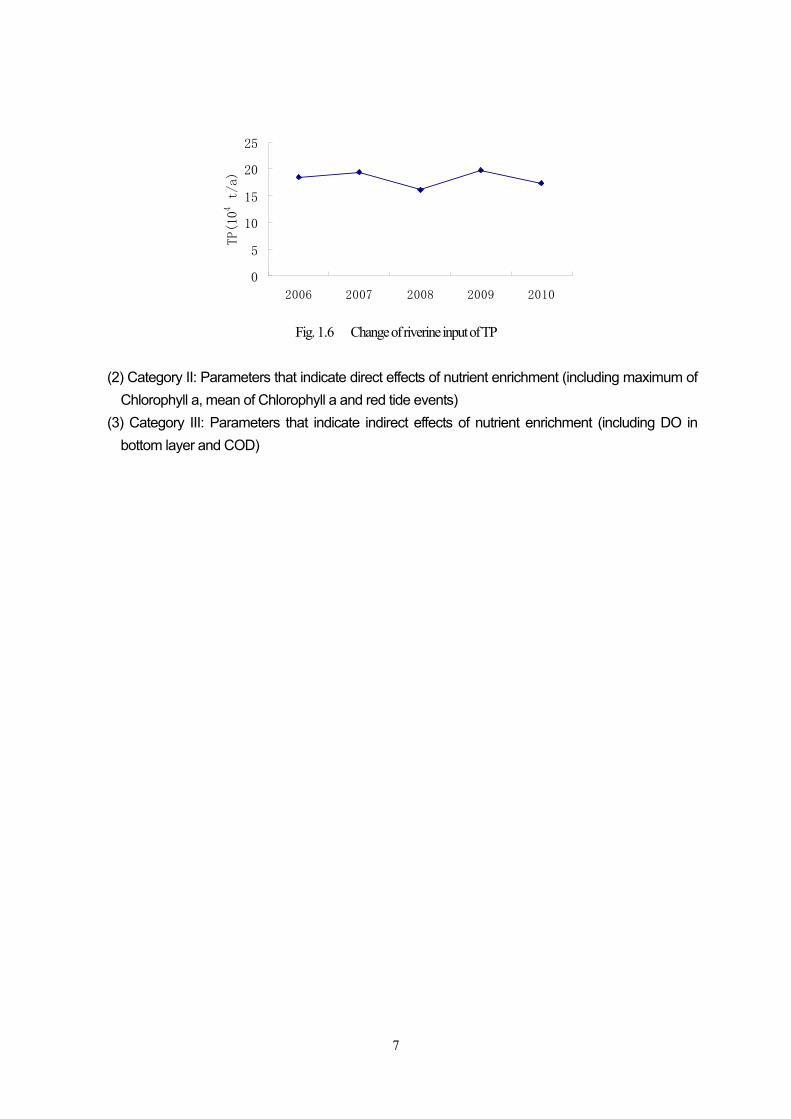
(1) Category I: Riverine input of TN, TP in 2006~2010 provided by Chinese National Environmental Monitoring Center was presented in Fig 1.5~1.6. In recent years, there was no obvious change of TN and TP at Chaoyang Farm section of Changjiang river. Since longterm monitoring parameters of riverine input of TN, TP can not be colletced, riverine inputs of DIN, DIP were used in this study (data from Changjiang River Statistical Almanac Committee, 1992-2004; Li et al, 2007). Parameters that indicate degree of nutrient enrichment, including DIN, DIP and DIN/DIP ratio.
0
50
100
150
200
250
2006 2007 2008 2009 2010
TN(10
4 t
/a)
Fig. 1.5 Change of riverine input of TN
7
0
5
10
15
20
25
2006 2007 2008 2009 2010
TP(10
4 t/a)
Fig. 1.6 Change of riverine input of TP
(2) Category II: Parameters that indicate direct effects of nutrient enrichment (including maximum of Chlorophyll a, mean of Chlorophyll a and red tide events)
(3) Category III: Parameters that indicate indirect effects of nutrient enrichment (including DO in bottom layer and COD)
8
Table 1.1 The collected environmental monitoring/survey information Survey area Governing organization Survey title Aim Survey period Main survey parameters Report frequency
China coastal water State Oceanic
Administration
Bulletin of Marine
Environmental Quality of China
Survey and assessment of
marine environmental quality
1990~2009 COD, nutrient, petroleum, heavy
metals, PCB, BHC, DDT, diversity
index, pollutant sources, red tides
Annually
China coastal water State Oceanic
Administration
Bulletin of Marine disaster of
China
Survey and assessment of
marine disaster
1990~2009 red tides Annually
Changjiang River
Estuary
Shanghai Oceanic
Administration
Bulletin of Marine
Environmental Quality of
Shanghai
Survey and assessment of
marine environmental quality
2001~2006 COD, nutrient, petroleum, heavy
metals, PCB, BHC, DDT, diversity
index, pollutant sources, red tides
Annually
Marine fishery waters
and key inland fishery
waters in China
Ministry of Agriculture,
Ministry of Environmental
Protection
Report on the state of the
fishery eco-environmental in
China
Survey and assessment of
Marine fishery waters and key
inland fishery waters
1900~2007 COD, nutrient, petroleum, heavy
metals, Chla, phytoplankton density,
zooplankton density,
Annually
Changjiang basin Ministry of Water Resources Report on water resource of
Changjiang River basin
Survey of water resource 1999~2006 Precipitation, amount of water
resources, waste water discharge
Annually
Changjiang River Ministry of Water Resources Changjiang sediment bulletin Survey of water and sediment
discharges
2000~2007 Water and sediment discharges Annually
Changjiang River
Estuary
Chinese Academy of
Sciences
Project of eutrophication
research
Survey and assessment of
eutrophication
2003~2007 T, Salinity, pH, DO, COD, Nutrients Quarterly(survey
frequency)
Changjiang River
Estuary
Chinese Academy of
Sciences
Project of eutrophication
research
Survey and assessment of
eutrophication
2003~2006,2009 Chla Quarterly(survey
frequency)
Riverine input of DIN, Changjiang River Statistical
Almanac Committee
Almanac of the Yangtze River, ,
Research project
Survey of Riverine input of DIN 1963.1973~1997,
2001~2007
DIN flux Annually
Riverine input of DIP Changjiang River Statistical
Almanac Committee
Almanac of the Yangtze River,
Research project
Survey of Riverine input of DIP 1964~1984,
1987~1988,1996,2001~2007
DIP flux Annually
9
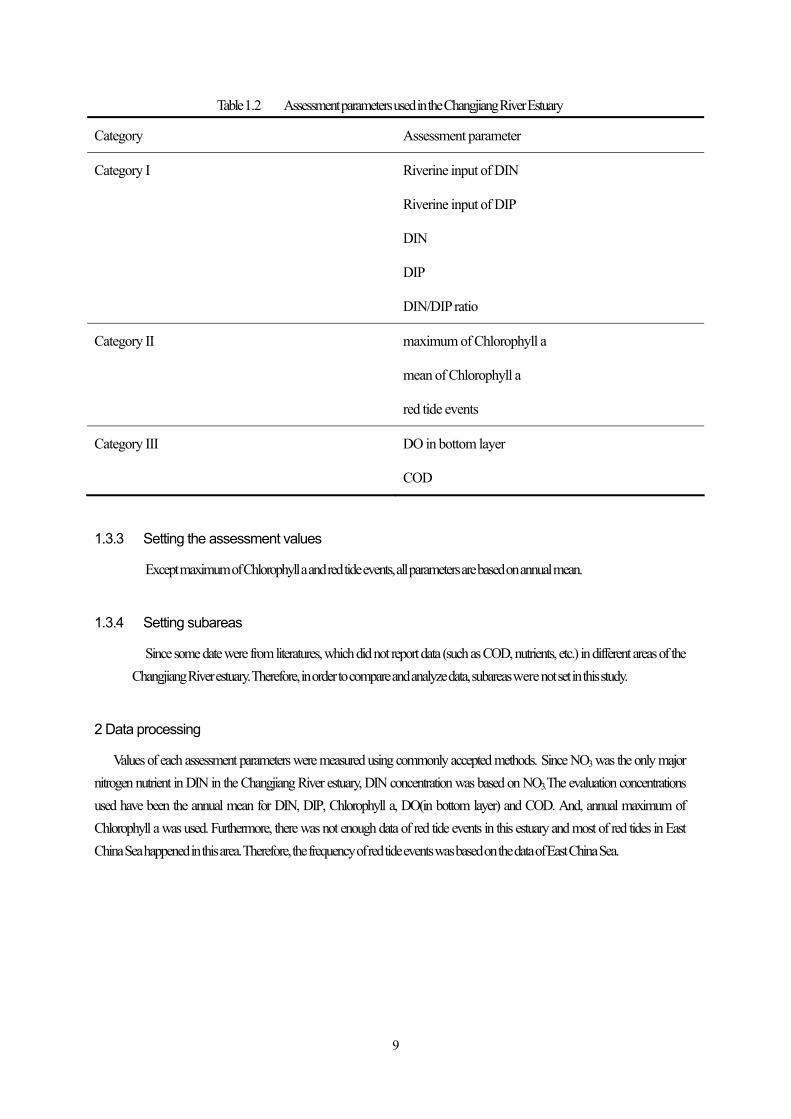
Table 1.2 Assessment parameters used in the Changjiang River Estuary
Category Assessment parameter
Category I Riverine input of DIN
Riverine input of DIP
DIN
DIP
DIN/DIP ratio
Category II maximum of Chlorophyll a
mean of Chlorophyll a
red tide events
Category III DO in bottom layer
COD
1.3.3 Setting the assessment values
Except maximum of Chlorophyll a and red tide events, all parameters are based on annual mean.
1.3.4 Setting subareas
Since some date were from literatures, which did not report data (such as COD, nutrients, etc.) in different areas of the Changjiang River estuary. Therefore, in order to compare and analyze data, subareas were not set in this study.
2 Data processing
Values of each assessment parameters were measured using commonly accepted methods. Since NO3 was the only major nitrogen nutrient in DIN in the Changjiang River estuary, DIN concentration was based on NO3. The evaluation concentrations used have been the annual mean for DIN, DIP, Chlorophyll a, DO(in bottom layer) and COD. And, annual maximum of Chlorophyll a was used. Furthermore, there was not enough data of red tide events in this estuary and most of red tides in East China Sea happened in this area. Therefore, the frequency of red tide events was based on the data of East China Sea.
10
3 Setting of assessment criteria
3.1 Setting of identification criteria of the assessment data
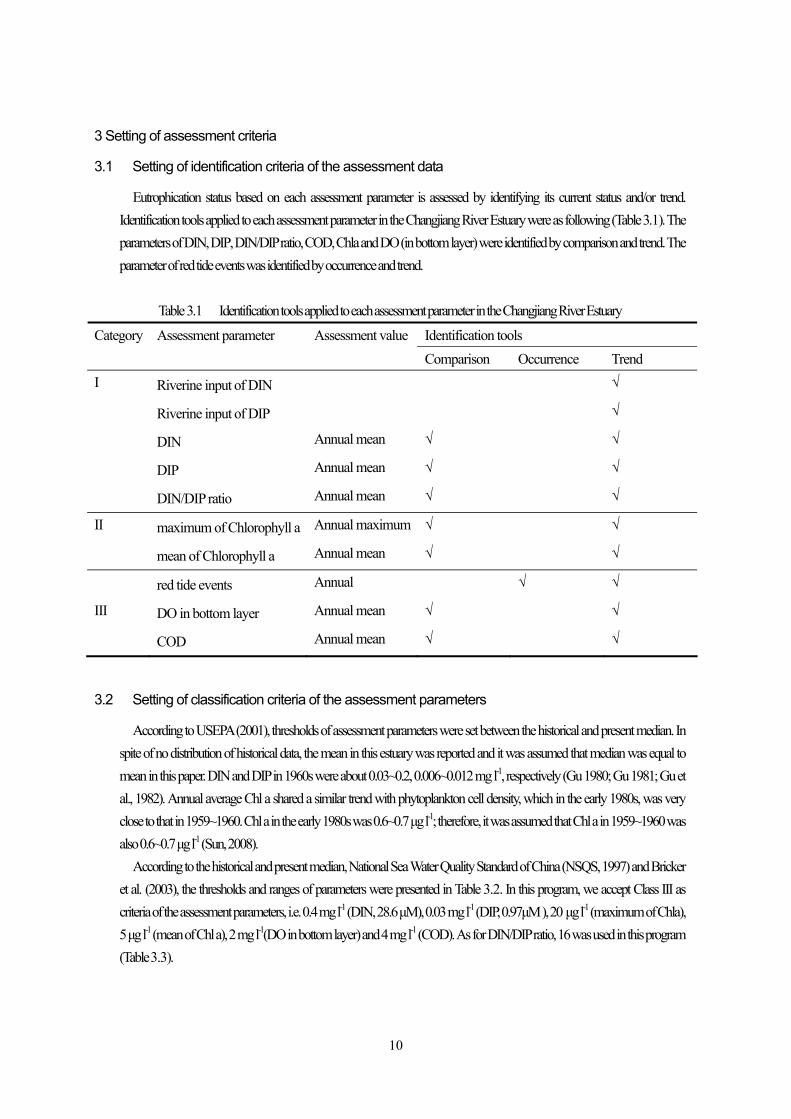
Eutrophication status based on each assessment parameter is assessed by identifying its current status and/or trend. Identification tools applied to each assessment parameter in the Changjiang River Estuary were as following (Table 3.1). The parameters of DIN, DIP, DIN/DIP ratio, COD, Chla and DO (in bottom layer) were identified by comparison and trend. The parameter of red tide events was identified by occurrence and trend.
Table 3.1 Identification tools applied to each assessment parameter in the Changjiang River Estuary
Identification tools Category Assessment parameter Assessment valueComparison Occurrence Trend
I Riverine input of DIN √
Riverine input of DIP √
DIN Annual mean √ √
DIP Annual mean √ √
DIN/DIP ratio Annual mean √ √
II maximum of Chlorophyll a Annual maximum √ √
mean of Chlorophyll a Annual mean √ √
red tide events Annual √ √
III DO in bottom layer Annual mean √ √
COD Annual mean √ √
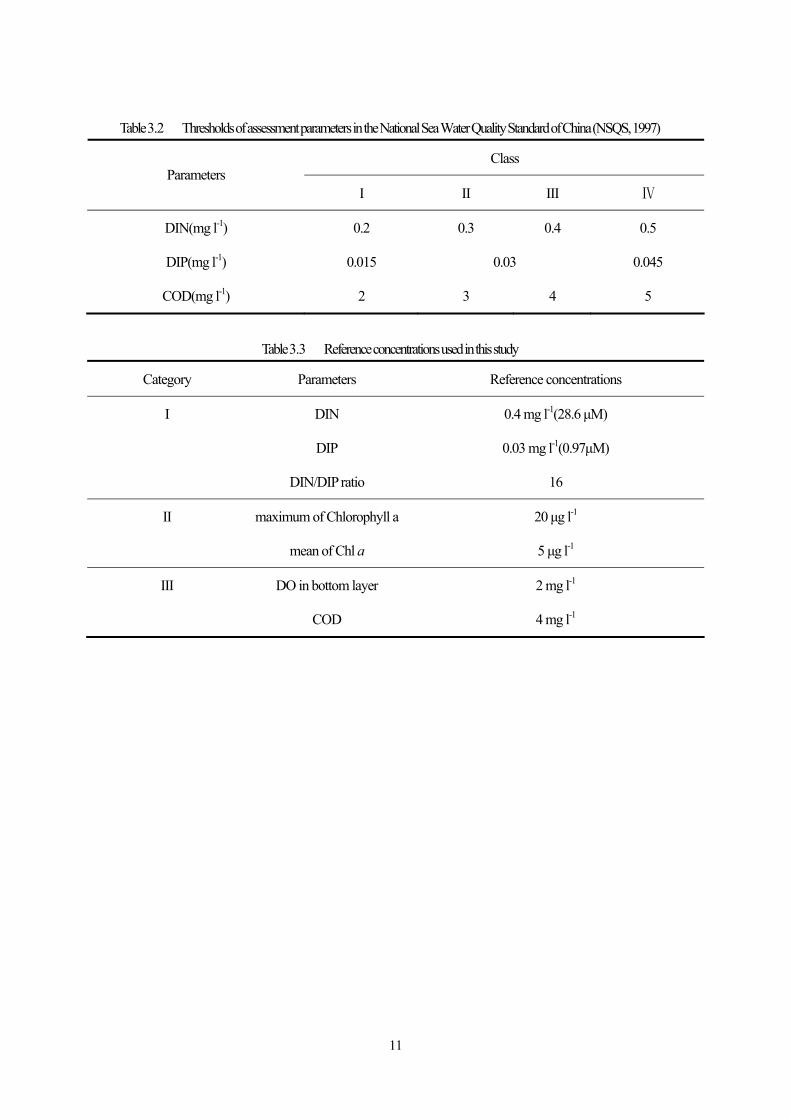
3.2 Setting of classification criteria of the assessment parameters
According to USEPA (2001), thresholds of assessment parameters were set between the historical and present median. In spite of no distribution of historical data, the mean in this estuary was reported and it was assumed that median was equal to mean in this paper. DIN and DIP in 1960s were about 0.03~0.2, 0.006~0.012 mg l-1, respectively (Gu 1980; Gu 1981; Gu et al., 1982). Annual average Chl a shared a similar trend with phytoplankton cell density, which in the early 1980s, was very close to that in 1959~1960. Chl a in the early 1980s was 0.6~0.7 μg l-1; therefore, it was assumed that Chl a in 1959~1960 was also 0.6~0.7 μg l-1 (Sun, 2008).
According to the historical and present median, National Sea Water Quality Standard of China (NSQS, 1997) and Bricker et al. (2003), the thresholds and ranges of parameters were presented in Table 3.2. In this program, we accept Class III as criteria of the assessment parameters, i.e. 0.4 mg l-1 (DIN, 28.6 μM), 0.03 mg l-1 (DIP, 0.97μM ), 20 μg l-1 (maximum of Chla), 5 μg l-1 (mean of Chl a), 2 mg l-1(DO in bottom layer) and 4 mg l-1 (COD). As for DIN/DIP ratio, 16 was used in this program (Table 3.3).
11
Table 3.2 Thresholds of assessment parameters in the National Sea Water Quality Standard of China (NSQS, 1997)
Class Parameters
I II III Ⅳ
DIN(mg l-1) 0.2 0.3 0.4 0.5
DIP(mg l-1) 0.015 0.03 0.045
COD(mg l-1) 2 3 4 5
Table 3.3 Reference concentrations used in this study
Category Parameters Reference concentrations
I DIN 0.4 mg l-1(28.6 μM)
DIP 0.03 mg l-1(0.97μM)
DIN/DIP ratio 16
II maximum of Chlorophyll a 20 μg l-1
mean of Chl a 5 μg l-1
III DO in bottom layer 2 mg l-1
COD 4 mg l-1
12
4 Assessment process and results
4.1 Assessment categories
Eutrophication assessment of Changjiang River Estuary was based on the information and data. Since some data were from literature, there was no data of all sites. Therefore, mean of parameters in the study area was used to assess.
4.1.1 Assessment of Category I
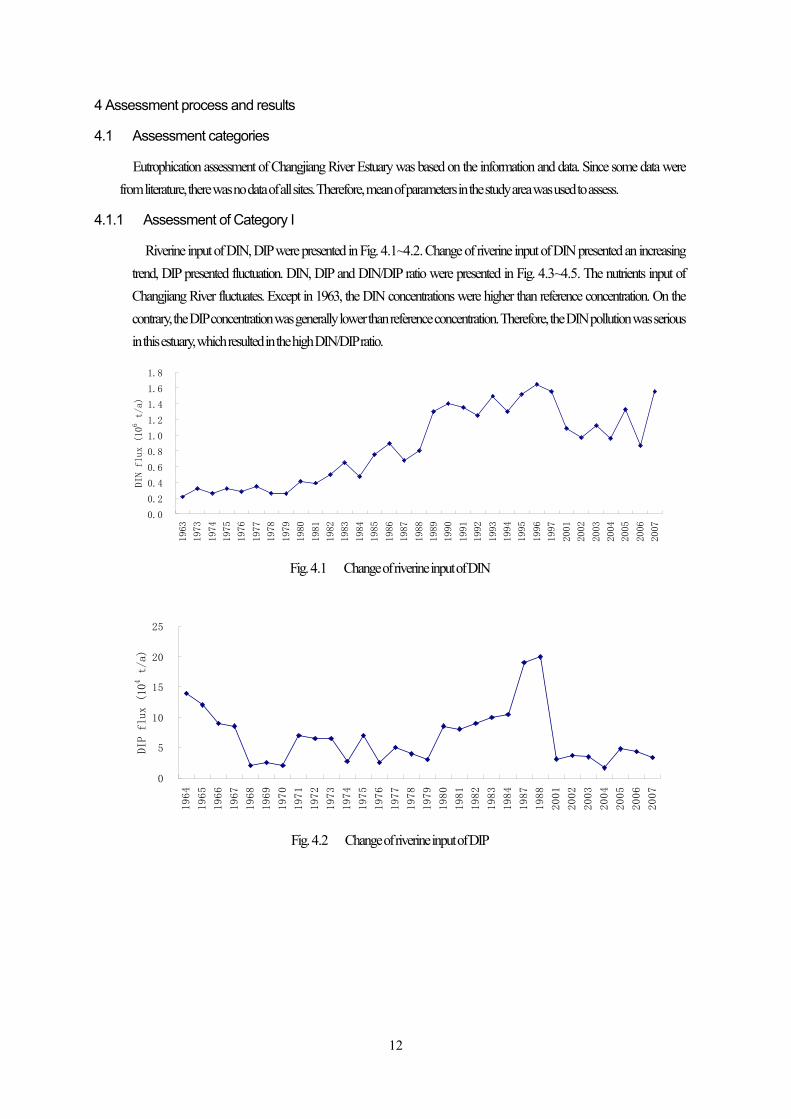
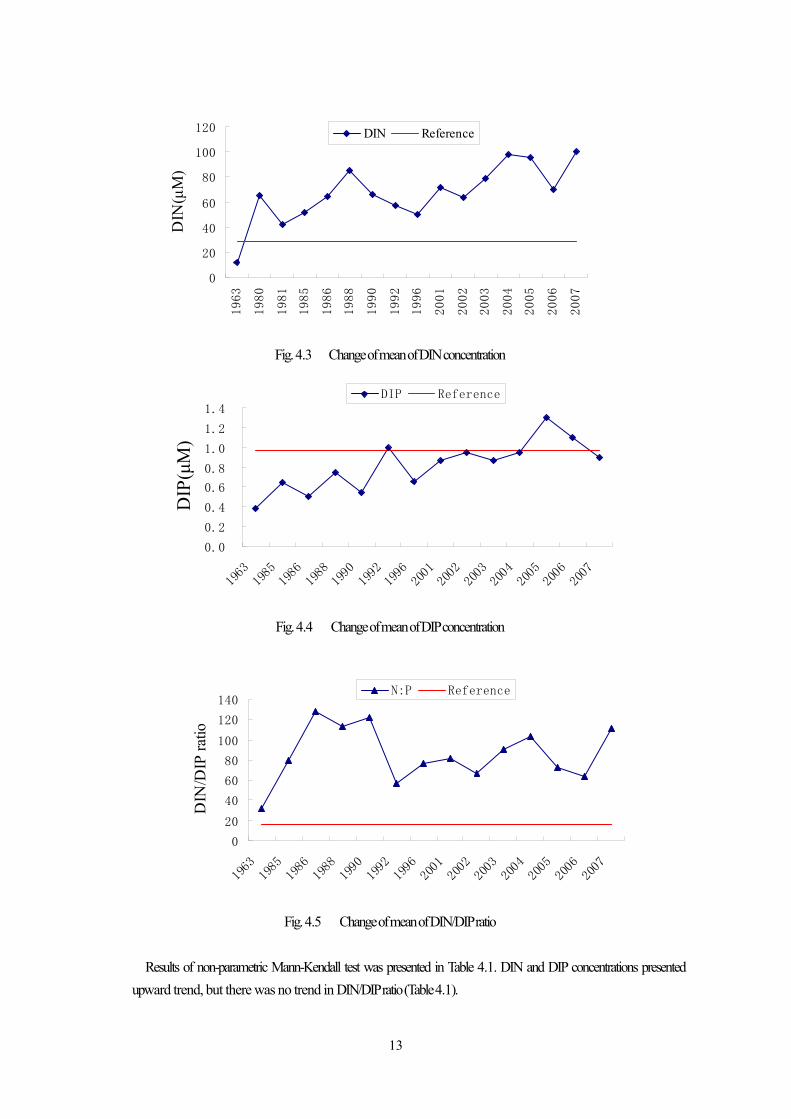
Riverine input of DIN, DIP were presented in Fig. 4.1~4.2. Change of riverine input of DIN presented an increasing trend, DIP presented fluctuation. DIN, DIP and DIN/DIP ratio were presented in Fig. 4.3~4.5. The nutrients input of Changjiang River fluctuates. Except in 1963, the DIN concentrations were higher than reference concentration. On the contrary, the DIP concentration was generally lower than reference concentration. Therefore, the DIN pollution was serious in this estuary, which resulted in the high DIN/DIP ratio.
0.0
0.2
0.4
0.6
0.8
1.0
1.2
1.4
1.6
1.8
1963
1973
1974
1975
1976
1977
1978
1979
1980
1981
1982
1983
1984
1985
1986
1987
1988
1989
1990
1991
1992
1993
1994
1995
1996
1997
2001
2002
2003
2004
2005
2006
2007
DIN flux (106 t/a)
Fig. 4.1 Change of riverine input of DIN
0
5
10
15
20
25
1964
1965
1966
1967
1968
1969
1970
1971
1972
1973
1974
1975
1976
1977
1978
1979
1980
1981
1982
1983
1984
1987
1988
2001
2002
2003
2004
2005
2006
2007
DIP flux (104 t/a)
Fig. 4.2 Change of riverine input of DIP
13
0
20
40
60
80
100
120
1963
1980
1981
1985
1986
1988
1990
1992
1996
2001
2002
2003
2004
2005
2006
2007
DIN
(μM
)
DIN Reference
Fig. 4.3 Change of mean of DIN concentration
0.0
0.2
0.4
0.6
0.8
1.0
1.2
1.4
1963
1985
1986
1988
1990
1992
1996
2001
2002
2003
2004
2005
2006
2007
DIP
(μM
)
DIP Reference
Fig. 4.4 Change of mean of DIP concentration
0
20
40
60
80
100
120
140
1963
1985
1986
1988
1990
1992
1996
2001
2002
2003
2004
2005
2006
2007
DIN
/DIP
ratio
N:P Reference
Fig. 4.5 Change of mean of DIN/DIP ratio
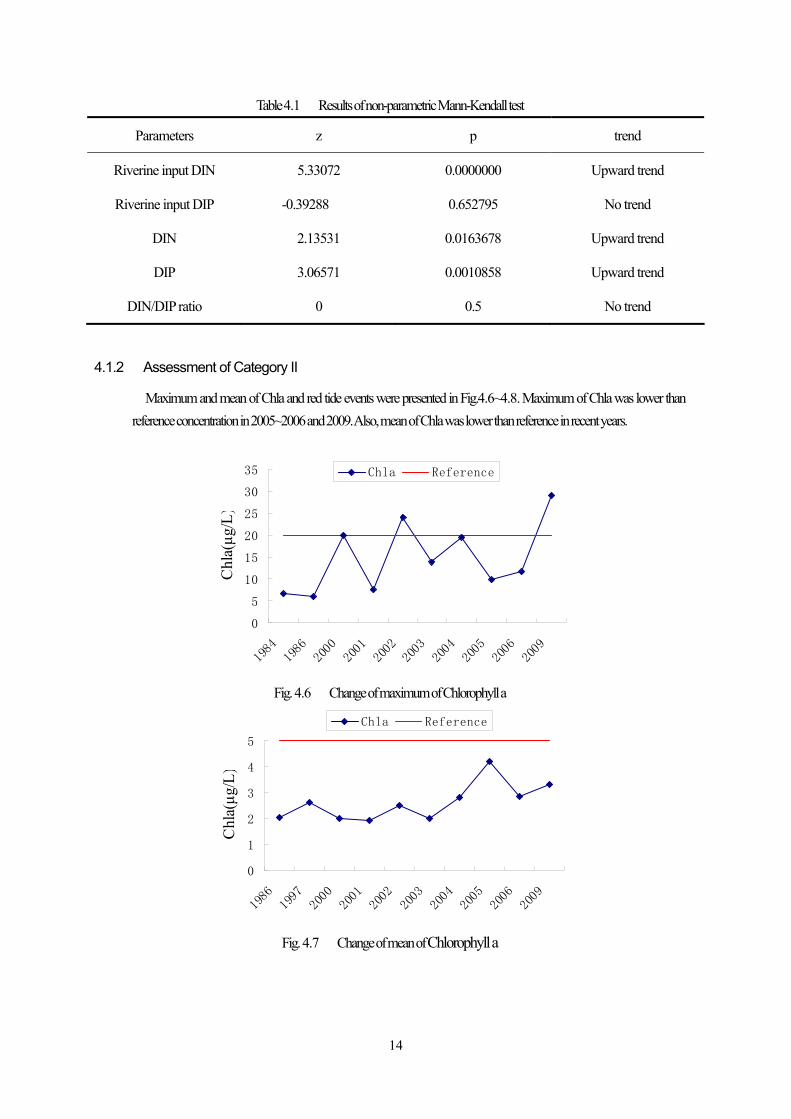
Results of non-parametric Mann-Kendall test was presented in Table 4.1. DIN and DIP concentrations presented upward trend, but there was no trend in DIN/DIP ratio (Table 4.1).
14
Table 4.1 Results of non-parametric Mann-Kendall test
Parameters z p trend
Riverine input DIN 5.33072 0.0000000 Upward trend
Riverine input DIP -0.39288 0.652795 No trend
DIN 2.13531 0.0163678 Upward trend
DIP 3.06571 0.0010858 Upward trend
DIN/DIP ratio 0 0.5 No trend
4.1.2 Assessment of Category II
Maximum and mean of Chla and red tide events were presented in Fig.4.6~4.8. Maximum of Chla was lower than reference concentration in 2005~2006 and 2009. Also, mean of Chla was lower than reference in recent years.
0
5
10
15
20
25
30
35
1984
1986
2000
2001
2002
2003
2004
2005
2006
2009
Chl
a(μg
/L)
Chla Reference
Fig. 4.6 Change of maximum of Chlorophyll a
0
1
2
3
4
5
1986
1997
2000
2001
2002
2003
2004
2005
2006
2009
Chl
a(μg
/L)
Chla Reference
Fig. 4.7 Change of mean of Chlorophyll a
15
0102030405060708090
100
1990
1998
2000
2001
2002
2003
2004
2005
2006
2007
2008
2009
Red
tide
eve
nts
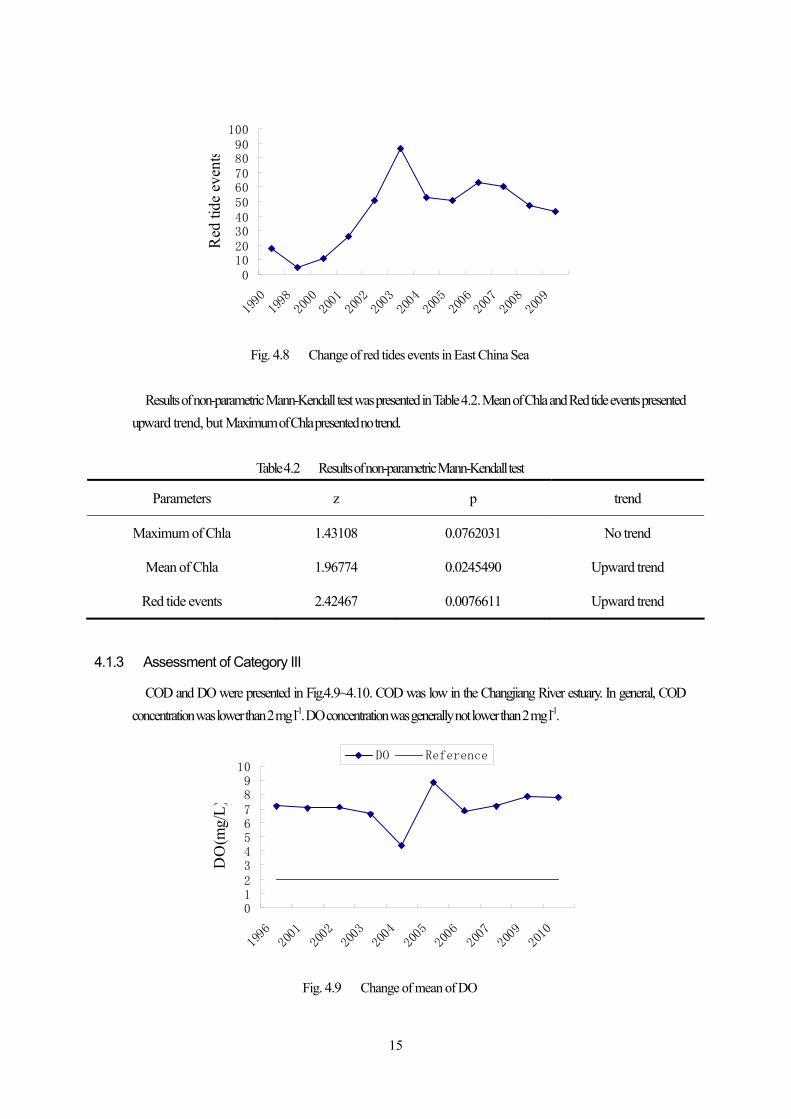
Fig. 4.8 Change of red tides events in East China Sea
Results of non-parametric Mann-Kendall test was presented in Table 4.2. Mean of Chla and Red tide events presented upward trend, but Maximum of Chla presented no trend.
Table 4.2 Results of non-parametric Mann-Kendall test
Parameters z p trend
Maximum of Chla 1.43108 0.0762031 No trend
Mean of Chla 1.96774 0.0245490 Upward trend
Red tide events 2.42467 0.0076611 Upward trend
4.1.3 Assessment of Category III
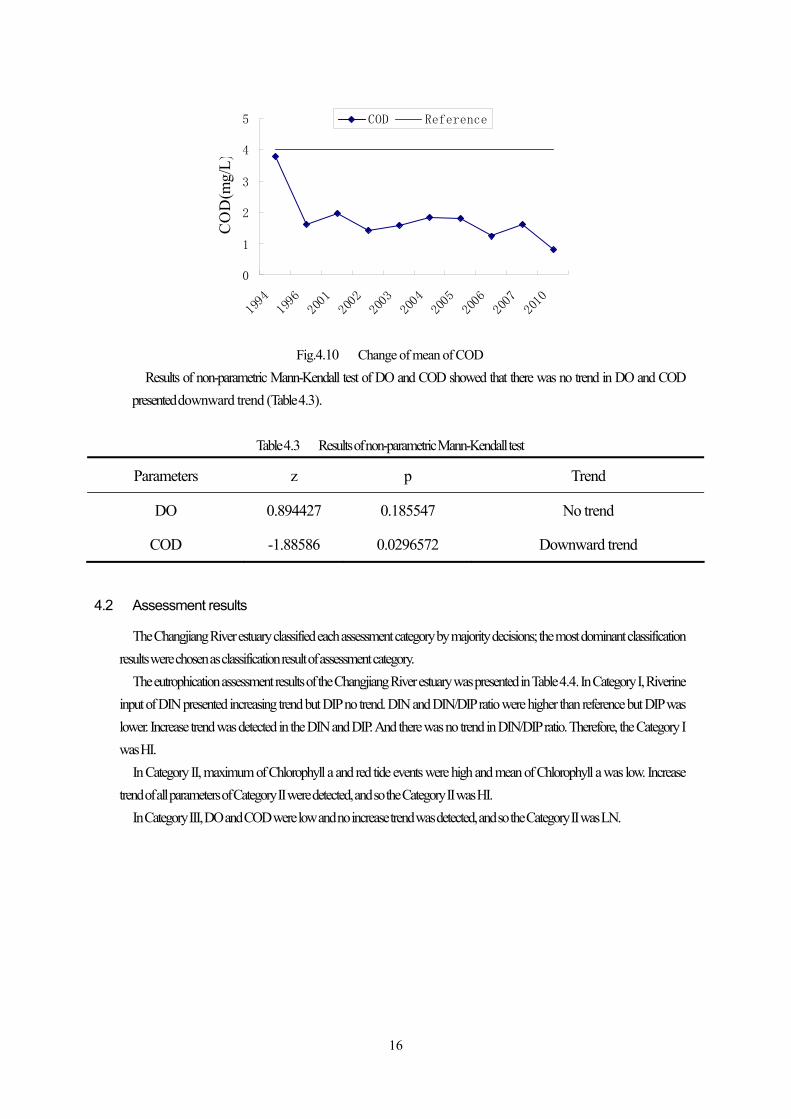
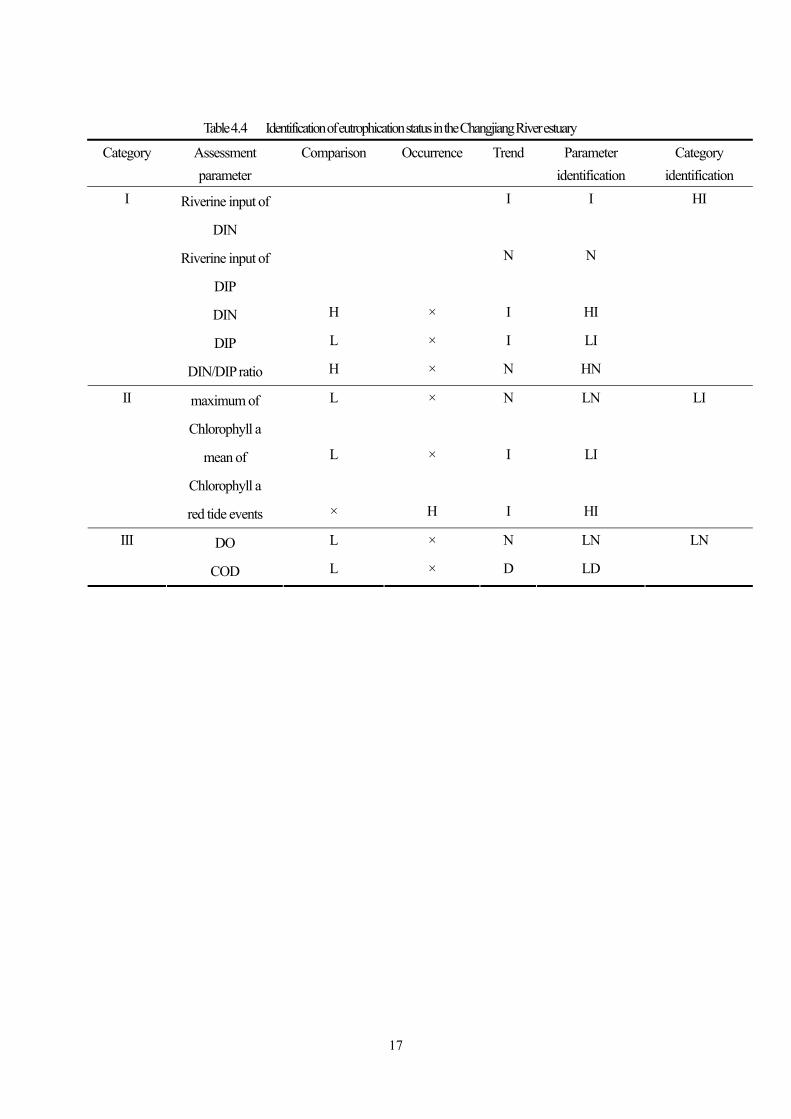
COD and DO were presented in Fig.4.9~4.10. COD was low in the Changjiang River estuary. In general, COD concentration was lower than 2 mg l-1. DO concentration was generally not lower than 2 mg l-1.
0123456789
10
1996
2001
2002
2003
2004
2005
2006
2007
2009
2010
DO
(mg/
L)
DO Reference
Fig. 4.9 Change of mean of DO
16
0
1
2
3
4
5
1994
1996
2001
2002
2003
2004
2005
2006
2007
2010
CO
D(m
g/L)
COD Reference
Fig.4.10 Change of mean of COD Results of non-parametric Mann-Kendall test of DO and COD showed that there was no trend in DO and COD
presented downward trend (Table 4.3).
Table 4.3 Results of non-parametric Mann-Kendall test
Parameters z p Trend
DO 0.894427 0.185547 No trend
COD -1.88586 0.0296572 Downward trend
4.2 Assessment results
The Changjiang River estuary classified each assessment category by majority decisions; the most dominant classification results were chosen as classification result of assessment category.
The eutrophication assessment results of the Changjiang River estuary was presented in Table 4.4. In Category I, Riverine input of DIN presented increasing trend but DIP no trend. DIN and DIN/DIP ratio were higher than reference but DIP was lower. Increase trend was detected in the DIN and DIP. And there was no trend in DIN/DIP ratio. Therefore, the Category I was HI.
In Category II, maximum of Chlorophyll a and red tide events were high and mean of Chlorophyll a was low. Increase trend of all parameters of Category II were detected, and so the Category II was HI.
In Category III, DO and COD were low and no increase trend was detected, and so the Category II was LN.
17
Table 4.4 Identification of eutrophication status in the Changjiang River estuary
Category Assessment parameter
Comparison Occurrence Trend Parameter identification
Category identification
Riverine input of
DIN
I I
Riverine input of
DIP
N N
DIN H × I HI
DIP L × I LI
I
DIN/DIP ratio H × N HN
HI
maximum of
Chlorophyll a
L × N LN
mean of
Chlorophyll a
L × I LI
II
red tide events × H I HI
LI
DO L × N LN III
COD L × D LD
LN
18
5 Conclusion and recommendations
5.1 Conclusion
1.In Category I, the Changjiang River estuary has current eutrophication status as “High” and “Increase”.
2.In Category II, the Changjiang River estuary has current eutrophication status as “Low” and “Increase”.
3.In Category III, the Changjiang River estuary has current eutrophication status as “Low” and “no trend”.
5.2 Recommendations
1. To get more longterm monitoring assessment parameters(such as riverine input TN, TP and TN, TP concentrations) in sites.
2. To get more detailed monitoring assessment parameters(such as red tides events). 3. To decrease the nutrients input of Changjiang River basin.
19
References
Barnes, H., 1959. Apparatus and Methods of Oceanography. Part One: Chemical. George Allen and Unwin Ltd, London, 341 pp.
Bricker, S.B., Ferreira, J.G., & Simas, T., 2003. An integrated methodology for assessment of estuarine trophic status. Ecological Modelling, 169, 39-60.
Chai, C., Yu, Z.M., Song, X.X., & Cao, X.H., 2006. The Status and Characteristics of Eutrophication in the Yangtze River (Changjiang) Estuary and the adjacent East China Sea, China. Hydrobiologia, 563(1), 1573-5117.
Changjiang River Statistical Almanac Committee, 1992-2004. Statistical Almanac of the Yangtze River. Hubei Education Publishing House. p. 566 (in Chinese)
Chen, M.Y., Yu, Z.M., Song, X.X., & Cao, X.H., 2007. Evaluation of fuzzy synthesis to assess the seawater eutrophication in the Changjiang estuary. Marine Sciences, 31(11), 47-54(in Chinese with English abstract).
Grasshoff K. Methods of seawater analysis. Verlag Chemie, Weinheim, New York: 1976. p.276-281. Gu, X. K., 1980. The maximum value of dissolved oxygen in its vertical distributin in Yellow Sea. Acta Oceanologica
Sinica 2(2):70-80 (in Chinese with English abstract). Gu, X. K., X. N. Ma, W. R. Shen, G. F. Ren, Z. Chen, H. X. Diao, H. J. Li & L. Y. Zhang, 1982. Mainre geochemistry of
nitrogen near estuary of Changjiang River. Nitrite and ammonia in sea water near estuary. Journal of Shangdong College of Oceanology 12: 31-38 (in Chinese with English abstract).
Gu, X. K., X. X. Xiong, M. X. Liu & Y. Li, 1981. Mainre geochemistry of nitrogen near estuary of Yangtze River. Nitrate in sea water near estuary. Journal of Shangdong College of Oceanology 11: 37-46 (in Chinese with English abstract).
Han, X. R., X. L. Wang, X. Sun, X. Y. Shi, C. J. Zhu, C. S. Zhang & R. Lu, 2003. Nutrient distribution and its relationship with occurrence of red tide in coastal area of East China Sea. Chinese Journal of Applied Ecology 14: 1097–1101(in Chinese with English abstract).
Li, M.T., Xu, K.Q., Masataka W., Chen, Z.Y., 2007. Long-term variations in dissolved silicate, nitrogen, and phosphorus flux from the Yangtze River into the East China Sea and impacts on estuarine ecosystem. Estuarine, Coastal and Shelf Science, 71, 3-12
NSQS, 1997. National seawater quality standard. GB 3097-1997 (in Chinese) . Pai, S. C., C. C. Yang & J. P. Reliey, 1990. Formation kinetics of the pink azo dye in the determination of nitrite in the
natural waters. Analytica Chimica Acta 232: 345-349. Parsons, T. R., Y. Maita & C. M. Lalli, 1984. A manual of chemical and biological methods for seawater analysis.
Pergamon Press, 173pp. Sanders, R., T., Jickells & D. Mills, 2001. Nutrients and chlorophyll at two sites in the Thames plume and southern
North Sea. Journal of Sea Research 46: 13-28. Shen H. T. & D. A. Pan, 2001. Turbidity Maximum in the Changjiang Estuary. China Ocean Press, Beijing, 39-61 pp
(in Chinese). Shi, Z., 2004. Behavior of fine suspended sediment at the North passage of the Changjiang Estuary. China Journal of
Hydrology 293: 180-190. State Oceanic Administration, 2006. Bulletin of Marine Environmental Quality of China (in Chinese) State Oceanic Administration, 2007. Bulletin of Marine Environmental Quality of China (in Chinese) State Oceanic Administration, 2008. Bulletin of Marine Environmental Quality of China (in Chinese)
20
State Oceanic Administration, 2009. Bulletin of Marine Environmental Quality of China (in Chinese) Strickland, J. D. H. & T. R. Parsons, 1972. A practical handbook of seawater analysis. Fisheries Research Board of
Canada Bulletin 167: 311. Su, C., Shen, Z.L., Yao, Y., & Cao, H.R., 2008. Assessment of eutrophication in the Yangtze River estuary and its
adjacent waters. Advances in Water Science, 19(1), 99–105(in Chinese with English abstract). Sun, B.Y., 2008. Effects of Irradiance on Growth of Phytoplankton in the Changjiang Estuary and Adjacent Coastal
Waters, Ocean University of China, phD thesis(in Chinaese with English abstract). USEPA, 2001. United States Environmental Protection Agency. Nutrient CriteriaTechnical Guidance Manual,
Estuarine and CoastalMarine Waters, EPA-822-B-01-003. Ye, X.S., Zhang,Y., & Xiang, Y.T., 2000. Characteristics of Nitrate Distribution in the Changjiang River Estuary and its
Cause of Formation. Marine Science Bulletin, 19(1), 89-92(in Chinese with English abstract). Zhang, C.S., Wang, X.L., Shi, X.Y., Han, X.R., Sun, X., Zhu, C.J., & Lu, R., 2003. Distributions of COD and petroleum
hydrocarbons and their relationships with occurrence of red tide in East China Sea. Chinese Journal of Applied Ecology, 14(7),1093-1096 (in Chinese with English abstract).
Zhang, F.Y., 2009. Historical Comparison on Evolution of Phytoplanlkton Cornmunity and its Relations with Environmental Factors in Yangtze Estuary and its adjacent Sea, Master thesis (in Chinese).
Zhu, J.R., Wang, J.H., Shen, H.T., & Wu, H., 2005. Observation and analysis of the diluted water and red tide in the sea off the Changjiang River mouth in middle and late June 2003. Chinese Science Bulletin, 50 (3), 240-247.
Zou, J.Z., Dong, L.P., & Qin, B.P., 1983. Preliminary Study of eutrophcaion and algal bloom in Bohai Bay. Marine Environmental Science, 2(2), 41-54 (in Chinese).