A case study on stoping shift buffering at - SciELO - Scientific … · · 2012-05-29A case study...
7
J o u r n a l P a p e r Introduction Despite all the advances in the field of project management, a good number of projects are invariably delivered with compromised basic deliverables of time, budget (cost), and content (which includes quality). In some quarters it has been institutionally accepted that projects will always be late. For a field with a number of publications comparable to most established fields, the following extensively quoted statistics of IT project failure rate 1 do not justify the cause—only quantitative quotes are referenced. † ➤ The Bull Survey: major findings were: – 75% of projects missed deadlines – 55% of projects exceeded budget – 37% of projects were unable to meet project requirements (content). ➤ The Chaos Report: This was commis- sioned in 1995 by the Standish Group in the USA and revealed the following: – 53% of the projects cost over 190% of their original budget – 31% of projects were cancelled before completion – 16% of projects met their project deliverables. Leach 2 postulates that more than 30% of projects are cancelled before completion. After analysing 18 projects in the mining industry, Vallee 3 concludes that 78% of the projects had non-delivery issues. These are just a few selected surveys that are available in the literature, and only the quantifiable bottom-line results are referred to. It is also worth mentioning that the academic debate on the statistical correctness of the above findings has been ignored because the paper is biased towards the bottom-line project management deliverables of time, budget, and content. In a typical mining scenario, bottom line results will manifest in the form of: ➤ Missed annual business plans ➤ Missed holing dates in development and stoping activities of the mining process ➤ Continuously shifting the shaft- commission dates ➤ As will be proved later, lost blasts. A number of valid reasons are given to justify the missed deliverables, and a majority of these explanations have something to do with the uncertainties that seem to befall all projects. In the following subsections, this paper will describe the application of a relatively new project management A case study on stoping shift buffering at Impala Platinum: A critical chain project management perspective by R.C.D. Phillis*, and H. Gumede* Synopsis Conventional stoping in hard rock mining is largely considered an operational environment. This paper suggests that stoping falls within the realm of a project management environment typified by uncertainty, variation, and large numbers of interdependencies. Stoping was then equated to a micro-project with many simultaneous activities that had to be executed accurately using finite resources within limited shift durations in order to reach specific goals. Critical chain project management (CCPM) principles were applied to the stoping activities, and the results showed that the number of blasts per panel can be significantly increased by successfully moving the distribution of work as close as possible to the start of shift. Critical chain principles also assisted in facilitating re-focusing and teamwork among stoping crews as well as between day- and night-shift crews. The main recorded success was in managing inherent protective capacities/local contingencies/fat/buffers that are found in all projects. The impact on mine health and safety (MHS) was significant as individual operators and crews became convinced that they could perform all stoping tasks (activities) without compromising accuracy or speed. Keywords buffers, critical chain, stoping shift. * Ukhozi Project Management, Johannesburg, South Africa. © The Southern African Institute of Mining and Metallurgy, 2011. SA ISSN 0038–223X/3.00 + 0.00. Paper received Oct. 2009; revised paper received Aug. 2011. 793 The Journal of The Southern African Institute of Mining and Metallurgy VOLUME 111 NOVEMBER 2011 ▲
Transcript of A case study on stoping shift buffering at - SciELO - Scientific … · · 2012-05-29A case study...

Journal
Paper
Introduction
Despite all the advances in the field of projectmanagement, a good number of projects areinvariably delivered with compromised basicdeliverables of time, budget (cost), and content(which includes quality). In some quarters ithas been institutionally accepted that projectswill always be late. For a field with a numberof publications comparable to most establishedfields, the following extensively quotedstatistics of IT project failure rate1 do notjustify the cause—only quantitative quotes arereferenced.†
� The Bull Survey: major findings were:– 75% of projects missed deadlines– 55% of projects exceeded budget– 37% of projects were unable to meet
project requirements (content).
� The Chaos Report: This was commis-sioned in 1995 by the Standish Group inthe USA and revealed the following:
– 53% of the projects cost over 190%of their original budget
– 31% of projects were cancelledbefore completion
– 16% of projects met their projectdeliverables.
Leach2 postulates that more than 30% ofprojects are cancelled before completion. Afteranalysing 18 projects in the mining industry,Vallee3 concludes that 78% of the projects hadnon-delivery issues.
These are just a few selected surveys thatare available in the literature, and only thequantifiable bottom-line results are referred to.It is also worth mentioning that the academicdebate on the statistical correctness of theabove findings has been ignored because thepaper is biased towards the bottom-line projectmanagement deliverables of time, budget, andcontent. In a typical mining scenario, bottomline results will manifest in the form of:
� Missed annual business plans� Missed holing dates in development and
stoping activities of the mining process� Continuously shifting the shaft-
commission dates� As will be proved later, lost blasts.
A number of valid reasons are given tojustify the missed deliverables, and a majorityof these explanations have something to dowith the uncertainties that seem to befall allprojects. In the following subsections, thispaper will describe the application of arelatively new project management
A case study on stoping shift buffering atImpala Platinum: A critical chain projectmanagement perspectiveby R.C.D. Phillis*, and H. Gumede*
SynopsisConventional stoping in hard rock mining is largely considered anoperational environment. This paper suggests that stoping fallswithin the realm of a project management environment typified byuncertainty, variation, and large numbers of interdependencies.Stoping was then equated to a micro-project with manysimultaneous activities that had to be executed accurately usingfinite resources within limited shift durations in order to reachspecific goals.
Critical chain project management (CCPM) principles wereapplied to the stoping activities, and the results showed that thenumber of blasts per panel can be significantly increased bysuccessfully moving the distribution of work as close as possible tothe start of shift. Critical chain principles also assisted in facilitatingre-focusing and teamwork among stoping crews as well as betweenday- and night-shift crews. The main recorded success was inmanaging inherent protective capacities/localcontingencies/fat/buffers that are found in all projects.
The impact on mine health and safety (MHS) was significant asindividual operators and crews became convinced that they couldperform all stoping tasks (activities) without compromisingaccuracy or speed.
Keywordsbuffers, critical chain, stoping shift.
* Ukhozi Project Management, Johannesburg, SouthAfrica.
© The Southern African Institute of Mining andMetallurgy, 2011. SA ISSN 0038–223X/3.00 +0.00. Paper received Oct. 2009; revised paperreceived Aug. 2011.
793The Journal of The Southern African Institute of Mining and Metallurgy VOLUME 111 NOVEMBER 2011 �

A case study on stoping shift buffering at Impala platinum
methodology in South Africa. This new methodology placesemphasis on the management of the uncertainties thatalways accompany projects.
Critical chain project management
The critical chain project management (CCPM) philosophywas introduced to the commercial world in the late 1990s byan Israeli philosopher Eliyahu M. Goldratt. Simply stated, it isa theory of constraint (TOC) way of managing projects.
The key aspects of CCPM are that it:
� Pays detailed attention to resource contention duringthe scheduling process
� Limits and discourages bad multi-tasking� Takes into account the tendencies of people to procras-
tinate getting down to work or to divide work evenlythroughout the estimated duration of work
� Uses the as-late-as-possible (ALAP) schedulingprocess
� Acknowledges the inherent existence of uncertaintiesin projects and attempts to quantifiably manage themthrough a process known as ‘buffer management’(Leach, 20042; Newbold, 19984; Goldratt, 19985).
Critical chain methodology
� Scheduling phase—The scheduling phase of CCPM isbasically the same as that for critical path scheduling.In fact, without resource contention, the critical path isthe same as the critical chain. The major difference isthat in CCPM the project due date is set andprotected/buffered against uncertainties. In simpleterms, all task durations are halved prior to resourcelevelling. The remaining half of the task durations areploughed back into the project plan as a protection ofthe project due date, which is known as the projectbuffer. This whole process of halving task durations iscarried out so as to eliminate the adverse humanbehaviours that can interfere with task execution. Thecritical chain is then identified as the longest chain ofdependent events taking into account the resourcecontention2.
� Execution and monitoring phase—In CCPM, resourcesare forced to prioritize tasks that are on the criticalchain. ‘Bad multi-tasking’† is eliminated by releasing—as a rule of thumb—only three tasks per resource atany given time. The project monitoring phase duringexecution involves monitoring the amount of buffersconsumed vis-à-vis the percentage of the critical chaincompleted5. The practical application of these principlesis described in the following section.
CCPM application: case study on stoping shiftbuffering
Case study background
Although Impala Platinum’s average monthly stoping produc-
tivity was 17m/month, its leadership was concerned that theoverall stoping performance had plateaued and was startingto deteriorate. Impala Platinum, through its Best PracticeDepartment, initiated an Accelerated ProductivityImprovement programme (API) aimed at improving theoverall productivity of the organization. It is a noteworthyobservation that a metre improvement in productivity of thewhole organization translated to a more than R1 billionincrease in annual sales in the 2007 financial year (turnoverof R17 billion at 17 metres per month). In addition,improving stoping productivity is a fundamental step towardsachieving annual business plans.
The API programme started with an industrialengineering study at Impala No.12 shaft for the periodbetween October 2006 and January 2007. The objective of thestudy was to identify the reasons for the fact that somestoping crews’ performance were falling short of theirmonthly targets/blasts. It was anticipated that the causes oflost blasts could broadly be classified into three areas:
� Input constraints—system limitations caused by under-resourcing of human, physical, information, and/orfinancial inputs
� Output constraints—system limitations caused by theinability to move the broken rock from the stopes
� Capacity constraints—constraints in capacity thatmeant that it was not possible to complete all thestoping tasks in the available shift time.
The focus of the study was on the stoping capacityconstraint, and only the day shift (drilling) will be discussedhere. Inbound and outbound logistics and development(including construction and equipping) studies were alsoconducted, but these do not form part of this paper. Theproject team used both qualitative and quantitative researchmethodologies.
CCPM application methodology
The project team used the following methodology, which isbased on research, correlation and implementation:
Stoping research study at Impala No. 12 shaft
Initially the project team did not know what the stopingcapacity constraints were, other than managementhypotheses. The project team set out to gather as muchrelevant data during time and motion studies.
Competent observers tracked selected stoping crews forboth the day and night shifts and observed time from start ofshift (SOS) to end of shift (EOS) and motion from shaft bankto bank.
The study was conducted on four panels, two of thesebeing benchmark panels and the other two comparisonpanels.
Comparing and correlating the study results with bestpracticeThe stoping resource schedule as shown in Figure 1 revealsthe following:
� Time and motion studies average performance of theoperator tasks were completed faster when compared tothe time allowed in the best practice—stoping resourceschedule.
�
794 NOVEMBER 2011 VOLUME 111 The Journal of The Southern African Institute of Mining and Metallurgy
†Bad multi-tasking may be considered as working on many concurrenttasks/paths that have an adverse effect on lead times, although effortand touch time remain unchanged.

� Individual operators that constituted the stoping crewswere efficient, as all operators were proficient in theirbest-practice-assigned responsibilities/jobs.
� It seemed that the main problem was the lack of theintegration of all the stoping activities. Thisphenomenon was realized only when the project teamobserved the holistic motion of the stoping crewsthroughout the shift vis-à-vis the goal of each stoping-shift, i.e. ‘A safe, quality blast per day, every day’.
� The resource-based nature of the stoping scheduleencouraged each crew member to concentrate on hisparticular tasks and ignore the global goal. Forinstance, when one of the three rock drill operators(RDOs) completed their tasks, that particular RDOsimply packed up and left the rest of the crew behind.The faster crew member did not stay on to assist othercrew members complete the stoping schedule andachieve the goal. Also, all crew members becameproficient, with a low reliance on the crew as a unit, i.e.individual operators did not find protection from thesystem.
� In the best practice schedule the focus on the resourcesand the integration of the resources was implicit. Assuch, crews divided all the work among operators, asevenly as possible. Miners would then drive continuousimprovement of the efficiencies of each crew member inanticipation that, when added together, all theindividual efficiencies would result in goalachievement.
� Idealizing tasks and/or resources meant that muchemphasis was placed on finishing each task on time as
the best way to achieve the goal.
The shortcomings listed above indicated that the originalbest practice resource schedule as shown in Figure 1 had tobe complemented with a best practice activity schedule (asseen in Figure 2) in the following manner:
� Shifting focus from the resources to the tasks/activities� Making the schedule integration explicit (divergent and
convergent points).
This solution was incomplete as it did not address stopingrisks such as:
� Resource variation such as availabilities (e.g.absenteeism) and efficiencies in relation to stopingproductivity
� Uncertainty caused by the erratic nature of the causesfor failure to blast (lost blasts) and protection againstthings that could go wrong
� Resistance to change, shown in the crew’s attitude todoing each and every task accurately, because eachstoping task is an act of MHS.
CCPM methodology was then applied to the stopingactivity schedule, with the main objectives including:
� Protection of the crew from uncertainties that result inlost blasts
� Facilitation of crew re-focusing on co-operation andteamwork
� Facilitation of the development of control charts (crewdashboard, a tool for crew synchronicity)
� Derivation of a single measure for behavioural change.
A case study on stoping shift buffering at Impala platinumJournal
Paper
795The Journal of The Southern African Institute of Mining and Metallurgy VOLUME 111 NOVEMBER 2011 �
Figure 1—Best practice – stoping resource schedule

A case study on stoping shift buffering at Impala platinum
Figure 3 illustrates the stoping activity schedule on CCPM,i.e. with resource allocation and buffering. The red barsindicate the actual critical chain while the blue bars arefloating paths/tasks, each with their own buffers shown inlight blue.
The buffers provided the opportunity to schedule floatingtasks/paths as-late-as-possible (ALAP). The implications forMHS were that the entire crew could focus on the start-of-shift procedure. The crews were rationalized with due regardto waiting place procedure, risk assessment, and stopeexamination, which formed part of an MHS campaign at thattime. Only when this (SOS procedure) was completed did the
crew split up to take on specific tasks, as may be seen inFigure 3. Promoting teamwork and protecting the shift fromlost blast, was more important than the convenience ofindividual operators. The CCPM stoping schedule was thenimplemented.
Implementation of the CCPM schedules at Impala No. 11shaft included a buy-in process to ensure the active collabo-ration of the shaft leadership, line management and crews,which is obviously a critical success factor. The elements thathad to be emphasized as part of the buy-in process are setout below:
�
796 NOVEMBER 2011 VOLUME 111 The Journal of The Southern African Institute of Mining and Metallurgy
Figure 2—Best practice–stoping activity schedule
Figure 3—Impala Platinum—stoping production cycle on CCPM
Task NameID
1 Stope Drilling - ORIGINAL 570 mins
2 Travel in 30 mins3 Risk Assessment & Examination 30 mins
4 Drilling Equipment Preparation 30 mins
6 Prepare Advances Strike Gulley (ASG) 150 mins
11 Support 3.5 hrs
5 Drilling 6 hrs
7 Water control 30 mins8 Ventilation control 30 mins
9 Rig chains & Snatch blocks 2 hrs
14 Carge=up preparation 3hrs
10 Transport material 2hrs15 Charge-up pana 1 hr
12 Remove mechnical props 30 mins
13 Pack away equipment (Storage) 30 mins
16 Travel out 30 mins17
Division
Task NameID
1 Stope Drilling - ORIGINAL 570 mins2 Travel in 30 mins3 Risk Assessment & Examination 30 mins4 Drilling Equipment Preparation 30 mins6 Prepare Advances Strike Gulley (ASG) 150 mins11 Support 3.5 hrs5 Drilling 6 hrs7 Water control 30 mins8 Ventilation control 30 mins9 Rig chains & Snatch blocks 2 hrs14 Carge=up preparation 3hrs10 Transport material 2hrs15 Charge-up panel 1 hr12 Remove mechnical props 30 mins13 Pack away equipment (Storage) 30 mins16 Travel out 30 mins17
1 Stope Drilling - BUFFERED 435 mins2 Travel in 15 mins3 Risk Assessment & Examination 15 mins4 Drilling Equipment Preparation 15 mins6 Prepare Advance Strike Gulley (ASG) 1.25 hrs11 Support 1.75 hrs5 Drilling 3 hrs7 Water control 15 mins8 Ventilation control 15 mins9 Rig chains & Snatch blocks 1 hrs14 Carge=up preparation 1.5 hrs10 Transport material 1 hrs15 Charge-up preparation 30 mins12 Remove mechnical props 15 mins13 Pack away equipment (Storage) 15 mins
16 Travel out 15 mins17 Stoping Shift Buffer (2.5 hrs) 150 mins
Division
� It had to be ensured that the operators understood thelogic of CCPM and were convinced that the overall blastprotection took priority over task protection. Thismeant that management clearly understood andaccepted that the halved estimates might never beachieved; and that if the halved-estimates were notachieved the management and/or the miner would notpenalize operators.
� It was explained that the other halves of the timeestimates would be pooled to the end of the shift(project) in a way that protects the shift, albeit at theexpense of the halved estimates. It had to be over-emphasised that the project as a whole was protected.
� The crews were informed in simple terms of what wasrequired. For instance, to eliminate the StudentSyndrome and Parkinson’s Law, the soccer analogywas presented to the crews and emphasis was placedon the fact that as a soccer team, the crew should scoreall their goals in the first half of the shift and thenspend the second half defending.
� Stoping, being a daily repetitive micro-project carriedout in uncertain ambient conditions (underground),called for a dashboard that had to be tracked andupdated in real time. This assisted in influencing crewbehaviour through the provision of timely warnings ofschedule deviations. As a consequence crews couldself-adjust or rationalize themselves in accordance withthe required crew work rate.
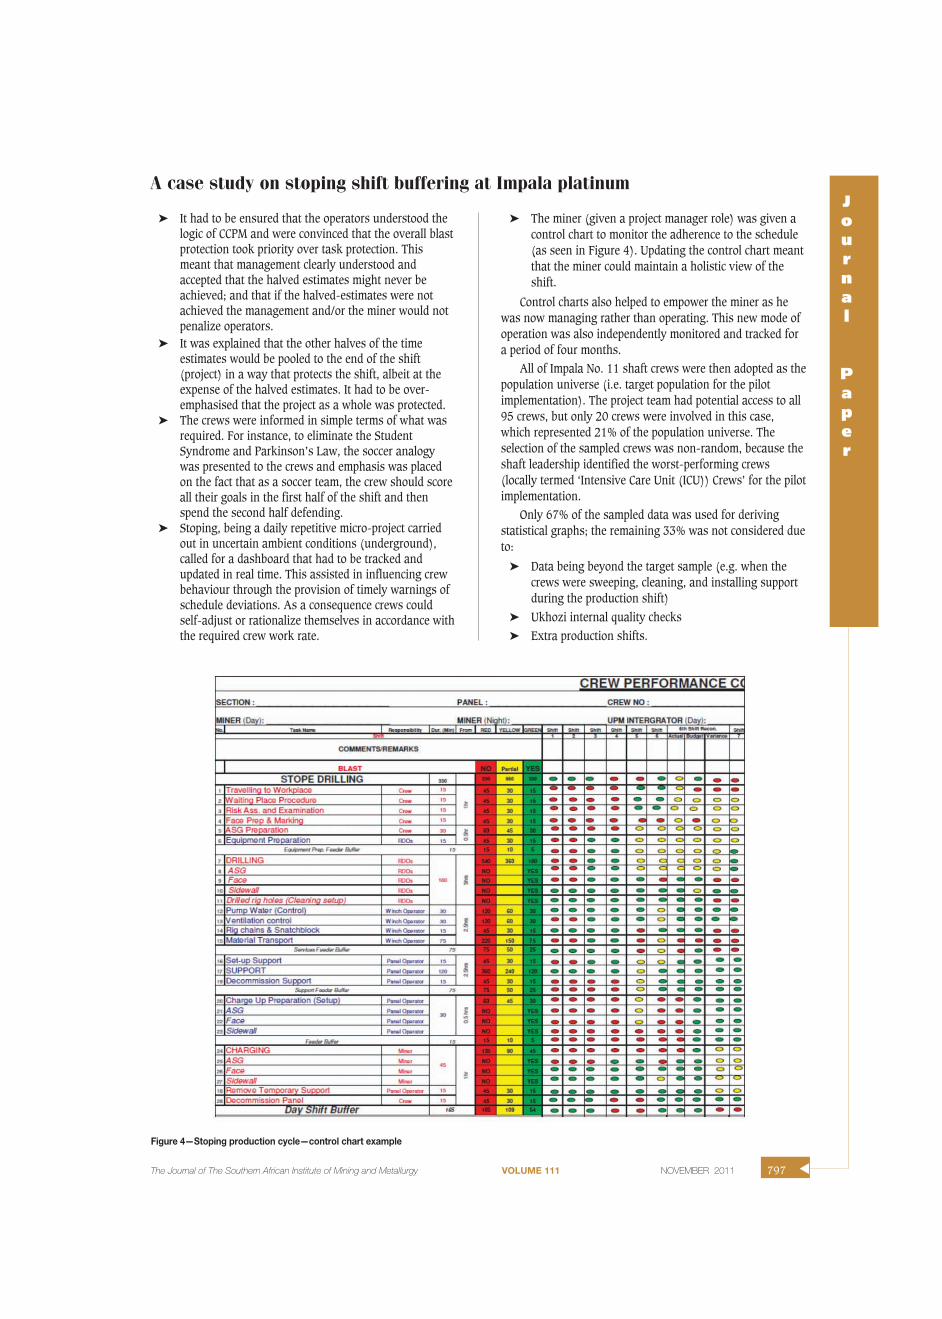
� The miner (given a project manager role) was given acontrol chart to monitor the adherence to the schedule(as seen in Figure 4). Updating the control chart meantthat the miner could maintain a holistic view of theshift.
Control charts also helped to empower the miner as hewas now managing rather than operating. This new mode ofoperation was also independently monitored and tracked fora period of four months.
All of Impala No. 11 shaft crews were then adopted as thepopulation universe (i.e. target population for the pilotimplementation). The project team had potential access to all95 crews, but only 20 crews were involved in this case,which represented 21% of the population universe. Theselection of the sampled crews was non-random, because theshaft leadership identified the worst-performing crews(locally termed ‘Intensive Care Unit (ICU)) Crews’ for the pilotimplementation.
Only 67% of the sampled data was used for derivingstatistical graphs; the remaining 33% was not considered dueto:
� Data being beyond the target sample (e.g. when thecrews were sweeping, cleaning, and installing supportduring the production shift)
� Ukhozi internal quality checks
� Extra production shifts.
A case study on stoping shift buffering at Impala platinumJournal
Paper
The Journal of The Southern African Institute of Mining and Metallurgy VOLUME 111 NOVEMBER 2011 797 �
Figure 4—Stoping production cycle—control chart example

A case study on stoping shift buffering at Impala platinum
The plan was to improve the ICU crews and make themthe best performing crews. The success of the ICU crew wasexpected to be imitated by other crews and spread to thewhole shaft in this way. The implementation results andanalysis are presented in the succeeding subsection.
Results analysis
During the implementation of API, Impala also introduced anew bonus system, namely the ‘Ama Ching-ching’ bonus,which suggests that some of the improvements in productioncould be attributed to this new system. However, it is worthmentioning that the project team was offering a uniqueproduct by promoting the concentration of work in the firsthalf of the shift so as to eliminate the Student Syndrome andParkinson’s Law. The project team had proposed/hypoth-esized that the number of blasts per panel could be increasedsignificantly by shifting workflow distribution to the first halfof the shift.
With that in mind, the project team measured thisparadigm shift as it was the only parameter that could beattributed to CCPM. The paradigm shift was tracked through acomparison of monthly workflow distribution curves of therelevant crews. Monitoring the behavioural change beforeand during the implementation of the revised CCPM scheduleinvolved gathering data underground in the form of time andmotion studies and conducting statistical analyses. Theseanalyses were carried out by:
� Subdividing the allocated times for the activities on thebest practice schedule into hourly intervals (asindicated in Table I)
� Extrapolating results from time and motion studies todetermine the number of times in which each activitywas completed within the CCPM best practiceschedule’s allocated time per shift, and calculatingcumulative frequencies
� Plotting cumulative frequency and percentageprobability distribution curves as illustrated in Figures5 and 6
� Calculating areas under the probability distributioncurves within a specific period to obtain the amount ofwork completed.
Only the results of one of the crews (BA44) are given inthis paper.
The above statistical analysis methodology was adoptedfrom Walpole et al. (1993)6 and Gumede et al (2007)7.
Figure 5 shows the percentage-frequency-density distri-bution of crew BA44’s completion of different tasks at section114 on level 13. The probability distribution of completingdifferent tasks is the area below each graph. In analysingFigure 5 there is a gradual increase in the area below thegraphs midway during the shift for the period betweenFebruary and May. This is illustrated by the consistentshifting of graphs towards the left from February to May,indicating a gain in percentage probability. As an illustration,in February, crew BA44 completed 47% of their day shiftproduction cycle midway into the shift, as seen in the areaunder the black curve.
For the same period in May, the same crew completed57% of their tasks—i.e. the area under the green curve—compared to 62% in April. This signifies a significant changein paradigm, as the crew concerned achieved a 10%increment in concentrating the work during the first half ofthe shift.
Table II summarizes the percentage distributions for allthe crews that were monitored during the implementation,and there is a clear indication that crews gradually concen-trated their efforts at the beginning of the shift (a paradigmshift).
�
798 NOVEMBER 2011 VOLUME 111 The Journal of The Southern African Institute of Mining and Metallurgy
Table I
Hourly interval activities on Impala Platinum’s original best practice schedule
Time (h) Tasks
0 Start of Shift (SOS)1 0–1 hour Travelling to workplace, waiting place procedure, risk assessment and examination, face preparation and marking2 1–2 hour ASG preparation and drilling 3 2–3 hour Drilling4 3–4 hour Drilling5 4–5 hour Drilling and charging-up6 5–6 hour Decommissioning of shift 7 End of shift (EOS)
Figure 5—Monthly workflow distribution of completed critical tasks
Table II
Percentage distribution of completed work
Month February March April May June
Average % probability 47% 49% 57% 56% 54%
1 2 3 4 5 6 Time (hrs)
Feb March April May
Monthly Workflow Distribution
Freq
uenc
y D
ensi
tyD
istr
ibut
ion
35%
30%
25%
20%
15%
10%
5%
0%
Midway through

An analysis of crew BA44 from the perspective of theprobability of achieving a blast is given in Figure 6. In thiscase it was assumed that whenever crews completed theirdrilling tasks they would definitely achieve a blast. Externalcauses for blast failures were ignored (e.g. material orequipment shortages and the unavailability of stopes). Thecomparison was pegged at the end of the drilling task on thebest practice schedule.
Using the CCPM best practice schedule, the drilling taskwas scheduled to finish after four-and-a-half hours. Also,assuming that the crew always charges up after successfullycompleting the drilling task, the following conclusions can bedrawn:
� In February crew BA44 had an 80% chance ofachieving its target, while the same crew had almost a100% chance of achieving its target for April and May2007.
Table III summarizes the cumulative frequency distrib-utions for all the crews that were monitored during theimplementation.
Figure 7 demonstrates the overall performance of one ofthe sections that the project team worked on (section 114). Inthis particular section there was an approximately 45%improvement in production during the CCPM implementation.
Conclusions
The partial and holistic application of the CCPM methodologyon the stoping production cycle has proven to be relativelysimple to practise, and the bottom-line results are evidentand quantifiable. Some of the advantages that the projectteam and client experienced were:
a. Keeping the entire stoping crew focused on the goal(crew synchronicity)
b. Facilitating crew co-operation and teamwork(rationalizing of resources)
c. Miner empowerment by inducing the miner to manage,in spite of the fact that the majority of miners believedthat they were more effective operating instead ofproject managing
d. Application of simple CCPM principles that led tosignificant improvements on daily stoping
performance and, ultimately, an improvement inreturns on equity (ROE)
e. Emphasis being placed on accuracy instead of speed(which was inevitable) as the root cause of effectivehealth, safety, quality, cost, production, and moralemanagement at the stope face.
Acknowledgements
The authors would like to thank Impala Platinum forpermission to publish this paper
References
1. CORTEX, I.T. Statistics over IT projects failure rate. http://www.it-cortex.
com/Stat_Failure_Rate.htm. 2009.
2. LEACH, L.P. Critical Chain Project Management. Artech House, Norwood,
MA, 2004.
3. VALLEE, M. Mineral resource + engineering, economic and legal feasibility
= ore reserve, CIM Bulletin, vol. 92, no. 1031, June 1999. pp 151–155.
4. NEWBOLD, R.C. Project Management in the Fast Lane: Applying the Theory
of Constraints. CRC Press, Boca Raton, FL, 1998.
5. GOLDRATT, E.M. Critical Chain: A Business Novel. North River Press, Great
Barrington, MA, 1998.
6. WALPOLE, R.E. and MAYERS, R.H. Probability and Statistics for Engineers
and Scientists. Prentice Hall, Upper Saddle River, NJ, 1993.
7. GUMEDE, H. and STACEY, T.R. Measurement of typical joint characteristics I
South African gold mines and the use of these characteristics in the
prediction of rock falls, Journal of the Southern African Institute of Miningand Metallurgy, vol. 106, no. 5, 2007. pp. 335–344. �
A case study on stoping shift buffering at Impala platinumJournal
Paper
The Journal of The Southern African Institute of Mining and Metallurgy VOLUME 111 NOVEMBER 2011 799 �
Figure 6—Workflow cumulative frequency distribution
FebruaryMarchAprilMarch
End of theDrillingCycle
Table III
Overall cumulative frequency distribution
Month Feb Mar Apr May Jun
% Cumulative Frequencies 82% 88% 96% 95% 94%
Figure 7—Impala Platinum No. 11 Shaft—section 114 performancechart
Time (hrs)
% C
um
. F
req
uen
cy
Jul Aug Sep Oct Nov Dec Jan Feb Mar Apr May JunMonths (July 2006 - June 2007)
Average performance= 286ca/month
Ukhozi improvement intervention:Monthly growth rate = 44%
272280
320306
316301
320
343
290
399410
Acting M/O discontinuedprocess - Original M/O
recalled from leave
450
400
350
300
250
200
150C
enta
res
(Ave
rage
m2
per T
eam
)